Embed Size (px)
Citation preview

SEVENTH FRAMEWORK PROGRAMME
Trustworthy ICT
Project Title:
Enhanced Network Security for Seamless Service Provisioningin the Smart Mobile Ecosystem
Grant Agreement No: 317888, Specific Targeted Research Project (STREP)
DELIVERABLE
D4.2 Anomaly detection based on real-time exploitation of billing systems
Deliverable No. D4.2
WorkpackageNo.
WP4 WorkpackageTitle
Anomaly detection using control planedata
Task No. T4.2 Task Title Anomaly detection based on real-timeexploitation of billing systems in billedand prepaid environments
Lead Beneficiary ICL
Dissemination Level PU
Nature of Deliverable R
Delivery Date 31 October 2014
Status F
File name NEMESYS Deliverable D4.2.pdf
Project Start Date 01 November 2012
Project Duration 36 Months
1

Authors List
Author’s Name Partner E-mail Address
Leading Author/Editor
Omer H. Abdelrahman ICL [email protected]
Co-Authors
Anastasios Drosou CERTH [email protected]
Erol Gelenbe ICL [email protected]
Gokce Gorbil ICL [email protected]
Vasilios Mavroudis CERTH [email protected]
Reviewers List
Reviewer’s Name Partner E-mail Address
Laurent Delosieres HIS [email protected]
Madalina Baltatu TIIT [email protected]
Luciana Costa TIIT [email protected]
2

Contents
List of Figures 5
List of Tables 6
1 Introduction 101.1 Motivation . . . . . . . . . . . . . . . . . . . . . . . . . . . . . . . . . . . 101.2 Objective of the Deliverable . . . . . . . . . . . . . . . . . . . . . . . . . . 121.3 Outline of the Deliverable . . . . . . . . . . . . . . . . . . . . . . . . . . . 12
2 Background 132.1 Network Level Threats and Mitigation . . . . . . . . . . . . . . . . . . . . 13
2.1.1 RRC based Signalling Overload . . . . . . . . . . . . . . . . . . . . 142.1.2 Existing Countermeasures . . . . . . . . . . . . . . . . . . . . . . . 16
2.2 Attacks Against Mobile Users . . . . . . . . . . . . . . . . . . . . . . . . . 162.2.1 Network based Detection . . . . . . . . . . . . . . . . . . . . . . . 17
3 RNN based Online Anomaly Detection 193.1 Background . . . . . . . . . . . . . . . . . . . . . . . . . . . . . . . . . . . 193.2 Detection of Signalling Anomalies . . . . . . . . . . . . . . . . . . . . . . . 21
3.2.1 Feature Selection . . . . . . . . . . . . . . . . . . . . . . . . . . . . 223.2.2 Selecting the Parameters of the Algorithm . . . . . . . . . . . . . . 25
3.3 Experiments and Results . . . . . . . . . . . . . . . . . . . . . . . . . . . . 263.3.1 Model of the User . . . . . . . . . . . . . . . . . . . . . . . . . . . 273.3.2 Attack Model . . . . . . . . . . . . . . . . . . . . . . . . . . . . . . 283.3.3 Results . . . . . . . . . . . . . . . . . . . . . . . . . . . . . . . . . 29
3.4 Mathematical Analysis . . . . . . . . . . . . . . . . . . . . . . . . . . . . . 343.4.1 Optimum Counter for Mitigation . . . . . . . . . . . . . . . . . . . 38
3.5 Final Remarks . . . . . . . . . . . . . . . . . . . . . . . . . . . . . . . . . 40
4 Graph-based Descriptors for the Detection of Billing Related Anomalies 414.1 Graph Descriptor . . . . . . . . . . . . . . . . . . . . . . . . . . . . . . . . 414.2 Graph Neighbourhoods . . . . . . . . . . . . . . . . . . . . . . . . . . . . 43
3

4.3 Graph based Feature Extraction . . . . . . . . . . . . . . . . . . . . . . . 444.3.1 Volume . . . . . . . . . . . . . . . . . . . . . . . . . . . . . . . . . 454.3.2 Edge Entropy . . . . . . . . . . . . . . . . . . . . . . . . . . . . . . 464.3.3 Graph Entropy . . . . . . . . . . . . . . . . . . . . . . . . . . . . . 464.3.4 Maximum Outlier Factor . . . . . . . . . . . . . . . . . . . . . . . 474.3.5 Edge Weight Ratio . . . . . . . . . . . . . . . . . . . . . . . . . . . 474.3.6 Average Outward/Inward Edge Weight . . . . . . . . . . . . . . . 484.3.7 Number of Outward/Inward Edges with a Specific Weight . . . . . 48
4.4 Detection of Anomalous Users . . . . . . . . . . . . . . . . . . . . . . . . . 494.5 Applications . . . . . . . . . . . . . . . . . . . . . . . . . . . . . . . . . . . 50
4.5.1 Application 1: Spam SMS dataset . . . . . . . . . . . . . . . . . . 504.5.2 Application 2: RRC Attacks . . . . . . . . . . . . . . . . . . . . . 54
5 Conclusions 56
4

List of Figures
3.1 RNN in the feed-forward structure . . . . . . . . . . . . . . . . . . . . . . 223.2 Anomaly score function . . . . . . . . . . . . . . . . . . . . . . . . . . . . 243.3 Classifier output for a misbehaving user . . . . . . . . . . . . . . . . . . . 303.4 Classifier output for a normal user . . . . . . . . . . . . . . . . . . . . . . 313.5 Classifier output for a heavy user . . . . . . . . . . . . . . . . . . . . . . . 323.6 Detection results in the ROC space . . . . . . . . . . . . . . . . . . . . . . 333.7 Accuracy of the RNN algorithm . . . . . . . . . . . . . . . . . . . . . . . . 343.8 A schematic representation of the mathematical model . . . . . . . . . . . 353.9 Optimum counter threshold for mitigating signalling storms . . . . . . . . 39
4.1 Anomaly detection based on graph-descriptors . . . . . . . . . . . . . . . 414.2 Graph descriptor of a small CDR record . . . . . . . . . . . . . . . . . . . 434.3 An example of k-neighbourhood graph . . . . . . . . . . . . . . . . . . . . 444.4 Graph traversal . . . . . . . . . . . . . . . . . . . . . . . . . . . . . . . . . 454.5 Examples of graph entropy. . . . . . . . . . . . . . . . . . . . . . . . . . . 474.6 The random forest algorithm . . . . . . . . . . . . . . . . . . . . . . . . . 504.7 The volume and edge weight ratio features for the SMS dataset . . . . . . 524.8 The edge and graph entropy features for the SMS dataset . . . . . . . . . 534.9 The maximum entropy outlier factor and volume features for the storm
dataset . . . . . . . . . . . . . . . . . . . . . . . . . . . . . . . . . . . . . . 55
5

List of Tables
4.1 An example CDR data representing calls between users. . . . . . . . . . . 424.2 Results of the graph descriptor method on the SMS spam dataset . . . . . 534.3 Results of the graph descriptor method on the storm dataset . . . . . . . 54
6

Abbreviations
CN Core Network
CDR Charging Data Record
DCH Dedicated Channel
DNS Domain Name System
DoS Denial of Service
DPI Deep Packet Inspection
EOF Entropy Outlier Factor
FACH Forward Access Channel
FP False Positive
FPR False Positive Rate
GGSN Gateway GPRS Support Node
HTTP Hypertext Transfer Protocol
IM Instant Messaging
IP Internet Protocol
KPI Key Performance Indicator
LTE Long Term Evolution
M2M Machine-to-Machine
MME Mobility Management Entity
MNO Mobile Network Operator
NAT Network Address Translation
PC Personal Computer
PCH Paging Channel
PGW Packet Data Network Gateway
QoS Quality of Service
RLC Radio Link Control
RNC Radio Network Controller
RNN Random Neural Network
ROC Receiver Operating Characteristic
RRC Radio Resource Control
SGSN Serving GPRS Support Node
SGW Serving Gateway
SMS Short Message Service
SMSC Short Message Service Centre
TCP Transmission Control Protocol
TP True Positive
7

TPR True Positive Rate
UE User Equipment
UMTS Universal Mobile Telecommunications System
VoIP Voice over IP
8

Abstract
Mobile malware and mobile network attacks are becoming a significant threat that ac-companies the increasing popularity of smart phones and tablets. Thus in this deliverablewe propose two anomaly detection algorithms that use traffic measurements and billingmeta(data) in order to identify malicious or misbehaving mobile devices. The first algo-rithm is based on measuring various quantities describing the activity of a user, applyingdifferent statistical methods to compute features that capture both instantaneous andlong term changes in behaviour, and using a random neural network to fuse the infor-mation gathered from the individual features in order to detect anomalies in real-time.The second approach uses graph based descriptors to model billing records, where ver-tices in the graph represent users and services, while edges correspond to communicationevents. Anomaly detection is then performed by extracting features from the graph, andapplying a supervised learning technique to discriminate between normal and anomaloususers. The proposed methods are evaluated on two datasets from our mobile networksimulator, representing threats that affect mobile users and networks.
1 Introduction
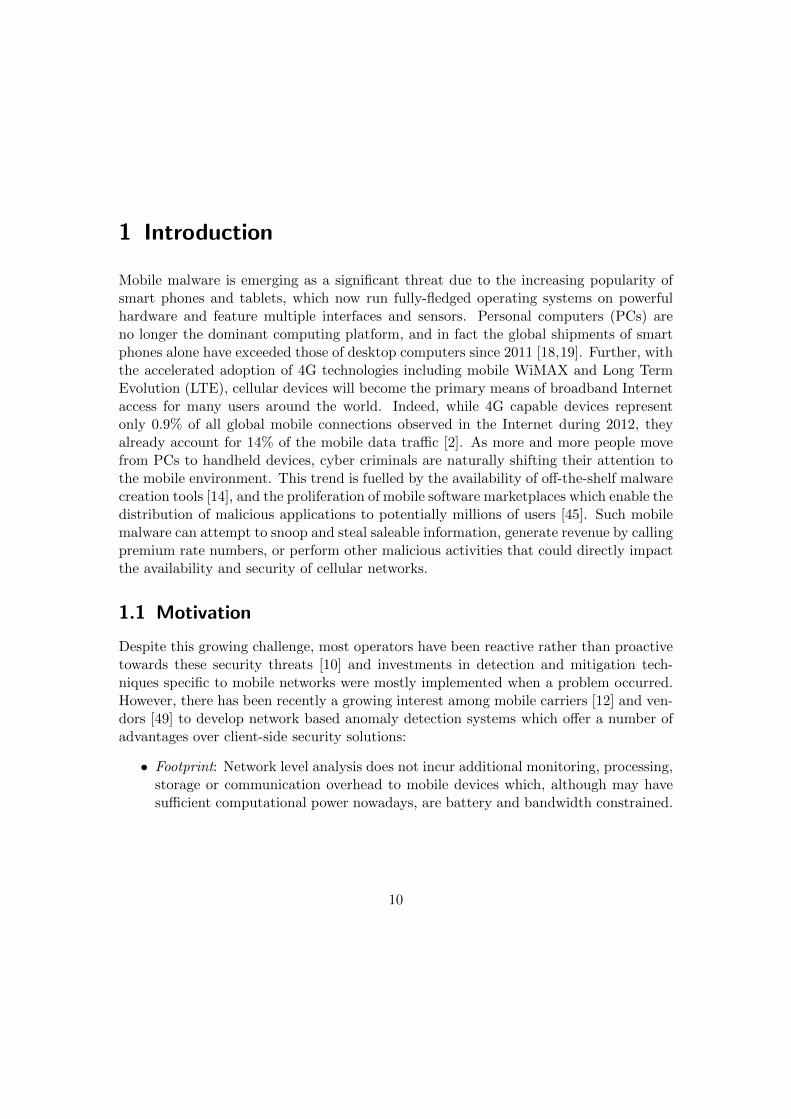
Mobile malware is emerging as a significant threat due to the increasing popularity ofsmart phones and tablets, which now run fully-fledged operating systems on powerfulhardware and feature multiple interfaces and sensors. Personal computers (PCs) areno longer the dominant computing platform, and in fact the global shipments of smartphones alone have exceeded those of desktop computers since 2011 [18,19]. Further, withthe accelerated adoption of 4G technologies including mobile WiMAX and Long TermEvolution (LTE), cellular devices will become the primary means of broadband Internetaccess for many users around the world. Indeed, while 4G capable devices representonly 0.9% of all global mobile connections observed in the Internet during 2012, theyalready account for 14% of the mobile data traffic [2]. As more and more people movefrom PCs to handheld devices, cyber criminals are naturally shifting their attention tothe mobile environment. This trend is fuelled by the availability of off-the-shelf malwarecreation tools [14], and the proliferation of mobile software marketplaces which enable thedistribution of malicious applications to potentially millions of users [45]. Such mobilemalware can attempt to snoop and steal saleable information, generate revenue by callingpremium rate numbers, or perform other malicious activities that could directly impactthe availability and security of cellular networks.
1.1 Motivation
Despite this growing challenge, most operators have been reactive rather than proactivetowards these security threats [10] and investments in detection and mitigation tech-niques specific to mobile networks were mostly implemented when a problem occurred.However, there has been recently a growing interest among mobile carriers [12] and ven-dors [49] to develop network based anomaly detection systems which offer a number ofadvantages over client-side security solutions:
• Footprint: Network level analysis does not incur additional monitoring, processing,storage or communication overhead to mobile devices which, although may havesufficient computational power nowadays, are battery and bandwidth constrained.
10

• Efficacy: Most users are not aware of the growing security risks with mobile de-vices [11], while others may be reluctant to use traditional antivirus solutionsbecause of their inherent power-hungry characteristics, negative impact on per-formance, and potential false positives caused by novel behaviour. Since largescale malware infections pose a significant threat to the availability and securityof cellular networks, it is in the interest of operators to ensure that users are wellprotected even if they are not security conscious.
• Agility and ease of deployment: It can be modified easily without requiring usersto install patches and updates, whereas an on-device solution must support a largenumber of mobile operating systems and hardware platforms.
• Trustability: Network based detection is not vulnerable to exploits that allow mal-ware to circumvent client-side security, but could be bypassed by stealthy attackersconcealing their activities to appear as normal users.
• Coverage: It provides a broad view of malicious activities within a carrier’s net-work, enabling the detection of zero-day attacks that misuse detection technologieswould not recognise. Indeed, while some attacks could be detected by examiningper user behaviour, others become more visible when specific features are aggre-gated across multiple users (e.g., data exfiltration attempts by a single server).Furthermore, the operator’s access to charging data records (CDR) can facilitatethe detection of attacks that have direct impact on billing data. In this respect,statistics extracted from billing information offer a new dimension in the analysisof anomalies, but the approach is also limited in scope in the sense that it con-siders only features related to billing and communication via the cellular networkwhile on-device security systems could benefit from monitoring other behaviouraldata such as system calls, power consumption, keystrokes, and communication overnon-cellular interfaces.
Thus, analysis of mobile network traffic offers a complementary means for detectingboth user and network targeted attacks, which could be used in conjunction with otherNEMESYS client-side solutions such as the mobile honeypot [3, 4] and high interactionhoneyclient [5], in order to improve detection performance. These tools which operatorsmay deploy on their networks can constitute value-added services for communities ofusers, in the same way that banks use profiling to reduce credit card fraud.
There are, however, two main drawbacks of existing network-side security mechanismswhich employ anomaly detection1. First, without proper and very specific training on
1Based on the experience of NEMESYS telecommunication partners.
11

the real network, existing tools produce a significantly high rate of false alarms, so muchso that analysts usually prefer to switch them off. Second, the training process has to berepeated at least each time a change occurs in the network, e.g. a device is substitutedor a new service is introduced, rendering the management cost of these solutions veryhigh.
1.2 Objective of the Deliverable
In this deliverable, we develop anomaly detection mechanisms that mobile network op-erators (MNOs) may deploy in their networks in order protect their own infrastructureand defend users against malware. The approach is based on the analysis of anonymisedCDR for both voice and Internet traffic, which are readily available to the operator andused for billing purposes. Such approach is easier to implement in a mobile networksince it relies on the analysis of user plane (meta)data, in contrast to solutions thatrequire changes to some of the network components and/or protocols. Furthermore, weaddress the aforementioned management overhead of network-side solutions by propos-ing a method to automate the configuration of the algorithms’ parameters, for examplebased on key performance indicators generated by the network equipment.
1.3 Outline of the Deliverable
The rest of this deliverable is structured as follows. Section 2 provides background aboutthe most common threats affecting mobile networks and users, and motivations for ourCDR based algorithms. Section 3 develops a framework for real-time detection usingrandom neural networks (RNN) [28,29], and presents experimental results validating theaccuracy of the approach in identifying mobile devices that are contributing to signallingoverloads. The results are complemented with a mathematical model that will allow usto optimise the performance of the signalling based detector of D4.1 [6], when combinedwith the present RNN algorithm as part of our future integration work. Section 4describes an approach that utilises graph based descriptors to represent billing activities,from which features are extracted and used in order to identify anomalous users in twodistinct scenarios: the above signalling storm, and SMS spam campaign. The datasetsused in this deliverable have been generated by extending the mobile network simulatorthat we have developed within NEMESYS [6, 34], so as to include more realistic dataplane models in addition to the signalling protocols of mobile networks. Finally, weprovide our concluding remarks in section 5.
12
2 Background
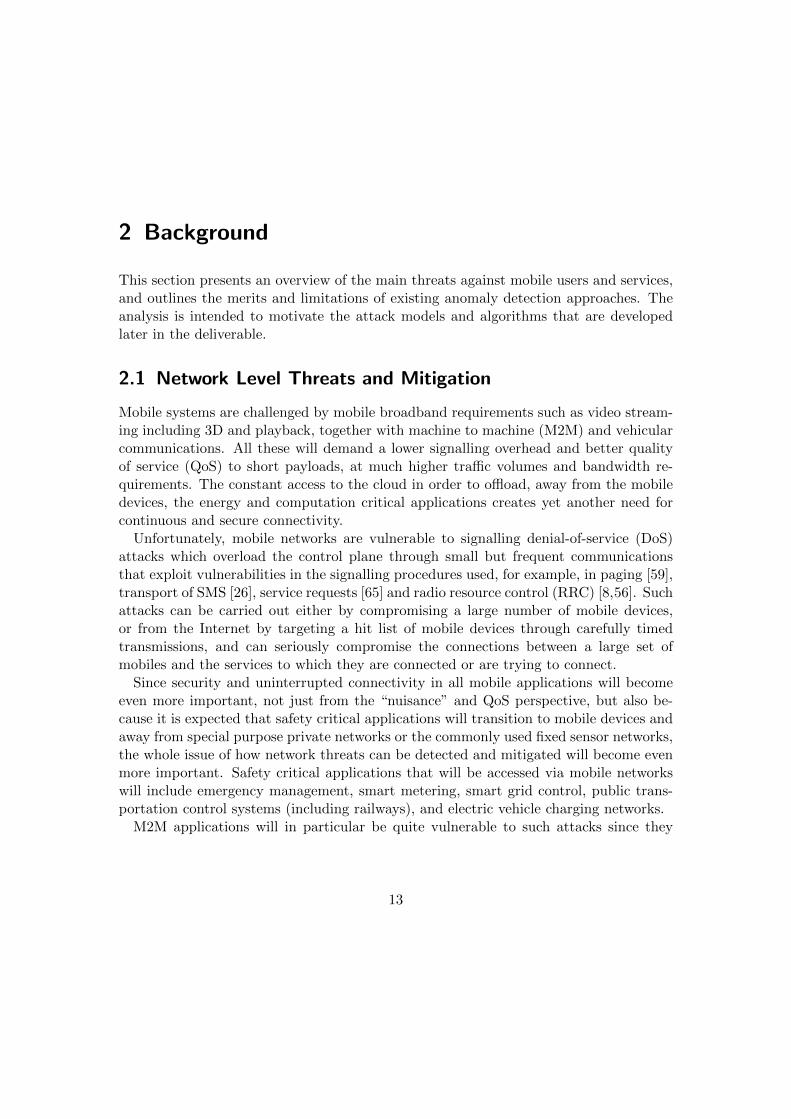
This section presents an overview of the main threats against mobile users and services,and outlines the merits and limitations of existing anomaly detection approaches. Theanalysis is intended to motivate the attack models and algorithms that are developedlater in the deliverable.
2.1 Network Level Threats and Mitigation
Mobile systems are challenged by mobile broadband requirements such as video stream-ing including 3D and playback, together with machine to machine (M2M) and vehicularcommunications. All these will demand a lower signalling overhead and better qualityof service (QoS) to short payloads, at much higher traffic volumes and bandwidth re-quirements. The constant access to the cloud in order to offload, away from the mobiledevices, the energy and computation critical applications creates yet another need forcontinuous and secure connectivity.
Unfortunately, mobile networks are vulnerable to signalling denial-of-service (DoS)attacks which overload the control plane through small but frequent communicationsthat exploit vulnerabilities in the signalling procedures used, for example, in paging [59],transport of SMS [26], service requests [65] and radio resource control (RRC) [8,56]. Suchattacks can be carried out either by compromising a large number of mobile devices,or from the Internet by targeting a hit list of mobile devices through carefully timedtransmissions, and can seriously compromise the connections between a large set ofmobiles and the services to which they are connected or are trying to connect.
Since security and uninterrupted connectivity in all mobile applications will becomeeven more important, not just from the “nuisance” and QoS perspective, but also be-cause it is expected that safety critical applications will transition to mobile devices andaway from special purpose private networks or the commonly used fixed sensor networks,the whole issue of how network threats can be detected and mitigated will become evenmore important. Safety critical applications that will be accessed via mobile networkswill include emergency management, smart metering, smart grid control, public trans-portation control systems (including railways), and electric vehicle charging networks.
M2M applications will in particular be quite vulnerable to such attacks since they
13

will not have the human-in-the-loop who can turn off a mobile when she sees somethingstrange going on. Thus significant efforts need to be made to better understand thesecurity liabilities and weaknesses of mobile connections and find new approaches tomake them resilient and reliable in the face of malicious malware or malfunctioningapplications.
2.1.1 RRC based Signalling Overload
In the context of UMTS networks, bandwidth is managed by the RRC protocol whichassociates a state machine with each user equipment (UE). There are typically four RRCstates, in order of increasing energy consumption: IDLE, Paging Channel (cell PCH),low bandwidth Forward Access Channel (cell FACH), and high bandwidth DedicatedChannel (cell DCH). We will refer hereafter to state cell X as X. State promotions aretriggered by uplink and downlink transmissions, and the move to FACH or DCH isdetermined by the size of the radio link control (RLC) buffer of the UE: if at any timethe buffer exceeds a certain threshold in either direction, the state will be promotedto DCH. State demotions in states DCH, FACH and PCH are triggered by inactivitytimers T1, T2 and T3, respectively. LTE implements a simpler RRC state machine withtwo states: idle and connected. Frequent transitions between the RRC states can resultin excessive signalling load, in order to allocate and deallocate radio resources, leadingto performance degradations and outages. The RRC protocols in 3GPP standards aredescribed in detail in D4.1 [6].
A number of recent studies have addressed the question of whether RRC signallingattacks are feasible in real networks, and three practical issues have been identified alongwith possible methods for dealing with them:
• Inference of radio resource allocation policies: Signalling DoS attacks require knowl-edge of the RRC policies used by the cellular operator, so that attack traffic couldinflict substantial load on the control plane. Probing techniques for inferring theRRC state machine of operational networks have been developed in [13,52].
• Reachability and NAT traversal: Mobile operators deploy firewalls and NetworkAddress Translation (NAT) at network boundaries to protect their infrastructureand mobile users from unsolicited traffic from the Internet, by hiding the entireIP address space behind a single public IP address. This enables communicationthrough edge routers only when a mobile initiates the data session, and any attemptby an external host to scan IP addresses inside the network will be unsuccessful.The authors in [53, 67] develop a mobile application and a probing technique al-lowing them to investigate middlebox policies used by 180 cellular carriers around
14

the world. Among other findings, the study reveals that 51% of the operatorsallow mobile devices to be probed from the Internet: some of them assign publicIP addresses to mobile devices while others use private ones but allow IP spoofingor device-to-device probing within the network.
• Exposing locations of mobile devices: An attacker must be able to map IP addressesof mobile devices to a geographic area in order to launch a signalling DoS attackfrom the Internet. In [53], active probing is used to discover a combination ofstatic and dynamic features, such as inactivity timer and minimum round triptime, enabling an attacker to identify a sufficient number of IP addresses in aparticular location. It is also found that 80% of mobile devices keep their IPaddresses for more than 4 hours, giving an attacker enough time to perform networkmeasurements.
In practice, however, signalling DoS attacks have not been observed, which is likely due tolack of financial incentives for cyber criminals who would rather have the infrastructurefunctional in order to launch profitable attacks. Nevertheless the threat cannot beignored as DoS attacks could be used, for example, to impair the competition or as aform of protest (hacktivism).
Signalling storms are similar to signalling DoS attacks, but they are mainly caused bymisbehaving mobile applications that repeatedly establish and tear-down data connec-tions [50] in order to transfer small amounts of data. Such “chatty” behaviour triggersrepeated signalling to allocate and deallocate radio channels and other resources, andtherefore has a negative impact on the control plane of the network [58]. There are anumber of recent high profile cases, e.g. in Korea [25] and Japan [27], where large opera-tors suffered major outages due to popular applications that constantly poll the networkeven when users are inactive. Ad based mobile monetisation is another culprit, shown tocause erratic spikes in signalling traffic [24]. Many mobile carriers have also reported [10]outages and performance issues caused by non-malicious but poorly designed applica-tions, yet the majority of those affected followed a reactive approach to identify andmitigate the problem. It is expected that signalling storms will continue to pose chal-lenges to operators, with the projected growth in mobile data [22] and the advent of M2Msystems for which existing cellular networks are not optimised [1, 41, 60, 63]. Signallingstorms could also occur as a byproduct of malicious activities that involve frequent com-munications. Indeed, a recent analysis of the traffic profiles of mobile subscribers inChina [44] indicated a positive correlation between the frequency of resource-inefficienttraffic and malicious activities in the network such as private data upload, billing fraudand TCP SYN flooding.
15

2.1.2 Existing Countermeasures
Signaling problems in mobile networks have a limited impact on the data plane and thusare difficult to detect using traditional intrusion detection systems which are effectiveagainst flooding type attacks. For Internet based attacks, a change detection algorithmusing the cumulative sum method has been proposed in [42], where the signaling rateof each remote host is monitored and an alarm is triggered if this rate exceeds a fixedthreshold. The use of a single threshold for all users, however, presents a trade-offbetween false positives and detection time, which can be difficult to optimise given thediversity of users’ behaviour and consumption.
A supervised learning approach is used in [35] to detect mobile-initiated signallingattacks, whereby transmissions that trigger a radio access bearer setup procedure aremonitored, and various features are extracted relating to destination IP and port num-bers, packet size, and response-request ratio. In this deliverable, we develop algorithmsto detect signalling anomalies using only billing-related information, thus simplifyingtheir deployment in the network. Furthermore, the methods proposed in this deliverablecan be integrated with the signalling based solution of D4.1 [6], so as to improve theoverall detection performance of the system. The work in [39] considers the detection ofSMS flooding attacks using low reply rate as the main indicator of malicious activities,which is likely to misclassify SMS accounts used for M2M communications, such as assettracking and smart grid metering [48].
A general framework for anomaly detection is presented in [23], where time-series ofone dimensional feature distributions are derived and change detection algorithms areapplied to identify statistically significant deviations from past behaviour. While themethod in [23] aims to identify large scale events by aggregating and analysing statisticsfrom all mobile users, our algorithm in Section 3 follows a different approach wherebyit is activated and configured based on key performance indicators (KPIs) (e.g. whensignalling load exceeds a certain threshold), and as such it does not need to operatecontinuously. Furthermore, the aim of our method is to identify in real-time the usersthat are contributing to a problem rather than detect the problem itself. Nevertheless,we also develop in Section 4 a graph based algorithm that can be executed periodically inorder to detect stealthy but non-critical malicious campaigns that may not affect KPIsin the mobile network.
2.2 Attacks Against Mobile Users
A recent report by Kaspersky Lab [46] revealed that the most frequently detected mal-ware threats affecting Android operating system are (i) SMS Trojans which send mes-
16

sages without users’ consent, (i) adware which displays unwanted advertisements, and(iii) root exploits which allow the installation of other malware or the device to becomepart of a botnet. While botnets are a well-known phenomenon in the wired Internet,the year 2012 saw the emergence of the first mobile botnets [47]. Mobile botnets poseinteresting questions as to their capabilities and uses since smart mobile devices possessmany abilities not present on a desktop computer. Such mobile botnets could be usedto attack mobile users, e.g. SMS spam, which in turn may have a serious impact on thenetwork functioning as described earlier. In the following, we discuss two approaches todeploying anomaly detection systems at the operator’s network, and we review existingtechniques that have been proposed in the literature.
2.2.1 Network based Detection
Recent work [43] has shown that mobile malware families are not different from theirnon-cellular counterparts, in the sense that they rely on the same Internet infrastructureto support their illicit operations, and share many behavioural characteristics such ashost changes, growth patterns and so on. Thus traditional network based solutions whichhave been applied successfully in the wired domain could be also effective in detectingand mitigating mobile threats. The literature includes a number of proposals for enablingmobile operators to detect user targeted attacks:
• DNS analysis: Since malware typically uses DNS to retrieve IP addresses of servers,detecting and blacklisting suspicious domains can be a first step towards limitingthe impact of malware [36, 43]. However, detection should not be based solely onhistorical data (i.e. known malicious domains), but also on behavioural character-istics that may differentiate normal and malicious traffic.
• Content matching: Uncommon header flags and syntactic matches in HTTP mes-sages can be used as indicators of data exfiltration attempts [36], but this approachis not effective when end-to-end encryption is used, as it relies on extracting infor-mation from plain-text transmissions, and it also requires performing deep packetinspection (DPI) which may not be scalable.
• CDR analysis: One of the key characteristics of mobile communications pertains tothe fact that the whole extent of exchanged traffic load is continuously monitoredfor billing and accounting purposes. Hence, it is expected that many maliciousactivities will have an evident impact on the CDR of the parties involved. In [48],communication patterns of SMS spammers are compared to those of legitimatemobile users and M2M connected appliances, showing evidence of spammer mo-bility, voice and data traffic resembling the behaviour of normal users, as well as
17

similarities between spammers and M2M communication profiles. Fuzzy-logic isused in [66] to detect SMS spamming botnets by exploiting differences in usageprofiles, while in [68] SMS anomalies are detected through building normal socialbehaviour profiles for users, but the learning technique fails to identify transientaccounts used only for malicious purposes. The work in [38] uses a bi-partite graphto represent voice calls from domestic to international numbers, and proposes aMarkov clustering algorithm to detect and classify voice-related fraud; the analysisshows that different fraud activities, such as those carried by malicious applica-tions with automated dialler or through social engineering tactics, exhibit distinctcharacteristics.
A somewhat different approach that can be used by operators to identify malware offers atrade-off between network-level analysis and on-device security: the former imposes zero-load on the device but limits its scope to cellular data, while the latter is able to utiliseinternal mobile events for detection but may be resource hungry. This hybrid approachuses a thin mobile client to extract relevant features from the device [17, 57] which arethen offloaded to the network or the cloud for inspection. Although this approach offersheavy-weight security mechanisms to devices that may not otherwise have the processingpower to run them, it still requires continuous monitoring, some processing and frequentcommunication with a remote service. Moreover, this approach can only protect thoseusers that install a security application, and requires a large number of subscribers inorder to identify large-scale events, while network based detection does not require theuser to do anything as all detection is performed using data available to the networkoperator.
18

3 RNN based Online Anomaly Detection
In this section we present a random neural network (RNN) [28, 29] based algorithm fordetecting mobile signalling anomalies in real-time using charging data records (CDR).The algorithm uses supervised learning to distinguish between normal and abnormalbehaviour, and is able to identify quickly when a mobile device generates excessive controlmessages without directly monitoring the signalling plane. In contrast to signalling basedsolutions which would require modification to cellular network equipment or protocols,the algorithm is designed to run on the core network using standard monitoring tools.Our motivation behind the use of a supervised learning approach is that it is suitedfor detecting threats that are well-understood, which include signalling storms whosecharacteristics and root causes have been analysed thoroughly in D4.1 [6].
The rest of this section is structured as follows. In section 3.1 we give a brief summaryof the RNN model as applied to our problem of distinguishing between normal andmisbehaving mobile devices. Section 3.2 presents the core of the detection technique,including the decision making process, and provides a detailed description of the choice ofinput features, and the parameters that can influence the performance of the algorithm.In section 3.3, we evaluate our detection mechanism using data generated by the mobilenetwork simulator developed within NEMESYS; we describe the user and attack models,and present some experimental results. Then section 3.4 presents a mathematical modelfor evaluating and optimising the performance of our algorithm when used in conjunctionwith the signalling based detector developed in D4.1. Finally, we summarise our findingsin section 3.5.
3.1 Background
The RNN is a biologically inspired computational model, introduced by Gelenbe [28],in which neurons exchange signals in the form of spikes of unit amplitude. In RNN,positive and negative signals represent excitation and inhibition respectively, and areaccumulated in neurons. Positive signals are cancelled by negative signals, and neuronsmay fire if their potential is positive. A signal may leave neuron i for neuron j as apositive signal with probability p+ij , as a negative signal with probability p−ij , or may
depart from the network with probability di, where∑
j [p+ij + p−ij ] + di = 1. Thus, when
19

neuron i is excited, it fires excitatory and inhibitory signals to neuron j with rates:
w+ij = rip
+ij ≥ 0, w−ij = rip
−ij ≥ 0,
where:ri = (1− di)−1
∑j
[w+ij + w−ij ].
The steady-state probability that neuron i is excited is given by qi = NiDi
where:
Ni = Λi +∑j
qjw+ji, Di = λi + ri +
∑j
qjw−ji
with Λi and λi denoting the rates of exogenous excitatory and inhibitory signal inputsinto neuron i, respectively.
A gradient descent supervised learning algorithm for the recurrent RNN has beendeveloped in [29]. For a RNN with n neurons, the learning algorithm estimates then × n weight matrices W+ = {w+
ij} and W={w−ij} from a training set comprisingK input-output pairs (X,Y). The set of successive inputs to the algorithm is X =(x(1), · · · ,x(K)), where x(k) = (Λ(k), λ(k)) are the pairs of exogenous excitatory andinhibitory signals entering each neuron from outside the network:
Λ(k) = (Λ(k)1 , · · · ,Λ(k)
n ), λ(k) = (λ(k)1 , · · · , λ(k)n ).
The successive desired outputs are Y = (y(1), · · · ,y(K)), where the k-th vector y(k) =
(y(k)1 , · · · , y(k)n ), whose elements y
(k)i ∈ [0, 1] correspond to the desired output values for
each neuron. The training examples are presented to the network sequentially, and theweights are updated according to the gradient descent rule to minimise an error function:
E(k) =1
2
n∑i=1
ai[q(k)i − y
(k)i ]2, ai ≥ 0.
The update procedure requires a matrix inversion operation for each neuron pairs (i, j)and input k which can be done in time complexity O(n3), or O(mn2) if m-step relaxationmethod is used, and O(n2) for feed-forward networks. The RNN has been successfullyapplied to several engineering problems [64] including pattern recognition, classificationand DoS attack detection [32,51].
20

3.2 Detection of Signalling Anomalies
The RNN based anomaly detection algorithm monitors the activity of each user, andmeasures a set of expressive features that describe various characteristics of the user’sbehaviour. Time is divided into slots, each of duration ∆ seconds, in which sum-mary statistics such as the mean and standard deviation of several quantities relatedto the activity of the user are collected. The algorithm stores the most recent w set ofmeasurements, and use them to compute the current values of the input features; i.e.the features for time slot τ are computed from measurements obtained for time slotsτ, τ − 1, · · · , τ − (w − 1) so that the observation window of the algorithm is W = w∆.We discuss in section 3.2.2 the selection of the algorithm’s parameters and how theyinfluence its performance.
Let z[τ ] denotes a measured or calculated quantity for time slot i, then the i-th inputfeature xi[τ ] can be obtained by applying a statistical function fi as follows:
xi[τ ] = fi(z[τ ], z[τ − 1], · · · , z[τ − w − 1]).
Hence, by employing different operators fi on different statistics z stored for the obser-vation window of w slots, it is possible to capture both instantaneous (i.e. sudden) andlong-term changes in the traffic profile of a user. In our work, we have used a numberof simple statistical functions such as the mean and standard deviation of z across theentire window, and also an exponential moving average filter in which the current featureis computed as:
xi[τ ] = αxi[τ − 1] + (1− α)z[τ ],
where α is some constant 0 < α < 1 typically close to 1, with higher values discount-ing older observations faster. An important concept from information theory that wehave also used in our approach is entropy which is a measure of the uncertainty orunpredictability in the data:
xi[τ ] = −τ∑
t=τ−w−1pz[t] log pz[t],
where pz[t] is the probability of observing data item z[t] within the window, which canbe estimated from the histogram of the data. Entropy is typically interpreted as theminimum number of bits required to encode the classification of a data item, thus asmall entropy indicates deterministic behaviour which is often associated with signallinganomalies [27,44,54].
Once the input features for a slot have been computed, they are fused using a trainedfeed-forward RNN architecture such as the one presented in Fig. 3.1 to yield the final
21

1w19+
w19{
w1, 13 {
8
9
13
14
15
w9,14+
w9,14{
w9,15
+
w9,15
{
w1, 13 +
Input layer Hidden layer Output layer
Figure 3.1: An example of the feed-forward RNN structure used for anomaly detection,with 8 input nodes, 5 hidden neurons and 2 output nodes correspondingto attack and normal traffic. The learning algorithm processes the inputtraining patterns in sequence and updates the weights. The k-th training
set consists of a feature vector x(k) = (Λ(k)1 , · · · ,Λ(k)
8 ) and its classification
y(k) = (y(k)14 , y
(k)15 ) set to (1, ε) for attack and (ε, 1) for normal samples where
ε ' 0. All other exogenous signals are set to zero.
decision: the input neurons receive the features computed for the current time slot, andthe output nodes correspond to the probabilities of the input pattern belonging to anyof two traffic classes (i.e. attack or normal). The final decision about the traffic observedin the time slot is determined by the ratio of the two output nodes (i.e. q14/q15): attackif the ratio is greater than 1 and normal otherwise. We have used an implementation ofthe RNN provided in [7].
3.2.1 Feature Selection
The selection of useful and information bearing input features for any classification prob-lem is one of the most important parts of the solution. In our approach, we used featuresthat can capture the RRC signalling dynamics of a user based on raw IP packet tracescollected from the mobile network core, namely the SGSN/GGSN in UMTS and SG-W/PGW in LTE. Our aim is to select features that are easy to measure or calculatewithout high computational or storage cost, given the sheer size of the mobile net-
22

work, while at the same time reflect both the instantaneous behaviour and the longerterm statistical properties of the traffic. We extract for each UE information related tointer-arrival times, lengths and destination IP addresses of packets. We do not assumeknowledge of the application generating a packet nor its service type, which would re-quire the use of a commercial deep packet inspection (DPI) tool, and would result inconsiderable overhead for real-time detection. The features that we have used in ourdetection mechanism are described below.
Inter-arrival Times
RRC signalling occurs whenever the UE sends or receives packets after an inactivityperiod that exceeds an RRC timer. Thus, the volume of traffic exchanged by a UEdoes not map directly into signalling load which is more influenced by the frequency ofintermittent activities. To capture this interaction between the data and RRC controlplane, we define a burst as a collection of packets whose inter-arrival times are less thanδ seconds, where δ is smaller than the RRC timers, typically in the order of few seconds.Specifically, for a sequence of packets whose arrival instants are {t1, t2, · · · }, we groupall packets up to the n-th arrival into a single burst, where n = inf{i : ti− ti−1 > δ}, andthen proceed in a similar manner starting from the (n+ 1)-th packet arrival. Note thatpackets within a single burst are likely not to trigger any control plane messages, whileinter-arrival times of bursts will be correlated to the actual signalling load generatedby the UE. In this manner, we remove any bias regarding the volume of traffic sent orreceived by the UE, and focus more on the frequency of potentially resource-inefficientcommunications.
The features based on the times between bursts are then calculated as follows. Thealgorithm stores the mean and standard deviation of the inter-burst times in each slotthen, using the most recent w values, it computes (i) entropy of the averages, (ii) movingaverage of the standard deviations, and (iii) moving average of an anomaly score for theaverages computed based on the RRC timer T in the high bandwidth state. In particular,the anomaly score α(z[t]) of the average inter-burst time in slot t is set to zero whenz[t] < T , reflecting the fact that such shortly spaced bursts may not have generated manyRRC transitions; it is high when z[t] is slightly larger than T , indicating potentiallyresource-inefficient bursts; and it drops quickly when z[t] is few seconds larger than T .We can obtain this effect using a gamma distribution:
α(z[t]) =(z[t]− T − ε)n−1e−
(z[t]−T−ε)θ
θnΓ(n),
where Γ(n) is the gamma function evaluated at n, ε is a small positive number and
23

6 7 8 9 10 11 12 13 14 150
0.05
0.1
0.15
0.2
0.25
0.3
0.35
0.4
0.45
0.5
Inter−burst time z
Ano
mal
y sc
ore
α(z
)
Figure 3.2: Anomaly score based on the gamma function, taking high values when thetime between successive bursts is slightly larger than the RRC timer whichin this case is 6s.
n, θ are parameters of the gamma distribution chosen to adjust the decay of α as z − Tincreases. The shape in Fig. 3.2 which satisfies the above requirements is obtained bysetting n = 1.5 and θ = 1.
Packet Size
If the data sent by a user has a probabilistic description, then it is expected that thepacket size distribution for a normal device will be markedly different from that of amobile device running a misbehaving application. For example, signalling storms can becaused by failures in over-the-top cloud services [54] or peer-to-peer networks used byVoIP applications [23]. In such cases, the client application will attempt to reconnectmore frequently, causing significant increase in the number of TCP SYN packets sent bythe user. This in turn changes the randomness or uncertainty of information associatedwith the size of packets, and can be used to identify misbehaving mobiles in the eventof a signalling storm. Our algorithm computes the average size of packets sent by aUE within each slot, and evaluates a feature based on the entropy of the most recent wmeasurements.
24

Burst Rate
Another obvious characteristic of signalling storms is the sudden increase and sustainedrate of potentially harmful bursts generated by a misbehaving user. Moving averageof the burst rate per slot and entropy of the rates across the observation window areused as features in order to capture, respectively, the frequent and repetitive nature ofnuisance transmissions. Furthermore, a misbehaving application may change the trafficprofile of a user in terms of the ratio of received and sent bursts, as in the case ofthe outage induced storm described above where many SYN packets will not generateacknowledgments. Hence, we also use as a feature the mean of the response ratios withinthe window of w slots.
Destination Addresses
The number of destination IP addresses contacted by a normally functioning mobiledevice is expected to be significantly different from that of an attacker [35], whether theattack originates from the mobile network due to a misbehaving application, or from theInternet as in the case of unwanted traffic (e.g. scanning probes, spam, etc.) reachingthe mobile network [55]. In the former, the number of destination IP addresses will beunusually small relative to the frequency of bursts, while in the latter this number isvery high. Thus we calculate the percentage of unique destination IP addresses contactedwithin each time slot, and use the average of the most recent w values as a feature.
3.2.2 Selecting the Parameters of the Algorithm
In the following, we summarise the parameters for the RNN algorithm and discuss howthey should be selected adaptively and how the choice of each parameter influences theperformance of the anomaly detector:
• Slot size ∆: This defines the resolution of the algorithm and the frequency atwhich classification decisions are made. It should be long enough for the measuredstatistical information to be significant, but not too long to make the algorithmreact slowly to attacks. In our experiments we set ∆ = 1 minute.
• Window size W : The window size W = w∆ determines the amount of historicalinformation to be included in a classification decision. The choice of the windowsize presents a trade-off between speed of detection and false alarm rate, since asmall window makes the algorithm more sensitive to sudden changes in the trafficprofile of a user, which in turn increases both detection and false alarm rates. Thistrade-off can be optimised by adjusting W according to the level of congestion in
25

the control plane, with shorter windows for higher signalling loads to enable thealgorithm to quickly identify misbehaving UEs. Note that information about the“health” of different network servers is typically available to the mobile networkoperator in the form of key performance indicators (KPIs) that can be fed tothe algorithm to adjust the window size. Furthermore, based on these KPIs, theanomaly detector could be switched on only when the signalling load exceeds acertain threshold, thus eliminating the need to continually analyse users’ traffic.The value of w used in our experimental results is 5, but we also experimentedwith other values which confirmed the aforementioned observations.
• Maximum packet inter-arrival time within a burst δ: This should be selected basedon the RRC timers, so that potentially resource-inefficient transmissions can betracked. In our simulations of a UMTS network, the timers in DCH and FACHstates are set to, respectively, T1 = 6s and T2 = 12s based on [52]. We haveevaluated different values of δ < min(T1, T2) and the results indicate that it doesnot affect detection performance significantly, but that training time drops as δ isincreased. The results presented in this deliverable are obtained with δ = 3s.
3.3 Experiments and Results
In this section, we evaluate the performance of our CDR based anomaly detection algo-rithm. Towards this end, we have extended our simulator [6,34] to include more realisticdata plane models in addition to the signalling protocols of mobile networks. We firstpresent the traffic models that have been integrated into the simulations, including twoattack models that represent both malicious and misbehaving UEs. Then we describethe results of applying our real-time algorithm on the dataset produced by the simulator.
While the impact of signalling storms on mobile networks has been analysed exten-sively in [6], the objective of the present simulation setup is to evaluate the performanceof our algorithms in identifying signalling anomalies in users’ profiles; thus a small sce-nario has been considered. In particular, we simulated 200 UEs in an area of 2x2 km2
which is covered by 7 Node Bs connected to a single radio network controller (RNC).The core network (CN) consists of the SGSN and the GGSN which is connected to 37Internet hosts acting as application servers, 5 of which for instant messaging, and 2 arecontacted by the attacking UEs.
26

3.3.1 Model of the User
The user model consists of three popular mobile services that are active simultaneouslyin order to create more realistic user behaviour. The model can also support a diurnalpattern for UE behaviour, where the UE is active for a certain duration (e.g. between14 and 16 hours) every 24 hours, and is inactive the rest of the time during which theuser does not generate or respond to traffic. This pattern represents the day/night cycleof users, and it varies from one user to another based on a random distribution.
Web Browsing
The interactive web browsing behaviour is based on the self-similar traffic model de-scribed in D4.1 [6] and assumes Zipf-like distribution for web server popularity, whichhas been widely used in the literature since it was first suggested in [16].
Instant Messaging
Instant messaging (IM) applications are characterised by frequent, small data transmis-sions and a long tail distribution representing messages with media rich contents such asvideos and photos. The IM application model consists of two distinct but related parts:message generator and responder. Each UE generates messages to chosen destinations,and also responds to received messages with a given probability. The message generatorworks based on sessions and waves. A session represents the duration that the user isactively generating messages, and consists of one or more waves where the messagesare actually sent. At each wave, the user generates and sends one or more messages,the number and length of which are configurable with random distributions, to a singledestination (mobile user) chosen at random. The time between waves within a session,the session duration and the time between user sessions are all given by random distri-butions. On the other hand, the UE responds to each received message with a givenprobability, and this response behaviour is independent of message generation, and canoccur both inside and outside of the user’s IM sessions.
The final destination of a message can be another mobile in the same network or amobile in another network (not explicitly simulated); mobiles in different networks arerepresented by one or more servers in the simulation, which act on behalf of these users.Mobiles in the same network are explicitly simulated. Regardless of its final destination,each message passes through an Internet chat server, which forwards the message to itsfinal destination, i.e. another mobile user. We simulate multiple chat servers representingpopular chat applications and services such as WhatsApp, GTalk, Skype, etc., andcurrently assume that each message belongs to a chat application that is chosen uniformly
27

at random from the available applications. The simulation model supports more genericmessage-to-application assignment based on other random distributions.
Short Message Service
The SMS application is similar to the IM application in that it consists of a messagegenerator and a responder, and also operates based on the same concept of sessionsand waves. Different from the IM application, we assume a single intermediate serverwithin the mobile network that handles all SMS messages for that network, i.e. theSMSC server. SMS messages are also different than IM messages in their types. EachSMS message is assigned a type at creation time, which can also be inferred from itsdestination address (i.e. phone number); an SMS message can be classified as in-networkmobile, out-network mobile, premium, and other, e.g. non-premium SMS based services,based on its destination. In-network mobiles are naturally represented by the UEsexplicitly simulated; we represent the out-network mobiles, premium numbers and otherdestinations by servers outside the simulated mobile network, with one or more serversrepresenting each class. Therefore, the type of a sent or received SMS can be inferredfrom its source and destination addresses (numbers). The type of the SMS message theUE generates is chosen at random based on the parameters of the SMS application.
3.3.2 Attack Model
We consider DCH attacks where the attacker aims to overload the control plane bycausing superfluous promotions to the high bandwidth DCH state. A similar FACHattack can be launched where the transition of interest is to the FACH state, which ismore effective in overloading the core network components such as SGSN (UMTS) andMME (LTE), but it is generally more difficult to launch because it requires knowledgeof the RRC buffer thresholds and measurement of user traffic volume.
We consider two types of attackers. The first is aggressive in the sense that a maliciousdevice knows when an RRC state transition occurs, and launches the next attack oncea demotion from DCH to FACH is detected. To perform the attack, we assume that theattacker has inferred the radio network configuration parameters, and is monitoring theuser’s activity in order to estimate when a transition occurs so as to trigger a new oneimmediately afterwards. However, there could be an error between the actual transitiontime and the estimated one, which we represent by an exponentially distributed randomvariable with mean 2s. When the attacker “thinks” that a transition has occurred, itsends a high data rate traffic to one of its Internet servers in order to cause the bufferthreshold to be reached and therefore result in a promotion to DCH. This model is used
28

mainly for training the supervised anomaly detection algorithm.The second attack type is based on a poorly designed application that sends periodic
messages whenever the user is inactive, with the transmission period set to be slightlylarger than the DCH timer in order to increase the chances of triggering state transi-tions. This behaviour represents the case where an application uses a pull mechanismto fetch updates periodically, and the update period happens to “synchronise” with theRRC timer. However, unlike aggressive attackers, the misbehaving application cannotguarantee the generation of signalling traffic for each of its updates, since (i) the appli-cation only starts when local user activity stops but it cannot observe downlink trafficthat may have restarted the DCH timer at the signalling server; and (ii) the data volumemay not be large enough to trigger a promotion to DCH. In both cases, the periodictransmissions may become completely out of sync with the RRC state machine, thereforenot generating any signalling traffic.
The two distinct attack models allow us to represent both malicious and benign be-haviours that may lead to a storm, but the first is well distinguishable and separablefrom the behaviour of a normal user in terms of both temporal and traffic volume. Onthe other hand, the second attack model captures the signalling behaviour of legitimateapplications that are much more similar to an “attack” rather than to a “normal” be-haviour, but are difficult to detect from CDR dynamics. Thus we use this model to testthe performance of our algorithm.
3.3.3 Results
The RNN algorithm provides at the end of a time slot the probabilities that the inputfeatures belong to an attack and normal behaviour (i.e., q14 and q15 in Fig. 3.1). Thefinal decision about the traffic is then determined by the ratio of the two output nodesq14/q15: it is classified as attack if the ratio is greater than 1 and normal otherwise.Fig. 3.3 shows the classifier output (top) and the actual RRC state transitions (bottom)of a misbehaving UE as captured during a simulation run. It can be observed that whenthe malfunctioning application is active, the number of state transitions significantlyincreases, with most transitions occurring between the FACH and DCH states in thisattack scenario. It is this back-and-forth transitioning behaviour that causes excessivesignalling load in the mobile network, while the load on the data plane is mostly unaf-fected, rendering traditional flooding based security solutions unable to detect signallingstorms. However, our anomaly detection mechanism is able to track very accurately theRRC state transitions of the UE, and to quickly identify when excessive signalling isbeing generated, despite the fact that it does not directly monitor these transitions butrather infers them from the CDR features that we have described. One can also observe
29

0 50 100 150 200 250 300 35010
−4
10−2
100
102
Time (minutes)
Cla
ssifi
er o
utpu
t
0 50 100 150 200 250 300 350Idle
FACH
DCH
Time (minutes)
RR
C s
tate
threshold
Figure 3.3: Classifier output (top) and RRC state transitions (bottom) for a misbehavingUE.
that the classifier’s output sometimes drops close to 1 during an attack epoch, which isattributed to other normal applications generating traffic in those time instants, thusreducing the severity of the attack. As mentioned earlier, the detection speed and toler-ance to signalling misbehaviour can be adjusted by modifying the size of the observationwindow, which in this scenario is set to 5 minutes.
Fig. 3.4 shows results when there is no attack, where the number of state transitionsin a given period are small and due to normal traffic generated and received by the UE.In this case, the UE does not spend long periods in “active” states, i.e. FACH andDCH, quickly transitioning down to Idle (bottom figure), and the classifier (top figure)does not generate any alarms regarding the signalling behaviour of the UE as one wouldexpect.
Next we examine in Fig. 3.5 how our algorithm performs when presented with a heavy
30

0 50 100 150 200 250 300 35010
−4
10−2
100
Time (minutes)
Cla
ssifi
er o
utpu
t
0 50 100 150 200 250 300 350Idle
FACH
DCH
Time (minutes)
RR
C s
tate
threshold
Figure 3.4: Classifier output (top) and RRC state transitions (bottom) for a normal UE.
31

0 50 100 150 200 250 300 35010
−4
10−2
100
102
Time (minutes)
Cla
ssifi
er o
utpu
t
0 50 100 150 200 250 300 350Idle
FACH
DCH
Time (minutes)
RR
C s
tate
threshold
Figure 3.5: Classifier output (top) and RRC state transitions (bottom) for a heavy UEthat generates significantly more signalling than the average user in the sim-ulation experiment.
normal user that generates significantly more state transitions than the average normaluser in our simulations. Interestingly enough, the classifier outputs a single alarm (outof 360 samples) when the corresponding state transitions are indeed excessive. Since theanomaly detection algorithm is supposed to be activate only when there is a signallingoverload condition, such classification decisions may not always be considered as falsealarms, as the goal would be to identify users that are causing congestion, regardless ofwhether they are attacking deliberately or not.
A well-known approach for assessing the performance of a binary classifier is to plottrue positive rate (TPR) against false positive rate (FPR) in what is commonly refereedto as receiver operating characteristic (ROC) space. The TPR (also known as sensitivityor recall) is the fraction of attack instances that have been correctly identified by the
32

0 0.2 0.4 0.6 0.8 10
0.2
0.4
0.6
0.8
1
False positive rate
Tru
e po
sitiv
e ra
te
random guess RNN
Figure 3.6: Detection results in the ROC space, where the diagonal line corresponds torandom guessing. There are 50 points, each representing the classificationresults for a misbehaving UE over an activity period of 6 hours.
classifier, while FPR or fall-out is the proportion of normal samples that have beenmistakenly classified as malicious. We assume that if a UE generates at least 1 attackpacket within a time slot, then the corresponding output of the classifier should be largerthan 1, otherwise a false positive is declared. We obtain the TPR and FPR per UE fromthe 360 classification decisions taken during the simulation experiment (6 hours, andthe resolution of the detector is ∆ = 1 minute). The results for 50 UEs are depicted inFig. 3.6 showing that the FPR is zero for all but one case, while the TPR is on average90% which can be further improved, at the cost of higher FPR, by reducing the windowsize W . Finally, Fig. 3.7 illustrates the accuracy of our classifier, namely the proportionof correct decisions (both true positives and true negatives) out of all test samples. Theresults indicate an accuracy between 88% and 98% with an average of 93% over the 50test cases. This fluctuation, which can also be observed in Fig. 3.6, can be attributed tothe fact that our algorithm does not classify an attack as such until few time slots havepassed (depending on w), and therefore misbehaving UEs with many silent periods willproduce higher false positives; fortunately, these less aggressive UEs will generate lowersignalling loads.
33

0 10 20 30 40 500.86
0.88
0.9
0.92
0.94
0.96
0.98
1
UE number
Acc
urac
y
Figure 3.7: The accuracy of the RNN algorithm, measured as the fraction of correctdecisions over the activity period of 6 hours, for 50 misbehaving UEs.
3.4 Mathematical Analysis
In this section, we present a mathematical model [31] which allows us to evaluate andoptimise the performance of the two storm detectors that we have developed so far:the above CDR approach, and the signalling based detector in D4.1 [6] which countsthe number of nuisance RRC transitions between low and high bandwidth states, andenforces a mitigation policy if this number exceeds a threshold. The analysis allowsus to derive the optimum value of the counter’s threshold, given a detection rate forthe overall system, and to show that this optimum value substantially reduces both theaverage number of attacking devices and the amount of signalling traffic.
The analysis and discussion in this section is conducted using very elementary and wellestablished modelling techniques [30,33] that are widely used in telephony and teletraffic.We represent the set of normal and malicious mobile calls in the system by a state s(t)at time t as:
s(t) = (b, B,C,A1, a1, ... , Ai, ai, ...) (3.1)
where:
• b is the number of mobiles which are just starting their communication in lowbandwidth mode,
34

• B is the number of normal mobiles which are in high bandwidth mode,
• C is the number of normal mobiles that have started to transfer or receive data orvoice in high bandwidth mode,
• Ai is the number of attacking mobiles which are in high bandwidth mode and haveundergone a time-out for i− 1 times,
• ai is the number of attacking mobiles which have entered low bandwidth modefrom high bandwidth mode after i time-outs.
We assume a Poisson arrival process of rate λ of new “calls” or mobile activations, anda call that is first admitted in state b then requests high bandwidth at rate r. Note thatr−1 can be viewed as the average time it takes a call to make its first high bandwidthrequest to the network.
With probability 1 − α such a call will be of normal type and will then enter stateB, while with probability α it will be an attacking call and will request high bandwidthand hence enter state A1 indicating the first request for bandwidth that is made by adefectively operating application or malware that can contribute to a storm. A schematicdiagram of the model is presented in Fig. 3.8.
b B C
a1 A1
a2 A2
¸
r®
¹±
¿
·r(1{®)
¿
¿
r
r
¯1
¯2
1
2
w
wx y
z
x
y+z
==
y+z
z
y+z
y
y+z
(a) (b)
M/M/∞ queue
Figure 3.8: A schematic representation of the mathematical model: (a) evolution of thenumber of normal and attacking calls in the system, and (b) the M/M/∞queueing system representation for a node in the model with arrival rate xand departure rates y and z.
35

Once a call enters state A1, since it is misbehaving, it will not start a communicationand will time-out after some time of average value τ−1. Note that the time-out is aparameter that is set by the operator, and in practice it is of the order of a few seconds.After entering state a1, the call may be detected as being anomalous, and will be removedor blocked from the system at rate β1, where β−11 is the average time it takes the detectorto identify that this call has the potential to contribute to a storm, and to block the callfrom further activation. However, it is very unlikely that the system is so smart thatit can make this decision correctly regarding the call so early in the game, so typicallyβ1 ' 0 and the call will manage to request high bandwidth and then enter state A2 atrate r.
Proceeding in the same manner, in state Ai the anomalous call will again not start anormal communication, so it will eventually time-out after an average time τ and enterstate ai, and so on. As a consequence, the rates at which calls enter these states issimply:
ΛA1 = αΛb,
Λai = ΛAi ,
ΛAi+1 = Λair
r + βi= αΛb
i∏l=1
fl, (3.2)
where fl = rr+βl
, and Λb is the rate at which calls enter state b, which will be determinedbelow from a more detailed analysis. Different calls will interfere each other via (i) theaccess to limited wireless bandwidth, and (ii) possible congestion due to signalling andother traffic in the backbone network. However if we neglect these points as a firstapproximation, calls act independently of each other so that the average number of callsin each of the “attacking” states, that are denoted by ai and Ai, is the average arrivalrate of calls into the state, multiplied by the average time spent by a call in that state,so that we have:
NA1 =αΛbτ1
,
NAi =αΛbτi
i−1∏l=1
fl, i > 1,
Nai =αΛbri + βi
i−1∏l=1
fl, i > 1. (3.3)
36

As a consequence, the total average number of malicious calls becomes:
Na =∞∑i=1
[Nai +NAi ] = αΛb
∞∑i=1
{[i−1∏l=1
fl][1
τ+
1
r + βi]}. (3.4)
Now with regard to normal calls, once a call requests high bandwidth and entersstate B, it will start communicating and this will be expressed as a transition rate κwhich takes the call into “communication state” C. From C the call’s activity may beinterrupted, as when a mobile device stops sending or receiving data to/from a web site,or when a voice call has a silent period, in which case the call will return to state B atrate µ. Similarly, the call may end at rate δ, leaving the system.
From B it may either return to C at rate κ signifying that transmission or receptionhas started once again, or it may time-out at rate τ and return to state b. Once itreturns to state b after a time-out, the call can try again to enter state B or state Aas a normal or attacking call, since we have to include the fact that a normal call maybecome an attacking call after acquiring malware during its “normal” communicationwith a web site or with another mobile. As a consequence, we can calculate the rates atwhich the calls enter these normal operating states become:
Λb = λ+τ
τ + κΛB,
ΛB = (1− α)Λb +µ
µ+ δΛC ,
ΛC =κ
κ+ τΛB, (3.5)
which yields:
ΛB = γΛb, where γ =1− α
1− µκ(µ+δ)(κ+τ)
,
Λb =λ
1− ττ+κγ
=λ
1− τ(1−α)τ+κ− µκ
µ+δ
,
ΛB =λγ
1− ττ+κγ
,
ΛC =κλγ
κ+ τ(1− γ). (3.6)
37

3.4.1 Optimum Counter for Mitigation
In this section we describe how to optimise the detection of signalling storms using bothsignalling [6] and billing related information. The anomaly detector based on signallingprotocols counts the number of successive RRC transitions that a mobile triggers withoutactually making use of the requested bandwidth. If this number reaches a thresholdn, then a mitigation policy is activated to prevent the mobile from making excessiverequests. On the other hand, the billing based detector conducts analysis of the user’sbehaviour, and can also check other attributes such as destination IP addresses or portnumbers that may be associated with malicious activities.
A large value of n will improve the chances of correctly detecting a misbehaving mobileuser, providing the system with full confidence to activate the mitigation policy. If nis small the counter based detector will have high false positives, giving a bigger rolefor the billing based detector. Thus the higher the n, the faster the decision can be toinvoke mitigation, using only signalling information. Based on this principle, and withreference to our earlier definition of βi, we have:
βi =
{0, 1 ≤ i < n,β(n), i ≥ n
where the detection rate β(n) increases with the threshold n, with a slope or derivativewith respect to n expressed as β
′(n). Using the previous analysis, the average number
of malicious calls becomes:
Na = αΛb[(n− 1 +r
β)(
1
τ+
1
r) +
1
τ] (3.7)
while the resulting signalling load from the attack is given by the total rate of malicioustransitions between low and high bandwidth states:
Λa = αΛb +∞∑i=1
[Λai + ΛAi ] = αΛb[2n+ 1 +2r
β] (3.8)
With some further simple analysis we can show that the value n∗ that minimises bothNa and Λa, is the value that satisfies:
β(n∗)2 ≈ r.β′(n∗). (3.9)
Figure 3.9 shows Na and Λa versus n when β(n) = 0.02n with r = 0.5 secs−1, andwe see that n∗ = 5 as predicted by (3.9). Note that since the mitigation strategyprevents misbehaving mobiles from generating signalling traffic for a short period, itcannot completely eliminates the attack; however, the optimum value n∗ is able toreduce the average number of misbehaving devices by about 60%.
38

0 2 4 6 8 10 12 14 16 18 20500
1000
1500
2000
n
Na
0 2 4 6 8 10 12 14 16 18 200
200
400
600
a
a
Na
Figure 3.9: Number of attacking mobiles (left) and resulting signalling overload (right)versus the number of false transitions that triggers the mitigation mechanism,when the rate of new connections λ = 10 calls/s, timer τ−1 = 5s, percentageof malicious calls α = 0.1, average connection setup time r−1 = 2s, andnormal user’s traffic characterised by κ−1 = 10s, δ−1 = 5mins, and µ−1 = 5s.
39

3.5 Final Remarks
While this section has focused on the real-time detection of signalling anomalies, theproposed RNN based approach is generic and can be applied to detect and classify avariety of attacks targeting both the mobile user and the network. This requires theselection of appropriate features and the adjustment of the algorithm’s parameters, aswe have illustrated in the case of signalling storms. Furthermore, the insights gainedfrom the mathematical model, which captures the interactions between the signallingand billing based detectors, will be utilised in the integration phase in order to improvethe overall performance of the NEMESYS solution.
40
4 Graph-based Descriptors for the Detection ofBilling Related Anomalies
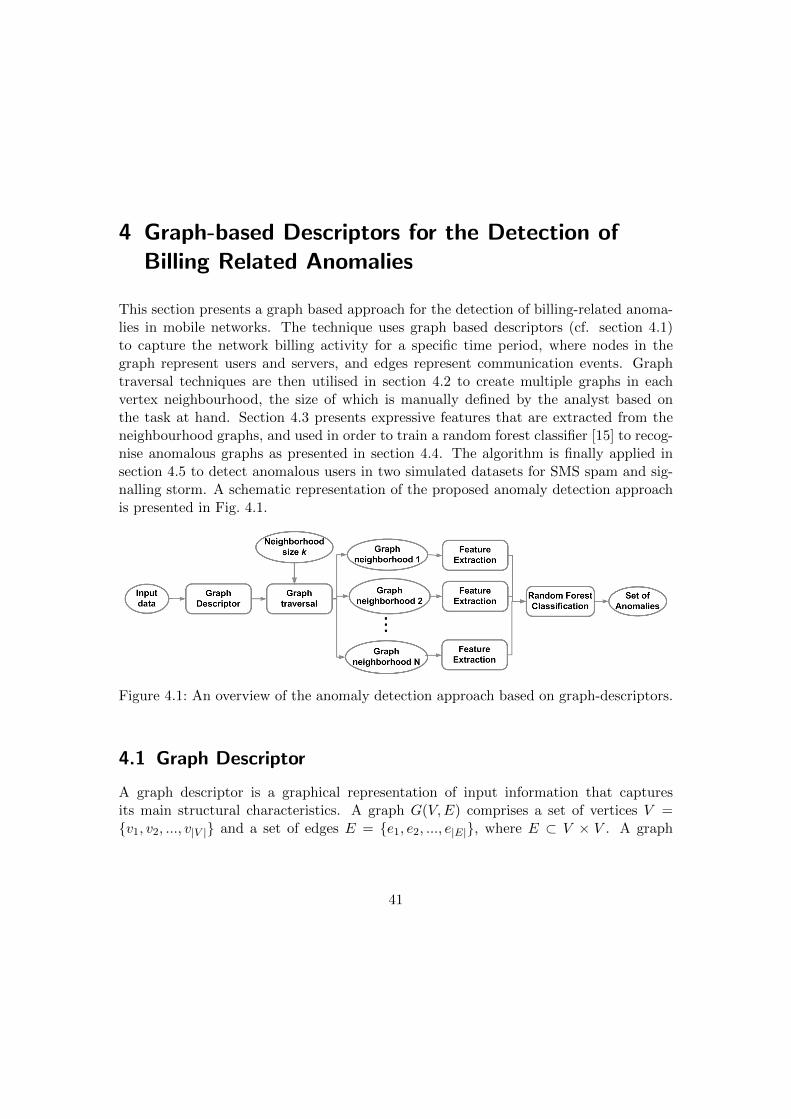
This section presents a graph based approach for the detection of billing-related anoma-lies in mobile networks. The technique uses graph based descriptors (cf. section 4.1)to capture the network billing activity for a specific time period, where nodes in thegraph represent users and servers, and edges represent communication events. Graphtraversal techniques are then utilised in section 4.2 to create multiple graphs in eachvertex neighbourhood, the size of which is manually defined by the analyst based onthe task at hand. Section 4.3 presents expressive features that are extracted from theneighbourhood graphs, and used in order to train a random forest classifier [15] to recog-nise anomalous graphs as presented in section 4.4. The algorithm is finally applied insection 4.5 to detect anomalous users in two simulated datasets for SMS spam and sig-nalling storm. A schematic representation of the proposed anomaly detection approachis presented in Fig. 4.1.
Figure 4.1: An overview of the anomaly detection approach based on graph-descriptors.
4.1 Graph Descriptor
A graph descriptor is a graphical representation of input information that capturesits main structural characteristics. A graph G(V,E) comprises a set of vertices V ={v1, v2, ..., v|V |} and a set of edges E = {e1, e2, ..., e|E|}, where E ⊂ V × V . A graph
41

descriptor is a weighted directed graph in which W : E → Rn is a function that takes asinput a specific edge and returns its corresponding edge weight, which is an n-dimensionalvector. The vertices of the graph descriptor can thus represent network entities (e.g.users, servers, etc.), the edges correspond to communication events between them, andthe edge weights capture the attributes of these communications.
In the context of CDR, the graph descriptor represents the billing activity of the usersin the network. Specifically, the nodes of the graph are the source and destination inthe CDR, e.g. user IDs for calls/SMS and IP servers for Internet traffic. The edgesconnect specific sources to their destinations and are directed, while the weights of theedges represent specific attributes of the CDR records, e.g. the number of calls/SMS,or the size of the Internet packets. The exact weights of the edges are selected basedon the task at hand, and the scenario under investigation. In this respect, the proposedgraph descriptor provides a holistic view of the CDR activity in the mobile network, andprovides a first step towards identifying anomalous behaviours.
Table 4.1 shows a small example of call records for three users: User-1 called User-2two times, and User-2 called User-3 one time. The graph descriptor for this example iscreated by associating each user with a vertex, and connecting users that exchanged atleast one call. Since there is only one attribute in the CDR, edge weights represent thenumber of calls between users. The direction of the edges encodes the direction of thecommunication. The resulting graph descriptor of the CDR in Table 4.1 is illustrated inFig. 4.2, where the widths of the edges reflect their weights: the edge connecting User-1to User-2 has weight 2, and all other edges have weight 1.
Table 4.1: An example CDR data representing calls between users.
Call ID Origin user Destination users
1 User-1 User-2
2 User-1 User-2
2 User-2 User-1
3 User-2 User-3
4 User-3 User-4
5 User-4 User-2
42

Figure 4.2: The graph descriptor of the calls in the CDR data of Table 4.1. The weightsof the edges represent the number of calls between users: User-1 called User-2two times.
4.2 Graph Neighbourhoods
The graph descriptor provides a method to represent the communication activities ofall the users in a network. In order to identify anomalous behaviours in the structureof the graph, a traversal method is applied to the initial graph, which results in thecreation of multiple smaller graphs, each representing the neighbourhoods of a vertex.The resulting graphs are subsequently used for feature extraction and classification ofanomalies.
Let Nk(vi) denote the set of k-neighbours of vertex vi ∈ V . This set is comprisedof all the nodes that have graph geodesic distance smaller than or equal to k, wherethe geodesic distance GD(vi, vj) between two vertices vi and vj is the length of theshortest path connecting them. Hence, the k-neighbours of vertex vi ∈ V are defined asNk(vi) = {vj |∀GD(vi, vj) ≤ k}. Graph traversal then consists in creating a new graph foreach vertex vi, denoted as Gi(Vi, Ei), where Vi = Nk(vi)
⋃vi, Ei = {ej = {vk, vh}|∀ej ∈
E, and vk, vh ∈ Vi}, and E is the set of edges of the initial graph descriptor G that isbeing traversed. Fig. 4.3(a) shows an example of k-neighbourhood graph for differentvalues of k, where the graph is created for the central large vertex; the larger the valueof k the larger the resulting graph.
Since the graph is directed, we denote by esj the source vertex of edge ej ∈ Ei, and
by edj its destination vertex. For each k-neighbours of vertex vi ∈ V , the set of outwarddirected edges represent all the edges that have their source in the set Nk(vi) and theirdestination outside of this set. More precisely, the set of outgoing edges for Nk(vi) isgiven by:
Eouti = {ej |ej ∈ Ei,∀esj ∈ Nk(vi) and edj /∈ Nk(vi)} (4.1)
The set of ingoing edges Eini for the set Nk(vi) is defined in a similar manner. Fig. 4.3(b)shows the set of inward and outward directed edges for each k-neighbourhood of thecentral vertex in Fig. 4.3(a). It can be observed that all the edges that intersect the
43

Figure 4.3: (a) Example of k-neighbourhood graph for the central large vertex underdifferent values of k. (b) Example of inward and outward directed edges forthe k-neighbourhood graph, with k = i, which consists of all the edges thatintersect the dashed red ellipsoid C.
dashed red ellipsoid C belong to either the set of ingoing edges (edges that are directedtowards the centre) or the set of outgoing edges (edges that are directed away from thecentre).
Fig. 4.4 illustrates the graph traversal process, showing the graphs that are created ineach step of the iteration using k-neighbourhoods for k = 1 and k = 2. All the verticesof the graph are traversed, and for the specific vertex under consideration in the currentiteration (called active vertex), all its k-neighbourhoods are utilised to create the corre-sponding neighbourhood graph. The red node in Fig. 4.4 represents the active vertex ineach step and the green vertices are its k-neighbourhoods in the graph. The end resultis the creation of a set of neighbourhood graphs, one for each vertex: {G1, G2, .., G|V |},where |V | is the number of vertices of the entire graph descriptor G.
4.3 Graph based Feature Extraction
This section describes how the aforementioned graph neighbourhoods can be used toextract relevant features that are able to characterise the network activity. The neigh-bourhoods that are created correspond to a set of weighted graphs Gi (Vi, Ei), one foreach vertex, with a weight mapping function W . From these representations, multiplefeatures can be extracted as described below, taking into account the weights and direc-tion of the edges, where each feature captures a different aspect of the graphs and all
44

Figure 4.4: An example of graph traversal with k = 1 and k = 2. The red vertex repre-sents the active vertex in each step, and green vertices are its k-neighboursin the graph.
the features together provide a complete view of the network activity.
4.3.1 Volume
The volume feature fvol captures the size of the graph, and consequently the degree ofnetwork activity, which is important for identifying anomalies related to large networkactivities. The volume feature is defined as follows:
fGivol =∑ej∈Ei
g (W (ej)) , (4.2)
where:
g(x) =
{1, for |x| 6= 00, for |x| = 0
and Gi denotes the neighbourhood graph of vertex Vi, Ei its set of edges, and W (ej) theweight of edge ej ∈ Ej .
45

4.3.2 Edge Entropy
Shannon’s entropy takes as input a set of symbols and their underling distribution,and returns their average amount of information; the input symbols represent distinctentities in a set of objects, which in this case are the edge weights. Hence the edgeentropy fee captures the amount of information in the edge weights as characterisedby their underling distribution. Large difference in the entropy value between distinctgraphs indicates that their weight distribution is quite different. The edge entropy of agraph Gi is defined as:
fGiee = −Y i∑j=1
yijyitotal
log
(yijyitotal
)(4.3)
where Y i is the number of different edge weight instances of graph Gi, yij is the number
of occurrences of the j-th weight, and yitotal =∑Y i
j=1 yij is the total number of weight oc-
currences. Note that this feature characterises two possible types of network behaviour:change in the volume of the data, and change in their underling distribution. Largenetwork disturbances not only increase the volume of the data, but also have a directeffect on their distribution. The entropy feature is introduced to capture this effect.
4.3.3 Graph Entropy
Graph entropy fge measures the structural information content of the graph based onthe distribution of the edge connections. The graph entropy was introduced in [40]as a problem of determining the best possible encoding of the information emitted by asource in which pairs of symbols may be indistinguishable. As noted earlier, the symbolsrepresent distinct entities in a set of objects which, in the case of graph entropy, are thevertices. Two symbols are distinguishable if they are connected through an edge, andindistinguishable otherwise. Examples of the entropy value of known graphs (illustratedin Fig. 4.5) include:
• A complete graph with n vertices has graph entropy log2(n) bits, since all thevertices are distinguishable. In this case, fge is equivalent to Shannon’s entropy.
• A complete bi-partite graph has entropy 1 bit, since it can be partitioned into twosets of indistinguishable vertices.
• A graph with no edges has entropy 0 bits, since all the vertices are indistinguishable.
More formally, Korner’s entropy is defined as [61,62]:
fGige = minX,Y
I(X ∧ Y ) (4.4)
46

where I(X ∧ Y ) is the mutual information of the variables X and Y that have thefollowing properties. The variable X is uniformly distributed and taking its values onthe vertices of Gi, while Y on the stable sets of Gi, and their joint distribution is suchthat X ∈ Y with probability 1. A subset Y of the vertices Vi of an undirected graphGi = (Vi, Ei) is a stable set if no edge in the graph has both endpoints in Y .
Figure 4.5: Examples of graph entropy.
4.3.4 Maximum Outlier Factor
The maximum outlier factor fmof of all the weights of all the graphs Gi,∀i ∈ {1, 2, .., |V |}characterises the existence of outliers in the graph, where an outlier represents an edgeweight which is not common, and thus deviates from the normal behaviour.
It is important to note that in order to define the fmof feature, all the different edgeweights for all the graphs Gi must be taken into account, and not only the weights ofthe graph under investigation. In this manner, false positives are reduced and only thetrue outliers stand out, since false positives can be caused by a small sample of weights,which may not be sufficient for an accurate outlier calculation. In our approach, we usethe entropy outlier factor (EOF), which was first proposed in [37] to quantify the degreeof outlier of each data record in a multidimensional set. The EOF procedure, denotedby F
(W (ek), P
), takes as input an edge ek plus its weight W (ek) and the set of all the
edge weights P ={W (ej) | ∀ej ∈ Ei, ∀i ∈ {1, 2, .., |V |}
}, and returns its corresponding
outlier factor, which is in [0, 1] with values close to 1 being outliers. The fmof feature isthen defined as follows:
fGimof = maxek∈Ei
F(W (ek), P
)(4.5)
4.3.5 Edge Weight Ratio
The edge weight ratio feature fwr captures the total difference in the values of the weightsbetween the edges of a graph Gi directed outward from vi and inward to vi. Thus,
47

this feature captures anomalies regarding large imbalances between the communicationdirections. For example, the number of SMS sent by spammers is usually much largerthan what they receive, while a normal user is likely to exhibit comparable number ofmessages in both directions. We define the edge weight ratio feature of graph Gi as:
fGiwr =
∑ej∈Eouti
W (ej)∑ej∈Eini
W (ej)(4.6)
where Eouti and Eini are the set of outward and inward directed edges for the k-neighboursof graph Gi, as described in section 4.2.
4.3.6 Average Outward/Inward Edge Weight
The average outward edge weight favout represents the ratio of the volume of trafficgenerated by a node to the number of its destinations:
fGiavout =
∑ej∈Eouti
W (ej)
|Eouti |(4.7)
This feature can be useful to detect, for example, spammers or port scanning worms thattypically have high communication activity directed to a large number of destinations,resulting in an average outward edge weight close to 1. On the other hand, normal usersare likely to communicate with a small set of destinations, leading to favout >> 1 for highactivity users. Similarly, the average inward edge weight favin can be defined as in (4.8)but using Eini ; this feature will exhibit very small values (close to 0) for the maliciousbehaviours mentioned above, and moderate to high values for normal behaviour whichmay further increase when a user receives anomalous traffic.
4.3.7 Number of Outward/Inward Edges with a Specific Weight
These features count the number of outward and inward edges that have weight equalto a specific value w. The feature for outward edges fneout is defined as follows:
fGineout =∑
ei∈Eouti
1[W (ei) = w], (4.8)
where 1[x] is the characteristic function which takes the value 1 if x is true and 0 other-wise. This feature can recognise deterministic communication patterns which are often
48

exhibited by malware (e.g. a spammer sending one spam message to each destination, ora bot receiving commands from a remote server a specific number of times). Similarly,we define a feature fnein as the number of inward edges with a specific weight.
4.4 Detection of Anomalous Users
As discussed earlier, each neighbourhood graph is created based on the k-neighbourhoodof each vertex in the entire graph descriptor. Each vertex represents an entity in thenetwork (e.g. a user, server, etc.) that is characterised be a set of actions, and theneighbourhood graph describes the network behaviour of this entity. Thus we can usesupervised learning methods to train a classifier based on the features extracted fromeach graph, so as to recognise anomalous neighbourhood graphs, i.e. anomalous entities.
There are a number of methods that may be used for supervised classification. Inthe context of graph based descriptor framework, random forest [15] has been shownto outperform other supervised learning algorithms [20, 21] in a variety of datasets. Inaddition, this method does not suffer from overfitting problems, is less sensitive to outlierdata, and calculates automatically the importance of each feature in the classificationtask [9]. Hence we use the random forest algorithm along with the features that we havedescribed in order to perform anomaly detection.
Specifically, the features extracted from each of the neighbourhood graphs are utilisedto train the classifier to distinguish between normal and abnormal behaviour. Then,when a new graph neighbourhood is generated, it is provided to the trained algorithm forclassification. It should be noted that the random forest is trained using the Leave-one-out validation method. In other words, in the case that the random forest must predictthe outcome of a specific graph neighbourhood, it is trained with all other graph neigh-bourhoods that contain both anomalous and normal graphs. In this way, the efficiencyof the proposed approach in detecting possible unknown incidents is demonstrated.
The random forest is a collection of multiple decision trees, trained on random samplesextracted from the initial dataset. The final classification result is calculated using ma-jority voting. Fig. 4.6 shows an example of decision tree generation for the classificationof two coloured circles: red and green. The background colour represents the classifica-tion result at the specific iteration, as calculated from the largest class belonging to thecorresponding partition. The total space is iteratively partitioned into smaller regionsalong each feature, in order to create the space partitioning that best represents thedata.
49

Figure 4.6: Examples of decision tree generation for the classification of two colouredcircles (red and green). The total space is iteratively partitioned into smallerregions along each feature, so as to create a partitioning that best representsthe data.
4.5 Applications
In this section we evaluate the performance of our anomaly detection algorithm on twodistinct datasets, one for a common attack against the mobile users (SMS spam) andthe second represents threats targeting the network infrastructure (signalling storms).
4.5.1 Application 1: Spam SMS dataset
The traffic models for the spam scenario are all based on the SMS application describedin section 3.3.1. There are in total 10,000 mobile devices which are divided into threedistinct groups according to behaviour: (i) 4,000 users exhibit low levels of SMS activity,(ii) 3,000 users exhibit medium levels of SMS activity, and (iii) 4,000 users exhibit highlevels of SMS activity. In the simulations, 102 mobile devices, uniformly distributedacross the three distinct groups, are assumed to be infected with spam malware. Themalware does not have a diurnal cycle, and it regularly sends a configurable number ofspam SMS messages, with each message being sent to a destination chosen randomlyfrom the mobile’s contact list. Normal mobile users have a very small probability ofresponding to a spam SMS; this small probability represents the small fraction of userswho reply to received spam messages in order to “opt-out” of the service. The goal inthis experiment is to identify the infected mobile devices.
The simulation scenario includes out-network, premium and legitimate advertisingservers, each having a different messaging behaviour in order to create noise in the dataand to produce realistic users’ profiles. For example, premium SMS servers may respondto a received message but they do not initiate a conversation, unlike out-network serverswhich represent mobile devices that are not explicitly simulated. On the other hand,
50

the advertising server is assumed to be a device connected to the mobile network andcapable of sending SMS messages at a high rate. We assume that the server has obtaineda list of the phone numbers of many mobile users, and frequently selects one or moreusers at random and sends a message to each. This server follows a diurnal cycle, andit does not respond to any received SMS messages.
Since the important factor in this dataset is SMS activity, the graph descriptor iscreated to represent this behaviour. Specifically, the vertices of the graph represent themobile devices, and the edges represent SMS activity between two devices. The weightof an edge represents the number of messages exchanged between the correspondingdevices. Thus, each neighbourhood graph represents the SMS activity of each user withrespect to the selected destinations and the number of messages directed to them. Forthe creation of the neighbourhood graphs, k-neighbours with k = 1 were used, since aspam message concerns two users, and the addition of extra neighbours would only addnoise, since a normal user whose graph geodesic distance to an anomalous user is 2 isnot necessarily anomalous.
Fig. 4.7a shows the volume feature fvol for 150 users from the low SMS activity class.As one would expect, spammers are characterised by relatively higher volumes, as theycommunicate with a larger number of destinations. Fig. 4.7b shows the edge weight ratiofeature fwr for 150 users from the medium SMS activity class, and the results illustratethat the anomalous users have low values in this feature, which is consistent with thefact that spammers send significantly more messages than they receive.
The edge entropy feature fee for 150 users taken from the high SMS activity classis presented in Fig. 4.8a. One can observe that anomalous users have large entropyvalues, indicating that they communicate with a large number of destinations, each at adifferent frequency. Fig. 4.8b presents the graph entropy feature fge for the same set ofusers, and the the results indicate that spammers exhibit lower values for this feature,which is due to the fact that they communicate with a large number of users. For thedefinition of the number of outward and inward edges with a specific weight (i.e. fneoutand fnein), a weight value w = 1 was selected based on the assumption that spammersare most likely to send SMS only once to new destinations.
The results of applying our anomaly detection algorithm are summarised in Table 4.2.The algorithm is evaluated based on two metrics, the True Positive (TP) which measuresthe number of users that are anomalous and also classified as anomalous by the system,and the False Positive (FP) which measures the number of users that are normal butclassified as anomalous by the system. As shown in the table, the users were partitionedinto three subsets on which both training and testing are performed: (i) low activityusers, (ii) low and medium activity users, and (iii) low, medium, and high activity users(i.e. the entire dataset). In all cases the proposed anomaly detection approach was
51

(a) The volume feature fvol .
(b) The edge weight ratio feature fwr.
Figure 4.7: Features based on the neighbourhood graphs for 150 users taken from thelow (a) and medium (b) SMS activity classes of the spam dataset, using thenumber of SMS as the weights of the edges. The first 33 users are anomalous,characterised by high volume and low edge weight ratio.
able to identify the anomalous users, producing zero false positives, which indicatesthat the features we defined can discriminate between normal and malicious behavioursindependently of the activity level of the users. In practice, however, we do not expectsuch level of performance, and therefore we plan to conduct further experiments, as partof the evaluation phase of NEMESYS, using models based on real malware or spamcampaigns.
52

(a) The edge entropy feature fee.
(b) The graph entropy feature fge.
Figure 4.8: Features based on the neighbourhood graphs for 150 users taken from thehigh SMS activity class of the spam dataset, using the number of SMS as theweights of the edges. The first 33 users are anomalous, characterised by highedge entropy and low graph entropy due to the large number of recipients.
Table 4.2: The results of the application of the graph descriptors anomaly detec-tion methods for the identification of spammers in the spam SMS dataset.TP=True Positive, and FP=False Positive
Activity Level Normal users Abnormal users TP FP
Low 3965 34 34 0
Low & Medium 6931 68 68 0
Low, Medium & High 9898 102 102 0
53

4.5.2 Application 2: RRC Attacks
This section presents the application of the graph descriptor approach to the dataset forRRC signalling storms described in section 3.3.2. There are two classes of anomaloususers in this dataset: (i) malicious UEs that send Internet packets whenever a demotionfrom the DCH state is assumed to have occurred, and (ii) misbehaving UEs that sendperiodic packets whenever the user is inactive. There are in total 200 users, of which 100are anomalous, 50 in the first class and 50 in the second one. The goal of this experimentis to evaluate the performance of our algorithm in identifying the anomalous users.
The graph descriptor for this dataset is built in order to reflect its key behaviouralfactor which is Internet activity. Specifically, the vertices of the graph descriptor rep-resent users and servers, while edges correspond to Internet traffic between them. Theweights of edges represent the size of the packets exchanged between the correspondingusers and servers. The graph traversal technique takes into consideration only the uservertices for the creation of the graph neighbourhoods (which include both users andservers), and the subsequent identification of anomalous users. For the creation of theneighbourhood graphs, k-neighbours with k = 1 were applied so as to take into accountthe Internet traffic from the user under investigation to its direct neighbours.
Fig. 4.9a presents the maximum entropy outlier factor feature fmof of the neighbour-hood graphs for all 200 users in the storm dataset. The feature is used as the main dis-criminant factor between normal and abnormal behaviour, and it indicates the existenceof at least one edge with very high weight in the activity of the abnormal users. Eachsuch edge represents the continuous exchange of Internet packets between the anoma-lous users and a specific server. Fig. 4.9b indicates that there is no distinct behaviourbetween normal and abnormal users in the volume feature, confirming our earlier obser-vation that signalling anomalies are difficult to detect using traditional flooding basedtechniques.
Finally, we summarise the results of applying our graph descriptor anomaly detectionmethod to the storm dataset in Table 4.3, showing that the algorithm was able to identifyall the anomalous users, while generating no false positives.
Table 4.3: The results of the application of the graph descriptors anomaly detectionmethod for the identification of abnormal users in the storm dataset.
Normal users Abnormal users TP FP
100 100 100 0
54

(a) The maximum entropy outlier factor feature fmof .
(b) The volume feature fvol.
Figure 4.9: Features of the neighbourhood graphs created for all 200 UEs in the stormdataset, using packet sizes as the weights of the edges. The first 100 users areanomalous, as indicated by their large outlier degree. However, no distinctbehaviour is present in the volume feature.
55

5 Conclusions
The goal of the NEMESYS project is to develop a novel security framework for gatheringand analysing information about the nature of cyber-attacks targeting mobile devicesand networks, and to identify abnormal events and malicious network activity. Thus thisdeliverable described our proposed approaches to the analysis of network traffic and thedevelopment of anomaly detection algorithms, which combine modelling and learningfrom network measurements and billing (meta)data that are readily available to themobile operator. In contrast to signalling based solutions, the algorithms presented inthis deliverable do not require changes to network components and/or protocols, andcan be deployed using standard traffic monitoring platforms.
We first presented an online anomaly detection approach based on the random neuralnetwork (RNN) [28,29]. Our method uses the notion of an observation window in whichsummary statistics about the behaviour of a mobile user are collected and stored at fixedtime intervals (called slots) and used in order to calculate expressive features that cancapture both sudden and long term changes in the user’s behaviour. The features forthe most recent time slot are subsequently fused using a trained RNN to produce thefinal classification decision. Using our mobile network simulator, we have shown thatour technique is able to detect quickly users that are causing signalling overloads in thenetwork, without directly monitoring the control plane itself, and can even identify theend of attacks.
The proposed RNN approach is flexible, providing a number of parameters to optimisethe trade-off between detection speed, accuracy and overhead. For example, the size ofthe observation window and the frequency of statistical measurements (i.e. number ofslots within the window) could be adjusted in real-time to respond to network conditions,and to reflect the capacity of the network to tolerate a specific misbehaviour. Ourapproach is also generic and can be applied to identify a variety of attacks targetingboth the mobile user and the network, which requires only the selection of appropriatefeatures and the adjustment of the algorithm’s parameters. We concluded our evaluationwith a mathematical model that allows us to analyse and optimise the performance of thesignalling based detector of D4.1 [6], when used in conjunction with the RNN method;the insights gained from the model will be utilised in the integration phase to improvethe overall detection performance of the NEMESYS solution.
Finally, we developed an anomaly detection algorithm which uses graph based de-
56

scriptors to capture billing related activities in the network, where nodes in the graphrepresent users and servers, and edges correspond to communication events. In thismethod, graph traversal techniques are applied to create multiple graphs in each vertexneighbourhood, from which features are extracted and used in order to train a randomforest classifier [15] to recognise anomalous graphs. The graph based approach has beenvalidated for the signalling storm dataset, and also for SMS spam data generated by oursimulator. The results indicate that the method is able to identify, with high accuracyand precision, anomalous users in both datasets, thus providing a complementary ap-proach to the online RNN algorithm; the latter is activated and configured based on keyperformance indicators to respond to an urgent condition, while the former can be exe-cuted periodically to detect stealthy but non-critical malicious campaigns in the mobilenetwork. These algorithms will be further evaluated in the final phase of the projectusing our mobile simulator and testbed.
57

Bibliography
[1] 3GPP TR 23.887 : Machine-type and other mobile data applications communica-tions enhancements (release 12). http://www.3gpp.org/DynaReport/23887.htm,Dec 2013. Technical report.
[2] Cisco visual networking index: Global mobile data traffic forecast update, 2012–2017, Feb. 2013.
[3] NEMESYS Deliverable D2.2: Virtualized mobile honeypot, Oct 2014.
[4] NEMESYS Deliverable D2.3: Lightweight malware detection module for mobiledevices, Oct 2014.
[5] NEMESYS Deliverable D3.2: Honey client prototype, Jul 2014.
[6] NEMESYS Deliverable D4.1: Anomaly detection based on signalling protocols, Oct2014.
[7] H. Abdelbaki. Matlab simulator for the RNN. http://www/cs/ucf.edu/ahossam/rnnsim.
[8] O. H. Abdelrahman and E. Gelenbe. Signalling storms in 3G mobile networks. InProc. IEEE International Conference on Communications (ICC’14), pages 1017–1022, Sydney, Australia, June 2014.
[9] J. Ali, R. Khan, N. Ahmad, and I. Maqsood. Random forests and decision trees.IJCSI International Journal of Computer Science Issues, 9(5), 2012.
[10] Arbor Networks. Worldwide infrastructure security report. http://www.
arbornetworks.com/research/infrastructure-security-report, 2012.
[11] AVG. New AVG study reveals smartphone users not aware of significant mobilesecurity risks. http://mediacenter.avg.com/content/mediacenter/en/news/
new-avg-study.html, Feb 2011.
58

[12] A. Baliga, J. Bickford, and N. Daswani. Triton: A carrier-based approach fordetecting and mitigating mobile malware. Journal of Cyber Security, 3(4):181–212,July 2014.
[13] A. Barbuzzi, F. Ricciato, and G. Boggia. Discovering parameter setting in 3Gnetworks via active measurements. IEEE Communications Letters, 12(10):730–732,Oct. 2008.
[14] BBC. Cyber thieves profit via the mobile in your pocket. http://www.bbc.co.uk/news/technology-20080397, Nov 2012.
[15] L. Breiman. Random forests. Machine learning, 45(1):5–32, 2001.
[16] L. Breslau, P. Cao, L. Fan, G. Phillips, and S. Shenker. Web caching and Zipf-likedistributions: evidence and implications. In Proc. IEEE INFOCOM’99, volume 1,pages 126–134, Mar 1999.
[17] I. Burguera, U. Zurutuza, and S. Nadjm-Tehrani. Crowdroid: behavior-based mal-ware detection system for android. In Proceedings of the 1st ACM workshop onSecurity and privacy in smartphones and mobile devices (SPSM ’11), pages 15–26,Chicago, Illinois, USA, 2011. ACM.
[18] Canalys. Smart phones overtake client PCs in 2011. http://www.canalys.com/
newsroom/smart-phones-overtake-client-pcs-2011, Feb 2012.
[19] Canalys. Mobile device market to reach 2.6 bil-lion units by 2016. http://www.canalys.com/newsroom/
mobile-device-market-reach-26-billion-units-2016, Feb. 2013.
[20] R. Caruana, N. Karampatziakis, and A. Yessenalina. An empirical evaluation ofsupervised learning in high dimensions. In Proceedings of the 25th internationalconference on Machine learning, pages 96–103. ACM, 2008.
[21] R. Caruana and A. Niculescu-Mizil. An empirical comparison of supervised learningalgorithms. In Proceedings of the 23rd international conference on Machine learning,pages 161–168. ACM, 2006.
[22] Cisco. Cisco visual networking index: Forecast and methodology, 2013-2018. WhitePaper, Jun 2014.
[23] A. Coluccia, A. D’alconzo, and F. Ricciato. Distribution-based anomaly detectionvia generalized likelihood ratio test: A general maximum entropy approach. Com-put. Netw., 57(17):3446–3462, Dec. 2013.
59

[24] S. Corner. Angry Birds + Android + ads = network overload. http://www.itwire.com/business-it-news/networking/47823, June 2011.
[25] M. Donegan. Operators urge action against chatty apps. Light Reading Report,Jun 2011.
[26] W. Enck, P. Traynor, P. McDaniel, and T. L. Porta. Exploiting open functionalityin SMS-capable cellular networks. In Proceedings of the 12th ACM Conference onComputer and Communications Security (CCS’05), pages 393–404, Nov. 2005.
[27] C. Gabriel. DoCoMo demands Google’s help with sig-nalling storm. http://www.rethink-wireless.com/2012/01/30/
docomo-demands-googles-signalling-storm.htm, Jan. 2012.
[28] E. Gelenbe. Random neural networks with negative and positive signals and productform solution. Neural Comput., 1(4):502–510, Dec. 1989.
[29] E. Gelenbe. Learning in the recurrent random neural network. Neural Comput.,5(1):154–164, Jan. 1993.
[30] E. Gelenbe. The first decade of g-networks. European Journal of Operational Re-search, 126(2):231–232, October 2000.
[31] E. Gelenbe and O. H. Abdelrahman. Time-outs and counters against storms. Sub-mitted for publication, Aug 2014.
[32] E. Gelenbe and G. Loukas. A self-aware approach to denial of service defence.Computer Networks, 51(5):1299–1314, April 2007.
[33] E. Gelenbe and R. Muntz. Probabilistic models of computer systems - part I (exactresults). Acta Informatica, 7(1):35–60, 1976.
[34] G. Gorbil, O. H. Abdelrahman, and E. Gelenbe. Storms in mobile networks. InProceedings of the 9th ACM Symposium on QoS and Security for Wireless andMobile Networks (Q2SWinet’14), pages 119–126, Sept. 2014.
[35] A. Gupta, T. Verma, S. Bali, and S. Kaul. Detecting MS initiated signaling DDoSattacks in 3G/4G wireless networks. In Proceedings of 5th International Conferenceon Communication Systems and Networks (COMSNETS’13), pages 1–6, 2013.
[36] D. Iland, A. Pucher, and T. Schauble. Detecting android malware on network level.Technical report, UC Santa Barbara, 2012.
60

[37] F. Jiang, Y. Sui, and C. Cao. An information entropy-based approach to outlierdetection in rough sets. Expert Systems with Applications, 37(9):6338–6344, 2010.
[38] N. Jiang, Y. Jin, A. Skudlark, W.-L. Hsu, G. Jacobson, S. Prakasam, and Z.-L.Zhang. Isolating and analyzing fraud activities in a large cellular network via voicecall graph analysis. In Proceedings of the 10th international conference on Mobilesystems, applications, and services (MobiSys ’12), pages 253–266, Low Wood Bay,Lake District, UK, 2012. ACM.
[39] E. K. Kim, P. McDaniel, and T. Porta. A detection mechanism for SMS floodingattacks in cellular networks. In A. D. Keromytis and R. Pietro, editors, Securityand Privacy in Communication Networks, volume 106 of LNICST, pages 76–93.Springer Berlin Heidelberg, 2013.
[40] J. Korner. Coding of an information source having ambiguous alphabet and theentropy of graphs. Transactions of the Sixth Prague Conference on InformationTheory, pages 411–425, 1973.
[41] A. Ksentini, Y. Hadjadj-Aoul, and T. Taleb. Cellular-based machine-to-machine:overload control. IEEE Network, 26(6):54–60, November 2012.
[42] P. P. Lee, T. Bu, and T. Woo. On the detection of signaling DoS attacks on 3Gwireless networks. In Proceedings of the 26th IEEE International Conference onComputer Communications (INFOCOM’07), pages 1289–1297, May 2007.
[43] C. Lever, M. Antonakakis, B. Reaves, P. Traynor, and W. Lee. The core of thematter: Analyzing malicious traffic in cellular carriers. In Proceedings of Networkand Distributed System Security Symposium (NDSS’13), pages 1–16, San Diego,CA, USA, Feb 2013. Internet Society.
[44] J. Li, W. Pei, and Z. Cao. Characterizing high-frequency subscriber sessions incellular data networks. In Proceedings of IFIP Networking Conference, pages 1–9,Brooklyn, NY, May 2013.
[45] Lookout Mobile Security. The bearer of BadNews. https://blog.lookout.com/
blog/2013/04/19/the-bearer-of-badnews-malware-google-play, Apr 2013.
[46] D. Maslennikov. Mobile malware evolution: Part 6. Technical report, KasperskyLab, Feb 2013.
61

[47] D. Maslennikov and Y. Namestnikov. Kaspersky security bulletin 2012: The over-all statistics for 2012. http://www.securelist.com/en/analysis/204792255/
Kaspersky_Security_Bulletin_2012_The_overall_statistics_for_2012, Dec.2012.
[48] I. Murynets and R. Piqueras Jover. Crime scene investigation: SMS spam dataanalysis. In Proceedings of the 2012 ACM conference on Internet measurementconference (IMC ’12), pages 441–452, Boston, Massachusetts, USA, 2012. ACM.
[49] Nokia Networks. New network-based security solution from NSN helps protectsmart device users against malware. http://networks.nokia.com/news-events/press-room/press-releases/new-network-based-security-solution-from-nsn-helps-protect-smart-device-users-against-malw, Feb 2014.
[50] NSN Smart Labs. Understanding smartphone behavior in the network. White pa-per, http://www.nokiasiemensnetworks.com/sites/default/files/document/Smart_Lab_WhitePaper_27012011_low-res.pdf, Jan 2011.
[51] G. Oke, G. Loukas, and E. Gelenbe. Detecting denial of service attacks with bayesianclassifiers and the random neural network. In Proceedings of Fuzz-IEEE 2007, pages1964–1969, London, UK, July 2007.
[52] F. Qian, Z. Wang, A. Gerber, Z. M. Mao, S. Sen, and O. Spatscheck. Character-izing radio resource allocation for 3G networks. In Proceedings of the 10th ACMSIGCOMM Conference on Internet Measurement (IMC’10), pages 137–150, Nov.2010.
[53] Z. Qian, Z. Wang, Q. Xu, Z. M. Mao, M. Zhang, and Y.-M. Wang. You canrun, but you can’t hide: Exposing network location for targeted DoS attacks incellular networks. In Proceedings of the 19th Annual Network and Distributed SystemSecurity Symposium (NDSS’12)), Feb. 2012.
[54] G. Redding. OTT service blackouts trigger signaling overload in mo-bile networks. http://blogs.nsn.com/mobile-networks/2013/09/16/
ott-service-blackouts-trigger-signaling-overload-in-mobile-networks/,Sept. 2013.
[55] F. Ricciato. Unwanted traffic in 3g networks. ACM SIGCOMM Comput. Commun.Rev., 36(2):53–56, Apr. 2006.
62

[56] F. Ricciato, A. Coluccia, and A. DAlconzo. A review of DoS attack models for 3Gcellular networks from a system-design perspective. Computer Communications,33(5):551–558, Mar. 2010.
[57] A.-D. Schmidt, F. Peters, F. Lamour, C. Scheel, S. A. Camtepe, and c. Albayrak.Monitoring smartphones for anomaly detection. Mobile Networks and Applications,14(1):92–106, 2009.
[58] C. Schwartz et al. Smart-phone energy consumption vs. 3G signaling load: Theinfluence of application traffic patterns. In Proc. 24th Tyrrhenian Int. W’shopDigital Communications (TIWDC’13), pages 1–6, Genoa, Italy, Sept. 2013.
[59] J. Serror, H. Zang, and J. C. Bolot. Impact of paging channel overloads or attacks ona cellular network. In Proceedings of the 5th ACM Workshop on Wireless Security(WiSe’06), pages 75–84, Sept. 2006.
[60] M. Z. Shafiq, L. Ji, A. X. Liu, J. Pang, and J. Wang. A first look at cellular machine-to-machine traffic: Large scale measurement and characterization. SIGMETRICSPerformance Evaluation Review, 40(1):65–76, Jun 2012.
[61] G. Simonyi. Graph entropy: a survey. Combinatorial Optimization, 20:399–441,1995.
[62] G. Simonyi. Perfect graphs and graph entropy. an updated survey. Perfect graphs,pages 293–328, 2001.
[63] T. Taleb and A. Kunz. Machine type communications in 3GPP networks: potential,challenges, and solutions. IEEE Communications Magazine, 50(3):178–184, March2012.
[64] S. Timotheou. The random neural network: A survey. The Computer Journal,53(3):251–267, 2010.
[65] P. Traynor, M. Lin, M. Ongtang, V. Rao, T. Jaeger, P. McDaniel, and T. La Porta.On cellular botnets: measuring the impact of malicious devices on a cellular networkcore. In Proceedings of the 16th ACM conference on Computer and communicationssecurity (CCS ’09), pages 223–234, Chicago, Illinois, USA, 2009. ACM.
[66] I. Vural and H. Venter. Mobile botnet detection using network forensics. In Pro-ceedings of the Third future internet conference on Future internet (FIS’10), pages57–67, Berlin, Germany, 2010. Springer-Verlag.
63

[67] Z. Wang, Z. Qian, Q. Xu, Z. Mao, and M. Zhang. An untold story of middle-boxes in cellular networks. ACM SIGCOMM Computer Communication Review -SIGCOMM’11, 41(4):374–385, Aug. 2011.
[68] G. Yan, S. Eidenbenz, and E. Galli. SMS-watchdog: Profiling social behaviors ofSMS users for anomaly detection. In Proceedings of the 12th International Sym-posium on Recent Advances in Intrusion Detection (RAID ’09), pages 202–223,Saint-Malo, France, 2009. Springer-Verlag.
64