Embed Size (px)
Citation preview
PART I: SUMMARYPROJECT TITLE: Optimizing Dietary Protein and Lipid Utilization to Improve
Production Efficiency of Tilapia in the Western United States
REPORT GIVEN IN YEAR: 2013
REPORTING PERIOD: 05/01/2010-09/19/2013
AUTHOR: Wendy M. Sealey
PARTICIPANTS: *Principal Investigator: Wendy M. SealeyInstitution: USFWS, Bozeman Fish Technology Center4050 Bridger Canyon RoadBozeman, MT 59715406/994-9908
Principal Investigator (Unfunded): Frederic T. BarrowsInstitution: USDA, ARS Trout Grains Project3509F National Fish Hatchery RoadHagerman, ID 83332208/837-9096
*Principal Investigator: Kevin M. FitzsimmonsInstitution: University of Arizona2601 E. Airport DriveTucson, AZ 85706520-626-3322
*Principal Investigator Responsible for Outreach: Gary FornshellInstitution: University of Idaho Extension246 Third Ave. E. Twin Falls, ID 83301 208/734-9590
Industry Collaborator: Tark RushDesert Springs Tilapia50621 Aguacaliente RoadDateland, AZ 85333
Project Monitor: Chhorn E. LimInstitution: USDA ARS Aquatic Animal Health Research Unit990 Wire Rd Auburn, Al, 36832334/887-3741 ext. 21
REASON for TERMINATION: Objectives completed (almost).
1
PROJECT OBJECTIVES:
(1) Identify the optimum dietary protein and lipid ratio(s) in practical diets for two different size classes of tilapia. (2) Evaluate the ability of vitamin supplementation to improve growth performance at different protein:lipid levels. (3) Further evaluate formulations identified with potential by laboratory testing in a pilot-scale on-farm trial. (4) Develop an integrated outreach program including at least one WRAC Extension publication to meet stakeholders’educational needs.
PRINCIPAL ACCOMPLISHMENTS: Completed five feeding trials resulting in data for development of an estimated four peer-
reviewed publications improving the knowledge base regarding the protein and lipid needs of tilapia.
Conducted three experimental hauling trials evaluating the effects of dietary protein and lipid levels on tilapia stress tolerance.
Validated laboratory data in a real-life on-farm pilot scale trial with “concept” feeds produced by a commercial feed manufacturer (pending).
Gave eight presentations at scientific meetings to convey project results. Trained two graduate students, one MS student at University of Arizona under the direction
of Kevin Fitzsimmons (Pamila Ramotar), one MS student (Chris Hooley) at Montana State University under the direction of Wendy Sealey.
Successfully published one article from project in JWAS prior to project completion.
IMPACTS: Our preliminary results demonstrate that the greatest weight gain for juvenile tilapia was observed for tilapia fed 36% CP. These data were demonstrated in both traditional and modern protein diets. Although the lowest dietary protein level examined in the current study (28%) would be below the minimum requirement described by El Sayed and Teshima (1991) and the 32% adequate according to NRC (1993), both displayed inferior growth as compared to fish fed the 36% dietary protein. In contrast, Bahnasawy (2009) observed no difference in growth when tilapias (2.5 g initial weight) were fed either 30 or 35% dietary crude protein levels. However, a notable difference between our study and that of Bahnasawy (2009) was that Bahnasawy (2009) was fertilizing tanks to increase natural food within the system. Thus, in the absence of natural food, a higher level of dietary protein may be required as was shown by the fact that 32% CP was not sufficient to optimize growth and performance of juvenile tilapia in our clear-water recirculating system. Data from the small fish study also demonstrates that a minimum lipid level of >3% is required to maintain normal growth and suggest that while increasing protein and lipid levels in tilapia diet formulations can improve tilapia growth rates in high intensity systems, stress tolerance during live hauls may be reduced. Results from the mixed-sex studies did not recapitulated these results. The large fish all male tilapia study demonstrated a benefit of amino acid supplementation to improve growth rates of fish fed 32% CP. These results suggest a growth benefit of feeding juvenile tilapia of this size range dietary protein and lipid levels higher than those previously reported and from a variety of protein sources. These data also indicate that choice of diet during the later stages of grow-out are dependent on multiple factors such as single or mixed sex, intensity of culture system, and processing location. Additionally, the ability of producers to utilize lower protein levels with amino
2

acid supplementation to increase performance (pending validation on-farm) increases formulation flexibility and thereby can buffer the effects of fluctuating protein ingredient costs.
RECOMMENDED FOLLOW-UP ACTIVITIES:
Objective 2b (Vitamin Trial) The work group decided that based on the most potential for economic impact to the farmer and the lack of fish and tanks space availability for the vitamin study, that this objective should be postponed in order to complete the camelina trial and to repeat the large fish study using single-sex fish. However, it is recommended that as funding allows that one additional growth trial will be conducted as previously described in Objective 1c utilizing the diets described in Objective 2a and produced at BFTC with the feeding trial to be conducted at University of Arizona. At the conclusion of the growth trial additional fish sampling will be conducted to define vitamin status. Specifically, fish in all treatments will be dissected and examined for signs of vitamin deficiency.
Objective 3: Evaluate products identified with potential by laboratory testing in pilot-scale on-farm trials (Year 3)Objective 3b (ongoing) Complete on-farm trials at Desert Springs Tilapia in Hyder, Arizona. The PIs, Tark Rush of Desert Springs Tilapia and David Brock of Rangen feeds met in March 2012 at Desert Springs to discuss study design and diets. In summer of 2013, plans were finalized regarding tank and fish availability and finalization of the experimental design. Two experimental diets (28%CP with and without amino acid supplementation) and a commercial control (28%CP producer supplied) that will be fed to satiation once daily. One additional diet (Rangen extruded 400 40%CP 10%CL) was added to the design by the producer and will be fed the same amount on a cost basis. Fish were stocked into experimental raceways on July 1, 2013 to acclimate to raceways and grow to initial target size starting weight of 150 gm. Experimental diets were produced by Rangen Feed in mid August and the study started on August 26, 2013. Initial sampling included a sample count of sixty fish per raceway, body condition indicies (HSI, VSI, and FR) on five fish per raceway and proximate compostion sampling from five fish per raceway. Monthly sample counts will continue until harvest. At harvest, all fish will be sized and graded, and body condition indicies and proximate samples will be obtained.
Objective 4: Outreach (ongoing)Work to address the extension and outreach portion of the grant (objective 4) will also continue. Specifically, the project webpage with preliminary results will be updated, the outreach publication developed, and a farm day on a tilapia farm in Idaho will be conducted. SUPPORT:
YEAR WRACUSDAFunding
OTHER SUPPORT TotalSupportUniversity Industry Other
FederalOther Total
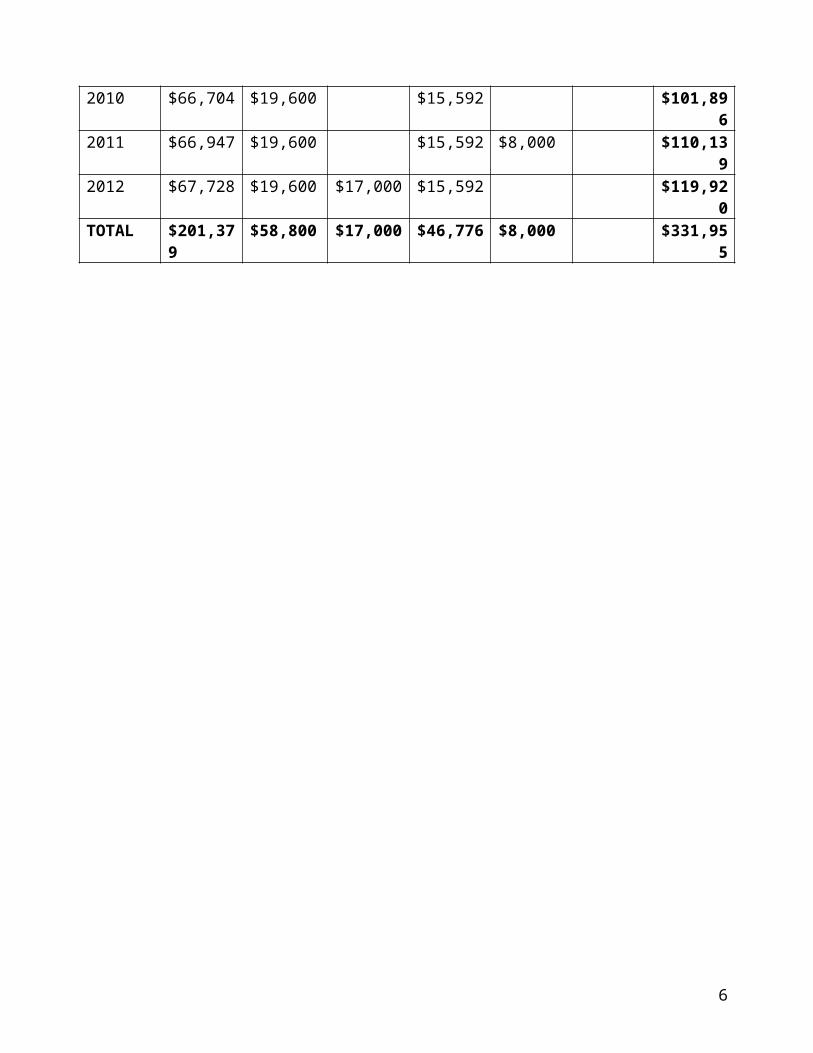
2010 $66,704 $19,600 $15,592 $101,8962011 $66,947 $19,600 $15,592 $8,000 $110,1392012 $67,728 $19,600 $17,000 $15,592 $119,920TOTAL $201,379 $58,800 $17,000 $46,776 $8,000 $331,955
3

PUBLICATIONS, MANUSCRIPTS, OR PAPERS PRESENTED:2011PresentationsC. G. Hooley, F. T. Barrows, J. A. Paterson, and W. M. Sealey. 2011. (Poster presentation)
Optimizing dietary protein and lipid levels of tilapia (Oreochromis niloticus) cultured in high intensity systems. Montana Nutrition Conference, Bozeman, MT. (Won 3rd place poster).
C. G. Hooley, F. T. Barrows, J. A. Paterson, and W. M. Sealey. 2011. (Oral presentation) Examination of the effects of dietary protein and lipid levels on growth and stress tolerance of tilapia Oreochromis niloticus. Fish Feeds and Nutrition Workshop, Pine Bluff, AR
2012PresentationsC. G. Hooley, F. T. Barrows, J. A. Paterson, and W. M. Sealey. 2012. (Oral presentation)
Examination of the effects of dietary protein and lipid levels on growth and stress tolerance of tilapia Oreochromis niloticus. USAS 2012, Las Vegas, NV. (USAS Abstract award; Spotlight Award Competition)
P. Ramotar and K. Fitzsimmons. 2012. (Oral presentation) Examination of the effects of dietary protein and lipid levels in and effects of alternative ingredients practical diets for tilapia Oreochromis niloticus. USAS 2012, Las Vegas, NV
P. Ramotar and K. Fitzsimmons. 2012. (Poster presentation) Examination of the effects of dietary protein and lipid levels in and effects of alternative ingredients practical diets for tilapia Oreochromis niloticus. Soil, Water and Environmental Science Earth Day, University of Arizona, Tucson, AZ
P. Ramotar and K. Fitzsimmons. 2012. (Poster presentation) Examination of the effects of dietary protein and lipid levels in and effects of alternative ingredients practical diets for tilapia Oreochromis niloticus. World Aquaculture Society Meeting, Prague, Czech Republic.
2013PresentationsP. Ramotar and K. Fitzsimmons. 2013. Camelina as a replacement for Soymeal in Tilapia
(Oreochromis niloticus) diets. ATA, 2013, Nashville,TN. P. Ramotar and K. Fitzsimmons. 2012. (Poster presentation) Camelina as a replacement for
Soymeal in Tilapia (Oreochromis niloticus) diets. Soil, Water and Environmental Science Earth Day, University of Arizona, Tucson, AZ.
PublicationsHooley, C.G. 2012. Examination of the effects of dietary protein and lipid on growth and stress
response of Nile tilapia cultured in high intensity systems. Master’s Thesis. Montana State University, Bozeman, MT.
P. Ramotar, B.P. 2012. Examination of the effects of dietary protein and lipid levels in and effects of alternative ingredients practical diets for tilapia Oreochromis niloticus. Master’s Thesis. University of Arizona, Tucson, AZ.
Hooley, C.G., F.T. Barrows, J. Patterson, and W.M. Sealey. (In Press). Examination of the effects of dietary protein and lipid levels on growth and stress tolerance of Juvenile Tilapia (Oreochromis niloticus). Journal of the World Aquaculture Society.
4

SUBMITTED BY:________________________________________________________________9/23/2013_______________
Title: (Wendy M. Sealey, Work Group Chair) Date
9/25/2013
APPROVED: __________________________________________________________________Project Monitor (Chhorn Lim) Date
5
PART II: DETAIL
PROJECT TITLE: Optimizing Dietary Protein and Lipid Utilization to Improve Production Efficiency of Tilapia in the Western United States
REPORT GIVEN IN YEAR: 2013
REPORTING PERIOD: 05/01/2010-09/19/2013
AUTHOR: Wendy M. Sealey
PARTICIPANTS: *Principal Investigator: Wendy M. SealeyInstitution: USFWS, Bozeman Fish Technology Center4050 Bridger Canyon RoadBozeman, MT 59715406/994-9908
Principal Investigator (Unfunded): Frederic T. BarrowsInstitution: USDA, ARS Trout Grains Project3509F National Fish Hatchery RoadHagerman, ID 83332208/837-9096
*Principal Investigator: Kevin M. FitzsimmonsInstitution: University of Arizona2601 E. Airport DriveTucson, AZ 85706520-626-3322
*Principal Investigator Responsible for Outreach: Gary FornshellInstitution: University of Idaho Extension246 Third Ave. E. Twin Falls, ID 83301 208/734-9590
Industry Collaborator: Tark RushDesert Springs Tilapia50621 Aguacaliente RoadDateland, AZ 85333
Project Monitor: Chhorn E. LimInstitution: USDA ARS Aquatic Animal Health Research Unit990 Wire Rd Auburn, Al, 36832334/887-3741 ext. 21
6

PROJECT OBJECTIVES: (1) Identify the optimum dietary protein and lipid ratio(s) in practical diets for two different size classes of tilapia. (2) Evaluate the ability of vitamin supplementation to improve growth performance at different protein:energy ratios. (3) Further evaluate formulations identified with potential by laboratory testing in a pilot-scale on-farm trial.(4) Develop an integrated outreach program including at least one WRAC Extension publication to meet stakeholders’ educational needs.
TECHNICAL SUMMARY AND ANALYSIS:Objective 1a progress: (completed) As proposed, in collaboration with the industry, common stocks and appropriate lines of tilapia for use in studies both in Arizona and Montana were identified. The move of Wendy Sealey to Montana necessitated pursuing permitting approval for tilapia from the State of Montana prior to their importation. Exotic Species Permit (for utilization in research) approval was granted to Wendy Sealey and the Bozeman Fish Technology Center on April 7, 2010. Fish arrived in Bozeman in June of 2010.
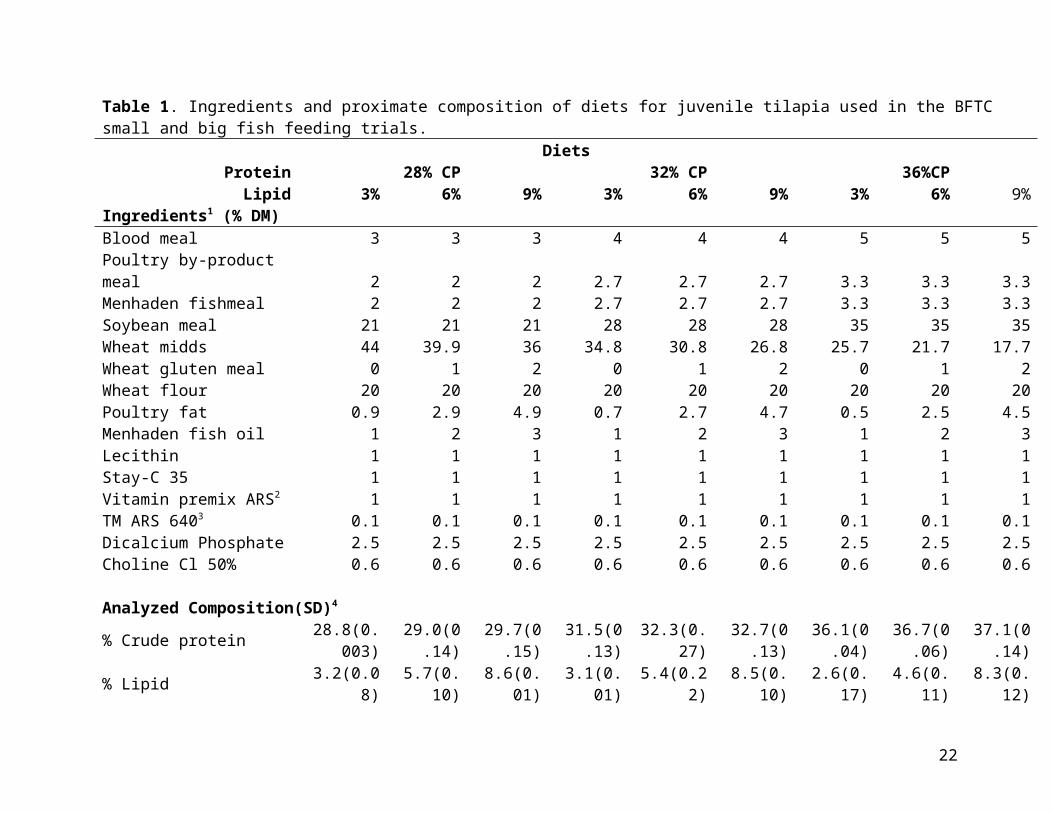
Objective 1b progress: (completed) Experimental diets were formulated as described. (Table 1: Bozeman Objective 1c small and big fish diets; Table 2: University of Arizona Objective 1c small fish diets; Table 3: University of Arizona Objective 1c camelina diets; Table 4: BFTC 1c second large fish trial diets. Diet manufacturing for both Bozeman Objective 1c studies and the University of Arizona small fish trial Objective 1c is complete. Diets were manufactured at the Bozeman Fish Technology Center (BFTC) using cooking extrusion (DNDL-44, Buhler AG, Uzwil, Switzerland) or cold pelleting and dried in a pulse bed drier (Buhler AG, Uzwil, Switzerland).
Objective 1c: (completed) Researchers at both BFTC and University of Arizona tested diets produced in objective 1b in late year 1 and year 2 for their ability to promote growth in two different size classes of tilapia. Specifically, one size class evaluated the ability of the diets to meet the needs of small tilapia when first transitioned from starter feed to a grow-out diet while the other size class will represent the last portion of the grow-out cycle (75 g to 500 g).
Objective 1c: BFTC progress, small fish study (completed) A 12-week feeding trial with juvenile tilapia was conducted as a 3 x 3 factorial with three crude protein (CP) levels (28, 32 and 36%) and three crude lipid (CL) levels (3, 6 and 9% (Table 1). At the conclusion of the feeding trial, tilapia were exposed to a simulated hauling experiment and the effects of dietary protein and lipid level on survival, blood chemistry and stress tolerance were assessed. All treatments had triplicate replications except for 3% CL levels which were run in duplicate due to tank space limitations. Duplicates were applied to the 3% CL because the existing literature suggested that this level was below optimum but had not previously been examined simultaneously with increasing protein levels. Fish were cultured in twenty-four, 75-L fiberglass tanks with an initial water depth of 0.25 meters. Lighting was maintained on a 13:11 diurnal fluctuation and water quality characteristics (dissolved oxygen, temperature, pH, ammonia-N, and nitrate-N) were maintained within acceptable ranges for tilapia.
Simulated hauling trials were performed by approximating conditions used by live-haulers in the Western United States (Cole et al. 2011). Briefly, tilapia were dry-netted from their respective culture tanks and placed in an insulated container at constant density of 0.52 lbs/L into 22 C spring water supplemented with 3 ppm salt. Compressed oxygen was supplemented to each container via
7

an airstone and was kept above saturation for the entirety 24-h period. Following the 24-h haul, fish were returned to their respective culture tanks and survival was monitored for an additional 48 h. Water quality parameters (pH, DO, un-ionized ammonia, nitrite-N, and temperature) were determined at the beginning and end of each simulated haul. At time 0 (prior to the haul), 24, and 48 h post-haul, two fish were quickly netted from each culture tank and bled via caudal puncture. Hematocrit was determined in duplicate on whole blood using a Critospin microhematocrit centrifuge and reader (Norwood, MA). Glucose and lactate levels were determined using a Vitros DT60 II (Johnson and Johnson, Rochestor, New York). Cortisol was analyzed by radio-immuno assay protocol at BFTC. Data was subjected to factorial analysis of variance using SAS version 9.1 (SAS Institute Inc., Cary, NC, USA) to determine the effect of dietary protein and lipid and their potential interactions on fish growth, performance and body composition and blood chemistry. Differences were considered significant at (P<0.05).
Analyzed dietary composition reflected formulation targets (Table 1). Tilapia weight gain, feed conversion and feed intake were significantly (P<0.05) affected by diet (Table 5). Fish fed 36% CP had greater gains and lower FCRs than fish fed 28 or 32%CP. Fish fed 3% CL had significantly higher FCRs than fish fed 6 or 9% CL. Feed intake was significantly decreased in fish fed 6 and 9% CL. Visceral somatic index, hepatosomatic index and fillet yield of tilapia were altered by dietary protein but not lipid (Table 6). Muscle ratio of fish fed 36%CP was significantly higher and VSI significantly lower than fish fed 32 or 28% CP. Hepatosomatic index was significantly increased in fish fed 28% CP compared to fish fed 32 or 36% CP. Whole body proximate composition and nutrient retention efficiency was also significantly altered by diet in juvenile tilapia (Table 6). Energy retention efficiency (ERE) was significantly different between 28%CP and 32%CP but there was no difference between 28% and 36%CP. At 28 % CP, protein retention efficiency (PRE) was significantly different than 32CP% and 36%CP. Water quality in the hauling container at 24 h post-haul was not significantly altered by diet (Table 7). Temp, DO, nitrite-N and unionized ammonia ranged from 20.9oC - 22.5oC, 26.0-11.1 mg/L, 0.01-0.04 ppm and 0.1-1.0 ppm, respectively at 24 h post-haul. Blood chemistry values were also altered by dietary protein and lipid levels (Figures 1 -3).
In the juvenile tilapia study, substantial dietary effects on growth of juvenile tilapia were observed and hauling stress was only minimally dietary responsive. These results suggest that feeding juvenile tilapia higher protein and lipid levels will produce better growth and performance. Cost effectiveness on a $/lb diet was calculated via a commercial feed company and $/lb of gain was measured at the conclusion of the study (Table 8). Therefore, when comparing the cost effectiveness of the observed growth rate in juvenile tilapia, the 36% CP and 6% CL diet is recommended.
Objective 1c: BFTC progress, Large fish study (completed)
A 3 X 3 factorial design was used with practical-type diets (Table 1) formulated to contain three levels of dietary protein (28, 32 and 36%) and three levels of dietary lipid (3, 6 and 9%). Mixed-sex tilapia (130± 4 g initial weight) were fed one of the nine diets, two feedings/d to apparent satiation, six d/wk for 18 wks. Fish were weighed and counted every three weeks and feed consumed recorded weekly. At 18 wks post-feeding, fish were sampled and exposed to the live-haul stress regime described above.
Tilapia weight gain, feed conversion and feed intake were not significantly (P<0.05) affected by diet (Table 9). There were no significant interactions between CP and CL observed for weight gain, FCR or feed intake. Visceral somatic index and hepatosomatic index of mature tilapia were not significantly altered by dietary protein or lipid levels (Table 10). In contrast, muscle ratio
8
was significantly affected by diet. Muscle ratio was significantly lower in fish fed 3% CL than fish fed 6 or 9% CL. No significant interactions between CP and CL were observed for VSI, HSI or FR.
Whole body proximate composition and nutrient retention efficiency were not significantly altered by diet in mature tilapia (Table 11). Moisture levels ranged from 68.5-71.8 %, lipid ranged from a 7.3 to 9.3%, protein ranged from 16.5 to 17.4 % and gross energy ranged from 1645-1854 kcal/g. PRE ranged from 21.0-25.5 and ERE ranged from 15.5- 20.6 in mature tilapia fed the various protein and lipid levels. Water quality in the hauling container at 24 h post-haul was not significantly altered by diet. Temperature, DO, nitrite and unionized ammonia ranged from 20.9 C - 22.5 C, 26.0-11.1 mg/L, 0.01-0.04 ppm and 0.1-1.0 ppm, respectively at 24 h post-haul (Data not shown).
Blood chemistry parameters of mature tilapia subjected to a simulated live-haul were significantly altered by diet (Table 12). Lactate levels of mature tilapia were significantly altered by dietary lipid level at time 24 h and time 72 h. At time 24 h, fish fed 3% CL had significantly lower lactate levels than fish fed 6 and 9% CL. At time 72 h, fish fed 9% CL had significantly higher lactate levels than fish fed 3 and 6% CL. There were also significant interactions at time 24 and 72 h. At time 24 h, a significant interaction was observed where fish fed diets containing 28% CP and 6% CL had significantly higher lactate levels than fish fed the 32% CP and 6% CL and the 36% CP and 6% CL diet. At time 72 h, a significant interaction was observed in that fish fed 32% CP and 6% CL had significantly lower lactate levels than fish fed 28% CP and 6% CL and fish fed 36% CP and 6% CL. In contrast, glucose levels of mature fish in the simulated haul were not significantly altered by dietary protein or lipid level (Table 12).
In the mature fish study, no significant effects of diet on growth were observed. For the mature fish study we found the most cost effective diet to be at 28% CP and 6% CL (Table 13) for this reason it is tempting to suggest that there is no need to increase protein above 28% CP and 6% CL in mature tilapia mixed-sex culture. However, because the mixed-sex culture system did result in fry production during the study it was determined that an additional large fish study at BFTC should be conducted using a single-sex population prior to making a recommendation.
Additional large fish single-sex study (completed) A 2 X 2 X 2 factorial design was used with practical-type diets (Table 4) formulated to
contain two levels of dietary protein (32 and 36%) and two levels of dietary lipid (6 and 9%) and with and without supplemental methionine and lysine). Male tilapia (75± 2 g initial weight) were stocked and fed one of the eight diets, two feedings/d to apparent satiation, six d/wk for nine wks. Fish were weighed and counted every three weeks and feed consumed was recorded weekly. At nine wks post-feeding, fish were sampled and exposed to the live-haul stress regime described above.
Growth results from the single sex study demonstrated a significant interaction (P=0.0432) between protein and amino acid supplementation in that fish fed 32%CP with amino acid supplementation were significantly larger than those without supplementation and similar in size to those fed 36%CP. Proximate composition and hauling trial data are still being compiled but statistical analysis recapitulates results of the mixed-sex trial.
Objective 1c: University of Arizona progress, small fish study (completed) Precise increases in the protein and lipid levels of tilapia diets can simultaneously reduce
feed costs and the amount of underutilized protein, excreted as ammonia and lipids stored as fat in tilapia. As a result, improved diet formulations can improve profitability and reduce environmental damages. This study investigated the potential of several protein sources and various lipid levels in several diets of juvenile Nile tilapia. Novel sources of plant protein including new Soya, peanut and
9

two types of algae: Chlorella and Earthrise brand Spirulina were examined. Diets were grouped as “standard commercial formulation” (with fishmeal) and “alternative” (without fish meal and partial replacement of fishmeal). Thirty six experimental tanks were stocked with twenty-five fish each (initial average biomass of 133g ± 2g) linked in a freshwater recirculation system within a greenhouse. Ambient sunlight provided illumination. Treatments were randomly assigned, with three reps per treatment and fishes were fed one of 12 diets (32%, 36% and 37% Crude Protein (CP), differing in Crude Lipid (CL) content (6%, 9% and 10% on dry weight basis). At the end of the 78 day feeding period, the average final weight per tank was 535g ± 88 g. Weight gain, standard growth rate, as well as energy and protein efficiency were determined. There were significant differences (P < 0.05), between the control diet 10 (37% CP:10% CL) and diet 12 (36% CP: 9% CL) (Fig. 4). Diet 12 which contained partial fishmeal, peanut and Chlorella had the lowest growth rate of the 12 diets, whereas diet 10 had the highest growth rate. The highest FCR was diet 9 with 36% CP: 9% CL but there was no significant differences (>0.05) when compared to the other 11 diets. The control diet, 10 was commercially manufactured by Star Milling of Perris, California. Originally, diet 10 was a peanut diet but this diet was spoilt and was replaced by the Star Milling diet. The comparisons among means for mortality, crude protein and lipid levels on growth or relative weight gained and “standard commercial” and “alternative” diet were non-significant (P>0.05). The comparisons among means for mortality, crude protein and lipid levels on growth or relative weight gained and “standard commercial” and “alternative” diet were non-significant (P>0.05) figure 5 and 6, respectively. Regarding, the body composition, there was no significant differences (P>0.5) but at the body level there was significant differences. Above 6% lipid does not increase the growth rate but causes an increase level of fat in the fish. Substituting the alternative ingredients used in this experiment may reduce the increase demand for fish meal and the cost of tilapia feed, hence decreasing the operating cost in intensive culture (Fig. 6).
Camelina study (completed) this study was an additional study that was related to our general topic but completed by the team with in kind support from Camelina researchers in Montana.
Juvenile tilapias were stocked into thirty six experimental tanks with five fish each (initial average biomass of 201 ± 4g) linked in a freshwater recirculation system within a greenhouse. The tanks are on a common recirculating system and each receives the same water supply inside a temperature controlled greenhouse. Treatments were randomly assigned, with three reps per treatment and fishes were fed one of 8 experimental test diets (Table 3). Five (5) fish were group-weighed and randomly stocked into each of the replicate tanks (5 fish per replicate and 3 reps per diet). Feeding rate was 3% of biomass per day and was split into two feedings per day. Intermediate weights (5 fish per tank) were determined every 14 days and the feeding rate and amount are adjusted for each treatment as appropriate. Water quality characteristics (DO, temperature, pH, ammonia-N, and nitrate-N, was determined and recorded on a regular basis. Each diet was fed to the triplicate groups of tilapia for 8 weeks. Analysis is presently ongoing on these samples. Initial data collected is shown in table 15.
Objective 2a (BFTC and USDA, ARS, Year 2-3; completed) A vitamin premix that meets the minimum published requirements for tilapia (NRC 2010). A second vitamin premix shown to improve performance of tilapia in high intensity systems has been formulated in collaboration with our technical advisor, Dr. Chhorn Lim (Table 13) will also be evaluated as compared to a vitamin deficient diet in small fish fed the best performing diets from year one and two studies (36:6 and 32:6 with supplemental methionine) in a 3 X 2 design.
10

Objective 2b (Vitamin Trial-pending) The work group decided that based on the most potential for economic impact to the farmer and the lack of fish and tanks space availability for the vitamin study, that this objective should be postponed in order to complete the camelina trial and to repeat the large fish study using single-sex fish. However, it is recommended that as funding allows that one additional growth trial will be conducted as previously described in Objective 1c utilizing the diets described in Objective 2a and produced at BFTC with the feeding trial to be conducted at University of Arizona. At the conclusion of the growth trial additional fish sampling will be conducted to define vitamin status. Specifically, fish in all treatments will be dissected and examined for signs of vitamin deficiency.
Objective 3: Evaluate products identified with potential by laboratory testing in pilot-scale on-farm trials (Year 3)Objective 3b (ongoing) Complete on-farm trials at Desert Springs Tilapia in Hyder, Arizona. The PIs, Tark Rush of Desert Springs Tilapia and David Brock of Rangen feeds met in March 2012 at Desert Springs to discuss study design and diets. In summer of 2013, plans were finalized regarding tank and fish availability and finalization of the experimental design. Two experimental diets (28%CP with and without amino acid supplementation) and a commercial control (28%CP producer supplied) that will be fed to satiation once daily. One additional diet (Rangen extruded 400 40%CP 10%CL) was added to the design by the producer and will be fed the same amount on a cost basis. Fish were stocked into experimental raceways on July 1, 2013 to acclimate to raceways and grow to initial target size starting weight of 150 gm. Experimental diets were produced by Rangen Feed in mid August and the study started on August 26, 2013. Initial sampling included a sample count of sixty fish per raceway, body condition indicies (HSI, VSI, and FR) on five fish per raceway and proximate compostion sampling from five fish per raceway. Monthly sample counts will continue until harvest. At harvest, all fish will be sized and graded, and body condition indicies and proximate samples will be obtained.
Objective 4: Outreach (ongoing)Work to address the extension and outreach portion of the grant (objective 4) will also continue. Specifically, the project webpage with preliminary results will be updated, the outreach publication developed, and a farm day on a tilapia farm in Idaho will be conducted.
IMPACTS: Our preliminary results demonstrate that the greatest weight gain for juvenile tilapia was observed for tilapia fed 36% CP. These data were demonstrated in both traditional and modern protein diets. Although the lowest dietary protein level examined in the current study (28%) would be below the minimum requirement described by El Sayed and Teshima (1991) and the 32% adequate according to NRC (1993), both displayed inferior growth as compared to fish fed the 36% dietary protein. In contrast, Bahnasawy (2009) observed no difference in growth when tilapias (2.5 g initial weight) were fed either 30 or 35% dietary crude protein levels. However, a notable difference between our study and that of Bahnasawy (2009) was that Bahnasawy (2009) was fertilizing tanks to increase natural food within the system. Thus, in the absence of natural food, a higher level of dietary protein may be required as was shown by the fact that 32% CP was not sufficient to optimize growth and performance of juvenile tilapia in our clear-water recirculating system. Data from the small fish study also demonstrates that a minimum lipid level of >3% is required to maintain normal growth and suggest that while increasing protein and lipid levels in tilapia diet formulations can improve tilapia growth rates in high intensity systems, stress tolerance during live hauls may be
11

reduced. Results from the mixed-sex studies did not recapitulated these results. The large fish all male tilapia study demonstrated a benefit of amino acid supplementation to improve growth rates of fish fed 32% CP. These results suggest a growth benefit of feeding juvenile tilapia of this size range dietary protein and lipid levels higher than those previously reported and from a variety of protein sources. These data also indicate that choice of diet during the later stages of grow-out are dependent on multiple factors such as single or mixed sex, intensity of culture system, and processing location. Additionally, the ability of producers to utilize lower protein levels with amino acid supplementation to increase performance (pending validation on-farm) increases formulation flexibility and thereby can buffer the effects of fluctuating protein ingredient costs.
PUBLICATIONS, MANUSCRIPTS, OR PAPERS PRESENTED:2011PresentationsC. G. Hooley, F. T. Barrows, J. A. Paterson, and W. M. Sealey. 2011. (Poster presentation)
Optimizing dietary protein and lipid levels of tilapia (Oreochromis niloticus) cultured in high intensity systems. Montana Nutrition Conference, Bozeman, MT. (Won 3rd place poster).
C. G. Hooley, F. T. Barrows, J. A. Paterson, and W. M. Sealey. 2011. (Oral presentation) Examination of the effects of dietary protein and lipid levels on growth and stress tolerance of tilapia Oreochromis niloticus. Fish Feeds and Nutrition Workshop, Pine Bluff, AR
2012PresentationsC. G. Hooley, F. T. Barrows, J. A. Paterson, and W. M. Sealey. 2012. (Oral presentation)
Examination of the effects of dietary protein and lipid levels on growth and stress tolerance of tilapia Oreochromis niloticus. USAS 2012, Las Vegas, NV. (USAS Abstract award; Spotlight Award Competition)
P. Ramotar and K. Fitzsimmons. 2012. (Oral presentation) Examination of the effects of dietary protein and lipid levels in and effects of alternative ingredients practical diets for tilapia Oreochromis niloticus. USAS 2012, Las Vegas, NV
P. Ramotar and K. Fitzsimmons. 2012. (Poster presentation) Examination of the effects of dietary protein and lipid levels in and effects of alternative ingredients practical diets for tilapia Oreochromis niloticus. Soil, Water and Environmental Science Earth Day, University of Arizona, Tucson, AZ
P. Ramotar and K. Fitzsimmons. 2012. (Poster presentation) Examination of the effects of dietary protein and lipid levels in and effects of alternative ingredients practical diets for tilapia Oreochromis niloticus. World Aquaculture Society Meeting, Prague, Czech Republic.
12

2013PresentationsP. Ramotar and K. Fitzsimmons. 2013. Camelina as a replacement for Soymeal in Tilapia
(Oreochromis niloticus) diets. ATA, 2013, Nashville,TN. P. Ramotar and K. Fitzsimmons. 2012. (Poster presentation) Camelina as a replacement for
Soymeal in Tilapia (Oreochromis niloticus) diets. Soil, Water and Environmental Science Earth Day, University of Arizona, Tucson, AZ.
PublicationsHooley, C.G. 2012. Examination of the effects of dietary protein and lipid on growth and stress
response of Nile tilapia cultured in high intensity systems. Master’s Thesis. Montana State University, Bozeman, MT.
P. Ramotar, B.P. 2012. Examination of the effects of dietary protein and lipid levels in and effects of alternative ingredients practical diets for tilapia Oreochromis niloticus. Master’s Thesis. University of Arizona, Tucson, AZ.
Hooley, C.G., F.T. Barrows, J. Patterson, and W.M. Sealey. (In Press). Examination of the effects of dietary protein and lipid levels on growth and stress tolerance of Juvenile Tilapia (Oreochromis niloticus). Journal of the World Aquaculture Society.
SUBMITTED BY:_____________________________________________________________________09/23/2013_________
Title: (Wendy M. Sealey, Work Group Chair) Date
APPROVED: ____________________________________________________________________
Project Monitor (Chhorn Lim) Date
13

Table 1. Ingredients and proximate composition of diets for juvenile tilapia used in the BFTC small and big fish feeding trials.Diets
Protein 28% CP 32% CP 36%CPLipid 3% 6% 9% 3% 6% 9% 3% 6% 9%
Ingredients1 (% DM)Blood meal 3 3 3 4 4 4 5 5 5Poultry by-product meal 2 2 2 2.7 2.7 2.7 3.3 3.3 3.3Menhaden fishmeal 2 2 2 2.7 2.7 2.7 3.3 3.3 3.3Soybean meal 21 21 21 28 28 28 35 35 35Wheat midds 44 39.9 36 34.8 30.8 26.8 25.7 21.7 17.7Wheat gluten meal 0 1 2 0 1 2 0 1 2Wheat flour 20 20 20 20 20 20 20 20 20Poultry fat 0.9 2.9 4.9 0.7 2.7 4.7 0.5 2.5 4.5Menhaden fish oil 1 2 3 1 2 3 1 2 3Lecithin 1 1 1 1 1 1 1 1 1Stay-C 35 1 1 1 1 1 1 1 1 1Vitamin premix ARS2 1 1 1 1 1 1 1 1 1TM ARS 6403 0.1 0.1 0.1 0.1 0.1 0.1 0.1 0.1 0.1Dicalcium Phosphate 2.5 2.5 2.5 2.5 2.5 2.5 2.5 2.5 2.5Choline Cl 50% 0.6 0.6 0.6 0.6 0.6 0.6 0.6 0.6 0.6
Analyzed Composition(SD)4
% Crude protein28.8(0.003) 29.0(0.14)
29.7(0.15) 31.5(0.13) 32.3(0.27)
32.7(0.13) 36.1(0.04)
36.7(0.06) 37.1(0.14)
% Lipid 3.2(0.08) 5.7(0.10) 8.6(0.01) 3.1(0.01) 5.4(0.22) 8.5(0.10) 2.6(0.17) 4.6(0.11) 8.3(0.12)
Gross energy kcal/kg4392(0.05) 4603(33) 4860(70) 4340(19) 4607(0.47) 4862(9) 4472(88) 4578(21) 4842(31)
14

% Moisture4.4(0.08) 3.1(0.10) 3.4(0.01) 1.8(0.01) 3.3(0.22) 2.2(0.10) 3.1(0.17) 3.3(0.08) 1.6(0.17)
1Origin of ingredients: Nelson & Sons, Murray, UT, USA. 2Contributed per kilogram of diet: vitamin A (as retinol palmitate), 10,000 IU; vitamin D3, 720 IU; vitamin E (as DL--tocopheryl-acetate), 530 IU; niacin, 330 mg; calcium pantothenate, 160 mg; riboflavin, 80 mg; thiamin mononitrate, 50 mg; pyridoxine hydrochloride, 45 mg; menadione sodium bisulfate, 25 mg; folacin, 13 mg; biotin, 1 mg; vitamin B12, 30 ug. 3Contributed in mg/kg of diet: zinc, 37; manganese, 10; iodine, 5; copper, 3. 4Means of two replicate samples per diet on an as-fed basis with the standard deviation.
Table 2. University of Arizona small fish protein X lipid study.
Traditional Protein Diet SeriesModern Protein Diet Series
Crude Protein 32 32 36 36 32 32 36 36Crude Lipid 6 9 6 9 6 9 6 9
Menhaden Fish Meal 2.7 2.7 3.3 3.3 Chicken 42 - ADF 4.8 4.8 6 6
Soybean meal 28 28 35 35EARTHRISE SPIRULINA 5.1 5.1 6.4 6.4
Blood meal US 4 4 5 5 Soybean meal 3010 ULO 28 28 35 35Poultry by-product, pet food 2.7 2.7 3.3 3.3 0 0 0 0Wheat gluten meal 1 2 1 2 Wheat gluten meal 1 2 1 2Poultry fat 2.7 4.7 2.5 4.5 Poultry fat 2.4 4.4 2.2 4.2Wheat midds 30.8 26.8 21.7 17.7 Wheat midds 30.5 26.5 21.3 17.3Wheat flour 20 20 20 20 Wheat flour 20 20 20 20Menhaden fish oil 2 3 2 3 Menhaden fish oil 2 3 2 3Lecithin 1.0 1.0 1.0 1.0 Lecithin 1 1 1 1Stay-C 35 1.0 1.0 1.0 1.0 Stay-C 35 1 1 1 1Vitamin premix ARS 1.0 1.0 1.0 1.0 Vitamin premix ARS 1 1 1 1TM ARS 640 0.1 0.1 0.1 0.1 TM ARS 640 0.1 0.1 0.1 0.1Dicalcium Phosphate 2.5 2.5 2.5 2.5 Dicalcium Phosphate 2.5 2.5 2.5 2.5Choline Cl 50% 0.6 0.6 0.6 0.6 Choline Cl 50% 0.6 0.6 0.6 0.6
15

Table 3. University of Arizona camelina study diets.Camelina Meal Inclusion (%) Camelina Oil Inclusion (%)
0 5 10 15 20 25 Raw WashedSoybean meal 42 38 34 30 26 22 42 42Camelina, Press cake 0 5 10 15 20 25 0 0Wheat flour 28.5 28.2 27.9 27.6 27.3 27.0 28.5 28.5Poultry fat 4.7 4 3.3 2.6 1.9 1.2 0 0Camelina oil 0 0 0 0 0 0 4.7 4.7
Corn Protein Concentrate 12.2 12.2 12.2 12.2 12.2 12.2 12.2 12.2Menhaden Fish Meal 5 5 5 5 5 5 5 5Menhaden fish oil 3 3 3 3 3 3 3 3Stay-C 35 0.2 1.0 1.0 1.0 1.0 1.0 1.0 1.0Vitamin premix ARS 1.0 1.0 1.0 1.0 1.0 1.0 1.0 1.0TM ARS 640 0.1 0.1 0.1 0.1 0.1 0.1 0.1 0.1Dicalcium Phosphate 2.5 2.5 2.5 2.5 2.5 2.5 2.5 2.5Choline Cl 50% 0.6 0.6 0.6 0.6 0.6 0.6 0.6 0.6Methionine 0 0.2 0.2 0.2 0.2 0.2 0.2 0.2
16

Table 4. Diet formulations for the second large (single-sex) tilapia trial at BFTC.
Ingredient (%) 32CP 6L32CP 6L w/M&L
32CP 9L
32CP 9L w/M&L 36CP 6L
36CP 6L w/M&L 36CP 9L
36CP 9L w/M&L
Menhaden Fish Meal - SPECIAL SELECT 2.67 2.67 2.67 2.67 3.33 3.33 3.33 3.33Soybean meal 28.00 28.00 28.00 28.00 35.00 35.00 35.00 35.00Blood meal US 4.00 4.00 4.00 4.00 5.00 5.00 5.00 5.00Poultry by-product, pet food 2.67 2.67 2.67 2.67 3.33 3.33 3.33 3.33Wheat gluten meal 1.00 1.00 2.00 2.00 1.00 1.00 2.00 2.00Poultry fat 2.65 2.65 4.65 4.65 2.45 2.45 4.45 4.45Wheat midds 30.82 30.82 26.82 26.82 21.68 21.68 17.68 17.68Wheat flour 20.00 19.52 20.00 19.52 20.00 19.90 20.00 19.90Menhaden fish oil (outside) 2.00 2.00 3.00 3.00 2.00 2.00 3.00 3.00Lecithin 1.00 1.00 1.00 1.00 1.00 1.00 1.00 1.00Stay-C 35 1.00 1.00 1.00 1.00 1.00 1.00 1.00 1.00Vitamin premix ARS1 1.00 1.00 1.00 1.00 1.00 1.00 1.00 1.00TM ARS 6402 0.10 0.10 0.10 0.10 0.10 0.10 0.10 0.10Dicalcium Phosphate 2.50 2.50 2.50 2.50 2.50 2.50 2.50 2.50Choline Cl 50% 0.60 0.60 0.60 0.60 0.60 0.60 0.60 0.60Methionine 0.00 0.16 0.00 0.16 0.00 0.1 0.00 0.10Lysine HCL 0.00 0.32 0.00 0.32 0.00 0.00 0.00 0.00
1Contributed per kilogram of diet: vitamin A (as retinol palmitate), 10,000 IU; vitamin D3, 720 IU; vitamin E (as DL--tocopheryl-acetate), 530 IU; niacin, 330 mg; calcium pantothenate, 160 mg; riboflavin, 80 mg; thiamin mononitrate, 50 mg; pyridoxine hydrochloride, 45 mg; menadione sodium bisulfate, 25 mg; folacin, 13 mg; biotin, 1 mg; vitamin B12, 30 ug. 2Contributed in mg/kg of diet: zinc, 37; manganese, 10; iodine, 5; copper, 3.
17

Table 5. Growth Performance of small tilapia fed 28, 32 or 36% crude protein and 3, 6 or 9%
crude lipid for 12 weeks at BFTC.
Growth Performance1 Body indices2
Weight gain3 FCR4 Feed
Intake5 Viscera FiletHepatosomatic
index0-12wk gain
(g feed/g gain) (%) Index Ratio
Diet
28% CP 3%CL 1627b,y 1.71a,x 3.13a,x 9.8b 35.6b 1.5a
28% CP 6%CL 2100b,y 1.46a,y 2.91a,y 9.9b 34.2b 1.8a
28% CP 9% CL 2177b,y 1.43a,y 2.91a,y 9.8b 35b 1.7a
32% CP 3%CL 2033b,xy 1.48 ab,x 2.95 b,x 9.7b 36.1 ab 1.3b
32%CP 6%CL 2151b,xy 1.41 ab,y 2.86 b,y 9.4b 36.8 ab 1.4b
32% CP 9%CL 1997b,xy 1.4 ab,y 2.74 b,y 9.7b 35.4 ab 1.5b
36% CP 3%CL 2176a,y 1.48b,x 2.99 ab,x 7.5a 38.4a 1.4b
36%CP 6%CL 2261a,y 1.35b,y 2.76 ab,y 8.6a 37.0a 1.4b
36% CP 9%CL 2479a,y 1.37b,y 2.89 ab,y 8.4a 37.4a 1.3b
Pooled SE 1.10 0.66 0.44 59.35 1.56 1.44ANOVA, Pr > F6 0.01 0.05 0.13 0.03 0.12 0.19Protein 0.02 0.03 0.01 0.07 0.01 0.07Lipid 0.04 0.03 0.92 0.02 0.87 0.54Protein*Lipid 0.52 0.62 0.8 0.19 0.56 0.291Means of three replicate tanks (30fish/tank). 2Means of nine fish per treatment; three replicate tanks per diet. Weight of viscera, fillet *2, and liver/body weight *100, respectively. 3(Final tank weight – initial tank weight. 4FCR = feed conversion ratio; (g feed fed (dry)/g gain (wet)). 5Feed intake= (total wet feed fed (g)*100)/(( Individual fish weight(g) + Initial individual fish weight(g))/2)/days on feed). 6Significance probability associated with the F-statistic Values within columns with a common superscript letter do not differ significantly at P< 0.05; lower case a,b,c when present superscripts refer to significant protein effects while lowercase x,y,z subscripts when present refer to significant lipid effects.
18

Table 6. Proximate composition and nutrient retention efficiency of small tilapia fed 28, 32 or 36% crude protein and 3, 6 or 9% crude lipid for 12 weeks at BFTC1.
Moisture Lipid Crude protein Gross energy PRE2 ERE3
Diet (%) (%) (%) kcal/kg (%) (%)
28% CP 3% CL 70.24 x 10.16a,x 16.48b 1767a,x 34.03a,A 25.35a
6% CL 69.40 x 8.65a,x 16.85b 1860a,x 37.87a,A 27.18a
9% CL 66.08 x 9.41a,x 16.74b 2067a,x 36.21a,A 30.68a
32% CP 3% CL 71.13 x 12.10a,x 17.19b 1701ab,x 37.51b 24.71b
6% CL 70.04 x 8.82a,x 16.60b 1740ab,x 36.31b 24.63b
9% CL 68.54 x 7.81a,x 16.85b 1909ab,x 38.52b 25.16b
36% CP 3% CL 69.61y 9.67b,y 17.64a 1809b,x 40.68b 27.48ab
6% CL 71.45y 9.98b,y 18.11a 1828b,x 39.01b 26.62ab
9% CL 69.46y 10.13b,y 18.16a 1805b,x 41.02b 25.72abb
Pooled SE 1.10 0.66 0.44 59 1.56 1.44
19
ANOVA, Pr > F4 0.01 0.05 0.13 0.03 0.12 0.19
Protein 0.02 0.03 0. 01 0.07 0.01 0.07Lipid 0.04 0.03 0.92 0.02 0.87 0.54
Protein*Lipid 0.52 0.62 0.80 0.19 0.56 0.29
1 eans of duplicate fish pools per tank; three replicate tanks per diet on an as-fed basis. 2Apparent protein retention efficiency (PRE) = protein gain in fish (g)/protein intake (g) x 100. 3Apparent energy retention efficiency (ERE) = energy gain in fish (g)/energy intake (g) x 100. 4Significance probability associated with the F-statistic. Values within columns with a common superscript letter do not differ significantly at P< 0.05; lower case superscripts refer to significant main effects; No significant interactions were observed.
20

Table 7. Effects of feeding 28, 32 or 36% CP and 3, 6 or 9% CP to small tilapia for 12 weeks on blood lactate1, glucose1 and hematocrit1during a simulated hauling trial at BFTC.
Time (hr) 0
Lactatemmol/L
24 48 0
Glucosemg/dL
24 48 0
Hematocrit(%)24 48
Diet
28% CP
0.9a,b 2.6a,y 0.7b 39.0b 59.0 43.0 31.0 29.8 25.73%CL
6%CL0.9a,b 2.6a,xy 0.6b 39.0b 83.0 41.5 31.2 29.0 25.6
9% CL0.8a,b 4.6a,x 0.7b 44.8b 67.8 45.8 29.9 30.7 28.0
32% CP
1.0a 4.9ab,y 2.0a 39.5a 78.5 51.0 33.9 34.3 30.93%CL
6%CL1.2a 5.4ab,xy 1.1a 30.2a 80.0 39.0 30.8 26.0 32.0
9%CL0.8a 5.5ab,x 1.3a 37.2a 87.7 40.7 29.6 26.0 30.3
36% CP
0.8b 4.9b,y 0.9a,b 40.0b 81.7 39.0 36.5 30.3 29.93%CL
6%CL0.6b 1.3b,xy 1.1a,b 45.0b 101.8 39.0 31.4 31.4 29.7
21
9%CL0.9b 8.5b,x 7.3a,b 45.3b 88.5 50.8 31.4 33.5 26.2
Pooled SE0.1 1.3 0.4 4.0 23.1 6.3 2.3 2.6 1.4
ANOVA, Pr > F2
0.07 0.09 0.39 0.02 0.91 0.44 0.74 0.42 0.06Protein 0.02 0.05 0.07 0.01 0.40 0.96 0.53 0.27 0.01Lipid 0.77 0.14 0.68 0.20 0.64 0.24 0.32 0.54 0.72
Protein*Lipid0.18 0.32 0.72 0.25 0.99 0.31 0.87 0.37 0.27
1 Means of duplicate fish per tank; three replicate tanks per diet except 3% lipid where n= 2 tanks/diet. 2Significance probability associated with the F-statistic. Values within columns with a common superscript letter do not differ significantly at P< 0.05; lower case superscripts refer to significant main effects; No significant interactions were observed.
22

Table 8. Effects of feeding 28, 32 or 36% CP and 3, 6 or 9% CP to small tilapia for 12 weeks on water quality at the end of a 24hr simulated hauling trial at BFTC.1
Nitrite(mg/L) pH Temperature
(ºC)DO
(mg/L)TAN
(mg/L)
Un-ionized Ammonia
(mg/L)Diet
28% CP
0.0 7.9a 20.9 23.5 17.4 0.53%CL
6%CL0.0 7.4b 22.4 16.0 14.8 0.2
9% CL0.0 7.3b 22.5 16.9 13.4 0.1
32% CP
0.17.3a 22.3 11.1 13.5 0.13%CL
6%CL0.0 7.4b 21.9 17.6 9.2 0.1
9%CL0.0 7.5b 22.2 17.6 15.2 0.1
36% CP
0.0 8.2a 21.7 26.0 10.2 1.03%CL
6%CL 0.07.5b 22.2 13.9 17.7 0.3
9%CL0.0 7.3b 22.4 17.3 11.9 0.1
Pooled SE 0.01 0.2 0.5 3.0 3.8 0.2
ANOVA, Pr > F2 0.24 0.12 0.72 0.21 0.91 0.20
Protein 0.08 0.47 0.98 0.62 0.71 0.40Lipid 0.59 0.05 0.34 0.31 0.97 0.11
Protein*Lipid 0.34 0.18 0.60 0.11 0.68 0.26
1 Means of duplicate assays per tank; three replicate tanks per diet except 3% lipid where n= 2 tanks/diet. 2Significance probabilities associated with the F-statistic. Values within columns with a common superscript letter do not differ significantly at P< 0.05; lower case superscripts refer to significant main effects; No significant interactions were observed.
23

Table 9. Cost evaluation of protein and lipid fraction of diets fed to juvenile tilapia for 12wks.
Diet Tank gain (0-12wk) Feed fed (g) Cost/lb of feed1 Cost/lb of gain2
28% CP 3%CL 1627 2780.2 0.35$ 0.60$
6%CL 2100 3055.9 0.37$ 0.54$
9% CL 2177 3110.3 0.40$ 0.57$
32% CP 3%CL 2033 3014.9 0.36$ 0.53$
6%CL 2151 3036.9 0.39$ 0.55$
9%CL 1997 2771.5 0.41$ 0.58$
36% CP 3%CL 2176 2505.6 0.38$ 0.56$
6%CL 2261 3043.6 0.40$ 0.54$
9%CL 2479 3389.2 0.43$ 0.59$
1Cost provided by a commercial feed manufacturing company.2Calculated as cost per pound of gain.
24

Figure 1. Lactate levels of juvenile tilapia at 0, 24 and 72 h post-hauling.
Lactate Levels
28%CP32%CP36%CP
MM
OL/
L
25
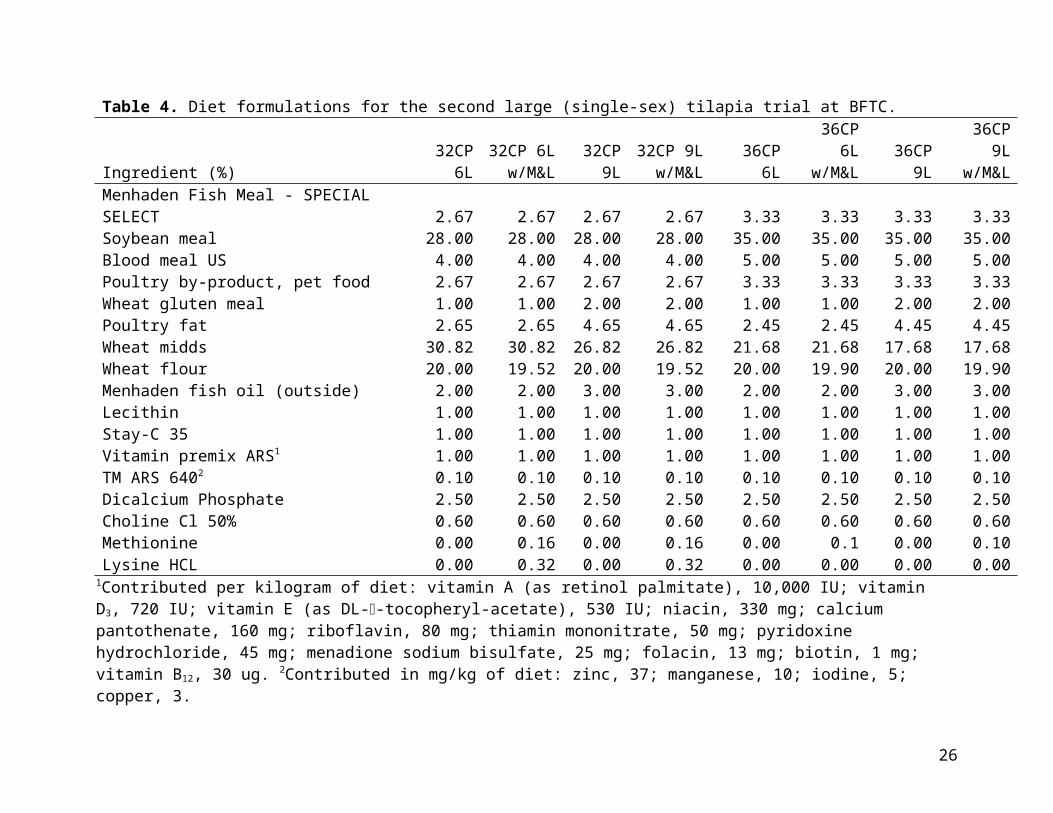
Figure 2. Glucose levels of juvenile tilapia at 0, 24 and 72 h post-hauling.
Glucose Levels
28%CP32%CP36%CP
MG/
DL
26

Figure 3. Cortisol levels of juvenile tilapia at 0, 24 and 72 h post-hauling.
Cortisol Levels
28%CP32%CP36%CP
ng/m
l
27

Table 10. Growth and performance of mature tilapia fed 28, 32 or 36% crude protein and 3, 6 or 9% crude lipid for 12 weeks.
Growth Performance1 Body indices2 Pellet Quality3
Weight gain4 FCR5 Feed
Intake6 VSI7 FR8 HSI9 PDI
Diet28% CP 3%CL 1644 2.10 3.07 8.0 29.8y 1.9 74.6(0.5)axy
6%CL 1815 1.88 3.03 8.1 38.6x 2.1 65.6(0.8)ay
9%CL 1528 2.16 2.94 9.2 35.6y 2.5 83.9(.0.6)bx
32% CP 3%CL 1314 2.39 2.83 7.5 29.3y 2.1 76.9(0.3)axy
6%CL 1924 1.96 3.23 7.1 37.1x 2.2 63.2(12)ay
9% CL 1828 1.98 3.17 8.5 35.7y 2.0 71.9(1.0)bx
36% CP 3%CL 1993 1.93 3.31 7.2 38.3y 1.8 58.5(1.2)axy
6%CL 2003 1.87 3.24 7.3 37.2x 2.0 66.5(0.6)ay
9% CL 1835 2.01 3.20 6.8 37.6y 1.9 66.4(0.8)bx
Pooled SE 0.005 8.30 0.74 1.1 0.50 4.59 0.54ANOVA, Pr > F10 0.30 0.25 0.42 0.70 0.08 0.54 <.0001Protein 0.21 0.41 0.16 0.24 0.22 0.35 <.0001Lipid 0.25 0.11 0.69 0.65 0.03 0.47 <.0001Protein*Lipid 0.42 0.38 0.44 0.83 0.23 0.52 <.00011 Means of three replicate tanks (30fish/tank) except for3% lipid where n=2 tanks. 2Means of nine fish per treatment except 3% lipid where n=6 fish. Means of two analyses/diet 3Pellet Durability Index ability of pellets to hold together when placed through a Holmen pellet quality tester. 4Weight gain(Final average fish weight –initial average fish weight. 5FCR = feed conversion ratio; (g feed fed (dry)/g gain (wet)). 6Feed intake= (total wet feed fed(g)*100)/(( Individual fish weight(g) + Initial individual fish weight(g))/2)/days on feed).7Visceral somatic index. 8Fillet ratio. 9Hepatosomatic index. 10Significance probability associated with the F-statistic Values within columns with a common superscript letter do not differ significantly at P< 0.05; lower case a,b,c when present superscripts refer to significant protein effects while lowercase x,y,z subscripts when present refer to significant lipid effects.
28

Table 11. Proximate composition and nutrient retention efficiency of mature tilapia fed 28, 32 or 36% crude protein and 3, 6 or 9% crude lipid for 18 weeks.1
Moisture CrudeLipid
Crude protein
Gross energy PRE2 ERE3
Diet (%) (%) (%) kcal/kg (%) (%)28% CP 3%CL 71.4 7.95 16.8 1645 23.3 15.6
6% CL 69.1 9.33 16.5 1756 22.9 19.89%CL 69.8 8.70 16.8 1792 25.5 19.5
32% CP 3%CL 68.5 8.85 17.3 1778 22.9 17.06% CL 69.5 8.63 17.4 1677 21.0 17.09%CL 70.0 8.73 17.0 1659 21.5 15.5
36% CP 3%CL 70.4 8.25 16.7 1730 25.5 20.66% CL 71.8 7.33 17.0 1854 21.2 19.09%CL 70.8 7.27 17.1 1636 21.8 17.1
Pooled SE 1.51 1.35 3.46 0.01 0.63 0.43ANOVA, Pr > F4 0.54 0.56 0.54 0.76 0.47 0.79Protein 0.16 0.13 0.16 0.81 0.27 0.46Lipid 0.96 0.95 0.97 0.69 0.33 0.81Protein*Lipid 0.53 0.71 0.58 0.48 0.60 0.671Means of duplicate fish pools per tank; three replicate tanks per diet on an as-fed basis except for 3% lipid treatment where n=two tanks per diet. 2Apparent protein retention efficiency (PRE) = protein gain in fish (g)/protein intake (g) x 100. 3Apparent energy retention efficiency (ERE) = energy gain in fish (g)/energy intake (g) x 100. 4Significance probabilities associated with the F-statistic.
29
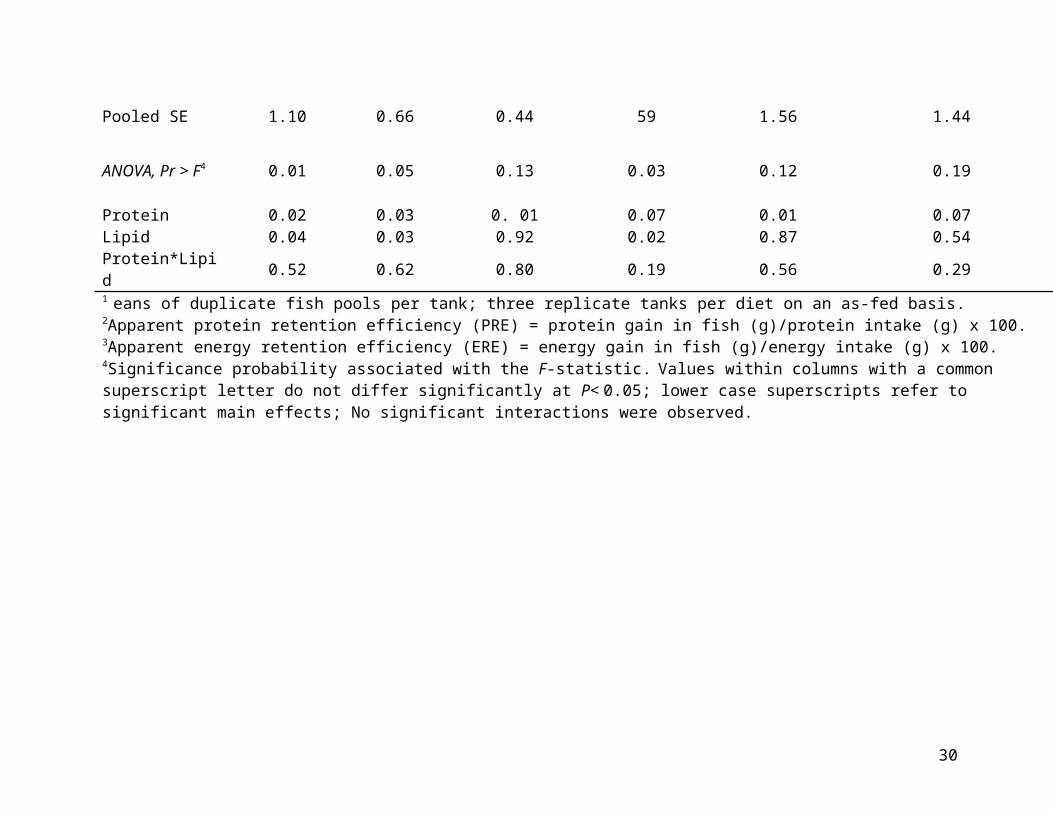
Table 12. Effects of feeding 28, 32 or 36% CP and 3, 6 or 9% CP to mature tilapia for 18 weeks1 on blood lactate2, glucose3, and cortisol4during a simulated hauling trial.
Lactate Glucose CortisolDiet Time 0 24h 72h Time 0 24h 72h Time 0 24h 72h28%CP 3%CL 0.9 3.9y 1.4x 49.3 130 63.0 70.1 356.8a 1856%CL 0.4 8.0x 1.7x 53.8 44.7 49.0 90.6 293.6a 92.39%CL 0.0 8.9x 1.9y 50.0 49.0 57.4 69.1 346.9a 74.332% CP 3%CL 0.8 7.9y 1.5x 43.7 62.2 63.4 81.4 248.2b 67.3
6%CL9%CL 0.4 7.8x 1.0x 45.2 65.3 52.6
126.0 178.0b 93.6
0.4 5.7x 1.3y 69.0 33.5 50.9 67.8 252.2b 70.336% CP 3%CL 0.1 4.3y 2.3x 48.8 28.0 56.2 67.1 141.3b 45.3
6%CL9%CL
0.6 6.8x 1.3x 48.7 102 60.6 89.6 200.6b 104
0.4 6.8x 1.2y 40.8 49.2 62.9106.5 226.4b 191
Pooled SE 0.28 1.24 0.42 10.4 24.9 16.8 30.1 86.7 80.9ANOVA, Pr>F5 0.21 0.002 0.001 0.55 0.31 0.96 0.56 0.11 0.45
Protein 0.60 0.16 0.13 0.62 0.66 0.85 0.67 0.01 0.68Lipid 0.20 0.01 0.02 0.82 0.28 0.71 0.28 0.47 0.96Protein*Lipid 0.15 0.001 0.002 0.26 0.21 0.81 0.49 0.78 0.151Means of duplicate fish per tank; three replicate tanks per diet except 3% lipid where n= 2 tanks/diet. 2Significance probability associated with the F-statistic. Values within columns with a common superscript letter do not differ significantly at P< 0.05; lower case a,b.c superscripts refer to significant protein effects while lower case x,y,z superscripts when present refer to significant lipid effects numeric subscripts refer to significant interactions
30

Table 13. Cost evaluation of protein and lipid fraction of diets fed to mature tilapia for 18 wks.Diet Gain (0-18wk) Feed (g) Cost/lb of feed 1 Cost/lb of gain2
28% CP 3%CL 1644 3460 0.35$ 0.73$6%CL 1815 3335 0.37$ 0.69$9% CL 1528 3265 0.40$ 0.85$32% CP 3%CL 1314 3119 0.36$ 0.86$6%CL 1924 3694 0.39$ 0.75$9%CL 1828 3607 0.41$ 0.82$
36% CP 3%CL 1993 3484 0.38$ 0.73$6%CL 2003 3704 0.40$ 0.74$9%CL 1835 3669 0.43$ 0.86$1Cost/ lb of feed provided by a commercial feed manufacturing company.2Calculated as $/lb of feed fed/0-18wk gain in lbs.
31

Table 14. Proposed Vitamin Premixes To Be Used In The Vitamin Trials. (Source Dr. Chhorn Lim).
VITAMIN mg vitamin activity per kg diet
Requirement(NRC 2011)
A 1.2 mg (4000 IU) 1.76-2.09 mg (5867-6967 IU)D3 50 µg (2000 IU) 9.35 µg (374 IU)
E 50 mg 50-100 mg
K 10 mg ---?
B1 10 mg 3.5mg
B2 12 mg 5-6 mg
B6 10 mg 3 mg
B12 0.01 mg NR
Biotin 0.2 mg 0.06 mg
Folic acid 2 mg 0.82 mg
Pantothenic acid 32 mg 10 mg
Niacin 80 mg 26 mg
Myoinositol -----(NR) NR
Choline 400 mg 1000 mg
C (stay C) 60 mg 19-50 mg
32
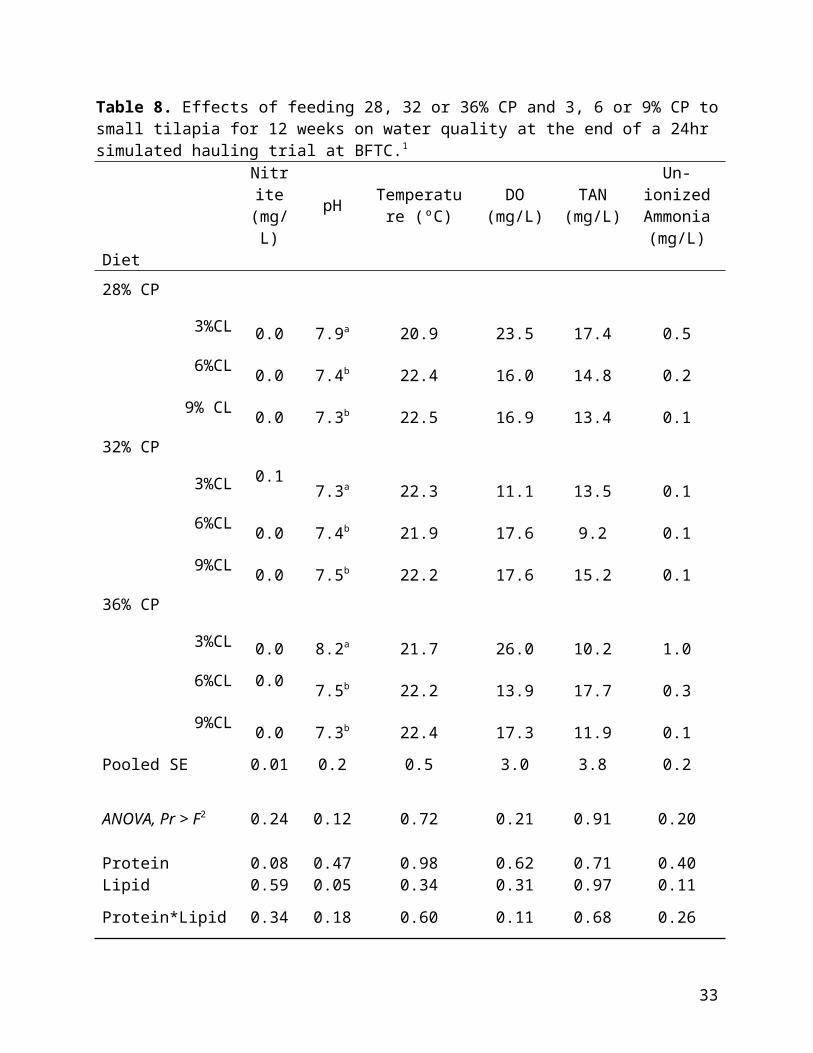
Figure 4. Showing the comparison between final biomass verses fish diets in Arizona Trial 1, (no significant differences)
33

Figure 5. Showing the comparison between crude protein and crude lipid levels on growth and relative weight gain in Arizona Trial 1.
34

Figure 6. Showing the comparison between “standard commercial” diets and “alternative” diets,(no significant differences) in Arizona Trial 1.
35

Table 15. Growth Performance of juvenile tilapia fed Camelina diets for 8 weeks at University of Arizona.
Treatments
original Total
Weight/Tank
final weight
weight gained
Feed fed FCR
1 202 412 210 472 2.25:12 201 497 296 519 1.75:13 207 466 259 478 1.85:14 198 468 270 502 1.85:15 201.9 460.6 258.7 489 1.90:16 197.8 469.8 272.0 459 1.70:17 201.1 472.2 271.1 500 1.85:18 201.1 472.2 271.1 499 1.85:19 200 468 269 494 1.85:1
36
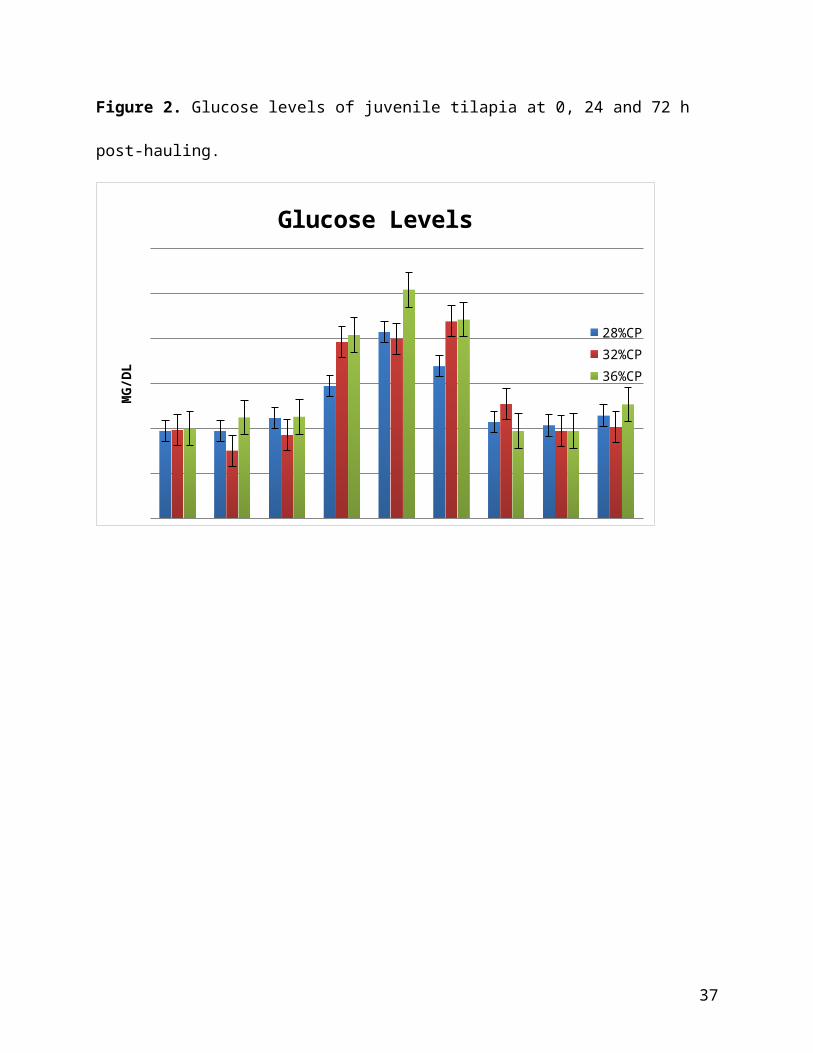
Table 16. . Weight gain1 of mature tilapia fed 32 or 36% crude protein and 6 or 9% crude lipid, with or without amino acid supplementation for 9 weeks.
Protein Lipid AA
initial tank
weight (g)
initial average fish weight (g)
Wk 9 tank
weight (g)
Wk 9 average fish weight (g)
32 6 no 892 74.3 1852.3 154.432 6 yes 891 74.3 1997.7 166.532 9 no 896 74.7 1871.3 155.932 9 yes 885 73.8 1928.3 160.736 6 no 885 73.8 1938.0 161.536 6 yes 880 73.3 1823.0 151.936 9 no 888 74.0 1810.0 150.836 9 yes 892 74.4 1768.7 147.4
Pooled SE 55 2.5ANOVA, Pr > F 0.1792 0.0380Protein 0.0790 0.1122Lipid 0.1782 0.1069AA 0.7842 0.0723Protein*AA 0.0453 0.0451Protein*Lipid 0.4360 0.5009Lipid*AA 0.9304 0.6242Protein*Lipid*AA
0.3414 0.0560
1 Means of three replicate tanks (12 fish/tank).
37

Table 17. Diet formulations for the pilot scale on-farm trial produced by Rangen, Inc.
Ingredient (%) 28CP 6L28CP 6L w/M&L
Fish Meal, Menhaden 2.67 2.67Soybean meal 28.00 28.00Blood meal US 4.00 4.00Poultry by-product, pet food 2.67 2.67Wheat gluten meal 1.00 1.00Poultry fat 2.67 2.67Wheat midds 30.82 30.32Wheat flour 20.00 20.00Blend oil (outside) 2.00 2.00Lecithin 1.00 1.00Stay-C 35 1.00 1.00Vitamin premix 30 1.00 1.00TM ARS 640 0.10 0.10Dicalcium Phosphate 2.50 2.50Choline Cl 50% 0.50 0.50Mold, inhibitor, myco 0.10 0.10Methionine 0.00 0.20Lysine HCL 0.00 0.30
38

Table 18. Initial stocking data for the on-farm trial at Desert Springs Tilapia, Hyder, AZ.
Initial Sampling Date stocked: 7/1/2013
Raceway # wt in grams # of fishesTotal biomass stocked
(g)
8 16.6 2590 42994
9 16.6 2650 43990
10 16.6 2590 42994
11 19.2 2447 46982.4
12 19.2 2901 55699.2
13 15.8 2721 42991.8
14 15.8 2784 43987.2
15 13.8 2741 37825.8
16 16.6 2590 42994
17 16.6 2590 42994
18 18.4 2500 46000
19 18.2 2450 44590
39


![· Web viewJournal of Citation [UCL] Report (Science) 1997 [Retour à Libellule] ------------------------------------------------------------------------ Title Impact Immediacy](https://img.pdfslide.us/doc/110x75/5adaec937f8b9a53618d463b/viewjournal-of-citation-ucl-report-science-1997-retour-libellule-.jpg)