Embed Size (px)
Citation preview

ix
PROJECT TEAM
Project Director: Dr. (Mrs) Sushma Panigrahy Space Applications Centre, ISRO, Ahmedabad
Dr T. S. Singh
Shri J. G. Patel
Haryana Space Applications Centre, Hisar
Dr. R. S. Hooda
Dr. K. E. Mothikumar
Ms. Rekha Rani
M. G. Science Institute, Ahmedabad Dr. R. D. Shah Shri Pragnesh kumar Vaishnav
Ms Yatisha Vaishnav

x

xi
CONTENTS
1.0 INTRODUCTION 1.1 Wetlands 1.2 Mapping and geospatial techniques 1.3 Wetland Inventory of India 2.0 NATIONAL WETLAND INVENTORY AND ASSESSMENT 2.1 Wetland Classification System 2.2 GIS database contents 3.0 STUDY AREA 4.0 DATA USED 5.0 METHODOLOGY 5.1 Creation of spatial framework 5.2 Geo-referencing of satellite data 5.3 Mapping of wetlands 5.4 Conversion of raster (indices) into a vector layer 5.5 Generation of reference layers 5.6 Coding and attribute scheme 5.7 Map composition and output 6.0 ACCURACY ASSESSMENT 7.0 WETLANDS OF HARYANA: MAPS AND STATISTICS 7.1 District-wise Wetland Maps and Statistics 7.1.1 Panchkula 7.1.2 Ambala 7.1.3 Yamunanagar 7.1.4 Kurukshetra 7.1.5 Kaithal 7.1.6 Kamal 7.1.7 Panipat 7.1.8 Sonipat 7.1.9 Jind 7.1.10 Fatehabad 7.1.11 Sirsa 7.1.12 Hisar 7.1.13 Bhiwani 7.1.14 Rohtak 7.1.15 Jhajar 7.1.16 Mahendragarh 7.1.17 Rewari 7.1.18 Gurgaon 7.1.19 Faridabad 8.0 MAJOR WETLAND TYPES OF HARYANA 9.0 IMPORTANT WETLANDS OF HARYANA 10.0 SOI SHEET-WISE WETLAND MAPS (selected sheets) References Annexure–I: Definitions of wetland categories used in the project. Annexure–II: Details of district information followed in the atlas

xii
List of Figures Figure 1: Spectral Signature of various targets Figure 2: Various land features as they appear in four spectral bands and in a typical three band FCC. Figure 3: Location map Figure 4: Spatial framework of Haryana Figure 5: IRS P6 LISS-III coverage of Haryana Figure 6: IRS LISS-III FCC (Post-monsoon and Pre-monsoon): Part of Haryana state Figure 7: Flow chart of the methodology used Figure 8: Steps in the extraction of wetland components Figure 9: Various combinations of the indices/spectral bands used to identify wetland components Figure 10: Type-wise wetland distribution Figure 11: District-wise graphical distribution of wetlands
List of Tables
Table 1: Wetland Classification System and coding Table-2: Satellite data used Table 3: Qualitative turbidity ratings Table 4: Area estimates of wetlands in Haryana Table-5: District-wise wetland highlights Table 6: Area estimates of wetlands in Panchkula Table 7: Area estimates of wetlands in Ambala Table 8: Area estimates of wetlands in Yamunanagar Table 9: Area estimates of wetlands in Kurukshetra Table 10: Area estimates of wetlands in Kaithal Table11: Area estimates of wetlands in Kamal Table 12: Area estimates of wetlands in Panipat
Table 13: Area estimates of wetlands in Sonipat Table 14: Area estimates of wetlands in Jind Table 15: Area estimates of wetlands in Fatehabad Table 16: Area estimates of wetlands in Sirsa Table 17: Area estimates of wetlands in Hisar Table 18: Area estimates of wetlands in Bhiwani Table 19: Area estimates of wetlands in Rohtak Table 20: Area estimates of wetlands in Jhajar Table 21: Area estimates of wetlands in Mahendragarh Table 22: Area estimates of wetlands in Rewari Table 23: Area estimates of wetlands in Gurgaon Table 24: Area estimates of wetlands in Faridabad
List of Plates Plate-1: Major wetland types of Haryana Plate-2a and 2b: Field photographs and ground truth data of different wetland types in Haryana Plate 3: Sultanpur Bird Sanctuary Plate 4: Wetland map - 5 km buffer area of Sultanpur Bird Sanctuary Plate 5: IRS LISS-III FCC - 5 km buffer area of Sultanpur Bird Sanctuary Plate 6: Bhindawas Bird Sanctuary
Plate 7: Wetland map - 5 km buffer area of Bhindawas Bird Sanctuary Plate 8: IRS LISS-III FCC - 5 km buffer area of Bhindawas Bird Sanctuary
Plate 9: Damdama Lake Plate 10: Wetland map - 5 km buffer area of Damdama Lake Plate 11: IRS LISS-III FCC - 5 km buffer area of Damdama Lake
Plate 12: Brahm Sarovar Plate 13 Wetland map - 5 km buffer area of Brahm Sarovar Plate 14: IRS LISS-III FCC - 5 km buffer area of Brahm Sarovar
1
1.0 INTRODUCTION It is increasingly realized that the planet earth is facing grave environmental problems with fast depleting natural resources and threatening the very existence of most of the ecosystems. Serious concerns are voiced among scientists, planners, sociologists, politicians, and economists to conserve and preserve the natural resources of the world. One of the difficulties most frequently faced for decision making is lack of scientific data of our natural resources. Often the data are sparse or unconvincing, rarely in the form of geospatial database (map), thus open to challenges. Thus, the current thrust of every country is to have an appropriate geospatial database of natural resources that is based on unambiguous scientific methods. The wetland atlas of Haryana, which is part of the National Wetland Atlas of India, is an attempt in this direction. 1.1 Wetlands Wetlands are one of the crucial natural resources. Wetlands are areas of land that are either temporarily or permanently covered by water. This means that a wetland is neither truly aquatic nor terrestrial; it is possible that wetlands can be both at the same time depending on seasonal variability. Thus, wetlands exhibit enormous diversity according to their genesis, geographical location, water regime and chemistry, dominant plants and soil or sediment characteristics. Because of their transitional nature, the boundaries of wetlands are often difficult to define. Wetlands do, however, share a few attributes common to all forms. Of these, hydrological structure (the dynamics of water supply, throughput, storage and loss) is most fundamental to the nature of a wetland system. It is the presence of water for a significant period of time which is principally responsible for the development of a wetland. One of the first widely used classifications systems, devised by Cowardin et al, (1979), was associated to its hydrological, ecological and geological aspects, such as: marine (coastal wetlands including rock shores and coral reefs, estuarine (including deltas, tidal marshes, and mangrove swamps), lacustarine (lakes), riverine (along rivers and streams), palustarine ('marshy'- marshes, swamps and bogs). Given these characteristics, wetlands support a large variety of plant and animal species adapted to fluctuating water levels, making the wetlands of critical ecological significance. Utility wise, wetlands directly and indirectly support millions of people in providing services such as food, fiber and raw materials, storm and flood control, clean water supply, scenic beauty and educational and recreational benefits. The Millennium Ecosystem Assessment estimates conservatively that wetlands cover seven percent of the earth’s surface and deliver 45% of the world’s natural productivity and ecosystem services of which the benefits are estimated at $20 trillion a year (Source : www.MAweb.org). The Millennium Assessment (MA) uses the following typology to categorise ecosystem services: Provisioning services: The resources or products provided by ecosystems, such as food, raw materials (wood), genetic resources, medicinal resources, ornamental resources (skin, shells, flowers). Regulating services: Ecosystems maintain the essential ecological processes and life support systems, like gas and climate regulation, water supply and regulation, waste treatment, pollination, etc. Cultural and Amenity services: Ecosystems are a source of inspiration to human culture and education throughout recreation, cultural, artistic, spiritual and historic information, science and education. Supporting services: Ecosystems provide habitat for flora and fauna in order to maintain biological and genetic diversity. Despite these benefits, wetlands are the first target of human interference and are among the most threatened of all natural resources. Around 50% of the earth’s wetlands is estimated to already have disappeared worldwide over the last hundred years through conversion to industrial, agricultural and residential developments. Even in current scenario, when the ecosystem services provided by wetlands are better understood - degradation and conversion of wetlands continues. This is largely due to the fact that the ‘full value’ of ecosystem functions is often ignored in policy-making, plans and corporate evaluations of development projects. 1.2 Mapping and Geospatial technique To conserve and manage wetland resources, it is important to have inventory of wetlands and their catchments. The ability to store and analyse the data is essential. Digital maps are very powerful tools to achieve this. Maps relating the feature to any given geographical location has a strong visual impact. Maps are thus essential for monitoring and quantifying change over time scale, and assist in decision making. The technique used in the preparation of map started with ground survey. The Survey of India (SOI) topographic maps are the earliest true maps of India showing various land use/cover classes including wetlands. Recent years have seen advances in mapping technique to prepare maps with much more information. Of particular importance is the remote sensing and geographic information system (GIS) technique. Remote sensing is

2
now recognized as an essential tool for viewing, analyzing, characterizing, and making decisions about land, water and atmospheric components. From a general perspective, remote sensing is the science of acquiring and analyzing information about objects or phenomena from a distance (Jensen, 1986; Lillesand and Keifer, 1987). Today, we define satellite remote sensing as the use of satellite borne sensors to observe, measure, and record the electromagnetic radiation (EMR) reflected or emitted by the earth and its environment for subsequent analysis and extraction of information. EMR sensors includes visible light, near-, mid- and far-infrared (thermal), microwave, and long-wave radio energy. The capability of multiple sources of information is unique to remote sensing. Of specific advantage is the spectral, temporal, and spatial resolution. Spectral resolution refers to the width or range of each spectral band being recorded. Since each target affects different wavelengths of incident energy differently, they are absorbed, reflected or transmitted in different proportions. Currently, there are many land resource remote sensing satellites that have sensors operating in the green, red, near infrared and short wave Infra red regions of the electromagnetic spectrum giving a definite spectral signature of various targets due to difference in radiation absorption and reflectance of targets. These sensors are of common use for land cover studies, including wetlands. Figure 1 shows typical spectral signature of few targets from green to SWIR region. Converted to image, in a typical false colour composite (FCC) created using NIR, red and green bands assigned as red, green and blue colour, the features become very distinct as shown in Figure 2 - A typical wetland located in Taoru block, Mewat district. In FCC, the vegetation thus appears invariably red (due to high reflection in NIR from green leaves). Since the early 1960s, numerous satellite sensors have been launched into orbit to observe and monitor the earth and its environment. Most early satellite sensors acquired data for meteorological purposes. The advent of earth resources satellite sensors (those with a primary objective of mapping and monitoring land cover) occurred, when the first Landsat satellite was launched in July 1972. Currently, more than a dozen orbiting satellites of various types provide data crucial to improving our knowledge of the earth’s atmosphere, oceans, ice and snow, and land. Of particular interest to India is the indigenous series of satellites called Indian Remote Sensing satellites (IRS-Series). Since the launch of the first satellite IRS 1A in 1987, India has now a number of satellites providing data in multi-spectral bands with different spatial resolution. IRS P6/RESOURCESAT 1 is the current generation satellite that provides multi-spectral images in spatial resolution of 5.8 m (LISS IV), 23.5 m (LISS III) and 56m (AWiFS). Over the past few decades, Indian remote sensing data has been successfully used in various fields of natural resources ( Navalgund et al. 2002 ). Development of technologies like Geographic Information System (GIS) has enhanced the use of RS data to obtain accurate geospatial database. GIS specialises in handling related, spatially referenced data, combining mapped information with other data and acts as analytical tool for research and decision making. During the past few decades, technological advances in the field of satellite remote sensing (RS) sensors, computerized mapping techniques, global positioning system (GPS) and geographic information system (GIS) has enhanced the ability to capture more detailed and timely information about the natural resources at various scales catering to local, regional, national and global level study.
Figure 1: Spectral Signature of various targets

3
Figure 2: Various wetland features as they appear in four spectral bands and in a typical three band FCC.
Green RED
NIR SWIR NIR RED GREEN

4
1.3 Wetland Inventory of India India with its large geographical spread supports large and diverse wetland classes, some of which are unique. Wetlands, variously estimated to be occupying 1-5 per cent of geographical area of the country, support about a fifth of the known biodiversity. Like any other place in the world, there is a looming threat to the aquatic biodiversity of the Indian wetlands as they are often under a regime of unsustainable human pressures. Sustainable management of these assets therefore is highly relevant. Realising this, Govt. of India has initiated many appropriate steps in terms of policies, programmes and plans for the preservation and conservation of these ecosystems. India is a signatory to the Ramsar Convention for management of wetland, for conserving their biodiversity and wise use extending its scope to a wide variety of habitats, including rivers and lakes, coastal lagoons, mangroves, peatlands, coral reefs, and numerous human-made wetland, such as fish and shrimp ponds, farm ponds, irrigated agricultural land, salt pans reservoirs, gravel pits, sewage farms, and canals. The Ministry of Environment and Forests has identified a number of wetlands for conservation and management under the National Wetland Conservation Programme and some financial assistance is being provided to State Governments for various conservation activities through approval of the Management Action Plans. The need to have an updated map database of wetlands that will support such actions has long been realized. Mapping requires a standard classification system. Though there are many classification systems for wetlands in the world, the Ramsar classification system is the most preferred one. The 1971 Ramsar Convention on Wetlands of International Importance especially as Waterfowl Habitat is the oldest conservation convention. It owes its name to its place of adoption in Iran. It came into being due to serious decline in populations of waterfowl (mainly ducks) and conservation of habitats of migratory waterfowl. Convention provides framework for the conservation and ‘wise use’ of wetland biomes. Ramsar convention is the first modern global intergovernmental treaty on conservation and wise use of natural resources (www.ramsar.org). Ramsar convention entered into force in 1975. Under the text of the Convention (Article 1.1) wetlands are defined as: “areas of marsh, fen, peatland or water, whether natural or artificial, permanent or temporary, with water that is static or flowing, fresh, brackish or salt, including areas of marine water the depth of which at low tide does not exceed six meters”. In addition, the Convention (Article 2.1) provides that wetlands: “may incorporate riparian and coastal zones adjacent to the wetlands, and islands or bodies of marine water deeper than six meters at low tide lying within the wetlands”. The first scientific mapping of wetlands of India was carried out during1992-93 by Space Applications Centre (ISRO), Ahmedabad, at the behest of the Ministry of Environment and Forests (MoEF), Govt. of India using remote sensing data from Indian Remote Sensing satellites (IRS-Series). The mapping was done at 1:250,000 scale using IRS 1A LISS-I/II data of 1992-93 timeframe under the Nation-wide Wetland Mapping Project. Since, no suitable wetland classification existed for comprehensive inventory of wetlands in the country at that time, the project used a classification system based on Ramsar Convention definition of wetlands. The classification considers all parts of a water mass including its ecotonal area as wetland. In addition, fish and shrimp ponds, saltpans, reservoirs, gravel pits were also included as wetlands. This inventory put the wetland extent (inland as well as coastal) at about 8.26 million ha. (Garg et al, 1998). These estimates (24 categories) do not include rice/paddy fields, rivers, canals and irrigation channels. Further updating of wetland maps of India was carried out by SAC using IRS P6/Resourcesat AWiFS data of 2004-05 at 1:250000 scale. In recent years, a conservation atlas has been brought out by Salim Ali Centre for Ornithology and Natural History (SACON, 2004), which provide basic information required by stakeholders in both wetland habitat and species conservation. Space Applications Centre has carried out many pilot projects for development of GIS based wetland information system (Patel et al, 2003) and Lake Information system (Singh et al, 2003).
5
2.0 NATIONAL WETLAND INVENTORY AND ASSESSMENT (NWIA) PROJECT Realising the importance of many small wetlands that dot the Indian landscape, it has been unanimously felt that inventory of the wetlands at 1:50,000 scale is essential. The task seemed challenging in view of the vast geographic area of our country enriched with diverse wetland classes. Space Applications Centre with its experience in use of RS and GIS in the field of wetland studies, took up this challenging task. This is further strengthened by the fact that guidelines to create geospatial framework, codification scheme, data base structure etc. for natural resources survey has already been well established by the initiative of ISRO under various national level mapping projects. With this strength, the National Wetland Inventory and Assessment (NWIA) project was formulated by SAC, which was approved and funded by MoEF. The main objectives of the project are:
• To map the wetlands on 1:50000 scale using two date (pre and post monsoon) IRS LISS III digital data following a standard wetland classification system.
• Integration of ancillary theme layers ( road, rail, settlements, drainage, administrative boundaries) • Creation of a seamless database of the states and country in GIS environment. • Preparation of State-wise wetland atlases
The project was initiated during 2007. The first task was to have a classification system that can be used by different types of users while amenable to database. An expert/peer group was formed and the peer review was held at SAC on June 2007 where wetland experts and database experts participated and finalized the classification system. It was agreed to follow the classification system that has been used for the earlier project of 1:250,000 scale, with slight modification. Modified National Wetland Classification system for wetland delineation and mapping comprise 19 wetland classes which are organized under a Level III hierarchical system. The definition of each wetland class and its interpretation method was finalized. The technical/procedure manual was prepared as the standard guideline for the project execution across the country (Garg and Patel, 2007). The present atlas is part of the national level data base and deals with the state of Haryana. 2.1 Wetland Classification System
In the present project, Modified National Wetland Classification system is used for wetland delineation and mapping comprising 19 wetland classes which are organized under a Level III hierarchical system (Table 1). Level one has two classes: inland and coastal, these are further bifurcated into two categories as: natural and man-made under which the 19 wetland classes are suitably placed. Two date data pertaining to pre-monsoon and post monsoon was used to confirm the classes. Wetlands put to agriculture use in any of the two dates are not included as wetland class. Definitions of wetland categories used in the project is given in Annexure-I.
2.2.1 Spatial Framework and GIS Database The National Spatial Framework) (NSF) has been used as the spatial framework to create the database (Anon. 2007). The database design and creation standard suggested by NRDB/NNRMS guidelines is followed. Feature codification scheme for every input element has been worked out keeping in view the nationwide administrative as well as natural hierarchy (State-district- within the feature class for each of the theme. All data elements are given a unique name, which are self explanatory with short forms. Following wetland layers are generated for each inland wetland: Wetland extent: As wetlands encompass open water, aquatic vegetation (submerged, floating and
emergent), the wetland boundary should ideally include all these. Satellite image gives a clear signature of the wetland extends from the imprint of water spread over the years.
Water spread: There are two layers representing post-monsoon and pre-monsoon water spread during the year of data acquisition.

6
Aquatic vegetation spread: The presence of vegetation in wetlands provides information about its trophic condition. As is known, aquatic vegetation is of four types, viz. benthic, submerged, floating, and emergent. It is possible to delineate last two types of vegetation using optical remote sensing data. A qualitative layer pertaining to presence of vegetation is generated for each season (as manifested on pre-monsoon and post-monsoon imagery).
Turbidity level of open water: A layer pertaining to a qualitative turbidity rating is generated. Three qualitative turbidity ratings ( low, medium and high) is followed for pre and post-monsoon turbidity of lakes, reservoirs, barrages and other large wetlands.
Small wetlands (smaller than minimum mappable unit) are mapped as point features. Base layers like major road network, railway, settlements, and surface drainage are created (either from
the current image or taken from other project data base).
In the case of coastal wetlands only wetland extent is given.
Table 1: Wetland Classification System and coding
*Wettcode Level I Level II Level III
1000 Inland Wetlands
1100 Natural
1101 Lakes
1102 Ox-Bow Lakes/ Cut-Off Meanders
1103 High altitude Wetlands
1104 Riverine Wetlands
1105 Waterlogged
1106 River/stream
1200 Man-made
1201 Reservoirs/ Barrages
1202 Tanks/Ponds
1203 Waterlogged
1204 Salt pans
2000 Coastal Wetlands
2100 Natural
2101 Lagoons
2102 Creeks
2103 Sand/Beach
2104 Intertidal mud flats
2105 Salt Marsh
2106 Mangroves
2107 Coral Reefs
2200 Man-made
2201 Salt pans
2202 Aquaculture ponds
* Wetland type code
7
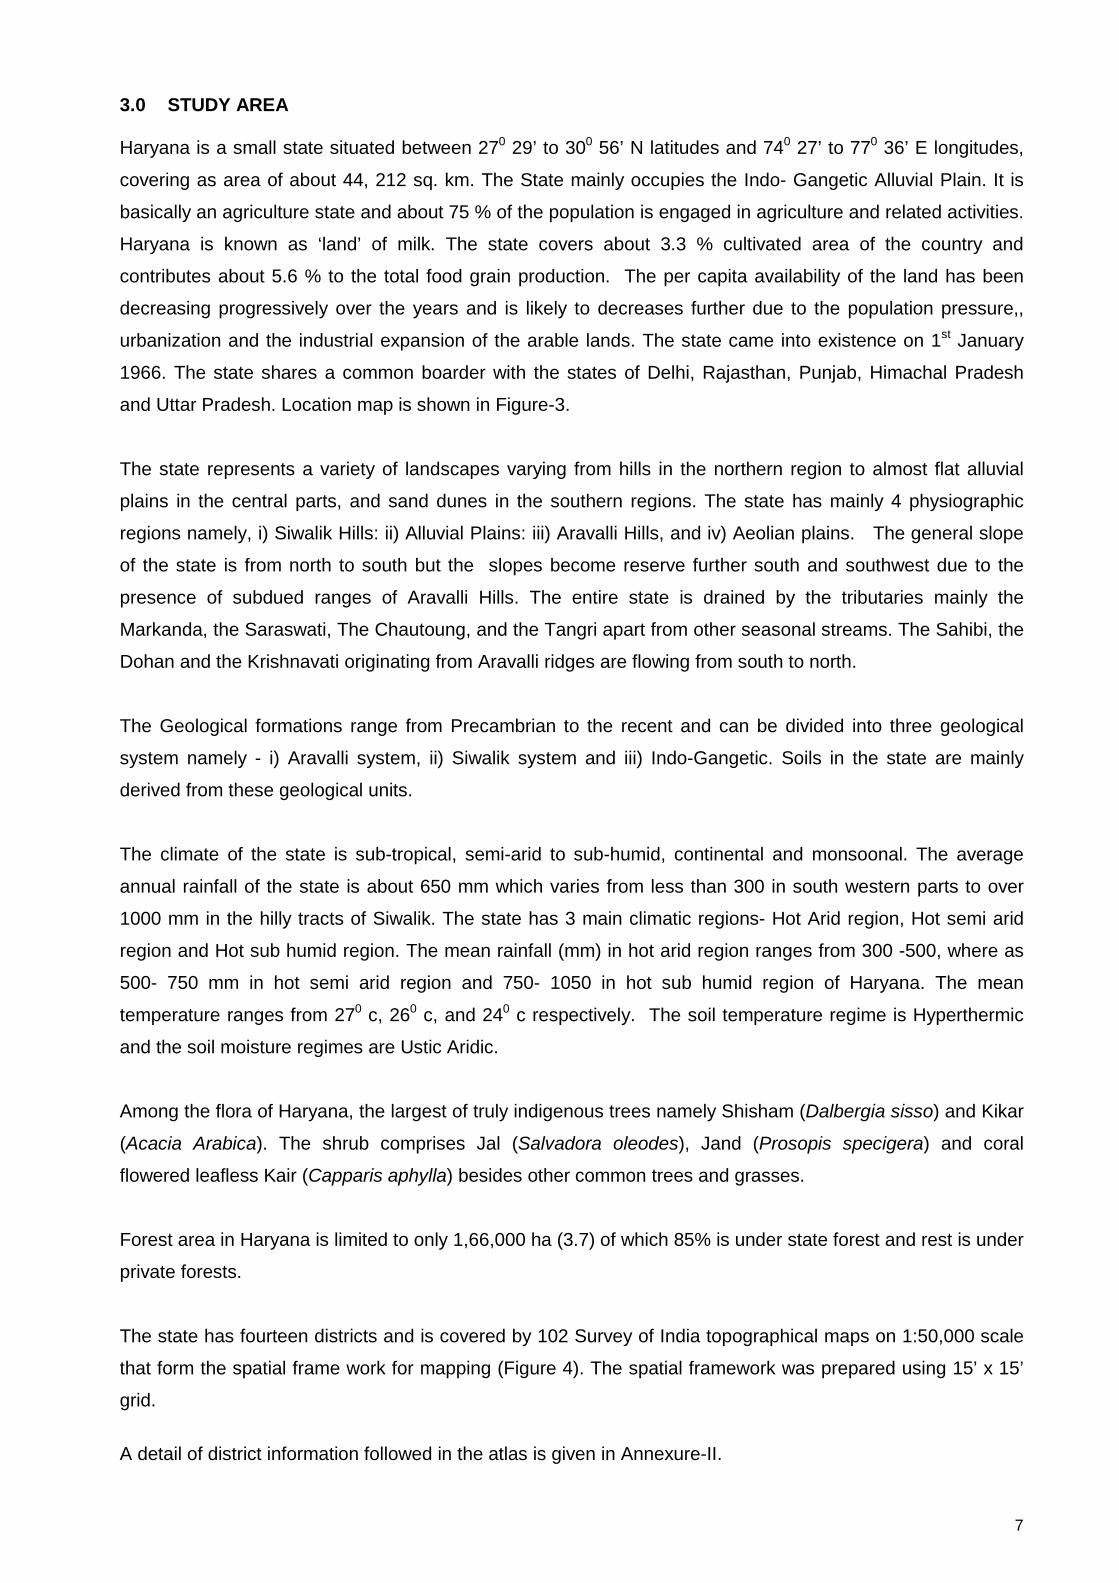
3.0 STUDY AREA Haryana is a small state situated between 270 29’ to 300 56’ N latitudes and 740 27’ to 770 36’ E longitudes,
covering as area of about 44, 212 sq. km. The State mainly occupies the Indo- Gangetic Alluvial Plain. It is
basically an agriculture state and about 75 % of the population is engaged in agriculture and related activities.
Haryana is known as ‘land’ of milk. The state covers about 3.3 % cultivated area of the country and
contributes about 5.6 % to the total food grain production. The per capita availability of the land has been
decreasing progressively over the years and is likely to decreases further due to the population pressure,,
urbanization and the industrial expansion of the arable lands. The state came into existence on 1st January
1966. The state shares a common boarder with the states of Delhi, Rajasthan, Punjab, Himachal Pradesh
and Uttar Pradesh. Location map is shown in Figure-3.
The state represents a variety of landscapes varying from hills in the northern region to almost flat alluvial
plains in the central parts, and sand dunes in the southern regions. The state has mainly 4 physiographic
regions namely, i) Siwalik Hills: ii) Alluvial Plains: iii) Aravalli Hills, and iv) Aeolian plains. The general slope
of the state is from north to south but the slopes become reserve further south and southwest due to the
presence of subdued ranges of Aravalli Hills. The entire state is drained by the tributaries mainly the
Markanda, the Saraswati, The Chautoung, and the Tangri apart from other seasonal streams. The Sahibi, the
Dohan and the Krishnavati originating from Aravalli ridges are flowing from south to north.
The Geological formations range from Precambrian to the recent and can be divided into three geological
system namely - i) Aravalli system, ii) Siwalik system and iii) Indo-Gangetic. Soils in the state are mainly
derived from these geological units.
The climate of the state is sub-tropical, semi-arid to sub-humid, continental and monsoonal. The average
annual rainfall of the state is about 650 mm which varies from less than 300 in south western parts to over
1000 mm in the hilly tracts of Siwalik. The state has 3 main climatic regions- Hot Arid region, Hot semi arid
region and Hot sub humid region. The mean rainfall (mm) in hot arid region ranges from 300 -500, where as
500- 750 mm in hot semi arid region and 750- 1050 in hot sub humid region of Haryana. The mean
temperature ranges from 270 c, 260 c, and 240 c respectively. The soil temperature regime is Hyperthermic
and the soil moisture regimes are Ustic Aridic.
Among the flora of Haryana, the largest of truly indigenous trees namely Shisham (Dalbergia sisso) and Kikar
(Acacia Arabica). The shrub comprises Jal (Salvadora oleodes), Jand (Prosopis specigera) and coral
flowered leafless Kair (Capparis aphylla) besides other common trees and grasses.
Forest area in Haryana is limited to only 1,66,000 ha (3.7) of which 85% is under state forest and rest is under
private forests.
The state has fourteen districts and is covered by 102 Survey of India topographical maps on 1:50,000 scale
that form the spatial frame work for mapping (Figure 4). The spatial framework was prepared using 15’ x 15’
grid.
A detail of district information followed in the atlas is given in Annexure-II.

8
Figure 3: Location Map
Figure 4: Spatial Framework of Haryana
9
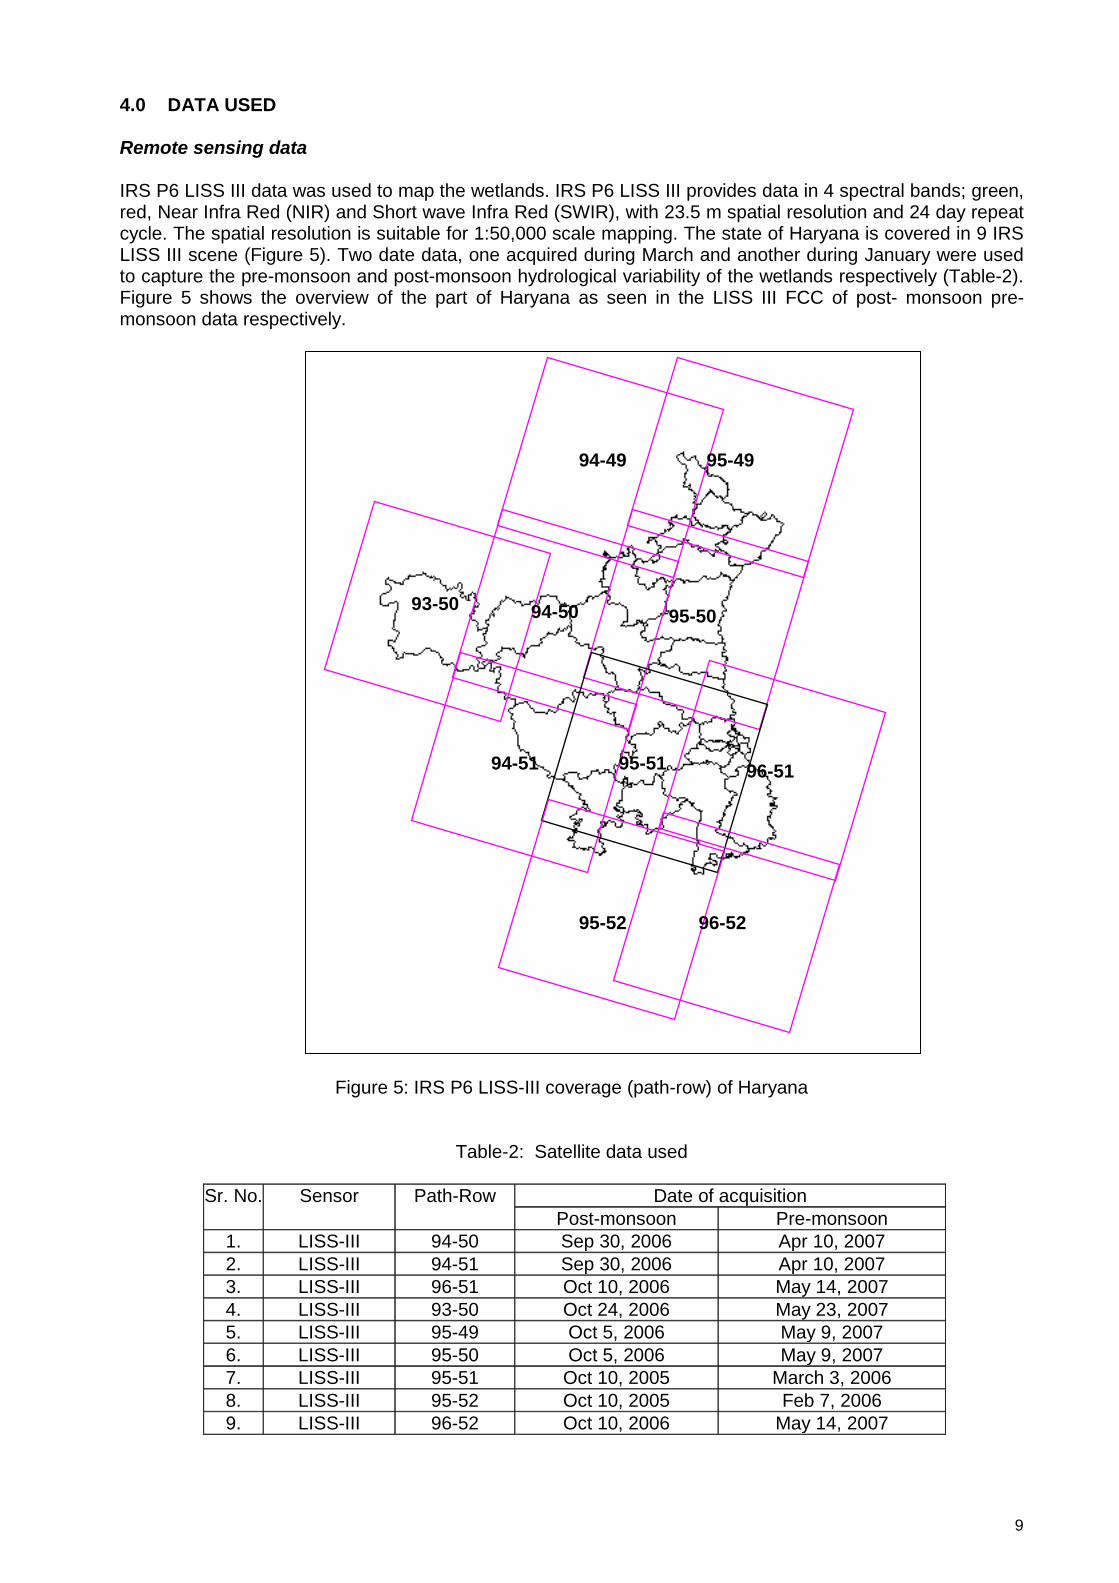
4.0 DATA USED Remote sensing data IRS P6 LISS III data was used to map the wetlands. IRS P6 LISS III provides data in 4 spectral bands; green, red, Near Infra Red (NIR) and Short wave Infra Red (SWIR), with 23.5 m spatial resolution and 24 day repeat cycle. The spatial resolution is suitable for 1:50,000 scale mapping. The state of Haryana is covered in 9 IRS LISS III scene (Figure 5). Two date data, one acquired during March and another during January were used to capture the pre-monsoon and post-monsoon hydrological variability of the wetlands respectively (Table-2). Figure 5 shows the overview of the part of Haryana as seen in the LISS III FCC of post- monsoon pre-monsoon data respectively.
Figure 5: IRS P6 LISS-III coverage (path-row) of Haryana
Table-2: Satellite data used
Sr. No. Sensor Path-Row Date of acquisition Post-monsoon Pre-monsoon
1. LISS-III 94-50 Sep 30, 2006 Apr 10, 2007 2. LISS-III 94-51 Sep 30, 2006 Apr 10, 2007 3. LISS-III 96-51 Oct 10, 2006 May 14, 2007 4. LISS-III 93-50 Oct 24, 2006 May 23, 2007 5. LISS-III 95-49 Oct 5, 2006 May 9, 2007 6. LISS-III 95-50 Oct 5, 2006 May 9, 2007 7. LISS-III 95-51 Oct 10, 2005 March 3, 2006 8. LISS-III 95-52 Oct 10, 2005 Feb 7, 2006 9. LISS-III 96-52 Oct 10, 2006 May 14, 2007
93-50
94-49
94-50
94-51
95-49
95-50
95-51
95-52
96-51
96-52

10
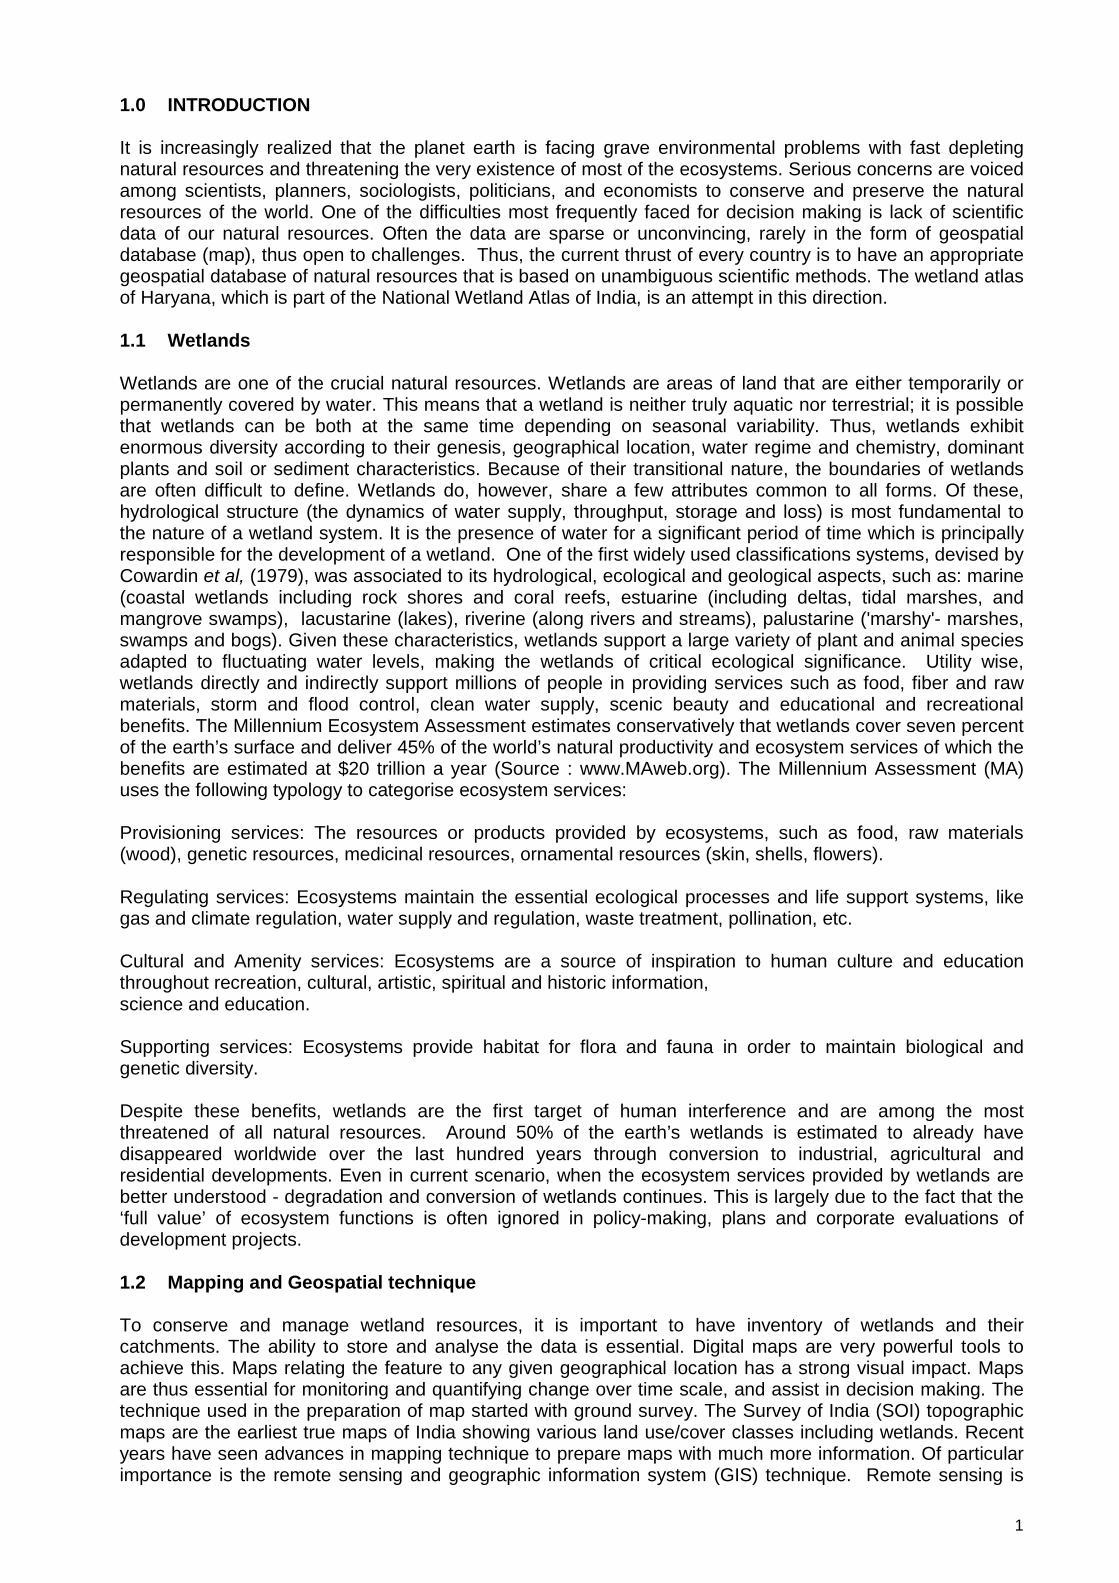
Ground truth data Remote sensing techniques require certain amount of field observation called “ground truth” in order to convert into meaningful information. Such work involves visiting a number of test sites, usually taking the satellite data. The location of the features is recorded using the GPS. The standard proforma as per the NWIA manual was used to record the field data. Field photographs are also taken to record the water quality (subjective), status of aquatic vegetation and water spread. All field verification work has been done during October and November 2008. Other data Survey of India topographical maps (SOI) were used for reference purpose. Lineage data of National Wetland Maps at 1:250,000 scale was used for reference. 5.0 METHODOLOGY The methodology to create the state level atlas of wetlands is adhered to NWIA technical guidelines and procedure manual (Garg and Patel, 2007). The overview of the steps used is shown in Figure 7. Salient features of methodology adopted are
• Generation of spatial framework in GIS environment for database creation and organisation. • Geo-referencing of satellite data • Identification of wetland classes as per the classification system given in NWIA Manual and mapping of
the classes using a knowledge based digital classification and onscreen interpretation • Generation of base layers (rail, road network, settlements, drainage, administrative boundaries) from
satellite image and ancillary data. • Mosaicing/edge matching to create district and state level database. • Coding of the wetlands following the standard classification system and codification as per NWIA
manual. • Preparation of map compositions and generation of statistics • Outputs on A3 size prints and charts for atlas.
Work was carried out using ERDAS Imagine, Arc/Info and Arcgis softwares. 5.1 Creation of spatial framework This is the most important task as the state forms a part of the national frame work and is covered in multiple map sheets. To create NWIA database, NNRMS/NRDB standards is followed and four corners of the 1:50,000 (15’ x 15’) grid is taken as the tics or registration points to create each map taking master grid as the reference. Spatial framework details are given in NWIA manual (Garg and Patel 2007). The spatial framework for Haryana state is shown in Figure 4. 5.2 Geo-referencing of satellite data In this step the raw satellite images were converted to specific map projection using geometric correction. This is done using archived geometrically corrected LISS III data (ISRO-NRC-land use / land cover project ). Standard image processing software was used for geo-referencing. First one date data was registered with the archived image. The second date data was then registered with the first date data. 5.3 Mapping of wetlands The delineation of wetlands through image analysis forms the foundation for deriving all wetland classes and results. Consequently, a great deal of emphasis has been placed on the quality of the image Interpretation. In the present study, the mapping of wetlands was done following digital classification and onscreen visual interpretation. Wetlands were identified based on vegetation, visible hydrology and geography. There are various methods for extraction of water information from remote sensing imagery, which according to the number of bands used, are generally divided into two categories, i.e. Single-band and multi-band methods. Single-band method usually involves choosing a band from multi-spectral image to distinguish water from land by subjective threshold values. It may lead to over- or under-estimation of open water area. Multi-band method takes advantage of reflective differences of each band. In this project, five indices known in literature that enhances various wetland characteristics were used (McFeetres, 1986; Xu Hanqiu, 2006; Lacaux et al, 2007; Townshend and Justice, 1986; Tucker and Sellers, 1986) as given below: i) Normalised Difference Water Index (NDWI) = (Green-NIR) / (Green + NIR) ii) Modified Normalised Difference Water Index (MNDWI) = (Green-MIR) / (Green + MIR) iii) Normalised Difference Vegetation Index (NDVI) = (NIR - Red) / (NIR + Red) iv) Normalised Difference Pond Index (NDPI) = (MIR – Green / MIR + Green) v) Normalised Difference Turbidity Index (NDTI) = (Red – Green) / (Red + Green)

11
Figure 6: IRS LISS-III FCC (Post-monsoon and Pre-monsoon): Part of Haryana state
October 2006
May 2007

12
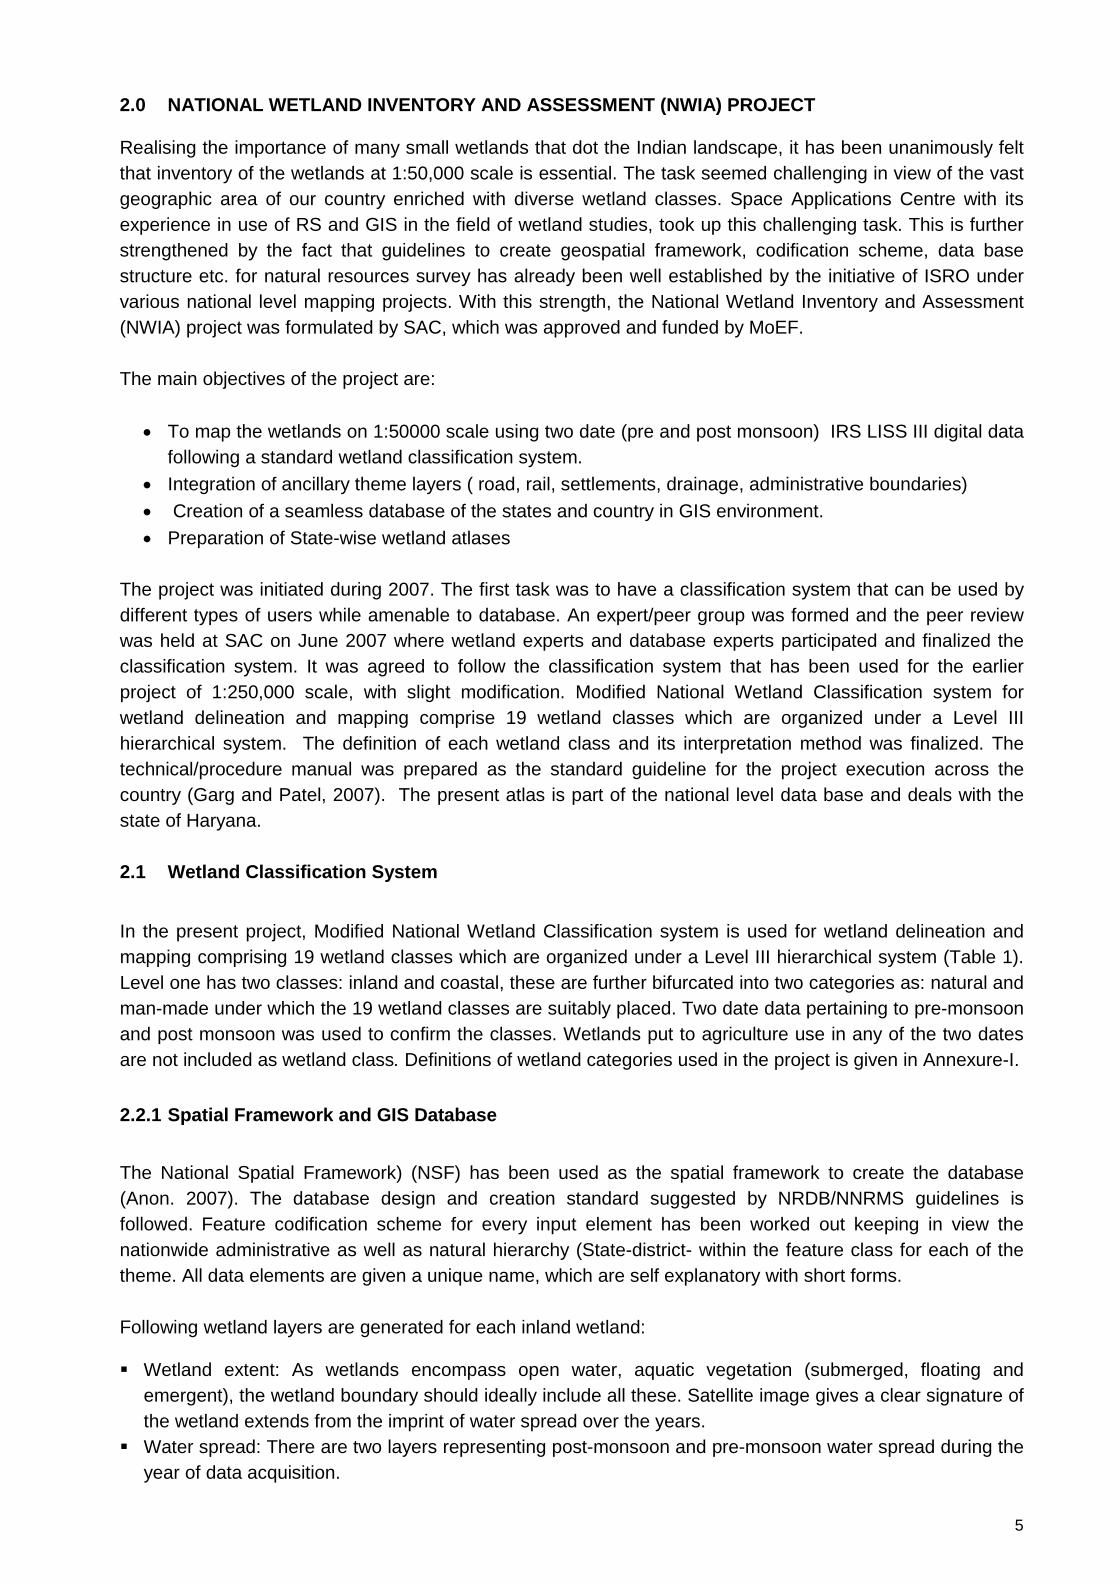
The indices were generated using standard image processing software, stacked as layers. (Figure 8). Various combinations of the indices/spectral bands were used to identify the wetland features as shown in Figure 9. The following indices were used for various layer extractions:
• Extraction of wetland extent : MNDWI, NDPI and NDVI image was used to extract the wetland boundary through suitable hierarchical thresholds.
• Extraction of open water :
MNDWI was used within the wetland mask to delineate the water and no-water areas.
• Extraction of wetland vegetation :
NDPI and NDVI image was used to generate the vegetation and no-vegetation areas within a wetland using a suitable threshold.
• Turbidity information extraction : NDTI and MNDWI image was used to generate qualitative turbidity level (high, moderate and low) based on signature statistics and standard deviations. In the False Colour Composite (FCC) these generally appear in different hues (Table-3).
Table 3: Qualitative turbidity ratings
Sr. No. Qualitative Turbidity Conditional criteria Hue on False Colour Composite (FCC)
1. Low > +1σ Dark blue/blackish
2. Moderate > -1σ to <= +1σ Medium blue
3. High/Bottom reflectance <= µ - 1σ Light blue/whitish blue
5.4 Conversion of the raster (indices) into a vector layer The information on wetland extent, open water extent, vegetation extent and turbidity information was converted into vector layers using region growing properties or on-screen digitisation. 5.5 Generation of reference layers Base layers like major rail, road network, settlements, drainage are interpreted from the current image or taken from other project database. The administrative boundaries (district, state) are taken from the known reference data. 5.6 Coding and attribute scheme Feature codification scheme for every input element has been worked out keeping in view the nationwide administrative as well as natural hierarchy (State-district-taluka) within the feature class for each of the theme. All data elements are given a unique name/code, which are self explanatory with short forms. 5.7 Map composition and output Map composition for atlas has been done at district and state level. A standard color scheme has been used for the wetland classes and other layers. The digital files are made at 1:50,000 scale. The hard copy outputs are taken on A3 size.

13
Figure 7: Flow chart of the methodology used
Figure 8: Steps in the extraction of wetland components
Legacy data Spatial frame work
On-screen interpretation/ Digital analysis
Geo-referenced images
GIS DATABASE (Wetland layers, Base layers)
Biological (Wetland vegetation)
Physical (Wetland type)
Ground truth
Morphometric (Wetland extent)
IRS P6 LISS III pre and post-monsoon data
NWIA Database Organisation (District, State, Country)
Analysis Atlases/Report
Base layers (Road, Settlement, drainage)
SOI topographic maps Admin. Boundaries (State, District)
Quality Check
Accuracy Assessment/ Quality Check

14
6.0 ACCURACY ASSESSMENT A comprehensive accuracy assessment protocol has been followed for determining the quality of information
derived from remotely sensed data. Accuracy assessment involves determination of thematic (classification)
as well as locational accuracy. In addition, GIS database(s) contents have been also evaluated for accuracy.
To ensure the reliability of wetland status data, the project adhered to established quality assurance and
quality control measures for data collection, analysis, verification and reporting.
This study used well established, time-tested, fully documented data collection conventions. It employed
skilled and trained personnel for image interpretation, processing and digital database creation. All interpreted
imageries were reviewed by technical expert team for accuracy and code. The reviewing analyst adhered to
all standards, quality requirements and technical specifications and reviewed 100 percent of the work. The
various stages of quality check include:
1. Image-to-Image Geo-referencing/Data generation 2. Reference layer preparation using NWIA post monsoon and pre-monsoon LISS-III data. 3. Wetland mapping using visual/digital interpretation techniques. 4. Geo-data base creation and organization 5. Output products.
6.1 Data verification and quality assurance of output digital data files All digital data files were subjected to rigorous quality control inspections. Digital data verification included
quality control checks that addressed the geospatial correctness, digital integrity and some cartographic
aspects of the data. Implementation of quality checks ensured that the data conformed to the specified
criteria, thus achieving the project objectives. There were tremendous advantages in using newer
technologies to store and analyze the geographic data. The geospatial analysis capability built into this study
provided a complete digital database to better assist analysis of wetland change information. All digital data
files were subjected to rigorous quality control inspections. Automated checking modules incorporated in the
geographic information system (Arc/GIS) were used to correct digital artifacts including polygon topology.
Additional customized data inspections were made to ensure that the changes indicated at the image
interpretation stage were properly executed.

15
Figure 9: Various combinations of the indices/spectral bands used to identify wetland components
MNDWI NDPI NDVI
IRS LISS III data, 10 October 2006
G R SWIR
G R NIR
NDWI NDVI NDPI
MNDWI MNDWI NDTI
Useful for wetland boundary extraction/delineation
Useful for wetland vegetation & open water features
Useful for qualitative turbidity delineation
Open water
Moderate
Vegetation

16