Embed Size (px)
Citation preview
3/12/2013
1
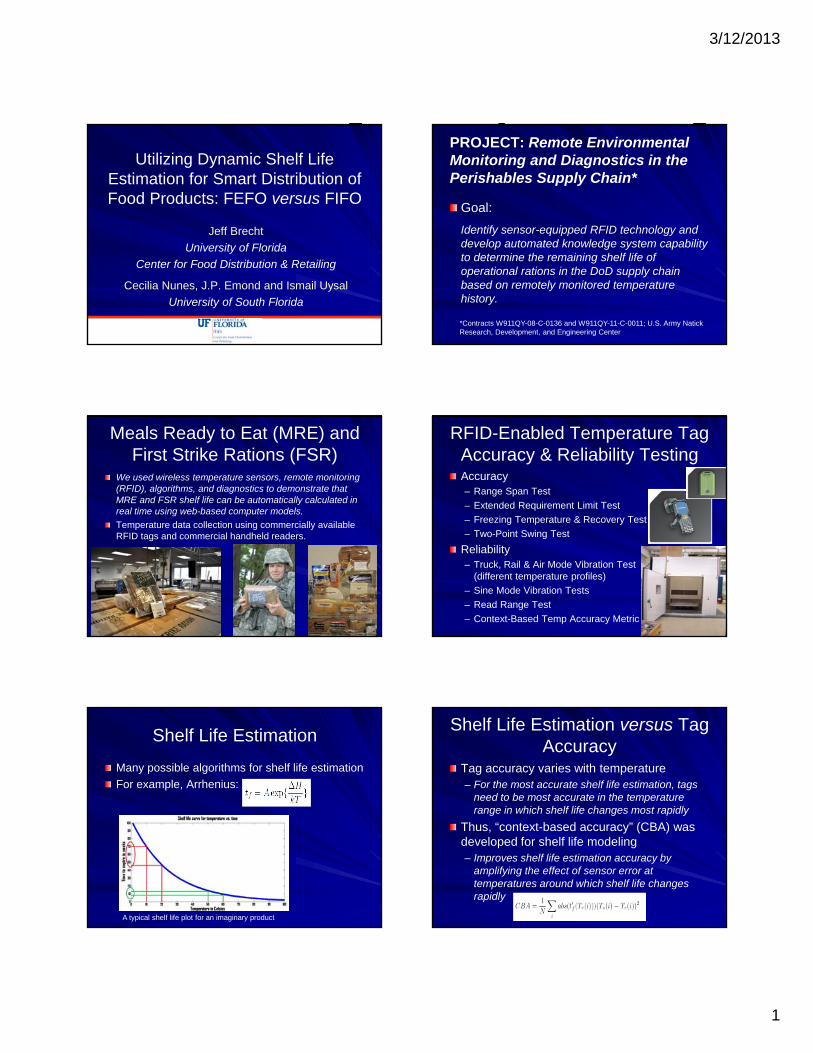
Utilizing Dynamic Shelf Life Estimation for Smart Distribution of Food Products: FEFO versus FIFO
Jeff Brecht
University of Florida
Center for Food Distribution & Retailing
Cecilia Nunes, J.P. Emond and Ismail Uysal
University of South Florida
PROJECT: Remote Environmental Monitoring and Diagnostics in the Perishables Supply Chain*
Goal:
Identify sensor-equipped RFID technology and develop automated knowledge system capability to determine the remaining shelf life of operational rations in the DoD supply chain based on remotely monitored temperature history.
*Contracts W911QY-08-C-0136 and W911QY-11-C-0011; U.S. Army Natick Research, Development, and Engineering Center
Meals Ready to Eat (MRE) and First Strike Rations (FSR)
We used wireless temperature sensors, remote monitoring (RFID), algorithms, and diagnostics to demonstrate that MRE and FSR shelf life can be automatically calculated in real time using web-based computer models.
Temperature data collection using commercially available RFID tags and commercial handheld readers.
RFID-Enabled Temperature Tag Accuracy & Reliability TestingAccuracy– Range Span Test
– Extended Requirement Limit Test
– Freezing Temperature & Recovery Test
– Two-Point Swing Test
Reliability– Truck, Rail & Air Mode Vibration Test
(different temperature profiles)
– Sine Mode Vibration Tests
– Read Range Test
– Context-Based Temp Accuracy Metric
Shelf Life Estimation
Many possible algorithms for shelf life estimation
For example, Arrhenius:
A typical shelf life plot for an imaginary product
Shelf Life Estimation versus Tag Accuracy
Tag accuracy varies with temperature– For the most accurate shelf life estimation, tags
need to be most accurate in the temperature range in which shelf life changes most rapidly
Thus, “context-based accuracy” (CBA) was developed for shelf life modeling– Improves shelf life estimation accuracy by
amplifying the effect of sensor error at temperatures around which shelf life changes rapidly
3/12/2013
2
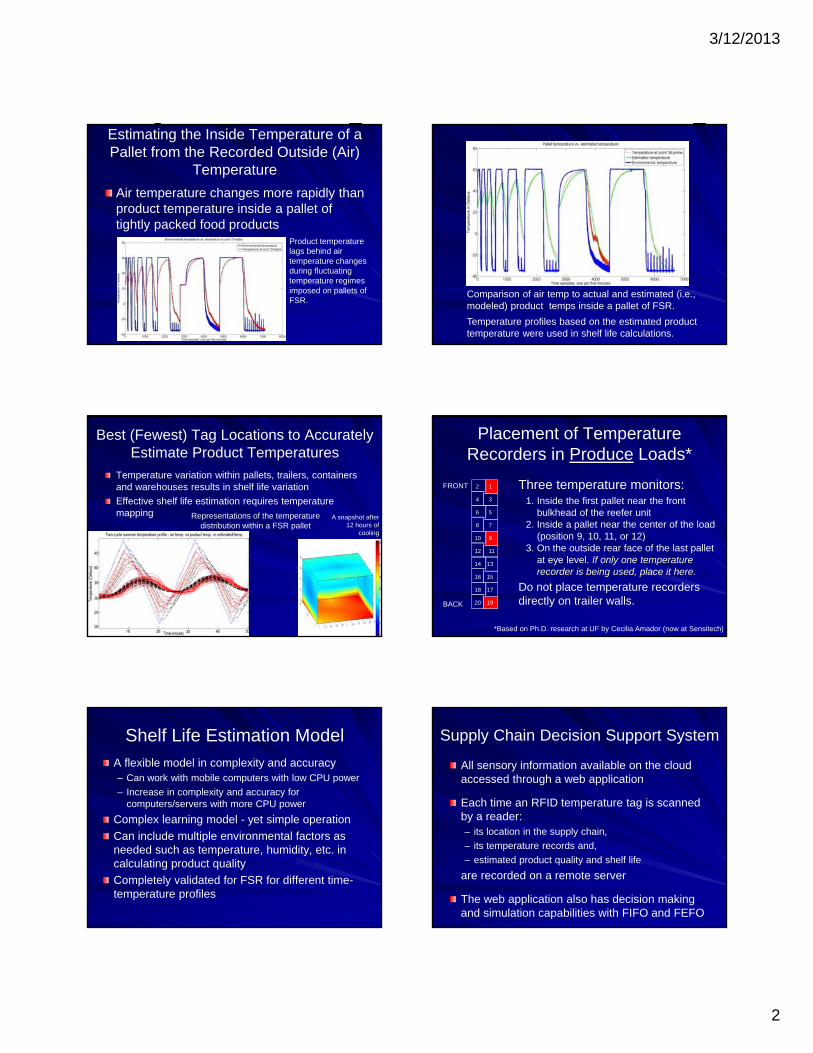
Estimating the Inside Temperature of a Pallet from the Recorded Outside (Air)
Temperature
Air temperature changes more rapidly than product temperature inside a pallet of tightly packed food products
Product temperature lags behind air temperature changes during fluctuating temperature regimes imposed on pallets of FSR.
Comparison of air temp to actual and estimated (i.e., modeled) product temps inside a pallet of FSR.
Temperature profiles based on the estimated product temperature were used in shelf life calculations.
Best (Fewest) Tag Locations to Accurately Estimate Product Temperatures
Temperature variation within pallets, trailers, containers and warehouses results in shelf life variation
Effective shelf life estimation requires temperature mapping Representations of the temperature
distribution within a FSR palletA snapshot after
12 hours of cooling
Placement of Temperature Recorders in Produce Loads*
2 1
4 3
6 5
8 7
10 9
12 11
14 13
16 15
18 17
20 19BACK
FRONT Three temperature monitors:1. Inside the first pallet near the front
bulkhead of the reefer unit2. Inside a pallet near the center of the load
(position 9, 10, 11, or 12)3. On the outside rear face of the last pallet
at eye level. If only one temperature recorder is being used, place it here.
Do not place temperature recorders directly on trailer walls.
*Based on Ph.D. research at UF by Cecilia Amador (now at Sensitech)
Shelf Life Estimation Model
A flexible model in complexity and accuracy– Can work with mobile computers with low CPU power
– Increase in complexity and accuracy for computers/servers with more CPU power
Complex learning model - yet simple operation
Can include multiple environmental factors as needed such as temperature, humidity, etc. in calculating product quality
Completely validated for FSR for different time-temperature profiles
Supply Chain Decision Support System
All sensory information available on the cloud accessed through a web application
Each time an RFID temperature tag is scanned by a reader:– its location in the supply chain,
– its temperature records and,
– estimated product quality and shelf life
are recorded on a remote server
The web application also has decision making and simulation capabilities with FIFO and FEFO
3/12/2013
3
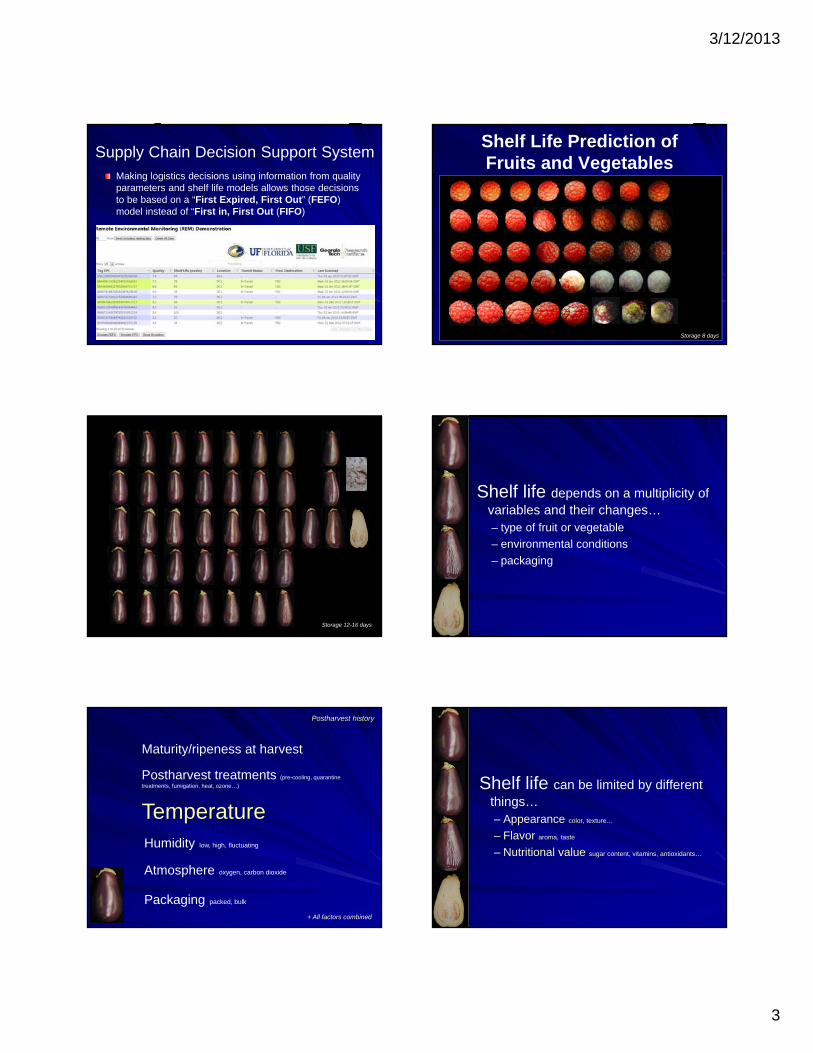
Supply Chain Decision Support SystemMaking logistics decisions using information from quality parameters and shelf life models allows those decisions to be based on a “First Expired, First Out” (FEFO) model instead of “First in, First Out (FIFO)
Storage 8 days
Shelf Life Prediction ofFruits and Vegetables
Storage 12-16 days
Shelf life depends on a multiplicity of variables and their changes…– type of fruit or vegetable
– environmental conditions
– packaging
Temperature low, high, fluctuating
Humidity low, high, fluctuating
Atmosphere oxygen, carbon dioxide
Packaging packed, bulk
Postharvest history
Postharvest treatments (pre-cooling, quarantine
treatments, fumigation, heat, ozone…)
+ All factors combined
Maturity/ripeness at harvest
Shelf life can be limited by different things…– Appearance color, texture…
– Flavor aroma, taste
– Nutritional value sugar content, vitamins, antioxidants…

3/12/2013
4
Methods to Predict Shelf Life
Predictive microbiology based on microbial growthsensory quality limits the shelf life and not microbial growth (Labuza & Fu 1993; Riva et al. 2001; Jacxsens et al. 2002; Sinigaglia et al. 2003; Corbo et al. 2006)
Time-temperature indicators use chromatic variation that depends on temperature-time exposure and assume a relationship with the loss of quality. Monitors the temperature history in response to the cumulative effect of time and temperature (Wells & Singh 1988; Riva et al. 2001; Giannakourou & Taoukis 2003)
Bio-indicators direct use of a microbial culture that displays same temperature characteristics of the food spoilage organism (McKeen & Ross 1996)
Methods to Predict Shelf Life
Respiration rate by measuring the oxygen consumed and the carbon dioxide released, but not appearance, texture or composition(Rieblinger et al. 1977)
Changes based on single quality factors assumed to be a measure of average biological aging or development pattern: firmness (Rieblinger et al. 1977; Aggarwal et al. 2003), color (Ishikawa & Hirata 2001;
Hertog 2002; Schouten et al. ; Hertog et al. 2004), shriveling (Hertog 2002)
Changes based on multiple quality factors as a function of individual commodity characteristics, handling temperature, humidity, temperature & humidity and time
(Nunes and colleagues, 2001-2012)
Time (days)
0 2 4 6 8 10 12 14 16 18 20
Time (days)
0 2 4 6 8 10 12 14 16 18 20
Qu
ality
rat
ing
(1-5
)
1.0
2.0
3.0
4.0
5.0
2C5C12C15C20C
Tommy Atkins Palmer
2°C CI or CI & softening
5°C Softening
12°C Softening, color changes & decay
15°C Softening & color changes or softening & decay
20°C Softening & color changes and decay or softening & color changes
Each temperature-related quality curve is designed based on the shelf life
limiting quality factor at that specific temperatureMango
SS
C (
% D
W)
18.0
24.0
30.0
36.0
42.0
48.0
54.0
60.0
1C5C10C15C20C
Asc
orb
ic a
cid
(m
g/1
00
g D
W)
30.0
45.0
60.0
75.0
90.0
105.0
120.0
135.0
150.0
Time (days)
0 1 2 3 4 5 6 7
Ch
loro
phyl
ls (
mg
/g D
W)
4.0
6.0
8.0
10.0
12.0
14.0
16.0
18.0
20.0
Time (days)
0 1 2 3 4 5 6 7
'Opus' 'Leon'
LSD0.05 = 1.21 LSD0.05 = 1.19
LSD0.05 = 6.11 LSD0.05 = 7.19
LSD0.05 = 1.51 LSD0.05 = 1.02
Soluble solids (SSC), total ascorbic acid (AA) and total chlorophylls contents of snap beans stored at chilling (1 and 5°C) or non-chilling (10, 15 and 20°C) temperatures
When snap beans reach their minimum acceptable sensory quality, reductions in SSC and AA content are already considerable
Green snap
beans
Time (days)
0 2 4 6 8 10 12 14 16
Asc
orb
ic a
cid (
mg/1
00g d
ry w
eig
ht)
300.0
400.0
500.0
600.0
700.0
800.0
Time (days)
0 2 4 6 8 10 12 14 16
Qualit
y ra
ting (
1-5)
1.0
1.5
2.0
2.5
3.0
3.5
4.0
4.5
5.0
0C5C10C15C20C
Time (days)
0 2 4 6 8 10 12 14 16
Weig
ht lo
ss (
%)
0.0
1.0
2.0
3.0
4.0
5.0
6.0
7.0
8.0
Time (days)
0 2 4 6 8 10 12 14 16
SS
C (
% d
ry w
eight)
50.0
60.0
70.0
80.0
90.0
100.0
13 days shelf life @ 10C
4% weight
loss
42% reduction
in SSC
48% reduction
in AA
Papaya
More than visual/tactile indicators need to be considered in determining the shelf-life and limiting quality factors Modeling to predict shelf life
The ultimate goal of Modelling is to provide reliable predictions of occurrences that have not yet taken place, for any product, from any source and in any situation.” (Tijskens and Luyten, 2003)
3/12/2013
5
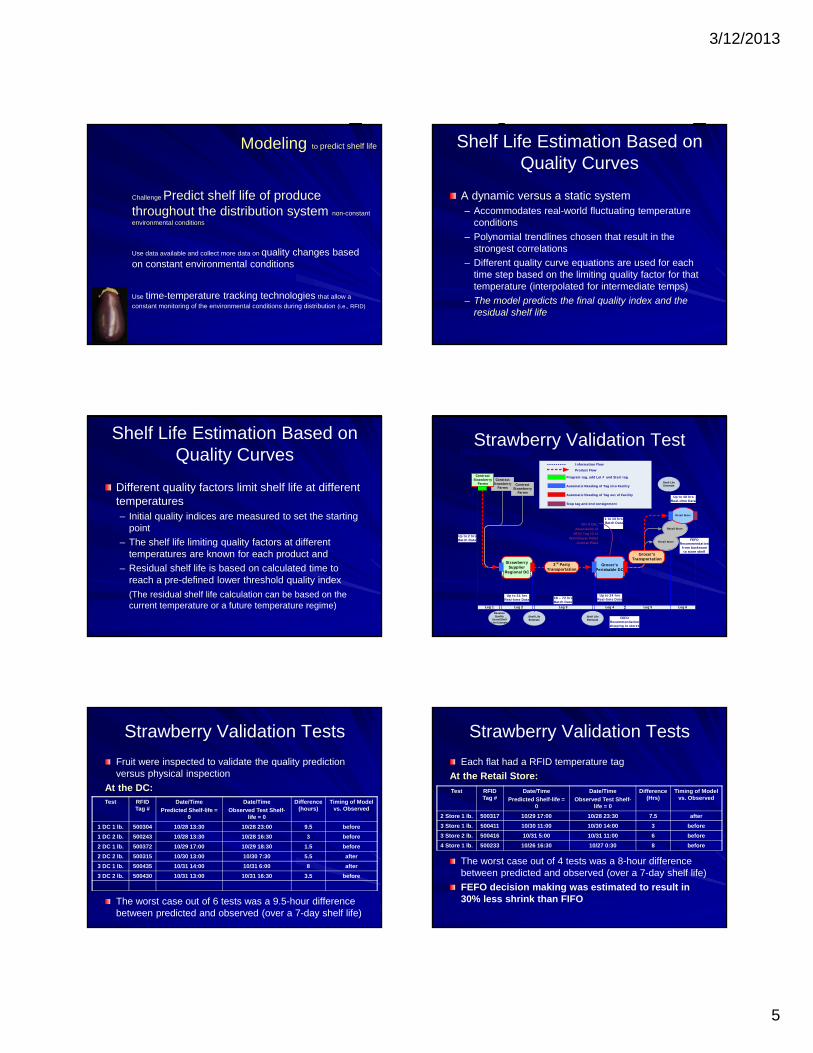
Modeling to predict shelf life
Challenge Predict shelf life of produce throughout the distribution system non-constant
environmental conditions
Use data available and collect more data on quality changes based on constant environmental conditions
Use time-temperature tracking technologies that allow a
constant monitoring of the environmental conditions during distribution (i.e., RFID)
Shelf Life Estimation Based on Quality Curves
A dynamic versus a static system– Accommodates real-world fluctuating temperature
conditions
– Polynomial trendlines chosen that result in the strongest correlations
– Different quality curve equations are used for each time step based on the limiting quality factor for that temperature (interpolated for intermediate temps)
– The model predicts the final quality index and the residual shelf life
Shelf Life Estimation Based on Quality Curves
Different quality factors limit shelf life at different temperatures– Initial quality indices are measured to set the starting
point
– The shelf life limiting quality factors at different temperatures are known for each product and
– Residual shelf life is based on calculated time to reach a pre-defined lower threshold quality index
(The residual shelf life calculation can be based on the current temperature or a future temperature regime)
Strawberry Validation Test
FEFORecommendation from backroom
to store shelf
Retail Store
FEFORecommendation shipping to stores
Contract Strawberry
FarmsContract
Strawberry Farms
Pilot Process Map
Contract Strawberry
Farms
Strawberry Supplier
Regional DC
Retail Store
Grocer’s Perishable DC
3rd Party Transportation
1 to 10 hrs Batch Data
Up to 48 hrs Real-time Data
Up to 24 hrs Real-time Data48 – 72 hrs
Batch Data
Up to 2 hrsBatch Data
Up to 24 hrs Real-time Data
Retail Store
CRITICAL: Association of RFID Tag ID to
Warehouse Pallet License Plate
Program tag, add Lot # and Start tag
Automatic Reading of Tag into Facility
Automatic Reading of Tag out of Facility
Stop tag and end consignment
Information Flow
Product Flow
Leg 1 Leg 2 Leg 3 Leg 4 Leg 5 Leg 6
Grocer’s Transportation
Baseline Quality
Score/Shelf Life Estimate
Shelf Life Estimate
Shelf Life Estimate
Shelf Life Estimate
Strawberry Validation Tests
Fruit were inspected to validate the quality prediction versus physical inspection
At the DC:
The worst case out of 6 tests was a 9.5-hour difference between predicted and observed (over a 7-day shelf life)
Test RFID Tag #
Date/Time
Predicted Shelf-life = 0
Date/Time
Observed Test Shelf-life = 0
Difference (hours)
Timing of Model vs. Observed
1 DC 1 lb. 500304 10/28 13:30 10/28 23:00 9.5 before
1 DC 2 lb. 500243 10/28 13:30 10/28 16:30 3 before
2 DC 1 lb. 500372 10/29 17:00 10/29 18:30 1.5 before
2 DC 2 lb. 500315 10/30 13:00 10/30 7:30 5.5 after
3 DC 1 lb. 500435 10/31 14:00 10/31 6:00 8 after
3 DC 2 lb. 500430 10/31 13:00 10/31 16:30 3.5 before
Strawberry Validation Tests
Each flat had a RFID temperature tag
At the Retail Store:
The worst case out of 4 tests was a 8-hour difference between predicted and observed (over a 7-day shelf life)
FEFO decision making was estimated to result in 30% less shrink than FIFO
Test RFID Tag #
Date/Time
Predicted Shelf-life = 0
Date/Time
Observed Test Shelf-life = 0
Difference (Hrs)
Timing of Model vs. Observed
2 Store 1 lb. 500317 10/29 17:00 10/28 23:30 7.5 after
3 Store 1 lb. 500411 10/30 11:00 10/30 14:00 3 before
3 Store 2 lb. 500416 10/31 5:00 10/31 11:00 6 before
4 Store 1 lb. 500233 10/26 16:30 10/27 0:30 8 before
3/12/2013
6
Conclusions
Tag accuracy varies for different temperatures (incorporate context-based accuracy in model)
Product temperature changes lag behind air temperature changes and are not uniform within a load
Use temperature mapping to relate air temperature measurements to product temperatures in different locations and to choose the (fewest) best tag locations
Consider all possible shelf life limiting quality factors over a wide temperature range for each specific product
A dynamic shelf life modeling system accommodates real-world fluctuating temperature conditions
Accurate determination of initial product quality is crucial
Thanks for your attention!
Questions?
~
Jeff Brecht: [email protected]
Cecilia Nunes: [email protected]
J.P. Emond: [email protected]
Ismail Uysal: [email protected]