Embed Size (px)
Citation preview

MASTER THESIS
PROJECT PORTFOLIO MANAGEMENT
USING CAPABILITY- BASED PLANNING
Yuchen Wang
S1518240 Master of Science in Business Information Technology
University of Twente
Enschede, The Netherland
Graduation committee:
Dr. Maria-Eugenia Iacob, University of Twente Dr. Ir. Marten. van Sinderen
Dr. Dick Quartel

Acknowledgement
This report is the result of my final project in Business & IT MSc program at the
University of Twente. I conducted this research as a graduate internship at
BiZZdesign B.V. After an intensive period, today is the day to write this note of
thanks as the finishing touch on my thesis. It has had a big impact on me to write this
thesis. Now, I would like to reflect on the people who have supported and helped me
throughout this period. Without them, this accomplishment would not be possible.
Firstly, I would like to give my deepest gratitude to my supervisors from the
University of Twente: Ms. Maria Iacob and Mr. Marten van Sinderen for their
valuable guidance, pointing me to the right direction so that I can complete my thesis.
I also want to sincerely thank Mr. Dick Quartel for all of the opportunities I was given
to conduct my research, and for the freedom of choosing my research topic that
provided an intense learning for me both in the scientific area and on a personal level.
Besides, a special note of thanks is extended to Ms. Adina Aldea for her insightful
comments on the thesis.
Secondly, I would like to thank my friend Tania. We were not only able to support
each other by deliberating over our problems and achievements, but also by talking
about things other than just papers.
Finally, I want to dedicate this thesis to my dearest parents and my boyfriend, Yi, for
their constant encouragement when I encountered difficulties.
Yuchen Wang
11/7/2016

Summary
In today’s dynamic environment, organizations have to modify their strategy and deal
with the ongoing project portfolios in a fast pace.
By using the technique of Capability-based planning, organizations could figure out
the capabilities with strategic importance and constitute the focal points of strategy
transformation; identify the gap by assessing the current and target states of the
capabilities; implement the strategy by closing the gap with corresponding working
packages.
Then, in order to ensure the strategy alignment of the project portfolios in a strategy
shift, a complete method is designed based on the CBP with a start from the business
strategy shift. The method goes through the determination of strategy capabilities shift
and affected ongoing projects, and concludes by supporting the project selections and
prioritizing.
The new method consists of three phases that respectively address what is the
organization current situation; which projects are impacted by the strategy shift; and
how the projects could be arranged. Then present organization ArchiPharma case to
demonstrate the method. The professionals have validated the important aspects of the
work in the thesis.

I
Contents
Contents ................................................................................................................................................ I
List of Tables .................................................................................................................................... IV
List of Figures .................................................................................................................................. VI
Chapter1: Introduction ............................................................................................................. 1
1.1 Problem Statements ...................................................................................................... 1
1.2 Research Objective......................................................................................................... 2
1.3 Research Question ......................................................................................................... 3
1.3.1 Main Research Question ..................................................................................... 3
1.3.2 Sub Research Question: ....................................................................................... 4
1.4 Research Scope ................................................................................................................ 4
1.5 Research Method ............................................................................................................ 4
1.5.1 Design Science Research Methodology ......................................................... 4
1.5.2 Literature Review .................................................................................................. 5
1.6 Research Structure ........................................................................................................ 6
Chapter2: Literature Review .................................................................................................. 7
2.1 Searching Strategy ......................................................................................................... 7
2.1.1 Searching Database ............................................................................................... 7
2.1.2 Inclusion and Exclusion Criteria ...................................................................... 7
2.1.3 Data Collection and Analysis ............................................................................. 8
2.1.4 Deviations ................................................................................................................. 8
2.2 Portfolio Management .................................................................................................. 9
2.2.1 Searching Process .................................................................................................. 9
2.2.2 Portfolio Management Definition ................................................................. 11
2.2.3 Project interdependencies .............................................................................. 13
2.2.4 PPM method .......................................................................................................... 15
2.2.4.1 Core Process Model in Portfolio Management (Padovani & Carvalho, 2016) ... 15
2.2.4.2 Project Portfolio selection process (Tavana, et al., 2015) .......................................... 18
2.3 CBP .................................................................................................................................... 20
2.3.1 Searching Process ............................................................................................... 20
2.3.2 Definitions ............................................................................................................. 21
2.3.3 CBP methodology with TOGAF and ArchiMate ....................................... 22
2.3.4 Relationships Between Capabilities ............................................................ 26
2.4 The IT4IT RA ................................................................................................................. 28
2.4.1 IT4IT RA Overview ............................................................................................. 28
2.5 The relationship between PM and CBP ............................................................... 30
Chapter3: Portfolio Management Method ...................................................................... 32

3.1 Overview ......................................................................................................................... 32
3.2 Phase A: Knowledge Mapping Phase ................................................................... 34
3.2.1 A1. Model the capability map and the strategy ....................................... 35
3.2.2 A2. Model the ongoing projects ..................................................................... 40
3.2.3 Recommendations .............................................................................................. 42
3.3 Phase B. Project Assessing ....................................................................................... 42
3.3.1 B1. Assess the ongoing projects .................................................................... 43
3.3.2 B2. Model possible solutions .......................................................................... 45
3.3.3 B3. Assess project strategy priority ............................................................. 48
3.3.4 Recommendations .............................................................................................. 53
3.4 Phase C. Portfolio Arranging ................................................................................... 54
3.4.1 C1. Build strategy implementation blueprint .......................................... 54
3.4.2 C2. Model the project dependencies ........................................................... 55
3.4.3 Recommendations .............................................................................................. 56
Chapter4: Case Study .............................................................................................................. 57
4.1 Introduction................................................................................................................... 57
4.1.1 Strategy Shift ........................................................................................................ 57
4.1.2 Ongoing Projects ................................................................................................. 58
4.2 Phase A: Knowledge Mapping ................................................................................ 60
4.2.1 Modelling capability map and strategies ................................................... 60
4.2.2 Map ongoing project. ......................................................................................... 66
4.3 Phase B: Portfolio Assessing ................................................................................... 68
4.3.1 Assess and adjust projects .............................................................................. 68
4.3.2 Propose projects to the capability that has no ongoing project
related 72
4.3.3 Projects Strategy Priority Score .................................................................... 75
4.4 Phase C: Portfolio Arranging ................................................................................... 76
4.4.1 Strategy implementation blueprint ............................................................. 76
4.4.2 Project Dependencies ........................................................................................ 77
Chapter5: Evaluation .............................................................................................................. 79
5.1 Survey .............................................................................................................................. 79
5.2 Discussion of the result ............................................................................................. 81
5.2.1 Background information .................................................................................. 81
5.2.2 Acceptance of the method ............................................................................... 82
Chapter6: Discussion and Conclusion .............................................................................. 85
6.1 Answers to Research Questions ............................................................................ 85
6.2 Contribution .................................................................................................................. 86
6.3 Research Limitation ................................................................................................... 87
6.3.1 Limitations of literature review .................................................................... 87
6.3.2 Limitations of the Proposed Method ........................................................... 87

6.3.3 Limitations according to the evaluation .................................................... 88
6.4 Recommendation for Future Work ...................................................................... 88
References ....................................................................................................................................... 90
Appendixes ...................................................................................................................................... 95
A. Alignment among constructs, indicators and its references of portfolio
management ............................................................................................................................... 95
B. Capability performance assessment framework (Cheng, 2015) ................... 98
C. Survey for the workshop .............................................................................................. 99
D. Survey result .................................................................................................................... 101

List of Tables
Table 1 Literature contributions in portfolio management .......................................... 10
Table 2 Definitions about portfolio management ........................................................ 12
Table 3 Activities in PPM construct model ................................................................. 17
Table 4 Definitions about Capability ........................................................................... 21
Table 5 Relationship types between capabilities ......................................................... 26
Table 6 Example of project portfolio backlog ............................................................. 30
Table 7 General view of knowledge mapping phase ................................................... 34
Table 8 Overview of step A1 ....................................................................................... 35
Table 9 Example of capability serving relationship matrix ......................................... 37
Table 10 Example of performance level of strategic capability .................................. 39
Table 11 Overview of step A2 ..................................................................................... 40
Table 12 Example of project dependency matrix ........................................................ 41
Table 13 Example of ongoing project card .................................................................. 42
Table 14 General view of project assessing phase....................................................... 43
Table 15 Overview of step B1 ..................................................................................... 43
Table 16 Example of anticipated performance level ................................................... 44
Table 17 Overview of step B2 ..................................................................................... 46
Table 18 Example of project dependency card ............................................................ 48
Table 19 Overview of step B3 ..................................................................................... 48
Table 20 Example of Strategy-Subgoal matrix ............................................................ 49
Table 21 Example of Goal-Capability matrix .............................................................. 50
Table 22 Example of identifying capability priority.................................................... 50
Table 23 Example of project contribution ................................................................... 51
Table 24 Example of identifying project priority ........................................................ 52
Table 25 General view of portfolio arranging phase ................................................... 54
Table 26 Overview of step C1 ..................................................................................... 54
Table 27 Overview of step C2 ..................................................................................... 55
Table 28 Example of blueprint card ............................................................................. 56
Table 29 Capability service relationship matrix .......................................................... 61
Table 30 Goal -subgoal matrix .................................................................................... 62
Table 31 Sub-goal capability matrix ............................................................................ 63
Table 32 Target performance level of the strategic capabilities .................................. 64
Table 33 Ongoing projects dependencies matrix ......................................................... 68
Table 34 Anticipate project contribution of billing process management ................... 69
Table 35 Anticipate project contribution of Regulatory analysis ................................ 71
Table 36 Project dependency card of Application Rationalization ............................. 71
Table 37 Gap analysis of capabilities without related ongoing projects ..................... 72
Table 38 Overview of proposed project Revision of PPM process ............................. 73
Table 39 Overview of proposed project Professionalize marketing ............................ 74

Table 40 Overview of proposed project product rationalization ................................. 74
Table 41 Overview of proposed project installment of APM process ........................ 74
Table 42 Overview of proposed project revision of billing process version A ........... 75
Table 43 Overview of proposed project revision of billing process version B ........... 75
Table 44 Project strategy priority ................................................................................ 75
Table 45 List of survey items use for estimating UTAUT (Venkatesh, et al., 2003) . 79
Table 46 Descriptive statistic of the result ................................................................... 82

List of Figures
Figure 1 DSRM process model (Peffers, et al., 2008) ................................................... 5
Figure 2 SLR process model (Sepúlveda, et al., 2016) .................................................. 6
Figure 3 Searching process of portfolio management ................................................. 10
Figure 4 Portfolio, program and project management interactions (PMI, 2013) ......... 14
Figure 5 PPM construct model .................................................................................... 15
Figure 6 Project selection process model (Tavana, et al., 2015) ................................ 18
Figure 7 Searching process of CBP ............................................................................. 20
Figure 8 The capability-based planning method (Papazoglou, 2014) ......................... 23
Figure 9 Motivation extension meta model (Aldea, et al., 2015). ............................... 24
Figure 10 Capability increment ................................................................................... 24
Figure 11 Relationships between “Strategy Elements”, “Motivation” and “Core
Elements” ..................................................................................................................... 25
Figure 12 Specialization of “Internal Behavior Elements”......................................... 25
Figure 13 Strategy mapping of “Centralize IS” (Aldea, et al., 2015). ......................... 26
Figure 14 Overview of relationships in ArchiMate 3.0 ............................................... 27
Figure 15 IT4IT RA level 1 framework version 2.0 .................................................... 28
Figure 16 Process of project portfolio backlog management ..................................... 29
Figure 17 Relationship between capabilities, EA, and projects................................... 30
Figure 18 Conceptual model of the method ................................................................. 32
Figure 19 Capability-based project portfolio management ......................................... 33
Figure 20 Process of Build/Update Capability Map .................................................... 36
Figure 21 Example of capability map ......................................................................... 36
Figure 22 Process of mapping the strategies to capabilities ....................................... 37
Figure 23 Example of strategy mapping ...................................................................... 38
Figure 24 Process of identifying the current and target performance level of
capabilities ................................................................................................................... 38
Figure 25 Capability dimensions ................................................................................. 39
Figure 26 Process of modeling ongoing project .......................................................... 40
Figure 27 Example of modeling ongoing project ........................................................ 41
Figure 28 Process to assess ongoing projects .............................................................. 44
Figure 29 Example of customer billing process related projects ................................. 45
Figure 30 Example of modeling proposed projects a .................................................. 46
Figure 31 Example of modeling proposed projects b .................................................. 47
Figure 32 Example of project strategy priority ............................................................ 53
Figure 33 Example of radar chart from a project perspective ..................................... 54
Figure 34 Example of strategy implementation blueprint ........................................... 55
Figure 35 Example of the projects dependencies ........................................................ 56
Figure 36 Previous Mission, vision, strategy of ArchiPharma .................................... 58
Figure 37 New strategy of ArchiPharma ..................................................................... 58
Figure 38 Realization relationship between plateaus and programs in ArchiPharma 58
Figure 39 Capability map of ArchiPharma .................................................................. 60
Figure 40 Strategy assessment of product leadership .................................................. 62
Figure 41 Sales & marketing management .................................................................. 63
Figure 42 Identified strategic capabilities .................................................................... 64
Figure 43 Identify ongoing project objectives ............................................................. 66
Figure 44 Link projects to capabilities ......................................................................... 67
Figure 45 Identified capabilities that relate to ongoing project ................................... 67
Figure 46 Ongoing project dependencies .................................................................... 68
Figure 47 Billing process management related ongoing project radar ........................ 69
Figure 48 Proposed projects of billing process management ...................................... 70
Figure 49 Capability radar of regulatory analysis ........................................................ 71
Figure 50 Proposed solution of regulatory analysis ..................................................... 72
Figure 51 project strategy priority chart ...................................................................... 76
Figure 52 Strategy implementation blueprint .............................................................. 77
Figure 53 Project dependencies ................................................................................... 78
Figure 54 UTAUT Research model (Venkatesh, et al., 2003)..................................... 79
Figure 55 Frequency of using CBP and PPM .............................................................. 81
Figure 56 Overview of average score and the standard deviation ............................... 83

1
Chapter1: Introduction
In this chapter, there are six sections generated to provide the general concepts of the
research:
1. Section 1.1 Problem Statements. It provides a concise description of the problems
that should be addressed in this research.
2. Section 1.2 Research Objectives. It describes the expected achievement of this
research.
3. Section 1.3 Research Question. It states the formulated research questions,
according to the research objective. This research involves one main question and
three sub questions.
4. Section 1.4 Research Scope. It defines the scope of this research, outlining the
limitations of the research and explaining the exclusion of the research.
5. Section 1.5 Research Methods. It illustrates the research methodology applied to
the research.
6. Section 1.6 Report Structure. It shows the general outlines of this thesis report.
1.1 Problem Statements
In early 2000s, people started to recognize the importance of applying portfolio
management. As “the art and science of making decisions about investment mix and
policy, matching investments to objectives, asset allocation for individuals and
institutions, and balancing risk against performance” (Investopedia, 2003), portfolio
management provides a central oversight of budget management. And it supports the
strategy alignment of the investments (Jeffery & Leliveld, 2004). What’s more,
portfolio management can help organizations to make the decisions that will set them
apart from competitors (Project Management Institude, 2012). Especially for the
large-scaled organizations, dealing with numerous portfolios in different stages
simultaneously is critical. Adopting a portfolio management approach could assist
them deflect the issues like projects run without delivering because of focus lacking;
or strategic targets could not be completely implemented by the deliveries because of
alignment lacking.
Nevertheless, the traditional portfolio management approaches seem to be no longer
enough. Nowadays, organizations are supposed to run their business in a dynamic
environment. Since rapid development brings an explosion of new technologies such
as mobile and cloud, turning out to be the tectonic shifts of lifestyle (Willmott, 2013).
Consequently, in order to remain competitive in the new-type industry, or even in the
new type ecosystem, organizations have to plan and change quickly to match

2
customers’ changing habits. Then, they need to keep adjusting their ongoing projects
to align with the latest strategy.
Without an appropriate approach, organizations have to face tremendous pressure of
technology transformation in today's fast-paced business world.
However, currently the portfolio management literatures have made little mention of
potential disturbances to the portfolios regarding to a strategic shift. Only the Project
Management Institute’s standard described two types of portfolio changes. One type
refers to periodical reviews of the portfolio performance “to ensure that the portfolio
contains only components that support achievement of the strategic goals. To achieve
this, components must be added, reprioritized, or excluded based on their
performance and ongoing alignment with the defined strategy in order to ensure
effective management of the portfolio” (Project Management Institute, 2008b, p. 77).
The other type relates to significant changes in the business environment leading to a
new strategic direction: “as environments inside and outside the organization change,
criteria for determining the composition and direction of the portfolio may also
change. When the need for new criteria becomes evident, the portfolio management
team needs to examine the current criteria in the strategic plan and move ahead with
appropriate changes, usually focusing first on categorizing. If strategic change is not
occurring, the efforts should focus on portfolio balancing” (Project Management
Institute, 2008b, p. 84). Nevertheless, it only mentioned why to change and what to
change about the portfolios. There are still no appropriate solutions to identify the
projects, which did not align with strategy or being disturbed due to the strategy shift.
Then organizations need an approach to remove the strategic deflection in the
portfolios by identifying, assessing, and adjusting the disturbed projects in the
portfolios.
1.2 Research Objective
Organizations need support quick identification, assessment and adjustment of
affected ongoing projects. Then, organizations could have a more effective portfolio
management. Therefore, it is essential to identify if the deliverables of the ongoing
project align with the strategy.
Researchers have proposed Capability-based Planning (CBP) methodology in order to
support the business IT alignment and suggested to apply this methodology in the
strategy management or enterprise architecture (EA) domains. The Open Group
summarized CBP as a versatile business planning paradigm that could assist in
aligning IT with the business and focus IT architects on the continuous creation of
business value (The Open Group, 2011). A series of studies conducted by Aldea et al.
made contributions to implement CBP in TOGAF framework and practiced the
method in the enterprise context (Papazoglou, 2014; Aldea, et al., 2015; Cheng, 2015).

3
According to the method, strategy is mapped into a set of capabilities. Besides, they
adopted approaches like capability heat map and capability maturity assessment to
quantify the current and target capability performance.
Moreover, the Open Group currently released a new framework the IT4IT reference
architecture (IT4IT RA) for supporting the business management of IT. The
framework provides a blueprint that organization could design and organize
transformations via value streams that support the continuous measurement of
portfolio’s business value. It has a strong connection with the stakeholders (The Open
Group, 2015).
Therefore, the main purpose of this paper is to investigate and develop a method that
integrates the Capability-based Planning (CBP) into portfolio management: strategy
alignment throughout the organization transformation. We use CBP in the new
method because CBP has been adopted by organizations to support the strategy
alignment (Azevedo, et al., 2015). With the capability standing in between, strategies
could be turned into portfolios accurately.
What’s more, since the IT4IT is a standard architecture from the open group to enable
the supporting functions like financial tracking of the projects and it is as a vender
neutral model, which means that most of organizations could refer it without vendor
limitations. We also plan a literature review of the IT4IT to identify if it could help to
optimize the project portfolio management method.
There are limitations that may also undermine the objective of the proposed research.
One limitation in the research is the vast variations between organizations in terms of
size: The proposed method may not be a proper method to support medium- and
small- sized organizations because of their simple organization structure. They could
easily identify if the project aligns with the strategy. Besides, the details of how to
propose or adjust project will be simplified in this research, as they are not the
emphases.
1.3 Research Question
1.3.1 Main Research Question
According to the determined problem and its corresponding research goal, the main
research question is defined as:
How to support effective portfolio management using the
Capability-based Planning in a dynamic environment?

4
In order to provide a comprehensive solution, the main research question is separated
into sub research questions, which are shown as the following section 1.3.2.
1.3.2 Sub Research Question:
The new method needs to adopt some mechanisms from CBP. Thus, it is necessary to
have a better insight of the portfolio management and CBP separately. Then with the
knowledge of these elements, the new model could be optimized with the useful
mechanisms. In general, two sub questions are identified as:
RQ1: What is the relationship between portfolio management and CBP?
RQ2: How could CBP help to optimize portfolio management?
1.4 Research Scope
The new method proposed here could be applied in the process of portfolio
management, analyzing the dependency relationships within the new strategies and
the ongoing portfolios in order to support adjustment, integration to optimize the
transformation process in a dynamic situation.
In order to support the portfolio integration and management process iteration, in this
research, it is assumed that portfolio management might not only monitor changes,
but might also manage and control changes and track the implement processes. It is
therefore suggested that the existing processes be supplemented with additional
empirical information.
1.5 Research Method
1.5.1 Design Science Research Methodology
For this research project, to design a successful method is crucial to arrange the
design process within a scientific research. Therefore, this research mainly follows the
Design Science Research Methodology (DSRM) guidelines (Peffers, et al., 2008)
which is frequently cited for developing new methods. Design Science offers an
effective means of addressing the relevancy gap that has plagued academic research,
particularly in the management and information systems disciplines. The type of
“wicked organizational problems” could be more effectively addressed using a type of
paradigm shift offered by design science. (Hevner & Chatterjee, 2010)
The research approach of this thesis includes the following steps: problem
identification and motivation, define the objectives for a solution, design and
development, demonstration, evaluation, and communication that is shown in Figure
1 (Peffers, et al., 2008):

5
Figure 1 DSRM process model (Peffers, et al., 2008)
In the DSRM Process Model, there are six key activities processed in this research.
These key activities are:
Problem Identification and Motivation: In this phase, the research problems
will be identified. Formulate the research questions of this thesis and relate
them to the problem statement and the motivation of this research and problem
identification is described in chapter 1.
Define the objectives for a solution: The next step is to define the objectives of
the solution. It is based on the defined problem and the studies of previous
literatures. It will be documented in chapter 2
Design and development: Depending on the literature review, the solution will
be developed. The method for will be designed in chapter 3.
Demonstration: After the method has been designed and developed, the
usability of it should be demonstrated by solving one or more problems. This
could be done by the experimentation, simulation, cased study, or other
appropriate activity. Case study will be carried and described in chapter 4.
Evaluation: To measure how well the method supports the solution of the
defined problems. This step aims at comparing the objectives of the solution to
the result from the use of the method, which will include the interview of the
experts in this area. This part will be described in chapter 5.
Communication: The communication step would be done in the end after the
thesis is published and the thesis defense would be finished.
Within the design process, there is also an iteration arranged from “Define the
objectives” to “Communication” if necessary.
1.5.2 Literature Review
Another method that adopted in this research is a systematic literature review method
in order to answer sub research question one. It follows the proposed guidelines

6
(Kitchenham, 2004; Kitchenham & Charters, 2007). Although both guidelines are
applied in software engineering area, they have been still widely adopted in the
various literature reviews because of their essentials, generic and valid principles.
Consequently, the guidelines are adopted in this systematic review as well.
The processes of each phase are shown in Figure 2 that generated by Sepúlveda,
Cravero & Cachero (2016) and adapted from Kitchenham and Charters (2007). From
the figure, all the steps are managed into three phases: planning, conducting and
reporting.
In the report, the literature review presented in Chapter2: with the searching process
and searching result.
1.6 Research Structure
The main body of the research report consists of 6 chapters in order to illustrate the
whole processes of defining the method. The identification of the research problem
and the motivation behind are defined in Chapter 1 (Introduction). Then in Chapter 2,
the summary of the literature review about the important concepts and techniques is
given. Furthermore, in Chapter 3, the development of the new method is clarified with
the explanation. Chapter 4 demonstrated the method with a case study. The evaluation
of the method is presented in Chapter 5 using workshop and questionnaires. Finally,
Chapter 6 comprises the research with the conclusion and results of the entire research
questions.
Figure 2 SLR process model (Sepúlveda, et al., 2016)

7
Chapter2: Literature Review
In this chapter, a systematic literature review is generated. The result can be used to
support the design of the new method and it could also be adopted as a reference for
the future corresponding research. The chapter is structured with five sections.
Section 2.1 introduces the searching strategy of the review. Then the following
section 2.2, 2.3 and 2.4 present the result and discussion of the review; and a brief
conclusion of the whole literature review is structured in the last section, section 2.5,
as the answer to RQ1.
2.1 Searching Strategy
2.1.1 Searching Database
All the selected literatures in this literature review are from the following 4 databases:
Scopus (https://www.scopus.com/)
UT Library (https://www.utwente.nl/ub/en/)
Google Scholar (https://scholar.google.nl/)
ScienceDirect (http://www.sciencedirect.com/)
The defined searching strings are firstly applied in the databases Scopus and
ScienceDirect. Two more databases (UT Library and Google Scholar) are adopted to
support 1) search the articles from the bibliographic references of the selected
literature and 2) searching for extra articles since there is just a few articles
determined in Scopus and ScienceDirect.
2.1.2 Inclusion and Exclusion Criteria
Defining criteria could assist to search and screen the candidate articles. The criteria
are broadly grouped into two categories: inclusion criteria and exclusion criteria.
The inclusion criteria are composed of:
Articles that published since Jan 1st, 2000;
Scientific Reports i.e. literature with clearly defined research questions, search
process, data extraction and data presentation from academic publications;
Grey Literatures i.e. survey reports or white papers from top consultant
companies or published books.
There are two reasons leading gray literature involved as an inclusion criterion. Firstly,
it is due to the insufficient amount of the scientific literatures, since both the IT4IT

8
RA and CBP are new topics in the research. Secondly, although some published
books and white papers from top consulting companies are not documented
completely in a scientific way, they are still widely cited by scientific literature, which
confirms their academic ability.
Exclusion Criteria:
Duplicate reports (the article exist in different journals with a complete
version of the study has been included in the review).
Articles from a non-academic digital magazine, blogs or newspaper.
2.1.3 Data Collection and Analysis
Following data should be extracted from each included article:
The source (journal or conference) and full reference, which contributes to
retrieve key literature.
Classification of the article Type (i.e. SLR, Meta-Analysis MA, book), which
supports the quality assessment of the literature review.
Main topic area, which provides needed information for answering research
questions.
The author(s), their institution and the country where it is situated, which also
supports the quality assessment of the literature review.
Summary of the study.
From the extracted data, the analysis is arranged according to the research questions
and research process. Besides, for addressing quality assessment, the affiliations of
the authors and their institutions need to be reviewed and justify whether the selected
study help to answer the research questions.
2.1.4 Deviations
Deviations in the search strategy are necessary in order to make the systematic
literature review feasible. Either a great or an insufficient number of findings might
make completion of the study impossible.
Combining the three sets of entry terms (“portfolio management”, “capability based
planning”) resulted in 0 articles in all databases. Thus, the searching process is
arranged for these three elements separately. Besides, the individual search for
“portfolio management” returned more than 7000 results. Thus the search was
performed again with some extra constraints (either title or keywords of the literature
should contain “portfolio management”). Moreover, to include the articles that not

9
recorded in the selected databases, an extra step to screen the references of the key
literature.
The searching process performed for each string could be concluded as:
Step 1. Initial searching. The defined searching string is firstly applied in the
databases Scopus and ScienceDirect, meeting the inclusion criteria.
Step 1.2. Extra searching (Optional). Search the defined string in the
databases Google Scholar and UT Library if the individual search returns less
than 50 results.
Step 2. Articles Screen:
Step 2.1(Optional). The result articles are firstly excluded with extra
constrains if the individual search returns more than 500 results.
Step 2.2. The filtered articles are excluded by scanning the title and the
abstract.
Step 2.3. The filtered articles are excluded by viewing the whole context.
Step 3. 2nd round searching:
Step 3.1. Review the bibliographies of the selected articles
Step 3.2. Search the articles in Google Scholar and UT Library by their titles
and authors.
2.2 Portfolio Management
2.2.1 Searching Process
The searching string is defined as “portfolio management” and initial searching
results of ScienceDirect and Scopus are:
1438 results found for pub-date > 1999 and ("portfolio management").
6235 results for KEY (portfolio management) AND DOCTYPE ( ar )
Then, the extra constrains are applied that limited key words should be contained in
the title and abstract. Thus, the new searching query as applied in ScienceDirect.com
and Scopus in April, 2016 is:
450 results found for pub-date > 1999 and TITLE (portfolio management)
or KEYWORDS (portfolio management).
98 document results for TITLE-ABS KEY (portfolio management) AND
DOCTYPE ( ar ) AND PUBYEAR > 1999 AND (LIMIT-
TO (EXACTKEYWORD, "Portfolio management") ) AND (LIMIT-TO
(EXACTKEYWORD, "Project management")

10
The whole searching process of this section is illustrated as Figure 3 below with the
action and the result of the filtered articles.
After the screening process, there are 18 articles selected as the key literatures on
portfolio management in this study. The Table 1 lists the selected articles and shows if
it could provide the information about definitions and models.
Table 1 Literature contributions in portfolio management
# Literature Definition Model
1 (Tavana, Keramatpour, Santos-Arteaga, &
Ghorbaniane, 2015) √
2 (Investopedia, 2003) √
3 (Jeffery & Leliveld, 2004) √ √
Articles excluded by the abstract
(n = 31)
Articles excluded after full text scanning
(n = 9)
Articles excluded by constrains
(n = 6783)
Total articles retrieved by the search strategy (n = 7673)
Articles retrieved with extra constrains
(n = 548)
Articles selected after title reading (n = 51)
Articles selected after abstract reading (n = 20)
Articles excluded by title (also duplication)
(n = 497)
Articles retrieved on the bibliographic references if the selected articles
(n = 7) Articles selected as key literatures (n = 18)
Articles selected after full text scanning
(n = 11)
Figure 3 Searching process of portfolio management

11
4 (Padovani & Carvalho, 2016) √ √
5 (Pajaresa & Lopeza, 2014) √ √
6 (Project Management Institute, 2013) √
7 (Petit, 2012) √
8 (Martinsuo, 2013) √
9 (Killen & Kjaer, 2012) √ √
10 (Heising, 2012) √ √
11 (Melton, 2011) √
12 (Young & Conboy, 2013) √
13 (Amaral & Araujo, 2009 ) √ √
14 (Bitman, 2005) √
15 (Archer & Ghasemzadeh, 1999) √
16 (Bodenstaff, Quartel, & Lankhorst, 2014) √ √
17 (Bodenstaff & Quartel, 2014) √ √
18 (Patanakul P. , 2015) √
In the following sections, the literature review result of portfolio management is
expounded with details from three perspectives. Firstly, a comparison of the relevant
term definitions is presented in section 2.2.2. Then, in section 2.2.3, we illustrate the
importance of project dependency relationship. At last, the process of portfolio
management is exemplified with three proposed models selected from these key
literatures, which is in section 2.3.4.
2.2.2 Portfolio Management Definition
According the definition from the book Real Project Planning (Melton, 2011) the
terms project, portfolio and program are used to describe specific activities:
Project: is a bounded piece of work which is non-routine for the organization. It is
not a part of business as usual (BAU) but has a defined start and end point (when it is
integrated into BAU).
Program: is a set of interdependent projects working together to achieve a defined
organizational goal. There is dependency between project outputs/benefits.
Portfolio: is a collection of projects using a common resource pool. These resources
could be assets, people or funding.
Apart from Melton, Project Management Institute (PMI) also provides a series of
definitions, which involve:

12
Project: is a temporary endeavor undertaken to create a unique product, service, or
result.
Program: is a group of related projects, subprograms, and program activities that are
managed in a coordinated way to obtain benefits not available from managing them.
Portfolio: means projects, programs, sub portfolios, and operations managed as a
group to achieve strategic objectives.
project management: is the application of knowledge, skills, tools, and techniques to
project activities to meet the project requirements.
program management: is the application of knowledge, skills, tools, and techniques
to a program to meet the program requirements and to obtain benefits and control not
available by managing projects individually.
portfolio management: is the centralized management of one or more portfolios to
achieve strategic objectives.
And according to the data collection of the literature review, the definitions of the
relevant terms in portfolio management are listed as Table 2:
Table 2 Definitions about portfolio management
# Literature Definition Term
1 (Investopedia, 2003)
portfolio management: is the art and science of making decisions about investment mix and policy, matching investments to objectives, asset allocation for individuals and institutions, and balancing risk against performance.
2 (Jeffery & Leliveld, 2004)
IT portfolio management: is managing IT as a portfolio of assets similar to a financial portfolio and striving to improve the performance of the portfolio by balancing risk and return.
3 (Padovani & Carvalho, 2016)
portfolio management: is a dynamic decision process that deals with multiple goals (Cooper, Edgett, & Kleinschmidt, 2001) reflecting internal and external stakeholders’ perspectives (Beringer, Jonas, & Kock, 2013), encompassing strategic considerations and adaptability to internal and external changes (Patanakul P. , 2015), resulting in a dynamic and uncertainty decision-making process. project portfolio management: Project portfolio management is an emerging aspect of business management that focuses on how projects are selected, prioritized, integrated, managed and controlled in the multi-project context that exists in modern organizations (Young & Conboy, 2013)
4 (Pajaresa & Lopeza, 2014)
project portfolio management: can be considered as a managerial approach for helping firms to obtain corporate objectives more efficiently.
5
(Project Management Institute, 2013)
project management: The application of knowledge, skills, tools, and techniques to project activities to meet the project requirements. program management: The application of knowledge, skills, tools, and techniques to a program to meet the program requirements and to obtain benefits and control not available by managing projects individually. portfolio management: The centralized management of one or more portfolios to achieve strategic objectives.
6 (Killen & Kjaer, 2012)
project portfolio management: Project portfolio management is central to many organizations' strategic processes and requires consideration of multiple factors and the ability to envision alternative future consequences to support strategic project portfolio decision making.

13
7 (Heising, 2012)
project portfolio management: can be considered as the simultaneous management of the collection of projects that make up an investment strategy of a company (Artto & Dietrich, 2004; Levine, 2005; Patanakul & Milosevic, 2009)
8 (Amaral & Araujo, 2009 )
project portfolio: is defined as a group of projects that compete for scarce resources and are conducted under the sponsorship or management of a particular organization. (Archer & Ghasemzadeh, 1999)
9
(Bodenstaff, Quartel, & Lankhorst, 2014)
enterprise portfolio management: is an integrated portfolio management approach that tightly manages strategy planning against the various portfolios of interdependent assets, like product portfolios and project portfolios.
10 (Bodenstaff & Quartel, 2014)
application portfolio management: is a management approach that allows structuring large IT landscapes by grouping applications (e.g. based on functionality or dependency) into portfolios which are then managed as a whole.
The series definitions of portfolio management provided by Project Management
Institute (PMI) and the project portfolio management definition from Young &
Conboy (2013) are adopted. This is a conscious decision for two reasons. First,
according to the cited number, these definitions have been widely adopted by other
literature (Petit, 2012; Martinsuo, 2013; Young & Conboy, 2013; Abrantes &
Figueiredo, 2015; Patanakul P. , 2015). The definition proposed by Young & Conboy
also referred the definition from PMI. Secondly, PMI provides the most
comprehensive definitions in its lexicon (Project Management Institute, 2015) with
the context of portfolio management.
2.2.3 Project interdependencies
Although in this model, shown projects are independent entity groups (no
interdependence among projects). It has been proved that interdependencies may exist
between project resources in the organization which has large scale and requires
dozens of projects (Melton, 2011). What’s more, the increasing importance of
acknowledging project interdependencies has also been widely accepted (Stummer &
Heidenberger, 2003; Dahlgren & Soderlund, 2010; Killen & Kjaer, 2012). Thus,
organizations have to identify the dependent relationships between projects in order to
make optimal decisions for providing the best outcomes.
Horizontal relationship
The dependency relationship could be identified “when the success of a project
depends upon other project(s)” (Killen & Kjaer, 2012). In the research, several
examples are shown to describe project interdependencies from different perspectives.
Some interdependencies rise due to the limitation of common resources in two
projects that one could not start until the resources released from the other one. This
kind of interdependencies may disappear while the resources are enough to support
both projects. Besides, there is no strict order limitation (project a could be
implemented before project b and vice versa). Apart from resource interdependencies,
there are also outcome dependencies and learning dependencies. A project has the
14
need of the outcome or the knowledge that provided by another project. For these
interdependencies, the project implementation should be strictly scheduled otherwise
a project may have to pause and wait for the knowledge or outcome from another
project.
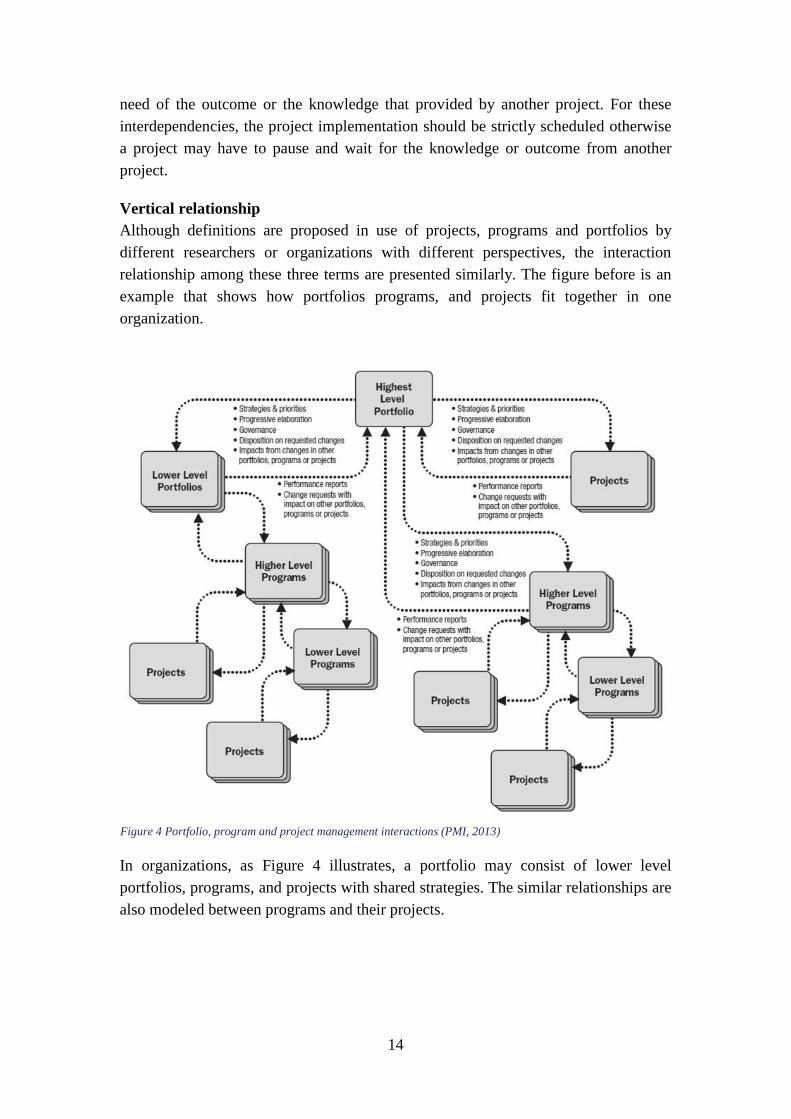
Vertical relationship
Although definitions are proposed in use of projects, programs and portfolios by
different researchers or organizations with different perspectives, the interaction
relationship among these three terms are presented similarly. The figure before is an
example that shows how portfolios programs, and projects fit together in one
organization.
In organizations, as Figure 4 illustrates, a portfolio may consist of lower level
portfolios, programs, and projects with shared strategies. The similar relationships are
also modeled between programs and their projects.
Figure 4 Portfolio, program and project management interactions (PMI, 2013)

15
2.2.4 PPM method
In this section, three process models are illustrated. The first one is a construct model
about the core processes involved in portfolio management. The other two models put
more emphases on the process of project selection.
2.2.4.1 Core Process Model in Portfolio Management (Padovani & Carvalho, 2016)
A construct model of project portfolio management is proposed in one of the latest
researches (Padovani & Carvalho, 2016). In the literature, authors identified the core
processes in project portfolio management. And validated the model using a survey-
based research. Besides, they also did an investigation for the relationship between
project portfolio management and enterprise performance. And the result shows a
strong significant and positive relationship between the process of project portfolio
management and performance.
Figure 5 PPM construct model
According the literature review, (Padovani & Carvalho, 2016) extracted the processes
in the portfolio management and concluded as construct model shown in Figure 5. In
the figure, the construct model consists of three parts. The first part in the top is the
“knowledge about the organizational context (KOC)”. As the knowledge base, it
drives the decision-making of portfolios and it is essential for supporting the portfolio

16
management alignment. The emphases are put on both the external environment and
internal context.
The second part located in the middle shows needed processes in project portfolio
management. There are two preparation activities decision criteria (DC) - to identify
the criteria for decision making and Resources Allocation(RA) - to investigate the
allocable resources. They are quite essential since they are the key to support the
activities that require decision making. The needed inputs of these two activities are
from the top level. Thus, they are also the key to insure the strategy alignment. Apart
from Decision Criteria and Resources Allocation, there are also relevant activities of
proposing, evaluating, selecting and arranging projects.
The last part in the bottom of the figure is the project portfolio management
infrastructure (PPMI) block. It consists of three main activities which are information
technology infrastructure, project management maturity and project management
structure. They are emphasized since they do affect the success of both project
portfolio management and projects themselves. A brief description of each block
composing the suggested model together with each one of their corresponding
activities is presented in Table 3.
Apart from this construct model, there is also a comprehensive literature review result
showing the indicators of each key element in the construct model with their
corresponding references structured in Appendix A.
The second part located in the middle shows needed processes in project portfolio
management. There are two preparation activities decision criteria (DC) - to identify
the criteria for decision making and Resources Allocation(RA) - to investigate the
allocable resources. They are quite essential since they are the key to support the
activities that require decision making. The needed inputs of these two activities are
from the top level. Thus, they are also the key to insure the strategy alignment. Apart
from Decision Criteria and Resources Allocation, there are also relevant activities of
proposing, evaluating, selecting and arranging projects.
The last part in the bottom of the figure is the project portfolio management
infrastructure (PPMI) block. It consists of three main activities which are information
technology infrastructure, project management maturity and project management
structure. They are emphasized since they do affect the success of both project
portfolio management and projects themselves. A brief description of each block
composing the suggested model together with each one of their corresponding
activities is presented in Table 3.

17
Table 3 Activities in PPM construct model
Block Activity Description
Knowledge of the organizational context (KOC)
Stakeholders Expectations
Existence of a formal planning process, reflecting internal and external stakeholder’s perspectives
Constraint Capability Uncertainties
It is necessary to have a certain knowledge about the constraints, capabilities, uncertainties information about the organization.
Organizational Strategy Have strategic performance measure systems
Main Portfolio Management Process
Decision Criteria (DC) Identify the Criteria for: individual project evaluation project selection and prioritization
Resource Allocation (RA) Identify the resource to be allocated
Opportunity Identification (OI)
Provide a global vision of the entire portfolio of projects with brief information of the candidate proposals (scope, objective, value, earnings, market etc.)
Classification (CL) Consists of the projects classification used to compare similar projects so that the budget can be allocated to projects according to classification. Besides, projects with the same classification are compared and may have concurrent resources that could support the resources management.
Balancing (BAL) Balance the criteria (e.g. investment and outcome) to align the project portfolio with the organization's strategy.
Selection. Prioritization. Optimization and Sequencing (SPOS)
In the research, Selection, prioritization, optimization and sequencing are grouped together. Optimization is to consider resource limitations as a constraint in the analysis of which and how many projects an organization should approve for a given period. Optimization tools are used in allocation resources and prioritization of projects Tools or models could be adopted in these activities
Approval (APP) Set the gateway to support formal approval process of projects in the enterprise.
Formation of Portfolio (FP)
This step is suggested by PMI (Project Management Institute, 2013). It allows multi-project level to conduct the approved portfolio and it provides the planning of projects in the portfolio.
Evaluation (EV) The project evaluation is set for reviewing the ongoing projects in the portfolios. The study shows the literature review result that the key performance indicators of projects in this step should include: a) The alignment of the project with the organization's strategic plan; b) Compare the projects to each other and compete for the same resources.
Project Portfolio Management Infrastructure (PPMI)
Project Management Infrastructure (PMO)
Influence of the types of PMO on portfolio management
Information Technology Infrastructure (IT)
Impact of the use of IT on project success
Project Management Maturity (OPM)
The OPM selected in the model because the maturity stage of project management in an organization will affect the performance of the strategy implementation.

18
Apart from this construct model, there is also a comprehensive literature review result
showing the indicators of each key element in the construct model with their
corresponding references structured in Appendix A.
2.2.4.2 Project Portfolio selection process (Tavana, et al., 2015)
The study from Tavana, et al. (2015) proposed a three-stage hybrid method for the
project selection in the portfolio management with a process model described in the
paper. The proposed method integrates the models fuzzy TOPSIS (the technique of
order preference by similarity to ideal solution), DEA (data envelopment analysis) for
multiple criteria decision making in order to make the framework more structured and
systematic. And the scope of this framework covers the processes from project
creation to the final project selection in the portfolio management.
The three-stage approach introduced in the study is described in Figure 6. The
framework is composed of three main phases involving: a preparatory stage, a project
evaluation stage, and a portfolio selection stage. The first phase is the preparatory
Figure 6 Project selection process model (Tavana, et al., 2015)

19
stage aiming to prepare the needed resources for the further processes. This phase
consists of three steps:
P1. Identify the decision maker(s). This step is to identify the relevant stakeholders
as decision makers.
P2. Identify objectives, priorities, initial constraints, and thresholds. Step 2 is
arranged to formulate the required information in the portfolio management.
P3. Identify evaluation criteria. The last step in phase 1 is to identify the criteria for
the later projects evaluation.
After phase 1, following phase 2 is also a preparation of the project selection, but
phase 2 puts emphases on the projects themselves by identifying project evaluation.
E1. Identify and screen projects. In this step, the inefficient projects should be
figured out and screened.
E2. Homogeneity Projects. Step 2 is arranged as a gateway. In this step, the decision
makers selected in step P1 should check if all projects are homogeneously classified.
There are two options: move to E4 directly if all projects are homogeneously
classified, or proceed to next step E3 if there still projects need to be classified.
E3. Classify projects to reach homogeneity. According to the literature, projects
could be classified by different criteria like research and development criteria, project
size, project time, technology type. The classify criteria are identified by decision
makers.
E4. Measure attributes & E5. Determine weights for attributes. These two steps
are arranged to measure each project’s value based on various criteria.
E6. Satisfaction with the scores and weights. E6 is a gateway to ensure the
satisfaction with the weights and scores. Otherwise, steps E4 and E5 will be iterated
until getting the approvals.
E7. Evaluate projects. The step is to evaluate the projects based on fuzzy TOPSIS
and produce a ranked list of the projects.
E8. Identify the augmented scores. The step aims at strengthening the consistency
between the results obtained from the linear IP model applied in the portfolio
selection stage.
The last phase is to select the projects, which includes the following steps:
S1. Constraints and portfolio’s preferences determination in this period. In S1,
the DMs decide to remove or add constraints.
S2. Form the portfolios that satisfy this period’s objectives and constraints: a
large number of project portfolios can be created, particularly when the number of
constraints is low.
S3. Calculate the relative weights and scores for each portfolio. The DMs can
consider new weights for the criteria after creating the feasible models.

20
S4. Check satisfaction with the scores and weights. In the gateway, the DMs
review the criteria weights and the portfolio score to ensure their satisfaction.
S5. Perform portfolio evaluation and make a provisional decision. The DMs select
portfolios that are higher in the rank as a temporary decision. If the group agrees,
continue to the next step; otherwise, return to steps S1 to S4.
S6. Apply sensitivity analysis and make a final decision about the project
portfolio. In this step, measure the effect on the model results caused by a change in
the variables. If a small shift leads to a significant change, the DMs must agree on
whether to keep the current portfolio or make a new decision.
2.3 CBP
2.3.1 Searching Process
The searching queries as “capability based planning” applied in ScienceDirect.com
and Scopus in April, 2016 are:
Figure 7 Searching process of CBP
Articles excluded by the abstract
(n = 5)
Articles excluded after full text scanning (n = 4)
Total articles retrieved by the search strategy (n = 43)
Articles selected after title reading
(n = 11)
Articles selected after abstract reading (n = 6)
Articles excluded by title (also duplication) (n = 32)
Articles retrieved on the bibliographic references if the selected articles (n = 4)
Articles selected as key literatures
(n = 6)
Articles selected after full text scanning (n = 2)

21
Search results: 23 results found for pub-date > 1999 and ("capability based
planning").
20 results for TITLE-ABS-KEY (“capability based planning”) AND DOCTYPE (ar
OR re) AND PUBYEAR > 1999 AND (LIMIT-TO (DOCTYPE, “ar”))
The searching process of this section is illustrated as Figure 7 with the action and the
result of the filtered articles.
2.3.2 Definitions
In Oxford Dictionary, a capability is simply defined as “the power or ability to do
something”. However, this definition is over general for specific usages. Then, the
Open Group defined “capability” in the context of enterprise architecture:
“An ability that an organization, person, or system possesses. (The Open Group,
2011)”
In the TOGAF book, “capabilities are expressed in general and high-level terms and
typically require a combination of organization, people, processes, and technology to
achieve, for example, marketing, customer contact, or outbound telemarketing” (The
Open Group, 2011). Besides, from its context, capabilities are also able to be
subdivided as pure business capabilities such as Process Claim or Order Management
or as technical capability such as Service Mediation. The study of Papazoglou (2014)
collected the definitions of the capability- related terms. The following Table 4 lists
some of the definitions with the corresponding literature.
Table 4 Definitions about Capability
# Literatures Definition
1 (The Open Group, 2011)
Capability: is an ability, capacity or potential that an organization, person or system possesses. Capabilities are typically expressed in general and high-level terms and typically require a combination of organization and different assets (e.g. people, processes, and technology) to be achieved and thus realize their goal.
2. (Azevedo, et al., 2015)
Capability: is an ability to employ resources to achieve some goal.
3 (Burton, 2013); (Bredemeyer et al., 2003)
Business capabilities are the ways in which enterprises combine resources, competences, information, processes and their environments to deliver consistent value to customers. They describe what the business does and what it will need to do differently in response to strategic challenges and opportunities.
4 (Brits et al., 2006); (Henry, 2011)
Strategic business capabilities are the business capabilities that offer a competitive advantage to the organization by being better than those owned by the organization’s competitors and by being difficult to imitate or replicate and that also contribute in shaping and realizing the organization’s business strategy.
5 (Acha, 2000); (Kim, 1999)
Technological capability is the ability of an organization to make use of technological know-how through identification,

22
appraisal, utilization and development. 6 (Alizadeh, 2012) Strategic technological capability is the generic knowledge intensive
ability to jointly mobilize different scientific and technical resources which enables a firm to successfully develop its innovative products and/or productive processes, by implementing competitive strategy and creating value in a given environment.
7 (Helfat, 2003); (O’Regan & Ghobadian, 2004)
Organizational capability refers to the organizational ability to perform a coordinated task, utilizing organizational resources (tangible, intangible and personnel-based), for the purpose of achieving a particular end result in order to improve performance.
There have been literatures identifying business capability modeling as an essential
element and stating that capabilities are applied in the large variety of tasks in EA
management (Barroero, 2010; Brits & Botha, 2007; Klinkmuller et al., 2010; Weber
& Schmidtmann, 2008).
2.3.3 CBP methodology with TOGAF and ArchiMate
The Open Group apply CBP in the context of EA, and define it as:
“a business planning technique that focuses on business outcomes, dealing with the
planning, execution and delivery of the target strategic business capabilities.”
The need for CBP in the context of organizations has become more apparent in the
recent years. From an Enterprise Architecture and IT perspective, CBP is a powerful
mechanism to ensure that the strategic business plan drives the enterprise from a top-
down approach (The Open Group, 2011).
From the definition, we can see that CBP could serve as an approach for translating
strategy into action. From the study of Papazoglou(2014), proposed a method for
implementing CBP in TOGAF framework and Cheng(2015) practiced the method in
the enterprise context. The method is proposed to formulate the strategy into a set of
capabilities with defined input and output.
Figure 8 shows the CBP method proposed by Papazoglou(2014). It can be used in
collaboration with TOGAF and modeled with ArchiMate for identifying, planning
and implementing the strategies.

23
Figure 8 The capability-based planning method (Papazoglou, 2014)
After one year, Aldea, et al. developed their CBP methodology based on the research
of Papazoglou(2014) with three main activities, Map Capabilities, Assess Capabilities,
and Plan capability increments. Thus, the new CBP methodology can be used
separately from other domains such as strategic management or EA, but also in
collaboration with these domains. As described, the new CBP methodology follows
the guidelines of TOGAF (Open Group, 2011), TTCP (Taylor, 2005) and the RAND
(Davis, 2002). And in the research, the new CBP methodology is validated in a case
modeled with ArchiMate 2.1. In the method, the strategies could be translated into a
goal of building or optimizing specific capabilities to the desired performance level.
Therefore, firstly, it is necessary to identify the existing or missing capabilities which
contribute to realizing the strategy. According to the organization capability map that
related to the strategies. Then identify the target performance of these capabilities.
This step still follows the principles of CBP. Generally, the strategic capability could
be identified according to the organization changing goals. And the changing goals
(objectives) could be identified based on how the strategies fulfilled at the moment.
The Figure 9 below shows the metamodel of motivation extension according to the
CBP methodology (Aldea, et al., 2015).

24
Figure 9 Motivation extension meta model (Aldea, et al., 2015).
The Open Group defined the capability could be realized by the capability increments,
which could be separated into three dimensions, which has been is shown as Figure
10 (The Open Group, 2012).
Figure 10 Capability increment
Apart from these three dimensions, the Open Group provided another perspective for
identifying capability dimensions by analyzing the relationships between Strategy
Elements and Motivation and Core Elements.

25
Figure 11 Relationships between “Strategy Elements”, “Motivation” and “Core Elements”
As shown in Figure 11 capability is affected by behavior elements and resource which
is assigned to the capability. And according to the Open Group, the resources can be
classified into tangible and intangible assets, which include financial, physical,
technology, and human assets.
Figure 12 Specialization of “Internal Behavior Elements”
The three types of internal behavior element are defined: process, function, and
interaction (Figure 12). However, by comparing the definitions, a business
interaction is defined as “a unit of behavior similar to a business process or function,
but which is performed in a collaboration of two or more roles within the
organization.” Thus, the interaction element could be identified as a KPI of the
process. A business function is defined as a collection of business behavior based on a
chosen set of criteria. And when the capability decomposed, one important reference
is to identify the sub capability according to the business functions. Therefore, to
identify the capability increments, The emphases should be put on the business
process.

26
As shown in Figure 13, Aldea, et al. also provide an example of mapping the strategy
“Centralized IS”, in order to briefly outline how the related strategic capability
identified.
Figure 13 Strategy mapping of “Centralize IS” (Aldea, et al., 2015).
In order to assess how well the objective of Centralize IS can be fulfilled at the
moment, several strategic KPIs are used, such as Process performance, Process
variance, and Information consistency. Then the result shows there are several
problems standing in the way of successfully centralizing IS. 1) The Process
performance metric scores low because there are “Multiple and inconsistent CRM
databases”. 2) Process variance metric scores low because it is “Difficult to comply
with new regulations due to complex landscape”. 3) Information consistency metric
scores low because there is a “Non-uniform way of billing customers”. Then, the
capability “Customer management” is identified that relate to implement to centralize
IS.
2.3.4 Relationships Between Capabilities
Capabilities are normally modelled independently in the CBP methodology. But
relationships between capabilities exist. In ArchiMate 3.0, there are 7 types
relationships have been identified and defined between capabilities. Table 5 is
generated based on the relationship matrix in ArchiMate 3.0 to represent all 7 types
and their corresponding definitions.
Table 5 Relationship types between capabilities
Elements Type Description
Capability
and
Capability
A capability consists of one or more other capabilities.
A transfer relationship from one capability to another.
A capability groups a number of other capabilities.
For showing the unspecified relationship.

27
A capability is a particular kind of another capability.
A capability has a temporal or causal relationship with another capability.
A capability provides its functionality to another capability.
Additionally, The Figure 14 shows all the relationship types and their classification in
the ArchiMate 3.0.
Figure 14 Overview of relationships in ArchiMate 3.0
Generally, the relationships are classified into four categories as:
Structural relationships, which model the static construction or composition of
concepts of the same or different types;
Dependency relationships, which model how elements are used to support
other elements;
Dynamic relationships, which are used to model behavioral dependencies
between elements;
Other relationships, which do not fall into one of the above categories.
It is of importance to figure out the relationship between the capabilities. The
composition relationships mean one capability consists of one or more capabilities. It
could be identified based on the capability decomposing. A high-level capability
composes of its low-level capabilities. Then, as shown, dynamic relationships are
used to model the behavioral dependencies. It means that the two capabilities will
have the behavior order rather than affect the performance of each other. Therefore, in
this case, all the dynamic relationships between capabilities has little influence on
each other. Then the specialization relationship means “A capability is a particular

28
kind of another capability”. It hardly happens when building the business capability
map. Therefore, only the composition relation and the serving relation will have a
strong influence on the capability performance.
2.4 The IT4IT RA
As mentioned in the introduction, it is interesting to see if the IT4IT RA could
contribute to the new method. Therefore, we also made a literature review of IT4IT
RA.
2.4.1 IT4IT RA Overview
The IT4IT RA is a new standard reference architecture raised by the Open Group in
order to face the challenge that managing the business of IT. And it is a value chain-
based operating model of the functions that IT performs to help organizations to
identify the activities that contribute to business competitiveness (The Open Group,
2015). Since it is a quite new topic, there is no scientific publications while the
searching process arranged. The main references of the IT4IT RA are from the
website of the open group. The IT4IT Reference Architecture uses both formal and
informal notation style to depict the element. The related notations are list in the
Appendix B. and the IT4IT RA Level 1 framework is shown in Figure 15.
Figure 15 IT4IT RA level 1 framework version 2.0
The based IT Value Chain has four value streams (Strategy to Portfolio, Request to
Fulfill, Requirement to Deploy, Detect to Correct) supported by a reference
architecture to drive efficiency and agility. In each value stream, there are several
functional components, showing as blue blocks, that support related functions.
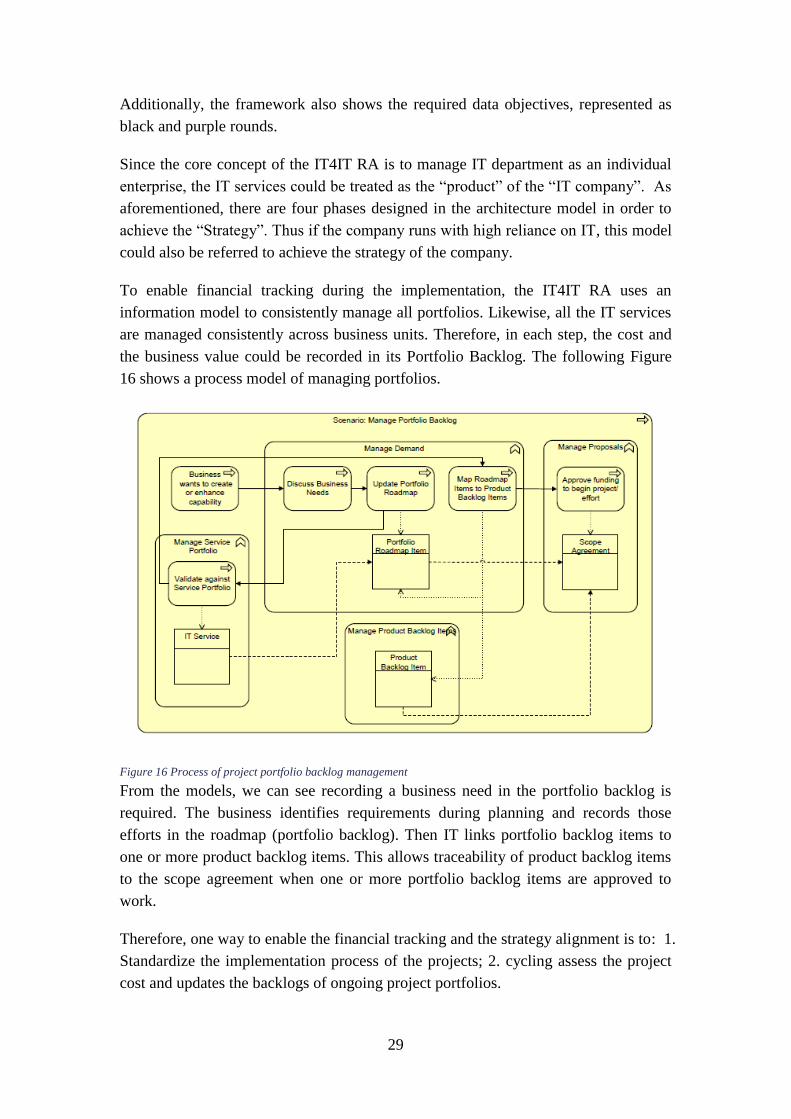
29
Additionally, the framework also shows the required data objectives, represented as
black and purple rounds.
Since the core concept of the IT4IT RA is to manage IT department as an individual
enterprise, the IT services could be treated as the “product” of the “IT company”. As
aforementioned, there are four phases designed in the architecture model in order to
achieve the “Strategy”. Thus if the company runs with high reliance on IT, this model
could also be referred to achieve the strategy of the company.
To enable financial tracking during the implementation, the IT4IT RA uses an
information model to consistently manage all portfolios. Likewise, all the IT services
are managed consistently across business units. Therefore, in each step, the cost and
the business value could be recorded in its Portfolio Backlog. The following Figure
16 shows a process model of managing portfolios.
Figure 16 Process of project portfolio backlog management
From the models, we can see recording a business need in the portfolio backlog is
required. The business identifies requirements during planning and records those
efforts in the roadmap (portfolio backlog). Then IT links portfolio backlog items to
one or more product backlog items. This allows traceability of product backlog items
to the scope agreement when one or more portfolio backlog items are approved to
work.
Therefore, one way to enable the financial tracking and the strategy alignment is to: 1.
Standardize the implementation process of the projects; 2. cycling assess the project
cost and updates the backlogs of ongoing project portfolios.

30
In this research, we found out that, IT4IT may help organization while implementing
the projects. However, in this case, we focus on the strategy alignment of the projects
and put emphases on assessing and adjusting the project. Therefore, there is little help
from IT4IT that can bring to the new method after the literature review.
Since we suppose portfolio backlog is a good way to keep the key information of the
projects. And mapping these backlogs to the related capability backlogs could trace
and record the complete degree of strategy implementation. We would keep the form
of the backlog as an approach to keep the project information. Following Table 6
shows a sample of a project portfolio backlog.
Table 6 Example of project portfolio backlog
Project Name
Summary This would represent the short description/ title/ summary of a given backlog item.
Description This would be the full description; ideally supports rich text.
Backlog Priority This priority is unique across all backlog items.
Stakeholders This would be used to link a portfolio backlog item to the stakeholders.
Proposed Budget This would be requirement, defect, or known error.
Fiscal Year This would indicate in which fiscal year the roadmap item (portfolio backlog item) is planned.
Capability Goals Capability name Influence level
Backlog Status The status shows the state of the backlog item. Status would be used by both the business and IT to determine whether it was an agreed roadmap item, proposed, in progress, etc.
Financial Cost Current/planned cost related to this backlog
2.5 The relationship between PM and CBP
Figure 17 Relationship between capabilities, EA, and projects
The Figure 17 above from the Open Group shows the crucial relationships between
Business Capabilities, Capability Increments, and the related work. We can see that

31
on the left side of the diagram, Capability Increments document the changes to
Business Capabilities that are needed to implement the Strategies. Each Capability
could be decomposed into one or more Capability Increments, representing a unit of
change that could be implemented as a work package. And the work packages could
be managed as project portfolios.
Therefore, the CBP methodology could support the strategy alignment of the project
portfolios by transferring the strategies into required capability levels to achieve the
improvements of assets like business processes and resources.
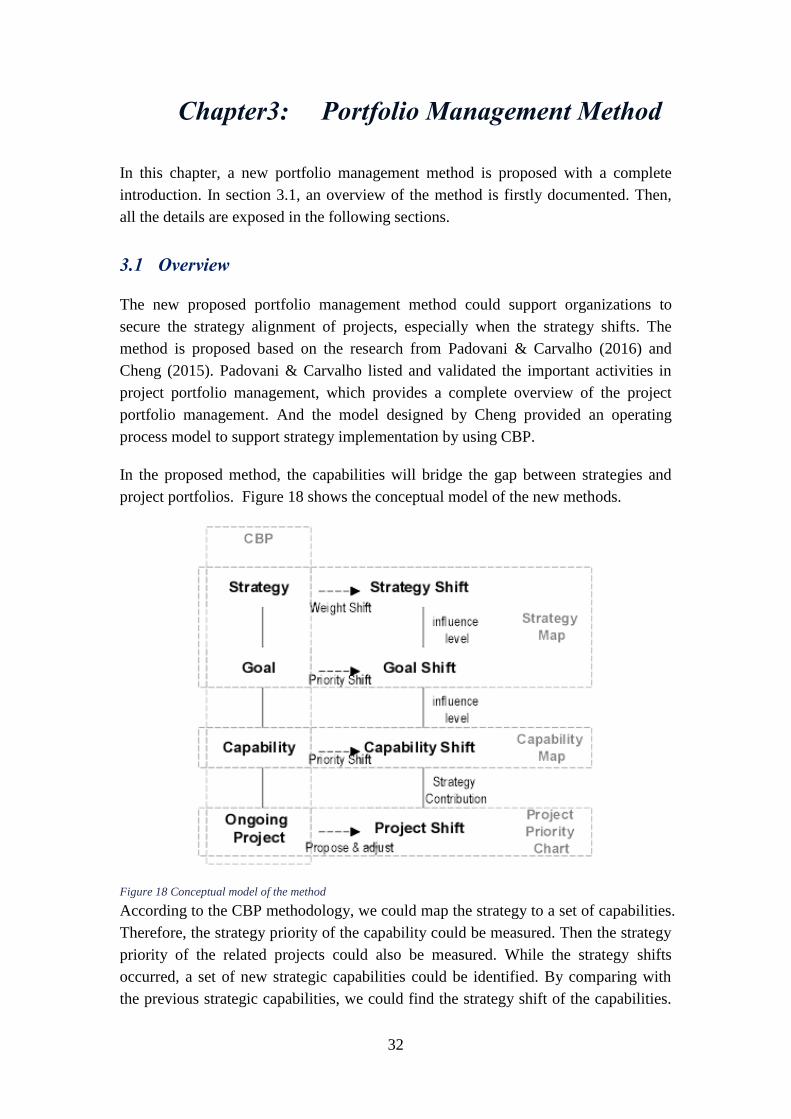
32
Chapter3: Portfolio Management Method
In this chapter, a new portfolio management method is proposed with a complete
introduction. In section 3.1, an overview of the method is firstly documented. Then,
all the details are exposed in the following sections.
3.1 Overview
The new proposed portfolio management method could support organizations to
secure the strategy alignment of projects, especially when the strategy shifts. The
method is proposed based on the research from Padovani & Carvalho (2016) and
Cheng (2015). Padovani & Carvalho listed and validated the important activities in
project portfolio management, which provides a complete overview of the project
portfolio management. And the model designed by Cheng provided an operating
process model to support strategy implementation by using CBP.
In the proposed method, the capabilities will bridge the gap between strategies and
project portfolios. Figure 18 shows the conceptual model of the new methods.
Figure 18 Conceptual model of the method
According to the CBP methodology, we could map the strategy to a set of capabilities.
Therefore, the strategy priority of the capability could be measured. Then the strategy
priority of the related projects could also be measured. While the strategy shifts
occurred, a set of new strategic capabilities could be identified. By comparing with
the previous strategic capabilities, we could find the strategy shift of the capabilities.

33
It could help stakeholders to re-weight the capabilities. Meanwhile, the related
projects could be re-weighted or even adjusted. At last the strategy priority of the
ongoing projects and the new proposed project could be identified, which supports the
organization to select and arrange the project portfolios.
Figure 19 Capability-based project portfolio management
In order to achieve aforementioned idea, a new method is proposed based on the
research from Padovani & Carvalho (2016) and Cheng (2015). As shown in Figure 19,
there are three phases designed in the new proposed method:
1. Knowledge Mapping Phase
In Knowledge Mapping Phase, the related information about the current situation and
the strategy could be collected and modeled. It could be self-iterated for correcting the
capability map.
2. Project Assessing Phase
Based on the collected information, this phase is to assess the impacted ongoing
projects and modeled possible solutions. What’s more, the strategy priority of all the
projects would be estimated to support the project selection. There could be iteration
between B2 and B3 for modeling appropriate solutions. There could also be an
iteration between Phase A and Phase B to adjust the identified strategic capabilities.
3. Portfolio Arranging Phase

34
The last phase Portfolio Managing Phase is to document how the strategy
implemented and to provide a project map according to the project dependencies and
the project strategy priority. Once there is a project implemented, the capability map
should be updated.
In the following sections, for each phase, the related sub-processes are expanded to
provide more detailed views and guidance. For each step, there also represent an
operating process model which follows the standard of Business Process Modelling
Notation (BPMN) 2.0. Besides, a brief of each phase provided in a table is at the
beginning of subchapter. Additionally, we use the language ArchiMate 3.0 to model
the deliverable examples. It is because ArchiMate has been used in the CBP
methodology. This language contains a set of strategic concepts and the notations to
present the Strategy, capability, and project concepts in this method. Then in chapter
3 and 4, we would like to use ArchiMate language 3.0 to demonstrate the proposed
method in this research.
3.2 Phase A: Knowledge Mapping Phase
This section illustrates the knowledge mapping phase – the first of three phases in the
process model. This phase aims to collect and model the necessary information about
the organization. The knowledge should include strategies, capabilities, and ongoing
projects.
The key information of the Knowledge Mapping Phase is shown in Table 7 below,
including the goal of the phase, the required input from the stakeholders, the desired
output, the adopted techniques and the reference literature.
Table 7 General view of knowledge mapping phase
Knowledge Mapping Phase
Goal Model required information about the organization to support further project portfolio management
Input Business capabilities, organization structures(optional), Strategy Ongoing projects and related projects documents
Deliverables 1. Strategy map 2. Organization capability map 3. Ongoing project map
Benefits Provide senior manager an overview of the organization. Based on the strategy priority score of the capability. A decision-making activity could be arranged to select the key capabilities and assign the budgets to the capabilities
Activities/Techniques 1. Model the capability map and the strategy
Business Capability Map; CBP; Strategy map
2. Model Ongoing Projects CBP; the IT4IT RA portfolio backlog
References Ulrich & Rosen, 2011; Aldea, et al., 2015; Azevedo, et al., 2015; The Open Group, 2016; The Open Group, 2011; Padovani & Carvalho, 2016; Kudryavtsev, et al., 2014

35
This phase is designed according to the “knowledge about the organizational context
(KOC)” part of the construct model described in section 2.2.4. The information that
could strongly affect the decision-making in the project portfolio management should
be identified and collected.
Generally, there are two activities designed in this phase. They are illustrated
separately in the following two subsections.
1. Model the capability map and the strategies. The first step is to model the
capability map of the organization. Then identify the strategic capabilities and
translate the strategies into the changing requirements of these capabilities. 2. Map the ongoing projects. The second step is to modeling the ongoing projects in
order to support the further assessment.
To arrange the knowledge mapping phase, it is necessary to make the step of
modelling organization capability map in front. Because by doing that, stakeholders
could feel facilitated while identifying the strategic capabilities and modeling the
ongoing projects by having capability map as a baseline.
3.2.1 A1. Model the capability map and the strategy
The first step of “Knowledge mapping” phase is to model the status of the
organization with the capability map and to map the strategies and ongoing projects.
The following table 8 provides essential information, including purpose, relevant staff,
deliverable and the suggested guidance of this step.
Table 8 Overview of step A1
Phase A. Model the capability map and the strategy
Step Goal Build or update the capability map of the organization and map the strategy to the
capability map
Stakeholders Enterprise Architect (may need support from departments)
Deliverable Current organization capability map
Guidance Build capability map The Open Group - business capability management
Map strategies Cheng, 2015; Kudryavtsev et al., 2014
In order to build the capability map, the guideline from the Open Group named
“business capability management” could be adopted. The process of capability map
modelling is shown in the Figure 20.

36
Figure 20 Process of Build/Update Capability Map
If the organization already has a capability map, the step could become updating the
capability map. Here suggested using a bottom-up approach to support the updating.
Because, by using the bottom up approach, users do not need to update the high- level
capability if there is no change with its sub capabilities. The example of a capability
map is shown in Figure 21.
Figure 21 Example of capability map

37
The color of the “capability” element is same as the color of level 2 capability. And
the reason to lighten the level 1 capability and deepen level 3 capability is to distinctly
show the capabilities at different levels.
Then, we need the input from stakeholders to identify the serving relationships
between capabilities by filling the matrix shown in Table 9.
Table 9 Example of capability serving relationship matrix
Serving ↓ From / → To L1 Capability N
L2 Capability I L2 Capability J
L3 Capability A L3 Capability B L3 Capability D L3 Capability E
L1
Cap
abili
ty N
L2 I
L 3 capability A - X L 3 capability B - X
L2 J
L 3 capability D -
L 3 capability E -
As defined, serving relation represents that a capability provides its functionality to
another capability. Therefore, the capability that provides functionality will affect the
performance of the served capability. Stakeholders can mark the serving relationships
based on the organizational business process. In considering the complexity of the
matrix, it is possible to reduce capabilities has low concerns. And the identified result
could support stakeholders to identify the strategic capabilities accurately.
Once the capability map is modeled, the strategies could be mapped to the capabilities.
And the process of modeling the strategies is shown as Figure 22.
Figure 22 Process of mapping the strategies to capabilities
For more operating details, the report of Cheng (2015) is recommended. The step of
“Decompose strategy goal by perspectives” could be optional if the organization has
already made a strategy map. What’s more, the capabilities should be selected from
the level 3 capabilities. An example of strategy mapping is shown in Figure 23.

38
Figure 23 Example of strategy mapping
Assess the strategic capabilities
This step could be fully achieved by following the CBP methodology. The study of
Cheng is recommended as the guideline of this step. The operating process could be
concluded as Figure 24.
Figure 24 Process of identifying the current and target performance level of capabilities
As the Open Group defined that capability is affected by behavior elements and
assigned by resources (Figure 11). The behavior elements have three types: process,
function, and interaction (Figure 12). Then, by comparing the definitions, a business
interaction is defined as “a unit of behavior similar to a business process or function,
but which is performed in a collaboration of two or more roles within the
organization”. Thus, the interaction element could be identified as a special type of
process or function. A business function is defined as “a collection of business
behavior based on a chosen set of criteria”. And since the capability is decomposed
according to the business functions, one identified dimension is “process”. And

39
according to the resources and external behavior element, the other dimensions are
identified as “financial”, “physical”, “technology”, “human” and “external” (Figure
25).
Figure 25 Capability dimensions
Stakeholders could identify the KPIs of each capability dimension. Nevertheless, if
there are several KPIs identified, it is also necessary to set the weight of each KPI for
amending the calculation.
There is a dimension that is different from the guideline. Cheng identified the
organizational dimension that focuses on the communication between different units
that could be treated as business interaction. As mentioned before, a business
interaction could be represented as an indicator of process performance. And the
dimension model modeled from Cheng ignored the dimension regarding the external
elements. Therefore, the organizational dimension is replaced by “external
dimension”. The performance level of the new dimension “external dimension” could
be identified as:
Level 0: No capability. The capability could not identify the external (customer or
environment) expectations or changes
Level 1: Initial. Get low sensitivity to the external changes, but has no idea about fulfilling the
external requirements.
Level 2: Under Development. Could identify the external expectation and changed to adapt
the new environment but not in time or cannot reach the target.
Level 3: Defined. Clear identify the external expectations or changes then planned and
implement itself to fulfill the requirements.
Level 4: Managed. Could be optimized agilely to fulfill the requirements.
Level 5: Optimizing. Could be flexibly to the external changes and analyses and predict the
changes that may occur.
Stakeholders could also identify the mature performance level of each capability
dimension themselves. The outcome of this step could be presented as Table 10,
which shows the capability performance level in dimensions.
Table 10 Example of performance level of strategic capability
Billing process management
Indicator Skill level Time Budget Equipment performance
Use of application
Adaptability of changing
Capability dimension
human process finance physical technology external
Indicator specification
The skill level of employee
The average time of the
The budget for the
How well to support the capability
How well to fulfill the requirement
How well to adapt the changes
Capability
External Finace Human Process Physical Technology

40
process capability
Current level 3 3 3 2 2 2
Target level 3 4 3 2 3 3
3.2.2 A2. Model the ongoing projects
The purpose of this step is to map the ongoing projects to the capability map. Then,
the impacted ongoing projects could be identified once the related capabilities are
selected as the strategic capabilities. The technique adopted in this step is CBP
methodology. The basic information is concluded in Table 11.
Table 11 Overview of step A2
Phase A. Modelling ongoing project
Step Goal Map all the ongoing projects to the capability map
Stakeholders Enterprise Architect (may need support from project owner)
Input Related project documents
Deliverable Capability project matrix, project dependency matrix
Techniques Identify related capabilities CBP
Identify project dependencies -
According to the motivation extension model (Figure 9) from Aldea, et al. (2015),
working packages(projects) could realize or enhance a capability which could realize
one or several specific strategies. The process of modeling ongoing projects is shown
in Figure 26.
Figure 26 Process of modeling ongoing project
To map the ongoing projects to the specific capabilities, firstly, identify the planned
deliverable and the project objective by reviewing the project documents. Then,
identify the related capabilities according to the project objective. In this step, we
recommend to map to the level 3 capabilities in order to support further assessment.
At last, link the project with the identified capability. An example is shown as Figure
27.

41
By reviewing the relevant project documents, the ongoing project “Harmonize billing
process” will deliver a uniform billing process in order to harmonize the customer
billing process since the organization has different ways of billing customers in
different locations. Then, according to the objective that the organization wants to
optimize the billing process, the capability “customer billing process management” is
identified. At last, the capability is linked with the project. As the figure shows, the
relationship between capability and project is modeled as “association relation”. It is
because the identified capability is the business capability instead of the capability
increment. Therefore, the relationship should not be “implementation relation”.
According to the project scope, it is possible that the project may contribute to several
capabilities.
The dependency relationship within projects, as described in the literature review, has
two types. One is according to the resources limitation to run the projects. This
dependency relationship may disappear if there are enough resources to support
project running at the same time. Therefore, this kind of dependence will not be taken
into account at the moment. Another dependency type is due to the information
requirement from the output of the projects. This dependency will always exist if
project A requires the output of project B. Table 12 shows the template of project
dependency matrix which requires the input from the stakeholders.
Table 12 Example of project dependency matrix
Trigger ↓ From / → To
Info Receiving
Project A Project B Project C Project D Project E
Info
Pro
vid
ing
Project A -
Project B X -
Project C - X
Project D -
Project E X -
While filling the project matrix, according to the mapping result from projects to
capability map, the projects that linked to the same capabilities should be
Figure 27 Example of modeling ongoing project

42
recommended to the stakeholders. According to CBP, working packages are made to
implement the capability increment. Therefore, the projects relating to same
capability would have dependency relationship or even should run in parallel.
3.2.3 Recommendations
1. Stakeholders could use a sample capability map as the baseline to build the
organization capability map since the organizations in the same industries may
have similar structures.
2. Usually, in the capability map, the bottom tier is the “Supporting” tier that
typically represents the essential elements of the business to function but is
more behind-the-scenes playing a supporting role. Therefore, more service
relationships could be identified from “Supporting” tier to the upper tiers.
3. Project card of each project could be generated to provide an overview of each
ongoing project. The example of project card is shown in Table 13.
Table 13 Example of ongoing project card
Project Name
Summary This represents the short description/ title/ summary of a given backlog item.
Description This would be the full description; ideally supports rich text.
Stakeholders People who is taking the responsibilities
Proposed Budget The total budget required by this project
Capability Goals Capability name Priority level Influence level
Status The status shows the state of the backlog item (proposed, agreed, in progress, etc. if the project is in progress, the percentage of completion should be recorded.
Required implementation Resources
It is optional to fill. If it is filled. It will support building the roadmap
Project dependencies The projects which rely on the output of this project
Financial Cost Current cost related to this backlog
4. In order to link the projects to capability more accurately, the stakeholders
should identify the objectives or the strategies as much detailed as possible.
5. The linking result could also be adopted to check and adjust the business
capability map. It may help the stakeholder to realize that some important
capabilities are missed while building the capability map.
3.3 Phase B. Project Assessing
This section is to illustrate the second phase of the method. The project assessing
phase is designed to assess the strategy alignment and strategy contribution of the
ongoing projects and the new proposed projects. The following Table 14 is to show
the general information of the project assessing phase.

43
Table 14 General view of project assessing phase
Project Assessing
Goal Align projects to the strategies
Input Proposed project
Output Capability implementation solution radar Strategy priority chart of the projects
Benefits The enterprise architect could propose the capability implementation solution according to the project contribution radar and the assigned budget. The project dependency map could help enterprise architect to quickly identify the related project while he wants to adjust or abandon the project. Could support senior manager to select the project to implement the strategic capabilities.
Steps/Techniques Step1. Assess the strategic capabilities CBP
Step2. Assess ongoing projects -
Step3. Model the possible solutions -
Step4. Identify project strategy priority level -
References Aldea, et al., 2015; Azevedo, et al., 2015; The Open Group, 2016; The Open Group, 2011
In this phase, we assumed that all the ongoing projects could run and provide the
deliverables as it is planned.
Generally, there are four activities designed in this phase and they are illustrated
separately in the following subsections.
1. Assess the strategic capabilities. The first step is to identify the current level and
the target level of the strategic capabilities.
2. Assess ongoing projects. The second step is to assess the ongoing project to see if
they could fully realize the target level of the capability.
3. Model the possible solutions. Then, according to the assessed result from previous
steps, enterprise architect could propose and model possible solutions.
4. Identify project strategy priority. At last, the strategy priority of the ongoing
project and proposed new project could be identified to support manager’s decision
making.
3.3.1 B1. Assess the ongoing projects
The second step of “Project Assessing” phase is to assess the ongoing projects to see
if they align with the strategies. The following Table 15 provides essential
information for this step.
Table 15 Overview of step B1
Phase B. Assess the ongoing projects
Step Goal Assess the planned deliverables of the ongoing projects to see if they align to the strategy.
Stakeholders Enterprise Architect, project manager
Input Related project documents
Deliverable Capability-project radar chart

44
The main idea of this step is to translate the project deliverables to the enhancement
of capability dimensions. Then the project deliverables could be modeled into
capability performance radar to check if the project aligns with the strategy. The
operating process could be concluded as:
Figure 28 Process to assess ongoing projects
For one strategic capability, the candidate ongoing projects are identified according to
two parts:
1. All the ongoing projects that linked to this strategic capability.
2. According to serving relationship, the projects linking to the capability which
will serve to this strategic capability are also selected.
Then, stakeholders could analyze the deliverables of each candidate project. Analyze
how the related capability could be enhanced by these deliverables and identify if the
deliverables could improve the performance level of the capability dimension.
Table 16 Example of anticipated performance level
Billing process management
Indicator Skill level time Budget Equipment performance
Use of application
Adaptability of changing
Capability dimension
human process finance physical Technology external
Indicator specification
the skill level of employee
The average time of the process
The budget for the capability
How well to support the capability
How well to fulfill the requirement
How well to adapt the changes
Current level 3 2 2 2 3 3
Project A 3 4 2 2 3 4
Project B 3 4 2 4 3 3
Consolidation level
3 5 2 4 3 4
Target level 3 5 2 4 4 4
As shown in Table 16, there are two projects that will contribute to the capability
“billing process management”. Firstly, the stakeholders should separately identify the
capability dimension performance level when each project delivered. Then, the
stakeholders should consolidate these anticipations in order to get the final capability
performance level while all the related ongoing project delivered.

45
For one capability dimension, if there is only one project contributing to this
dimension, then the consolidation result could be as same as this project. However, if
multiple projects are working on one dimension, the consolidation should be
identified by anticipating the performance level while all the projects delivered.
Model the radar chart
Once stakeholder identified the current level and the project delivering level, a
complete radar chart could be drawn automatically to provide a view of related
ongoing project strategy alignment. For example, as shown in Figure 29, the current
performance level is marked in yellow. The target performance level (capability
increment performance) is plotted out with a red round-dot outline. And the
performance level according to the project's contribution, could be modeled in blue.
Figure 29 Example of customer billing process related projects
Since the project delivering performance level shows the consolidation result of all
related projects. The project name could be marked to show where the contribution
comes from. What’s more, stakeholders may have a more comprehensive view by
listing out some key attributes they concerned, like project cost, capability priority
level, and planned budget.
In the radar chart, the area between the target performance level and the project
delivering performance level represents the gap that needs to be noticed. The
enterprise architect could narrow or close the gap by adjusting the related projects or
proposing new projects.
3.3.2 B2. Model possible solutions
If there is no gap, it means the running projects could bring desired change to the
capability dimensions. Then the project could continue running as planned. Otherwise,
organizations should provide solutions to achieve the capability increment.
012345human
process
finance
physical
technology
external
Customer billing process
Target Project Current
Budget €100,000
Project A €60,000
Project B €30,000
A, B
B
A

46
Table 17 Overview of step B2
Phase B. Model possible solutions
Step Goal Assess the planned deliverables of the ongoing projects to see if they align to the strategy.
Stakeholders Enterprise Architect, project manager
Input -
Deliverable Proposed solutions in radar chart
As shown in Table 17 Overview of step B2 step B2 is designed with the purpose of
proposing possible solutions. Generally, enterprise architect could propose new
projects, adjust ongoing projects or abandon ongoing projects.
Propose New Project
Enterprise should choose to propose new projects for the strategic capabilities that are
without related ongoing projects. The suggestions for this condition to follow the
suggestion from Cheng’s paper (Cheng, 2015), in the Step “Creating the capability
development projects”.
Since the projects are proposed to implement the changing requirements of the
capabilities, the deliverable of these proposed projects could be modelled in the
capability performance radar.
Enterprise could model the solutions from a capability perspective. Figure 30 shows
an example of new proposed projects. The capability should be optimized from
“process” and “technology” dimensions to close the gap between the current
performance and the target performance. Then, the enterprise architect proposes two
projects: project “revision of billing process” and project “rationalization of
application”. The two projects are marked with different patterns.
Figure 30 Example of modeling proposed projects a
0
1
2
3
4
5Human
Process
Finance
Technology
Phsical
External
Capability A
Current Capability Increment
Budget €100,000
project “revision of billing
process” €10,000 “rationalization
of application” €20,000
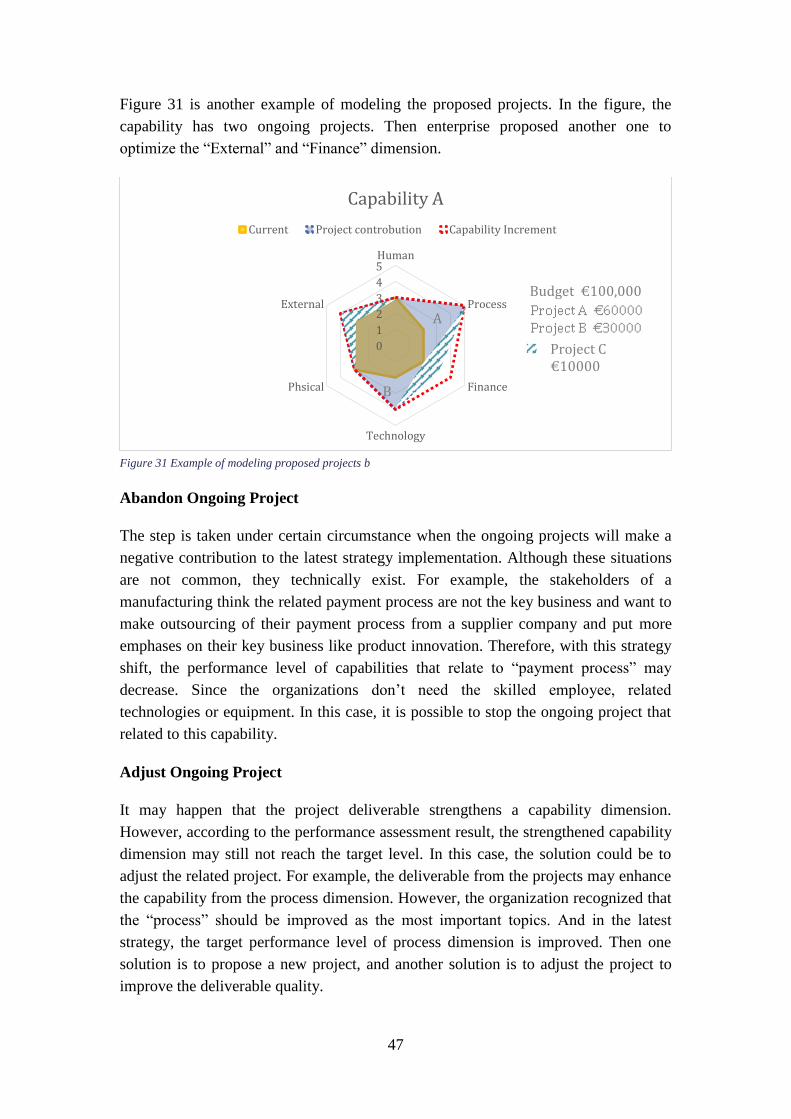
47
Figure 31 is another example of modeling the proposed projects. In the figure, the
capability has two ongoing projects. Then enterprise proposed another one to
optimize the “External” and “Finance” dimension.
Figure 31 Example of modeling proposed projects b
Abandon Ongoing Project
The step is taken under certain circumstance when the ongoing projects will make a
negative contribution to the latest strategy implementation. Although these situations
are not common, they technically exist. For example, the stakeholders of a
manufacturing think the related payment process are not the key business and want to
make outsourcing of their payment process from a supplier company and put more
emphases on their key business like product innovation. Therefore, with this strategy
shift, the performance level of capabilities that relate to “payment process” may
decrease. Since the organizations don’t need the skilled employee, related
technologies or equipment. In this case, it is possible to stop the ongoing project that
related to this capability.
Adjust Ongoing Project
It may happen that the project deliverable strengthens a capability dimension.
However, according to the performance assessment result, the strengthened capability
dimension may still not reach the target level. In this case, the solution could be to
adjust the related project. For example, the deliverable from the projects may enhance
the capability from the process dimension. However, the organization recognized that
the “process” should be improved as the most important topics. And in the latest
strategy, the target performance level of process dimension is improved. Then one
solution is to propose a new project, and another solution is to adjust the project to
improve the deliverable quality.
0
1
2
3
4
5Human
Process
Finance
Technology
Phsical
External
Capability A
Current Project controbution Capability Increment
A
B
Budget €100,000
Project C €10000

48
Project Dependencies
While adjusting or abandoning ongoing projects, it is important to notice if other
capabilities or projects would be affected by this projects. To support the decision
making, the method provides a list to show the affected projects and capabilities of
the project. The example of the project dependency card is shown in Table 18. The
row “related capability” shows the capabilities this project could affect and the degree
of project influencing other projects.
Table 18 Example of project dependency card
Project Name
Summary This represents the short description/ title/ summary of a given backlog item
Filled according to the project document
Stakeholders People who is taking the responsibilities
Completion The percentage of the project completion
Related Capability
Capability Name Influence Level Serving Capability Sub capability project matrix & capability serving relationship matrix
Supporting projects
Project name Project Owner Required output Project dependency matrix
As mentioned, the complete radar chart could facilitate stakeholders to identify the
changing requirements of the strategic capabilities. Therefore, stakeholders could
generate some proper solutions like proposing new projects or adjusting ongoing
projects. While new projects proposed, the capability-project matrix and the project
dependency matrix should be updated. Then, all the candidate projects could be
modeled into radar chart.
3.3.3 B3. Assess project strategy priority
The last step of phase B is to assess the strategy priority of the proposed projects and
the ongoing projects. The following Table 19 provides essential information of this
step.
Table 19 Overview of step B3
Phase B. Assess project strategy priority
Step Goal Build or update the capability map of the organization and map the strategy to the
capability map
Stakeholders Enterprise Architect (may need support from departments)
Deliverable Current organization capability map
Guidance
Calculate capability strategy
priority
Kudryavtsev et al., 2014
Calculate project strategy
priority
-
The using approach to calculate the strategy priority of the capabilities is called Goal-
cascading matrices, referring to the literature by Kudryavtsev et al. and there are two
matrices picked:

49
“Strategy – Subgoal” matrix.
The first matrix is to evaluate the priority value of the sub-goals. As shown in Table
18, all the strategies and the sub-strategy goals are listed out. The stakeholders should
assign one score to all the strategies in the “Strategy Priority” column according to the
concerns. Then for each sub-strategy goal, the influence power of subgoal could be
identified by stakeholders. According to the approach, there are three levels of
influence power. The highest level is named as “Strong” with the weight of 9 points.
The second level is called “Medium”, with the weight of 3 points. And the lowest
level is named as “Weak”, with 1 point. In the literature, Kudryavtsev et al. didn’t
illustrate the principle to identify the weight. However, from opinion, it is better to
identify the weight of “Strong” level much higher, because it is much more effective
to achieve the strategy by achieving its subgoal with a strong influence on it.
Table 20 Example of Strategy-Subgoal matrix
Strategy Goal
Goal Priority Subgoal 1 Subgoal 2 Ongoing project objective 3
Goal 1 0.7 Strong (9) Medium (3)
Goal 2 0.3 Weak (1) Strong (9)
Subgoal Priority 6.3 2.4 2.7
Related Priority 55% 21% 24%
After filling the table, the priority value of the subgoal could be calculated
automatically by the equation:
𝑆𝑃𝑛 = ∑ 𝐺𝑃𝑘
𝑚
k=1
× 𝐼𝑘,𝑛
which has these variables:
SP stands for the Subgoal Priority value;
n means the nth subgoal;
m means there are m strategy goals in total;
GP stands for the Goal Priority value;
And I stands for the Influence Power score.
Therefore, the priority value of subgoal 1 should be: 𝑆𝑃1 = 0.7 ∗ 9 + 0.3 ∗ 0 = 6.3
In the Related Priority row, the total 1 point is assigned to the subgoals according to
the Subgoal Priority value. The calculation follows the equation:
𝑅𝑃𝑛 = 𝑆𝑃𝑛
∑ 𝑆𝑃𝑘𝑚k=1
which involves these variables:
RP stands for the Related Priority value;
n means the nth subgoal;
SP stands for the Subgoal Priority value;
m means there are m subgoals in total.

50
Therefore, the Related Priority value of subgoal 1 should be: 𝑅𝑃1 =6.3
6.3+2.4+2.7≈
55%
“Goal – Capability” matrix.
It helps to evaluate the priority value of the Capability. Table 21 shows the example
of the Goal- Capability Matrix. The values in the column “Goal Priority” are from the
calculation results in Table 20. Then for each level 3 capability, stakeholders could
identify the influence power.
Table 21 Example of Goal-Capability matrix
Sub strategy Goal Subgoal Priority Capability 1 Capability 2 Capability 3
Subgoal 1 0.65 Strong (9) Weak (1)
Subgoal 2 0.07 Medium (3) Strong (9)
Subgoal 3 0.28 Medium (3) Strong (9)
Capability Priority 6.69 0.86 3.15
While linking the level 3 capability to the subgoals, it may happen that there is the
only capability identified has a weak or medium influence to the subgoal. As shown
in Table 22, this means the organization misses a capability to implement this subgoal.
Then, the stakeholder should define a new capability and add this new capability as
one of the strategic capabilities that need to be implemented. The default influence
level of the new capability is “Strong”.
Table 22 Example of identifying capability priority
Sub strategy Goal
Subgoal Priority
Capability 1 Capability 2 Capability 3 Identified New capability
Subgoal 1 0.65 Strong (9) Weak (1)
Subgoal 2 0.07 Medium (3) Strong (9)
Subgoal 3 0.28 Medium (3) Strong (9)
Subgoal 4 0.28 Strong (9)
Capability Priority 6.69 0.86 3.15 2.52
After filling the table, the priority value of the capability could be calculated
automatically by the equation:
𝐶𝑃𝑛 = ∑ 𝑆𝑃𝑘
𝑚
k=1
∗ 𝐼𝑘,𝑛
with the following variables:
CP stands for the Capability Priority value;
n means the nth capability;
m means there are m subgoals in total;
SP stands for the Subgoal Priority value;
And I stands for the Influence Power score.
Therefore, the priority value of Capability 1 should be:
𝐶𝑃1 = 0.65 ∗ 9 + 0.07 ∗ 0 + 0.28 ∗ 3 = 6.69

51
During the linking step, one thing should be paid attention. The relationship between
strategy goals and capabilities is “many to many”, which means one goal might be
affected by changing several capabilities. Vice versa, one capability could be changed
to affect several goals.
Different organizations may have different concerns of the projects, which means
organizations may set multiple criteria while ranking the projects. In this method, the
emphases are on the strategy alignment and a clear strategy related score would be
calculated and provided. The strategy priority score would also be one criterion if
organizations set multiple criteria to identify the project priority. Then, the last step of
the phase should be set to identify the strategic priority of the projects. Stakeholders
could keep updating the capability project matrix table and project dependency matrix
table while they are proposing new projects or adjusting the ongoing projects. Then
the priority could be calculated automatically according to the information from the
capability project matrix table.
First, it is important to identify the contribution of the project to a capability. It is
calculated according to the capability increment, capability current performance level,
and the increasing level that the project can provide. Here we assume that all 6
dimensions in the capability have equal weight. This means, improving “process”
dimension from level 2 to level 3 will bring the same value as improving
“Technology” dimension from level 1 to level 2. Then the contribution from a project
to a capability could be calculated as how much percentage the project will implement
the strategic goal.
Table 23 Example of project contribution
Project 1-Capability 1
Dimension process human technology physical external financial
Target performance level 4 3 4 4 4 4
Project provide performance 4 2 4 4 3 4
Current performance level 2 2 3 4 3 4
Strategy performance Gap (Target-Current)
2 1 1 0 1 0
Contribution (Project-Current)
2 0 1 0 0 0
Total Contribution (2*1+0*1+1*1+0*1+0*1) = 3
Total Gap (2*1+1*1+1*1+0*1+1*1) = 5
Contribution percentage 60%
For example, in Table 23, we can see that the gap between the current capability and
the capability increment could be concluded as improving 2 performance level in
process dimension, 1 level in “human” dimension, 1 level in “technology” dimension
and 1 level in “external” dimension. And the project will achieve the changing
requirements of process dimension and technology dimension, which means this
project could produce 60% of the all requirements. Then, the contribution percentage
of the project to a capability will be adopted in for the strategic priority calculation.

52
The following Table 24 is built to calculate the project strategic priority. And this
table could be filled by combine the tables of capability project matrix, strategy
capability matrix, and the capability dimension performance table mentioned before.
The cells in the table show the percentage of the contribution to the capability from
the project.
Table 24 Example of identifying project priority
Sub capability
Capability Priority project 1 project 2 …
Sub capability 1
0.69 60% …
Sub capability 2
0.18 10% 57% …
Subgoal Priority 0.432 0.10 …
Then, the equation is identified as:
𝑃𝑃𝑛 = ∑ 𝐶𝑃𝑘
𝑚
k=1
∗ 𝑃𝑘,𝑛
which has these variables:
PP stands for the Project Priority value;
n means the nth project;
m means there are m sub capabilities in total;
SP stands for the Sub capability Priority value;
And P stands for the contribution percentage of the project to the capability.
After calculation, there could be a projects list with its strategy priority score. And
with the budget proposed by the enterprise architect, we could build a chart to shown
the project priority. Like the template shown in Figure 32, Y-axis shows the strategy
priority score of the project and X-axis shows the required budget of the project. Then
stakeholders could add more criteria like risk level to support the project selection, if
they want. The extra criteria could be marked as different colors or sizes of the project
bubbles.
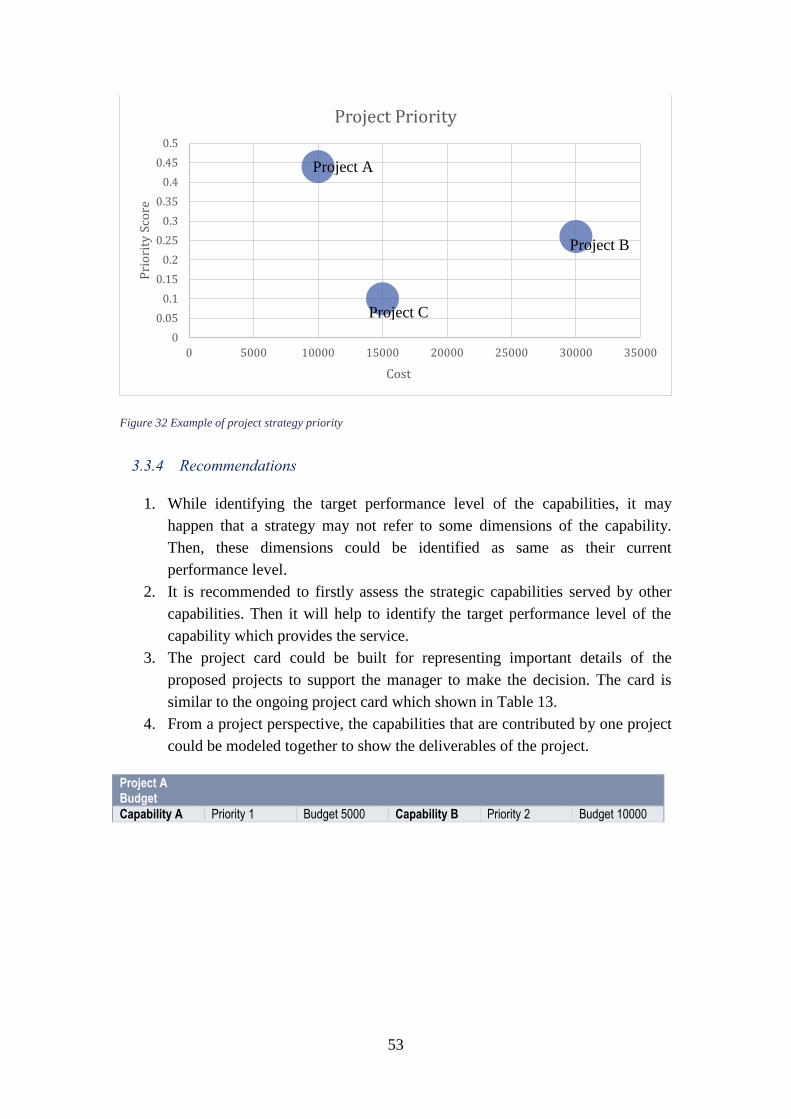
53
Figure 32 Example of project strategy priority
3.3.4 Recommendations
1. While identifying the target performance level of the capabilities, it may
happen that a strategy may not refer to some dimensions of the capability.
Then, these dimensions could be identified as same as their current
performance level.
2. It is recommended to firstly assess the strategic capabilities served by other
capabilities. Then it will help to identify the target performance level of the
capability which provides the service.
3. The project card could be built for representing important details of the
proposed projects to support the manager to make the decision. The card is
similar to the ongoing project card which shown in Table 13.
4. From a project perspective, the capabilities that are contributed by one project
could be modeled together to show the deliverables of the project.
Project A Budget
Capability A Priority 1 Budget 5000 Capability B Priority 2 Budget 10000
0
0.05
0.1
0.15
0.2
0.25
0.3
0.35
0.4
0.45
0.5
0 5000 10000 15000 20000 25000 30000 35000
Pri
ori
ty S
core
Cost
Project Priority
Project A
Project C
Project B
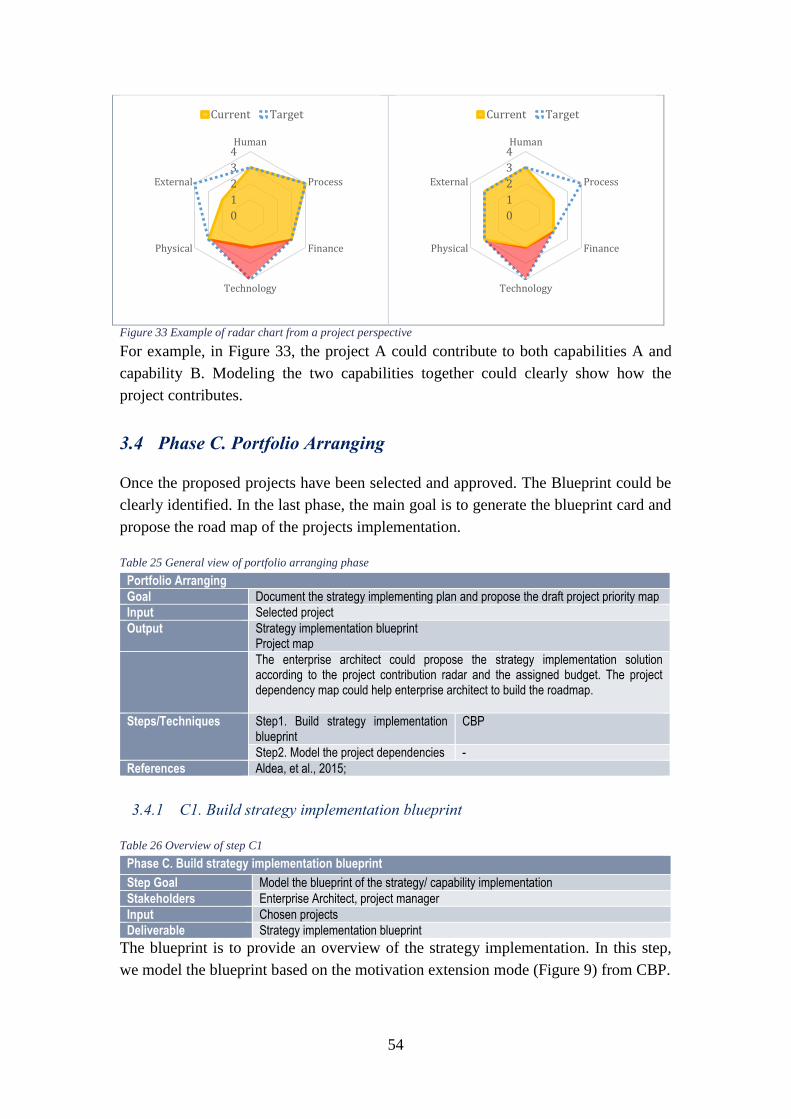
54
Figure 33 Example of radar chart from a project perspective
For example, in Figure 33, the project A could contribute to both capabilities A and
capability B. Modeling the two capabilities together could clearly show how the
project contributes.
3.4 Phase C. Portfolio Arranging
Once the proposed projects have been selected and approved. The Blueprint could be
clearly identified. In the last phase, the main goal is to generate the blueprint card and
propose the road map of the projects implementation.
Table 25 General view of portfolio arranging phase
Portfolio Arranging
Goal Document the strategy implementing plan and propose the draft project priority map
Input Selected project
Output Strategy implementation blueprint Project map
The enterprise architect could propose the strategy implementation solution according to the project contribution radar and the assigned budget. The project dependency map could help enterprise architect to build the roadmap.
Steps/Techniques Step1. Build strategy implementation blueprint
CBP
Step2. Model the project dependencies -
References Aldea, et al., 2015;
3.4.1 C1. Build strategy implementation blueprint
Table 26 Overview of step C1
Phase C. Build strategy implementation blueprint
Step Goal Model the blueprint of the strategy/ capability implementation
Stakeholders Enterprise Architect, project manager
Input Chosen projects
Deliverable Strategy implementation blueprint
The blueprint is to provide an overview of the strategy implementation. In this step,
we model the blueprint based on the motivation extension mode (Figure 9) from CBP.
0
1
2
3
4Human
Process
Finance
Technology
Physical
External
Current Target
0
1
2
3
4Human
Process
Finance
Technology
Physical
External
Current Target

55
Figure 34 Example of strategy implementation blueprint
As we can see in Figure 34, the blueprint should include at least three parts, the
strategies, the identified strategic capabilities, and the projects which could contribute
to these capabilities.
3.4.2 C2. Model the project dependencies
This section illustrates the last step in this new method, building the dependency map
of all the projects.
Table 27 Overview of step C2
Phase C. Model the project dependencies
Step Goal To provide an overview of the project dependencies
Stakeholders Enterprise Architect, project manager
Input
Deliverable Project dependencies map
The dependency relationship, as described in the literature review, has two types. One
is according to the limited resources to run the projects. This dependency relationship
will exist if projects using common resources. Another dependency type is due to the
requirement of the output from another project. This dependency will always exist.
And it could be identified according to the project dependencies that filled by

56
stakeholders. The last step is to build a draft of the roadmap for the stakeholders. An
example is shown in Figure 35.
The example roadmap includes all the approved projects and the strategic capability
which these projects contribute to. What’s more, the project dependencies could be
marked out with the triggering relationship and the resource limitations are
represented by grouping the projects that require same resources.
Figure 35 Example of the projects dependencies
3.4.3 Recommendations
Apart from the blueprint, it is also possible to provide a clear overview of strategies
implementation in a table. And it will support the further assessment if there is new
strategy shift occurred during the strategy implementation.
Table 28 Example of blueprint card
Strategy Name
Capability Name Influence level
Current / Blueprint capability
Current and blueprint radar chart
budget The total budget of capability development
projects name Stakeholders Contribution
Project name Project owner Deliverable radar chart
Table 28 shows the template of the blueprint card, involving the essential information
about how the strategy is implemented. It could also be modeled as a strategy
implementation architecture.

57
Chapter4: Case Study
In this chapter, a case study is arranged to practice the proposed method with the
purpose of demonstration. The case named “ArchiPharma” is a real case of a
pharmaceutical manufacturer. “ArchiPharma” is a pseudonym of the organization
because of the confidential issue. The ArchiPharma case is from BiZZdesign, used as
a sample of enterprise architecture modeling and portfolio management in the
BiZZdesign Enterprise Studio.
In the case study, the method is applied to close the gap between the projects and the
latest strategies by identifying the related capabilities, mapping the strategies and
projects and proposing appropriate solutions. With the help of method, ArchiPharma
could have a better performance of their portfolio management by having a more
precise insight into the projects.
Due to the data limitation, we make some assumptions while implementing the case
study. But in a real case, all the required information should be determined from
related stakeholders or documents.
4.1 Introduction
4.1.1 Strategy Shift
As a large international pharmaceutical manufacturer, ArchiPharma consists of many
mergers and take-overs that turn out to have multiple geographically spread locations
including New York, London, and Amsterdam. The end mission of the organization is
to become a global leading service provider in the pharmaceutical industry. And they
identified this ambitious mission as the result of providing the most innovative
pharmaceutical services with a quick and reliable solution.
Then, they made a complete focus on operational excellence as shown in Figure 36.
And now in the latest meeting, they switched it by putting a focus on product
leadership. And the operational excellence could be continuing in the background if
the budget is enough, which means, the goal of having excellent operations has much
less priority than before. The Figure 37 below shows the new version of the mission,
the vision, and strategy of ArchiPharma.

58
Figure 36 Previous Mission, vision, strategy of ArchiPharma
Figure 37 New strategy of ArchiPharma
4.1.2 Ongoing Projects
Last few years, in order to achieve “Operational excellence”, ArchiPharma currently
has two plateaus involving four ongoing programs and they are shown in Figure 38.
Figure 38 Realization relationship between plateaus and programs in ArchiPharma

59
According to the figure, all four programs contribute to improving “customer
management” and the program Application rationalization could also improve
“Governance, Risk, and Compliance.” And then, within each program, there is a
series of ongoing working packages, which are treated as projects:
Improve global accessibility database
Analyze data sources
Develop database authentication protocols
Develop integrated reporting
Install database authentication
Install federated database management system (FDMS)
Prepare and adapt database
Publish database information
Harmonize billing process
Analyze billing process variance
Choose, develop, test and run global, test and run global finance
Harmonize process variants
Phase out Amsterdam billing applications
Phase out London billing applications
Phase out New York billing applications
Application Rationalization
Define Valuation Model
Develop application rationalization roadmap
Identify obsolete applications
Inventory application
Migrate and eliminate identified applications
Valuate application
Homogenize information & data
Design data architecture
Analyze heterogeneous data sources
Data mapping
Data cleaning
Consistent data model development
Analyze heterogeneous information sources
Information harmonization
Information mapping
Information cleaning

60
4.2 Phase A: Knowledge Mapping
In the first phase, strategy mapping phase, we need to transfer the strategy into
capability changing requirements. Therefore, we should start with building the current
capability resources map.
4.2.1 Modelling capability map and strategies
Before mapping the latest strategy, the first step is to model the current capability
resources map of ArchiPharma. As described in chapter 3. The capability map could
act as a bridge to help organizations managing projects and strategies.
According to the organization structure of the enterprise, the high-level capabilities
map could be identified. Since within the same industries, the organization structures
are similar. To model efficiently, Archipharma could build the capability map based
on samples. As shown in the Figure 39 below, it is the level 3 capability map of the
ArchiPharma. For the capability which organization has less focus than others. We
suggest to model it until level2 to decrease the complexity.
Figure 39 Capability map of ArchiPharma

61
Since there is no input from enterprise architect about the capability service
relationship, we make an assumption to list several service relationships and marked
in the matrix below.
Table 29 Capability service relationship matrix
Serving ↓ From / → To Customer management
Customer order management Reporting management
Order lifecycle management
Order data management
Reporting generating
Reporting exporting
Cu
sto
mer
mg
mt
Cus
tom
er
billi
ng m
gmt
Billing process mgmt
Billing collection mgmt
X
Cus
tom
er
orde
r m
gmt Order lifecycle
mgmt X
Order data mgmt
X
After generating the capability map, the next step is to map the strategies to
capabilities. According to the method, it can be done by identifying strategic
capabilities and determining the capability increment.
Identify strategic capabilities
ArchiPharma identified their strategy goal as “Optimize price quality ratio” to remain
as a product leader. ArchiPharma has made an assessment to identify how well the
“price quality ratio” performs by assessing three drivers: innovation, time to market
and Margin (Figure 40). Stakeholders could set these drivers according to their
concerns.

62
Figure 40 Strategy assessment of product leadership
Then the assessment result shows the identified problems involving:
1. "Innovation" scores low because of "Heterogeneous and complex product
offerings."
2. "Time to market" scores low because of "Lack of insight and anticipation on
new regulations."
3. "Margin" scores low because "Product maintenance is expensive."
For addressing the problems, strategy goals are identified by ArchiPharma as
“improve product offering” and “minimize operational costs” from financial and
customer perspective. However, these two goals are still too general to map the level
3 capability. Therefore, we decompose the strategy goals into four sub level strategy
goals from the internal perspective.
Once the sub strategy goals are identified, the “Goal – Subgoal” matrix could be
filled by stakeholders to ensure the influence level of each sub strategy goal to the
main strategy goal. As shown in Table 30, both new goals and old ones are involved
since ArchiPharma still put the goals of “operational excellence” working in
background.
Table 30 Goal -subgoal matrix
Strategy Goal
Go
al P
rio
rity
Imp
rove
reg
ula
tio
ns
revi
ewin
g
Sta
nd
ard
ize
pro
du
ct
po
rtfo
lio
man
agem
ent
Sim
plif
y
serv
ice
pro
cess
Co
nso
lidat
e
the
app
licat
ion
s
Sta
nd
ard
ize
mar
keti
ng
pro
cess
Cen
tral
ize
info
rmat
ion
Improve
information sharing
0.1 Strong (9)
Facilitate resource sharing
0.1 Strong (9) Strong (9)
Eliminate local variance
0.1 Strong (9) Strong (9)
Improve product offering
0.5 Strong (9) Strong (9) Medium (3) - Medium (3)
Minimized operational
costs
0.2 - Weak (1) Medium (3) Strong (9) Medium (3)
Subgoal Priority 4.5 4.7 2.1 3.6 3.0 1.8
Related Priority 0.23 0.24 0.11 0.18 0.15 0.09
After filling the Goal- Subgoal matrix, next step is to identify the level 3 capabilities
that relate to achieving these strategies. By filling the Subgoal-capability matrix, the
missing capability could be identified if current capabilities could not deliver the
strategy. By reviewing all the level 3 capabilities, we listed the related capabilities in

63
Table 31. After filling this matrix, enterprise architect could also check the accuracy
of the capability map to see if they missed some capabilities while modeling.
Table 31 Sub-goal capability matrix
Sub-strategy Goal S
ub
go
al P
rio
rity
Reg
ula
tory
anal
ysis
Pro
du
ct p
ort
folio
dat
a m
anag
emen
t
Pro
du
ct p
ort
folio
pro
cess
man
agem
ent
Bill
ing
pro
cess
man
agem
ent
Ord
er li
fecy
cle
man
agem
ent
Ap
plic
atio
n
po
rtfo
lio
man
agem
ent
mar
keti
ng
pro
cess
man
agem
ent
Improve regulations reviewing
0.23 Strong (9)
Standardize product portfolio management
0.24 Strong (9)
Strong (9)
Simplify service process
0.11 Strong (9)
Medium (3)
Consolidate the applications
0.18 Strong (9)
Strong (9)
Standardize market process
0.15 Strong (9)
Centralize information
0.09 Strong (9)
Capability Priority 2.07 2.97 2.16 2.7 0.33 1.62 1.35
According to the result of Table 31, a new capability should be built. And it is
identified as “marketing process management” which classified as the sub capability
in “marketing management”. The new capability is shown in Figure 41. The missing
capability is marked in white color, which means it doesn’t exist at the moment.
Figure 41 Sales & marketing management
And the Strategic capabilities of ArchiPharma are marked out with red color from the
capability map and shown as Figure 42.

64
Figure 42 Identified strategic capabilities
Identify the capability increment
As what we discuss before, the organization requires specific capabilities to translate
their strategic into actions. Moreover, it is also necessary for the organization to
determine the target performance level (capability increments) of these capabilities.
The capability performance level could be assessed by measuring its dimensions. As
described, the dimensions are finance, external, physical, human, process, and
technology. For each dimension, stakeholders could set one or several indicators.
Then, stakeholders could determine the target performance level by identifying the
desired status of these indicators. In this case, we made the assumptions of the target
performance as:
Table 32 Target performance level of the strategic capabilities
Regulatory analysis
Indicator Skill
level
time Budget Equipment
performance
Use of
application
Adaptability
of changing
Capability
dimension
human process finance physical Technology external
Indicator the skill The The How well the If the How well to

65
specification level of
employee to
perform the
work
average
time of
finish
regulatory
analysis
budget
for the
regulator
analysis
equipment
performs to
support the
work
application
could fulfill
the
requirement
anticipate the
regulatory
changes
Target 3 4 3 3 4 5
Product portfolio data management
Indicator Skill
level
time Budget Equipment
performance
Use of
application
Adaptability
of changing
Capability
dimension
human process finance physical Technology external
Indicator
specification
the skill
level of
employee
The
average
time of
the
process
The budget
for the
capability
How well to
support the
capability
How well to
fulfill the
requirement
How well to
adapt the
changes
Target 4 4 5 4 3 3
Product portfolio process management
Indicator Skill
level
time Budget Equipment
performance
Use of
application
Adaptability
of changing
Capability
dimension
human process finance physical Technology external
Indicator
specification
the skill
level of
employee
The
average
time of
the
process
The budget
for the
capability
How well to
support the
capability
How well to
fulfill the
requirement
How well to
adapt the
changes
Target 4 5 2 4 4 3
Billing process management
Indicator Skill
level
time Budget Equipment
performance
Use of
application
Adaptability
of changing
Capability
dimension
human process finance physical Technology external
Indicator
specification
the skill
level of
employee
The
average
time of
the
process
The budget
for the
capability
How well to
support the
capability
How well to
fulfill the
requirement
How well to
adapt the
changes
Target 3 5 3 3 4 2
Order lifecycle management
Indicator Skill
level
time Budget Equipment
performance
Use of
application
Adaptability
of changing
Capability
dimension
human process finance physical Technology external
Indicator
specification
the skill
level of
employee
The
average
time of
the
process
The budget
for the
capability
How well to
support the
capability
How well to
fulfill the
requirement
How well to
adapt the
changes
Target 3 4 3 2 4 5
Application portfolio management
Indicator Skill
level
time Budget Equipment
performance
Use of
application
Adaptability
of changing
Capability
dimension
human process finance physical Technology external
Indicator
specification
the skill
level of
employee
The
average
time of
the
The budget
for the
capability
How well to
support the
capability
How well to
fulfill the
requirement
How well to
adapt the
changes

66
process
Target 5 4 3 2 4 2
marketing process management
Indicator Skill
level
time Budget Equipment
performance
Use of
application
Adaptability
of changing
Capability
dimension
human process finance physical Technology external
Indicator
specification
the skill
level of
employee
The
average
time of
the
process
The budget
for the
capability
How well to
support the
capability
How well to
fulfill the
requirement
How well to
adapt the
changes
Target 3 4 3 3 4 4
There is only one indicator identified to assess each dimension performance level in
this case. Nevertheless, it is possible for organizations to set multiple indicators to
assess the performance level more accurately. Then, the organization should set a
weight for each indicator to consolidate the results.
4.2.2 Map ongoing project.
By analyzing the deliverable of each ongoing project, we can identify the goals that
the project could achieve. As shown in Figure 43, project “harmonize billing process”
is to eliminate the local variance of the billing process. Project “Homogenize
information & data” and “Improve global accessibility databases” aim to improve the
information and resource sharing of the customer. The project “Improve global
accessibility databases” also aims to facilitate resources sharing in governance, risk
management, and Compliance management. The project Application rationalization is
to eliminate the local variance of the applications used in governance, risk
management, and compliance management.
Figure 43 Identify ongoing project objectives

67
Then, according to these goals, the related capability could be identified. Then, the
last step is to link the project to the particular capability shown in Figure 44.
Figure 44 Link projects to capabilities
Therefore, there are 9 level-3 capabilities identified. And they listed and grouped in
the Figure 45.
Figure 45 Identified capabilities that relate to ongoing project

68
Then the final part of this step is to identify if there are any dependencies between
these projects. According to the capability map of the organization, projects with
shared capabilities should have dependency relationships and could be proposed to
stakeholders while filling the table.
Table 33 Ongoing projects dependencies matrix
Trigger ↓ From / → To
Receiving
“Homogenize information & data”
Improve global accessibility databases
Harmonize billing process
Application rationalization
Pro
vid
ing
“Homogenize information & data”
- X
Improve global accessibility databases
-
Harmonize billing process
- X
Application rationalization
-
By filling the matrix as Table 33, it is identified that the project “Improve global
accessibility databases” requires the output from the project “Homogenize
information & data”; the project “Application rationalization” should start when
“Application rationalization” is done. The result could be modeled as Figure 46.
Figure 46 Ongoing project dependencies
4.3 Phase B: Portfolio Assessing
The main principle function of phase B is to propose new projects and adjusting
ongoing projects to ensure the strategy alignment.
4.3.1 Assess and adjust projects
The first capability is “Billing process management”. From the analyses result, the
related ongoing projects are the project “harmonize billing process” and the project

69
“Application rationalization”. Then assess the current performance level and the
performance level contributed by these two ongoing projects in Table 34.
Table 34 Anticipate project contribution of billing process management
Billing process management
Indicator Skill
level
time Budget Equipment
performance
Use of
application
Adaptability
of changing
Capability
dimension
human process finance physical Technology external
Indicator
specification
the skill
level of
employee
The
average
time of
the
process
The
budget for
the
capability
How well to
support the
capability
How well to
fulfill the
requirement
How well to
adapt the
changes
Target Level 3 5 3 3 4 4
Current level 3 3 3 2 2 2
harmonize
billing process
3 5 3 3 3 2
Application
rationalization
3 3 3 3 3 2
Projects
Consolidation 3 5 3 3 4 2
According to the project assessment result, the capability related projects could be
modeled as a radar chart shown in Figure 47.
Figure 47 Billing process management related ongoing project radar
From the figure, we can see that the projects will deliver to strengthen the process
technology and physical dimension. However, from the new strategy, the external
dimension is also required to be enhanced to have enough adaptability to deal with
customers’ expectations. Therefore, the current ongoing projects related to capability
“billing process management” cannot fully achieve the strategy.
Enterprise architect could make a solution as proposing an additional project to
strengthen the external dimension. Or, adjust the project “Harmonize billing process”
0
1
2
3
4
5human
process
finance
physical
technology
external
B i l l i n g P r o c e s s M a n a g e m e n t
Target Project Current
Strategy Rank:#2
Project "Harmonize billing process""Application rationalization"
A
H

70
to enhance the external dimension of the billing process management capability. In
the case study, we skipped the sub-activities of project proposing since they are not
the focus of this research.
Here we assume that there are two projects proposed by the enterprise architect with
different deliverables and cost, which are shown in Figure 48.
Figure 48 Proposed projects of billing process management
In the figure, the above solution could fulfill the requirement of enhancing the
capability “business process management”. The second project is proposed with lower
cost and could achieve part of the requirements. Then the manager could make the
decision later by comparing the project cost and strategy achievement of these two
solutions.
For the capability “Regulatory Analysis”, the process is the same, first assess if the
related ongoing project needs to be adjusted or not.
0
1
2
3
4
5human
process
finance
physical
technology
external
Bi l l i ng P ro cess Ma n agement
Target Project Current
Strategy Rank:#2
Capability Budget 40000
Ongoing Project: "Harmonize billing process" 10000"Application rationalization" 10000
Project "Revision of billing process B" Cost 15000
A
H
0
1
2
3
4
5human
process
finance
physical
technology
external
Bi l l i ng P ro cess Ma n agement
Target Project Current
Strategy Rank:#2
Capability Budget 40000
Ongoing Project: "Harmonize billing process" 10000"Application rationalization" 10000
Project "Revision of billing process B" Cost 10000
A
H

71
Table 35 Anticipate project contribution of Regulatory analysis
Regulatory analysis
Indicator Skill
level
time Budget Equipment
performance
Use of
application
Adaptability
of changing
dimension human process finance physical Technology external
Indicator
specification
the skill
level of
employee
The
average
time of
the
process
The
budget for
the
capability
How well to
support the
capability
How well to
fulfill the
requirement
How well to
adapt the
changes
Target Level 4 3 3 3 4 5
Current level 4 3 3 3 3 3
Application
rationalization
3 3 3 3 4 4
According to the assessment result, the capability radar could be shown as:
Figure 49 Capability radar of regulatory analysis
According to the radar chart, the related ongoing projects could strengthen process
dimension and technology dimension when they are delivered. But compared with the
capability increment. The process, human and external and physical dimensions of the
capability still need to be improved. For the project “Application Rationalization”,
there is a project dependency card, shown as Table 36, provided to support enterprise
architecture to make the decision.
Table 36 Project dependency card of Application Rationalization
Application Rationalization
Summary Rationalize the applications used in customer billing process and regulatory analyzing.
Stakeholders Project manager A
Completion Approved
Related Capability
Capability Name Influence Level Serving Capability
Regulatory analysis Strong -
Billing process management Strong -
Customer data management Strong -
Required by projects
Project name Project Owner Required output
- - -
0
1
2
3
4
5human
process
finance
physical
technology
external
Reg u latory An a lys isTarget Project Current
Strategy Rank:#4
Project "Application rationalization"

72
According to the given information, we found out that project “Application
Rationalization” is arranged to separately rationalize the applications that used in the
billing process, customer management, and regulatory analysis and the project does
not rely on any other projects. Therefore, adjusting this project will not affect other
projects or capabilities. Then, the project “Application Rationalization” could be
adjusted.
Figure 50 Proposed solution of regulatory analysis
4.3.2 Propose projects to the capability that has no ongoing project related
After assessing the capability related ongoing projects, we could propose new projects
to achieve the other strategic capabilities. For these capabilities, the current
performance level of each capability would be analyzed.
Table 37 Gap analysis of capabilities without related ongoing projects
Product portfolio data management
Indicator Skill level time Budget Equipment performance
Use of application
Adaptability of changing
Capability dimension
human process finance physical Technology external
Indicator specification
the skill level of employee
The average time of the process
The budget for the capability
How well to support the capability
How well to fulfill the requirement
How well to adapt the changes
Target Level 4 4 5 4 4 5
Current Level 3 3 5 4 3 3
Product portfolio process management
Indicator Skill level time Budget Equipment performance
Use of application
Adaptability of changing
Capability dimension
human process finance physical Technology external
Indicator specification
the skill level of employee
The average time of the process
The budget for the capability
How well to support the capability
How well to fulfill the requirement
How well to adapt the changes
Target Level 4 5 2 4 4 4
0
1
2
3
4
5human
process
finance
physical
technology
external
Reg u latory An a lys isTarget Project Current
Strategy Rank:#4
Project "Application rationalization"

73
Current Level 3 3 2 4 4 3
Order lifecycle management
Indicator Skill level time Budget Equipment performance
Use of application
Adaptability of changing
Capability dimension
human process finance physical Technology external
Indicator specification
the skill level of employee
The average time of the process
The budget for the capability
How well to support the capability
How well to fulfill the requirement
How well to adapt the changes
Target Level 3 4 3 2 4 5
Current Level 3 2 3 2 3 3
Application portfolio management
Indicator Skill level time Budget Equipment performance
Use of application
Adaptability of changing
Capability dimension
human process finance physical Technology external
Indicator specification
the skill level of employee
The average time of the process
The budget for the capability
How well to support the capability
How well to fulfill the requirement
How well to adapt the changes
Target Level 3 4 3 2 4 2
Current Level 3 4 3 2 2 2
According to CBP, the projects could be proposed to close these gaps. Enterprise
could also provide all the proper solutions to one capability in order to support the
further project evaluation and selection. For each proposed project, a project card
could be generated according to the project proposal. Totally, there are six projects
proposed to achieve the strategy.
Project Revision of PPM Process:
Choose, develop and install enterprise-wide PPM software
Develop real-time portfolio monitoring
Develop real-time portfolio reporting
Harmonize local PPM approaches
Install enterprise-wide PPM approach
Inventory all PPM processes
Table 38 Overview of proposed project Revision of PPM process
Project Revision of PPM Process
Summary Professionalize the product portfolio management process
Description -
Stakeholders Manager A
Proposed Budget 10,000
Capability Goals Capability name Priority level Contribution
Product portfolio process management 2.16 (#3) 75%
Required Resources Resource group 4
Project Professionalize marketing:
Align marketing processes
Identify current marketing processes
Consolidate marketing applications
Install necessary applications for monitoring competitors

74
Install process for monitoring competitors
Integrate marketing processes
Table 39 Overview of proposed project Professionalize marketing
Project Professionalize marketing
Summary Professionalize the marketing process
Description -
Stakeholders Manager B
Proposed Budget 15,000
Capability Goals Capability name Priority level Contribution
Market process management 1.35 (#6) 100%
Required Resources Resource group 2
Project Product Rationalization
Analyze current product portfolio
Expand customer channels with internet
Harmonize ordering process
Identify products for termination, migration and consolidation
Rationalize project portfolio
Redesign portfolio into limited set of highly configurable projects
Table 40 Overview of proposed project product rationalization
Project Product Rationalization
Summary Rationalize the product type
Description -
Stakeholders Manager B
Proposed Budget 10,000
Capability Goals Capability name Priority level Contribution
Product portfolio data management 2.07 (#4) 100%
Order lifecycle management 0.33 (#7) 100%
Required Resources Resource group 1
Project Installment of APM process
Choose, configure, test and install APM applications
Design and populate application portfolios
Design enterprise-wide APM process
Table 41 Overview of proposed project installment of APM process
Project Installment of APM process
Summary Optimize the application portfolio management
Description -
Stakeholders Manager C
Proposed Budget 10,000
Capability Goals Capability name Priority level Contribution
Application portfolio management 1.62 (#5) 75%
Required Resources Resource group 1
Project Revision of Billing Process
Version A:

75
o Inventory all PPM processes
o Develop real-time process monitoring
o Develop real-time process reporting
o Harmonize all billing process related applications
Table 42 Overview of proposed project revision of billing process version A
Project Revision of Billing Process Version A
Summary Optimize the flexibility of customer billing process
Description -
Stakeholders Manager A
Proposed Budget 10,000
Capability Goals Capability name Priority level Contribution
Billing process management 2.7 (#1) 29%(2:7)
Required Resources Resource group 2
Version B:
o Inventory all PPM processes
o Develop cycling process monitoring
o Develop cycling process reporting
o Harmonize the entire ordering process related applications
Table 43 Overview of proposed project revision of billing process version B
Project Revision of Billing Process Version B
Summary Optimize the flexibility of customer billing process
Description -
Stakeholders Manager A
Proposed Budget 10,000
Capability Goals Capability name Priority level Contribution
Billing process management 2.7 (#1) 14%(1:7)
Required Resources Resource group 2
4.3.3 Projects Strategy Priority Score
Once all the projects proposed, we made a calculation of project strategy priority
score according to the project contribution to the strategy. The strategy priority score
could become a criterion to support the project selection.
Table 44 Project strategy priority
Su
b
cap
ab
ilit
y
Reg
ula
tory
anal
ysis
Pro
du
ct
po
rtfo
lio
dat
a
man
agem
ent
Pro
du
ct
po
rtfo
lio
pro
cess
man
agem
ent
Bill
ing
p
roce
ss
man
agem
ent
Ord
er
lifec
ycle
man
agem
ent
Ap
plic
atio
n
po
rtfo
lio
man
agem
ent
mar
keti
ng
pro
cess
man
agem
ent
Subgoal Priority Capability Priority 2.07 2.97 2.16 2.7 0.33 1.62 1.35
Professionalize marketing
100% 1.35
Harmonize Billing process
43% 1.16
Application rationalization
67% 43% 2.55

76
Installment of APM process
100% 1.21
Product rationalization
100% 100% 3.30
Revision of billing process A
29% 0.78
Revision of billing process B
14% 0.38
Revision of PPM process
75% 1.62
Figure 51 shows the project priority referring to project budget and project strategy
priority.
Figure 51 project strategy priority chart
4.4 Phase C: Portfolio Arranging
In the last phase, ArchiPharma could have a clear overview by having the strategy
implementation blueprint and project dependency map which could also facilitate
building the roadmap.
4.4.1 Strategy implementation blueprint
After the manager making the decisions, we could build the strategy implementation
blueprint to provide an overview of how the strategy implemented.
As shown in Figure 52, the blueprint involves the strategy map, the related strategic
capabilities, and the corresponding projects. The model could also support the further
assessment. Once a new strategy shift occurs, stakeholders could quickly identify the
affected ongoing projects without mapping all the projects to the capability map.
0
0.5
1
1.5
2
2.5
3
3.5
4
0 5000 10000 15000 20000 25000 30000 35000
Pri
ori
ty S
core
Cost
Project Priority
Product rationalization
Application rationalization
Harmonize Billing process
Revision of PPM process Installment of
APM process
Revision of billing process B
Revision of billing process A
Professionalize marketing

77
Figure 52 Strategy implementation blueprint
4.4.2 Project Dependencies
There are two key attributes that will affect the order of the project implementation:
strategy priority and project dependency. According to the Subgoal capability matrix,
the project “product rationalization”, “Harmonize billing process”, “Revision of PPM
process” and “Professionalize marketing” has the priority. The new project
dependency map is shown in the Figure 53 below.
As shown in the figure, the arrow shows the triggering relationship of the projects.
The project “Revision of PPM process” and the project “Application rationalization”
require the outcome of the project “installment of APM”. Therefore, it should be
arranged in front; even it has low priority. And the projects that required same
resources could be ordered by strategy priority.

78
Figure 53 Project dependencies

79
Chapter5: Evaluation
Evaluation is one main step of DSRM. The observation and measurement about the
quality of the solution will be done in this step. And the evaluation process was done
by performing a small workshop and in the end of the workshop each participant
filled a survey as the feedback about the workshop. This chapter states how the survey
created and discusses the results of the workshop.
5.1 Survey
In order to collect feedback for the new proposed method, a survey is built as the tool
to do the qualitative analysis. While formulating the survey, the model (shown as
Figure 54) from Unified Theory of Acceptance and Use of Technology (UTAUT) is
adopted as the guideline to analyze user acceptance of the new method.
Figure 54 UTAUT Research model (Venkatesh, et al., 2003)
In the research, UTAUT integrates fragmented theory and research on individual
acceptance of information technology into a unified theoretical model that captures
the essential elements of eight previously established models (Venkatesh et al., 2003).
And the summarized as a list of survey which shown as Table 45.
Table 45 List of survey items use for estimating UTAUT (Venkatesh, et al., 2003)
Constructs Definition Items Root Constructs
Performance expectancy
"the degree to which an individual believes that using the system will help him or her to attain gains in job performance."
U6: I would find the system useful in my job. RA1: Using the system enables me to accomplish tasks more quickly. RA5: Using the system increases my productivity. OE7: If I use the system, I will increase my chances of getting a
Perceived usefulness (TAM/TAM2 and C-TAM-TPB), Extrinsic motivation (MM), Job-fit (MPCU), Relative advantage (IDT), and Outcome expectations (SCT)

80
raise.
Effort expectancy
"the degree of ease associated with the use of the system."
EOU3: My interaction with the system would be clear and understandable. EOU5: It would be easy for me to become skillful at using the system. EOU6: I would find the system easy to use. EU4: Learning to operate the system is easy for me.
Perceived ease of use (TAM/TAM2), Complexity (MPCU), and Ease of use (IDT)
Facilitating conditions
"the degree to which an individual believes that an organizational and technical infrastructure exists to support use of the system."
SN1: People who influence my behavior think that I should use the system. SN2: People who are important to me think that I should use the system. SF2: The senior management of this business has been helpful in the use of the system. SF4: In general, the organization has supported the use of the system.
Perceived behavioral control (TPB/ DTPB, C-TAM-TPB), Facilitating conditions (MPCU), and Compatibility (IDT)
Attitude toward using technology
"an individual’s overall affective reaction to using a system."
PBC2: I have the resources necessary to use the system. PBC3: I have the knowledge necessary to use the system. PBC5: The system is not compatible with other systems I use. FC3: A specific person (or group) is available for assistance with system difficulties.
Attitude toward behavior (TRA, TPB/DTPB, C-TAM-TPB), Intrinsic motivation (MM), Affect toward use (MPCU), and Affect (SCT)
Self-efficacy "Judgment of one’s ability to use a technology (e.g., computer) to accomplish a particular job or task."
I could complete a job or task using the system... SE1: If there was no one around to tell me what to do as I go. SE4: If I could call someone for help if I got stuck. SE6: If I had a lot of time to complete the job for which the software was provided. SE7: If I had just the built-in help facility for assistance.
Self-efficacy (SCT)
Behavioral Intention to use the system
“a person's perceived likelihood or subjective probability that he or she will engage in a given behavior"
BI1: I intend to use the system in the next <n> months. BI2: I predict I would use the system in the next <n> months. BI3: I plan to use the system in the next <n> months.
Attitude Toward Behavior (TRA, TPB/DTPB, C-TAM-TPB), Perceived behavioral control (TPB/ DTPB, C-TAM-TPB), Intrinsic motivation (MM)
The survey that used in the workshop is created based on the UTAUT and the
questions are formulated based on Table 45. The entire survey is attached as
Appendix C.

81
5.2 Discussion of the result
A one-hour workshop has been conducted to evaluate the method in BiZZdesign.
There were 5 participants who are all experts from BiZZdesign. The workshop
included a presentation of the method introduction, a discussion and a short survey. In
this section, we did a data analysis of the survey in order to obtain some valuable
insights.
5.2.1 Background information
The survey started with three background questions including participant’s positions
at BiZZdesign and the frequency of using the two key techniques in the method.
1. Participant positions
There were total 5 participants from BiZZdesign joining the workshop. Three of them
are Research Consultants, one is Customer Success Consultant, and the last one is
Interaction Designer. Most of them are under the Research and Development
Department of BiZZdesign.
2. Frequency of using techniques
Figure 55 Frequency of using CBP and PPM
As can be seen in Figure 55, three of five participants rarely use the CBP during their
work; one occasionally uses the technique; and the last one often uses the technique.
There are four participants use PPM sometimes and the other one rarely use the
technique of PPM. It is reasonable since some of them have no work that needs these
techniques.
0 1 2 3 4
rarely
sometimes
often
very often
Project portfolio management Capability-based planning
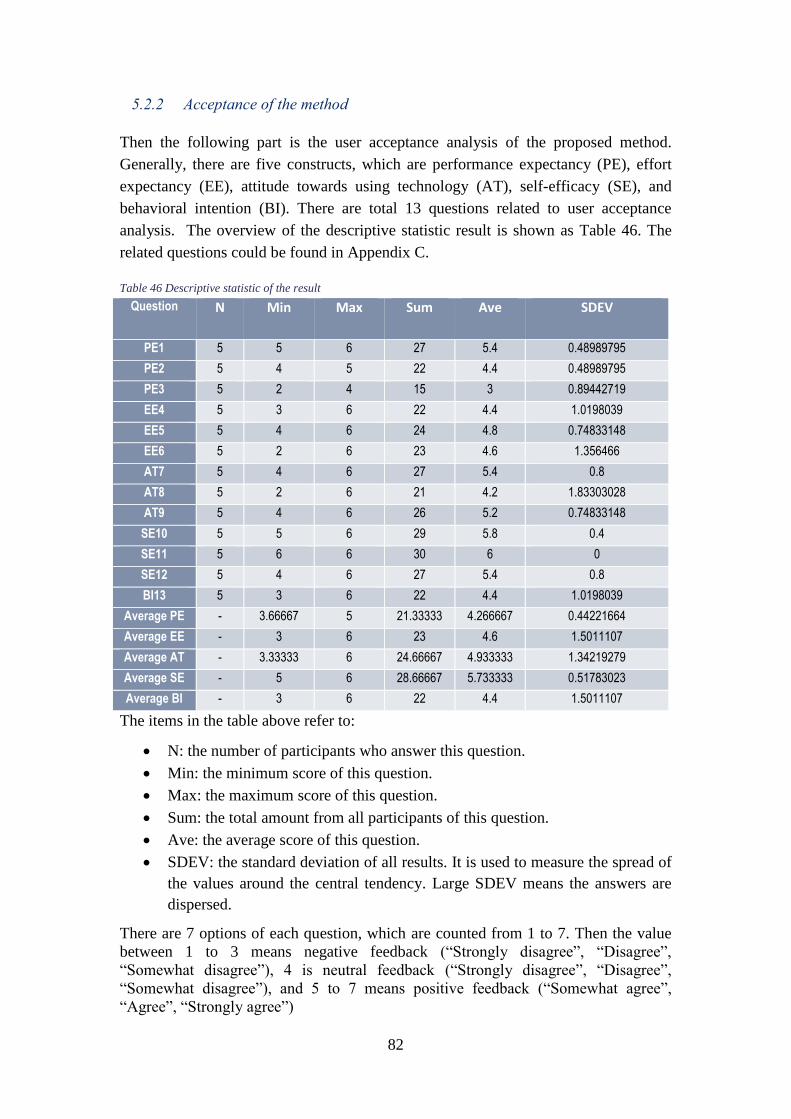
82
5.2.2 Acceptance of the method
Then the following part is the user acceptance analysis of the proposed method.
Generally, there are five constructs, which are performance expectancy (PE), effort
expectancy (EE), attitude towards using technology (AT), self-efficacy (SE), and
behavioral intention (BI). There are total 13 questions related to user acceptance
analysis. The overview of the descriptive statistic result is shown as Table 46. The
related questions could be found in Appendix C.
Table 46 Descriptive statistic of the result
Question N Min Max Sum Ave SDEV
PE1 5 5 6 27 5.4 0.48989795
PE2 5 4 5 22 4.4 0.48989795
PE3 5 2 4 15 3 0.89442719
EE4 5 3 6 22 4.4 1.0198039
EE5 5 4 6 24 4.8 0.74833148
EE6 5 2 6 23 4.6 1.356466
AT7 5 4 6 27 5.4 0.8
AT8 5 2 6 21 4.2 1.83303028
AT9 5 4 6 26 5.2 0.74833148
SE10 5 5 6 29 5.8 0.4
SE11 5 6 6 30 6 0
SE12 5 4 6 27 5.4 0.8
BI13 5 3 6 22 4.4 1.0198039
Average PE - 3.66667 5 21.33333 4.266667 0.44221664
Average EE - 3 6 23 4.6 1.5011107
Average AT - 3.33333 6 24.66667 4.933333 1.34219279
Average SE - 5 6 28.66667 5.733333 0.51783023
Average BI - 3 6 22 4.4 1.5011107
The items in the table above refer to:
N: the number of participants who answer this question.
Min: the minimum score of this question.
Max: the maximum score of this question.
Sum: the total amount from all participants of this question.
Ave: the average score of this question.
SDEV: the standard deviation of all results. It is used to measure the spread of
the values around the central tendency. Large SDEV means the answers are
dispersed.
There are 7 options of each question, which are counted from 1 to 7. Then the value
between 1 to 3 means negative feedback (“Strongly disagree”, “Disagree”,
“Somewhat disagree”), 4 is neutral feedback (“Strongly disagree”, “Disagree”,
“Somewhat disagree”), and 5 to 7 means positive feedback (“Somewhat agree”,
“Agree”, “Strongly agree”)
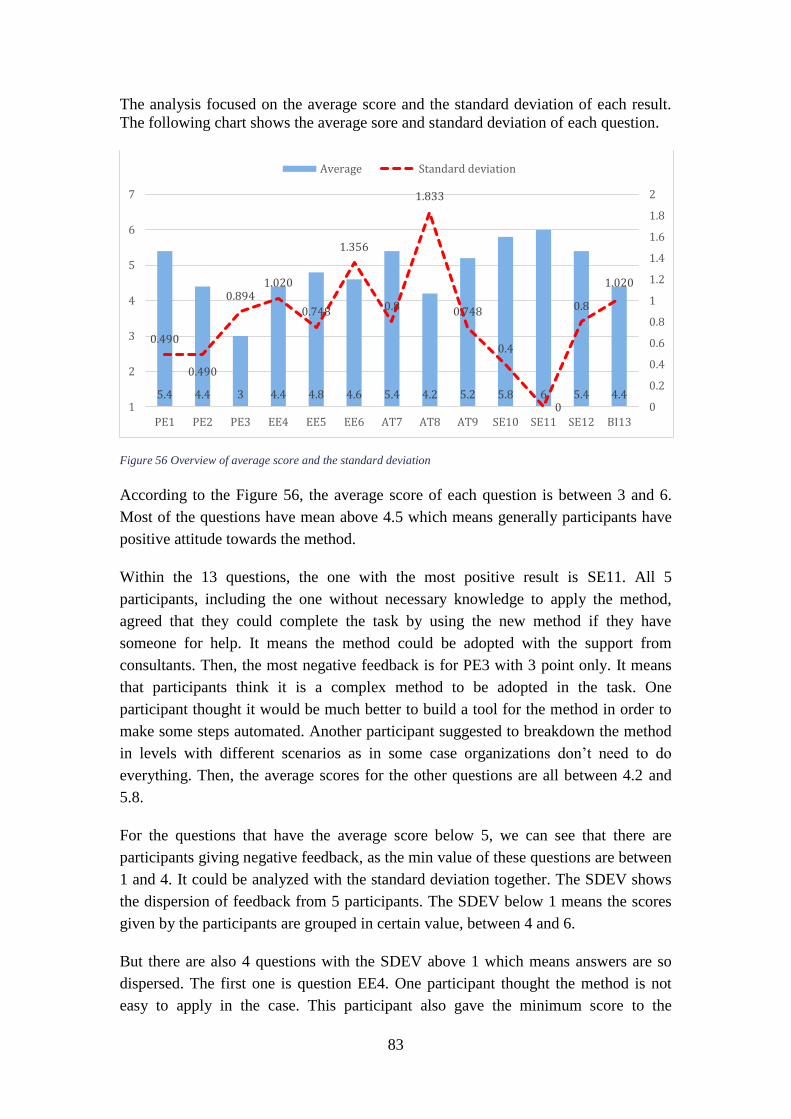
83
The analysis focused on the average score and the standard deviation of each result.
The following chart shows the average sore and standard deviation of each question.
Figure 56 Overview of average score and the standard deviation
According to the Figure 56, the average score of each question is between 3 and 6.
Most of the questions have mean above 4.5 which means generally participants have
positive attitude towards the method.
Within the 13 questions, the one with the most positive result is SE11. All 5
participants, including the one without necessary knowledge to apply the method,
agreed that they could complete the task by using the new method if they have
someone for help. It means the method could be adopted with the support from
consultants. Then, the most negative feedback is for PE3 with 3 point only. It means
that participants think it is a complex method to be adopted in the task. One
participant thought it would be much better to build a tool for the method in order to
make some steps automated. Another participant suggested to breakdown the method
in levels with different scenarios as in some case organizations don’t need to do
everything. Then, the average scores for the other questions are all between 4.2 and
5.8.
For the questions that have the average score below 5, we can see that there are
participants giving negative feedback, as the min value of these questions are between
1 and 4. It could be analyzed with the standard deviation together. The SDEV shows
the dispersion of feedback from 5 participants. The SDEV below 1 means the scores
given by the participants are grouped in certain value, between 4 and 6.
But there are also 4 questions with the SDEV above 1 which means answers are so
dispersed. The first one is question EE4. One participant thought the method is not
easy to apply in the case. This participant also gave the minimum score to the
5.4 4.4 3 4.4 4.8 4.6 5.4 4.2 5.2 5.8 6 5.4 4.4
0.490
0.490
0.8941.020
0.748
1.356
0.8
1.833
0.748
0.4
0
0.8
1.020
0
0.2
0.4
0.6
0.8
1
1.2
1.4
1.6
1.8
2
1
2
3
4
5
6
7
PE1 PE2 PE3 EE4 EE5 EE6 AT7 AT8 AT9 SE10 SE11 SE12 BI13
Average Standard deviation
84
question PE3. It could be understood that this participant thought method is too
complex to be applied in a case.
The question EE6, AT8, and BI13 also have a large SDEV. BI13 is to ask if the
participant wants to use the method in the future. Two participants showed the
willingness. Two participants gave neutral answers and the last one thought he would
not use it. The result could be analyzed with their positions together. The participants
who had positive result are the customer success consultant and one research
consultant. Their work involves the area of project portfolio management. As a result,
they showed the interests in implementing the method in the future. The interaction
designer thought he would not use the method as it out of his scope.
AT8 is to analyze if the participant has all necessary knowledge to use the method.
The interaction designer and the customer success consultant stated that they lacked
knowledge, while all the research consultants mentioned they had all necessary
knowledge, so the SDEV is above 1.
EE6 is about the interaction with the method. One participant gave a core 2 while the
others gave 5 or 6, because the participant had questions about measuring the
capability performance. He thought the success of the method is highly depending on
the ability to measure the capability performance. As capability performance
assessment is a part of CBP, we directly use the approach within CBP instead of
designing a new approach to assess the capability performance.
At last, based on the survey result and experts’ opinion, there are some conclusions
generated:
1. The proposed method could improve the performance of project portfolio
management. With the method, organizations could have more transparency
and better control of their ongoing projects.
2. The proposed method could be adopted smoothly if there is a consultant or a
guideline.
3. However, the proposed method is complex. Therefore, it suggests that the next
step could be simplify the method.

85
Chapter6: Discussion and Conclusion
In the previous chapters, we firstly proposed a project portfolio management method
to facilitate organizations for the purpose of dealing with the strategy shift; then, we
did a case study for demonstration and held a workshop as evaluation.
This chapter aims to make a conclusion about the entire research, involving the
answers to the research questions, the contributions, the limitations, and the
recommendations for the future research.
6.1 Answers to Research Questions
The main research question has been formulated as:
How to support effective portfolio management using the
Capability-based Planning in a dynamic environment?
We answered this question by proposing a new method to assess the affected ongoing
projects. Before designing the method, we did a literature review to answer the two
sub-questions firstly.
RQ1: What is the relationship between portfolio management and CBP?
As defined, the portfolio management is to manage the portfolios to achieve the
strategy. In the portfolio management, the focus is how projects are selected,
prioritized, integrated, managed and controlled in the multi-project context. And CBP
is a business planning technique that helps to plan the strategy implementation.
Therefore, CBP has no overlap with portfolio management, but it provides the
relevant information that required in the portfolio management.
RQ2: How could CBP help to optimize portfolio management?
The projects and portfolios could be treated as the working packages in the CBP,
aiming to achieve the capability increment and to realize the strategy. Therefore,
conversely, CBP could be adopted as an approach to the portfolio management that
contributes to project proposing and project strategy aligning.
To be more detailed, by using CBP, strategies could be translated to the changing
requirements to the capabilities. Then, firstly, projects could be proposed as the
working package to achieve these demands. Secondly, while strategy changed, which
means the capabilities may have new requirements, the impacted ongoing projects
should be quickly identified. Thirdly, with the CBP, the strategy alignment of the

86
projects could be measured more easily by assessing if the project delivers the
desirable outcome that could fulfill the changing requirements of the capability.
6.2 Contribution
The biggest contribution of this research is providing a method that enables strategy
alignment in the project portfolio management, especially in the case of the strategy
shift. What’s more, according to the evaluation results that discussed in chapter 5, the
key contributions of this research can be summarized and classified into the
theoretical contributions and the practical contributions, which are:
Theoretical Contributions:
1. Link projects to capabilities in different levels. The first contribution of this
research is using the CBP to describe how the ongoing projects contribute to the
organization by identifying the objectives of the projects and mapping the goals to
the high-level capabilities. Then determine the appropriate level of the capabilities
and link the projects to the capabilities.
2. Analyze the relationship between capability dependencies and the project
dependencies. In the research, we analyzed all seven types of relationship between
capabilities and identified the relationship that could cause the performance
dependencies between capabilities. Then according to the identified capability
dependencies, some dependency relationship between projects could be identified
automatically.
3. Propose an approach to calculate the strategy priority score of the capabilities and
projects with the related equations. In this study, we identify the strategy priority
of the projects by calculating the completion percentage of the capability
increment and then combining them with the priority score of the capability. It
helps in a situation that a capability is contributed by several projects or a project
contributes to several capabilities.
Practical Contributions:
1. Model the proposed method in ArchiMate 3.0 language. Since the CBP is a main
technique adopted in the proposed method and the projects could also be modelled
as working package. The proposed method in this research is close to the usage of
ArchiMate. It could also facilitate combining the proposed method with other
methods which follow the principles of ArchiMate 3.0.
2. Based on linking the projects to the capabilities, analyze the relationship between
capability dependencies and project dependencies. The proposed method could
help the users identified the affected projects while strategy shifts or projects are
adjusted or abandoned.

87
3. Model the project deliverables into capability performance chart. As shown in
Figure 25, the capability is decomposed into six dimensions. The project
deliverables could be modeled as the enhancement of one or some dimensions of
the capabilities. It facilitates the enterprise architect.
6.3 Research Limitation
6.3.1 Limitations of literature review
Although SLR method is designed very comprehensively, in this research, there are
still some limitations due to both the SLR method itself and the situation of this
research:
Searching Database
Based on the order of SLR steps, there is a limitation because the selected databases
may not include all the relevant studies. This limitation is controlled by reviewing the
references of the selected papers.
Literature Selection
For the selected studies, the limitation is about selection bias. Normally, in a
systematic literature review, the literature selection is done by several researchers
with several round selections to avoid selection bias. In this SLR, since there is only
one researcher, the studies selection and data extraction could have introduced bias.
Personal preferences might be involved when selecting the studies.
6.3.2 Limitations of the Proposed Method
According to the case study in chapter 4, several limitations are identified of the new
proposed method.
Firstly, the method limits the input data type. While collecting the required
information, the adopted techniques are strategy map and capability map. This limits
the input data type. Therefore, it needs extra steps to translate the related information
into strategy map and capability map if the organization doesn’t have them. The
operating guidelines for modeling the strategy map and capability map have been
listed in Chapter 3.2.1.
Secondly, in the case study, capability performance related assessments are skipped
because of the data limitation, the performance level of each capability dimension is
directly assumed.

88
Lastly, in this research, we focus on how to make project align with the strategy.
However, in the project portfolio management, strategy alignment is not the only
criterion. As other criteria like risk analysis are out of the research scope, it requires
further development to extend the method to involve more criteria like risk, time to
market. Further research could keep optimizing the equation to identify the priority of
the projects
6.3.3 Limitations according to the evaluation
Based on the survey result, there are two limitations identified.
1. Assessing the capability performance need to be improved. The data accuracy
will highly affect the success of the method. It is critical to have an
appropriate approach to evaluate the capability performance. Although there
are already some capability performance assessment frameworks proposed, it
still lacks detailed guideline. It could be a research direction in the future.
2. The method is complex and users need time to apply the method. As
mentioned in the discussion of the evaluation, it does require time and effort to
use the entire method as the method covered the areas of strategy, capability,
and projects. It suggests to simplify the method in different aspects or levels
with different scenarios. It also suggests to implement the method in tools with
the guidance to different scenarios.
6.4 Recommendation for Future Work
Considering the limitations, we suggest further study to improve the method. Apart
from limitations, there are also some possible directions for the future research.
Firstly, in this method, the focus is on the business perspective. The capability map is
mainly including the business capabilities. Further research could consider involving
more details for the supporting capabilities; then the method could not only support
the strategy implementation but also support bottom- up innovation.
Secondly, the project deliverable could be modeled as the capability enhancement in
this research. If we want to show more details about the project deliverable, we could
model the deliverable as a plateau in the enterprise architecture. Then there is a
challenge that, in the enterprise architecture, it is hard to present the enhancement of
human skill or the financial level.
Thirdly, in this research, we study the IT4IT RA which enables the real-time
monitoring and recording the important information about the project. Future research
could move the emphases on the project implementation. With the support of IT4IT

89
RA and CBP, cycling monitor the strategy alignment and business value during the
project implementation.

90
References
Abrantes, R., & Figueiredo, J. (2015). Resource management process framework for
dynamic NPD portfolios. International Journal of Project Management, 33(6),
1274–1288.
Aldea, A., Iacob, M.-E., Hillegersberg, J. v., Quartel, D., Bodenstaff, L., & Franken,
H. (2015). Modelling strategy with ArchiMate. SAC '15 Proceedings of the
30th Annual ACM Symposium on Applied Computing (pp. 1211-1218). ACM.
Amaral, A., & Araujo, M. (2009 ). Project Portfolio Management Phases: A
Technique for Strategy Alignment. International Journal of Social,
Behavioral, Educational, Economic, Business and Industrial Engineering,
3(10).
Archer, N., & Ghasemzadeh, F. (1999). An integrated framework for project portfolio
selection. International Journal of Project Management, 17(4), 207-216.
Artto, K., & Dietrich, P. (2004). Strategic Business Management through Multiple
Projects. In The Wiley Guide to Managing Projects (pp. 144-176).
Azevedo, C. L., Iacob, M.-E., Paulo , J., Almeida, A., van Sinderen, M., Pires, L. F.,
& Guizzardi, G. (2015). Modeling resources and capabilities in enterprise
architecture: A well-founded ontology-based proposal for ArchiMate.
Information Systems, pp. 235–262.
BBC. (2016). UK industry in recession for third time in eight years. Retrieved 4 28,
2016, from http://www.bbc.com: http://www.bbc.com/news/business-
36266178
Becker, C., Antunes, G., Proenca, D., Barateiro, J., Vieira , R., & Borbinha, J. (2012).
Assessing Digital Preservation Capabilities Using a Checklist Assessment
Method. 9th International Conference on Preservation of Digital Objects.
Toronto, Canada: iPRES 2012.
Beringer, C., Jonas, D., & Kock, A. (2013). Behavior of internal stakeholders in
project portfolio management and its impact on success. International Journal
of Project Management, 31(6), 830-846.
Bitman, W. R. (2005). R&D Portfolio Management Framework for Sustained
Competitive Advantage.

91
Bodenstaff, L., & Quartel, D. (2014). Application Portfolio Management Gaining
control of large landscapes. Enschede: BiZZdesign.
Bodenstaff, L., Quartel, D., & Lankhorst, M. (2014). From Strategy to Successful
Implementation with Enterprise Portfolio Management. BiZZdesign.
Cheng, S. (2015). Translating Strategy into Implementation via Capability-based
planning. Enschede: University of Twente.
Cooper, R. G., Edgett, S. J., & Kleinschmidt, E. J. (2001). Portfolio Management for
New Products (reprint ed.). Basic Books.
Dahlgren, J., & Soderlund, J. (2010). Modes and mechanisms of control in multi-
project organisations: the R&D case. International Journal of Technology
Management, 50(1), 1-22.
Dietrich, P., & Lehtonen, P. (2005). Successful management of strategic intentions.
pp. 386-391.
Heising, W. (2012). The integration of ideation and project portfolio management —
A key factor for sustainable success. (E. Ltd, Ed.) International Journal of
Project Management(30), 582–595.
Helfat, C. E., & Winter, S. G. (2011, Nov.). Untangling Dynamic and Operational
Capabilities: Strategy for the (N)ever-Changing World. Strategic Management
Journal, 32(11), 1243–1250. doi:10.1002/smj.955
Hevner, A., & Chatterjee, S. (2010). Design Research in Information Systems.
Springer.
Investopedia. (2003). Portfolio Management Definition. Retrieved 5 4, 2016, from
http://www.investopedia.com:
http://www.investopedia.com/terms/p/portfoliomanagement.asp
Jeffery, M., & Leliveld, I. (2004). Best practices in IT portfolio management. MIT
Sloan Manage, 41–49.
Killen, C. P., & Kjaer, C. (2012). Understanding project interdependencies: The role
of visual representation, culture and process. International Journal of Project
Management, 554-566.
Krisnawati, A. M. (2015). Project Portfolio Valuation with Enterprise Architecture.
Univrtsity of Twente, Faculty of Electrical Engineering, Mathematics &
Computer Science.

92
Lankhorst, M., & van Dijk, S. (2014, 10 10). Driving Business Outcomes with
Enterprise Architecture as a Knowledge Hub. Retrieved 4 23, 2016, from
bizzdesign.com: http://blog.bizzdesign.com/driving-business-outcomes-with-
enterprise-architecture-as-a-knowledge-hub
Levine, H. A. (2005). Project Portfolio Management: A Practical Guide to Selecting
Projects, Managing Portfolios, and Maximizing Benefits (Wiley Desktop
Editions ed.). Wiley.
Lohman, D. F., & Lakin, J. M. (2011). Handbook of Intelligence . In R. J. Sternberg,
S. B. Kaufman, R. J. Sternberg, & S. B. Kaufman (Eds.), The Cambridge
Handbook of Intelligence (2nd Edition ed.). Cambridge: Cambridge
University Press.
Martinsuo, M. (2013). Project portfolio management in practice and in context.
International Journal of Project Management, 794–803.
McFarlan, F. W., & Cathleen, B. (2003). Connecting the Dots: Aligning Projects with
Objectives in Unpredictable Times. Boston,MA : Harvard Business School
Press.
Melton, T. (2011). Real Project Planning: Developing a Project Delivery Strategy.
Butterworth-Heinemann.
Miklos, J. (2012). A meta-model for the spatial capability architecture. Journal of
Theoretical and Applied Information Technology, 43(2), 301-305.
Nolan, R. L. (1973, July). Managing the computer resource: a stage hypothesis.
Communications of the ACM, 16(7), 399-405 .
Padovani, M., & Carvalho, M. M. (2016). Integrated PPM Process: Scale
Development and Validation. International Journal of Porject Management,
627-642.
Pajaresa, J., & Lopeza, A. (2014). New Methodological Approaches To Project
Portfolio Management: the Role of Interactions Within Projects And
Portfolios. Procedia - Social and Behavioral Sciences, 645-652.
Patanakul, P. (2015). Key attributes of effectiveness in managing project portfolio.
International Journal of Project Management, 33(5), 1084-1097.
Patanakul, P., & Milosevic, D. (2009). The effectiveness in managing a group of
multiple projects: factors of influence and measurement criteria. .
International Journal of Project Management, 27(3), 216–233.

93
Peffers, K., Tuunanen, T., Rothenberger, M. A., & Chatterjee, S. (2008, December 1).
A Design Science Research Methodology for Information Systems Research.
Journal of Management Information Systems, 24(3), 45-77.
Petit, Y. (2012, July). Project portfolios in dynamic environments: Organizing for
uncertainty. International Journal of Project Management, 30(5), 539–553.
Project Management Institude. (2012). Pulse of the Profession Portfolio Management.
Project Management Institute, Inc.
Project Management Institute. (2013). The Standard for Portfolio Management (3 ed.).
Atlanta: Project Management Institute, inc.
Project Management Institute. (2015). PMI Lexicon of Project Management Terms.
Atlanta: Project Management Institute, Inc.
Rawlin, R. (2016, 4 27). Global Recession in 2016 and Beyond - The Obvious
Evidence. Retrieved 5 1, 2016, from The Market Oracle:
http://www.marketoracle.co.uk/Article54966.html
Ray, G., Barney, J. B., & Muhanna, W. A. (2004, Jan.). Capabilities, business
processes, and competitive advantage: choosing the dependent variable in
empirical tests of the resource-based view. Strategic Management Journal,
25(1), 23–37. doi:10.1002/smj.366
Stirna, J., Grabis, J., Jelena, Z., & Henkel, M. (2012). Capability driven
development—an approach to support evolving organizations. The Practice of
Enterprise Modeling, 117–131.
Stummer, C., & Heidenberger, K. (2003). Interactive R&D portfolio analysis with
project interdependencies and time profiles of multiple objectives.
Transactions on Engineering Management, 50(2), 175–183.
Tavana, M., Keramatpour, M., Santos-Arteaga, F. J., & Ghorbaniane, E. (2015). A
fuzzy hybrid project portfolio selection method using Data Envelopment
Analysis, TOPSIS and Integer Programming. Expert Systems With
Applications, 8432-8444.
The Open Group. (2011). Business Capability Management. Retrieved from
www.opengroup.org:
http://www.opengroup.org/johannesburg2011/Ulrich%20Kalex%20-
%20Business%20Capability%20Management.pdf
The Open Group. (2011). TOGAF version 9 (9.1 ed.). The Open Group.

94
The Open Group. (2015). IT4IT Reference Architecture, Version 2.0 (2 ed.). Berkshire:
The Open Group.
The Open Group. (2016). IT4IT™ for Managing the Business of IT – A Management
Guide. Van Haren.
The Open Group. (2016). Open Group Guide-Business Capabilities. The Open Group.
Ulrich, W., & Rosen, M. (2011 ). The Business Capability Map: The ―Rosetta Stone‖
of Business/IT Alignment. . Enterprise Architcture, 1–23.
Wieringa, R. J. (2014). Design Science Methodology for Information Systems and
Software Engineering (1 ed.). Enschede, Netherlands: Springer-Verlag Berlin
Heidelberg.
Willmott, P. (2013). the digital enterprise. Retrieved from mckinsey.com:
http://www.mckinsey.com/business-functions/business-technology/our-
insights/the-digital-enterprise
Young, M., & Conboy, K. (2013). Contemporary project portfolio management:
Reflections on the development of an Australian Competency Standard for
Project Portfolio Management. International Journal of Project Management,
31(8), 1089-1100.

95
Appendixes
A. Alignment among constructs, indicators and its references of
portfolio management
Construct Indicator Reference
Kno
wle
dge
of
the
orga
niza
tiona
l con
text
(K
OC
)
KOC1:Existence of a formal planning process, reflecting internal and external stakeholders perspectives
Archer and Ghasemzadeh (1999), Beringer et al. (2013).
KOC2:Knowledge about constraints, capabilities, uncertainties and interdependencies
Artto and Dietrich (2004), Cañ ez and Garfias (2006), Martinsuo and Lehtonen (2007), Buys and Stander (2010), Voss and Kock (2013), Teller and Kock (2013), Patanakul (2015)
KCO3: To have strategic performance measure
systems
Barczak and Sultan (2006)
Opp
ortu
nity
iden
tific
atio
n (O
I)
OI1:Preparation of a list of proposed projects and single ongoing projects
PMI (2013a), Lacerda et al. (2011), Englund and Grahm (1999)
OI2: Garner minimum data for each project from the list, such as scope, value, market, etc.
and the objectives of each project
PMI (2013a), Lacerda et al. (2011), Englund and Grahm (1999)
Dec
isio
n cr
iteria
(D
C)
DC1: Criteria for evaluate individual projects Chien (2002)
DC2: Decision criteria for project selection and prioritization
Cooper et al. (1997), Hart et al. (2003), Girotra
et al. (2007), Hart et al. (2003)
DC3:Giving weights for each decision criteria Coldrick et al. (2005), Agresti and Harris (2009)
DC4:Alignment of decision criteria with stakeholder desires
Shenhar and Dvir (2007), Buys and Stander (2010)
DC5:Definition of decision criteria occur in a multidisciplinary committee
Chien (2002)
Cla
ssifi
catio
n (C
L)
CL1:Classification of project criteria for engineering systems aimed at better decision making
Agresti and Harris (2009), Dye and Pennypacker (2000), PMI (2013a), Lager (2002), Jolly (2003)
CL2: Classification of projects is used to
compare similar projects
Shenhar (2001), Liesio and Salo (2008),
Floricel and Ibanescu (2008)
CL3:Budget is allocated to projects with the same classification
Shenhar (2001), Shenhar and Dvir (2007)
CL4: Projects with the same classification are compared and have concurrent resources
Shenhar (2001)
Sel
ectio
n,
prio
ritiz
atio
n,
optim
izat
ion
and
sequ
enci
ng (
SP
OS
)
SPOS1: Project selection model Coldrick et al. (2005), Lawson et al. (2006),
Liesio and Salo (2008)
SPOS2:Methodology and easy to use decision tools (AHP, ANP, DEA)
Greiner and Fowler (2003), Joshi and Lambert (2009), Linton et al. (2007), Mavrotas et al. (2008), Linton, et al. (2002), Coldrick et al. (2005), Wallenius et al. (2008)
SPOS3: Stakeholder participation in the
decision criteria definition
Chien (2002)
SPOS4: Constraints are considered in the resource allocation
Angelou and Economides (2008), Bitman and Sharif (2008), Danilovic and Sandkull (2005)
SPOS5: Environment and socio-environmental constraints applied to project selection
Liesio and Salo (2008), Angelou and Economides (2008), Trappey et al. (2009), Danilovic and Sandkull (2005)
SPOS6: Project prioritizations and selection consider interdependencies and synergies
between projects
Liesio and Salo (2008), Angelou and Economides (2008), Trappey et al. (2009),
Danilovic and Sandkull (2005)

96
SPOS7: Optimization tools are used in allocation resources and prioritization of projects
Mavrotas et al. (2008), Blau et al. (2004), Angelou and Economides (2008)
SPOS8:Postpone deadline is considered in allocation of resources activity
Jonas (2010), Englund and Grahm (1999), Archer and Ghasemzadeh (1999), Cooper et al. (1999)
Bal
anci
ng (
BA
L)
BAL1: Alignment of portfolio with strategy Archer and Ghasemzadeh (1999), Cooper et al. (1999), Greiner and Fowler (2003)
BAL2:Balancing of portfolios from different areas considering different criteria: innovation, financial risk, etc., and balancing techniques.
Bitman (2005), Caron et al. (2007), Chao and Kavadias (2008);
App
rova
l
(AP
P)
APP1:Formal approval process of projects in the portfolio
PMI (2013a)
APP2:Centralization of the decision making in respect to the approval process of projects
PMI (2013a)
Res
ourc
e al
loca
tion
(RA
)
RA1: Effective use of resources Al-Fawzan and Haouari (2005), Mohanty and Deshmukhb (1997), Varma et al. (2008), Chen and Wei (2009), Cheng et al. (2006), Lin and Hsu (2010), Ngo-The and Ruhe (2009)
RA2: Impact of litigation due to the allocation of
shared resources to the project
Elonen and Artto (2003)
RA3: Clarity about human resources available Chen and Wei (2009), Jonas (2010), Engwall and Jerbrant (2003), Ngo-The and Ruhe (2009)
RA4: Clarity about budget available Chen and Wei (2009), Jonas (2010), Engwall and Jerbrant (2003), Ngo-The and Ruhe (2009)
RA5: Clarity about technological resources
available
Chen and Wei (2009), Jonas (2010), Engwall and Jerbrant (2003), Ngo-The and Ruhe (2009)
RA6: The responsibility to define the project management is concerned to a PMO (project management office)
Chen and Wei (2009), Jonas (2010), Engwall and Jerbrant (2003), Ngo-The and Ruhe (2009)
RA7: Partial allocation of human resources with
matrix structure of resources
Elonen and Artto (2003)
RA8: Leverage of resources Trappey et al. (2009), Kendall and Rollins
(2003)
RA9: Political negotiation of resources Jonas (2010), Elonen and Artto (2003)
For
mat
ion
of p
ortfo
lio (
FP
) FP1: Planning and programming of projects in
the portfolio
Cohen et al. (2004), Kao et al. (2006), Stouffer and Rachlin (2003), (PMI, 2013a)
FP2: Measurements of physical progress of
projects and portfolios PMI (2013a)
FP3: Existence of portfolio management
support tools
Artto and Dietrich (2004), Hui et al. (2008)
FP4: Existence of tools of portfolio management
Reyck et al. (2005)
Eva
luat
ion
(EV
)
EV1—The inclusion of projects in the portfolio takes into account the fact that its scope is aligned with the organization's strategic plan.
Englund and Graham (1999), PMI (2013a), Lacerda et al. (2011), Crawford (2002)
EV2—The organization evaluates projects according to strategic priorities.
Englund and Graham (1999), PMI (2013a), Lacerda et al. (2011), Crawford (2002)
EV3—All projects are compared with each other and compete for the same resources, regardless of classification.
Archer and Ghasemzadeh (1999), Cooper et al. (1998), Greiner and Fowler (2003), Jonas (2010), Englund and Graham (1999), Edwards
et al. (2003)
EV4—Projects belonging to the same classification are compared to each other and compete for the same resources, however, they are not compared or compete for resources other classification
Archer and Ghasemzadeh (1999), Cooper et al. (1998), Greiner and Fowler (2003), Jonas (2010), Englund and Graham (1999), Edwards et al. (2003)

97
Pro
ject
po
rtfo
lio
man
agem
ent
infr
astr
uctu
re (
PP
MI)
Project Management Office Structure (PMO) PMO: Influence of the types of PMO on portfolio management
Dai and Wells (2004); Patah and Carvalho (2009); Lopes (2009)
Organizational Project Management Maturity (OPM) OPM: Influence of the stages of maturity in
organizations
Cooke-Davis and Arzimanow (2003), Martinsuo and Lehtonen (2007), Beringer et al. (2013)
Information Technology for Project Support (IT) IT: Impact of the use of IT on project success
Froese (2010), Barczak et al. (2007), Salem and Mohanty (2008), Browning (2010), Artto and Dietrich (2004), Hui et al. (2008), Lam et al. (2010), Shenhar (2001), Vaccaro et al. (2010), Martinsuo et al. (2014)

98
B. Capability performance assessment framework (Cheng, 2015)

99
C. Survey for the workshop

100
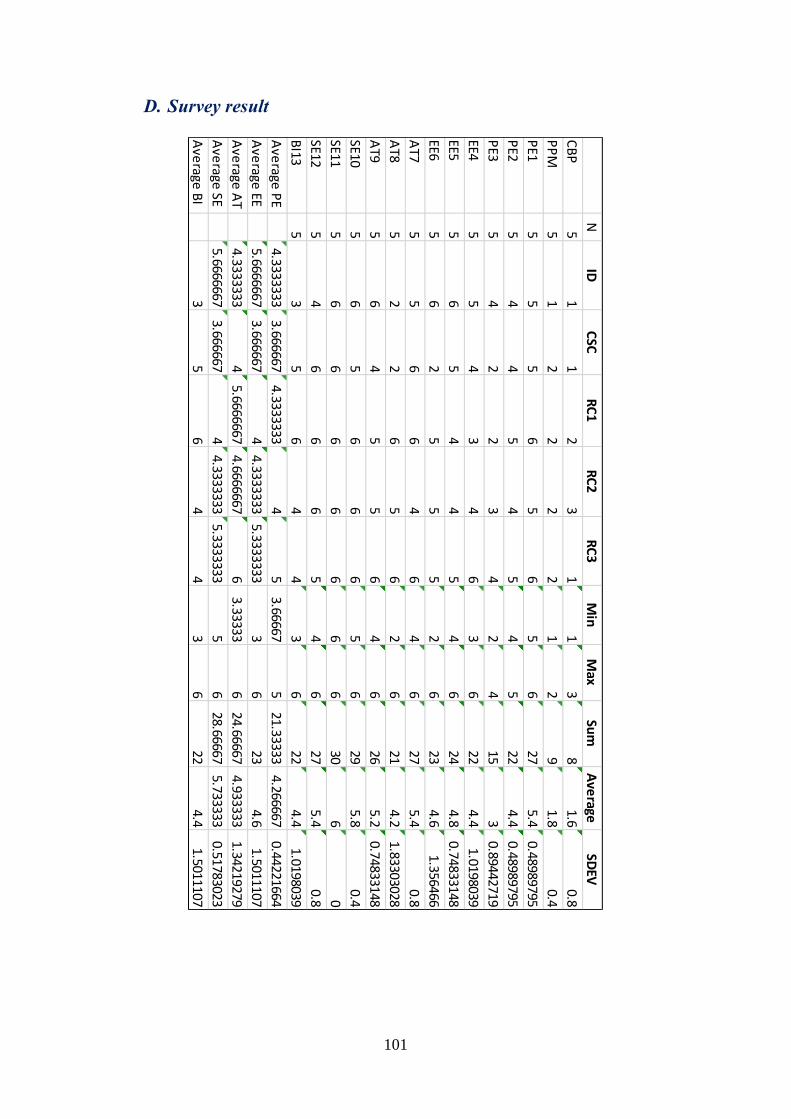
101
D. Survey result
NID
CSC
RC
1R
C2
RC
3M
inM
axSu
mA
verage
SDEV
CB
P5
11
23
11
38
1.60.8
PP
M5
12
22
21
29
1.80.4
PE1
55
56
56
56
275.4
0.48989795
PE2
54
45
45
45
224.4
0.48989795
PE3
54
22
34
24
153
0.89442719
EE45
54
34
63
622
4.41.0198039
EE55
65
44
54
624
4.80.74833148
EE65
62
55
52
623
4.61.356466
AT7
55
66
46
46
275.4
0.8
AT8
52
26
56
26
214.2
1.83303028
AT9
56
45
56
46
265.2
0.74833148
SE105
65
66
65
629
5.80.4
SE115
66
66
66
630
60
SE125
46
66
54
627
5.40.8
BI13
53
56
44
36
224.4
1.0198039
Ave
rage P
E4.3333333
3.6666674.3333333
45
3.666675
21.333334.266667
0.44221664
Ave
rage EE
5.66666673.666667
44.3333333
5.33333333
623
4.61.5011107
Ave
rage A
T4.3333333
45.6666667
4.66666676
3.333336
24.666674.933333
1.34219279
Ave
rage SE
5.66666673.666667
44.3333333
5.33333335
628.66667
5.7333330.51783023
Ave
rage B
I3
56
44
36
224.4
1.5011107