Embed Size (px)
Citation preview
PROJECT OF DEVELOPMENT COOPERATION
OF THE CZECH REPUBLIC AND MACEDONIA
„OLD ENVIRONMENTAL BURDENS IN CHEMICAL
PLANT OHIS, SKOPJE“
November 2009
Updated Risk Assessment
Report
PROJECT OF DEVELOPMENT COOPERATION OF THE CZECH REPUBLIC AND MACEDONIA
„OLD ENVIRONMENTAL BURDENS IN CHEMICAL PLANT OHIS, SKOPJE“
Updated Risk Assessment
Prague, 13th November 2009
Project Manager: Approved by: RNDr. Jan Němeček Mgr. Zdeněk Matějík
Elaborated for: Czech Ministry of Environment
Vršovická 1442/65 100 10 Prague 1
Elaborated by: ENACON s.r.o
Na holém vrchu 708/3 143 00 Praha 4 Czech Republic
ENACON s.r.o. Na holém vrchu 708/3 143 00 Praha 4, Czech Republic
OHIS Skopje, Macedonia November 2009 Old Environmental Burdens Risk Assessment
1
Table of Contents Introduction ...............................................................................................................................................5 1. Site Settings ............................................................................................................................................5
1.1 General Information .......................................................................................................................5 1.1.1 Geographical Site Definition ..................................................................................................5 1.1.2 Existing and Planned Land Use ..............................................................................................6 1.1.3 Basic Demographic Settings ...................................................................................................6
1.2 Natural Settings................................................................................................................................6 1.2.1 Geomorphologic and Climatic Settings ...............................................................................6 1.2.2 Geological Settings ..................................................................................................................7 1.2.3 Hydrogeological Settings ........................................................................................................7 1.2.4 Hydrological Settings ...............................................................................................................8 1.2.5 Geochemical and Hydrochemical Settings ........................................................................8
2. Site Investigations ..................................................................................................................................8 2.1 Previous Investigations ....................................................................................................................8
2.1.1 Results of Previous Investigations ...........................................................................................8 2.1.2 Summary of Contamination Sources ................................................................................. 10 2.1.3 Definition of chemicals of potential concern and of other risk factors ........................ 11 2.1.4 Preliminary Conceptual Model of Contamination .......................................................... 12
2.2 Site Characterization ................................................................................................................... 12 2.2.1 Methods and Scope of Field and Analytical Investigation ............................................ 12
2.2.1.1 Soil borings ....................................................................................................................... 13 2.2.1.2 Collection of Soil and Soil Gas Samples ...................................................................... 14 2.2.1.3 Installation of monitoring wells ...................................................................................... 14 2.2.1.4 Collection of Groundwater Samples ........................................................................... 15 2.2.1.5 Collection of Samples of Construction Material ........................................................ 16 2.2.1.6 Laboratory Analyses ....................................................................................................... 16
2.2.2 Results of Site Characterization ........................................................................................... 18 2.2.2.1 Results of Soil and Soil Gas Investigation ..................................................................... 18 2.2.2.2 Results of Street Sweepings and Sediment of the On-site Sewer ............................ 21 2.2.2.3 Results of Investigation of Dumps of Waste HCH Isomers ......................................... 21 2.2.2.4 Results of Groundwater Investigation ......................................................................... 25 2.2.2.3 Results of Investigation of Contamination of Construction Materials .................... 27 2.2.2.4 Results of Analyses of Vegetables ............................................................................... 28
2.2.3 Summary of the Contamination Data ............................................................................... 28 2.2.4 Assessment of the Contaminant Migration ....................................................................... 31
2.2.4.1 Migration of Contamination in the Unsaturated Zone ............................................. 31 2.2.4.2 Migration of Contamination in the Saturated Zone ................................................. 32 2.2.4.3 Migration of Contamination in the Surface Water ................................................... 33 2.2.4.4 Progress of Contamination with Regards to Natural Attenuation .......................... 33
2.2.5 Summary of Migration and of Contamination Progress .................................................. 34 3 Risk Assessment .................................................................................................................................... 36
3.1 Hazard Identification ................................................................................................................... 36 3.1.1 Determination of priority contaminants ............................................................................. 36 3.1.2 Basic characteristics of the risk acceptors ........................................................................ 41 3.1.3 Summary of exposure pathways and exposure scenarios ............................................. 41
3.1.3.1 Conceptual model of exposure .................................................................................. 41 3.1.3.2 Exposure scenarios ......................................................................................................... 43
3.2 Human Health Risk Assessment .................................................................................................. 44 3.2.1 Evaluation of dose – response relationship ....................................................................... 44 3.2.2 Exposure assessment ............................................................................................................. 45 3.2.3 Risk characterization ............................................................................................................. 50
ENACON s.r.o. Na holém vrchu 708/3 143 00 Praha 4, Czech Republic
OHIS Skopje, Macedonia November 2009 Old Environmental Burdens Risk Assessment
2
3.3 Assessment of Environmental Risk .............................................................................................. 52 3.4 Summary of Total Risks ................................................................................................................. 52
4. Proposal of Corrective Measures .................................................................................................... 53 4.1 Proposal of Target Concentrations for Corrective Measures ............................................... 53 4.2 Proposal of Scope and Character of Corrective Measures ................................................. 54
5. Conclusions and Recommendations ............................................................................................. 57 List of tables Table 1: Content of Mercury in Soil ................................................................................................... 10 Table 2: Parameters of Monitoring Wells .......................................................................................... 15 Table 3: Scope of laboratory analyses: ............................................................................................ 17 Table 4: Basic Parameters of the α-HCH and β-HCH dump .......................................................... 23 Table 5: Basic Parameters of δ-HCH dump ...................................................................................... 24 Table 6: Field Measurements – March 2008 ..................................................................................... 25 Table 7: Field Measurements – September 2009 ............................................................................. 25 Table 8: Input Values for Calculation of Velocity of Pollutant Migration ..................................... 32 Table 9: Calculated Velocities of Pollutant Migration .................................................................... 32 Table 10: Summary of toxicological properties of priority contaminants – inhalation exposure38 Table 11: Summary of toxicological properties of priority contaminants – oral exposure .................. 39 Table 12: Summary of toxicological properties of priority contaminants – dermal contact .............. 40 Table 13: Risk acceptors ...................................................................................................................... 41 Table 14: Overview of assumed exposure scenarios ......................................................................... 44 Table 15: Overview of exposure scenarios exceeding acceptable level of risk ............................. 51 Table 16: Proposed Target Concentrations ....................................................................................... 54 List of Figures Figure 1: Preliminary conceptual model of contamination - scheme .......................................... 12 Figure 2: Soil drilling at the dumpsite of alpha and beta isomers of HCH .................................... 13 Figure 3: Drilling core at the dumpsite of α- and β- isomers of HCH (white substance – waste
isomers of HCH) ............................................................................................................................ 14 Figure 4: 3D model of the α-HCH and β-HCH dump ...................................................................... 22 Figure 5: 3D model of the dump of δ-HCH ....................................................................................... 24 Figure 6: Sampling of construction materials in the former electrolysis plant .............................. 28 Figure 7: Scheme of the selected exposure scenarios ................................................................... 42
ENACON s.r.o. Na holém vrchu 708/3 143 00 Praha 4, Czech Republic
OHIS Skopje, Macedonia November 2009 Old Environmental Burdens Risk Assessment
3
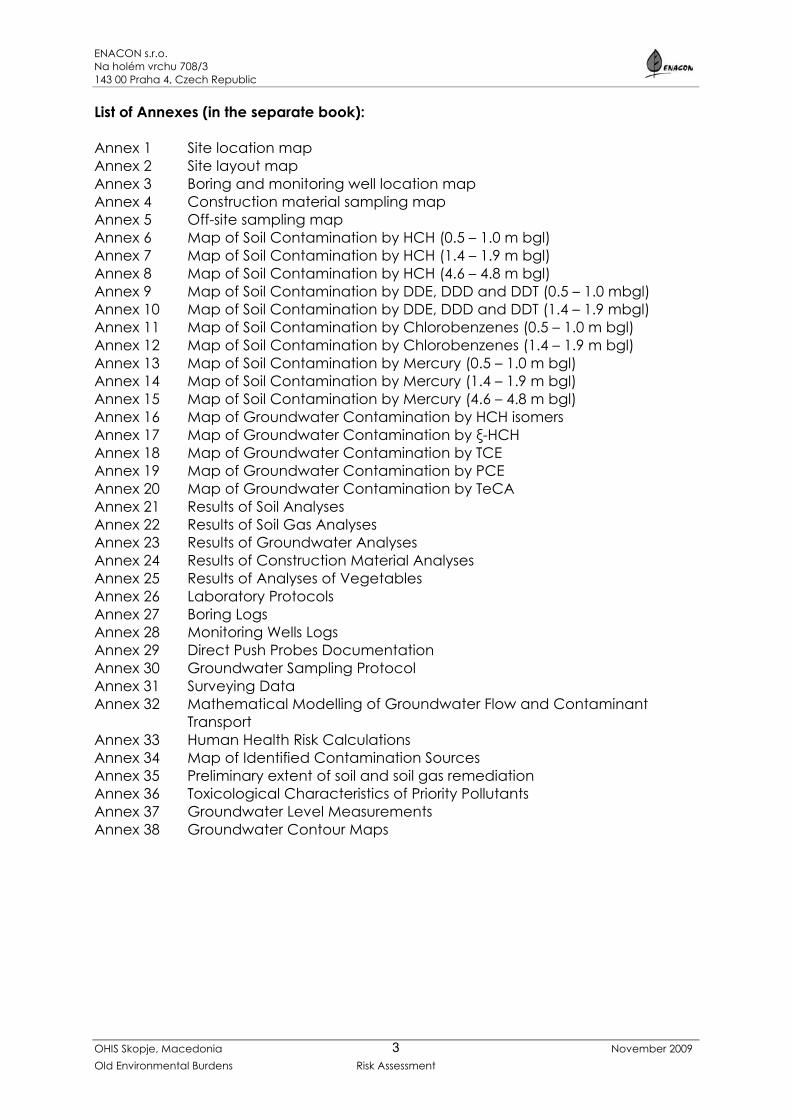
List of Annexes (in the separate book): Annex 1 Site location map Annex 2 Site layout map Annex 3 Boring and monitoring well location map Annex 4 Construction material sampling map Annex 5 Off-site sampling map Annex 6 Map of Soil Contamination by HCH (0.5 – 1.0 m bgl) Annex 7 Map of Soil Contamination by HCH (1.4 – 1.9 m bgl) Annex 8 Map of Soil Contamination by HCH (4.6 – 4.8 m bgl) Annex 9 Map of Soil Contamination by DDE, DDD and DDT (0.5 – 1.0 mbgl) Annex 10 Map of Soil Contamination by DDE, DDD and DDT (1.4 – 1.9 mbgl) Annex 11 Map of Soil Contamination by Chlorobenzenes (0.5 – 1.0 m bgl) Annex 12 Map of Soil Contamination by Chlorobenzenes (1.4 – 1.9 m bgl) Annex 13 Map of Soil Contamination by Mercury (0.5 – 1.0 m bgl) Annex 14 Map of Soil Contamination by Mercury (1.4 – 1.9 m bgl) Annex 15 Map of Soil Contamination by Mercury (4.6 – 4.8 m bgl) Annex 16 Map of Groundwater Contamination by HCH isomers Annex 17 Map of Groundwater Contamination by ξ-HCH Annex 18 Map of Groundwater Contamination by TCE Annex 19 Map of Groundwater Contamination by PCE Annex 20 Map of Groundwater Contamination by TeCA Annex 21 Results of Soil Analyses Annex 22 Results of Soil Gas Analyses Annex 23 Results of Groundwater Analyses Annex 24 Results of Construction Material Analyses Annex 25 Results of Analyses of Vegetables Annex 26 Laboratory Protocols Annex 27 Boring Logs Annex 28 Monitoring Wells Logs Annex 29 Direct Push Probes Documentation Annex 30 Groundwater Sampling Protocol Annex 31 Surveying Data Annex 32 Mathematical Modelling of Groundwater Flow and Contaminant
Transport Annex 33 Human Health Risk Calculations Annex 34 Map of Identified Contamination Sources Annex 35 Preliminary extent of soil and soil gas remediation Annex 36 Toxicological Characteristics of Priority Pollutants Annex 37 Groundwater Level Measurements Annex 38 Groundwater Contour Maps
ENACON s.r.o. Na holém vrchu 708/3 143 00 Praha 4, Czech Republic
OHIS Skopje, Macedonia November 2009 Old Environmental Burdens Risk Assessment
4
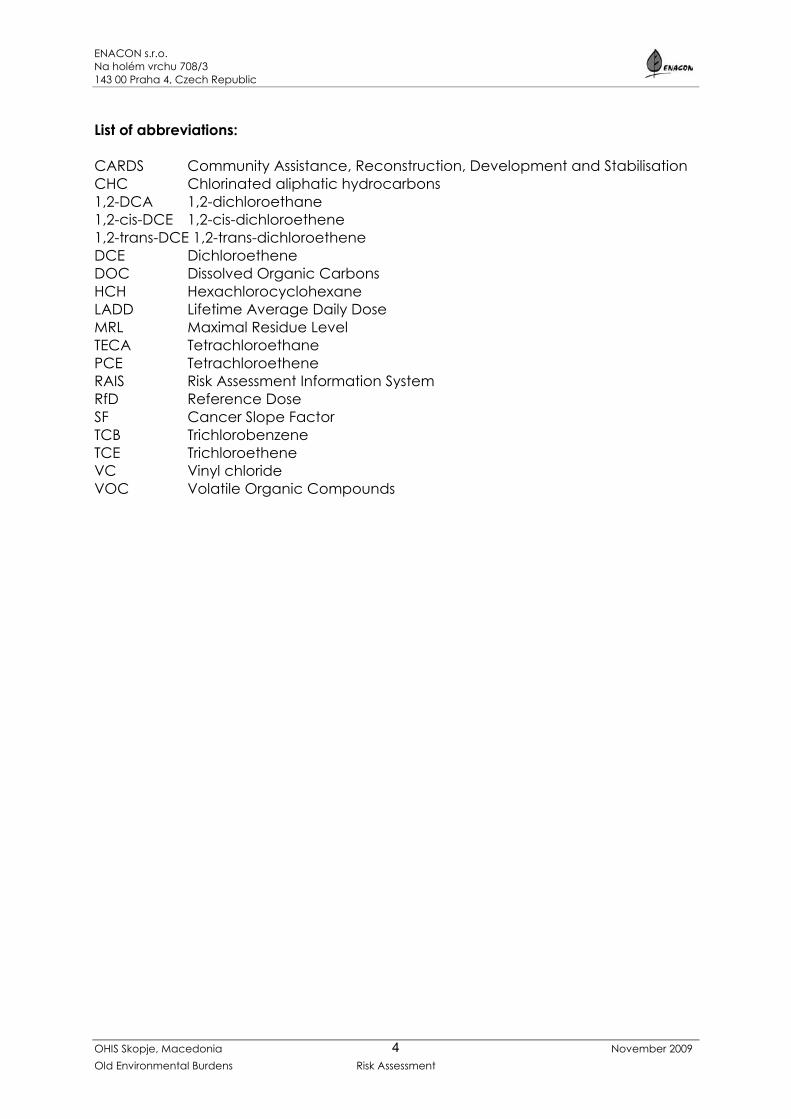
List of abbreviations: CARDS Community Assistance, Reconstruction, Development and Stabilisation CHC Chlorinated aliphatic hydrocarbons 1,2-DCA 1,2-dichloroethane 1,2-cis-DCE 1,2-cis-dichloroethene 1,2-trans-DCE 1,2-trans-dichloroethene DCE Dichloroethene DOC Dissolved Organic Carbons HCH Hexachlorocyclohexane LADD Lifetime Average Daily Dose MRL Maximal Residue Level TECA Tetrachloroethane PCE Tetrachloroethene RAIS Risk Assessment Information System RfD Reference Dose SF Cancer Slope Factor TCB Trichlorobenzene TCE Trichloroethene VC Vinyl chloride VOC Volatile Organic Compounds
ENACON s.r.o. Na holém vrchu 708/3 143 00 Praha 4, Czech Republic
OHIS Skopje, Macedonia November 2009 Old Environmental Burdens Risk Assessment
5
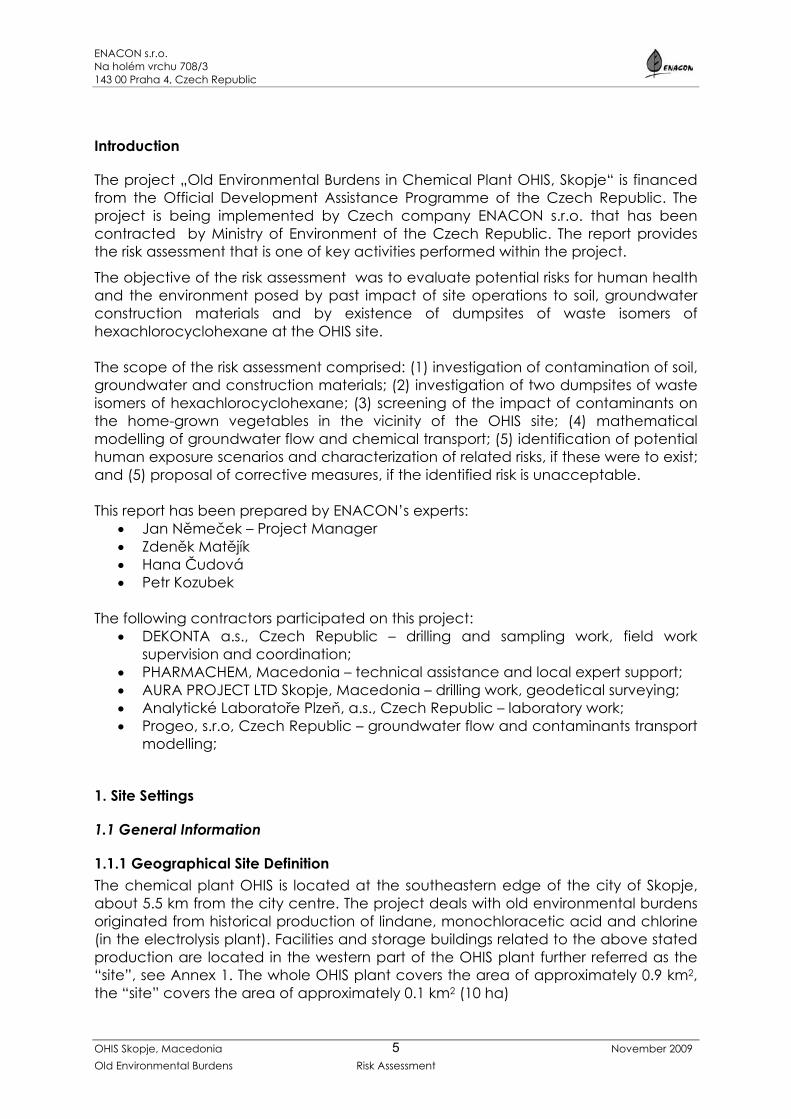
Introduction
The project „Old Environmental Burdens in Chemical Plant OHIS, Skopje“ is financed from the Official Development Assistance Programme of the Czech Republic. The project is being implemented by Czech company ENACON s.r.o. that has been contracted by Ministry of Environment of the Czech Republic. The report provides the risk assessment that is one of key activities performed within the project.
The objective of the risk assessment was to evaluate potential risks for human health and the environment posed by past impact of site operations to soil, groundwater construction materials and by existence of dumpsites of waste isomers of hexachlorocyclohexane at the OHIS site. The scope of the risk assessment comprised: (1) investigation of contamination of soil, groundwater and construction materials; (2) investigation of two dumpsites of waste isomers of hexachlorocyclohexane; (3) screening of the impact of contaminants on the home-grown vegetables in the vicinity of the OHIS site; (4) mathematical modelling of groundwater flow and chemical transport; (5) identification of potential human exposure scenarios and characterization of related risks, if these were to exist; and (5) proposal of corrective measures, if the identified risk is unacceptable. This report has been prepared by ENACON’s experts:
• Jan Němeček – Project Manager • Zdeněk Matějík • Hana Čudová • Petr Kozubek
The following contractors participated on this project:
• DEKONTA a.s., Czech Republic – drilling and sampling work, field work supervision and coordination;
• PHARMACHEM, Macedonia – technical assistance and local expert support; • AURA PROJECT LTD Skopje, Macedonia – drilling work, geodetical surveying; • Analytické Laboratoře Plzeň, a.s., Czech Republic – laboratory work; • Progeo, s.r.o, Czech Republic – groundwater flow and contaminants transport
modelling;
1. Site Settings
1.1 General Information
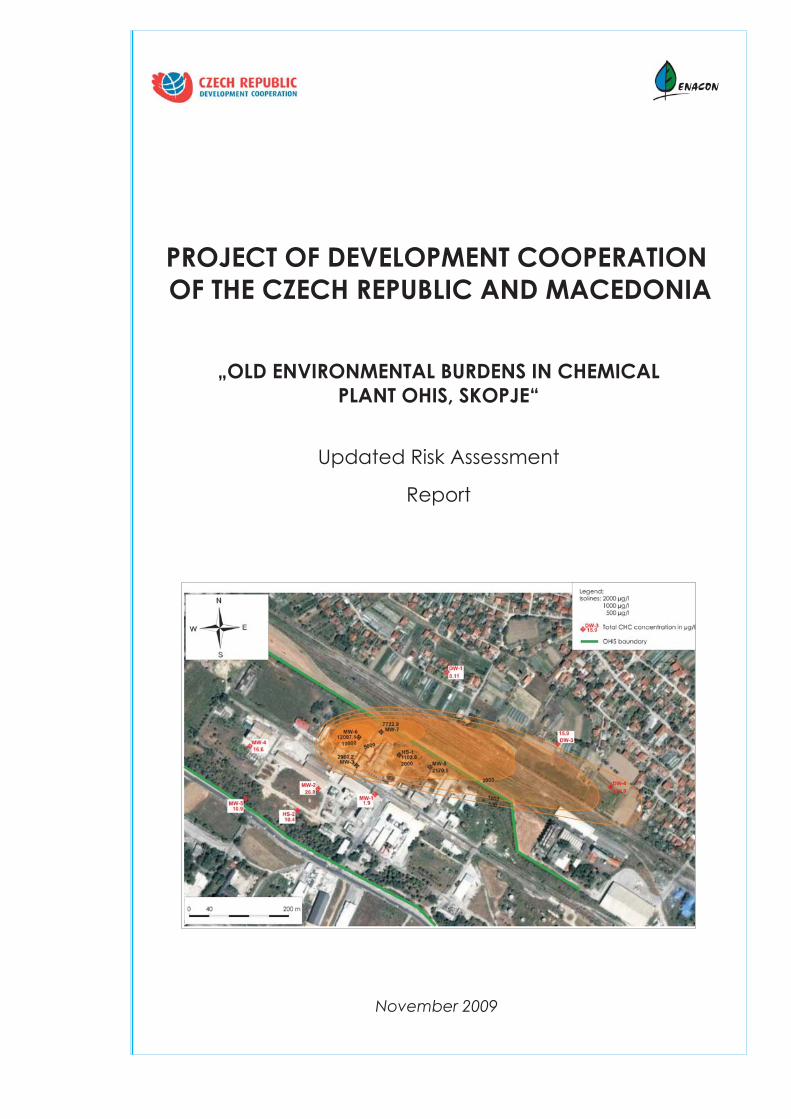
1.1.1 Geographical Site Definition The chemical plant OHIS is located at the southeastern edge of the city of Skopje, about 5.5 km from the city centre. The project deals with old environmental burdens originated from historical production of lindane, monochloracetic acid and chlorine (in the electrolysis plant). Facilities and storage buildings related to the above stated production are located in the western part of the OHIS plant further referred as the “site”, see Annex 1. The whole OHIS plant covers the area of approximately 0.9 km2, the “site” covers the area of approximately 0.1 km2 (10 ha)
ENACON s.r.o. Na holém vrchu 708/3 143 00 Praha 4, Czech Republic
OHIS Skopje, Macedonia November 2009 Old Environmental Burdens Risk Assessment
6
1.1.2 Existing and Planned Land Use The site is located at the southeastern edge of Skopje, in an industrial area that is spread along the road connecting Skopje and a city of Dracevo. The site was developed in the first half of the 60´s, the lindane was produced in the period from 1965 to 1972. The electrolysis plant was in operation in the period from 1965 to 1995. The production of monochloracetic acid took place in years 1963 - 2004. At present the site is mostly abandoned. Some production activities are performed with regards to repackaging of pesticides (produced off-site) from large containers to small retail packaging. Reportedly no pesticides are currently produced at the site. The present surrounding land use is as follows: To the north: railway with a railway station and beyond it a private agricultural land and further to the north within a distance of 150 m from the site residential houses of the village of Gorno Lisice (part of Skopje). To the southeast: the part of the OHIS plant dealing with production of detergents. To the southwest: the road connecting Skopje and Dracevo and beyond it a mixed industrial/commercial area with an abandoned glass mill and further to the southwest rural area with dwellings of Kisela Voda. To the northwest: undeveloped part of OHIS plant and beyond it a small residential area.
1.1.3 Basic Demographic Settings The nearest residential area is Gorno Lisice located approximately 200 m to the northeast of the site. Dwellings belonging to Kisela Voda are located about 300 m to the southwest of the site. Based on the rough estimate up to 1000 residents live within a distance of 500 m from the site mainly in Gorno Lisice. The site itself is almost abandoned. During the project (2007 - 2009) first tens of people are involved in some minor production activities, maintenance and guarding at the site.
1.2 Natural Settings
1.2.1 Geomorphologic and Climatic Settings The site is located at the southwestern edge of the flood plain of the Vardar river (see Section 1.2.4), at an average elevation of 239 m above sea level (asl.). The site area is almost flat very gently sloping to the northeast. Further to the southwest of the site there are the steep side hills of the Vodno mountain range. The average annual air temperature is 12.5 oC, where the maximum temperature is 41.2 oC. Usually the climate during the summer period is very dry and warm, in winter the climate is moderate cold. The average annual precipitation is 502.3 mm (Eptisa 2007).
ENACON s.r.o. Na holém vrchu 708/3 143 00 Praha 4, Czech Republic
OHIS Skopje, Macedonia November 2009 Old Environmental Burdens Risk Assessment
7
1.2.2 Geological Settings The bedrock beneath the site area is composed of Pliocene sediments comprising sandstone, marlstone and conglomerate. The depth to bedrock rapidly increased in north-east direction from first tens of meters to more than 200 m along the Vardar river. The bedrock is overlain by Quaternary proluvial sediments comprising sandy, gravely and silty loams. Quaternary proluvial sediments fill the depression eroded in Pliocene sediments. The depth to Quaternary proluvial sediments is about 70 m at the site and increases in northern direction to approximately 90 m. The Quaternary proluvial sediments are overlain by alluvial sediments of the Vardar river comprising mainly gravels, sandy, silty and loamy gravels alternating with thin layers (first tens of centimetres thick) of sandy gravelly clay and silt. The uppermost layers of alluvial sediments comprise clayey silt to silty clay. The thickness of these fine grained sediments varies at the site from 1.5 m to 4.5 m. The alluvial sediments are locally overlain by fill comprising mostly crashed stones, gravelly clay and gravel. The thickness of the fill is less than 0.5 m. Allegedly it was man-deposed during the various historic construction/revamping stages of the site.
1.2.3 Hydrogeological Settings A phreatic aquifer is developed in the alluvial sediments of the Vardar river. The permeability of the aquifer is 10-3 m/s up to 10-2 m/s in formations of pure gravel. Underlying proluvial sediments can be also considered as water bearing strata, however of lower permeability. The depth to groundwater is about 8 to 8.5 m below ground level (bgl). The saturated thickness of the aquifer is about 60 m at the site and increases in northern direction. Groundwater flows generally toward the east (see groundwater level contour map in Annex 37) and finally discharges into the Vardar river and into the lowermost section of the Markova river. Groundwater is abstracted in down-gradient and cross-gradient direction in number of domestic wells in the village of Gorno Lisice. The nearest well is located within the distance of about 150 m to the northeast from the site border. Based on the interview with the local residents, wells are rather shallow (about 10 to 12 m) and abstracted groundwater is used for irrigation only. Drinking water is supplied by municipal mains there. Two abstraction well fields of OHIS plant are located in the alluvial plain of the Vardar river. Well field “Lisice 1” consists of 8 wells of the depth of approximately 30 m situated perpendicular to groundwater flow at the distance of 1.2 km to the northeast of the site border (thus cross-gradient with respect to groundwater flow). Well field Lisice 1 is reportedly more than 6 years out of operation. At the distance of approximately 2.3 km to the northeast of the site (about 200 m to the south of the Vardar river) there is abstraction well Lisice 2. It is a 23 m deep well 5.5 m in diameter with radial drains 17 to 33 m long. The annual amount of groundwater abstracted from this well was approximately 2 Mil. m3 in 2007 (average pumping rate of 63 l/s). According to information provided by OHIS representatives abstracted groundwater is used for sanitary purposes and as a source of process water. Groundwater is not used for drinking. Based on the location of well Lisice 2 with respect to Vardar river and general direction of groundwater flow, the well abstracts mainly surface water of the Vardar river that recharge the alluvial aquifer rather than intercepts groundwater flowing from the site.
ENACON s.r.o. Na holém vrchu 708/3 143 00 Praha 4, Czech Republic
OHIS Skopje, Macedonia November 2009 Old Environmental Burdens Risk Assessment
8
1.2.4 Hydrological Settings The nearest surface water is the Colemni Kamenj creek flowing in direction southwest - northeast at the distance of 400 m to the northwest of the site. The Colemni Kamenj creek discharges into the Vardar river – a regional watercourse flowing in northwest -southeast direction at the distance of 2.3 km to the northeast of the site. Another watercourse in the site vicinity is the Markova Reka river flowing in south - north direction within a distance of 1.6 to the east of the site. The Markova Reka river discharges into the Vardar river some 1 km downgradient of the estuary of Colemni Kamenj to the Vardar. The Vardar river covers a catchment area of 4650 km2, the mean flow rate (calculated for the profile in Skopje) is 63 m3/s, the 90% flow rate (Qmin90%) is 6,34 m3/s. Reportedly, the OHIS property has never been flooded by the Vardar river or by the Markova reka river. In 1962, the OHIS area was flooded by the storm water run-off from the Vodno mountains. The capacity of the Colemni Kamnej creek was not sufficient to collect stormwater and overflew.
1.2.5 Geochemical and Hydrochemical Settings Hydrochemical properties of groundwater were investigated with the aim to assess potential groundwater contamination and the fate of potential contaminants in the aquifer (organic pollutants, metals, and selected ions and physical-chemical properties of groundwater – pH, ORP, temperature and conductivity). In summary, groundwater of the aquifer is of neutral to alkaline pH (6.94 – 10.24), slightly negative to positive redox potential (–34 to +182 mV by Ag/AgCl electrode) and of elevated conductivity within the OHIS site (700 – 1589 µS/cm). Concentration of dissolved oxygen varies from 0.00 to 3. 1 mg/l, respectively). The groundwater has content of nitrates in order of magnitude of tens of mg/l, content of sulphates from 83 to 163 mg/l and low content of iron and manganese (both below 1 mg/l). Based on the above given concentrations of the anions in groundwater and measured physical-chemical parameters the redox conditions of the aquifer can be considered as indifferent (between aerobic and nitrate reducing conditions).
2. Site Investigations
2.1 Previous Investigations
2.1.1 Results of Previous Investigations No systematic soil and groundwater investigation has been performed at the site in past. In 2001, two soil samples of superficial soil were taken within the CARDS Project near the present monitoring well HS-1 (next to the former electrolysis plant) and near the present monitoring well HS-2 (next to the HCH dump, respectively). Both soil samples were analysed for the content of lead, mercury and chromium. In the first sample
ENACON s.r.o. Na holém vrchu 708/3 143 00 Praha 4, Czech Republic
OHIS Skopje, Macedonia November 2009 Old Environmental Burdens Risk Assessment
9
elevated concentration of mercury – 7 mg/kg was found, in the second sample laboratory analyses did not found elevated concentration of any analysed metal. Screening of soil and groundwater contamination was performed by company BENA, Thessaloniky within the project CARDS in 2002. Within this project two monitoring wells HS-1 and HS-2 were installed next to the former electrolysis plant and next to the δ-HCH dump, respectively. Soil samples were taken from the core of both borings and samples of groundwater were taken. In addition, samples of sediment of an old wastewater canal and wastewater sample were taken. Samples were analysed for wide spectrum of inorganic as well as organic parameters. Soil analyses encountered elevated concentrations of total chlorinated hydrocarbons (127 µg/kg calculated as TCE) in the depth interval 4 to 5 m bgl. of boring HS-1 and also in boring HS-2 in the depth interval 3 to 4 m bgl. (42.72 µg/kg). Groundwater sample taken from well HS-1 contained elevated concentrations of trichloroethylene (TCE) – 104.95 µg/l, tetrachloroethylene (PCE) – 132.45 µg/l, α-HCH – 0.239, β-HCH µg/l – 0.282 µg/l, aldrin – 0.3 µg/l and of mercury – 1.1 µg/l. Groundwater sample taken from well HS-2 contained elevated concentrations of α-HCH – 2.4, β-HCH – 3.20 µg/l, γ-HCH – 0.38 µg/l and of bromoform – 18.39 µg/l. No elevated concentrations of polycyclic aromatic hydrocarbons (PAH) or of analysed metals (Pb, Cr) were encountered in any of groundwater samples. Laboratory analyses of sediments of the old wastewater canal found elevated concentrations of γ-HCH in order of tens of µg/kg in the depth interval from 0 to 2.5 m below canal bottom. Maximal concentration was 53.9 µg/kg in the depth interval 0 to 0.5 m below canal bottom. The sample of OHIS wastewater discharged into the Vardar river contained elevated concentrations of TCE – 23.4 µg/l and of mercury – 0.11 µg/l, the sample was not analysed for content of pesticides. In 2007, company EPTISA performed limited site investigation within a project managed by the European Agency for Reconstruction. The site investigation consisted of geoelectrical (resistivity) mapping with the goal to evaluate possible anomaly zones indicating contamination of soil and groundwater by HCH and mercury and to propose strategy for site remediation. Four anomalies were detected by geoelectrical mapping – to the east of the former electrolyses plan (contamination by mercury), to the southeast of the former monochloracetic acid plant, along the north-eastern side of the α-HCH and β-HCH dump and to the east of this dump (contamination by HCH). In 2007 the Institute of Public Health in Skopje collected four superficial soil samples (0.05 to 0.35 m bgl) in the surroundings of the former electrolysis plant and analysed them for the content of mercury. Content of mercury in these soil samples are given in table bellow:
ENACON s.r.o. Na holém vrchu 708/3 143 00 Praha 4, Czech Republic
OHIS Skopje, Macedonia November 2009 Old Environmental Burdens Risk Assessment
10
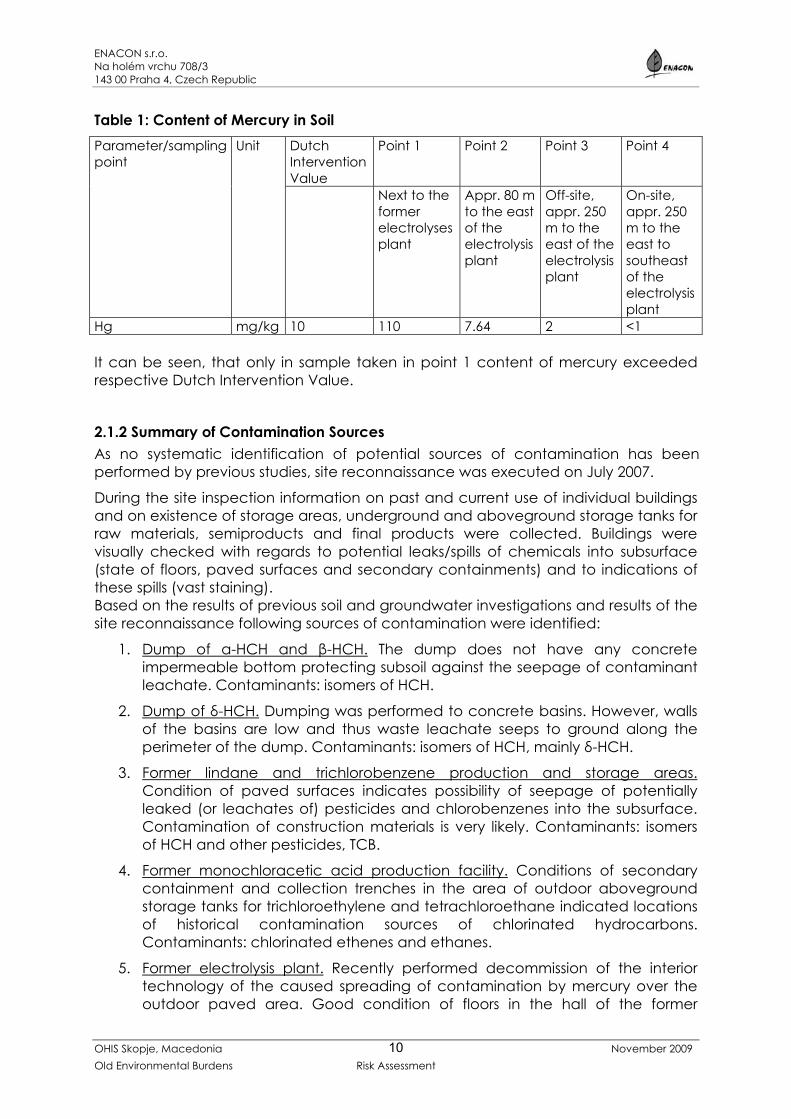
Table 1: Content of Mercury in Soil Parameter/sampling point
Unit Dutch Intervention Value
Point 1 Point 2 Point 3 Point 4
Next to the former electrolyses plant
Appr. 80 m to the east of the electrolysis plant
Off-site, appr. 250 m to the east of the electrolysis plant
On-site, appr. 250 m to the east to southeast of the electrolysis plant
Hg mg/kg 10 110 7.64 2 <1 It can be seen, that only in sample taken in point 1 content of mercury exceeded respective Dutch Intervention Value.
2.1.2 Summary of Contamination Sources As no systematic identification of potential sources of contamination has been performed by previous studies, site reconnaissance was executed on July 2007.
During the site inspection information on past and current use of individual buildings and on existence of storage areas, underground and aboveground storage tanks for raw materials, semiproducts and final products were collected. Buildings were visually checked with regards to potential leaks/spills of chemicals into subsurface (state of floors, paved surfaces and secondary containments) and to indications of these spills (vast staining). Based on the results of previous soil and groundwater investigations and results of the site reconnaissance following sources of contamination were identified:
1. Dump of α-HCH and β-HCH. The dump does not have any concrete impermeable bottom protecting subsoil against the seepage of contaminant leachate. Contaminants: isomers of HCH.
2. Dump of δ-HCH. Dumping was performed to concrete basins. However, walls of the basins are low and thus waste leachate seeps to ground along the perimeter of the dump. Contaminants: isomers of HCH, mainly δ-HCH.
3. Former lindane and trichlorobenzene production and storage areas. Condition of paved surfaces indicates possibility of seepage of potentially leaked (or leachates of) pesticides and chlorobenzenes into the subsurface. Contamination of construction materials is very likely. Contaminants: isomers of HCH and other pesticides, TCB.
4. Former monochloracetic acid production facility. Conditions of secondary containment and collection trenches in the area of outdoor aboveground storage tanks for trichloroethylene and tetrachloroethane indicated locations of historical contamination sources of chlorinated hydrocarbons. Contaminants: chlorinated ethenes and ethanes.
5. Former electrolysis plant. Recently performed decommission of the interior technology of the caused spreading of contamination by mercury over the outdoor paved area. Good condition of floors in the hall of the former
ENACON s.r.o. Na holém vrchu 708/3 143 00 Praha 4, Czech Republic
OHIS Skopje, Macedonia November 2009 Old Environmental Burdens Risk Assessment
11
electrolysis plant does not provide potential for vast seepage of mercury. However, collection system of cooling water and especially underground settling sumps of this collection system were identified as potential contamination sources. Contaminants: mercury.
6. Outdoor cooled storage of flammables. Volatile organic compounds are stored there in corroded drums on the concrete pavement. During higher ambient temperature, drums are sprinkled with water that runs off the paved area, partially seeps to ground and partially drains into the rainwater sewer inlet. Contaminants: volatile organic compounds.
2.1.3 Definition of chemicals of potential concern and of other risk factors Two aspects are usually taken into account within the process of selecting the chemicals of potential concern:
1. Potential sources of contamination and their relationship to technological processes,
2. Toxicological hazard of potential contaminants. Based on the above given summary of the site reconnaissance and results of previous site investigations the chemicals of potential concern are defined as follows:
• chlorinated pesticides – mainly γ-HCH (lindane) and other HCH isomers generated during lindane production, DDD, DDE and DDT.
• organophosphates – namely phosmet, fenitrotion, dimethoate, malathion, formothion and fonofos produced at the site.
• thio- and dithiocarbamates – namely cycloate produced at the site. • chlorobenzenes – mainly trichlorobenzene (TCB) produced at the site
and byproducts of its decay – dichlorobenzene and chlorobenzene. • monocholoracetic acid – produced in the former monochloracetic acid
production facility. • chlorinated ethenes and ethanes – generated as by-products during
production of the monochloracetic acid. • mercury – used in the former electrolysis plant (total mercury losses were
estimated by the EPTISA team during 38 year - long operation of the electrolysis plant to 350 to 400 t).
ENACON s.r.o. Na holém vrchu 708/3 143 00 Praha 4, Czech Republic
OHIS Skopje, Macedonia November 2009 Old Environmental Burdens Risk Assessment
12
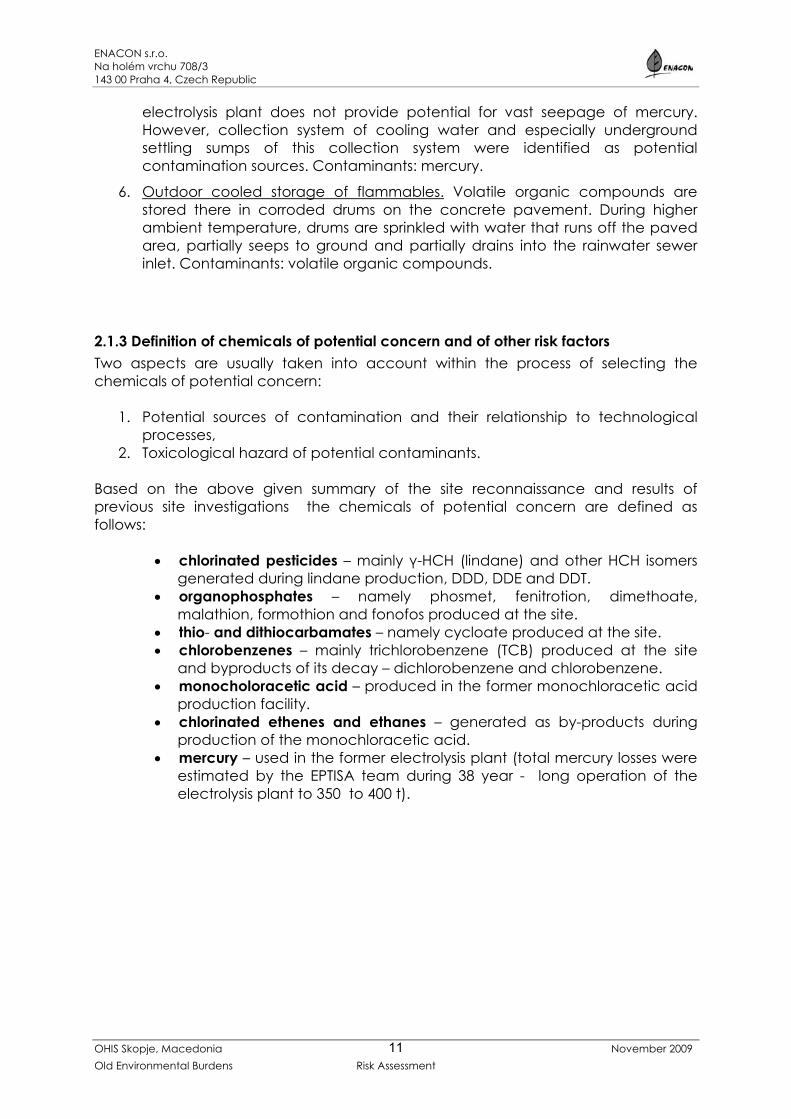
2.1.4 Preliminary Conceptual Model of Contamination The preliminary conceptual model of contamination is shown in the following scheme. The “transport” of contamination and potential contact of risk acceptors with contaminated media is indicated by red and blue arrows.
Figure 1: Preliminary conceptual model of contamination - scheme
2.2 Site Characterization
2.2.1 Methods and Scope of Field and Analytical Investigation The goal of the site characterization was to: (1) investigation of contamination of soil, groundwater and construction materials; (2) investigation of two dumpsites of waste isomers of hexachlorocyclohexane; (3) screening of the impact of contaminants on the home-grown vegetables in the vicinity of the OHIS site.
The scope of work included:
• Site visit, preparation of sampling plan;
• Execution of 64 soil borings and 8 direct push probes (performed in the period July – September 2007 and March 2009),
• Installation of 16 monitoring wells (performed in March 2008 and March 2009),
• Collection of 195 soil samples (from soil borings in 2007 and 2009, from drilling core during installation of monitoring wells in 2008, 2009, two samples of topsoil in agricultural land in Gorno Lisiče),
• Collection of one sample of street dust taken from paved road next to the former electrolysis plant,
ENACON s.r.o. Na holém vrchu 708/3 143 00 Praha 4, Czech Republic
OHIS Skopje, Macedonia November 2009 Old Environmental Burdens Risk Assessment
13
• Collection of one sample of sediment of a sewer at the site,
• Collection of 79 groundwater samples from existing, newly installed monitoring wells as well as domestic and abstraction wells,
• Collection of 10 soil gas samples and 4 ambient air samples,
• Collection of 75 samples of construction materials,
• Collection of 2 samples of lettuce, one sample of celery and one of potatoes grown on the field in Gorno Lišice,
• Laboratory analyses of samples for parameters of potential concern,
• Atmogeochemical Mercurometry Survey (March 2009),
• Surveying of existing and newly installed monitoring wells and of both dumps of HCH waste isomers,
• Field and laboratory data processing and evaluation.
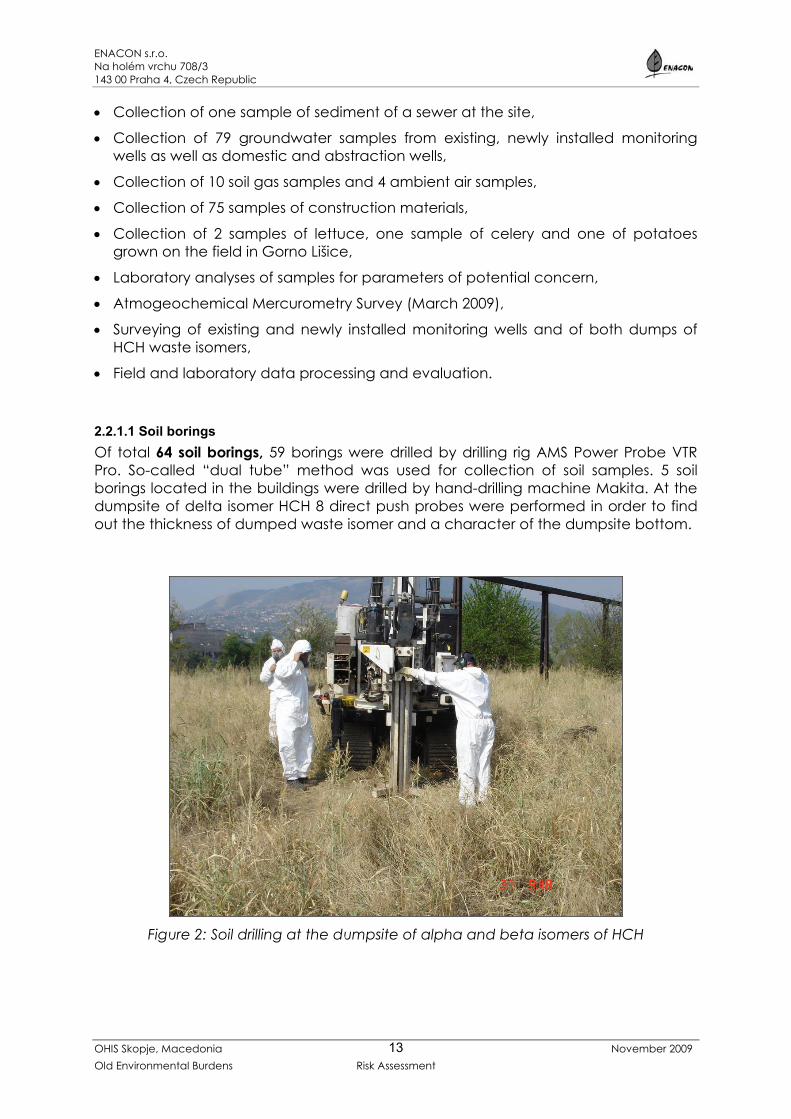
2.2.1.1 Soil borings Of total 64 soil borings, 59 borings were drilled by drilling rig AMS Power Probe VTR Pro. So-called “dual tube” method was used for collection of soil samples. 5 soil borings located in the buildings were drilled by hand-drilling machine Makita. At the dumpsite of delta isomer HCH 8 direct push probes were performed in order to find out the thickness of dumped waste isomer and a character of the dumpsite bottom.
Figure 2: Soil drilling at the dumpsite of alpha and beta isomers of HCH
ENACON s.r.o. Na holém vrchu 708/3 143 00 Praha 4, Czech Republic
OHIS Skopje, Macedonia November 2009 Old Environmental Burdens Risk Assessment
14
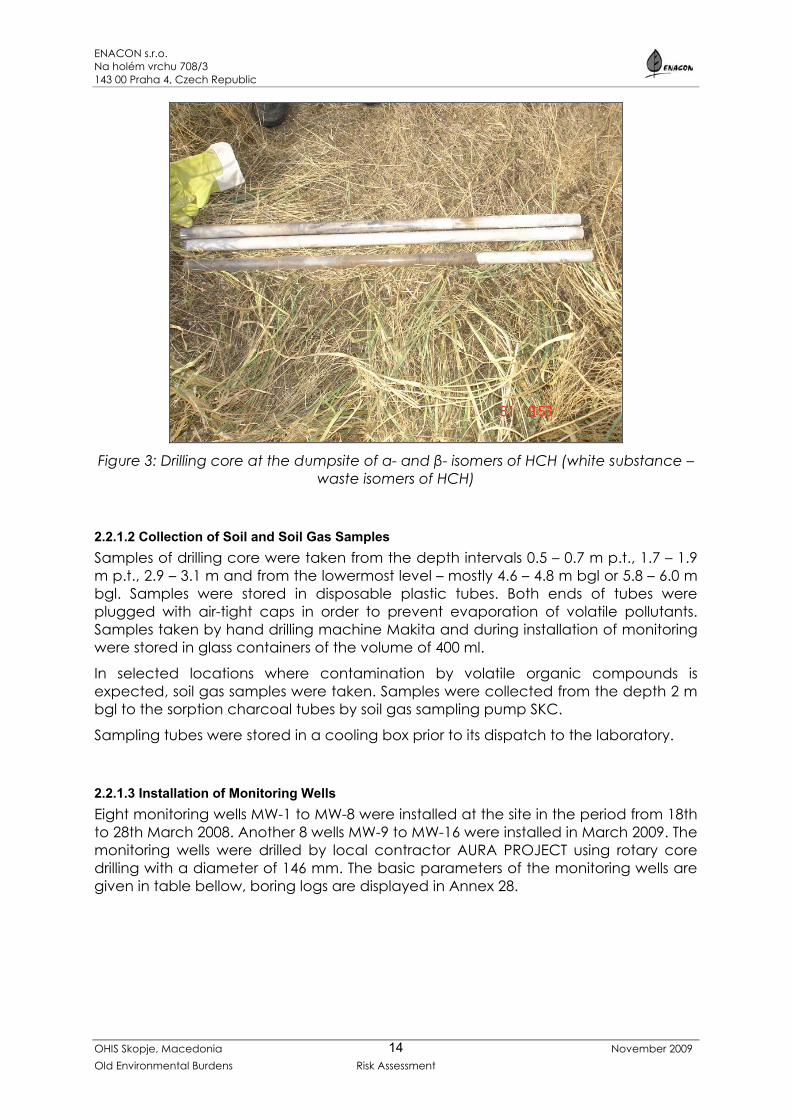
Figure 3: Drilling core at the dumpsite of α- and β- isomers of HCH (white substance –
waste isomers of HCH)
2.2.1.2 Collection of Soil and Soil Gas Samples Samples of drilling core were taken from the depth intervals 0.5 – 0.7 m p.t., 1.7 – 1.9 m p.t., 2.9 – 3.1 m and from the lowermost level – mostly 4.6 – 4.8 m bgl or 5.8 – 6.0 m bgl. Samples were stored in disposable plastic tubes. Both ends of tubes were plugged with air-tight caps in order to prevent evaporation of volatile pollutants. Samples taken by hand drilling machine Makita and during installation of monitoring were stored in glass containers of the volume of 400 ml.
In selected locations where contamination by volatile organic compounds is expected, soil gas samples were taken. Samples were collected from the depth 2 m bgl to the sorption charcoal tubes by soil gas sampling pump SKC.
Sampling tubes were stored in a cooling box prior to its dispatch to the laboratory.
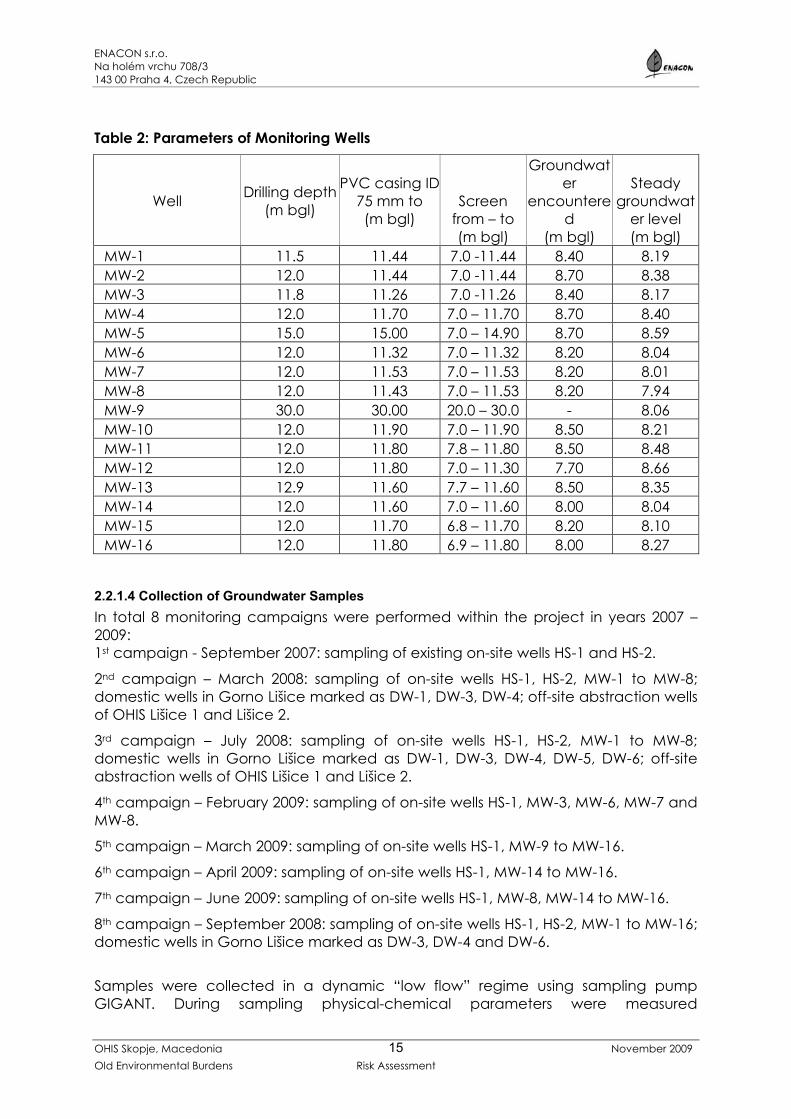
2.2.1.3 Installation of Monitoring Wells Eight monitoring wells MW-1 to MW-8 were installed at the site in the period from 18th to 28th March 2008. Another 8 wells MW-9 to MW-16 were installed in March 2009. The monitoring wells were drilled by local contractor AURA PROJECT using rotary core drilling with a diameter of 146 mm. The basic parameters of the monitoring wells are given in table bellow, boring logs are displayed in Annex 28.
ENACON s.r.o. Na holém vrchu 708/3 143 00 Praha 4, Czech Republic
OHIS Skopje, Macedonia November 2009 Old Environmental Burdens Risk Assessment
15
Table 2: Parameters of Monitoring Wells
Well Drilling depth (m bgl)
PVC casing ID75 mm to (m bgl)
Screen from – to (m bgl)
Groundwater
encountered
(m bgl)
Steady groundwat
er level (m bgl)
MW-1 11.5 11.44 7.0 -11.44 8.40 8.19 MW-2 12.0 11.44 7.0 -11.44 8.70 8.38 MW-3 11.8 11.26 7.0 -11.26 8.40 8.17 MW-4 12.0 11.70 7.0 – 11.70 8.70 8.40 MW-5 15.0 15.00 7.0 – 14.90 8.70 8.59 MW-6 12.0 11.32 7.0 – 11.32 8.20 8.04 MW-7 12.0 11.53 7.0 – 11.53 8.20 8.01 MW-8 12.0 11.43 7.0 – 11.53 8.20 7.94 MW-9 30.0 30.00 20.0 – 30.0 - 8.06 MW-10 12.0 11.90 7.0 – 11.90 8.50 8.21 MW-11 12.0 11.80 7.8 – 11.80 8.50 8.48 MW-12 12.0 11.80 7.0 – 11.30 7.70 8.66 MW-13 12.9 11.60 7.7 – 11.60 8.50 8.35 MW-14 12.0 11.60 7.0 – 11.60 8.00 8.04 MW-15 12.0 11.70 6.8 – 11.70 8.20 8.10 MW-16 12.0 11.80 6.9 – 11.80 8.00 8.27
2.2.1.4 Collection of Groundwater Samples In total 8 monitoring campaigns were performed within the project in years 2007 – 2009: 1st campaign - September 2007: sampling of existing on-site wells HS-1 and HS-2.
2nd campaign – March 2008: sampling of on-site wells HS-1, HS-2, MW-1 to MW-8; domestic wells in Gorno Lišice marked as DW-1, DW-3, DW-4; off-site abstraction wells of OHIS Lišice 1 and Lišice 2.
3rd campaign – July 2008: sampling of on-site wells HS-1, HS-2, MW-1 to MW-8; domestic wells in Gorno Lišice marked as DW-1, DW-3, DW-4, DW-5, DW-6; off-site abstraction wells of OHIS Lišice 1 and Lišice 2.
4th campaign – February 2009: sampling of on-site wells HS-1, MW-3, MW-6, MW-7 and MW-8.
5th campaign – March 2009: sampling of on-site wells HS-1, MW-9 to MW-16.
6th campaign – April 2009: sampling of on-site wells HS-1, MW-14 to MW-16.
7th campaign – June 2009: sampling of on-site wells HS-1, MW-8, MW-14 to MW-16.
8th campaign – September 2008: sampling of on-site wells HS-1, HS-2, MW-1 to MW-16; domestic wells in Gorno Lišice marked as DW-3, DW-4 and DW-6.
Samples were collected in a dynamic “low flow” regime using sampling pump GIGANT. During sampling physical-chemical parameters were measured
ENACON s.r.o. Na holém vrchu 708/3 143 00 Praha 4, Czech Republic
OHIS Skopje, Macedonia November 2009 Old Environmental Burdens Risk Assessment
16
(temperature, O2, pH and conductivity). Measurement was performed by instrument WTW pH/Cond 340i/SET, with probe SenTix 41 for measurement of pH and temperature and probe TetraCon 325 for measurement of conductivity. Domestic wells as well as OHIS abstraction well Lisice 2 were sampled by installed pumps. Locations of sampled wells are displayed in Annex 3 (on-site wells) and in Annex 5 (off-site wells). Sampling protocols of the last monitoring campaign are given in Annex 30.
2.2.1.5 Collection of Samples of Construction Material In total, 75 samples of construction material were collected. Sampling locations were selected with respect to historical and present use of buildings and to the expected level and character of contamination. Higher number of samples was preferably taken from already abandoned buildings. Samples were taken by hand drill hammer from floors, walls and reinforced cladding. In case of masonry, selected samples were taken from the plaster and from the masonry itself.
2.2.1.6 Atmogeochemical Mercurometry Survey
In March 2009 a complementary site investigation has been carried out in the area of the former electrolysis plant – by the means of mercurometry aimed at: • concentration of Hg in soil gas in the vicinity of former electrolysis plant (building
D1), and • measurement of concentrations of Hg vapors in the ambient indoor and outdoor
air.
Measurements were performed with the mercury analyzer RA-915+, product of the company Lumex Ltd. Soil gas was sucked by the analyzer from various depth intervals (0.6 to 4.8 m bgl) via probes drilled by Powerprobe. In case of elevated Hg readings soil sample was taken from the same depth interval for laboratory analysis.
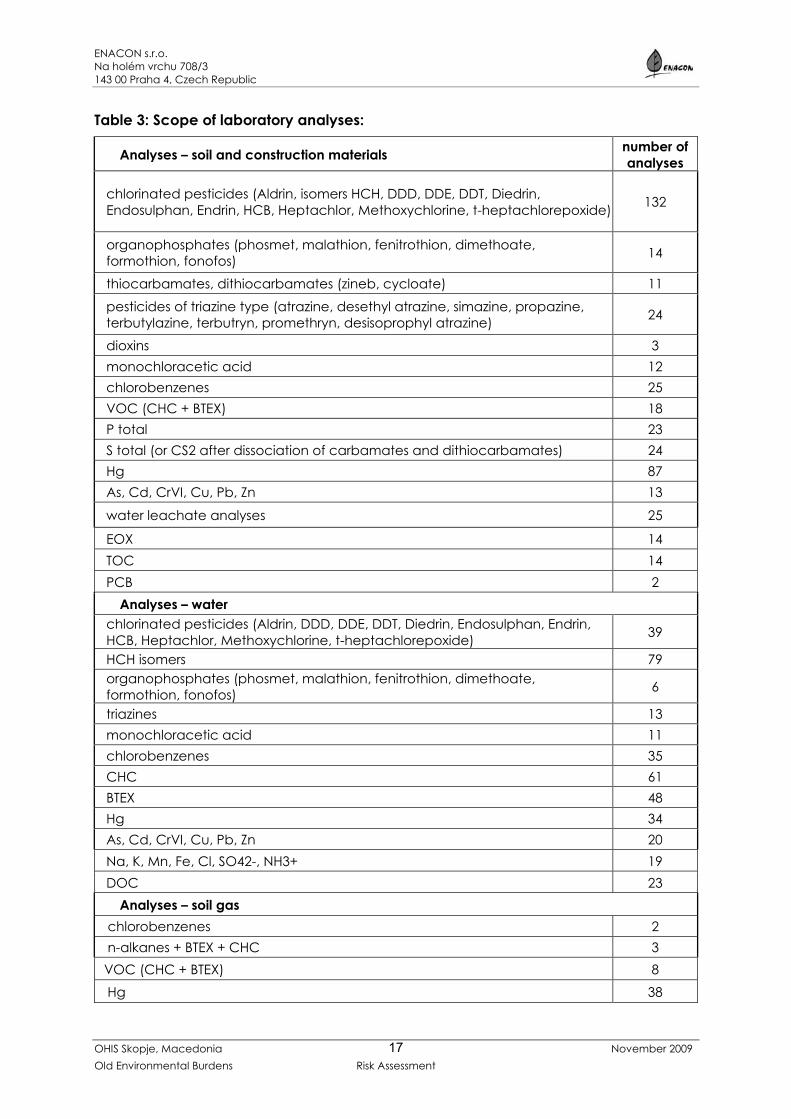
2.2.1.7 Laboratory Analyses
Samples of soil, construction materials, soil gas and groundwater were delivered to the laboratory Analytické laboratoře Plzeň, a.s. Scope of laboratory analyses was determined based on the results of the site reconnaissance, obtained information on spectrum of pesticides produced in past and at present and on physical-chemical, toxicological and ecotoxicological properties of potential pollutants. The list of analyses was in comparison to the original plan extended by determination of dioxins (generated during production of HCH) and of pesticides, that where at the site produced and/or stored in larger amounts (organophosphates, carbamates and dithiocarbamates, triazines, monochloracetic acid and chlorobenzenes). Additionally, selected samples will be analysed for screening parameters characterizing individual groups of pesticides (EOX – for screening chlorinated pesticides, total P – for screening of organophosphates), total S – for screening of thiocarbamates a dithiocarbamates).
Methods of laboratory analyses are given in laboratory protocols (Annex 26). Results are in a table form presented in Annexes 21 up to 25 and discussed in previous chapters.
ENACON s.r.o. Na holém vrchu 708/3 143 00 Praha 4, Czech Republic
OHIS Skopje, Macedonia November 2009 Old Environmental Burdens Risk Assessment
17
Table 3: Scope of laboratory analyses:
Analyses – soil and construction materials number of analyses
chlorinated pesticides (Aldrin, isomers HCH, DDD, DDE, DDT, Diedrin, Endosulphan, Endrin, HCB, Heptachlor, Methoxychlorine, t-heptachlorepoxide) 132
organophosphates (phosmet, malathion, fenitrothion, dimethoate, formothion, fonofos) 14
thiocarbamates, dithiocarbamates (zineb, cycloate) 11
pesticides of triazine type (atrazine, desethyl atrazine, simazine, propazine, terbutylazine, terbutryn, promethryn, desisoprophyl atrazine) 24
dioxins 3 monochloracetic acid 12 chlorobenzenes 25 VOC (CHC + BTEX) 18 P total 23 S total (or CS2 after dissociation of carbamates and dithiocarbamates) 24 Hg 87 As, Cd, CrVI, Cu, Pb, Zn 13
water leachate analyses 25
EOX 14 TOC 14 PCB 2
Analyses – water chlorinated pesticides (Aldrin, DDD, DDE, DDT, Diedrin, Endosulphan, Endrin, HCB, Heptachlor, Methoxychlorine, t-heptachlorepoxide) 39
HCH isomers 79 organophosphates (phosmet, malathion, fenitrothion, dimethoate, formothion, fonofos) 6
triazines 13 monochloracetic acid 11 chlorobenzenes 35 CHC 61 BTEX 48 Hg 34 As, Cd, CrVI, Cu, Pb, Zn 20 Na, K, Mn, Fe, Cl, SO42-, NH3+ 19 DOC 23
Analyses – soil gas chlorobenzenes 2 n-alkanes + BTEX + CHC 3
VOC (CHC + BTEX) 8 Hg 38
ENACON s.r.o. Na holém vrchu 708/3 143 00 Praha 4, Czech Republic
OHIS Skopje, Macedonia November 2009 Old Environmental Burdens Risk Assessment
18
Analyses – ambient air Hg 25
Analyses - vegetables chlorinated pesticides (Aldrin, DDD, DDE, DDT, Diedrin, Endosulphan, Endrin, HCB, Heptachlor, Methoxychlorine, t-heptachlorepoxide) 2
HCH isomers 4 PCB 4 Hg 2
2.2.2 Results of Site Characterization
2.2.2.1 Results of Soil and Soil Gas Investigation Results of laboratory analyses of soil samples were compared with the Dutch Soil Remediation Intervention Values (see tables in Annex 21) which indicate when the functional properties of the soil for humans, plant and animal life is seriously impaired or threatened. They are representative of the level of contamination above which there is a serious case of soil contamination. Further soil contamination maps were elaborated for main pollutants and depth intervals (Annexes 6 to 15). Results can be summarized as follows:
• Contamination of the superficial soil (to the depth of 1 m bgl.) by HCH isomers was identified in most boring locations of all sectors of the site. The most significant contamination was found in sectors A (production of pesticides), B (dumpsites of waste HCH isomers) and E (outdoor cooled storage of flammables). Beside these sectors, significant contamination of the soil superficial zone by chlorinated pesticides (exceeding 10-times Dutch Intervention Value) was found only next to the railway siding in sector D (electrolysis plant). The highest sum HCH concentration (in sum in order of hundreds up to thousands of mg/kg were discovered under both dumpsites of waste HCH isomers and in their close surroundings and in minor scale also under the building of former lindane production (bld. A-4). The maximum total HCH concentration of 384 350 mg/kg was found in soil boring S-B-16 located next to the δ-HCH dump in the depth interval 0.3 to 0.7 m bgl. Soil contamination by HCH isomers sharply ceases with depth due to their low water solubility and due to low permeability of the underlying clay layer. In the depth interval from 1.4 to 1.9 m bgl. significant contamination by these isomers was detected, additionally to the underlying soil of both dumpsites, in their adjacent neighborhood (26 030 mg/kg in soil boring S-B-16) and furthermore also under the building A-4 of former lindane production (50.81 mg/kg in soil boring S-A-04), in sector D (former electrolysis) next to the railway siding (68.1 mg/kg in soil boring S-D-04) and surprisingly also to the east of the electrolysis bld. (22.7 mg/kg in soil boring S-D-09). In the deepest sampled interval (4.6 – 4.8 m bgl.) data are limited, e.g. information underneath of both HCH dumps. However analyses of samples of boreholes located adjacent to the dumps indicates high HCH concentrations (in tens up to hundreds of mg/kg) even in this depth (e.g. 536.48 mg/kg in soil boring S-B-14). Outside of the dumps soil contamination by HCH in this depth interval was encountered in sector D next to the railway siding (20.82 mg/kg in soil boring S-D-04).
ENACON s.r.o. Na holém vrchu 708/3 143 00 Praha 4, Czech Republic
OHIS Skopje, Macedonia November 2009 Old Environmental Burdens Risk Assessment
19
Analysis of the topsoil sample taken on the agricultural land near the railway station Gorno Lisice (approximately 100 m to the north of the site), see Annex 5, found sum HCH concentration (2.005 mg/kg) slightly exceeding the Dutch Intervention Value. As content of α-HCH dominates in this sample it can be considered that it is airborne type of contamination rather than the consequence of excessive treatment of plants in past. The second sample of topsoil collected on the agricultural some 250 m to the northeast from the site contained approximately one half of the HCH content in first sample (1.05 mg/kg) .
• Selected three soil samples were also analysed for the content of dioxins: samples of the superficial layer of borings S-B-16 (next to the δ-HCH dump) and S-B-14 (underneath the storage of pesticides) and also sample taken under the dump of α-HCH and β-HCH (boring S-B-10). For dioxins Dutch standards define a so called Indicative Level for Serious Contamination. Only in superficial layer of boring S-B-16 Dutch Indicative Level for Serious Contamination was exceeded (7-times) that is for dioxins defined in toxic equivalents – ng I-TEQ/g. Nevertheless, it is obvious, that dioxins were generated during the production of chlorinated pesticides at the OHIS site and are present in soil.
• Extent of soil contamination by DDE, DDD and DDT and its intensity is significantly lower compare to HCH. DDE, DDD and DDT impact refers only to superficial layer in sector A (production of pesticides). Maximal sum concentrations of DDT, DDD and DDT was 227.5 mg/kg (in soil boring S-B-14 advanced under the storage of pesticides – bld. A-9). In the depth interval from 1.5 to 1.9 m bgl. soil contamination by these pesticides was encountered only next to the building of former lindane production (west of bld. A-4) in sum concentration of 82.5 mg/kg. In the lowermost sampling interval (4.6 – 4.8 m bgl.) elevated DDE, DDD and DDT concentrations were not identified.
Both samples of topsoil contained DDE, DDD and DDT below laboratory detection limit.
• Contamination of soil by chlorobenzenes in the superficial layer (to the depth of 1 m bgl) as well as in the depth interval 1.4 – 1.9 m bgl. was found only next to the south-eastern edge of the δ-HCH dump (boring S-B-16). Maximal sum concentration of chlorobenzenes was found in the depth interval 0.3 – 0.7 m bgl. (1115.5 mg/kg). In deeper strata sum concentration of chlorobenzenes did not exceed Dutch Intervention Value.
• Laboratory analyses of soil samples did not identify elevated content of other chlorinated pesticides (drins, heptachlor, heptachlorepoxides,..) or nonchlorinated ones (organophosphates, thiocarbamates and dithiocarbamates, triazines).
• Of volatile organic compounds (VOC) only traces of TCE and PCE (in order of first tenths of mg/kg) were identified in sector C (former production of monochloracetic acid). Elevated content of chlorinated ethenes in soil gas in this area indicates, that results of soil analyses are probably underestimated due to extremely high temperature during the sampling campaign.
• Of monitored metals elevated contents of mercury was only encountered. Mercury contaminated soil in the superficial layer (depth < 1 m b.g.l.) was found in the area of former electrolysis plant under the floor of the former
ENACON s.r.o. Na holém vrchu 708/3 143 00 Praha 4, Czech Republic
OHIS Skopje, Macedonia November 2009 Old Environmental Burdens Risk Assessment
20
production building (borings S-D-8, S-D-15 - where maximal Hg concentration was found 978 mg/kg) as well as outside the building next to the settling sump (boring S-D-2, S-D-14, and S-D-18), at former acethylene storage (bldg. D5), and at asphalted road to the gate in the eastern side of former electrolysis (bldg. D10 – boring S-D-10. Mercury concentration above the DIV in the depth interval 1.0 – 2.0 m b.g.l. was encountered inside the electrolysis building D1 (borings S-D15 and S-D-21), under the road towards the southeast apart the production building (boring S-D-7), and at former acethylene storage (S-D-16); maximal mercury content in this depth interval was found again next to the settling sump (boring S-D-02: 240 mg/kg). In the lowermost sampling level, mercury concentration exceeding the DIV (10 mg/kg) was found only underneath the electrolysis building (borings S-D-15, S-D-21, and S-D-05 with the highest Hg concentration 81.4 mg/kg in the depth interval 4.6 – 4.8 m b.g.l.). In addition, Hg content far exceeding the DIV was found in soil sample collected from recovered core during the installation of MW-15 (depth 0.5 m, Hg = 285 mg/kg d.m. – since this sample is situated quite far apart from the electrolysis building, it may be assumed that this contamination results from secondary activities – i.e. removal of scrap from the bldg. D1; nevertheless, this case indicates the urgency of the remediation in order to minimize further soil contamination by mercury spilled from drawn technologies, this fact also indicates the necessity of careful monitoring of the soil quality during the excavation of Hg contaminated soil. Content of mercury in both samples of topsoil taken on agricultural land in Gorno Lisiče was below the DIV (0.16 mg/kg and 0.09 mg/kg, respectively). Laboratory analyses of sediment of the sewage inside the electrolysis plant area found Hg in concentration of 1.66 mg/kg. The sample of street sweepings collected on paved road east of the electrolysis plant contained elevated sum concentration of HCH (2.886 mg/kg), insignificantly exceeding the DIV. Surprisingly, elevated sum concentration of PCB (2.97 mg/kg) was found. Content of mercury was quite low (1.4 mg/kg) considering the close vicinity of the former electrolysis plant.
• Atmogeochemic mercurometry investigation found elevated concentrations of Hg in soil gas in most of borings with observed general decrease of concentration with depth. Higher Hg concentration in soil gas were measured along the north-western side of the building of the former electrolysis plant. Maximal concentration of Hg in soil gas 44.3 µg/m3 in a superficial layer (0.6 m bgl) of boring S–D-14 located next to the settling sump. Measured concentrations of Hg in soil gas superficial soil layer indicates necessity to pay relevant attention to occupational health and safety issues during the remediation works. Measurement of Hg in ambient air inside the electrolysis plant was influenced by two weather factors – by wind and low temperature (2oC). Amount of volatilized mercury strongly depends on the temperature, mercury concentration in ambient air increases substantially if the temperature raises up. Maximal Hg concentration found indoor was 35.8 µg/m3 , outdoor of the electrolysis plant was 8.6 µg/m3 next to the south-eastern entrance to the electrolysis plant.
• Analyses of VOC in soil gas samples (see Annex 22) found elevated contents of trichloroethene (TCE) and tetrachlorethene (PCE). In sector C (production of monochloracetic acid). Maximal TCE concentration was 2940 mg/m3 in
ENACON s.r.o. Na holém vrchu 708/3 143 00 Praha 4, Czech Republic
OHIS Skopje, Macedonia November 2009 Old Environmental Burdens Risk Assessment
21
boring S-C-4 located in the area of former above-ground tanks for this semiproduct.
2.2.2.2 Results of Street Sweepings and Sediment of the On-site Sewer • Laboratory analyses of sediment of the on-site sewer found elevated
concentrations of HCH (3.84 mg/kg) exceeding the Dutch Intervention Limit and residues of other chlorinated pesticides such as endusulfan (0.47 mg/kg), DDE (0.12 mg/kg), DDD (0.24 mg/kg) and DDT (1.24 mg/kg). Mercury was found in the sample in concentration of 1.66 mg/kg.
• The sample of street sweepings collected on paved road east of the electrolysis plant contained elevated sum concentration of HCH (2.886 mg/kg), insignificantly exceeding the Dutch Intervention Value. Content of other chlorinated pesticides were below respective laboratory detection limits. Surprisingly, elevated sum concentration of PCB (2.97 mg/kg) was found. Content of mercury was rather low (1.4 mg/kg) assuming close vicinity of the former electrolysis plant.
2.2.2.3 Results of Investigation of Dumps of Waste HCH Isomers α-HCH and β-HCH dump
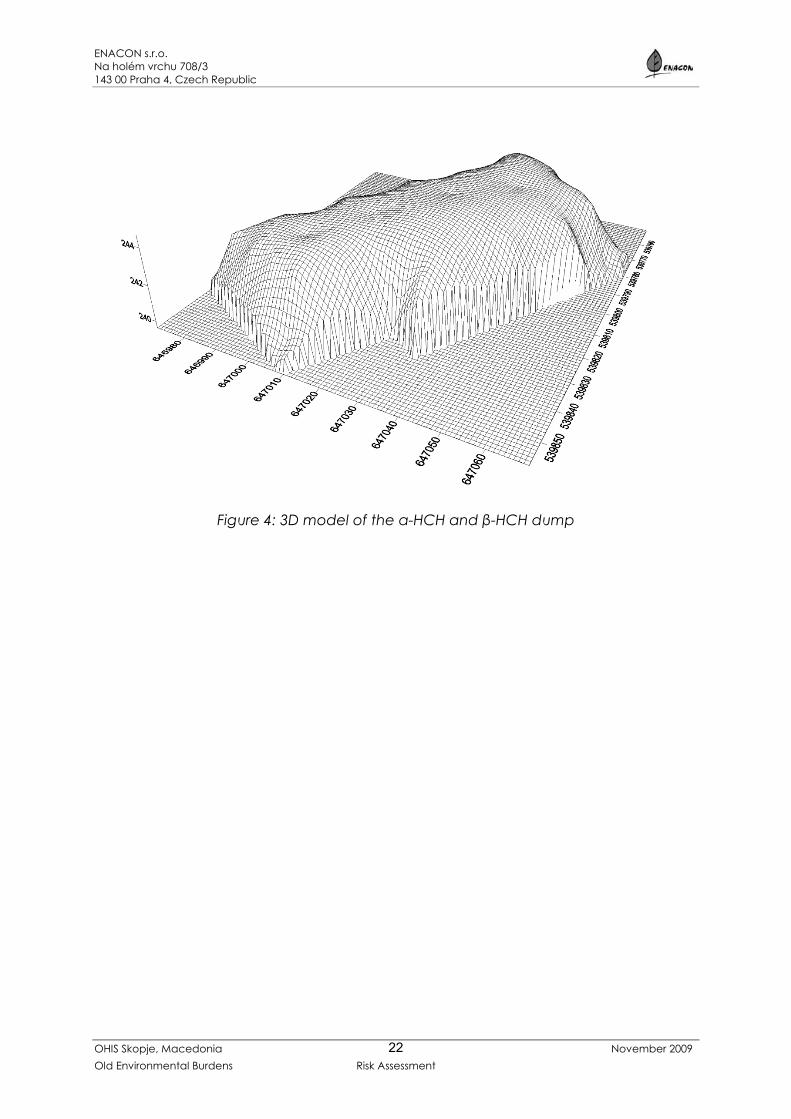
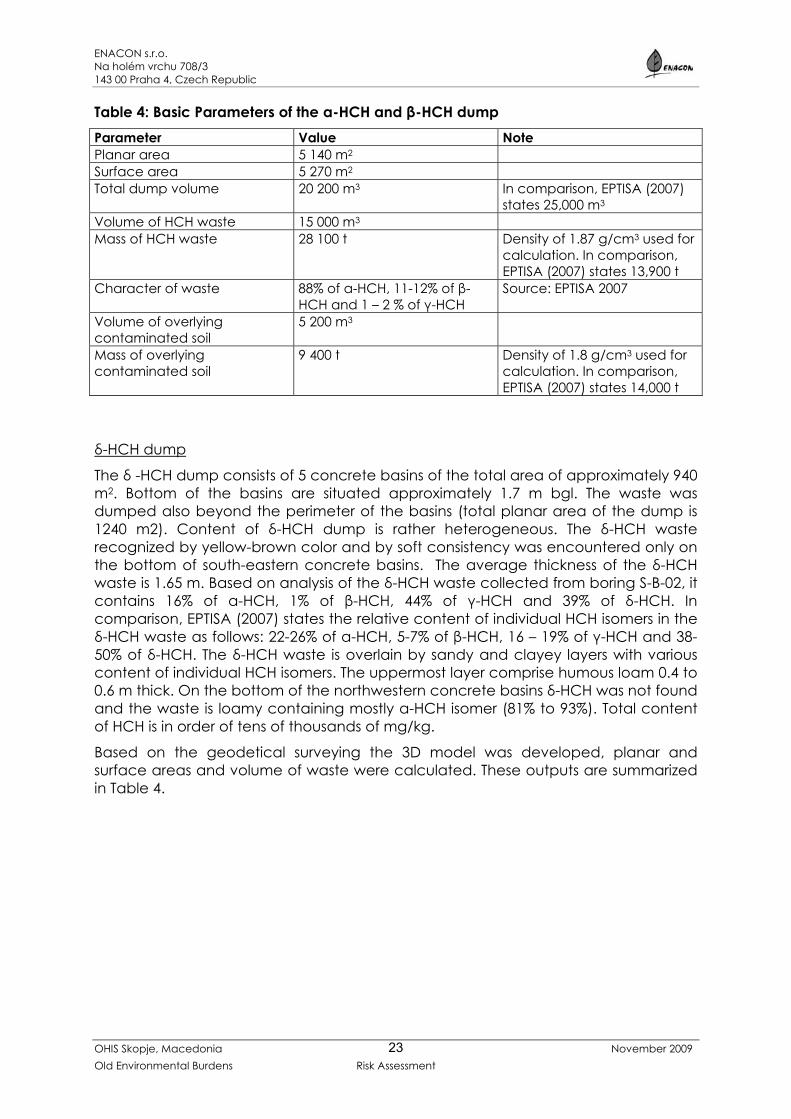
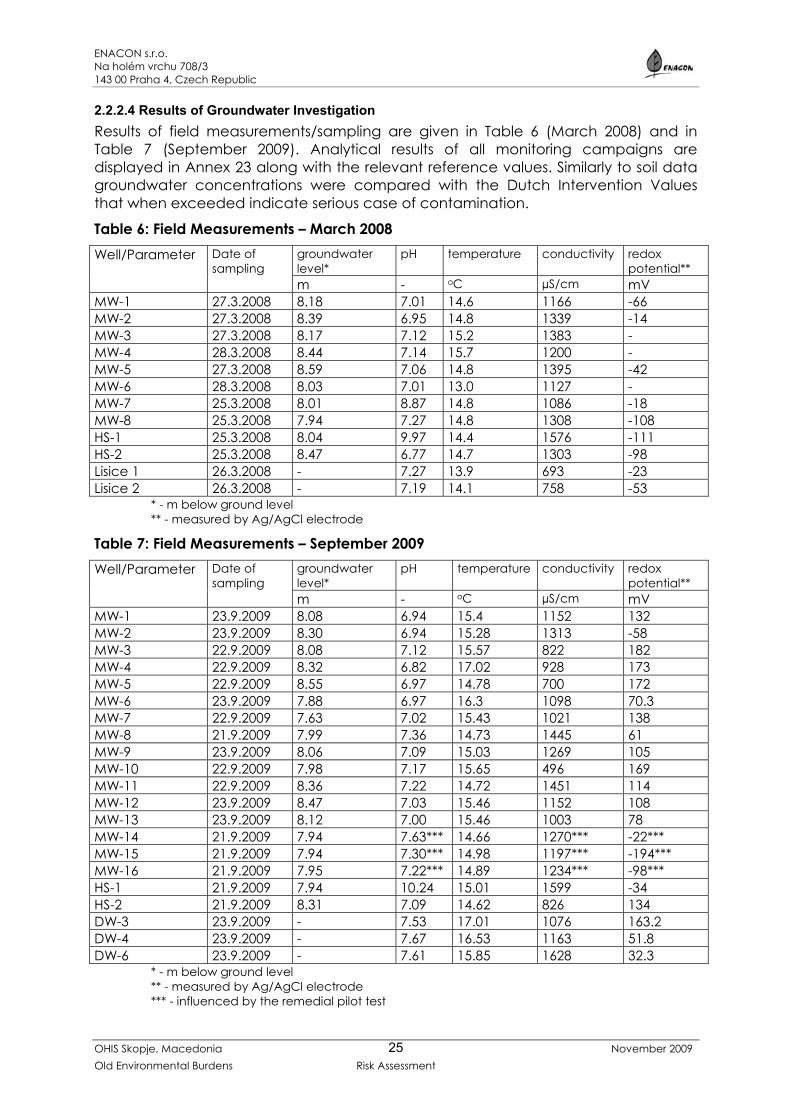
Analyses of both samples of waste disposed in the α-HCH and β-HCH dump found almost pure α-HCH. EPTISA (2007) states that the waste contains 86-88% of α-HCH, 11-12% of β-HCH and 1 – 2 % of γ-HCH. Based on boring logs the waste was disposed in this dump on natural ground without any protection, which confirms information provided by OHIS representatives. Thickness of waste (of white colour and pasty consistency) varies from 3.2 to 4.6 m. Waste isomers are overlain by a layer of humous loam and sandy clay of the thickness of 0.5 up to 1.6 m (1 m in average). The content of HCH in the soil cover of the dump is 897.13 mg/kg (soil boring S-B-06). Based on the geodetical surveing the 3D model was developed, planar and surface areas and volume of waste were calculated. These outputs are summarized in Table 4.
ENACON s.r.o. Na holém vrchu 708/3 143 00 Praha 4, Czech Republic
OHIS Skopje, Macedonia November 2009 Old Environmental Burdens Risk Assessment
22
Figure 4: 3D model of the α-HCH and β-HCH dump
ENACON s.r.o. Na holém vrchu 708/3 143 00 Praha 4, Czech Republic
OHIS Skopje, Macedonia November 2009 Old Environmental Burdens Risk Assessment
23
Table 4: Basic Parameters of the α-HCH and β-HCH dump Parameter Value Note Planar area 5 140 m2 Surface area 5 270 m2 Total dump volume 20 200 m3 In comparison, EPTISA (2007)
states 25,000 m3 Volume of HCH waste 15 000 m3 Mass of HCH waste 28 100 t Density of 1.87 g/cm3 used for
calculation. In comparison, EPTISA (2007) states 13,900 t
Character of waste 88% of α-HCH, 11-12% of β-HCH and 1 – 2 % of γ-HCH
Source: EPTISA 2007
Volume of overlying contaminated soil
5 200 m3
Mass of overlying contaminated soil
9 400 t Density of 1.8 g/cm3 used for calculation. In comparison, EPTISA (2007) states 14,000 t
δ-HCH dump
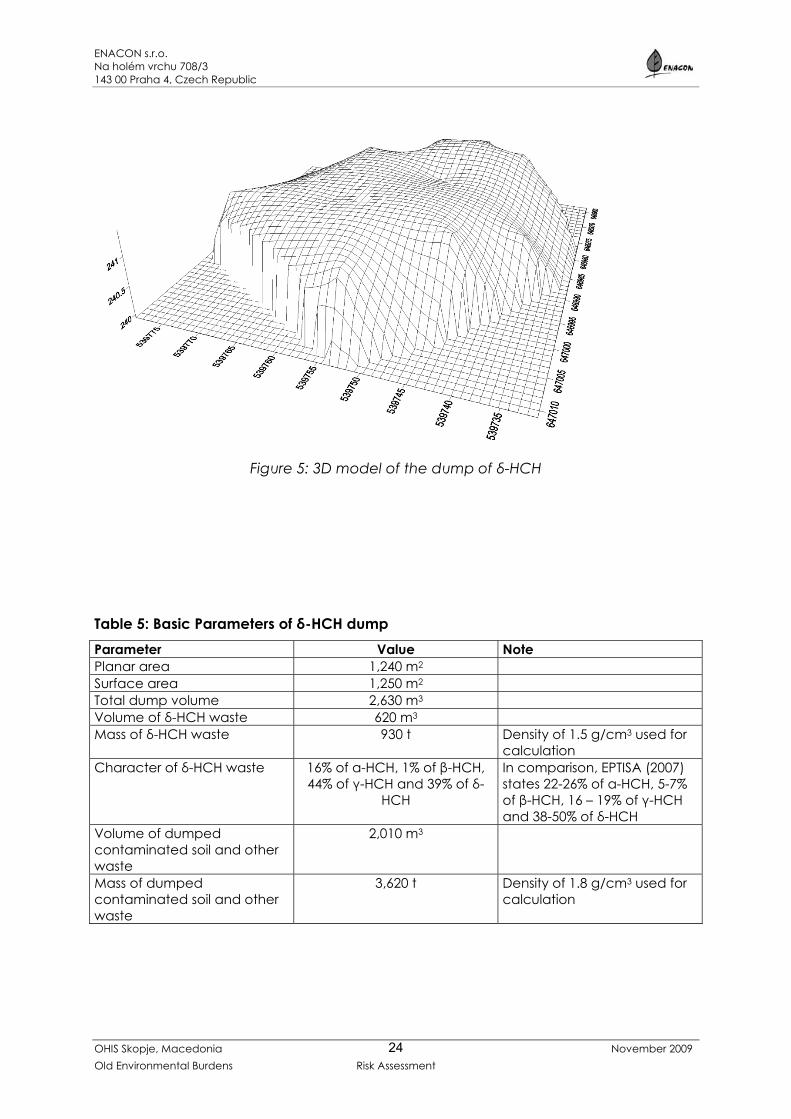
The δ -HCH dump consists of 5 concrete basins of the total area of approximately 940 m2. Bottom of the basins are situated approximately 1.7 m bgl. The waste was dumped also beyond the perimeter of the basins (total planar area of the dump is 1240 m2). Content of δ-HCH dump is rather heterogeneous. The δ-HCH waste recognized by yellow-brown color and by soft consistency was encountered only on the bottom of south-eastern concrete basins. The average thickness of the δ-HCH waste is 1.65 m. Based on analysis of the δ-HCH waste collected from boring S-B-02, it contains 16% of α-HCH, 1% of β-HCH, 44% of γ-HCH and 39% of δ-HCH. In comparison, EPTISA (2007) states the relative content of individual HCH isomers in the δ-HCH waste as follows: 22-26% of α-HCH, 5-7% of β-HCH, 16 – 19% of γ-HCH and 38-50% of δ-HCH. The δ-HCH waste is overlain by sandy and clayey layers with various content of individual HCH isomers. The uppermost layer comprise humous loam 0.4 to 0.6 m thick. On the bottom of the northwestern concrete basins δ-HCH was not found and the waste is loamy containing mostly α-HCH isomer (81% to 93%). Total content of HCH is in order of tens of thousands of mg/kg.
Based on the geodetical surveying the 3D model was developed, planar and surface areas and volume of waste were calculated. These outputs are summarized in Table 4.
ENACON s.r.o. Na holém vrchu 708/3 143 00 Praha 4, Czech Republic
OHIS Skopje, Macedonia November 2009 Old Environmental Burdens Risk Assessment
24
Figure 5: 3D model of the dump of δ-HCH
Table 5: Basic Parameters of δ-HCH dump Parameter Value Note Planar area 1,240 m2 Surface area 1,250 m2 Total dump volume 2,630 m3 Volume of δ-HCH waste 620 m3 Mass of δ-HCH waste 930 t Density of 1.5 g/cm3 used for
calculation Character of δ-HCH waste 16% of α-HCH, 1% of β-HCH,
44% of γ-HCH and 39% of δ-HCH
In comparison, EPTISA (2007) states 22-26% of α-HCH, 5-7% of β-HCH, 16 – 19% of γ-HCH and 38-50% of δ-HCH
Volume of dumped contaminated soil and other waste
2,010 m3
Mass of dumped contaminated soil and other waste
3,620 t Density of 1.8 g/cm3 used for calculation
ENACON s.r.o. Na holém vrchu 708/3 143 00 Praha 4, Czech Republic
OHIS Skopje, Macedonia November 2009 Old Environmental Burdens Risk Assessment
25
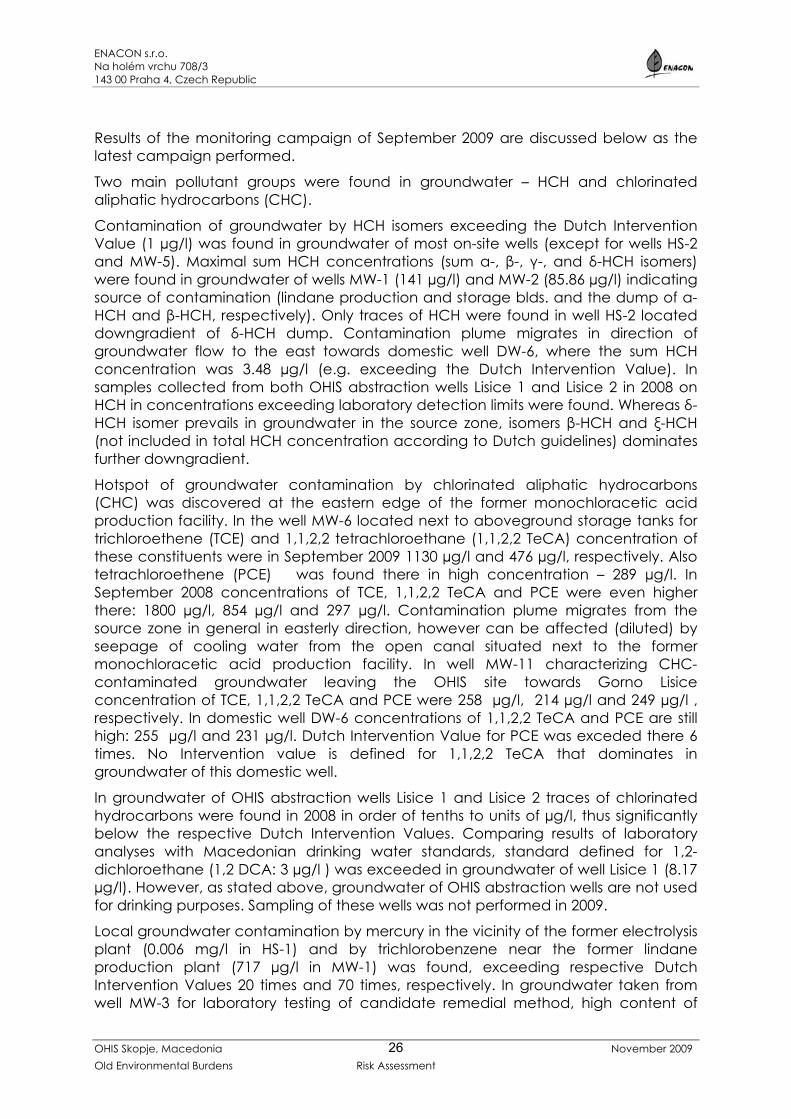
2.2.2.4 Results of Groundwater Investigation Results of field measurements/sampling are given in Table 6 (March 2008) and in Table 7 (September 2009). Analytical results of all monitoring campaigns are displayed in Annex 23 along with the relevant reference values. Similarly to soil data groundwater concentrations were compared with the Dutch Intervention Values that when exceeded indicate serious case of contamination.
Table 6: Field Measurements – March 2008 Well/Parameter Date of
sampling groundwater level*
pH temperature conductivity redox potential**
m - oC µS/cm mV MW-1 27.3.2008 8.18 7.01 14.6 1166 -66 MW-2 27.3.2008 8.39 6.95 14.8 1339 -14 MW-3 27.3.2008 8.17 7.12 15.2 1383 - MW-4 28.3.2008 8.44 7.14 15.7 1200 - MW-5 27.3.2008 8.59 7.06 14.8 1395 -42 MW-6 28.3.2008 8.03 7.01 13.0 1127 - MW-7 25.3.2008 8.01 8.87 14.8 1086 -18 MW-8 25.3.2008 7.94 7.27 14.8 1308 -108 HS-1 25.3.2008 8.04 9.97 14.4 1576 -111 HS-2 25.3.2008 8.47 6.77 14.7 1303 -98 Lisice 1 26.3.2008 - 7.27 13.9 693 -23 Lisice 2 26.3.2008 - 7.19 14.1 758 -53
* - m below ground level ** - measured by Ag/AgCl electrode
Table 7: Field Measurements – September 2009 Well/Parameter Date of
sampling groundwater level*
pH temperature conductivity redox potential**
m - oC µS/cm mV MW-1 23.9.2009 8.08 6.94 15.4 1152 132 MW-2 23.9.2009 8.30 6.94 15.28 1313 -58 MW-3 22.9.2009 8.08 7.12 15.57 822 182 MW-4 22.9.2009 8.32 6.82 17.02 928 173 MW-5 22.9.2009 8.55 6.97 14.78 700 172 MW-6 23.9.2009 7.88 6.97 16.3 1098 70.3 MW-7 22.9.2009 7.63 7.02 15.43 1021 138 MW-8 21.9.2009 7.99 7.36 14.73 1445 61 MW-9 23.9.2009 8.06 7.09 15.03 1269 105 MW-10 22.9.2009 7.98 7.17 15.65 496 169 MW-11 22.9.2009 8.36 7.22 14.72 1451 114 MW-12 23.9.2009 8.47 7.03 15.46 1152 108 MW-13 23.9.2009 8.12 7.00 15.46 1003 78 MW-14 21.9.2009 7.94 7.63*** 14.66 1270*** -22*** MW-15 21.9.2009 7.94 7.30*** 14.98 1197*** -194*** MW-16 21.9.2009 7.95 7.22*** 14.89 1234*** -98*** HS-1 21.9.2009 7.94 10.24 15.01 1599 -34 HS-2 21.9.2009 8.31 7.09 14.62 826 134 DW-3 23.9.2009 - 7.53 17.01 1076 163.2 DW-4 23.9.2009 - 7.67 16.53 1163 51.8 DW-6 23.9.2009 - 7.61 15.85 1628 32.3
* - m below ground level ** - measured by Ag/AgCl electrode *** - influenced by the remedial pilot test
ENACON s.r.o. Na holém vrchu 708/3 143 00 Praha 4, Czech Republic
OHIS Skopje, Macedonia November 2009 Old Environmental Burdens Risk Assessment
26
Results of the monitoring campaign of September 2009 are discussed below as the latest campaign performed.
Two main pollutant groups were found in groundwater – HCH and chlorinated aliphatic hydrocarbons (CHC).
Contamination of groundwater by HCH isomers exceeding the Dutch Intervention Value (1 µg/l) was found in groundwater of most on-site wells (except for wells HS-2 and MW-5). Maximal sum HCH concentrations (sum α-, β-, γ-, and δ-HCH isomers) were found in groundwater of wells MW-1 (141 µg/l) and MW-2 (85.86 µg/l) indicating source of contamination (lindane production and storage blds. and the dump of α-HCH and β-HCH, respectively). Only traces of HCH were found in well HS-2 located downgradient of δ-HCH dump. Contamination plume migrates in direction of groundwater flow to the east towards domestic well DW-6, where the sum HCH concentration was 3.48 µg/l (e.g. exceeding the Dutch Intervention Value). In samples collected from both OHIS abstraction wells Lisice 1 and Lisice 2 in 2008 on HCH in concentrations exceeding laboratory detection limits were found. Whereas δ-HCH isomer prevails in groundwater in the source zone, isomers β-HCH and ξ-HCH (not included in total HCH concentration according to Dutch guidelines) dominates further downgradient.
Hotspot of groundwater contamination by chlorinated aliphatic hydrocarbons (CHC) was discovered at the eastern edge of the former monochloracetic acid production facility. In the well MW-6 located next to aboveground storage tanks for trichloroethene (TCE) and 1,1,2,2 tetrachloroethane (1,1,2,2 TeCA) concentration of these constituents were in September 2009 1130 µg/l and 476 µg/l, respectively. Also tetrachloroethene (PCE) was found there in high concentration – 289 µg/l. In September 2008 concentrations of TCE, 1,1,2,2 TeCA and PCE were even higher there: 1800 µg/l, 854 µg/l and 297 µg/l. Contamination plume migrates from the source zone in general in easterly direction, however can be affected (diluted) by seepage of cooling water from the open canal situated next to the former monochloracetic acid production facility. In well MW-11 characterizing CHC-contaminated groundwater leaving the OHIS site towards Gorno Lisice concentration of TCE, 1,1,2,2 TeCA and PCE were 258 µg/l, 214 µg/l and 249 µg/l , respectively. In domestic well DW-6 concentrations of 1,1,2,2 TeCA and PCE are still high: 255 µg/l and 231 µg/l. Dutch Intervention Value for PCE was exceded there 6 times. No Intervention value is defined for 1,1,2,2 TeCA that dominates in groundwater of this domestic well.
In groundwater of OHIS abstraction wells Lisice 1 and Lisice 2 traces of chlorinated hydrocarbons were found in 2008 in order of tenths to units of µg/l, thus significantly below the respective Dutch Intervention Values. Comparing results of laboratory analyses with Macedonian drinking water standards, standard defined for 1,2-dichloroethane (1,2 DCA: 3 µg/l ) was exceeded in groundwater of well Lisice 1 (8.17 µg/l). However, as stated above, groundwater of OHIS abstraction wells are not used for drinking purposes. Sampling of these wells was not performed in 2009.
Local groundwater contamination by mercury in the vicinity of the former electrolysis plant (0.006 mg/l in HS-1) and by trichlorobenzene near the former lindane production plant (717 µg/l in MW-1) was found, exceeding respective Dutch Intervention Values 20 times and 70 times, respectively. In groundwater taken from well MW-3 for laboratory testing of candidate remedial method, high content of
ENACON s.r.o. Na holém vrchu 708/3 143 00 Praha 4, Czech Republic
OHIS Skopje, Macedonia November 2009 Old Environmental Burdens Risk Assessment
27
1,1,4,4 –tetrachloro 1,3 – butadiene was identified by a gas chromatograph in order of magnitude of hundreds of µg/l. Origin of this constituent was not discovered.
2.2.2.3 Results of Investigation of Contamination of Construction Materials Results of laboratory analyses of samples of construction materials are give in a table form in Annex 24.
• Analyses of samples of construction material found extremely high content of HCH isomers in inner mortar and masonry of building A-1 (former storage of HCH and production of TCB) and in the concrete floor of building A-2 (production of lindane). Sum concentration of HCH in these samples exceeds 1000 mg/kg). High HCH content was also found in all sampled materials (concrete floor, masonry and mortar) buildings A-10 (storage of granulated pesticides) and walls and ceiling of buildings A-2 and A-4 (former production of lindane), where sum concentration was in the range of tens to hundreds of mg/kg. Elevated HCH concentration (above 1 mg/kg) was identified in all analyzed samples of sector A.
• In floor of buildings A-6 (production of pesticides), A-8 (production of granulated organophosphates), A-7 (storage of pesticides) and A-10 (storage of granulated pesticides) high content of DDE, DDD and DDT were also found. Sum concentration of these pesticides varies in order of units of mg/kg.
• Laboratory determination of organophosphates in selected samples encountered extreme concentration of fonofos (1350 mg/kg) in the concrete floor of the storage of granulated pesticides (building A-10). Elevated content of fonofos (1.6 mg/kg) was also found in the concrete floor of the production building of granulated organophosphates (A-8).
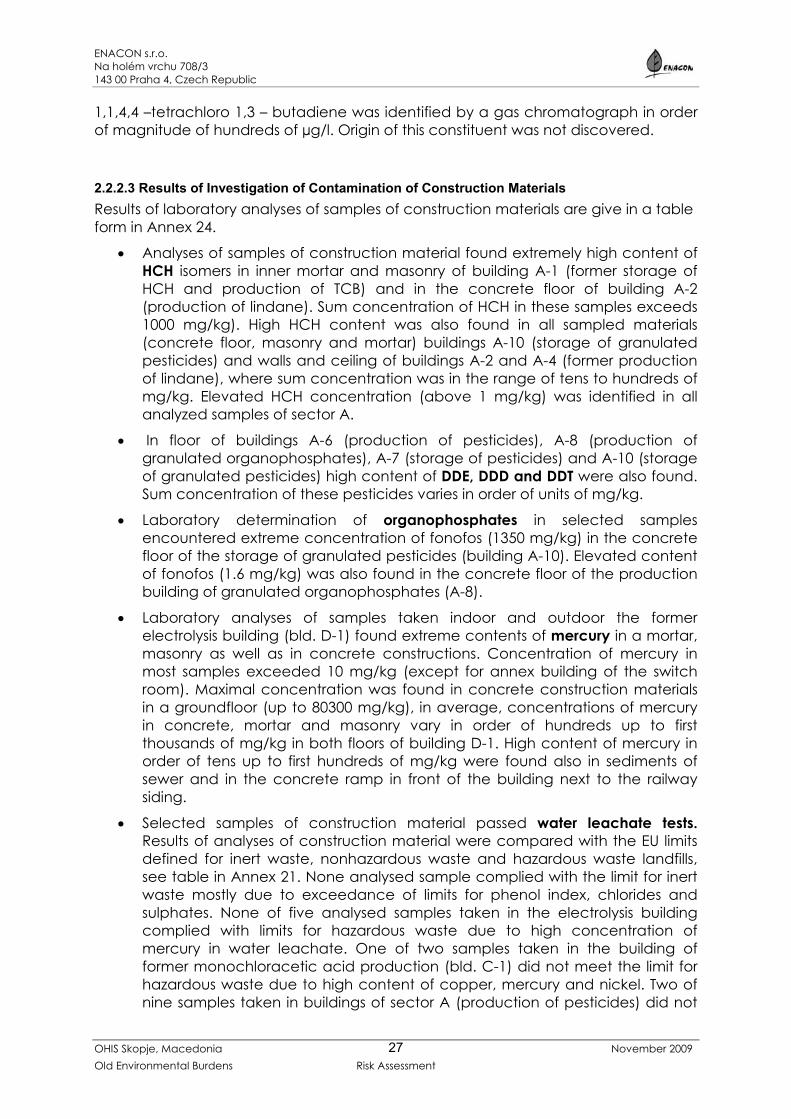
• Laboratory analyses of samples taken indoor and outdoor the former electrolysis building (bld. D-1) found extreme contents of mercury in a mortar, masonry as well as in concrete constructions. Concentration of mercury in most samples exceeded 10 mg/kg (except for annex building of the switch room). Maximal concentration was found in concrete construction materials in a groundfloor (up to 80300 mg/kg), in average, concentrations of mercury in concrete, mortar and masonry vary in order of hundreds up to first thousands of mg/kg in both floors of building D-1. High content of mercury in order of tens up to first hundreds of mg/kg were found also in sediments of sewer and in the concrete ramp in front of the building next to the railway siding.
• Selected samples of construction material passed water leachate tests. Results of analyses of construction material were compared with the EU limits defined for inert waste, nonhazardous waste and hazardous waste landfills, see table in Annex 21. None analysed sample complied with the limit for inert waste mostly due to exceedance of limits for phenol index, chlorides and sulphates. None of five analysed samples taken in the electrolysis building complied with limits for hazardous waste due to high concentration of mercury in water leachate. One of two samples taken in the building of former monochloracetic acid production (bld. C-1) did not meet the limit for hazardous waste due to high content of copper, mercury and nickel. Two of nine samples taken in buildings of sector A (production of pesticides) did not
ENACON s.r.o. Na holém vrchu 708/3 143 00 Praha 4, Czech Republic
OHIS Skopje, Macedonia November 2009 Old Environmental Burdens Risk Assessment
28
comply with the limits for hazardous waste due to high content of DOC, additionally two samples of that sector did not meet the limit for nonhazardous waste due to high content of DOC and fluorides, respectively.
Figure 6: Sampling of construction materials in the former electrolysis plant
2.2.2.4 Results of Analyses of Vegetables Results of laboratory analyses of lettuce, potatoes and celery were compared with maximum residue level (MRL) of pesticides defined by Regulation (EC) No 396/2005 of the European Parliament and of the Council on maximum residue levels of pesticides in or on food and feed of plant and animal origin. As regulation does not define MRL specifically for HCH isomers and for DDD, DDE and DDT, Default MRL in foodstuffs of 10 µg/kg was used. Default MRL was not exceeded in any sample of lettuce and potatoes, however was exceeded by β-HCH in the celery (25 µg/kg). Some residues of PCB in the range of tenths of µg/kg were found in samples of lettuce (under detection limits in potatoes and celery). Lettuce was analysed also for the content of mercury and was under the detection limit.
2.2.3 Summary of the Contamination Data The assessment of the contamination at the site resulted in the evaluation of the following environmental media:
1. Soil and soil gas. 2. Street sweepings and sediment of the on-site sewer. 3. Dumps of waste HCH isomers. 4. Groundwater. 5. Construction material. 6. Vegetables
ENACON s.r.o. Na holém vrchu 708/3 143 00 Praha 4, Czech Republic
OHIS Skopje, Macedonia November 2009 Old Environmental Burdens Risk Assessment
29
Results of the site characterization can be characterized as follows: Soil of the superficial zone (to the depth of 1 m bgl) is impacted by HCH isomers in most of the assessed area of the OHIS property. The highest concentrations of HCH were found under and next to both dumps of waste isomers where sum HCH concentrations exceed Dutch Intervention Limit more than 100 times. Soil contamination by HCH isomers sharply ceases with depth due to their low water solubility and due to low permeability of the underlying clay layer. Nevertheless, under the both HCH dumps, in the vicinity of the δ-HCH dump and sporadically also in other locations HCH concentrations are still high exceeding the Dutch Intervention Limit by more than one order even in the deepest sampled interval (4.6 – 4.8 m bgl.) The topsoil of the agricultural land some 100 m to the north of the site found sum HCH concentration slightly exceeding the Dutch Intervention Value. In one of three samples analysed for dioxins content the concentration exceeded Dutch Indicative Level for Serious Contamination. Extent of soil contamination by DDE, DDD and DDT and its intensity is significantly lower compare to HCH. DDE, DDD and DDT impact refers only to superficial layer in sector A (production of pesticides) where maximal sum concentration exceeded the Dutch Intervention Value. Contamination of soil by chlorobenzenes in the superficial layer (to the depth of 1 m bgl) as well as in the depth interval 1.4 – 1.9 m bgl. was found only next to the south-eastern edge of the δ-HCH dump. Maximal sum concentration of chlorobenzenes was found in the depth interval 0.3 – 0.7 m bgl. exceeded the Dutch Intervention limit 37 times. Of monitored metals elevated contents of mercury in sector D (former electrolysis plant) was only encountered. Mercury contaminated soil was found under the floor of the electrolysis building as well as outside the building. Generally, Hg concentration increases with depth in most of the borings of this sector. Maximal mercury content in soil exceeded the Dutch Intervention Limit 98 times.¨ Elevated concentrations of Hg in soil gas were detected in most of borings within the former electrolysis plant and its close surroundings with observed general decrease of concentration with depth. Higher Hg concentration in soil gas were measured along the north-western side of the building of the former electrolysis plant. Maximal concentration of Hg in soil gas 44.3 µg/m3 in a superficial layer (0.6 m bgl) next to the settling sump. Analyses of soil gas samples found elevated contents of trichloroethene (TCE) and tetrachlorethene (PCE). In sector C (production of monochloracetic acid). Maximal TCE concentration was 2940 mg/m3 in boring S-C-4 located in the area of former above-ground tanks for this semiproduct Laboratory analyses of sediment of the on-site sewer found elevated concentrations of HCH exceeding the Dutch Intervention Limit 1.9 times and residues of other chlorinated pesticides such as endusulfan, DDE, DDD and DDT. Mercury was found in the sample in concentration of 1.66 mg/kg.
The sample of street sweepings collected on paved road east of the electrolysis plant contained elevated concentration of HCH, insignificantly exceeding the Dutch Intervention Value. Content of other chlorinated pesticides were below respective laboratory detection limits. Surprisingly, elevated sum concentration of PCB was
ENACON s.r.o. Na holém vrchu 708/3 143 00 Praha 4, Czech Republic
OHIS Skopje, Macedonia November 2009 Old Environmental Burdens Risk Assessment
30
found. Content of mercury was rather low (1.4 mg/kg) assuming close vicinity of the former electrolysis plant. Analyses of both samples of waste disposed in the α-HCH and β-HCH dump found almost pure α-HCH. The waste was disposed in this dump on natural ground without any protection. Thickness of waste (of white colour and pasty consistency) varies from 3.2 to 4.6 m. Waste isomers are overlain by a layer of humous loam and sandy clay of the thickness of 0.5 up to 1.6 m (1 m in average). The content of HCH in the soil cover of the dump exceeded the Dutch Intervention Value 450 times (one sample analysed). Surveying of the dump resulted in total volume of 20 200 m3 and volume of HCH waste of 15 000 m3. Assuming α-HCH density of 1.87 g/cm3 it gives 28 100 t of HCH waste. The δ-HCH dump consists of 5 concrete basins however the waste was dumped also beyond the perimeter of the basins. Content of δ-HCH dump is rather heterogeneous. The δ-HCH waste was encountered only on the bottom of south-eastern concrete basins. The average thickness of the δ-HCH waste is 1.65 m. Based on analysis of the δ-HCH waste contains 16% of α-HCH, 1% of β-HCH, 44% of γ-HCH and 39% of δ-HCH. The δ-HCH waste is overlain by sandy and clayey layers with various content of individual HCH isomers. The uppermost layer comprise humous loam 0.4 to 0.6 m thick. On the bottom of the northwestern concrete basins δ-HCH waste was not found and the waste is loamy containing mostly α-HCH isomer (81% to 93%). Based on the surveying, the total dump volume is 2 630 m3 and volume of δ-HCH waste is approximately 620 m3 (590 t), remaining 2 010 m3 comprise dumped contaminated soil and other waste (prevailing α-HCH). Two main pollutant groups were found in groundwater – HCH and chlorinated aliphatic hydrocarbons (CHC). Maximal HCH concentrations in groundwater exceeding Dutch Intervention Limit 141 times and 86 times, respectively were found in September 2009 next to probable source of contamination - lindane production and storage blds. and the dump of α-HCH and β-HCH. Contamination plume migrates in direction of groundwater flow to the east towards domestic well DW-6, where the sum HCH concentration also exceeded the Dutch Intervention Value (3.5 times). Hotspot of groundwater contamination by CHC was discovered at the eastern edge of the former monochloracetic acid production facility. Comparing concentrations of individual CHC with respective Dutch Intervention Values, in the very hotspot, the Dutch Intervention Value was exceeded 2.3 times for TCE and 7 times for PCE. Of all sampled downgradient domestic wells, the Dutch Intervention Value for PCE was exceeded 6 times in well DW-6. No Intervention value is defined for 1,1,2,2 TeCA that dominates there. Local groundwater contamination by mercury in the vicinity of the former electrolysis plant, by trichlorobenzene near the former lindane production plant was found, exceeding respective Dutch Intervention Values 20 times and 70 times, respectively. In groundwater taken from well MW-3 for laboratory testing of candidate remedial method, high content of 1,1,4,4 –tetrachloro 1,3 – butadiene was identified by a gas chromatograph in order of magnitude of hundreds of µg/l. Origin of this constituent was not discovered. Analyses of samples of construction material found elevated HCH concentration (above 1 mg/kg) in all analyzed samples of sector A (production of pesticides). Extremely high content of HCH isomers (above 1000 mg/kg) were identified in inner mortar and masonry of building A-1 (former storage of HCH and production of TCB) and in the concrete floor of building A-2 (production of lindane). In floor of buildings
ENACON s.r.o. Na holém vrchu 708/3 143 00 Praha 4, Czech Republic
OHIS Skopje, Macedonia November 2009 Old Environmental Burdens Risk Assessment
31
A-6 (production of pesticides), A-8 (production of granulated organophosphates), A-7 (storage of pesticides) and A-10 (storage of granulated pesticides) high content of DDE, DDD and DDT (in order of units of mg/kg) were also found. Extreme concentration of fonofos exceeding 1000 mg/kg was found in the concrete floor of the storage of granulated pesticides (building A-10). Extreme contents of mercury (hundreds up to thousands of mg/kg) were found in a mortar, masonry as well as in concrete constructions of the former electrolysis building (bld. D-1). Selected samples of construction material passed water leachate tests and results of analyses of construction material were compared with the EU limits defined for inert waste, nonhazardous waste and hazardous waste landfills. None analyzed sample complied with the limit for inert waste. None of five analysed samples taken in the electrolysis building complied with limits for hazardous waste due to mercury content, One of two samples taken in the building of former monochloracetic acid production (bld. C-1) did not meet the limit for hazardous waste due to high content of copper, mercury and nickel. Two of nine samples taken in buildings of sector A (production of pesticides) did not comply with the limits for hazardous waste due to high content of DOC. Results of laboratory analyses of vegetables (lettuce, potatoes, celery) were compared with maximum residue level (MRL) of pesticides defined by Regulation (EC) No 396/2005. Default MRL of 10 µg/kg for individual pesticide was not exceeded in any sample of lettuce and potatoes, however was exceeded by β-HCH in the celery (25 µg/kg). Some residues of PCB in the range of tenths of µg/kg were found in samples of lettuce (under detection limits in potatoes and celery). Lettuce was analysed also for the content of mercury and was under the detection limit.
2.2.4 Assessment of the Contaminant Migration
2.2.4.1 Migration of Contamination in the Unsaturated Zone The aquifer is confined by a low-permeable layer of clayey silt to silty clay of the variable thickness from 1.5 to 4.5 m that serves as a protective layer of the aquifer developed in Quaternary alluvial sediments. Total thickness of the unsaturated zone is rather high – 8 to 8.5 m in average. Nevertheless, encountered vast groundwater contamination by both main pollutants (HCH and CHC) clearly proves that the hydraulic and chemical resistance of that layer is not sufficient with regards to amounts of contaminants leaching from above ground contamination sources. Based on the mathematical modelling of contaminant transport (see Annex 32) approximately 30 kg/year of HCH isomers, 30 kg/year of PCE and 90 kg/year of TeCA seep through the unsaturated zone to groundwater. Higher mass flux of CHC (namely PCE and TeCA) in comparison to HCH (considering large amounts of HCH waste stored at the site) reflex the fact that chlorinated hydrocarbons are more mobile than HCH due to higher water solubility, lower tendency to sorption and higher density. Of other contaminants mercury and trichlorobenzene were found locally in groundwater in elevated concentrations and thus their mobility and leaked amounts have overcome the retention capacity of the unsaturated zone. In comparison to above discussed contaminants (HCH and CHC) mercury and , trichlorobenzene
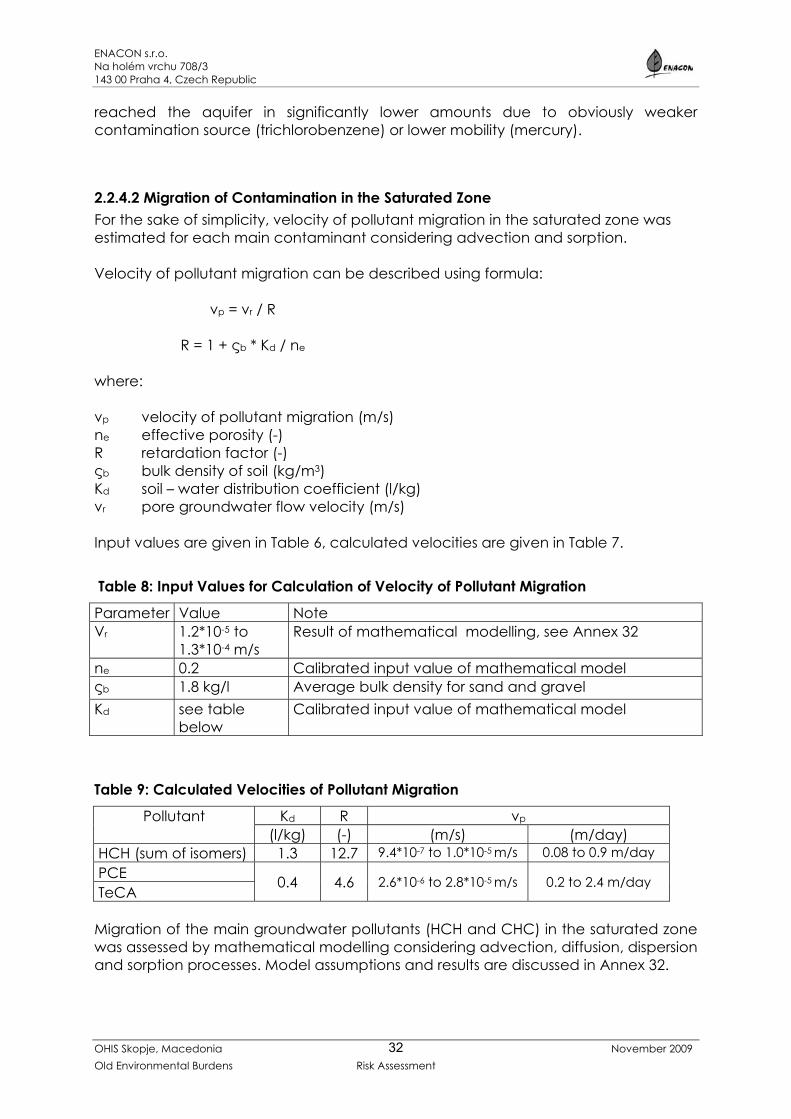
ENACON s.r.o. Na holém vrchu 708/3 143 00 Praha 4, Czech Republic
OHIS Skopje, Macedonia November 2009 Old Environmental Burdens Risk Assessment
32
reached the aquifer in significantly lower amounts due to obviously weaker contamination source (trichlorobenzene) or lower mobility (mercury).
2.2.4.2 Migration of Contamination in the Saturated Zone For the sake of simplicity, velocity of pollutant migration in the saturated zone was estimated for each main contaminant considering advection and sorption. Velocity of pollutant migration can be described using formula:
vp = vr / R
R = 1 + ςb * Kd / ne where: vp velocity of pollutant migration (m/s) ne effective porosity (-) R retardation factor (-) ςb bulk density of soil (kg/m3) Kd soil – water distribution coefficient (l/kg) vr pore groundwater flow velocity (m/s) Input values are given in Table 6, calculated velocities are given in Table 7.
Table 8: Input Values for Calculation of Velocity of Pollutant Migration
Parameter Value Note Vr 1.2*10-5 to
1.3*10-4 m/s Result of mathematical modelling, see Annex 32
ne 0.2 Calibrated input value of mathematical model ςb 1.8 kg/l Average bulk density for sand and gravel Kd see table
below Calibrated input value of mathematical model
Table 9: Calculated Velocities of Pollutant Migration
Pollutant Kd R vp (l/kg) (-) (m/s) (m/day)
HCH (sum of isomers) 1.3 12.7 9.4*10-7 to 1.0*10-5 m/s 0.08 to 0.9 m/day PCE 0.4 4.6 2.6*10-6 to 2.8*10-5 m/s 0.2 to 2.4 m/day TeCA Migration of the main groundwater pollutants (HCH and CHC) in the saturated zone was assessed by mathematical modelling considering advection, diffusion, dispersion and sorption processes. Model assumptions and results are discussed in Annex 32.
ENACON s.r.o. Na holém vrchu 708/3 143 00 Praha 4, Czech Republic
OHIS Skopje, Macedonia November 2009 Old Environmental Burdens Risk Assessment
33
Based on the mathematical modelling, HCH plume migrates from the source area (HCH dump and probably also former HCH production areas) in direction of groundwater flow towards the east. After about 40 years of assumed duration of the contamination source (production of HCH started in the mid of 1960´s), the HCH contaminant plume extended to the south-eastern part of Gorno Lisice. Based on the mathematical model the front edge of the HCH contaminant plume (expressed as 1µg/l isoline) is some 1.4 km downgradient (to the east) of the contamination source area. Migration of HCH in the period of years 2008 – 2028 was predicted by the mathematical model. Within this period front edge of the HCH plume will move further in easterly direction by another 300 m. CHC are substantially more mobile pollutants. According to results of the calibrated mathematical model TeCA and PCE plumes were attracted by the Lisice 1 wells when these wells were active. When pumping of Lisice 2 wells ceased the front edge of the plumes started to move towards the Lisice 2 well. Model results for year 2008 (i.e. after approximately 40 – year duration of the source) show that the edge of the PCE and TeCA plumes is about 2.0 km to the east to northeast from the contamination source area. Model predictions of the future behaviour of the CHC plumes resulted in further spread of both plumes towards the Markova river on the east and to the Lisice 2 well to the northeast. In sum, based on the model results, trace concentrations of CHC found in groundwater of the Lisice 2 well and especially in groundwater of the Lisice 1 well have very likely origin in the OHIS plant.
2.2.4.3 Migration of Contamination in the Surface Water As discussed above, groundwater contaminated by CHC has spread towards the Lisice 1 and Lisice 2 abstraction wells. As the Lisice 2 well is still being pumped, it acts as a interceptor of the CHC contaminant plume. Thus, under such conditions, the CHC contaminant plume will not reach the Vardar river. According to the model results the Markova river does not drain groundwater (groundwater level is below the surface water level) thus cannot be affected either. In case that groundwater abstraction from the Lisice 2 well is terminated or pumping rate significantly decreases, CHC plume would finally discharge into the Vardar river. Nevertheless, comparing even the 90% minimal flow rate of the Vardar river (6340 l/s) with the estimated flow rate of the contaminated plume towards the Vardar river (first tens of l/s in maximum), the dilution factor will be more than 1:100. Considering such dilution factor and CHC concentration in the front part of the contaminant plume (units or first tens of µg/l), even under the conservative assumptions surface water quality of the Vardar river should not be affected by drainage of impacted groundwater.
2.2.4.4 Progress of Contamination with Regards to Natural Attenuation As groundwater contamination by HCH and CHC dominate at the site natural attenuation of these two main contaminants are discussed below. In case of chlorinated aliphatic hydrocarbons (CHC) intrinsic biodegradation is the main attenuation process. There are several intrinsic CHC biodegradation processes oxidative as well as reductive nevertheless the reductive dechlorination (halorespiration) is considered as the most important one.
ENACON s.r.o. Na holém vrchu 708/3 143 00 Praha 4, Czech Republic
OHIS Skopje, Macedonia November 2009 Old Environmental Burdens Risk Assessment
34
For halorepiration to occur, the following conditions must exist: (1) the subsurface environment must be anaerobic and have a low oxidation-reduction potential, (2) chlorinated hydrocarbons amenable to halorepiration must be present, (3) there must be an adequate supply of fermentation substrate for production of dissolved hydrogen (acts as electron donor), and (4) microbes mediating the reaction (halorespirators) must be present. Detailed assessment of these assumptions was not included within the scope of this study, however review of collected data resulted in conclusions that local conditions are unfavourable for significant intrinsic biodegradation mainly due to following reasons:
• Aquifer is in aerobic or indifferent state with high concentrations of nitrates (tens of mg/l) and sulphates ( > 100 mg/l), low concentration of iron and manganese (<1 mg/l), see Annex 23), not under sulphate reducing conditions that is optimal for halorespiration;
• Low content of fermentation substrate (low concentration of dissolved organic carbon - first units of mg/l) that can act as electron donor.
• Insignificant intensity of intrinsic biodegradation at the site is also indicated by low concentrations of semi-products of CHC biodegradation –1,2-cis-DCE and 1,2-trans-DCE in groundwater in comparison to original pollutants (TCE and PCE) that strongly dominates.
In sum, natural attenuation processes are not very likely of such significance that would prevent further migration of groundwater contamination by CHC off-site. With regards to HCH limited information is available on rates of natural attenuation processes observed in the field. Although HCH undergo hydrolysis (degradation from reaction with water), the primary degradation mechanism relies on biodegradation. Biodegradation of γ-HCH (lindane) in soil occurs under both aerobic as well as anaerobic conditions, however anaerobic conditions are more favourable: 744 to 9912 hours of aerobic half-life in comparison to 142 to 734 hours of anaerobic half-life based on anaerobic flooded soil die-away study data (Howard et al 1991). Degradation proceeds through various intermediates. Montgomery (1991) reports generation of penta- and tetrachlorocyclohexanes, penta-, tetra-, tri- and dichlorobenzenes. Nevertheless HCH isomers are in general considered as rather persistent pollutants. Very low concentrations of chlorobenzenes (potential intermediates of HCH degradation) in groundwater at the site indicate that biodegradation processes are not significant at the site. Thus sorption is the main process that prevent spread of HCH contamination in groundwater. However sorption retards the migration rather than decrease the total content of the contaminant in the aquifer.
2.2.5 Summary of Migration and of Contamination Progress Results of the assessment of migration of contaminants can be summarized as follows:
• low-permeable layer of clayey silt to silty clay overlying the aquifer serves as protective layer, nevertheless is not sufficient with regards to amounts of contaminants leaching from above ground contamination sources.
ENACON s.r.o. Na holém vrchu 708/3 143 00 Praha 4, Czech Republic
OHIS Skopje, Macedonia November 2009 Old Environmental Burdens Risk Assessment
35
Based on the mathematical modelling of contaminant transport approximately 30 kg/year of HCH isomers, 30 kg/year of PCE and 90 kg/year of TeCA seep through the unsaturated zone to groundwater. Of other contaminants mercury and trichlorobenzene were found locally in groundwater in elevated concentrations and thus their mobility and leaked amounts have overcome the retention capacity of the unsaturated zone, nevertheless not to large extent.
• velocities of migration of main pollutants in groundwater (HCH isomers, PCE and TeCA) were estimated considering advection and sorption. HCH isomers migrates in groundwater by velocity of approximately 0.08 to 0.9 m/day (30 to 330 m/year). Velocity of PCE and TeCA is approximately 0.2 to 2.4 m/day (70 to 900 m/year). Higher migration velocities refer to the surroundings of abstraction wells Lisice 1 and Lisice 2, where low concentrations of chlorinated aliphatic hydrocarbons were detected only. Based o calibrated mathematical model HCH - contaminated groundwater spread some 1.4 km downgradient (to the south-eastern part of Gorno Lisice) from the source within approximately 40 years. CHC are substantially more mobile pollutants. Model results for year 2008 (i.e. after approximately 40 – year duration of the source) show that the edge of the PCE and TeCA plumes is about 2.0 km to the east to northeast from the contamination source area and were attracted by the Lisice 1 and Lisice 2 abstraction wells. Thus, based on the model results, trace concentrations of CHC found in groundwater of the Lisice 2 well and especially in groundwater of the Lisice 1 well have very likely origin in the OHIS plant.
• Based on the mathematical model, as long as the Lisice 2 abstraction well is active, it will act as a interceptor of the CHC contaminant plume migrating from the OHIS plant. Even in the case of termination of groundwater abstraction from the Lisice 2 well, the impact of surface water quality by discharge of contaminated groundwater into the Vardar river will be negligible due to the high dilution factor. According to the model results the Markova river does not drain groundwater (groundwater level is below the surface water level) thus cannot be affected either.
• Natural attenuation processes are not very likely of such significance that would prevent further migration of groundwater contamination by CHC and HCH off-site. Sorption is the main process that prevent significant spread of HCH contamination in groundwater (in comparison to CHC). However sorption retards the migration rather than decrease the total content of the contaminant.
ENACON s.r.o. Na holém vrchu 708/3 143 00 Praha 4, Czech Republic
OHIS Skopje, Macedonia November 2009 Old Environmental Burdens Risk Assessment
36
3 Risk Assessment
3.1 Hazard Identification The relevant exposure scenarios were identified based on the actual information on contamination character and its extent considering the real transport mechanisms and current land use.
Under the current land use the potential risk acceptors are associated with the following:
• contaminated top soil horizon (to the depth of 1 m below surface). It includes the contact (inhalation of dust / fine particles generated from unpaved areas) with contaminated soil during a routine walkover by on-site workers in Sectors A and B;
• contaminated soil to a depth of approximately 2 m below surface. It includes the contact with contaminated soil during the temporary excavation activities at the site carried out by external workers;
• contaminated construction material - it includes the inhalation of dust and fine particles released from construction material by on-site workers during routine activities in sectors A and D;
• contaminated soil gas – it includes the excavation activities and vapors intrusion into on-site buildings and their subsequent inhalation by on-site workers;
• contaminated groundwater off-site – it includes the contact with groundwater during irrigation of gardens and small fields located north-easterly the site;
• contaminated soil in gardens and small fields off-site – it includes the contact with soil impacted by dust originated from the site during gardening;
• contaminated vegetables – it includes the ingestion of home-grown vegetables on gardens and small fields located northerly the site.
3.1.1 Determination of priority contaminants The priority contaminants were determined based on the found level of contamination (in comparison with Dutch intervention values) in the individual assessed media:
• top soil horizon - α-, β-, γ-, and δ-isomers of HCH, DDT, monochlorobenzene, dichlorobenzene, trichlorobenzene, tetrachloobenzene, pentachlorobenzene and hexachlorobenzene;
• soil - α-, β-, γ-, and δ-isomers of HCH, DDD, DDE, DDT and chlorobenzenes, mercury;
• construction material - α-, β-, γ-, and δ-isomers of HCH, endosulfan, DDE, DDE, DDT and mercury;
• soil gas – trichloroethylene, tetrachloroethylene and mercury;
ENACON s.r.o. Na holém vrchu 708/3 143 00 Praha 4, Czech Republic
OHIS Skopje, Macedonia November 2009 Old Environmental Burdens Risk Assessment
37
• groundwater off-site - α-, β-, γ-, and δ-isomers of HCH, tetrachloroethylene and tetrachloroethane;
• soil in gardens and small fields off-site - α-, β-, and γ-isomers of HCH and mercury;
• vegetables - α-, β-, γ-, and δ-isomers of HCH, DDE, endosulfan, PCBs.
The input values of priority contaminants have been calculated from all data obtained during site investigations (data from borings/wells drilled in paved areas were not used for the calculation for top soil horizon) as mean representing the average so called most likely exposure (MLE). The half of detection limit has been used if concentration was found below it.
The overview of calculated input concentrations of priority contaminants in the individual media is shown in Annex 33.
The basic toxicological properties of selected priority contaminants (values of reference doses for chronic exposure and slope factors – see also chapter 3.2.2) are summarized in the following tables. The main source of data is the toxicological database RAIS (Risk Assessment Information System http://rais.ornl.gov/) reviewed in July 2008 unless otherwise noted.
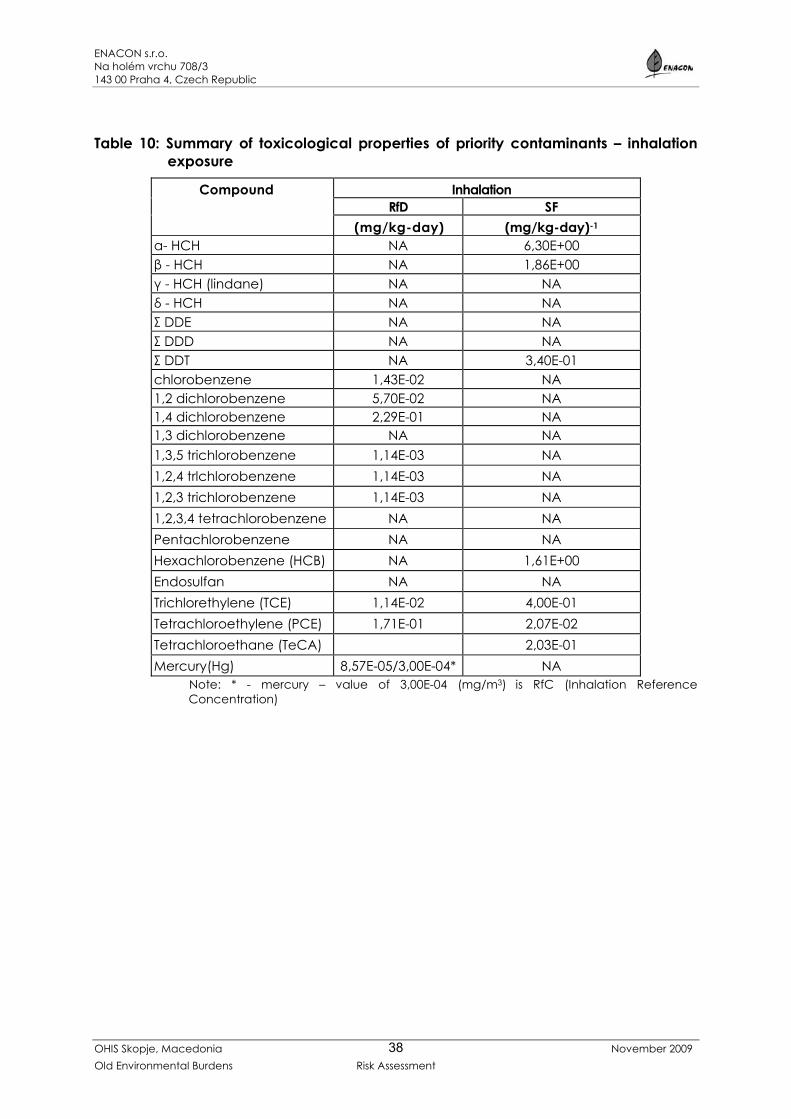
ENACON s.r.o. Na holém vrchu 708/3 143 00 Praha 4, Czech Republic
OHIS Skopje, Macedonia November 2009 Old Environmental Burdens Risk Assessment
38
Table 10: Summary of toxicological properties of priority contaminants – inhalation exposure
Compound Inhalation RfD SF (mg/kg-day) (mg/kg-day)-1 α- HCH NA 6,30E+00 β - HCH NA 1,86E+00 γ - HCH (lindane) NA NA δ - HCH NA NA Σ DDE NA NA Σ DDD NA NA Σ DDT NA 3,40E-01 chlorobenzene 1,43E-02 NA 1,2 dichlorobenzene 5,70E-02 NA 1,4 dichlorobenzene 2,29E-01 NA 1,3 dichlorobenzene NA NA 1,3,5 trichlorobenzene 1,14E-03 NA 1,2,4 trlchlorobenzene 1,14E-03 NA 1,2,3 trichlorobenzene 1,14E-03 NA 1,2,3,4 tetrachlorobenzene NA NA Pentachlorobenzene NA NA Hexachlorobenzene (HCB) NA 1,61E+00 Endosulfan NA NA Trichlorethylene (TCE) 1,14E-02 4,00E-01 Tetrachloroethylene (PCE) 1,71E-01 2,07E-02 Tetrachloroethane (TeCA) 2,03E-01 Mercury(Hg) 8,57E-05/3,00E-04* NA
Note: * - mercury – value of 3,00E-04 (mg/m3) is RfC (Inhalation Reference Concentration)
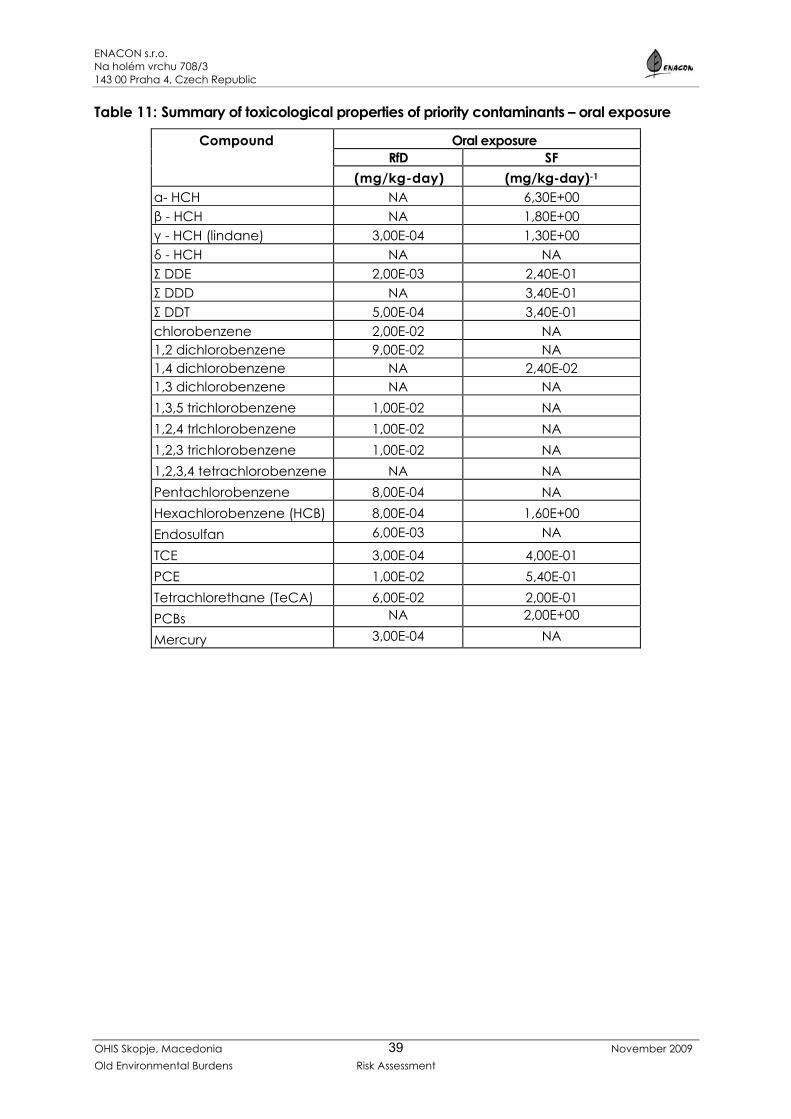
ENACON s.r.o. Na holém vrchu 708/3 143 00 Praha 4, Czech Republic
OHIS Skopje, Macedonia November 2009 Old Environmental Burdens Risk Assessment
39
Table 11: Summary of toxicological properties of priority contaminants – oral exposure
Compound Oral exposure RfD SF (mg/kg-day) (mg/kg-day)-1 α- HCH NA 6,30E+00 β - HCH NA 1,80E+00 γ - HCH (lindane) 3,00E-04 1,30E+00 δ - HCH NA NA Σ DDE 2,00E-03 2,40E-01 Σ DDD NA 3,40E-01 Σ DDT 5,00E-04 3,40E-01 chlorobenzene 2,00E-02 NA 1,2 dichlorobenzene 9,00E-02 NA 1,4 dichlorobenzene NA 2,40E-02 1,3 dichlorobenzene NA NA 1,3,5 trichlorobenzene 1,00E-02 NA 1,2,4 trlchlorobenzene 1,00E-02 NA 1,2,3 trichlorobenzene 1,00E-02 NA 1,2,3,4 tetrachlorobenzene NA NA Pentachlorobenzene 8,00E-04 NA Hexachlorobenzene (HCB) 8,00E-04 1,60E+00 Endosulfan 6,00E-03 NA
TCE 3,00E-04 4,00E-01 PCE 1,00E-02 5,40E-01 Tetrachlorethane (TeCA) 6,00E-02 2,00E-01 PCBs NA 2,00E+00
Mercury 3,00E-04 NA
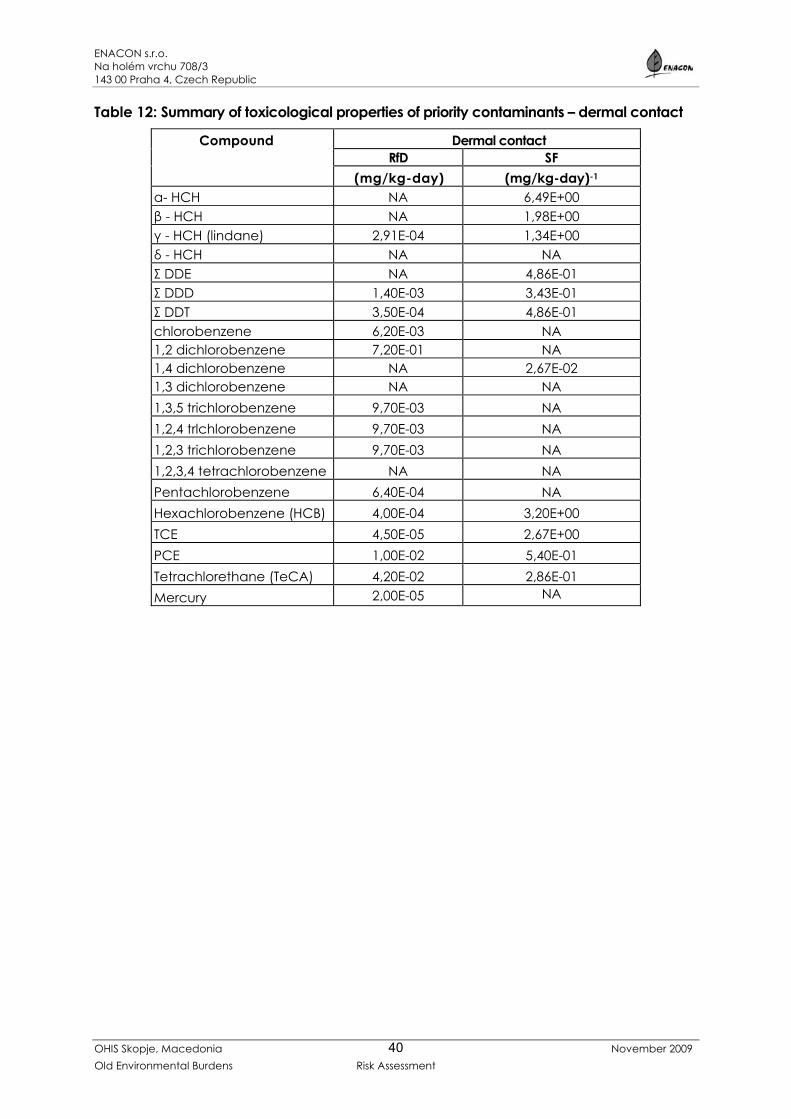
ENACON s.r.o. Na holém vrchu 708/3 143 00 Praha 4, Czech Republic
OHIS Skopje, Macedonia November 2009 Old Environmental Burdens Risk Assessment
40
Table 12: Summary of toxicological properties of priority contaminants – dermal contact
Compound Dermal contact RfD SF (mg/kg-day) (mg/kg-day)-1 α- HCH NA 6,49E+00 β - HCH NA 1,98E+00 γ - HCH (lindane) 2,91E-04 1,34E+00 δ - HCH NA NA Σ DDE NA 4,86E-01 Σ DDD 1,40E-03 3,43E-01 Σ DDT 3,50E-04 4,86E-01 chlorobenzene 6,20E-03 NA 1,2 dichlorobenzene 7,20E-01 NA 1,4 dichlorobenzene NA 2,67E-02 1,3 dichlorobenzene NA NA 1,3,5 trichlorobenzene 9,70E-03 NA 1,2,4 trlchlorobenzene 9,70E-03 NA 1,2,3 trichlorobenzene 9,70E-03 NA 1,2,3,4 tetrachlorobenzene NA NA Pentachlorobenzene 6,40E-04 NA Hexachlorobenzene (HCB) 4,00E-04 3,20E+00 TCE 4,50E-05 2,67E+00 PCE 1,00E-02 5,40E-01 Tetrachlorethane (TeCA) 4,20E-02 2,86E-01 Mercury 2,00E-05 NA
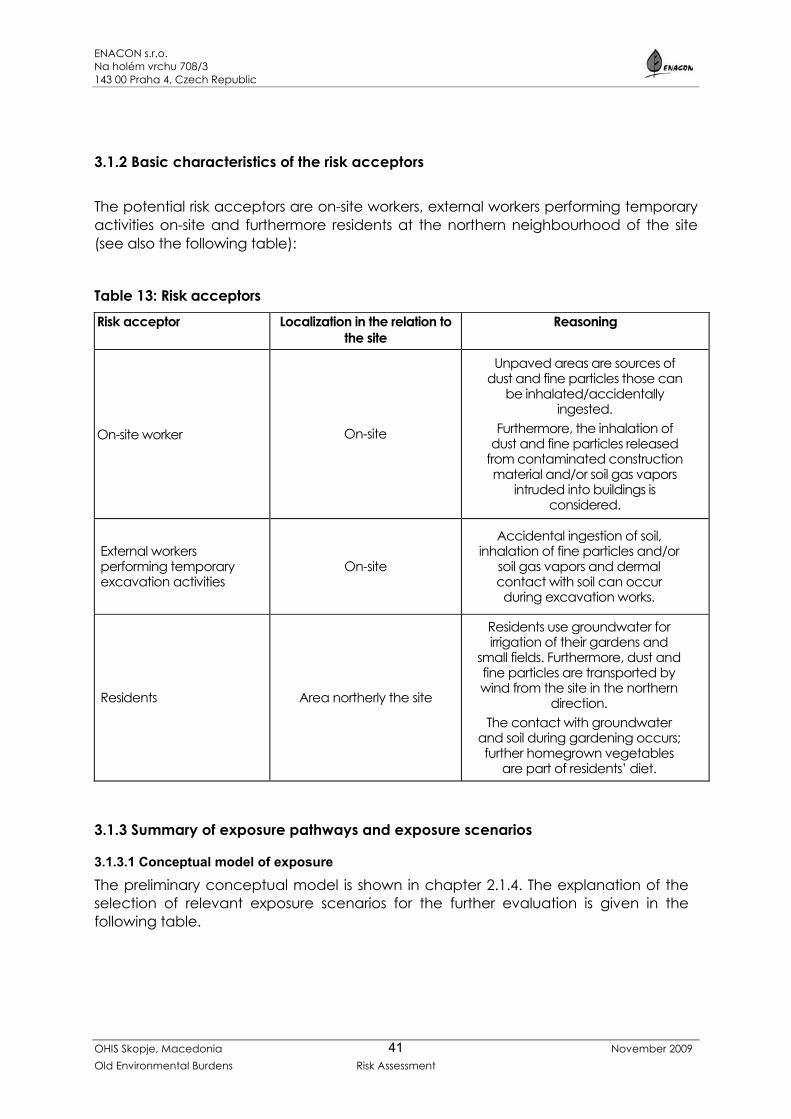
ENACON s.r.o. Na holém vrchu 708/3 143 00 Praha 4, Czech Republic
OHIS Skopje, Macedonia November 2009 Old Environmental Burdens Risk Assessment
41
3.1.2 Basic characteristics of the risk acceptors
The potential risk acceptors are on-site workers, external workers performing temporary activities on-site and furthermore residents at the northern neighbourhood of the site (see also the following table):
Table 13: Risk acceptors Risk acceptor Localization in the relation to
the site Reasoning
On-site worker On-site
Unpaved areas are sources of dust and fine particles those can
be inhalated/accidentally ingested.
Furthermore, the inhalation of dust and fine particles released
from contaminated construction material and/or soil gas vapors
intruded into buildings is considered.
External workers performing temporary excavation activities
On-site
Accidental ingestion of soil, inhalation of fine particles and/or
soil gas vapors and dermal contact with soil can occur during excavation works.
Residents Area northerly the site
Residents use groundwater for irrigation of their gardens and
small fields. Furthermore, dust and fine particles are transported by wind from the site in the northern
direction. The contact with groundwater
and soil during gardening occurs; further homegrown vegetables
are part of residents’ diet.
3.1.3 Summary of exposure pathways and exposure scenarios
3.1.3.1 Conceptual model of exposure
The preliminary conceptual model is shown in chapter 2.1.4. The explanation of the selection of relevant exposure scenarios for the further evaluation is given in the following table.
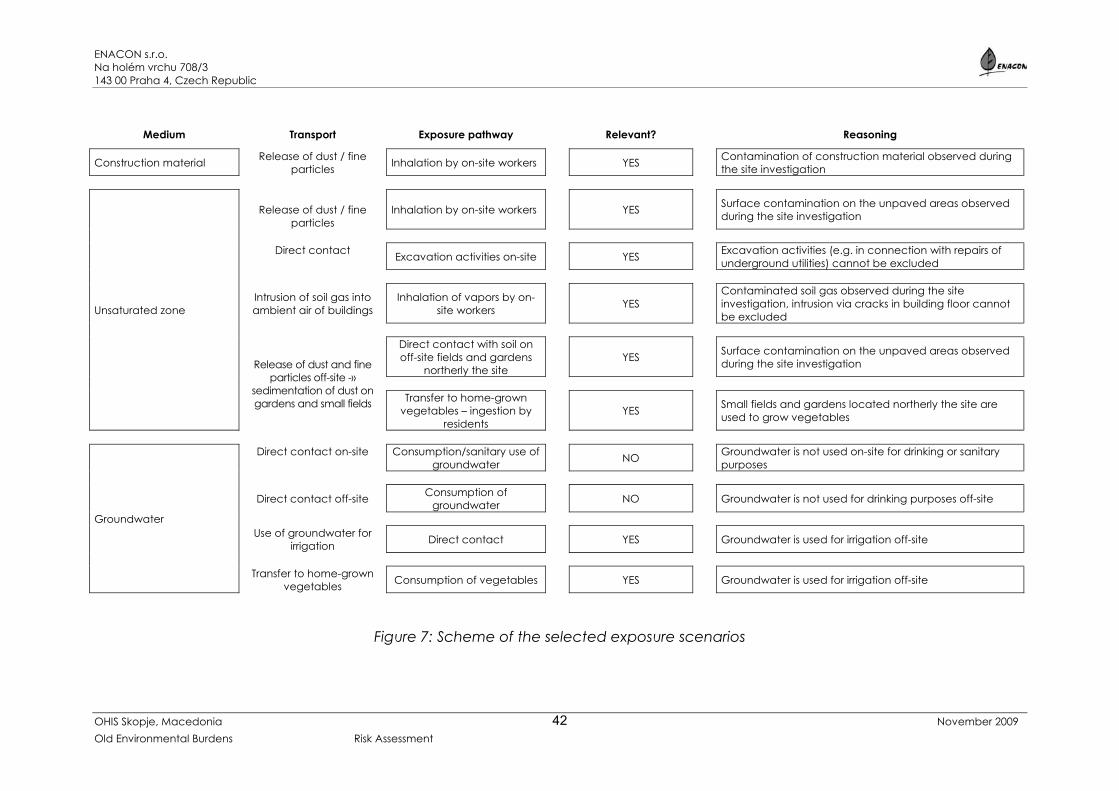
ENACON s.r.o. Na holém vrchu 708/3 143 00 Praha 4, Czech Republic
OHIS Skopje, Macedonia November 2009 Old Environmental Burdens Risk Assessment
42
Medium Transport Exposure pathway Relevant? Reasoning
Construction material Release of dust / fine particles Inhalation by on-site workers YES Contamination of construction material observed during
the site investigation
Unsaturated zone
Release of dust / fine
particles Inhalation by on-site workers YES
Surface contamination on the unpaved areas observed during the site investigation
Direct contact
Excavation activities on-site YES Excavation activities (e.g. in connection with repairs of underground utilities) cannot be excluded
Intrusion of soil gas into ambient air of buildings
Inhalation of vapors by on-site workers YES
Contaminated soil gas observed during the site investigation, intrusion via cracks in building floor cannot be excluded
Release of dust and fine particles off-site -»
sedimentation of dust on gardens and small fields
Direct contact with soil on off-site fields and gardens
northerly the site YES
Surface contamination on the unpaved areas observed during the site investigation
Transfer to home-grown
vegetables – ingestion by residents
YES Small fields and gardens located northerly the site are
used to grow vegetables
Groundwater
Direct contact on-site
Consumption/sanitary use of groundwater NO Groundwater is not used on-site for drinking or sanitary
purposes
Direct contact off-site Consumption of groundwater NO Groundwater is not used for drinking purposes off-site
Use of groundwater for
irrigation Direct contact YES Groundwater is used for irrigation off-site
Transfer to home-grown
vegetables Consumption of vegetables YES Groundwater is used for irrigation off-site
Figure 7: Scheme of the selected exposure scenarios
ENACON s.r.o. Na holém vrchu 708/3 143 00 Praha 4, Czech Republic
OHIS Skopje, Macedonia 43 November 2009 Old Environmental Burdens Risk Assessment
3.1.3.2 Exposure scenarios
The following exposure scenarios are assumed at the site:
1. On-site worker – inhalation of dust and fine particles – the exposure of adult individual of the average lifetime 70 years of 70 kg weight that during his routine walkover the site (unpaved areas at the site – sectors A and B) is assumed. The exposure frequency is 225 days per year for 2 hours daily during the 30 years period. The level of respirable particles (so called PM10 – particles in size of 10 micrometers and less) is assumed to be 110 µg/m3 (based on results of PM10 monitoring in the Gorno Lisice area), assumed fraction of inhalated particles that originates from the contaminated sources is 100 %.
2. On-site worker – inhalation of dust and fine particles released from the contaminated construction material (buildings in sectors A and D) – the exposure of adult individual of the average lifetime 70 years of 70 kg weight that during his daily working activities inside production buildings on-site is assumed. The exposure frequency is 225 days per year for 8 hours daily during the 30 years period. The level of respirable particles (so called PM10 – particles in size of 10 micrometers and less) is assumed to be 110 µg/m3, assumed fraction of inhalated particles that originates from the contaminated sources is 100 %.
3. On-site worker – inhalation of vapors of volatile compounds intruding into production buildings – the exposure of adult individual of the average lifetime 70 years of 70 kg weight that during his daily working activities inside production buildings on-site is assumed. The exposure frequency is 225 days per year for 8 hours daily during the 30 years period.
4. External worker performing temporary excavation activities at the site (sectors A and B with soil contaminated by organic pollutants and sector D with soil containing mercury) – inhalation of dust and fine particles/vapors of volatile compounds present in soil gas, accidental ingestion of soil, dermal contact with soil – the exposure of adult individual of the average lifetime 70 years of 70 kg weight that carries out excavation at the site for 20 days for 8 hours daily. The assumed fraction of inhalated particles originating from the contaminated sources is 100 %, furthermore tenfold dilution of soil gas in the excavation is assumed.
5. Resident – dermal contact with soil during gardening – the exposure of adult individual of lifetime 70 years of 70 kg weight that lives in the nearby residential houses for 30 years is assumed. The exposure frequency is 90 days per year.
6. Resident – use of groundwater for irrigation – the inhalation and dermal exposure of adult individual of average lifetime 70 years of 70 kg weight that uses groundwater for irrigation of gardens and small fields in the nearby residential houses for 30 years is assumed. The exposure frequency is 90 days per year for 2 hours daily.
7. Resident – consumption of home-grown vegetables – the exposure of adult individual of average lifetime 70 years of 70 kg weight that consumes homegrown vegetables (160 foods per year). The assumed fraction of vegetables originating from the contaminated sources is 40 %.
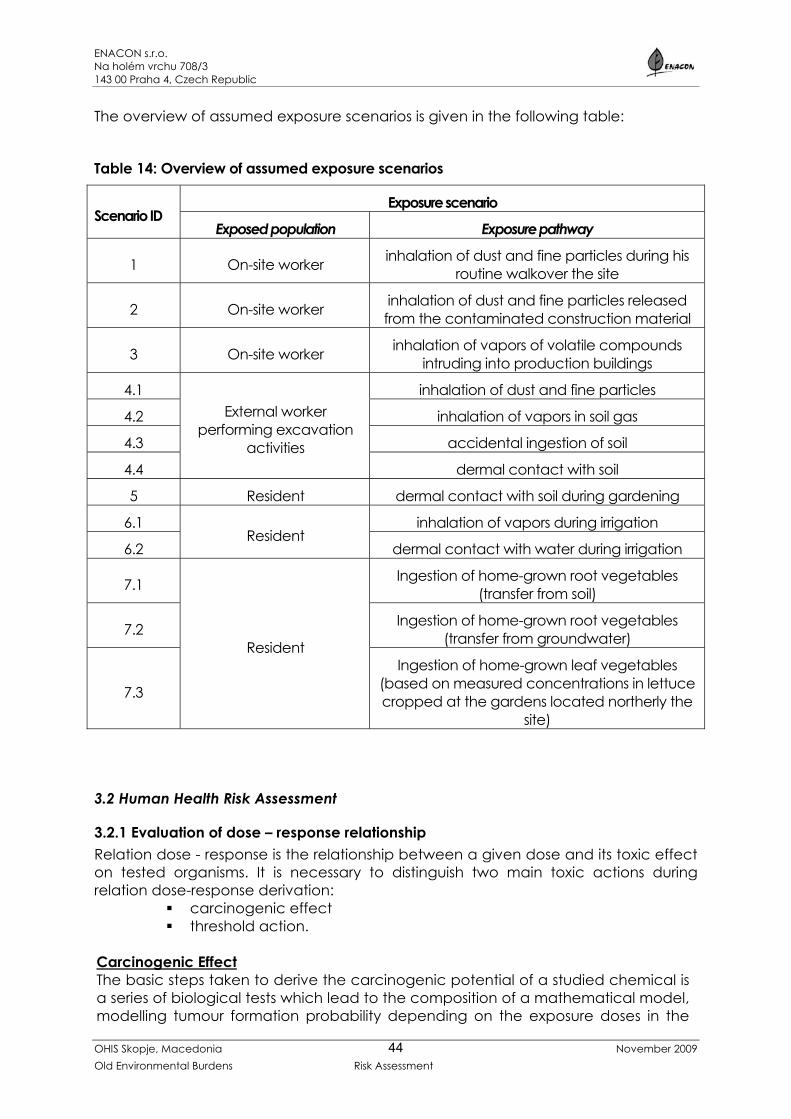
ENACON s.r.o. Na holém vrchu 708/3 143 00 Praha 4, Czech Republic
OHIS Skopje, Macedonia November 2009 Old Environmental Burdens Risk Assessment
44
The overview of assumed exposure scenarios is given in the following table:
Table 14: Overview of assumed exposure scenarios
Scenario ID Exposure scenario
Exposed population Exposure pathway
1 On-site worker inhalation of dust and fine particles during his routine walkover the site
2 On-site worker inhalation of dust and fine particles released from the contaminated construction material
3 On-site worker inhalation of vapors of volatile compounds intruding into production buildings
4.1 External worker
performing excavation activities
inhalation of dust and fine particles
4.2 inhalation of vapors in soil gas
4.3 accidental ingestion of soil
4.4 dermal contact with soil
5 Resident dermal contact with soil during gardening
6.1 Resident
inhalation of vapors during irrigation
6.2 dermal contact with water during irrigation
7.1
Resident
Ingestion of home-grown root vegetables (transfer from soil)
7.2 Ingestion of home-grown root vegetables (transfer from groundwater)
7.3
Ingestion of home-grown leaf vegetables (based on measured concentrations in lettuce cropped at the gardens located northerly the
site)
3.2 Human Health Risk Assessment
3.2.1 Evaluation of dose – response relationship Relation dose - response is the relationship between a given dose and its toxic effect on tested organisms. It is necessary to distinguish two main toxic actions during relation dose-response derivation:
carcinogenic effect threshold action.
Carcinogenic Effect The basic steps taken to derive the carcinogenic potential of a studied chemical is a series of biological tests which lead to the composition of a mathematical model, modelling tumour formation probability depending on the exposure doses in the
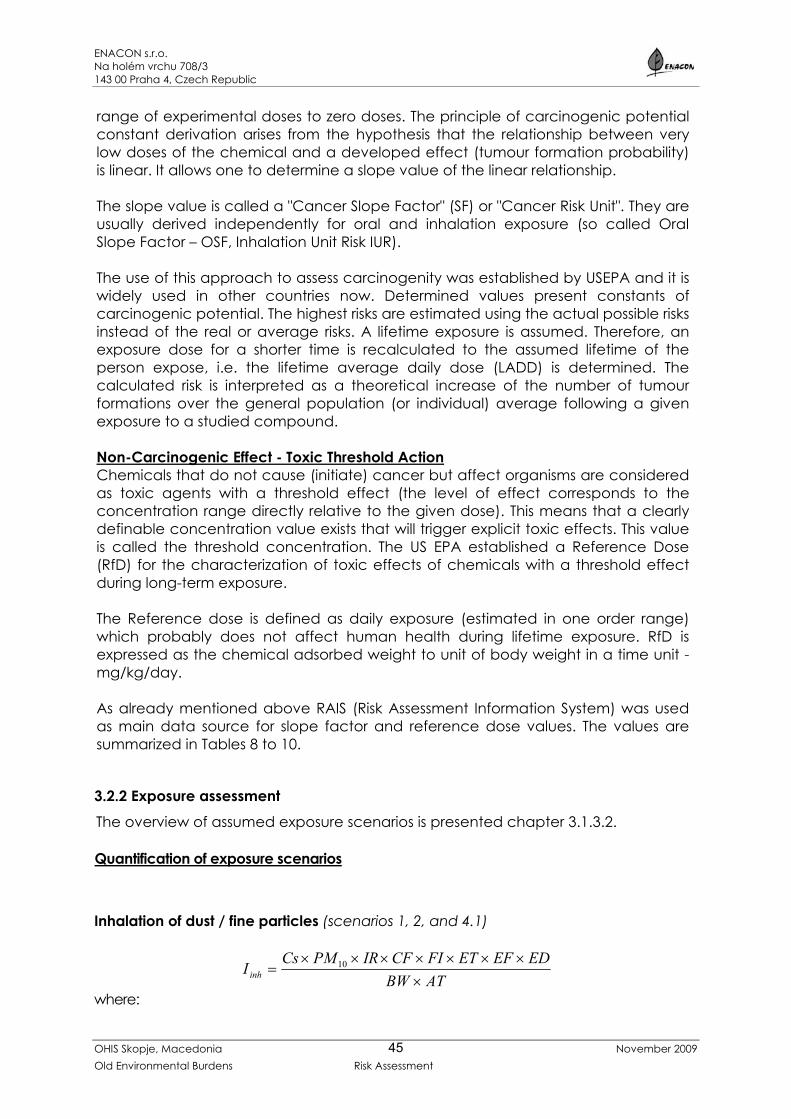
ENACON s.r.o. Na holém vrchu 708/3 143 00 Praha 4, Czech Republic
OHIS Skopje, Macedonia November 2009 Old Environmental Burdens Risk Assessment
45
range of experimental doses to zero doses. The principle of carcinogenic potential constant derivation arises from the hypothesis that the relationship between very low doses of the chemical and a developed effect (tumour formation probability) is linear. It allows one to determine a slope value of the linear relationship. The slope value is called a "Cancer Slope Factor" (SF) or "Cancer Risk Unit". They are usually derived independently for oral and inhalation exposure (so called Oral Slope Factor – OSF, Inhalation Unit Risk IUR). The use of this approach to assess carcinogenity was established by USEPA and it is widely used in other countries now. Determined values present constants of carcinogenic potential. The highest risks are estimated using the actual possible risks instead of the real or average risks. A lifetime exposure is assumed. Therefore, an exposure dose for a shorter time is recalculated to the assumed lifetime of the person expose, i.e. the lifetime average daily dose (LADD) is determined. The calculated risk is interpreted as a theoretical increase of the number of tumour formations over the general population (or individual) average following a given exposure to a studied compound. Non-Carcinogenic Effect - Toxic Threshold Action Chemicals that do not cause (initiate) cancer but affect organisms are considered as toxic agents with a threshold effect (the level of effect corresponds to the concentration range directly relative to the given dose). This means that a clearly definable concentration value exists that will trigger explicit toxic effects. This value is called the threshold concentration. The US EPA established a Reference Dose (RfD) for the characterization of toxic effects of chemicals with a threshold effect during long-term exposure. The Reference dose is defined as daily exposure (estimated in one order range) which probably does not affect human health during lifetime exposure. RfD is expressed as the chemical adsorbed weight to unit of body weight in a time unit - mg/kg/day. As already mentioned above RAIS (Risk Assessment Information System) was used as main data source for slope factor and reference dose values. The values are summarized in Tables 8 to 10.
3.2.2 Exposure assessment The overview of assumed exposure scenarios is presented chapter 3.1.3.2.
Quantification of exposure scenarios
Inhalation of dust / fine particles (scenarios 1, 2, and 4.1)
ATBWEDEFETFICFIRPMCs
Iinh ××××××××
= 10
where:
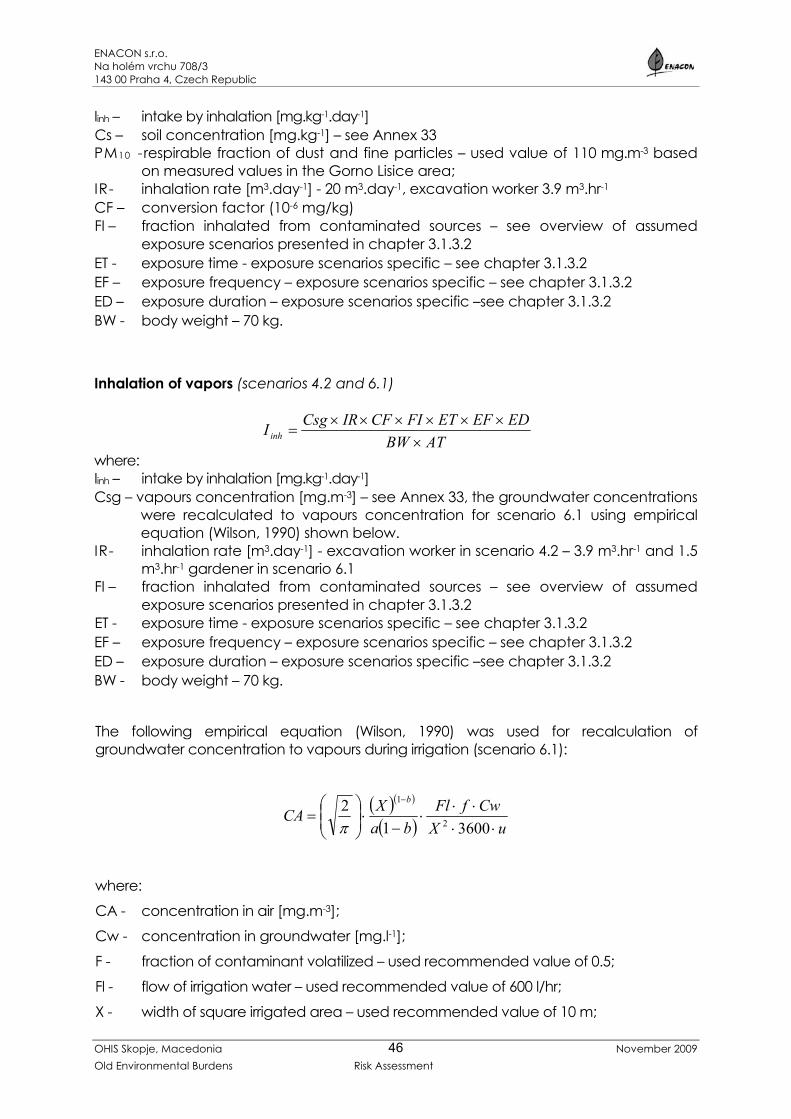
ENACON s.r.o. Na holém vrchu 708/3 143 00 Praha 4, Czech Republic
OHIS Skopje, Macedonia November 2009 Old Environmental Burdens Risk Assessment
46
Iinh – intake by inhalation [mg.kg-1.day-1] Cs – soil concentration [mg.kg-1] – see Annex 33 PM10 -respirable fraction of dust and fine particles – used value of 110 mg.m-3 based
on measured values in the Gorno Lisice area; IR- inhalation rate [m3.day-1] - 20 m3.day-1, excavation worker 3.9 m3.hr-1 CF – conversion factor (10-6 mg/kg) FI – fraction inhalated from contaminated sources – see overview of assumed
exposure scenarios presented in chapter 3.1.3.2 ET - exposure time - exposure scenarios specific – see chapter 3.1.3.2 EF – exposure frequency – exposure scenarios specific – see chapter 3.1.3.2 ED – exposure duration – exposure scenarios specific –see chapter 3.1.3.2 BW - body weight – 70 kg.
Inhalation of vapors (scenarios 4.2 and 6.1)
ATBWEDEFETFICFIRCsgI inh ×
××××××=
where: Iinh – intake by inhalation [mg.kg-1.day-1] Csg – vapours concentration [mg.m-3] – see Annex 33, the groundwater concentrations
were recalculated to vapours concentration for scenario 6.1 using empirical equation (Wilson, 1990) shown below.
IR- inhalation rate [m3.day-1] - excavation worker in scenario 4.2 – 3.9 m3.hr-1 and 1.5 m3.hr-1 gardener in scenario 6.1
FI – fraction inhalated from contaminated sources – see overview of assumed exposure scenarios presented in chapter 3.1.3.2
ET - exposure time - exposure scenarios specific – see chapter 3.1.3.2 EF – exposure frequency – exposure scenarios specific – see chapter 3.1.3.2 ED – exposure duration – exposure scenarios specific –see chapter 3.1.3.2 BW - body weight – 70 kg.
The following empirical equation (Wilson, 1990) was used for recalculation of groundwater concentration to vapours during irrigation (scenario 6.1):
( )( )
( ) uXCwfFl
baXCA
b
⋅⋅⋅⋅
⋅−
⋅
=
−
360012
2
1
π
where:
CA - concentration in air [mg.m-3];
Cw - concentration in groundwater [mg.l-1];
F - fraction of contaminant volatilized – used recommended value of 0.5;
Fl - flow of irrigation water – used recommended value of 600 l/hr;
X - width of square irrigated area – used recommended value of 10 m;
ENACON s.r.o. Na holém vrchu 708/3 143 00 Praha 4, Czech Republic
OHIS Skopje, Macedonia November 2009 Old Environmental Burdens Risk Assessment
47
a - stability constant – used recommended value of 0.15;
b – stability constant – used recommended value of 0.75;
u – near surface wind velocity – used value of 2.6 m/s (average velocity of the most frequent western winds in the Gorno Lisice area).
Intrusion of vapours into buildings (scenario 3) In respect to the fact that chlorinated aliphatic hydrocarbons, namely TCE and PCE, and mercury were found in soil gas, the evaluation of subsurface vapour intrusion into production buildings was performed. Volatilization of contaminants located in subsurface soils or in groundwater, and the subsequent mass transport of these vapours into indoor spaces via cracks in basement or constructed slab-on-grade constitutes a potential inhalation exposure pathway. Evaluation of the human risk associated with the subsurface vapour intrusion into buildings was performed using Vapor Intrusion Model by USEPA (2004) free available on http://www.epa.gov/oswer/riskassessment/airmodel/johnson_ettinger.htm. This model is un update (version 3.1) of original Johnson and Ettinger model (1991). Model couples a transport model (one-dimensional analytical solution to both convective and diffusive transport mechanisms) and calculation of risk for humans inside the buildings via inhalation pathway. Model enables to specify the strata between the level of soil gas measurement (200 cm in case of chlorinated hydrocarbons and 60 cm in case of mercury) and bottom of a building. The soil profile at the site can be characterized as clayey loam. The values for the required strata-specific properties as total porosity, soil dry bulk density, and soil-water-filled porosity were used from a model database for defined soil type. The transport mechanisms depend on the other several parameters which includes for example: thickness of floor slab, soil-building pressure differential, floor-wall seam crack width, indoor air exchange rate etc. These values were not fully available thus model default values were used for calculations. Model sets its default values for the single story family house to sustain a conservative approach. On-site worker can be potentially exposed via inhalation of vapours that could migrate into production buildings, i.e. the used value of exposure frequency is 225 days per year for 8 hours daily during the 30 years period. Scenario 3 (subsurface vapour intrusion into buildings) could not be assessed for mercury due to lack of data on mercury concentration in soil gas.
Dermal contact with soil (scenarios 4.4 and 5)
ATBWEDEFABSAFSACFCsIderm ×
××××××=
where:
ENACON s.r.o. Na holém vrchu 708/3 143 00 Praha 4, Czech Republic
OHIS Skopje, Macedonia November 2009 Old Environmental Burdens Risk Assessment
48
Iderm – absorbed dose [mg.kg-1.day-1] Cs – soil concentration [mg.kg-1] – see Annex 33 SA – skin area – assuming that hands can be exposed to the dermal contact (adult
male 0,082 m2 according to US EPA (1989) AF – soil-to-skin adherence factor [mg.cm-2], for clayey loam 1,45 mg/cm2 (US EPA,
1989,1988) ABS – absorption factor, compound specific – see Annex 33 EF – exposure frequency – exposure scenarios specific – see overview of assumed
exposure scenarios presented in chapter 3.1.3.2. ED – exposure duration – exposure scenarios specific –see chapter 3.1.3.2. CF – conversion factor (10-6 mg/kg) BW - body weight –70 kg AT – averaging time – period over which exposure is averaged (in days), for non-
carcinogenic effects AT = ED (year) x 365 days; for carcinogenic effects AT = 70 years (lifetime) x 365 days.
Dermal contact with water (scenario 6.2)
ATBWEDEFETKSACFCw
I pderm ×
××××××=
where:
Iderm – absorbed dose [mg.kg-1.day-1] Cw – groundwater concentration [mg.l-1] – see Annex 33 SA – skin area – assuming that hands can be exposed to the dermal contact (adult
male 0,082 m2 according to US EPA (1989) Kp – skin permeability coefficient – compound specific – see Annex 33 ET - exposure time - exposure scenarios specific – see overview of assumed
exposure scenarios presented in chapter 3.1.3.2. EF – exposure frequency – exposure scenarios specific – see chapter 3.1.3.2. ED – exposure duration – exposure scenarios specific –see chapter 3.1.3.2. CF – conversion factor (10-3 l/cm3) BW - body weight – 70 kg AT – averaging time – period over which exposure is averaged (in days), for non-
carcinogenic effects AT = ED (year) x 365 days; for carcinogenic effects AT = 70 years (lifetime) x 365 days.
Oral ingestion (scenarios 4.3, 7.1, 7.2, and 7.3)
ATBWEDEFGIFICFIRCsIing ×
××××××=
ENACON s.r.o. Na holém vrchu 708/3 143 00 Praha 4, Czech Republic
OHIS Skopje, Macedonia November 2009 Old Environmental Burdens Risk Assessment
49
where:
ling – intake by oral ingestion [mg.kg-1.day-1] Cs – concentration in ingested media (soil, vegetable – the empirical equations for
recalculation of concentration in root vegetables after transfer from soil and groundwater are shown below - [mg.kg-1] – see Annex 33
IR – ingestion rate [mg.day-1 or mg.food-1] – accidental ingestion of soil 100 mg/day, consumption of homegrown vegetables 200 mg/food
CF – conversion factor (10-6 mg/kg) FI – fraction ingested from contaminated sources – see overview of exposure
scenarios GI – gastrointestinal factor – compound specific – see Annex 33 EF – exposure frequency – exposure scenarios specific – see overview of assumed
exposure scenarios presented in chapter 3.1.3.2. ED – exposure duration – exposure scenarios specific – see chapter 3.1.3.2. BW - body weight – 70 kg AT – averaging time – period over which exposure is averaged (in days), for non-
carcinogenic effects AT = ED (year) x 365 days; for carcinogenic effects AT = 70 years (lifetime) x 365 days.
AT – averaging time – period over which exposure is averaged (in days), for non-carcinogenic effects AT = ED (year) x 365 days; for carcinogenic effects AT = 70 years (lifetime) x 365 days.
The following empirical equations (USEPA 1986) were used for recalculation of cross-media transfer between groundwater/soil and homegrown root vegetables: Transfer from soil
CsRCFsCr ×= where: Cr - chemical concentration in root RCFs - root concentration factor Cs - chemical concentration in soil
( ) ( ) 52.1log77.082.0log −×=−×× owococ KfKRCFs
where: KOC - organic carbon-water partitioning coefficient fOC - organic carbon content in soil (used value of 5 % in soil in gardens) KOW – octanol-water partitioning coefficient Transfer from groundwater
CwRCFwCr ×= where: Cr - chemical concentration in root RCFw root concentration factor
ENACON s.r.o. Na holém vrchu 708/3 143 00 Praha 4, Czech Republic
OHIS Skopje, Macedonia November 2009 Old Environmental Burdens Risk Assessment
50
Cw - chemical concentration in water
( ) ( ) 52.1log77.082.0log −×=− owKRCFw
where: KOW – octanol-water partitioning coefficient Estimate of chronic daily intake (ADD – average daily doses for non-carcinogenic risk evaluation and LADD - lifetime average daily dose for carcinogenic risk evaluation) for assumed exposure scenarios is presented in tables of Annex 33.
3.2.3 Risk characterization This section characterizes the potential non-carcinogenic and carcinogenic risks for the exposure scenarios at the site. The potential health effects are characterized separately for non-carcinogenic and carcinogenic endpoints. Non-carcinogenic Risk Characterization Non-carcinogenic risk is derived by dividing the estimated average daily dose (i.e., ADDs) of a non-carcinogen by its reference dose (RfD). The ratio ADD / RfD is called a hazard quotient. The RfD is defined as the maximum daily dose of a substance to which one can be exposed for a lifetime without the potential occurrence of non-carcinogenic effects. It is generally derived by establishing the dose that results in no effect for the most sensitive endpoint in the most sensitive species tested. The hazard quotients for all the compounds of interest found in the completed exposure pathway (i.e., air or groundwater) are summed to form an HI score for that pathway. Since it is unlikely that an individual would be subjected to cumulative exposure from all pathways at the maximum level and that all contaminants would act on the same target organ(s) in an additive fashion, this characterization of non-cancer risks is highly conservative. As such, HI scores at or below 1 are considered de minimis regulatory risks and such exposures can be reasonably assumed not to pose a health concern. In addition, HI scores of 1 or greater are an indication of concern but are not necessarily an indication of a serious health risk since both the ADD and RfD represent conservative values. HI greater than 1 in a risk assessment suggest the need for a more rigorous evaluation of the exposure estimates and toxicity values to assess whether there may be a true health concern. Carcinogenic Risk Characterization The theoretical cancer risk associated with exposure to compounds identified as carcinogens is calculated by multiplying the conservatively estimated lifetime average daily dose (i.e., LADD) by a cancer slope factor. The cancer slope factor is derived by extrapolating the results of a high dose study to the low dose range that
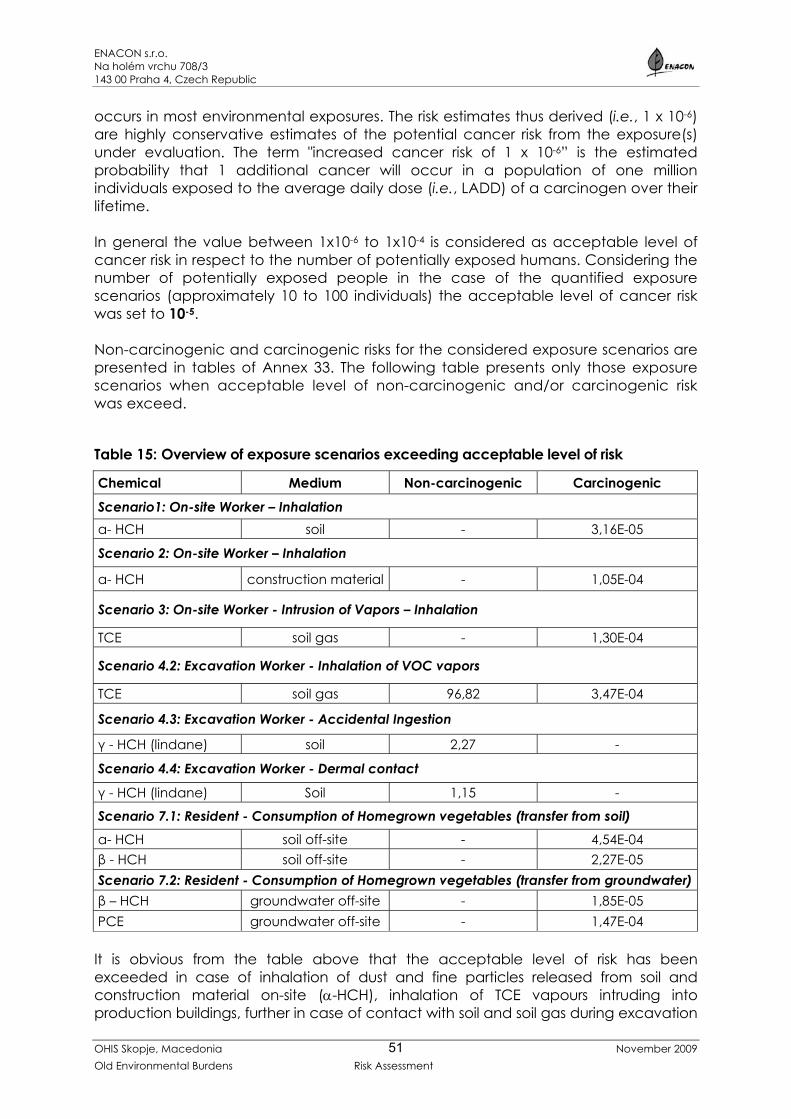
ENACON s.r.o. Na holém vrchu 708/3 143 00 Praha 4, Czech Republic
OHIS Skopje, Macedonia November 2009 Old Environmental Burdens Risk Assessment
51
occurs in most environmental exposures. The risk estimates thus derived (i.e., 1 x 10⁻⁶) are highly conservative estimates of the potential cancer risk from the exposure(s) under evaluation. The term "increased cancer risk of 1 x 10⁻⁶” is the estimated probability that 1 additional cancer will occur in a population of one million individuals exposed to the average daily dose (i.e., LADD) of a carcinogen over their lifetime. In general the value between 1x10⁻⁶ to 1x10⁻⁴ is considered as acceptable level of cancer risk in respect to the number of potentially exposed humans. Considering the number of potentially exposed people in the case of the quantified exposure scenarios (approximately 10 to 100 individuals) the acceptable level of cancer risk was set to 10-5. Non-carcinogenic and carcinogenic risks for the considered exposure scenarios are presented in tables of Annex 33. The following table presents only those exposure scenarios when acceptable level of non-carcinogenic and/or carcinogenic risk was exceed.
Table 15: Overview of exposure scenarios exceeding acceptable level of risk
Chemical Medium Non-carcinogenic Carcinogenic
Scenario1: On-site Worker – Inhalation α- HCH soil - 3,16E-05
Scenario 2: On-site Worker – Inhalation
α- HCH construction material - 1,05E-04
Scenario 3: On-site Worker - Intrusion of Vapors – Inhalation
TCE soil gas - 1,30E-04
Scenario 4.2: Excavation Worker - Inhalation of VOC vapors
TCE soil gas 96,82 3,47E-04
Scenario 4.3: Excavation Worker - Accidental Ingestion
γ - HCH (lindane) soil 2,27 -
Scenario 4.4: Excavation Worker - Dermal contact
γ - HCH (lindane) Soil 1,15 -
Scenario 7.1: Resident - Consumption of Homegrown vegetables (transfer from soil) α- HCH soil off-site - 4,54E-04 β - HCH soil off-site - 2,27E-05 Scenario 7.2: Resident - Consumption of Homegrown vegetables (transfer from groundwater) β – HCH groundwater off-site - 1,85E-05 PCE groundwater off-site - 1,47E-04 It is obvious from the table above that the acceptable level of risk has been exceeded in case of inhalation of dust and fine particles released from soil and construction material on-site (α-HCH), inhalation of TCE vapours intruding into production buildings, further in case of contact with soil and soil gas during excavation
ENACON s.r.o. Na holém vrchu 708/3 143 00 Praha 4, Czech Republic
OHIS Skopje, Macedonia November 2009 Old Environmental Burdens Risk Assessment
52
activities on-site and in case of consumption of homegrown root vegetables due to transfer of α-, and β-HCH from soil and of β-HCH and PCE from groundwater used for irrigation. In the case of other identified priority contaminants the level of risk has been assessed as acceptable.
The presented risk assessment is limited by the following facts, assumptions and considerations:
• The use of the empirical equations and the values based on the professional judgment;
• Unavailability of certain toxicological data for some priority contaminants;
• Absence of data on concentration of mercury in soil gas.
3.3 Assessment of Environmental Risk The Vardar river, the Markova Reka river and the Colemni Kamenj are the only potential environmental receptors of the identified subsurface impact. Due to higher surface water level in comparison to groundwater level the Markova Reka river and the Colemni Kamenj these surface water bodies do not drain contaminated groundwater. The Vardar river is at present hydraulically “protected” by active abstraction well Lisice 2 that intercepts impacted groundwater. Even in the case that the Lisice 3 well is not pumped dilution factor is such that natural drainage of impacted groundwater does not significantly affect the Vardar surface water quality. In sum, the impact of the aquatic ecosystem in the surroundings of the OHIS plant caused by identified contamination sources is considered as negligible.
3.4 Summary of Total Risks Unacceptable human health risk was identified with regards to:
• Outdoor and indoor inhalation of α-HCH contaminated dust particles by on-site worker;
• Indoor inhalation of VOC (TCE) vapours by on-site worker; • Outdoor inhalation of VOC (TCE) vapours by excavation worker; • Accidental ingestion of γ-HCH contaminated soil by excavation
worker; • Dermal contact of excavation worker with γ-HCH contaminated soil; • Ingestion of root vegetables grown on α-HCH and β-HCH
contaminated topsoil off-site and irrigated by groundwater contaminated by β-HCH and PCE.
The risk for human health on acceptable level was found by the quantification of exposure scenarios for remaining selected priority contaminants. Environmental risks were not identified.
ENACON s.r.o. Na holém vrchu 708/3 143 00 Praha 4, Czech Republic
OHIS Skopje, Macedonia November 2009 Old Environmental Burdens Risk Assessment
53
4. Proposal of Corrective Measures
4.1 Proposal of Target Concentrations for Corrective Measures The target concentrations were proposed by backward calculations of contaminant concentrations that yield in acceptable level of carcinogenic and/or non-carcinogenic risk for respective exposure scenario. Target concentration for TCE was not derived from the exposure scenario of inhalation of VOC vapours by on-site worker as due to following reasons:
• limited area of contaminated soil gas by TCE – thus “excavation” scenario is considered as very rare;
• exposure can be eliminated by usage of personal protective equipment; • contaminated soil gas should be treated anyway, target limit for TCE in soil gas
is derived from another exposure scenario.
Despite the fact that risk assessment did not identified unacceptable risk with regards to inhalation of mercury vapours, due to high uncertainty related to low ambient temperature during mercurometry measurements a preliminary rule of thumb target concentration was proposed. As Dutch Intervention Values were derived considering all exposure routes being active, which is unlikely for the industrial site, target concentration was proposed to be 5 times higher than the Dutch Intervention Value for mercury in soil.
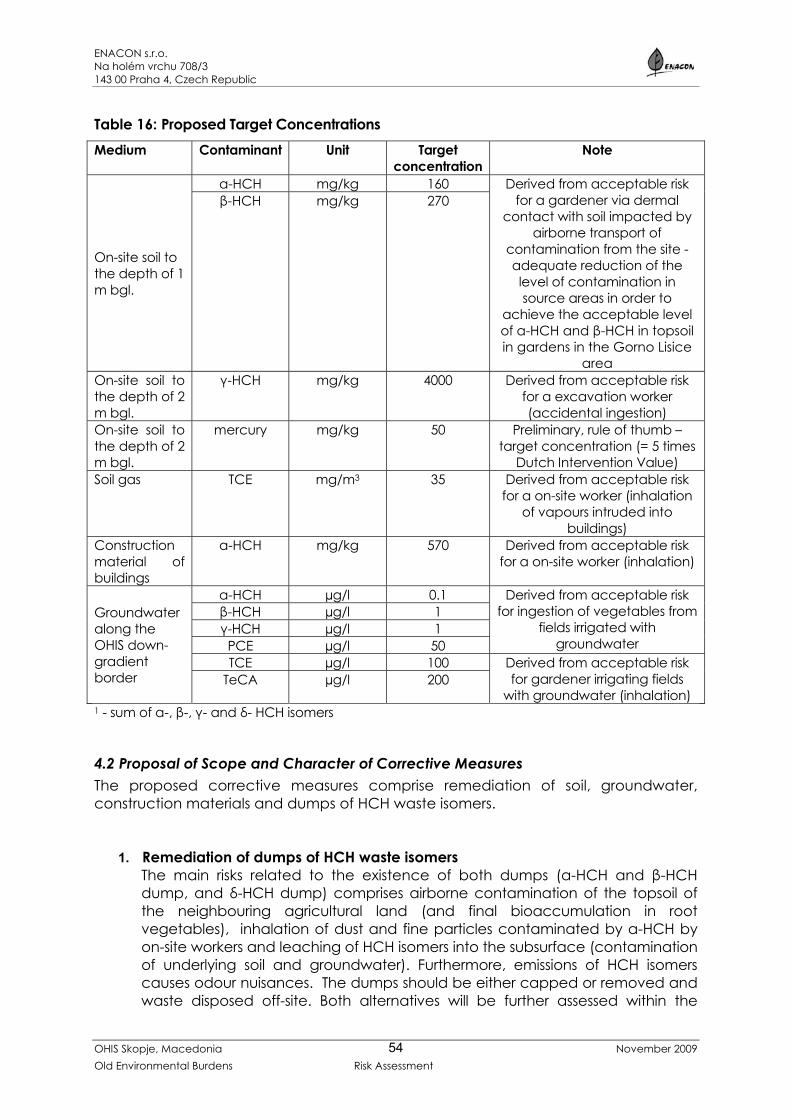
ENACON s.r.o. Na holém vrchu 708/3 143 00 Praha 4, Czech Republic
OHIS Skopje, Macedonia November 2009 Old Environmental Burdens Risk Assessment
54
Table 16: Proposed Target Concentrations Medium Contaminant Unit Target
concentration Note
On-site soil to the depth of 1 m bgl.
α-HCH mg/kg 160 Derived from acceptable risk for a gardener via dermal
contact with soil impacted by airborne transport of
contamination from the site - adequate reduction of the level of contamination in source areas in order to
achieve the acceptable level of α-HCH and β-HCH in topsoil in gardens in the Gorno Lisice
area
β-HCH mg/kg 270
On-site soil to the depth of 2 m bgl.
γ-HCH mg/kg 4000 Derived from acceptable risk for a excavation worker (accidental ingestion)
On-site soil to the depth of 2 m bgl.
mercury mg/kg 50 Preliminary, rule of thumb – target concentration (= 5 times
Dutch Intervention Value) Soil gas TCE mg/m3 35 Derived from acceptable risk
for a on-site worker (inhalation of vapours intruded into
buildings) Construction material of buildings
α-HCH mg/kg 570 Derived from acceptable risk for a on-site worker (inhalation)
Groundwater along the OHIS down-gradient border
α-HCH µg/l 0.1 Derived from acceptable risk for ingestion of vegetables from
fields irrigated with groundwater
β-HCH µg/l 1 γ-HCH µg/l 1 PCE µg/l 50 TCE µg/l 100 Derived from acceptable risk
for gardener irrigating fields with groundwater (inhalation)
TeCA µg/l 200
1 - sum of α-, β-, γ- and δ- HCH isomers
4.2 Proposal of Scope and Character of Corrective Measures The proposed corrective measures comprise remediation of soil, groundwater, construction materials and dumps of HCH waste isomers.
1. Remediation of dumps of HCH waste isomers The main risks related to the existence of both dumps (α-HCH and β-HCH dump, and δ-HCH dump) comprises airborne contamination of the topsoil of the neighbouring agricultural land (and final bioaccumulation in root vegetables), inhalation of dust and fine particles contaminated by α-HCH by on-site workers and leaching of HCH isomers into the subsurface (contamination of underlying soil and groundwater). Furthermore, emissions of HCH isomers causes odour nuisances. The dumps should be either capped or removed and waste disposed off-site. Both alternatives will be further assessed within the
ENACON s.r.o. Na holém vrchu 708/3 143 00 Praha 4, Czech Republic
OHIS Skopje, Macedonia November 2009 Old Environmental Burdens Risk Assessment
55
scope of feasibility study. Surface areas, total volumes of each dumps as well as volumes of deposited waste are given in Tables 4 and 5.
2. Remediation of contaminated soil Superficial soil (to the depth of 1 m bgl.) contaminated by α-, and β- isomers of HCH in unpaved areas can cause unacceptable risks related to airborne contamination of the topsoil of the neighbouring agricultural land (and final bioaccumulation in root vegetables). The unacceptable risk is also related to the inhalation of α-HCH contaminated dust and fine particles by on-site workers. Similarly to dumps of HCH waste isomers, HCH isomers can leach from highly contaminated superficial soil layers further downwards and impact underlying soil and groundwater. Odour nuisances cannot be also neglected. The extend of superficial soil contaminated above the proposed target concentration of α-HCH and β-HCH is limited to the unpaved areas located in close surroundings of the δ- HCH dump. However, if both dumps will be removed (and disposed off-site) portion of underlying soil contaminated above the target concentration will have to be treated as well. Soil contaminated by γ-HCH above the derived target concentration can cause unacceptable risk for excavation worker. Similarly to superficial soil contaminated by α-HCH and β-HCH, soil with γ-HCH content exceeding the target concentration is located in close surroundings of the δ- HCH dump and can be expected also under this dump. No soil contaminated by γ-HCH above the proposed target concentration was found underneath the α-HCH and β-HCH dump. Areas of soil contaminated by HCH isomers are displayed in Annex 35. In sum, approximately 2300 m3 of superficial soil should be remediated under and in close surroundings of the δ- HCH dump and another approximately 1500 m3 of contaminated soil underlying the dump of α-HCH and β-HCH. These figures must be considered as rough estimates, lateral extent of soil/soil gas contaminated above the target limit should be further assessed within the scope of remedial investigation. Another unacceptable risk resulted from the assessment of inhalation of TCE vapours migrating into buildings from the underlying contaminated soil. Remediation of unsaturated zone containing TCE in soil gas above the target concentration refers to the area under the former monochloracetic acid production building and its close surroundings, see Annex 35. The planar area of this contaminated unsaturated zone is approximately 3000 m2. Risks related to inhalation of mercury vapours were found acceptable, however, due to high uncertainty related to low ambient temperature during mercurometry measurements it is recommended to remediate soil contaminated by mercury above preliminarily proposed target concentration. Such impacted soil is located under the footprint of the former electrolysis plant and in the area westerly this plant. Assuming depth of 2 m, total volume of mercury-contaminated soil to be remediated is approximately 3500 m3.
ENACON s.r.o. Na holém vrchu 708/3 143 00 Praha 4, Czech Republic
OHIS Skopje, Macedonia November 2009 Old Environmental Burdens Risk Assessment
56
Similarly to the remediation of HCH waste isomers dumps, candidate soil treatment options (in-situ, on-site and off-site) will be discussed and assessed within the scope of the feasibility study.
3. Remediation of contaminated groundwater Unacceptable risk related to contaminated groundwater was identified considering present use (irrigation) of groundwater downgradient the site. Target concentrations were derived by backward calculations for HCH isomers, TCE, PCE and 1,1,2,2 TeCA in groundwater “leaving” the site (along the down-gradient site boundary). I It is assumed that removal of primary and secondary contamination sources of chlorinated pesticides will results to gradual degrease of their concentration in groundwater. Nevertheless, temporary containment/treatment contaminated groundwater along downgradient border of the site is recommended. Due to physical-chemical properties of CHC it is recommended to treat in addition also the source (saturated) zone in the area of the former monochloracetic acid production building and its eastern surroundings.
4. Remediation of construction materials
The risk assessment resulted to unacceptable risk for on-site worker working in buildings A1 (former storage of HCH and TCB production building) and A3 (former lindane production building) due to inhalation of dust and fine particles contaminated by α-HCH. Nevertheless, both buildings are not used at present (i.e. no receptor of the exposure) similarly to most of the buildings at the site. As these buildings were designed and constructed with the specific purpose (especially former production buildings), their future use is very problematic (also due to their technical state) and thus their demolition and proper disposal of the originated construction waste is recommended. In general, construction materials of the investigated buildings does not meet the EU limits defined for inert waste based on the results of water leachate tests. Some construction materials even do not meet limits for hazardous waste due to high content of mercury or DOC. Demolition practices and waste management, incl. estimates of generated waste will be discussed in the feasibility study.
5. Regular monitoring of groundwater quality It is recommended to perform regular monitoring of groundwater in selected wells in order to detect any potential change of groundwater quality at the site as well as off-site. The set of monitoring wells should comprise all existing on-site monitoring wells as well as selected domestic wells and (with lower frequency) the OHIS abstraction wells Lisice 1 and Lisice 2 located downgradient the site. The monitoring campaigns should be performed on a biannual basis.
ENACON s.r.o. Na holém vrchu 708/3 143 00 Praha 4, Czech Republic
OHIS Skopje, Macedonia November 2009 Old Environmental Burdens Risk Assessment
57
5. Conclusions and Recommendations The objective of the risk assessment was to evaluate potential risks for human health and the environment posed by past impact of site operations to soil, groundwater construction materials and by existence of dumpsites of waste isomers of hexachlorocyclohexane (HCH) at the OHIS site. 1. Results of the site investigation can be summarized as follows:
• Soil of the superficial layer (to the depth of 1 m bgl) is impacted by HCH isomers in most of the assessed area of the OHIS property. The highest concentrations of HCH were found under and next to both dumps of waste isomers where sum HCH concentrations exceed Dutch Intervention Limit more than 100 times. Soil contamination by HCH isomers sharply ceases with depth. Nevertheless, under the both HCH dumps, in the vicinity of the δ-HCH dump and sporadically also in other locations HCH concentrations are still high exceeding the Dutch Intervention Limit by more than one order even in the deepest sampled interval (4.6 – 4.8 m bgl.) The topsoil of the agricultural land some 100 m to the north of the site found sum HCH concentration slightly exceeding the Dutch Intervention Value. In one of three samples analysed for dioxins content the concentration exceeded Dutch Indicative Level for Serious Contamination. Extent of soil contamination by DDE, DDD and DDT and its intensity is significantly lower compare to HCH and is limited to the superficial layer in sector A only. Contamination of soil by chlorobenzenes in the superficial layer as well as in the depth interval 1.4 – 1.9 m bgl. was found only locally. Of monitored metals elevated contents of mercury in sector D (former electrolysis plant) was only encountered. Mercury contaminated soil was found under the floor of the electrolysis building as well as outside the building. Generally, Hg concentration increases with depth in most of the borings of this sector. Maximal mercury content in soil exceeded the Dutch Intervention Limit 98 times.
• Analyses of soil gas samples found elevated contents of trichloroethene (TCE) and tetrachlorethene (PCE). In sector C (production of monochloracetic acid). Maximal TCE concentration was 2940 mg/m3 in the area of former above-ground tanks for this semiproduct. Elevated concentrations of Hg in soil gas were detected in most of borings within the former electrolysis plant and its close surroundings with observed general decrease of concentration with depth. Higher Hg concentration in soil gas were measured along the north-western side of the building of the former electrolysis plant. Maximal concentration of Hg in soil gas 44.3 µg/m3 in a superficial layer (0.6 m bgl) next to the settling sump.
• Laboratory analyses of sediment of the on-site sewer found elevated
concentrations of HCH exceeding the Dutch Intervention Limit 1.9 times and residues of other chlorinated pesticides such as endusulfan, DDE, DDD and DDT. Mercury was found in the sample in concentration of 1.66 mg/kg.
ENACON s.r.o. Na holém vrchu 708/3 143 00 Praha 4, Czech Republic
OHIS Skopje, Macedonia November 2009 Old Environmental Burdens Risk Assessment
58
• The sample of street sweepings collected on paved road east of the
electrolysis plant contained elevated concentration of HCH, insignificantly exceeding the Dutch Intervention Value.
• Analyses of both samples of waste disposed in the α-HCH and β-HCH dump
found almost pure α-HCH. The waste was disposed in this dump on natural ground without any protection. Thickness of waste (of white colour and pasty consistency) varies from 3.2 to 4.6 m. Waste isomers are overlain by a layer of humous loam and sandy clay of the thickness of 0.5 up to 1.6 m (1 m in average). The content of HCH in the soil cover of the dump exceeded the Dutch Intervention Value 450 times (one sample analysed). Surveying of the dump resulted in total volume of 20 200 m3 and volume of HCH waste of 15 000 m3. Assuming α-HCH density of 1.87 g/cm3 it gives 28 100 t of HCH waste.
• The δ-HCH dump consists of 5 concrete basins however the waste was
dumped also beyond the perimeter of the basins. Content of δ-HCH dump is rather heterogeneous. The δ-HCH waste was encountered only on the bottom of south-eastern concrete basins. The average thickness of the δ-HCH waste is 1.65 m. Based on analysis of the δ-HCH waste contains 16% of α-HCH, 1% of β-HCH, 44% of γ-HCH and 39% of δ-HCH. The δ-HCH waste is overlain by sandy and clayey layers with various content of individual HCH isomers. The uppermost layer comprise humous loam 0.4 to 0.6 m thick. On the bottom of the northwestern concrete basins δ-HCH waste was not found and the waste is loamy containing mostly α-HCH isomer (81% to 93%). Based on the surveying, the total dump volume is 2 630 m3 and volume of δ-HCH waste is approximately 620 m3 (590 t), remaining 2 010 m3 comprise dumped contaminated soil and other waste (prevailing α-HCH).
• Two main pollutant groups were found in groundwater – HCH and chlorinated
aliphatic hydrocarbons (CHC). Maximal HCH concentrations in groundwater exceeding Dutch Intervention Limit 141 times and 86 times, respectively were found in September 2009 next to probable source of contamination - lindane production and storage blds. and the dump of α-HCH and β-HCH. Contamination plume migrates in direction of groundwater flow to the east towards domestic well DW-6, where the sum HCH concentration also exceeded the Dutch Intervention Value (3.5 times). Hotspot of groundwater contamination by CHC was discovered at the eastern edge of the former monochloracetic acid production facility. Comparing concentrations of individual CHC with respective Dutch Intervention Values, in the very hotspot, the Dutch Intervention Value was exceeded 2.3 times for TCE and 7 times for PCE. Of all sampled downgradient domestic wells, the Dutch Intervention Value for PCE was exceeded 6 times in well DW-6. No Intervention value is defined for 1,1,2,2 TeCA that dominates there. Local groundwater contamination by mercury in the vicinity of the former electrolysis plant, by trichlorobenzene near the former lindane production plant was found, exceeding respective Dutch Intervention Values 20 times and 70 times, respectively. In groundwater taken from well MW-3 for laboratory testing of candidate remedial method, high content of 1,1,4,4 –tetrachloro 1,3 –
ENACON s.r.o. Na holém vrchu 708/3 143 00 Praha 4, Czech Republic
OHIS Skopje, Macedonia November 2009 Old Environmental Burdens Risk Assessment
59
butadiene was identified by a gas chromatograph in order of magnitude of hundreds of µg/l. Origin of this constituent was not discovered.
• Analyses of samples of construction material found elevated HCH
concentration (above 1 mg/kg) in all analyzed samples of sector A (production of pesticides). Extremely high content of HCH isomers (above 1000 mg/kg) were identified in inner mortar and masonry of building A-1 (former storage of HCH and production of TCB) and in the concrete floor of building A-2 (production of lindane). In floor of buildings A-6 (production of pesticides), A-8 (production of granulated organophosphates), A-7 (storage of pesticides) and A-10 (storage of granulated pesticides) high content of DDE, DDD and DDT (in order of units of mg/kg) were also found. Extreme concentration of fonofos exceeding 1000 mg/kg was found in the concrete floor of the storage of granulated pesticides (building A-10). Extreme contents of mercury (hundreds up to thousands of mg/kg) were found in a mortar, masonry as well as in concrete constructions of the former electrolysis building (bld. D-1). Selected samples of construction material passed water leachate tests and results of analyses of construction material were compared with the EU limits defined for inert waste, nonhazardous waste and hazardous waste landfills. None analyzed sample complied with the limit for inert waste. None of five analysed samples taken in the electrolysis building complied with limits for hazardous waste due to mercury content, One of two samples taken in the building of former monochloracetic acid production (bld. C-1) did not meet the limit for hazardous waste due to high content of copper, mercury and nickel. Two of nine samples taken in buildings of sector A (production of pesticides) did not comply with the limits for hazardous waste due to high content of DOC.
• Results of laboratory analyses of vegetables (lettuce, potatoes, celery) were
compared with maximum residue level (MRL) of pesticides defined by Regulation (EC) No 396/2005. Default MRL of 10 µg/kg for individual pesticide was not exceeded in any sample of lettuce and potatoes, however was exceeded by β-HCH in the celery (25 µg/kg). Some residues of PCB in the range of tenths of µg/kg were found in samples of lettuce (under detection limits in potatoes and celery). Lettuce was analysed also for the content of mercury and was under the detection limit.
2. Results of the assessment of migration of contaminants can be summarized as
follows: • Low-permeable soil layer overlying the aquifer serves as protective layer,
nevertheless is not sufficient with regards to amounts of contaminants leaching from above ground contamination sources. Based on the mathematical modelling of contaminant transport approximately 30 kg/year of HCH isomers, 30 kg/year of PCE and 90 kg/year of TeCA seep through the unsaturated zone to groundwater. Of other contaminants mercury and trichlorobenzene were found locally in groundwater in elevated concentrations and thus their mobility and leaked amounts have overcome the retention capacity of the unsaturated zone, however not to large extent.
• Velocities of migration of main pollutants in groundwater (HCH isomers, PCE and TeCA) were estimated considering advection and sorption. HCH isomers migrates in groundwater by velocity of approximately 0.08 to 0.9 m/day (30 to
ENACON s.r.o. Na holém vrchu 708/3 143 00 Praha 4, Czech Republic
OHIS Skopje, Macedonia November 2009 Old Environmental Burdens Risk Assessment
60
330 m/year). Velocity of PCE and TeCA is approximately 0.2 to 2.4 m/day (70 to 900 m/year). Higher migration velocities refer to the surroundings of abstraction wells Lisice 1 and Lisice 2, where low concentrations of chlorinated aliphatic hydrocarbons were detected only. Based o calibrated mathematical model HCH - contaminated groundwater spread some 1.4 km downgradient (to the south-eastern part of Gorno Lisice) from the source within approximately 40 years. CHC are substantially more mobile pollutants. After approximately 40 – year duration of the source the edge of the PCE and TeCA model plumes is about 2.0 km to the east to northeast from the contamination source area and were attracted by the Lisice 1 and Lisice 2 abstraction wells. Thus, based on these model results, trace concentrations of CHC found in groundwater of the Lisice 2 well and especially in groundwater of the Lisice 1 well have very likely origin in the OHIS plant.
• Based on the mathematical model, as long as the Lisice 2 abstraction well is active, it will act as a interceptor of the CHC contaminant plume migrating from the OHIS plant. Even in the case of termination of groundwater abstraction from the Lisice 2 well, the impact of surface water quality by discharge of contaminated groundwater into the Vardar river will be negligible due to the high dilution factor. According to the model results the Markova river does not drain groundwater (groundwater level is below the surface water level) thus cannot be affected either.
• Natural attenuation processes are not very likely of such significance that would prevent further migration of groundwater contamination by CHC and HCH off-site. Sorption is the main process that prevent significant spread of HCH contamination in groundwater (in comparison to CHC). However sorption retards the migration rather than decrease the total content of the contaminant.
3. Quantitative assessment of human health risk identified potential human health
risk with regards to following exposure scenarios: • Outdoor and indoor inhalation of α-HCH contaminated dust particles by on-
site worker; • Indoor inhalation of VOC (TCE) vapours by on-site worker; • Outdoor inhalation of VOC (TCE) vapours by excavation worker; • Accidental ingestion of γ-HCH contaminated soil by excavation worker; • Dermal contact excavation worker with γ-HCH contaminated soil; • Ingestion of root vegetables grown on α-HCH and β-HCH contaminated
topsoil off-site and/or irrigated with groundwater contaminated by β-HCH and PCE.
4. The target concentrations were proposed for respective contaminated media
(soil, soil gas, groundwater) that yield in acceptable level of risk for human health.
5. Scope and character of corrective measures were proposed for soil, groundwater, construction materials and dumps of HCH waste isomers.
Prague, November 13, 2009
ENACON s.r.o. Na holém vrchu 708/3 143 00 Praha 4, Czech Republic
OHIS Skopje, Macedonia November 2009 Old Environmental Burdens Risk Assessment
61
Literature: EPTISA (2007): Development of Remediation Plans with Financial Requirements for
Elimination of Industrial Hotspots – Europaid/123674/D/SER/MK. Feasibility Study – Volume I – OHIS Plant.
Howard et al (1991): Handbook of Environmental Degradation Rates Lewis Publishers.
Kidd, H. and James, D. R., Eds. (1991): The Agrochemicals Handbook, Third Edition. Royal Society of Chemistry Information Services, Cambridge, UK, 1991.
USEPA (1986): Methods of Assessing Exposure to Chemical Substances. Vol 8: Methods for Assessing Environmental Pathways of Food Contamination. EPA 560/5-85-008. September 1986.
USEPA (1988): Estimating Toxicity of Industrial Chemicals to Aquatic Organisms Using Structure Activity Relationship. EPA/560/6-88-001.
USEPA, (1989): U.S. Environmental Protection Agency: Risk Assessment Guidance for Superfund, Volume 1. Human Health Evaluation Manual (Part A), Interim Final. Office of Emergency and Remedial Response, Washington, DC. EPA/540/1-89/002.
USEPA, (1995): U.S. Environmental Protection Agency: Exposure Factor Handbook. Office of Health and Environmental Assessment, Washington, D.C. May.
USEPA, (2000): User’s Guide for the Johnson and Ettinger (1991) Model for Subsurface Vapor Intrusion into Buildings (Revised). USEPA, PN 050240.0004.
Wilson, R. (1990): Simple Area Source Algorithm for Risk Assessment Screening. Memorandum to P. Cirone, USEPA Health and Environmental Assessment Section, March 1990.


![THE FORMER YUGOSLAV REPUBLIC OF MACEDONIA ...Macedonia. Migration Flows in Modern Macedonia. Skopje. 14 Malgorzata Markiewicz [2006]: Migration and Remittances in Macedonia. Center](https://img.pdfslide.us/doc/110x75/5fa5020ac1ba4c3ab23aefc2/the-former-yugoslav-republic-of-macedonia-macedonia-migration-flows-in-modern.jpg)