Embed Size (px)
Citation preview
Laundry System Analysis
IOE 48112/16/98
Project Members:John DowneyJulian Wong
Laundry System AnalysisFinal Report P. 1
Introduction and Background
Approach and Methodology
Current Situation
Alternatives
Simulation
Findings and Conclusions
Recommendations
Limitations
Action Plan
Appendices
Laundry System AnalysisFinal Report P. 2
The purpose of this project is to gain a global understanding of the laundry
system at The University of Michigan Hospital and to eventually find a remedy
to the existing problem. The problem is that at certain times during the week
the inventory levels of linen get extremely low because there are only five days of
laundry cleaning for seven days of service. The underlying purpose of this project is to
find a way to keep inventory levels of linen substantial at all times in every department.
Our goal is to propose recommendations to improve customer satisfaction. These
recommendations should minimize cost and maximize service to the customer, which of
course is the hospital and all of its departments. Some of these recommendations may
include acquiring more linen and equipment, rescheduling of distribution times,
suggesting a new sequence of processes, and/or rescheduling workers (specifically those
in material service and housekeeping).
To gain an understanding of the problem, the background and environment
affecting the project must be discussed. There are multiple departments that work
together in making the laundry system work. In the past, the clean laundry would come
into the hospital and get loaded onto the bulk carts. The bulk carts contained all types of
linens such as towels, scrubs, gowns, and other various pieces. These bulk carts were
then circulated throughout the hospital to different departments by material services,
where each department took what was needed to refill their supply. Once the carts were
empty, they were taken back down by material services to get refilled. This was called
“The Exchange Cart System”. It proved to be inefficient and the system needed a
change. This system has changed and there is now a distribution center utilized inside the
hospital. This new system is called “The Bulk Delivery System”. The clean incoming
laundry is taken to the distribution center and distributed into bins organized by the bulk
distribution people. The internal distribution then fills delivery carts according to the
departments’ needs and takes them to the designated department. All deliveries are
scheduled. This system has proven to be more efficient that “The Exchange Cart
System”.
Laundry System AnalysisFinal Report P. 3
PROJECT PLAN
There are multiple departments that are being dealt with. To begin with, every
department uses laundry, so all are involved. The departments that deal with taking care
of and distributing the laundry are Material Services, the actual Laundry Center that
cleans the laundry, and house keeping. The Laundry Center and house keeping fall under
the Environmental Department. Other operating entities that are involved are the internal
distribution, receiving, bulk disthbution, and transportation services.
There are multiple key issues affecting the project. One of the issues affecting the
project is the fact that every Monday morning inventory levels are extremely low, in
addition to some other times throughout the week. Another issue is that the laundry
cleaning system currently does not operate during weekends.
SCOPE OF PROJECT
There are many important issues included in the project that must be taken into
account for project. Some of these important issues are the timeliness of the project,
sequence of processes, laundry production, bulk distribution, internal distribution,
collection and transport, rescheduling and restaffing of distribution, how the departments
work together, end user issues, and receiving.
There are multiple issues that will be excluded from this project. Some of the
excluded issues are the study and calculation of par levels and inventory levels, the
different range of products, whether there is the correct type of product or not, advice or
direction on how to manage the system, and the soiled collection subsection of the
system.
In this project, we have used several approaches.
Interviews -
First, we have conducted interviews with Thomas Peterson, our client manager, who has
guided and supported us with needed information on our project. During the interview,
Tom Peterson gave us a brief introduction of the whole laundry system within the
Laundry System AnalysisFinal Report P. 4
University Campus explaining to us who and what is involved, and what is the current
problem with the system. After the first meeting, we also scheduled multiple meetings
with Tom to report findings, ask further questions, and report our progress on project.
Tour
A tour of the entire laundry system was conducted where Tom Peterson walked us
through the entire process early in October. We began our tour at the loading docks in
the hospital where the clean linens come in. We then went on to see the internal
distribution in the bulk laundry room where the clean laundry was sorted and put onto
push carts. The amount of laundry put on each cart was determined by the current need
of each department. These carts were then circulated throughout the hospital to their pre
determined destinations. Once the carts arrived at their destinations, the proper amount
of linen was deposited. Once the carts were empty, they were sent back down to the bulk
distribution room to get refilled. The soiled linens get collected by house keeping and are
put into blue push bins that get sent down to the truck docks en route to the laundry
facility on North Campus. The next part of our tour was visiting the laundry production
facility to get an understanding of how the laundry was actually cleaned. This is a part of
the process that we will not be concentrating on. After this tour, we were able to better
understand how the entire laundry system worked.
Data Collection
Since one of our approaches is Simulation, we need to collect data in order to build our
simulation model. First, we asked Tom Peterson about data that were needed and he
supported us with as much relevant data that he had concerning our needs. He supplied
us with laundry production reports, profile counts, bulk distribution reports, shortage
reports, and distribution staff schedules. Also, we asked some of the staff from internal
distribution to supply us with past demand data per department. The raw data that we
actually collected by ourselves was the time data. The time data that we collected
includes internal distribution fill time, actual delivery time, restock time (per department)
and anything else that may have happened once they material services left the bulk
Laundry System AnalysisFinal Report P. 5
distribution room. This time data was collected using stopwatches. The next couple of
paragraphs get into our data collection in more detail.
The demand of linens varies according to patient arrivals at the usage locations.
Since different units/departments have their own policy on how to use the clean linens, it
is difficult to approximate it into a mathematical data. After we collected Tom Peterson’s
expert opinion, we tried to model location usage time as an exponential distribution since
patient or customer always comes along with this kind of distribution.
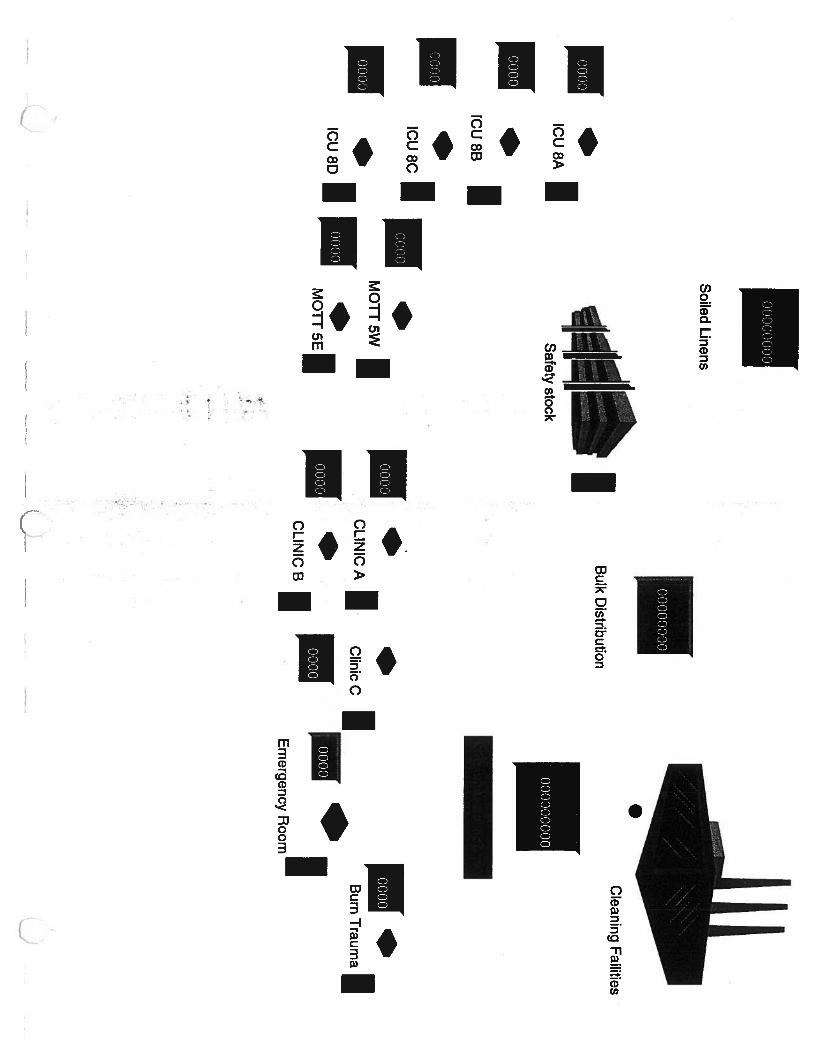
The type and number of departments/units that can represent the whole hospital
system are listed here. Since there are many departments/units in the hospital, Tom
Peterson recommended the following 11 departments that will best represent the hospital
system as a whole: Mott 5 East, Mott 5 West, Clinic A, Clinic B, Clinic C, ICU 8A, ICU
8B, ICU 8C, ICU 8D, Burn Trauma, and Emergency Room.
The following set of data is that which we collected at the hospital manually: The
travel times of the linens between the distribution center and departments/units of the
hospital are outlined here. Travel time includes the time linen take to be delivered to
each unit and the time linens take to be unloaded at each unit. We collected the data by
following the hospital employees with their linen cart and timing how long it takes to
make deliveries from the distribution center to their respective units. We also timed how
long the employees took to unload the linens. In addition, we took the time for employees
to return to the distribution center from their respective units. We collected 10 sets of data
in one week and we took the average between this data to be the estimated arrival time.
We also learned that before employees deliver the linens to the different
departments, each employee checks the inventory level of linens of their respective
departments. This is done every Monday through Sunday, once per day in the morning.
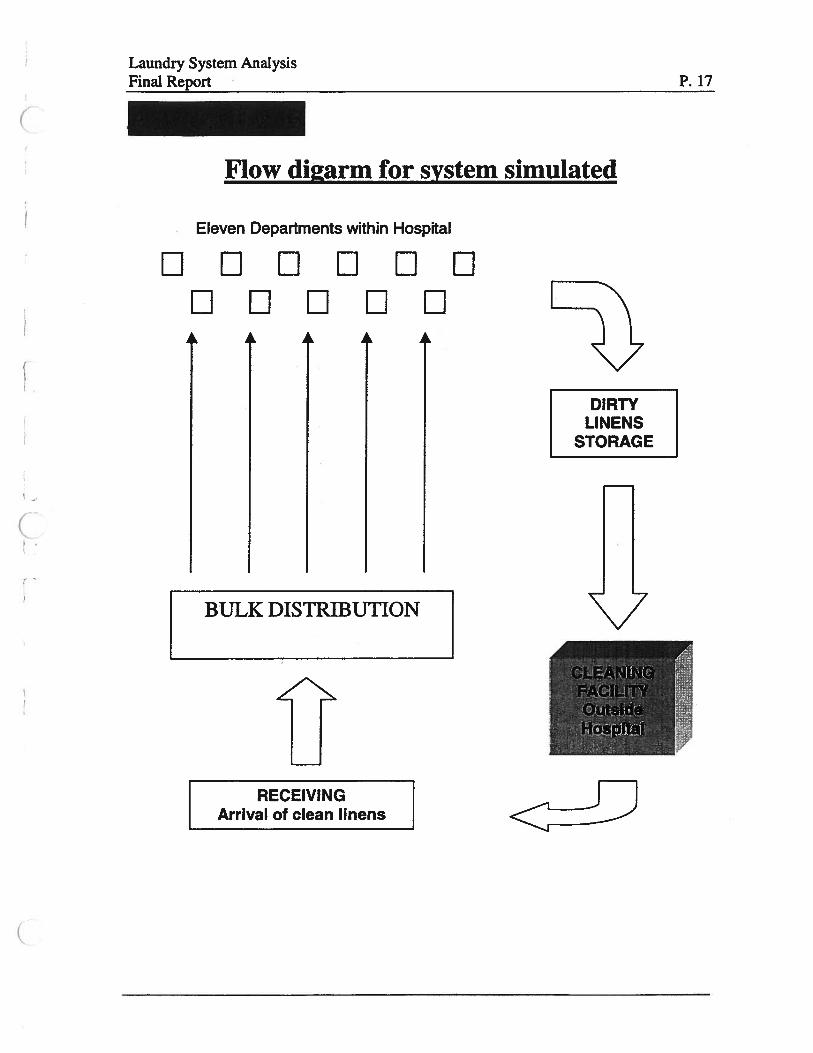
Simulation
One of the approaches that we used is a simulation of the process. A simulation model
randomly reflects a given scenario, that “model”, or scenario being the laundry system in
this case. We have tried to simulate the entire laundry system as accurately as possible
within the confines of one semester. With an accurate simulation of the current process,
countermeasures were tested to see what the best solution to the problem was. A flow
Laundry System AnalysisFinal Report P. 6
diagram of the laundry system has been included in appendix B. This part of the project
took the most time because we thed to best model the situation within the confines of the
simulation software, being ProModel 4.0. Building a simulation required us to identify
exactly what the problem is, collect all of the needed data, build the actual model,
accurately represent the current situation, and implement proposed countermeasures. In
order to simulate the process, many different types of accurate data were required. For
example, we needed time data (further defined later), staff schedules, meetings with
different departments, demand data, and a very thorough understanding of the entire
process. Every department will be involved, especially distribution (bulk and internal),
material services, and laundry production.
Assumptions & justifications:
• Assumption: Eleven different departments can represent the whole hospital system.
Justification: We assumed that the eleven different departments would best represent
the hospital system because our contact, Tom Peterson, informed us that those units
represent the highest, middle and lowest demand of linens within the hospital system.
• Assumption: The efficiency of cleaning facility does not affect the scheduling of
deliveries to the distribution center.
Justification: We assumed that the efficiency of the cleaning facility does not affect
the delivery schedule to the distribution center because the hospital demands that the
cleaning facility must make those deliveries on time. In addition, our contact
informed us that the cleaning facility has not failed to make those deliveries even if
the facility suffers a “setback”.
• Assumption: One entity will represent the most demanded linen.
Justfication: We assumed that an entity would represent the most demanded linen
because it is too difficult and too complicated to capture all the different types of
linen being used by the hospital.
• Assumption: “Black-boxing” the laundry facility outside the hospital is feasible.
Justification: We assumed that “black-boxing” the cleaning facility is feasible
because our main parameter of interest is the distribution of linens within the hospital
system.
Laundry System AnalysisFinal Report P. 7
Assumption: The availability of laundry bins/carts is not constrained.
Justfication: We assumed that the availability of the laundry bins/carts is not
constrained because there are always plenty of bins/carts available when personnel
deliver the linens.
The final model:
Our model simulates the hospital laundry system, which is divided into four major
parts: the cleaning facility, the bulk distribution center, the different departments/units,
and the collection of soiled linen. Each part has its own location and sub-location parts.
We are now going to describe each part in detail.
Cleaning Facility
The cleaning facility only consists of one location and is named cleaning facility in our
model. The cleaning facility is linked between the bulk distribution center and the soiled
linen collection. The main task of the cleaning facility is to clean all soiled linen
delivered from the hospital.
Bulk Distribution
When the linen arrives at the bulk distribution center, the linen is distributed. An entity
called checker is an entity whose responsibility is to send information on the amount of
linens that the entire department needs. This entity will first check that amount at each
department and then send the information to the distribution center. This checking
process is scheduled periodically once a day. The linen at the bulk distribution receives a
signal and the linen is routed to the different departments within the hospital. The moving
time of linen is different from each department. This moving time includes the loading
time of soiled linen onto the trucks as they are leaving the distribution center.
Different Departments
We modeled 11 departments to represent the hospital system. Each department consists
of two locations. One location represents the inventory and the second one represents the
usage of linen. An entity called patient goes to the usage location to request a linen entity.
After using the linen, the patient leaves the system and the soiled linen remains in the
usage location to wait until it is routed to the soiled linen collection. Inventory in each
Laundry System AnalysisFinal Report P. 8
department decrease and at a scheduled time period, the checker sends the request
information to the bulk distribution in order to replenish the inventory again.
Soiled Linen Collection
Soiled linen collection is the location where soiled linen is collected. Solid linen is
transported to the cleaning facility by trucks.
The problem that frequently occurs within the laundry system is that the levels of
linen get severely depleted or certain linens stock out before the material services
department restocks. Many times, the demand for clean linens is higher than the clean
inventory level in the bulk distribution room. That means the remaining inventory levels
of some of the linens are equal to zero, which constitutes stock outs. Monday mornings
typically have the lowest levels of inventory. Often, departments cannot get restocked
for a period of time because, there was no laundry production over the weekends. It takes
time on Monday morning for the clean laundry to hit the Hospital too. If the demand
during the weekends is especially high, the inventory of clean linens on Monday morning
is almost sure to be very low along with multiple stock outs.
Due to this situation, the patients and doctors may only receive a clean set
of linens or clothing over a period of one to three days, patients may have to dry off with
sheets instead of towels, and multiple sets of soiled linens may have to get reused. This
is a serious issue because soiled clothing has potential health threats to the patients (and
doctors) and law suits are just waiting to happen.
Since the hospital has not employed any measures to currently solve this problem,
we are trying to find some immediate solutions to temporarily remedy the problem. We
will call any immediate solutions, “short term solutions”, and then we will move on and
recommend what the “long term gradual solution” will be.
Short-term solutionsi
Laundry System AnalysisFinal Report P. 9
Safety Stock
The idea of safety stock is retrieved from the concept of inventory control. It is a
backup supply that is used to fulfill the extra demand of a product. In this project,
we treat linens as the product and the departments and patients are the customers.
Since it is very difficult to forecast the extra demand, safety stock can be
functioned as a back-up supplier when the inventory level of the linen is low.
Therefore, a safety stock in the laundry system should be accessed by material
services only when inventory levels in the bulk distribution room are low.
Share system
Another alternative is the implementation of a “share system”. Such a system
would allow departments in need to share inventory from other departments that
have sufficient levels. A system such as this would be set up in a simple manner
where the departments in need would just put in a call to material services, and
material services would do the deliveries between the departments. We will go
into greater detail later about how to implement such a system in the action plan.
This is the idea of the share system.
Long term solution
Adjusting the par level
The par level is a predetermined amount of linen. After a restocking, the level of
linens in any given department should equal the par level. Occasionally, certain
types of linens stock out due to the fact that the par levels for some departments
are too low. If the par level of one type of linen is lower than the demand for that
linen, this linen will easily stock out. Moreover, if the par level of one type of
linen is more than the demand, this linen will be over stocked at most times.
Therefore, adjusting the par level after studying which linens usually stock out, or
are usually overstocked, can solve the long-term problem of the linen shortages.
Laundry System AnalysisFinal Report P. 10
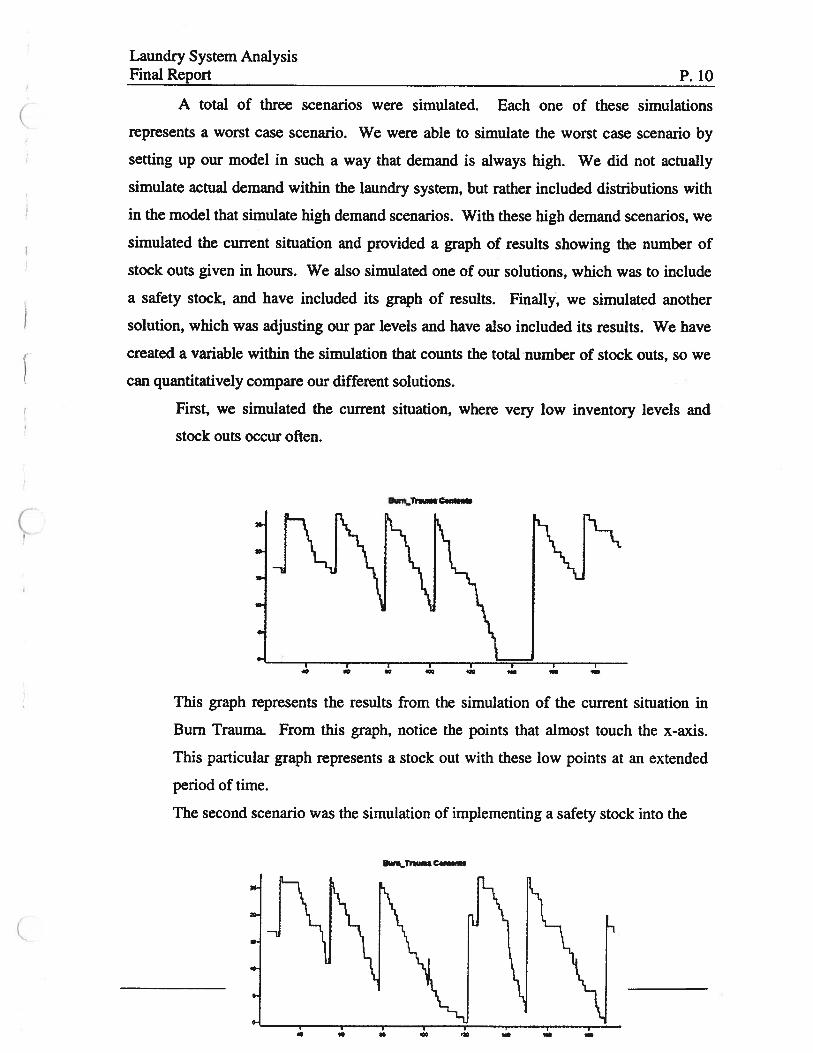
A total of three scenarios were simulated. Each one of these simulations
represents a worst case scenario. We were able to simulate the worst case scenario by
setting up our model in such a way that demand is always high. We did not actually
simulate actual demand within the laundry system, but rather included distributions with
in the model that simulate high demand scenarios. With these high demand scenarios, we
simulated the current situation and provided a graph of results showing the number of
stock outs given in hours. We also simulated one of our solutions, which was to include
a safety stock, and have included its graph of results. Finally, we simulated another
solution, which was adjusting our par levels and have also included its results. We have
created a variable within the simulation that counts the total -number of stock outs, so we
can quantitatively compare our different solutions.
First, we simulated the current situation, where very low inventory levels and
stock outs occur often.
This graph represents the results from the simulation of the current situation in
Bum Trauma. From this graph, notice the points that almost touch the x-axis.
This particular graph represents a stock out with these low points at an extended
period of time.
The second scenario was the simulation of implementing a safety stock into the
C.et.ib
Uflkjt1UmI Caøi
Laundry System AnalysisFinal Report P. 11
system.
This graph represents the simulation of implementing a safety stock in Burn
Trauma. Notice that the low points on the graph representing low inventory
situations have quickly jumped back up to a level of increased inventory instead
of remaining stocked out. This means that implementing such a system (safety
stock) will reduce the chances and effects of stock outs.
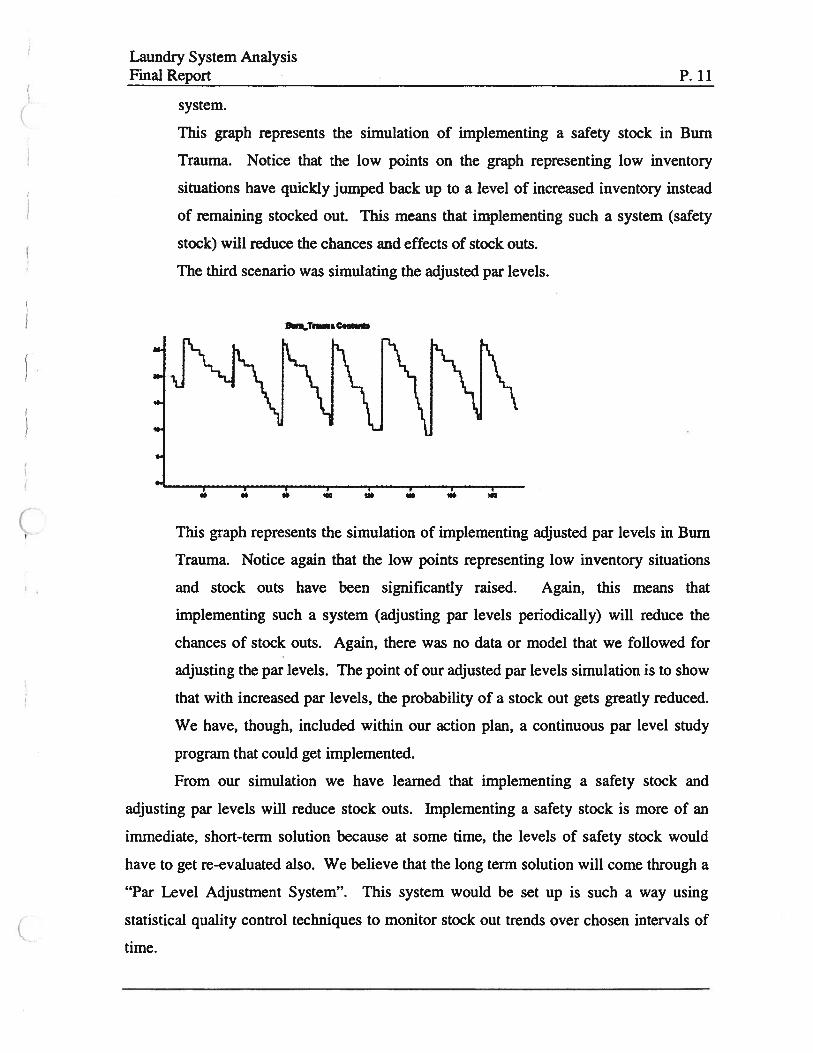
The third scenario was simulating the adjusted par levels.
This graph represents the simulation of implementing adjusted par levels in Bum
Trauma. Notice again that the low points representing low inventory situations
and stock outs have been significantly raised. Again, this means that
implementing such a system (adjusting par levels periodically) will reduce the
chances of stock outs. Again, there was no data or model that we followed for
adjusting the par levels. The point of our adjusted par levels simulation is to show
that with increased par levels, the probability of a stock out gets greatly reduced.
We have, though, included within our action plan, a continuous par level study
program that could get implemented.
From our simulation we have learned that implementing a safety stock and
adjusting par levels will reduce stock outs. Implementing a safety stock is more of an
immediate, short-term solution because at some time, the levels of safety stock would
have to get re-evaluated also. We believe that the long term solution will come through a
“Par Level Adjustment System”. This system would be set up is such a way using
statistical quality control techniques to monitor stock out trends over chosen intervals of
time.
‘I
Laundry System AnalysisFinal Report P. 12
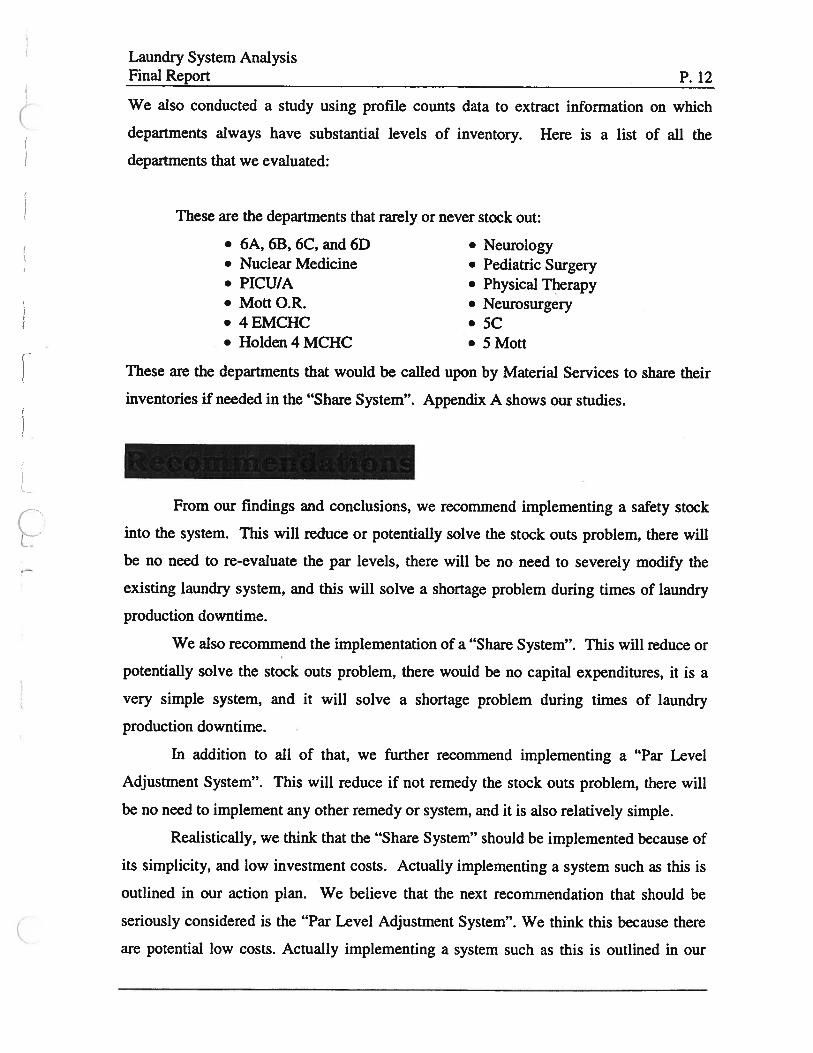
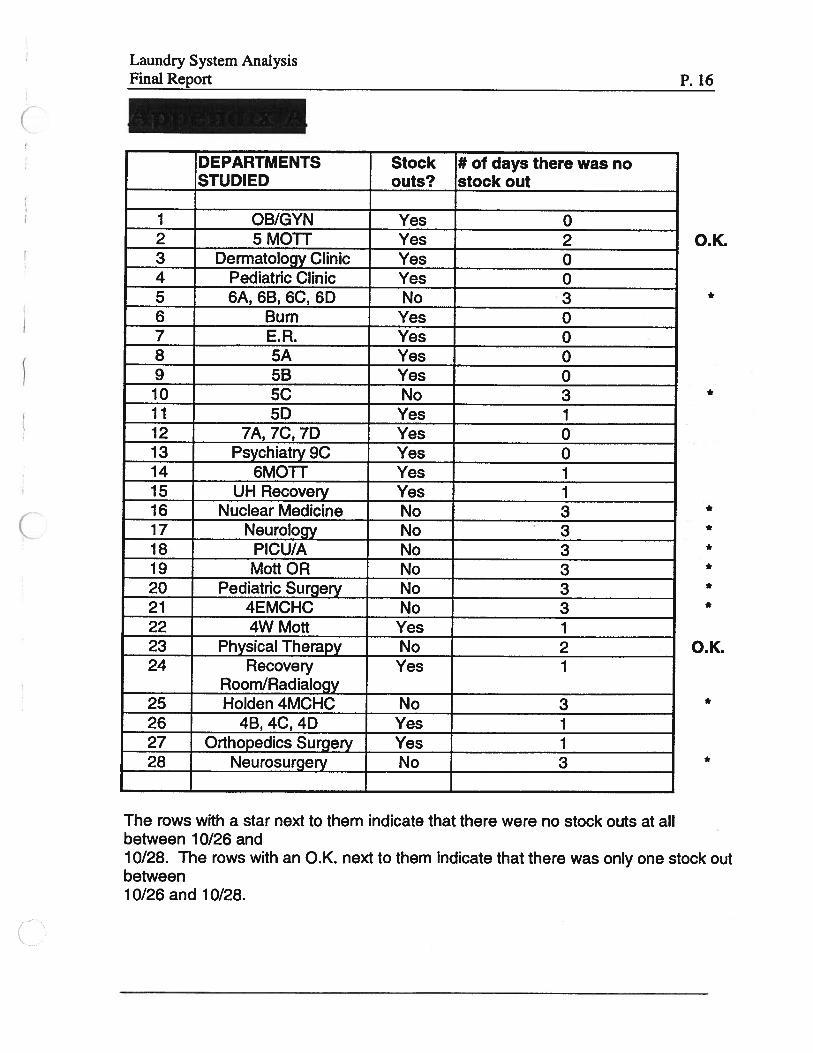
We also conducted a study using profile counts data to extract information on which
departments always have substantial levels of inventory. Here is a list of all the
departments that we evaluated:
These are the departments that rarely or never stock out:
• 6A, 6B, 6C, and 6D • Neurology• Nuclear Medicine • Pediatric Surgery• PICU/A • Physical Therapy• Mott O.R. • Neurosurgery•4EMCHC •5C• Holden 4 MCHC • 5 Mott
These are the departments that would be called upon by Material Services to share their
inventories if needed in the “Share System”. Appendix A shows our studies.
From our findings and conclusions, we recommend implementing a safety stock
into the system. This will reduce or potentially solve the stock outs problem, there will
be no need to re-evaluate the par levels, there will be no need to severely modify the
existing laundry system, and this will solve a shortage problem during times of laundry
production downtime.
We also recommend the implementation of a “Share System”. This will reduce or
potentially solve the stock outs problem, there would be no capital expenditures, it is a
very simple system, and it will solve a shortage problem during times of laundry
production downtime.
In addition to all of that, we further recommend implementing a “Par Level
Adjustment System”. This will reduce if not remedy the stock outs problem, there will
be no need to implement any other remedy or system, and it is also relatively simple.
Realistically, we think that the “Share System” should be implemented because of
its simplicity, and low investment costs. Actually implementing a system such as this is
outlined in our action plan. We believe that the next recommendation that should be
seriously considered is the “Par Level Adjustment System”. We think this because there
are potential low costs. Actually implementing a system such as this is outlined in our
Laundry System AnalysisFinal Report P. 13
action plan. Finally, we think the “Safety Stock” solution should be considered last
because there is cost associated with it. Actually implementing a system such as this is
outlined in our action plan.
We should advise that there are limitations associated with each one of these
recommendations. The “Share System” could potentially create a need for a new position
within Material Services called “A Runner” who makes deliveries to and from different
departments. To remedy this potential situation though, we have thought up a remedy,
which will be outlined in the action plan.
The “Par Level Adjustment System” solution has potential disadvantages also.
There could be an expenditure of buying more linen, there may need to be increased
laundry production levels, and more transportation may be needed.
The “Safety Stock” solution has potential disadvantages too. There would be a
capital expenditure for more linen, it is possible for safety stock to stock out, and there
could be potential abuse of safety stock. For example, material services may pull
inventory from the safety stock when not needed, thus depleting the system.
The “Share System” action plan involves multiple, simple steps for
implementation. First, a list of departments that rarely or never stock out will be devised
and given to material services for reference. These departments will be listed in order
from least likely to stock out, to most likely to stock out (though each department was
chosen because of its low probability of stocking out). A procedure will be distributed to
all departments on how to properly utilize the share system. This procedure will outline
that material services is to be contacted and how to put in an order for more linens.
Finally, there are two options to choose from on how to deliver the linens from one
department to another. The first and least desirable option is to create a new position
called “A Runner”. This person would work under material services and be responsible
Laundry System AnalysisFinal Report P. 14
for transferring linen from one department to another. This is least desirable though
because of the costs involved with an added employee. The second option is to give
everybody in the material services department pagers. When a delivery is needed, and
material services has decided which department it is going to pull inventory from, the
material services employee closest to the involved departments will be paged. From
there the employee calls material services back and finds out where he needs to go. From
there, a delivery must be made. In addition, before inventory is actually pulled from a
certain department, material services needs to get permission from the department in
which they would like to pull from. If inventory eventually gets pulled from a
department, this must be dated and documented for the purposes of keeping a record and
to exclude those days in the reassessment of par levels.
The “Par Level Adjustment System” action plan also involves multiple steps for
implementation. Statistical analysis must be utilized here to determine the needed change
in par levels. The statistical analysis used would be random sampling of historically
affected departments on every Monday morning spanning over a period of every three
months. The data that would be collected would be a count of the number of times
certain linen stocks out. This data would be plotted on X bar and R charts. This would
show whether or not there is an acceptable level of stock outs, by showing either an in or
out of control chart condition. Management, such as Tom Peterson will set the
acceptable levels. By using a tool such as this, management would be able to determine
if the set par levels are adequate. In addition, management would be able to monitor how
other recommendations have had an effect. Another tool that could be utilized is an
inventory control model method. This methodology utilizes the probability of stock out
situations, setup costs, lead-time, and the demand. Using this methodology will help aid
in recalculating the par level.
The “Safety Stock” action plan also involves multiple steps for implementation.
First of all, an area within the laundry production facility would need to be set up for the
extra stock. We have determined this because of the fact that there is very little room in
the hospital and there is under utilized room in the laundry facility. Next would be to
invest in a pre-determined amount of new linens. Thirdly, setting up a system on how to
actually call for and transport the linens must be accomplished. For example, when
Laundry System AnalysisFinal Report P. 15
internal distribution gets low on inventory, material services would have call the laundry
facility and arrange for a delivery of more clean linens to the hospital. Finally, a memo
must be devised and distributed to all departments on how to properly utilize the safety
stock system.
OC
DO
(D—
—-
0)
X.
CDO
)CD
CD DQ
D&
..LC
Do
t’.)
Ic;5 pD
—I
CD -‘ 0 C’)
C’)
p) D CD 0 CD 3 0 C,
CD -4.
-4.
CD CD 0 0 -4.
0 C,
0 C U)
t-4 CD sc
,)1 ,-
4C
,, CD C,,
—.
C’,
r\)r
o)r
%)
41’)-
Q.J
O)Q
1O
C(Y
i)i)-’O
04O
)C51
C,)
ØQ
0 .j
0Z
z1
0D
CD-
>-,
jCD
z 000
00
ocooo
ooocn
ococn
00
0*
00
0-Il
.Q
.‘.‘
‘l< I
C,)
_L
C,)
ø—
OO
--”C
)O
OO
OC
,)O
OF
)O
0 D 0
0*
**
**
**
**
0*
0
Laundry System AnalysisFinal Report
Flow digarm for system simulated
P.17
Eleven Departments within Hospital
LIDI I
DEl
DIRTYLINENS
STORAGE
BULK DISTRIBUTION
RECEIVINGArrival of clean linens
SICU
8A
SICU
8B
SICU
8C
SICU
8D
00000000
SoiledL
inens
jl’00000000
IS
afetystock
I
.
000000000
SM
OT
5W
SMOTT5EI
IF.
Bulk
Distribution
SC
LINIC
AC
linicC
SCLIN
ICB
SE
mergency
Room
Cleaning
Failities
SB
urnT
rauma
U