Embed Size (px)
Citation preview

H APPENDIX H
Groundwater Assessment (GWS Limited)

i
Project Martha
Assessment of Groundwater Effects
43 Moresby Ave
Waihi 3610
New Zealand
Report Prepared for: OceanaGold NZ Ltd
20th
April 2018
FINAL REPORT
ii
Contents
1. Introduction ............................................................................................................................ 1
1.1 Project Description................................................................................................... 1
1.2 Scope of Work.......................................................................................................... 1
2. Hydrogeologic Setting............................................................................................................. 2
2.1 Regional Geology ..................................................................................................... 2
2.2 Regional Hydrogeology ............................................................................................ 4
3. Mine Dewatering .................................................................................................................. 17
3.1 Historic Workings ................................................................................................... 17
3.2 Historic Dewatering ............................................................................................... 18
3.3 Historic Dewatering Effects.................................................................................... 20
3.4 Recent Mine Dewatering ....................................................................................... 20
3.5 Observed Dewatering Effects ................................................................................ 22
4. Groundwater Effects Assessment......................................................................................... 24
4.1 Martha Underground Dewatering - Groundwater Inflows.................................... 24
4.2 Martha Underground Dewatering – Drawdown Effects........................................ 25
4.3 Martha Underground Dewatering - Effects to Surface Waters ............................. 28
4.4 Martha Underground Dewatering – Effects to Groundwater Resource................ 29
4.5 Martha Underground Dewatering – Effects to Plant Growth................................ 33
4.6 Rex and Martha Phase 4 Pit Dewatering – Groundwater Inflows ......................... 33
4.7 Rex and Martha Phase 4 Pit Dewatering – Drawdown Effects .............................. 33
4.8 Martha Underground Post Closure –Rewatering Rate .......................................... 33
4.9 Martha Underground Post Closure – Long Term Discharge .................................. 34
4.10 Martha Underground Post Closure – Effects on Surface Waters .......................... 40
4.11 Rex and Martha Phase 4 Pit Post Closure – Effects on Pit Wall............................. 40
5. Recommendations................................................................................................................ 41
5.1 Dewatering............................................................................................................. 41
5.2 Rewatering and Post-Closure................................................................................. 42

iii
Tables
Table 1 Aquifer Hydraulic Properties.................................................................................. 16
Table 2 Calculated Pumping Rate for Proposed Martha Underground.............................. 24
Table 3 Groundwater Availability Calculations................................................................... 29
Table 4 Private Bore Information from Council Database.................................................. 31
Table 5 Calculated Rewatering Volumes ............................................................................ 34
Table 6 Shaft and Adit Elevations below 1104 m RL........................................................... 38
Figures
Figure 1 Generalised Geology in the Waihi Area............................................................... 3
Figure 2 Ore Body Distribution .......................................................................................... 3
Figure 3 General Geology and Structural / Hydrogeologic Domains................................. 4
Figure 4 Conceptual Water Balance for the Waihi Area (Modified after GCNZ, 1985)..... 5
Figure 5 Groundwater Levels in Alluvium / Ash ................................................................ 7
Figure 6 Groundwater Levels - Groundwater System in Younger Volcanics..................... 8
Figure 7 Groundwater Levels - Andesite Rock Aquifer...................................................... 9
Figure 8 Water Table Map............................................................................................... 10
Figure 9 Hydrological Cross-Section Locations................................................................ 11
Figure 10 Hydrological Cross-Section Pit to P92................................................................ 11
Figure 11 Hydrological Cross-Section Pit to P95................................................................ 12
Figure 12 Hydrological Cross Section Pit to P102 .............................................................. 12
Figure 13 Conceptual Model of Andesite Permeability and Vein Interconnection........... 15
Figure 14 Historical Workings Void Filled by Levels .......................................................... 17
Figure 15 Historical Martha Annualised Average Pumping Rates and Levels ................... 19
Figure 16 Mine Pumping Schematic .................................................................................. 21
Figure 17 Pumping Rates for Martha and Correnso from 2003 to 2016........................... 23
Figure 18 Proposed Martha Underground Development and Dewatering Schedule ....... 25
Figure 19 Multilevel Piezometer P3 Data. ......................................................................... 26
Figure 20 Pressure Gradient P3 ......................................................................................... 27
Figure 21 Locations of Private Bores from Council Data Base........................................... 30
Figure 22 Private Bore Monitoring Data............................................................................ 32
Figure 23 Conceptual model of Mine Hydraulic Interconnectivity.................................... 35
Figure 24 Approximate Location of 1104 m Contour ........................................................ 37
Figure 25 Historical Adit Levels – Union Hill ...................................................................... 38
Figure 26 Elevations of Historical Shafts – Union Hill........................................................ 39
Appendices
Appendix A Dewatering Model
Appendix B Rewatering Model
Appendix C Numerical Modelling

iv
EXECUTIVE SUMMARY
OceanaGold NZ Ltd (OceanaGold) is seeking Resource Consents for its Waihi operation to
extend a section of the north wall of the Martha Open Pit and commence underground
mining operations of the Martha ore body that, together, are referred to as Project Martha.
GWS Limited has been engaged to quantify the volumes required to dewater and rewater
the Martha Underground and to indicate the consequent effects on groundwater levels and
pressures. The scope of this report is focussed on the development of the Martha
Underground and Martha Phase 4 Pit.
The geological and hydrological setting of the area is well understood and has been
described in numerous previous reports. In summary, the ore body to be mined comprises
near-vertical quartz veining with relatively elevated permeability and groundwater storage
within an andesite rockmass of lower permeability and storage.
The andesite rockmass is overlain, in part, by younger volcanic materials comprising rhyolitic
tephras and ignimbrite flows, breccias and tuffs. Paleosols and sedimentary deposits are
occasionally interspersed or located at the base of these deposits. These deposits infill a
paleovalley system between the outcropping andesite elevation highs. This paleovalley
system extends from beneath East Waihi and passes between Martha Hill and Union Hill.
The groundwater in the younger volcanic deposits is separated from the deeper
groundwater in the andesite rock by a weathered, lower permeability upper layer of the
andesite rockmass.
Vein and fault intersections provide interconnections between the Martha, Trio and
Correnso mines. These intersections have been enhanced by mine developments. While
the Favona mine was, initially, hydrologically separate from the other mines, now a low level
drive provides connection to the other mines above 823 m RL.
As a result of the interconnections, dewatering of one vein also dewaters the interconnected
veins to a similar elevation, but the andesite rockmass surrounding and between the veins is
dewatered to a lesser degree such that steep hydraulic gradients develop between the veins
and the rockmass.
This dewatering effect is substantially attenuated by the low permeability layer at the top of
the andesite rockmass such that only close to Union Hill, where the low permeability layer
appears to be thinner, has an effect on the water pressures at the base of the younger
volcanics been observed as a departure from the natural hydrostatic gradient. Further north
of Union Hill, this effect reduces until it is absent.
This dewatering effect on the younger volcanic rocks developed early in the current mining
phase and is not sufficient to alter the primarily horizontal groundwater movement within
that rock unit.
The current dewatering level of the Martha, Trio and Correnso vein systems (as at early
2018) is at approximately 770 m RL with the consented dewatering depth being 700 m RL.
Historical dewatering has been undertaken to approximately 540 m RL and with the
proposed Martha Underground Mine to extend to 500 m RL, only some 40 m of previously
non-dewatered ground would be dewatered.
v
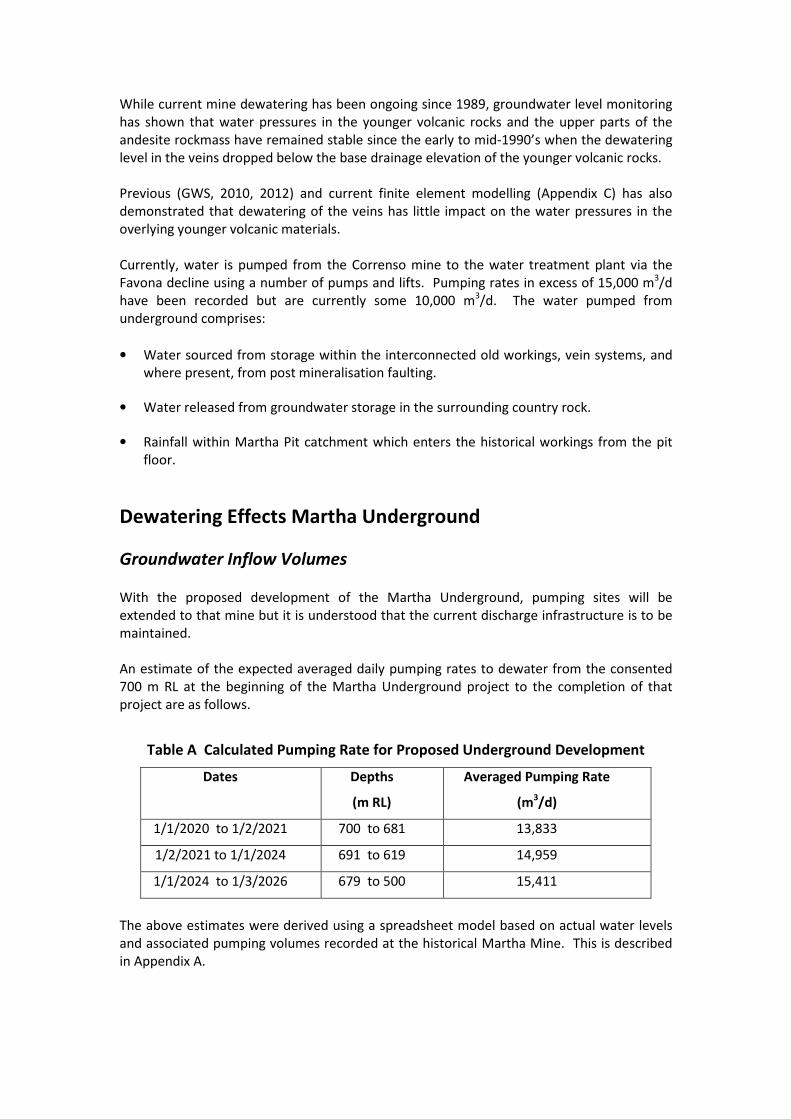
While current mine dewatering has been ongoing since 1989, groundwater level monitoring
has shown that water pressures in the younger volcanic rocks and the upper parts of the
andesite rockmass have remained stable since the early to mid-1990’s when the dewatering
level in the veins dropped below the base drainage elevation of the younger volcanic rocks.
Previous (GWS, 2010, 2012) and current finite element modelling (Appendix C) has also
demonstrated that dewatering of the veins has little impact on the water pressures in the
overlying younger volcanic materials.
Currently, water is pumped from the Correnso mine to the water treatment plant via the
Favona decline using a number of pumps and lifts. Pumping rates in excess of 15,000 m3/d
have been recorded but are currently some 10,000 m3/d. The water pumped from
underground comprises:
• Water sourced from storage within the interconnected old workings, vein systems, and
where present, from post mineralisation faulting.
• Water released from groundwater storage in the surrounding country rock.
• Rainfall within Martha Pit catchment which enters the historical workings from the pit
floor.
Dewatering Effects Martha Underground
Groundwater Inflow Volumes
With the proposed development of the Martha Underground, pumping sites will be
extended to that mine but it is understood that the current discharge infrastructure is to be
maintained.
An estimate of the expected averaged daily pumping rates to dewater from the consented
700 m RL at the beginning of the Martha Underground project to the completion of that
project are as follows.
Table A Calculated Pumping Rate for Proposed Underground Development
Dates Depths
(m RL)
Averaged Pumping Rate
(m3/d)
1/1/2020 to 1/2/2021 700 to 681 13,833
1/2/2021 to 1/1/2024 691 to 619 14,959
1/1/2024 to 1/3/2026 679 to 500 15,411
The above estimates were derived using a spreadsheet model based on actual water levels
and associated pumping volumes recorded at the historical Martha Mine. This is described
in Appendix A.

vi
The model provides averaged pumping rates to achieve a desired amount of dewatering. In
practice, variations in vein geometry and hydraulic parameters and variations in rainfall
inflow via Martha Pit in response to event rainfall, would result in a need for higher pumping
rates on occasions to maintain the desired rate of dewatering.
Groundwater Drawdown Effects
Dewatering from 700 m RL to 500 m RL will be achieved by pumping water inflows from vein
systems collected in underground sumps. Groundwater monitoring to date has shown that
pressure change in the vein systems has had little effect on groundwater levels in the
overlying younger volcanic rocks during mine dewatering since approximately the mid-
1990’s.
In summary, expected drawdown effects from pumping vein water levels from 700 m RL to
approximately 500 m RL are assessed as follows:
- Groundwaters in Younger Volcanic Rocks
The current water table is expected to remain unaffected due to persistent surface recharge.
Minor pressure changes may develop at the base of the thicker parts of the younger volcanic
rocks (at lower elevation) where the thickness of the weathered andesite layer could be
affected by stoping.
- Groundwaters in Low Permeability Weathered Andesite
Negative pressure gradients (reducing pressure with depth) through this layer may steepen
as a result of pressures within the layer adjusting to a dewatered state as a consequence of
nearby mine development.
Current positive pressure gradients (increasing pressure with depth) may steepen and
possibly become negative in limited areas where nearby stoping reduces the thickness of the
low permeability layer.
With an increase in the negative pressure gradients, a small increase in seepage from the
overlying younger volcanic rocks may develop in some locations but given the low vertical
permeability of this layer, this would not affect any groundwater flows or the water table in
the overlying materials, i.e. recharge from rainfall will still exceed any increase in seepage.
- Higher Permeability Andesites (approximately 1000 m RL to 700 m RL)
This zone has responded to current dewatering (approximately 770 m RL) in the veins. The
current response is interpreted to be variable depending on localised permeability. A
phreatic surface is expected to have developed within the rockmass, curving upwards and
away from vein water level and encompassing the dewatered zone (i.e. a cone of
depressurisation). Modelling shows this to lead to a maximum width of the dewatered zone
within the low permeability layer, a process which has been ongoing since the dewatering
level dropped below the base of the low permeability layer. Dewatering to approximately
500 m RL may lead to a nominal widening of the dewatered zone beneath the low
permeability layer over parts of the system and possibly, to some movement of the
dewatered zone up into the base of the low permeability layer. But effects on pressures in
vii
the overlying younger volcanic rocks are shown by predictive modelling and past monitoring
observations to be minimal.
- Lower Permeability Andesites (approximately 700 m RL to below 500 m RL m RL)
The modelling shows that dewatering veins to approximately 500 m RL in the deeper, low
permeability andesite rockmass is unlikely to lead to development of a substantial
dewatered zone in the adjacent country rock. The indication is that the rockmass will drain
slowly and the phreatic surface will be steep and sub-parallel to the vein systems in this
zone.
Effects on Surface Waters
Monitoring data collected over the period since dewatering began has indicated no adverse
effects on shallow groundwater or base flow to surface waters. This is, largely, a
consequence of the perched nature of the surface water bodies in the shallow groundwater
system. The proposed deepening will have no additional effect to surface waters
Effects on the Groundwater Resource
- Groundwater Availability
This assessment has shown that there is sufficient groundwater available in the Waihi Basin
deep aquifer system to allow the proposed average daily take of 15,000 m3 for dewatering
to take place. It is of note that the proposed groundwater take is for dewatering purposes,
and that this water will, in-fact, be discharged into surface waters locally. This water is,
therefore, not lost from the catchment, rather it is put back into the Waihi Basin system at a
higher level, thereby having a net neutral effect on the catchment water balance.
- Other Aquifers
The groundwater take for mine dewatering is from the deep andesite rockmass. Close
monitoring of shallow and deep groundwater levels has been undertaken since the
commencement of modern mine dewatering in 1989. These records clearly show that
pumping of the deep groundwater system does not impact on the shallow groundwater
system due to the low permeability strata that separates the two. As the abstracted
groundwater will be discharged back into the surface water environment, there is a neutral
effect on the catchment water balance. As the abstracted groundwater will be discharged at
the surface, there will be a net positive benefit by enhancing stream flow locally.
- Other Users
OceanaGold NZ Ltd (OceanaGold) maintains a complaints database in accordance with its
existing consent conditions. The Company has responded to queries on some bore
performance issues in the past and is currently understood to be working with one bore user
who had identified a water level drop in their bore. Further deepening of the mine is not
expected to affect existing groundwater users, however the same approach as under the
existing conditions is expected to adequately manage potential effects on other bores.

viii
Effects on Plant Growth
This was an issue raise during the first application for modern mining at Waihi. Plant growth
relies on soil moisture retention in the near-surface soils, which is a function of rainfall
infiltration. The demonstrated lack of effects on shallow groundwater from deep
dewatering supports the observation that drainage effects will not alter shallow soil
moisture contents and, therefore, plant growth.
Martha Post Closure Effects
Re-watering Rate
A spreadsheet groundwater rewatering model was developed to provide an estimate of the
inflows to the underground developments and the pit lake following mine closure. The
rewatering model focuses on groundwater inflow as the primary input parameter, with
rainfall into the pit and diverted Ohinemuri River water as additional sources for re-filling
within the Martha and Waihi East groundwater systems, as well as the Martha Mine Lake.
This model is described in Appendix B.
The groundwater rewatering model estimates are based on a specific set of values for a
range of inputs, and the combination of these effects is assessed in more detail in the Water
Management Report (GHD, 2018). This report provides a first estimate inflow volumes
required to re-fill the system from 500 m RL to the proposed lake overflow elevation of 1104
m RL with average river contributions of 9,000 m3/d and 15,000 m
3/d as follows:
Table B Calculated Rewatering Volumes
River Recharge Rate (m3/d) 9,000 15,000
Total Storage (m3) 70,190,170 70,190,170
Total Groundwater (m3) 9,008,720 6,291,944
Rainfall (m3) 14,215,137 9,820,513
Total River Recharge (m3) 46,966,313 54,077,713
Long Term Discharge
While the Waihi ore bodies had limited hydrological comunication with the Favona ore
bodies prior to mining, the construction of the low level Trio Incline (800 m RL to 823 m RL)
and high level Trio Decline (1015 m RL to 1060 m RL) from the Favona mine to the Trio Mine
will result in a combined water level rise within both systems once groundwater level
recovers above 823 m RL.
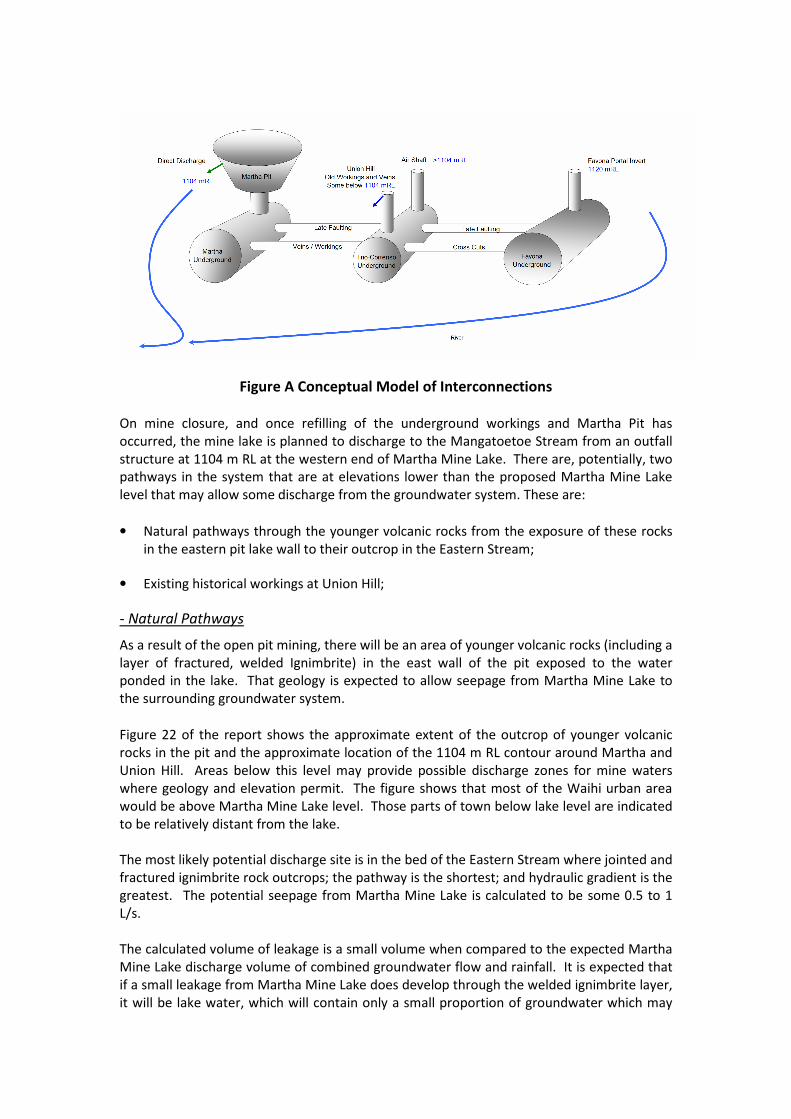
To assist in understanding the connectivity between the mines, a conceptual model has been
developed and is shown in Figure A. The model considers the system as a series of plumbing
components where the bucket represents the open pit, storage tanks represent the
underground workings and pipes represent features that provide interconnection. Veins,
historical workings and recent mining are considered as open conduits for flow, whereas late
phase faulting provides fewer open connections.
ix
Figure A Conceptual Model of Interconnections
On mine closure, and once refilling of the underground workings and Martha Pit has
occurred, the mine lake is planned to discharge to the Mangatoetoe Stream from an outfall
structure at 1104 m RL at the western end of Martha Mine Lake. There are, potentially, two
pathways in the system that are at elevations lower than the proposed Martha Mine Lake
level that may allow some discharge from the groundwater system. These are:
• Natural pathways through the younger volcanic rocks from the exposure of these rocks
in the eastern pit lake wall to their outcrop in the Eastern Stream;
• Existing historical workings at Union Hill;
- Natural Pathways
As a result of the open pit mining, there will be an area of younger volcanic rocks (including a
layer of fractured, welded Ignimbrite) in the east wall of the pit exposed to the water
ponded in the lake. That geology is expected to allow seepage from Martha Mine Lake to
the surrounding groundwater system.
Figure 22 of the report shows the approximate extent of the outcrop of younger volcanic
rocks in the pit and the approximate location of the 1104 m RL contour around Martha and
Union Hill. Areas below this level may provide possible discharge zones for mine waters
where geology and elevation permit. The figure shows that most of the Waihi urban area
would be above Martha Mine Lake level. Those parts of town below lake level are indicated
to be relatively distant from the lake.
The most likely potential discharge site is in the bed of the Eastern Stream where jointed and
fractured ignimbrite rock outcrops; the pathway is the shortest; and hydraulic gradient is the
greatest. The potential seepage from Martha Mine Lake is calculated to be some 0.5 to 1
L/s.
The calculated volume of leakage is a small volume when compared to the expected Martha
Mine Lake discharge volume of combined groundwater flow and rainfall. It is expected that
if a small leakage from Martha Mine Lake does develop through the welded ignimbrite layer,
it will be lake water, which will contain only a small proportion of groundwater which may

x
have moved through the closed underground mines. The effect of such a small discharge of
diluted mine water is considered to be minimal.
While there may be other potential seepage locations, such discharge is assessed as being
much smaller than calculated for the Eastern Stream.
- Historical Workings Discharge Pathway
Prior to mining, the water level measured in No. 7 Shaft at Martha Hill varied around 1110 m
RL. Given the proposed lake outfall level of 1104 m RL, groundwater from the surrounding
areas will move towards the Martha Mine Lake, i.e. the lake would generally remain an
inward gradient location.
Pre-mining, groundwater levels in andesite rocks around Martha Mine were indicated to be
relatively flat indicating groundwater flow paths were closely interconnected. The flat water
levels extended to Union Hill where the Union Shaft groundwater levels were similar to
Martha Hill shaft groundwater levels and southwards to, at least, Gilmour Lake. The only
observed discharge from the historic mine workings was a warm spring at an elevation of
1106 m RL flowing from a collapsed drive on the east side of the Mangatoetoe Stream. The
historic linkages are unlikely to have been substantially altered by current mining. As a
consequence, post-mining groundwater levels are expected to return to a flat hydraulic
gradient with this flat gradient extending to all the interconnected mine workings.
Figures 23 and 24 in the main report provide the historical adit elevations and shaft collar
elevations on Union Hill. These indicate that several historical adits and shafts are at
elevations below 1104 m RL (Martha Mine Lake Control level) and these are presented in
Table C.
Table C Shaft and Adit Elevations below 1104 m RL
Shaft Collars (m
RL) Adit Inverts (m RL)
1102 1090
1103 1094
1095
Two shafts and three adits would be below the inferred recovered groundwater elevations
in the veins and workings below Union Hill.
Given the indicated close connection between Martha and Union workings and veins, water
levels in the historical Martha Mine workings should have dropped to some 1094 m RL, 2 m
above the lowest discharge point at Union Hill prior to open pit mining, if discharge was
taking place through the Union Hill adits and shafts. No discharge was, in fact, observed.
This suggests that groundwater discharges from the lower elevation shafts and adits around
Union Hill did not occur prior to open pit mining, or that if discharges did occur, they were of
too small a volume to affect groundwater levels in the veins and workings in Union Hill or
Martha Mine. Collapsed adits or shafts may account for the lack of, or the minor,
groundwater discharge. These observations indicate pre-mining water levels above the adit
and shaft elevations on Table C and that those adits and shafts were not influencing water
levels in the andesite rock outside of Union Hill. With the control level on Martha Mine Lake

xi
being set lower than historical groundwater levels in Martha Hill, there is a reduced
possibility of seepages from the historical adits and shafts on Union Hill.
Other old adits and shafts are present around the Martha, Union and Favona Mines. These
are all indicated to be in the more elevated areas and to have invert levels above 1104 m RL.
Effects On Surface Waters
Following closure of the mine there will be a direct discharge from the Martha Lake at an
elevation of 1104 m RL into the Mangatoetoe Stream. It is not expected that there will be
any other significant groundwater discharges to surface waters following recovery of the
water level. It is possible that localised discharges associated with former mine workings
could develop. However, any discharges that may occur will be controlled such that any
discharge is of a very small volume.
Recommendations
Dewatering
Ongoing dewatering will be required to develop Project Martha, and in particular the Martha
Underground, to its proposed depth of 500 m RL. Currently, existing mining consents
require a Dewatering and Settlement Monitoring Plan be prepared and actioned. The
Dewatering and Settlement Monitoring Plan 2016 (WAI-200 PLN 009) combines the
monitoring plans for Martha, Favona Trio and Correnso/SUPA into one document given their
similar monitoring networks and frequencies.
In relation to dewatering and settlement, the plan describes the monitoring regime designed
to assess the effects of:
a) Mine dewatering on the regional groundwater system.
b) Mine dewatering on settlement.
The objectives of the current Dewatering and Settlement Monitoring Plan are:
• To outline the monitoring systems in place for dewatering, groundwater and settlement
and the requirements for these systems in accordance with the relevant consent
conditions.
• To identify trigger limits that will indicate when contingency mitigation and/or
monitoring may be necessary.
• To identify what contingency mitigation and/or monitoring would be undertaken in the
event that the trigger levels are exceeded, in order to ensure that adverse
environmental effects are avoided, remedied or mitigated.
The current monitoring approach is considered to be appropriate for managing any
dewatering effects that may develop during Project Martha. The plan can be revised and be
re-issued having regards to the following:
• Separately measure and record daily the water volume pumped from Martha

xii
Underground and other underground mine areas.
• Sample the discharge waters from the separate underground mine areas. This, together
with the volume pumped, can be used to calibrate the Martha Mine Lake chemistry
models.
• Measure and record water levels weekly. This can be done in piezometers drilled
underground to intercept veins/historical workings or in the absence of underground
piezometers, in sumps at the lowest elevation in the mine. Both methods have been
used during current mining.
Groundwater Monitoring
The existing network of piezometers is generally considered adequate to enable
observation of dewatering effects related to project Martha. As can be seen in Figure 8,
there are a number of areas where the monitoring network is less dense. This includes the
area to the south and southwest of the pit which is shown to be in Settlement Zones 4, 5
and 6 (EGL, 2018). Given the proposal is to extend dewatering by a further 200 m depth,
additional multi-level piezometers in these areas would assist with modelling the ongoing
settlement and the re-bound post-closure. The exact locations of these piezometers would
be included in an updated Dewatering and Settlement Monitoring Plan.
Rewatering and Post-Closure
• It will be important to monitor the rate of water level recovery during closure to validate
and update the rewatering model. It will also be important as a guide to the volume of
river water diversion needed during filling.
• The location of instrumentation to record recovery would depend on what structures
are to remain during closure and into post-closure. The location and the setting of such
instrumentation would need to be decided and in place before water level recovery
began.
• The current monitoring network will need to be reviewed to check that it will be suitable
to monitor water level recovery in the shallower rock units during closure and post-
closure and to update the monitoring plan where any modification to this network is
identified or proposed.
• The monitoring plan should include a requirement to undertake site inspections of
potential leakage zones once the Martha Mine Lake water level reaches final elevation.
Should any leakage outside of the constructed discharge location be identified, the plan
should include a requirement to undertake an effects assessment and, if necessary, to
design and implement mitigation measures.

SECTION 1
Introduction
1
1. Introduction
1.1 Project Description
OceanaGold NZ Ltd. (OceanaGold) is seeking Resource Consents for its Waihi operation to extend a
section of the north wall of the Martha Open Pit and commence underground mining operations of the
Martha ore body that together are referred to as Project Martha. The elements of the project, referred
to as project Martha, will generally consist of the following:
- Martha Phase 4 pit
- Martha Underground, including the Rex Ore Body
Each of these project areas has been the subject of study by the various technical disciplines and this
report is intended to address the dewatering effects associated with the Martha Underground Mine
development.
1.2 Scope of Work
GWS Limited has been engaged to quantify the volumes required to dewater and rewater the Martha
Underground Mine and to indicate the consequent effects on groundwater levels and pressures. The
scope of this report is focussed on the development of the Martha Underground and Martha Phase 4
Pit. This assessment includes effects related to short term dewatering during operations, and effects
associated with the long term discharge from the mine following closure. The purposes of this report
are to determine:
- Groundwater inflows
- Drawdown effects
- Re-watering effects
- Potential for effects on other aquifers
- Potential for effects on surface water
- Potential for effects on other groundwater users
- Potential for effects on plant growth
This report has been prepared based on historical and recent information that provides an
understanding of the site groundwater systems. This has been confirmed as appropriate and robust by
monitoring over the period of mining to date (approximately 30 years). This understanding has been
taken forward alongside the Project Martha scope and has included further technical analysis to enable
dewatering and rewatering responses of the groundwater systems to be quantified.

SECTION 2
Hydrogeologic Setting
2
2. Hydrogeologic Setting
2.1 Regional Geology
2.1.1 Basement Rocks
The geology of the area has been previously described by GNS (1996) which defines the Waihi Basin as a
structurally controlled depression that is likely part of a former caldera structure. Basement rocks in the
region comprise Coromandel Group andesite and dacite volcanic rocks which are present in the form of
horst and graben structures (up thrown and down thrown blocks) due to past faulting. These structural
controls provided pathways for epithermal fluid migration that ultimately led to the deposition of
precious metal bearing quartz veins that have been mined in historical and recent times. The structural
controls in the basement rocks are, largely, extensional features, with the greatest density of these
features centred around the former Martha Hill area.
Davies (2002) defined district-scale northeast trending grabens based on general stratigraphic patterns
and fault data. The western margin of one of these structures is referred to as the Waihi Graben which
is host to the Martha-Favona epithermal system. At mine scale, the Martha Graben is host to the
Martha, Empire, Royal and Rex ore Bodies. Further to the east, fault relays form the Trio, Union,
Mascotte and Amaranth ore bodies. All of these structures are north-east trending. The Correnso ore
body is a north trending structure which, along with a number of post-mineralisation faults, cuts through
the north-east trending ore bodies resulting in a high degree of connectivity.
Further east, the Union Horst (Union and Amaranth ore bodies) forms a paleo-topographic high that
separates the Martha Graben from the Favona-Moonlight Graben. The Union horst structure is
considered to act as a physical barrier between the more structurally permeable areas of the Martha
Graben and Favona-Moonlight structures. The hydraulic connectivity between the Martha system and
the Favona system is considered to be weak. The separation between the systems is at the approximate
location of No. 9 Fault (shown on Figure 1).
In summary, the fault controls in the basement rocks create discontinuous structures in the rockmass
that have implications for groundwater movement and form the hydrogeologic domains which are
discussed in this document. Figure 1 provides a conceptual geologic model for the area and Figure 2
identifies the ore body vein distribution. Figure 3 shows the structural features and the hydrogeologic
domains that define the Martha East ore bodies and the Waihi East ore bodies.
2.1.2 Post Mineralisation Deposits
In the Martha Graben, the basement andesite volcanic rocks are overlain by a series of younger rhyolitic
volcanic deposits. These latter materials are highly variable in thickness depending on the paleo
topography beneath. These deposits vary in composition from rhyolitic tephras and ignimbrites in the
form of flows, breccias and tuffs. Paleosols and sedimentary deposits, such as alluvium and boulder
alluvium, mark the top of the eruption sequences. Boulder alluvium is also present at the base of the
rhyolitic tephras. To the east of the Favona-Moonlight Graben, a thick sequence of post mineralisation
dacite volcanics are present overlying the andesite rock and forming Black Hill. A rhyolitic intrusion
protrudes through the entire sequence to the east of Black Hill and this is where the rock and tailings
storage facilities are located.

SECTION 2
Hydrogeologic Setting
3
Figure 1 Generalised Geology in the Waihi Area
Figure 2 Ore Body Distribution

SECTION 2
Hydrogeologic Setting
4
Figure 3 General Geology and Structural / Hydrogeologic Domains
2.2 Regional Hydrogeology
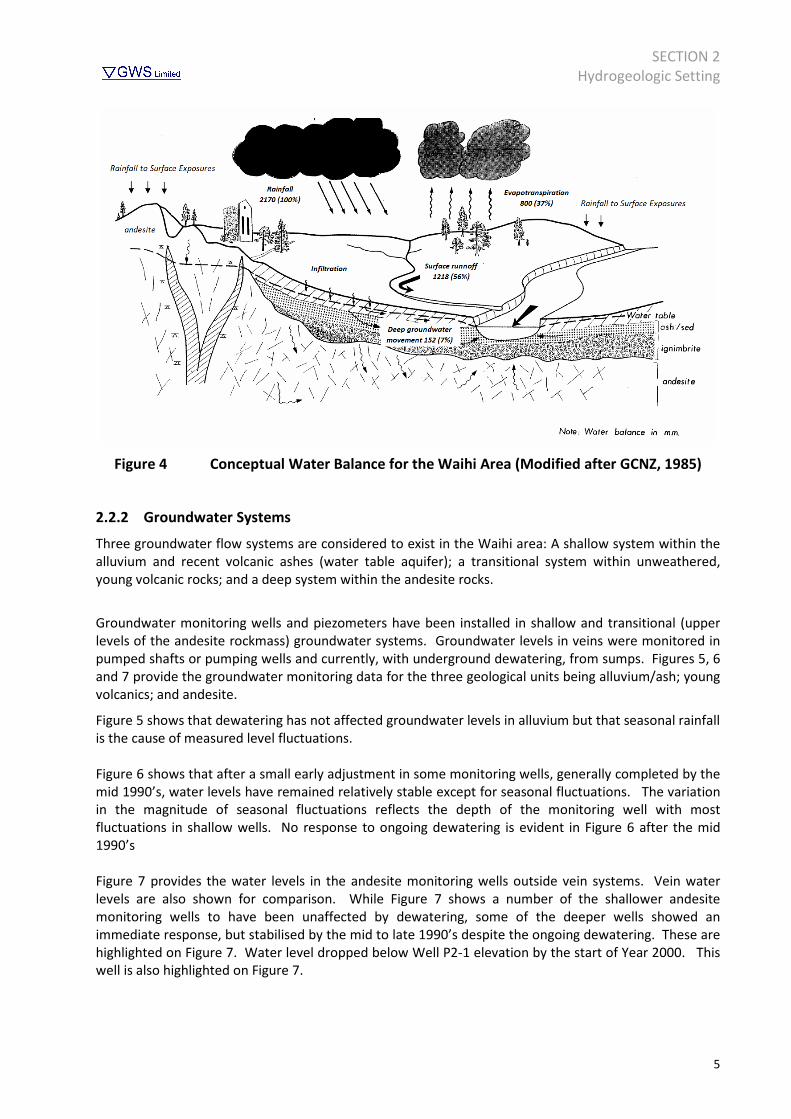
2.2.1 Groundwater Recharge and Discharge
Groundwater recharge in Waihi is from direct rainfall infiltration to the shallow groundwater system.
Average rainfall is 2170 mm per year and potential evapotranspiration is in the order of 800 mm per
year. The rainfall that infiltrates the ground surface enters the shallow groundwater system and, after
some residence time in this system, discharges locally as springs and base flow to streams. Infiltration to
the deep groundwater system is a small proportion of the water balance and is a result of direct rainfall
infiltration where the andesite is exposed at the surface, and due to some leakage from the shallow
groundwater system through the upper surface of the andesite rockmass. Figure 4 provides a
conceptual water balance model.
Prior to the current mining activity, a warm spring at an elevation of approximately 1106 m RL
discharged deep mine water from a collapse adit into the Mangatoetoe stream with a relatively small
flow of approximately 6 L/s (515 m3/d). Water levels around Martha Hill at that time were
approximately 1110 m RL indicating a flat groundwater gradient. Note that levels are expressed as mine
datum, which is approximately 1,000 m below mean sea level (i.e. 1,000 m RL mine datum is
approximately sea level).
SECTION 2
Hydrogeologic Setting
5
Figure 4 Conceptual Water Balance for the Waihi Area (Modified after GCNZ, 1985)
2.2.2 Groundwater Systems
Three groundwater flow systems are considered to exist in the Waihi area: A shallow system within the
alluvium and recent volcanic ashes (water table aquifer); a transitional system within unweathered,
young volcanic rocks; and a deep system within the andesite rocks.
Groundwater monitoring wells and piezometers have been installed in shallow and transitional (upper
levels of the andesite rockmass) groundwater systems. Groundwater levels in veins were monitored in
pumped shafts or pumping wells and currently, with underground dewatering, from sumps. Figures 5, 6
and 7 provide the groundwater monitoring data for the three geological units being alluvium/ash; young
volcanics; and andesite.
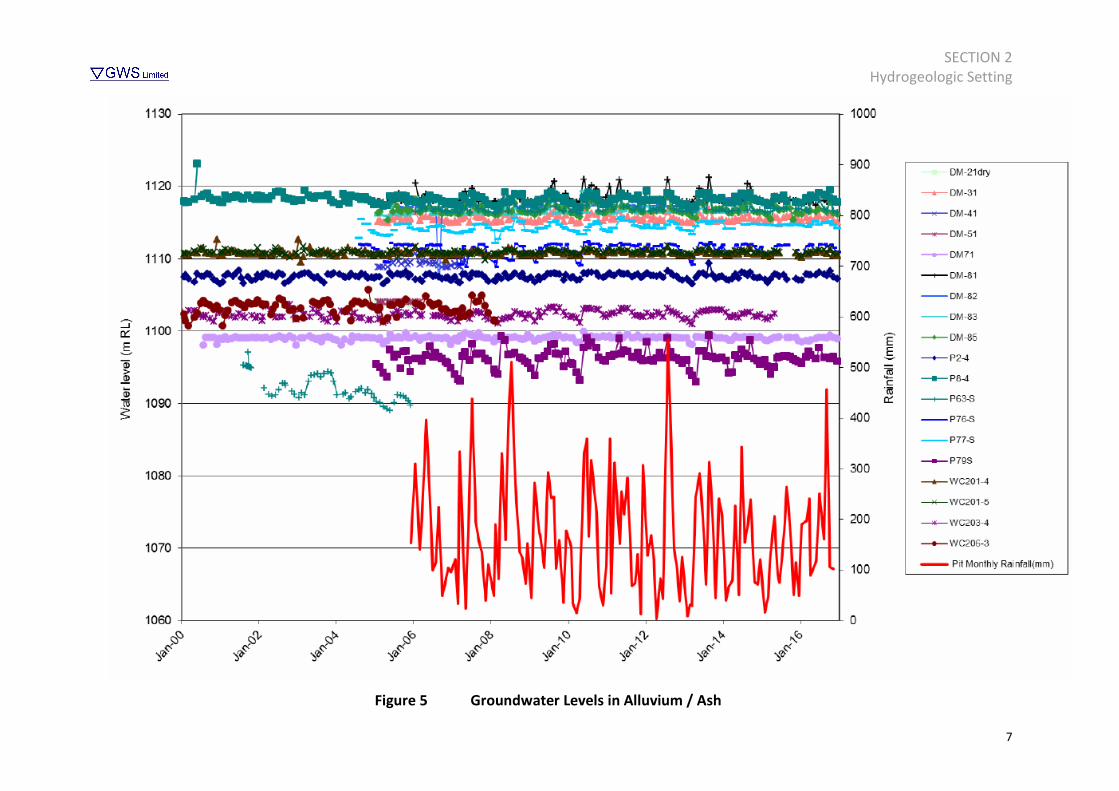
Figure 5 shows that dewatering has not affected groundwater levels in alluvium but that seasonal rainfall
is the cause of measured level fluctuations.
Figure 6 shows that after a small early adjustment in some monitoring wells, generally completed by the
mid 1990’s, water levels have remained relatively stable except for seasonal fluctuations. The variation
in the magnitude of seasonal fluctuations reflects the depth of the monitoring well with most
fluctuations in shallow wells. No response to ongoing dewatering is evident in Figure 6 after the mid
1990’s
Figure 7 provides the water levels in the andesite monitoring wells outside vein systems. Vein water
levels are also shown for comparison. While Figure 7 shows a number of the shallower andesite
monitoring wells to have been unaffected by dewatering, some of the deeper wells showed an
immediate response, but stabilised by the mid to late 1990’s despite the ongoing dewatering. These are
highlighted on Figure 7. Water level dropped below Well P2-1 elevation by the start of Year 2000. This
well is also highlighted on Figure 7.

SECTION 2
Hydrogeologic Setting
6
The Waihi ore bodies are hosted by altered andesitic lava flows, breccias and tuffs, the upper part of
which is weathered and/or thermally altered, and provides a low permeability zone. This low
permeability zone provides an aquitard layer that separates the deeper groundwater system in the
andesite from the shallower groundwater systems in the overlying younger volcanic rocks and alluvium
i.e. it perches the groundwater in the overlying younger materials.
SECTION 2
Hydrogeologic Setting
7
Figure 5 Groundwater Levels in Alluvium / Ash

SECTION 2
Hydrogeologic Setting
8
Figure 6 Groundwater Levels - Groundwater System in Younger Volcanics

SECTION 2
Hydrogeologic Setting
9
Figure 7 Groundwater Levels - Andesite Rock Aquifer
SECTION 2
Hydrogeologic Setting
10
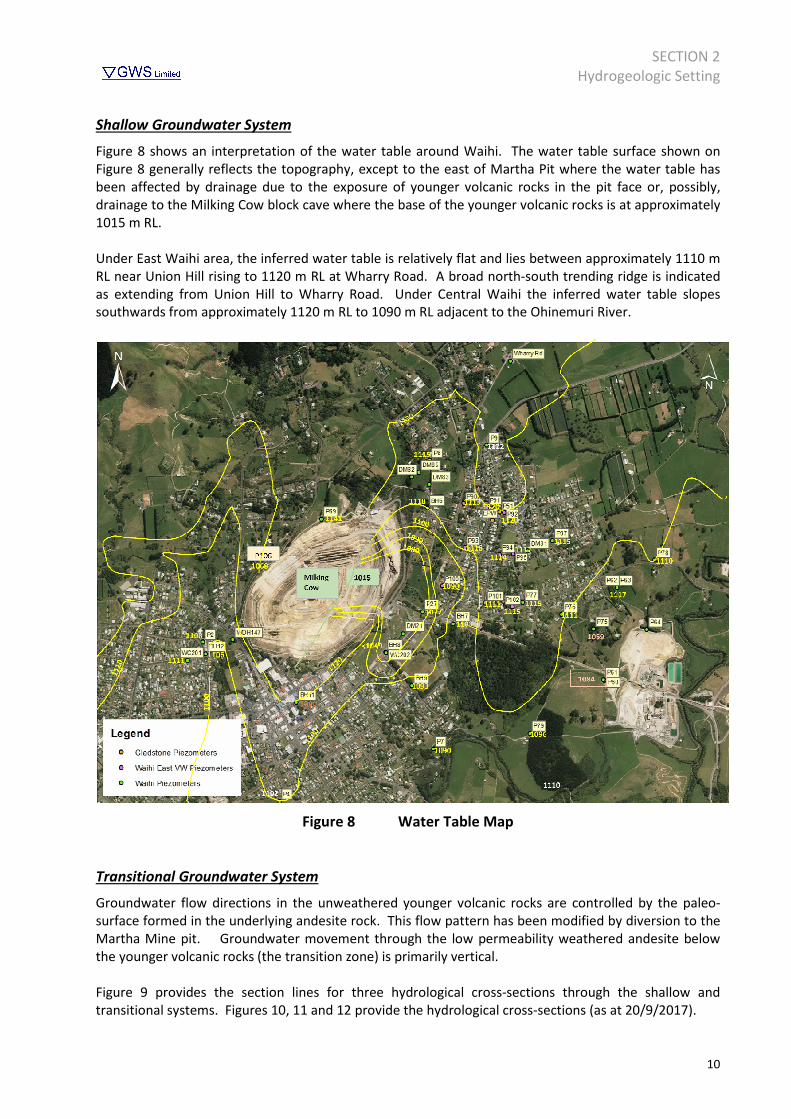
Shallow Groundwater System
Figure 8 shows an interpretation of the water table around Waihi. The water table surface shown on
Figure 8 generally reflects the topography, except to the east of Martha Pit where the water table has
been affected by drainage due to the exposure of younger volcanic rocks in the pit face or, possibly,
drainage to the Milking Cow block cave where the base of the younger volcanic rocks is at approximately
1015 m RL.
Under East Waihi area, the inferred water table is relatively flat and lies between approximately 1110 m
RL near Union Hill rising to 1120 m RL at Wharry Road. A broad north-south trending ridge is indicated
as extending from Union Hill to Wharry Road. Under Central Waihi the inferred water table slopes
southwards from approximately 1120 m RL to 1090 m RL adjacent to the Ohinemuri River.
Figure 8 Water Table Map
Transitional Groundwater System
Groundwater flow directions in the unweathered younger volcanic rocks are controlled by the paleo-
surface formed in the underlying andesite rock. This flow pattern has been modified by diversion to the
Martha Mine pit. Groundwater movement through the low permeability weathered andesite below
the younger volcanic rocks (the transition zone) is primarily vertical.
Figure 9 provides the section lines for three hydrological cross-sections through the shallow and
transitional systems. Figures 10, 11 and 12 provide the hydrological cross-sections (as at 20/9/2017).

SECTION 2
Hydrogeologic Setting
11
Figure 9 Hydrological Cross-Section Locations
Figure 10 Hydrological Cross-Section Pit to P92

SECTION 2
Hydrogeologic Setting
12
Figure 11 Hydrological Cross-Section Pit to P95
Figure 12 Hydrological Cross Section Pit to P102

SECTION 2
Hydrogeologic Setting
13
Measured pressure heads and calculated intermediate pressure heads derived from the multi-level
piezometer data were used to construct these cross-sections. The solid red lines on Figures 10 to 12
represent the estimated contact between the upper flow system in the younger volcanic rocks and the
top of the low permeability weathered andesites. Elevation is shown as m RL on the vertical axis and
distance from Martha pit is shown on the horizontal axis.
Piezometers P90 to P92 (Figure 10) are indicated to be in a zone of horizontal flow through the younger
volcanic rocks, more or less normal to the plane of that part of the cross-section. Both vertical and
lateral pressure gradient components are indicated for the upper andesite.
The cross-section containing P93 to P95 (Figure 11) also appears to have mainly horizontal flow in the
younger volcanic rocks but with a vertical component indicated. Within the weathered low permeability
andesite, vertical pressure gradients predominate. Dry areas are indicated at depth within the andesite
rockmass.
The third cross-section (Figure 12) shows the andesite rockmass to extend much closer to the surface at
this location, possibly as a result of faulting. Vertical gradients with a minor horizontal flow component
are indicated in the shallow younger volcanic rocks. Strong vertical gradients reflecting the low
permeability of the weathered andesite are indicated, with dry conditions present a short distance
below the contact.
From P100 to the pit the phreatic surface slopes indicating discharge at the outcrop contact between the
ignimbrites (younger volcanics) / andesite in the pit or to the Milking Cow Block Cave.
When comparing the three cross sections, the dewatered condition (zero pressure) appears to extend to
greater depth in moving from south (P100 – P102) to north (P90-P92).
Deep Groundwater System
- Andesite Rock
Andesite rock forms the local basement rock body for the area and hosts the mineralisation. The
andesite rocks were formerly exposed at the surface where the weathering profile developed that
perches groundwater in the overlying younger materials and acts as the transition zone between
groundwater in the andesite and the shallower groundwater systems. This transition zone is indicated to
extend up to 24 m or more in thickness (P102). Within the upper part of the unweathered andesite
(above about 700 m RL to approximately 1000 m RL), fracturing is more widespread due to relaxation of
the rockmass. With increasing depth, the density and aperture of the fractures reduces, resulting in
lower permeability.
Table 1 includes assessed aquifer hydraulic properties for the andesite groundwater system. Overall, the
andesite rockmass is of low permeability due to the low density of fractures in most areas. Exceptions to
this occur where post-mineralisation faulting has taken place, known to result in fracture zones of higher
permeability. Vein systems and associated fracturing provide planar zones of higher permeabilities
within the rockmass. The contrast between rock mass permeability and vein zone permeability is
marked by full and rapid water losses from investigation drill holes when vein and associated fracture
zones are intercepted.
Groundwater levels in the andesite rocks are influenced by current mine dewatering. This is evident in
Figures 10 to 12 where water levels in the veins and interconnected features are at approximately 770 m
RL but were at higher elevations elsewhere in the andesite rockmass. Groundwater levels and directions

SECTION 2
Hydrogeologic Setting
14
are controlled by the presence and interconnections (where they occur) of the workings, vein systems
and post mineralisation structures (faults and fracture zones).
The extent of dewatering in the andesite rock mass is limited in spatial extent due to low rock mass
permeability. To the north and west the extent of the dewatering effect is understood to be limited by
faulting which act as hydraulic barriers to groundwater flow. A restricted area of dewatering is observed
to the south west that is considered to be due to drainage along north-south oriented vein structures.
Dewatering effects are noted to reduce further east in the Martha and associated ore bodies as these
structures terminate. To the south east a wide area of dewatering is noted to occur which extends
throughout the Martha ore bodies that encompasses the Trio and Correnso vein systems. This pattern
of dewatering is a function of the high degree to which these systems are connected via workings, veins
and faulting.
As set out at the beginning of this document, the Martha and Martha East ore bodies, while still part of
the same wider groundwater system, form a separate hydrogeological domain from the Waihi East ore
bodies that incorporate the Favona and Moonlight vein systems. Around the Waihi East ore bodies the
pattern of dewatering in the andesite rock is limited to the immediate surrounds of the country rock.
This disconnection is considered a function of the thick block of relatively competent andesite that
separates the localities, and the absence of cross cutting structures connecting it to the wider system.
While it is noted that there is limited natural connectivity between the Martha ore bodies and the Waihi
East ore bodies at this time, recent mining has excavated high level and low level cross cuts that now
connect the Favona mine to the Trio mine, thereby connecting the Martha and Waihi East groundwater
systems.
- Vein Systems
Epithermal vein systems occur as a result of ancient faulting or a series of faults where dilatent
movement has allowed the opening of fracture systems that enable thermal fluids at depth to rise. The
properties of epithermal vein systems are inherently variable, ranging from vuggy and cavernous to
dense and monolithic, often depending on the vertical location within the structure. Typically, it is
common to observe more open veins at shallower depths. The width of the veins can vary from small
scale to >20 m wide in places. The veins are generally sub-vertical and form as hanging wall deposits,
but may be sub-horizontal on footwall structures, depending on the structure and stresses involved.
Generally, the historical information shows that with increasing depth (below approximately 700 m RL)
the vein systems become narrower, tend to converge and become less open.
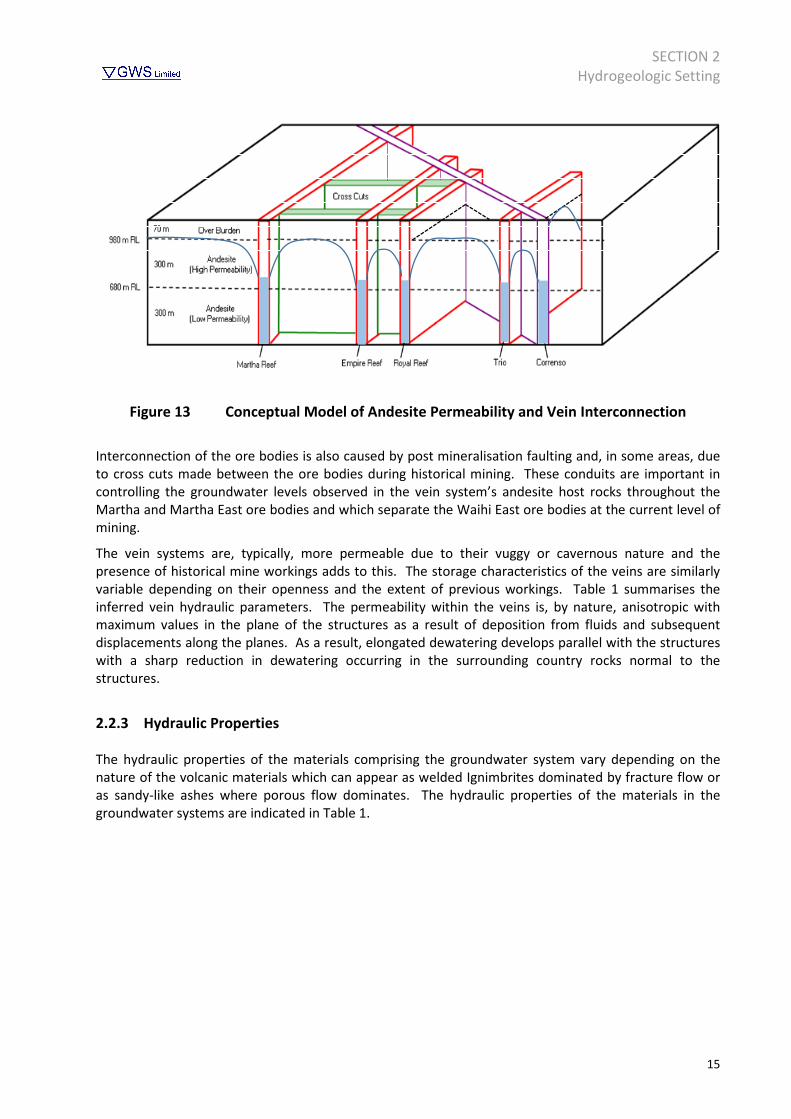
The Martha and Martha East ore bodies are highly interconnected due to their conjugate orientations
which means they cut through each other based on the various phases of formation (Figure 13).
SECTION 2
Hydrogeologic Setting
15
Figure 13 Conceptual Model of Andesite Permeability and Vein Interconnection
Interconnection of the ore bodies is also caused by post mineralisation faulting and, in some areas, due
to cross cuts made between the ore bodies during historical mining. These conduits are important in
controlling the groundwater levels observed in the vein system’s andesite host rocks throughout the
Martha and Martha East ore bodies and which separate the Waihi East ore bodies at the current level of
mining.
The vein systems are, typically, more permeable due to their vuggy or cavernous nature and the
presence of historical mine workings adds to this. The storage characteristics of the veins are similarly
variable depending on their openness and the extent of previous workings. Table 1 summarises the
inferred vein hydraulic parameters. The permeability within the veins is, by nature, anisotropic with
maximum values in the plane of the structures as a result of deposition from fluids and subsequent
displacements along the planes. As a result, elongated dewatering develops parallel with the structures
with a sharp reduction in dewatering occurring in the surrounding country rocks normal to the
structures.
2.2.3 Hydraulic Properties
The hydraulic properties of the materials comprising the groundwater system vary depending on the
nature of the volcanic materials which can appear as welded Ignimbrites dominated by fracture flow or
as sandy-like ashes where porous flow dominates. The hydraulic properties of the materials in the
groundwater systems are indicated in Table 1.

SECTION 2
Hydrogeologic Setting
16
Table 1 Aquifer Hydraulic Properties
Hydraulic Conductivity Storativity
Material Max (m/s) Min(m/s) Geomean (m/s) Max Min
Shallow Aquifers
Ash / Alluvium 1 x 10⁻⁴
1 x 10⁻⁷
0.3 0.1
Ignimbrite 1 x 10⁻⁵
1 x 10⁻⁸
0.01 0.001
Rhyolitic Tephra 1 x 10⁻⁶
1 x 10⁻⁷
0.1 0.05
Deep Aquifer
Andesite Surface 3 x 10⁻⁵
2 x 10⁻⁶
5 x 10⁻⁶
0.3 0.1
Andesite to 50 m Depth 7 x 10⁻⁹
6 x 10⁻⁹
0.01 0.005
Andesite to 100 m Depth 6 x 10⁻⁷
6 x 10⁻⁹
3 x 10⁻⁸
0.01 0.005
Andesite 1 x 10⁻⁵
1 x 10⁻⁸
0.05 0.001
Un-Mined Vein 1 x 10⁻³
1 x 10⁻⁷
0.05 0.01
Generally, the materials that form the shallower groundwater systems are of higher permeability and
storage.
SECTION 3
Mine Dewatering
17
3. Mine Dewatering
3.1 Historic Workings
Mining of the Martha ore bodies commenced in 1878 with a series of open cut operations at the
elevated location of Martha Hill where gold could be extracted above the water table. Dewatering
began once the water table was reached (1110 m RL; 1893) and progressed at a relatively steady rate
of approximately 18 m/year depth. Later mining of the Martha veining and other prospects to the east
of the Martha Mine required the sinking of shafts to access the ore body at depth. In the Martha ore
bodies the deepest documented shaft was the Waihi No 5 shaft that extended to a depth of 557 m RL
(mine datum). The other workings along the Martha veins to the east were recorded to have reached
a depth of 541 m RL.
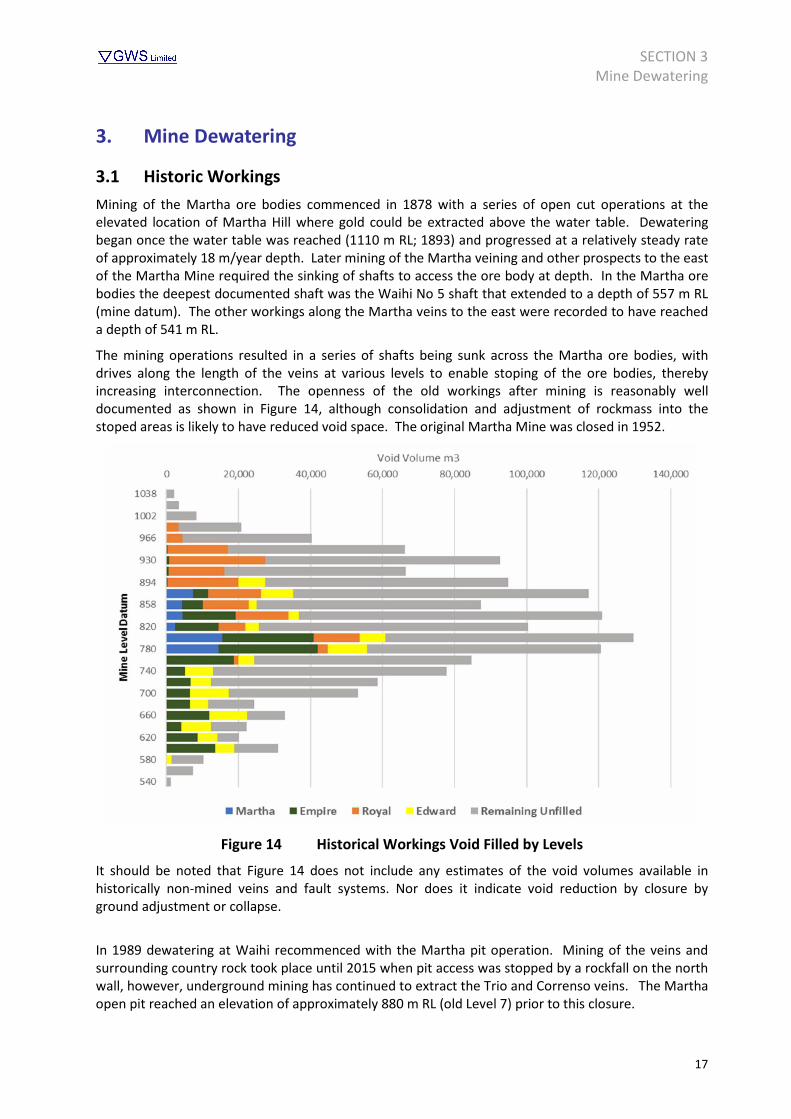
The mining operations resulted in a series of shafts being sunk across the Martha ore bodies, with
drives along the length of the veins at various levels to enable stoping of the ore bodies, thereby
increasing interconnection. The openness of the old workings after mining is reasonably well
documented as shown in Figure 14, although consolidation and adjustment of rockmass into the
stoped areas is likely to have reduced void space. The original Martha Mine was closed in 1952.
Figure 14 Historical Workings Void Filled by Levels
It should be noted that Figure 14 does not include any estimates of the void volumes available in
historically non-mined veins and fault systems. Nor does it indicate void reduction by closure by
ground adjustment or collapse.
In 1989 dewatering at Waihi recommenced with the Martha pit operation. Mining of the veins and
surrounding country rock took place until 2015 when pit access was stopped by a rockfall on the north
wall, however, underground mining has continued to extract the Trio and Correnso veins. The Martha
open pit reached an elevation of approximately 880 m RL (old Level 7) prior to this closure.
SECTION 3
Mine Dewatering
18
Given the proposal to mine to 500 m RL, old mine workings will be encountered to a depth of 541 m
RL. Dewatering of the veins and workings will be required to reach the target mine depth. Inflows will
be from storage within the workings, veins and the rockmass. In addition, rainfall infiltrating the base
of the pit will report to the Martha Underground during mining. Small pockets of perched
groundwater may also be encountered in old mine workings. Below 550 m RL previously un-mined
veins are expected, so only water from the veins, rockmass and Martha Pit will be removed.
3.2 Historic Dewatering
Dewatering of the Martha ore bodies was problematic during former mining. Limitations in pumping
technology meant that groundwater inflows impeded the access to reserves at increasing depth.
Relatively good records of pumped volumes of water were kept after 1900 and the average daily
inflows relative to shaft depth are included in Figure 15. As shaft depths increased, periods of high
initial groundwater inflows were experienced reaching some 9000 m3/d. The water levels in the mine
and shafts between Levels 6 and 11 (950 to 730 m RL) were stated to have been pulled down after
several months of pumping at a rate of 13,000 m3/d, which reduced to between 4,900 and 6,500 m
3/d
over time. Peak inflows were noted to occur immediately after accessing the veins at a new level. It
was reported by the Chief Engineer in 1912 (McAra J.B, 1988) that inflows at Level 10 (780 m RL) were
estimated to be 26,000 m3/d when first cut. In the 1920’s and 1930’s the mine was expanded along
strike between Levels 13 and 15 (650 to 557 m RL) and groundwater inflows stabilised to 4,200 m3/d.
This rate of pumping was considered “normal” for the Martha mine. It was noted that the inflows
reduced from Level 11 to Level 15 (730 to 550 m RL) and was thought to reflect the narrower and less
cavernous lodes and tighter country rock.
There were a number of occasions, historically, where pump failures or shut downs occurred that
resulted in recovery of the water levels within the mines. In 1912, as a result of a miners’ strike, the
water level rose 45 m over a period of 68 days from 728 m RL to 773 m RL. And in 1945 and 1949 the
water level rose 30 to 40 m from 678 m RL to 708-718 m RL over the period of one year.
After the closure of the historical mines the old workings were collapsed locally and allowed to fill with
water, thereby forming the depression of what became the Martha Lake. The water level in the lake
recovered to an elevation of approximately 1110 m RL which reflected the groundwater level through
the interconnected vein system.

SECTION 3
Mine Dewatering
19
Figure 15 Historical Martha Annualised Average Pumping Rates and Levels
SECTION 3
Mine Dewatering
20
3.3 Historic Dewatering Effects
There was little documentation recorded relating to environmental effects due to historical dewatering,
however, the extent of drawdown was estimated by Johnson in 1944 (in Groundwater Consultants NZ Ltd
1985) based on water levels measured in shafts. The map prepared showed an elongated cone of
depression that was some 1,000 to 1,500 m in radius.
No adverse effects on stream flows or ground settlement were reported following 60 years of dewatering.
The groundwater being discharged was noted to be of good quality being a dominantly bicarbonate type
water, with only minor acidic waters encountered locally.
3.4 Recent Mine Dewatering
Since the re-commencement of mining, dewatering has been a necessary part of the operation since 1989
in order to access the reserves. The Martha Open Pit operation required initial dewatering of the Lake and
then progressively from the workings as excavation advanced. Dewatering was undertaken until 2011
from the old No.7 shaft which is within the footprint of the mine. In 2011 three bores constructed from a
bench within the pit at 940 m RL (mine datum) were used for dewatering. In May 2015, pumping from
Correnso mine commenced. Figure 16 shows a schematic of the dewatering system for the underground
mining. Correnso water is pumped to the Trio decline and exits the underground at the Favona Portal to
discharge following treatment at the water treatment plant. Favona water is now pumped up the Trio
incline, lifted to the Trio Decline and, thence, to the Favona portal.
The water pumped from the underground comprises
• Water sourced from storage within the interconnected old workings, vein systems, and where
present, from post mineralisation faulting.
• Water released from groundwater storage in the surrounding country rock.
• Rainfall within Martha Pit catchment which enters the historical workings from the pit floor.

SECTION 3
Mine Dewatering
21
Figure 16 Mine Pumping Schematic
CORRENSO EMPIRE
350m
PORTAL
1010
995
980
965
950
935
920
SP6
997 DDC
953
936
977
DDC
983
988
924
DDC
948
DDC
RAR
NOT TO SCALE
915
Escapeway
120m
120m
900
350m
350m
350m
250m
400m
340m
250m
390m
1025
1050
940
928
912
920 DDR
890
905
Favona Decline
FAR
972
2 Pumps (what sort?)
953 SUMP - No Pump
3 Monos
3, 12, 11
938
952
966
Air/Diaphragm Pump
Mono Pump
Flygt Pump
SP Pump
794 Pump Station
Drain Holes
830 S
811 SPTrio Incline
800 S
828 ESC
825 N
807 N
788 N
815 S827 WS
795
810
825
840
823 Correnso Access
SP8
120m
120m
120m
465m
834
FAVONA TRIO
830 HW
765
794 Pump Station
780785
Correnso Decline
ED2
801
785
786
ED1
816
813
831
765
Dobson Decline
Gladstone Decline
844 Correnso Drill Drive
807
Empire Decline
815
800 SUPA Drive
823 Cribroom
150m
182m
52m
DDC7
846
844 Correnso Drill Drive
844
SP11
827 - 3 Monos
2, 4, 6
SP Pump
1 x 20kW Flygt
Mono Max Capacity 110L/s 6,600 L/min
Pump Station Max Capacity (1 Train) 120L/s 7,200 L/min
Pump Station Max Capacity (2 Trains) 180L/s 10,800L/min
37kW Flygt Pump 60L/s
20kW Flygt Pump
SP Pump
2 Monos
10, 5
1 x 37kW Flygt MT
2 SP Pumps - 787
SUMP
2 x 37kW Flygt
2 x 37kW Flygt1 x 37kW Flygt
1 SP Pump
1 x 20kW Flygt
1 x 37kW Flygt
1 x 37kW Flygt780 SUMP
845 S
860 S860 N
845 N863
881
889
895
855
870
350m
260m
845
860
Favona NorthDecline
Favona South Decline
Drain Holes to 827 Sump
885
875
905 908
917
899
885
260m
875
882
1 x 20kW Flygt

SECTION 3
Mine Dewatering
22
The groundwater response to dewatering at the Martha Pit and the underground mines has been
observed at a network of piezometers located around the Waihi area. It has been shown, over time, that
the vein systems of the Martha ore bodies (Martha, Empire, Royal, Trio and Correnso) are all highly
interconnected and are separated from the Waihi East ore bodies (Favona, Moonlight). As parallel
development of the underground mines and at the Martha Pit continued, it became apparent that
dewatering at Martha had the effect of dewatering the other vein systems. This was also known and
utilised historically.
Pumping records for the combined water take from the Martha and Correnso operations are included in
Figure 17 from 2003 to 2016. From 2003 to 2008 these data show high initial pumping rates (>7,000 m3/d)
as deepening of the mine took place and water levels were rapidly pumped down. From 2008 to 2010 a
stable volume of dewatering from 4,000 to 5,000 m3/d was reached, with these volumes consistent with
historical inflows. In 2010 the Trio underground mining operation commenced and, due to the
connectivity with other vein systems and the rate of mine development, the pumping rate increased to
greater than 15,000 m3/d as the water levels were rapidly being drawn down. From 2010 to 2015 these
volumes diminished until the pumping rate stabilised between 4,000 and 5,000 m3/d, reflecting inflow
from the rockmass plus rainfall infiltration via Martha pit. At this time dewatering of Trio was undertaken
by the 3 pumping bores located in the Martha Pit. When access to the pit stopped in 2015, dewatering
was relocated from the Martha vein system to the Correnso underground operation which dewaters the
Martha East associated ore bodies (Trio, Correnso etc.). The water levels within the vein systems in all of
the ore bodies are held approximately constant at the pumped level from wherever dewatering takes
place. As there is no direct hydraulic connection, groundwater from the Martha East (Trio/Correnso) and
Waihi East (Favona/Moonlight) underground operations are pumped separately to the Favona portal as
shown on Figure 16.
In 2015 and 2016 a gradual increase in pumped volumes is noted, and this is interpreted to be a result of
an increased rate of development to deeper levels resulting in further release of water from storage,
bringing the water level down from the 795 m RL. At this time, flows from the Martha East and Waihi East
mines were combined with the total discharge measured, and this showed as an increase in the discharge
from the mine. The resource consent for Correnso dewatering allows for the water level in the veins to be
pumped down to 700 m RL. This is expected to be achieved by the end of 2019. A further 200 m of
dewatering will be required to enable mining down to 500 m RL for the proposed Martha Underground
project. Historical workings will be dewatered to approximately 540 m RL after which un-mined veins will
be dewatered to 500 m RL. The proposed underground mine development will, therefore, require only a
further 40 m of dewatering below the depth to which previous dewatering has already taken place.
3.5 Observed Dewatering Effects
Aside from depressurisation in the andesite rockmass which has been observed through groundwater
monitoring, there has been only one incident of localised dewatering of the younger volcanics. This
occurred in 2012 when a geotechnical borehole, CGD008, was incompletely grouted through the
weathered andesite zone and this resulted in drainage of the shallow groundwater system in the younger
volcanics for a period. This drainage resulted in some ground settlement effects (EGL, 2018). The
drainage occurred rapidly and was of a reasonable magnitude and after re-grouting the groundwater level
recovered quickly in the younger volcanics. This pattern of response suggests the younger volcanic rocks
were of low storativity at this location. This occurrence was not, therefore, a direct result of mine
dewatering.

SECTION 3
Mine Dewatering
23
It is noted that there have been two sinkholes (1999 and 2001) that developed in young volcanic materials
since modern mining commenced. These collapses are known to be the result of unfilled shrink stopes in
the andesite that migrated through the younger volcanic rocks and to the ground surface through chimney
caving. There is no relationship between the development of these collapses and groundwater or
drainage effects in the younger volcanic rocks. At the location of the sinkholes, the younger volcanics
were dewatered by drainage into the pit and/or the milking cow (as shown in Figure 8). Groundwater
monitoring in the surrounding network of piezometers did not elude to such events taking place nor is
there evidence of these events having affected groundwater levels in the younger volcanics elsewhere.
Figure 17 Pumping Rates for Martha and Correnso from 2003 to 2016