Embed Size (px)
Citation preview
7/31/2019 Project Management Science
http://slidepdf.com/reader/full/project-management-science 1/19
E. K.., January 2005
Quantifying the Effects of Budget Management
on Project Cost and Success
Ed KujawskiEngineering Division
Lawrence Berkeley National LaboratoryE-mail: [email protected]: 510.486.6932
INCOSE Meeting – San Francisco Bay Area Chapter
January 11, 2005

7/31/2019 Project Management Science
http://slidepdf.com/reader/full/project-management-science 2/19
E. K.., January 2005
Outline
Based on E. Kujawski, M.L. Alvaro, W.R. Edwards, “Incorporating PsychologicalInfluences in Probabilistic Cost Analysis”, Systems Engineering Vol. 7, No. 3, 2004.
The cost overrun problem and its causes– (Organizational considerations), human behavior, modeling
A modified PCA– Level of analysis
–
Assessment of cost elements– Distribution Functions
– MAIMS principle
– Two-level correlation model
Analysis of a sample design/engineering project
Budget allocation, contingency management, and project cost Summary of key concepts– Comparison with other approaches
Future directions

7/31/2019 Project Management Science
http://slidepdf.com/reader/full/project-management-science 3/19
E. K.., January 2005
The cost-overrun problem
This observation is very insightful and still applicable today.
Common threads among the various “top 10” lists– Institutional and organizational culture
• Procurement process, management pressure, poor project definition
–
Real Vs. idealized human behavior• Psychology is relevant to economics,decision-making,management,...
The “100% rational” person is a theoretical model that differs from reality.
– Inadequate analyses - Today’s typical PCA • Ad-hoc data elicitation, improper distributions, omitted and/or limited
dependencies, omitted high risk events & decision points
Shift from deterministic to probabilistic approach is NOT silver bullet !
• Monte Carlo simulation is only a mathematical tool: GIGO.
– Poor management practices• Lack of appreciation of probabilistic concepts and psychological influences in
budget allocation and control of management reserve
Projects that come-in under cost do not necessarily deserve kudos.– They may have carried excessively safe budgets.
"Their judgment was based more on wishful thinking
than on sound calculation of probabilities.”
Thucydides, 431 B.C.E.

7/31/2019 Project Management Science
http://slidepdf.com/reader/full/project-management-science 4/19
E. K.., January 2005
Current project reality leads to costoverruns
Our approach models these causes and effects to obtainrealistic cost estimates and enhance project success.
Win project
H
Some leads wantsafe estimates
Low projectcost
estimates
P
Today's typicalPCA
Project costoverruns
P
Inadequateproject
management
H
Achieve technicalperformance
O
Managementwants to meet
scheduleH
Humanbehavior
O
Organization/Politics*
Legend
H
Optimism abouttechnolgy
Conflict
O
Managementpressure for low
estimates
Conflict
Conflict
P
Practices
* beyond scope

7/31/2019 Project Management Science
http://slidepdf.com/reader/full/project-management-science 5/19
E. K.., January 2005
Psychology can teach us much aboutcost overruns
Overconfidence– R&D folks are intrinsically optimistic about new technologies.
–
"For heaven's sake, Spread Those Fractiles! Be honest with yourselves! Admit what you don't know!" Alpert and Raiffa, 1982
Negative human behavior – MAIMS Principle– "Money Allocated Is Money Spent.“ C. Gordon, 1997
Task underruns are rarely available to protect against tasks overruns.Task overruns are passed on to the total project cost.
Mistakes of reason– “Too many details tend to cloud the big picture.”
Total project cost is not simply the sum of the individual cost elements.Project characteristics and risks are likely to affect multiple elements.
– “Implicitly trusting the most readily available information or anchoring too much on convenient facts.” Russo and Schoemaker, 1990 - Decision trap # 5
Realistic cost analysis requires a systems engineering approach.
A credible cost analysis needs to integrate psychological findingswith mathematically valid models and sound management techniques.

7/31/2019 Project Management Science
http://slidepdf.com/reader/full/project-management-science 6/19
E. K.., January 2005
Insight into structuring PCA
Consider n cost elements with uncertainty at WBS level-i
- Total project cost random variable
- Expect value
- Variance
Consider Independent cost elements
- Fictitious reduction of uncertainty Central limit theorem applies
- CT is a Gaussian normal distribution!
)()( n
j
jT C E C E
n
j
jT C C
1),(1
)](*)([*),()()( 2 / 1
ji
ji
j j ji
ji jT
C C Corr
C Var C Var C C Corr C Var C Var
nC E C Var T T / 1)( / )(
Do not subdivide project cost into too many bite-size pieces!
Sum of 10 identical cost elements
0.00
0.05
0.10
0.15
0.20
0.25
0.30
0.35
0.40
3,500 4,000 4,500 5,000 5,500
Cost, K$
P r o b a b i l i t y
d e n s i t y

7/31/2019 Project Management Science
http://slidepdf.com/reader/full/project-management-science 7/19 E. K.., January 2005
Direct Fractile Assessment (DFA)method
Subjective assessment of cost elements– DFA proven one of the most reliable and least bias-prone procedures for
eliciting uncertain quantities Experts provide 10th, 50th, and 90th percentiles
Calibrate percentiles
– Default correction for optimism: 10th 20th, 90th 80th
Selection of realistic and flexible PDFs - Criteria– C1. Fit 3 arbitrary percentiles
– C2. Finite lower range– C3. Infinite upper range with reasonable behavior
– C4. Physically meaningful and easy to estimate parameters
The DFA method with calibration and
3-parameter Weibull can provide cost credibility

7/31/2019 Project Management Science
http://slidepdf.com/reader/full/project-management-science 8/19 E. K.., January 2005
It’s the assessment!
Values of the input percentileshave a significant impact
Important to select PDFs that fitassessed percentiles– Use Crystal Ball or @Risk
Differences among fits whereexpert opinion is unreliable
0.00
0.10
0.20
0.30
0.40
0.50
300 400 500 600 700 800 900
Cost, K$
P r o b a b i l i t y d e n s i t y
W 10/50/90 W 20/50/80B 10/50/90 B 20/50/80
0%
20%
40%
60%
80%
100%
300 400 500 600 700 800 900
Cost, K$
C o s t p r o b a b i l i t y o f s u c c e s s
W 10/50/90 W 20/50/80
B 10/50/90 B 20/50/80
Distribution(fractiles*)
Mean
K$
SD^
K$
Weibull(10/50/90) 9
Weibull(20/50/80)
Beta(10/50/90)
Beta(20/50/80) 9
* 10/50/90: x10 = 382 K$, x50 = 421 K$, x90 = 499 K$
20/50/80: x20 = 382 K$, x50 = 421 K$, x80 = 499 K$.
f l P
7/31/2019 Project Management Science
http://slidepdf.com/reader/full/project-management-science 9/19 E. K.., January 2005
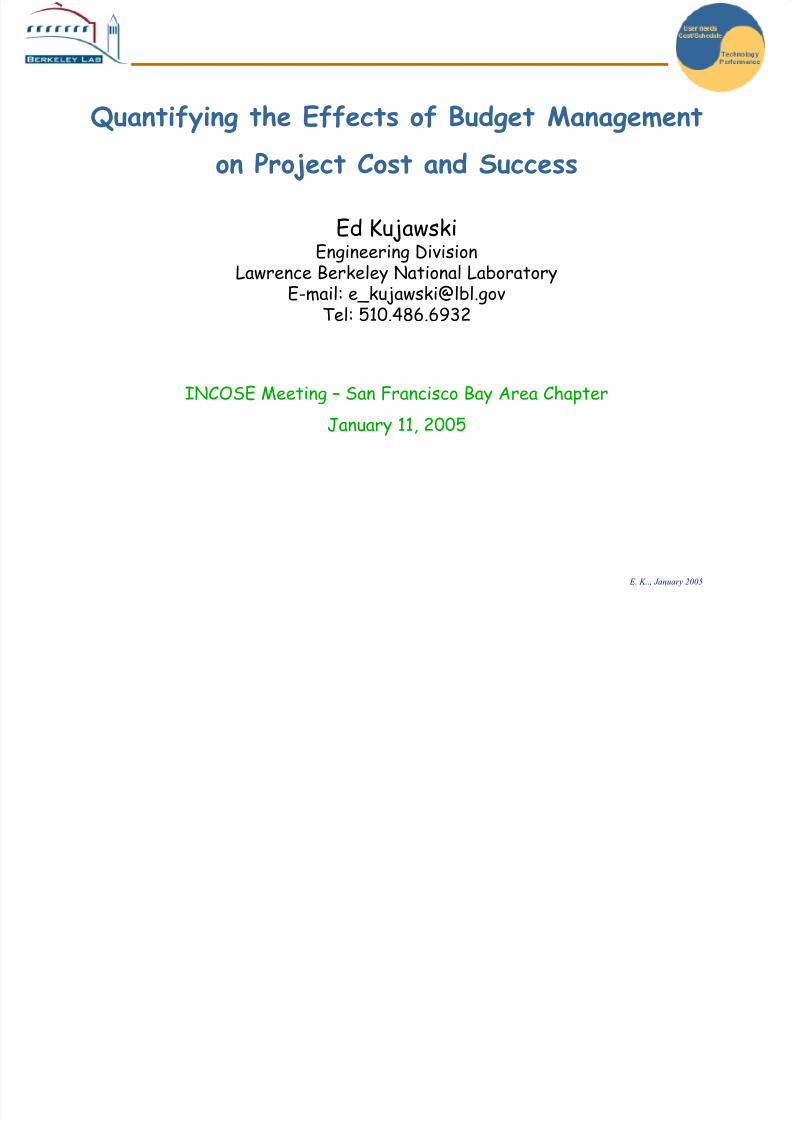
MAIMS significantly impacts PCA costelements
Illustration- Cost element with 3-parameter Weibull distribution
0.00
0.02
0.04
0.06
0.08
0.10
0.12
0.14
0.16
0.18
350 450 550 650
Cost, K$
P r o b a b i l i t y d e n s i t y
w WM@X50 WM@mean WM@X75
0.00
0.10
0.20
0.30
0.40
0.50
0.60
0.70
0.80
0.90
1.00
350 450 550 650
Cost, K$
P r o b ( < C o s t )
w WM@X50 WM@mean WM@X75
Allocated
budget
X*, K$
Mean,
K$
Perc. of
mean
SD,
K$
Ideal 448 63 85
mean = 448 479 75 66
X50 = 422 463 72 73
X75 = 482 502 81 55
X85 = 521 535 87 48
Properties of MAIMS-Modified distributions – Proper PDFs
– Minimum value: allocated budget, x*
– Modified Dirac delta function at x*– Identical to original cost element for values > x*
Not the same as Crystal Ball and @Risk truncated PDFs
MAIMS has a significant impact on PCA.Impact increases with increased budget allocation.

7/31/2019 Project Management Science
http://slidepdf.com/reader/full/project-management-science 10/19 E. K.., January 2005
A correlation model for dependencies atthe subsystem and system levels
There are multiple dependencies among cost elements– Within a given subsystem due to technical complexity and common staff
–
Among different subsystems due to common organizational and programmaticconsiderations
Consider cost elements Cm.j
- 1st and 2nd integers refer to WBS level 2 and level 3, respectively
» We model cost correlations based on Markowitz’s multi-factor model
Cm.j = Rm.j + m.j*Fm m.j are constants; Rm.j are independent random variables; Fm are correlated random
variables; Rm.j and Fn are independent
It can be shown Corr(Cm.j, Cn.k) = Corr(Fn, Fm)* m.j* n.k
Given the lack of data, we make the following assumptions
- Simplified Two-Level Correlation Model (STLCM) 1. Corr(Cm.j, Cm.k) = int for cost elements in the same subsystem
2. Corr(Cm.j, Cn.k) = ext for cost elements in different subsystems
3 int > ext
Important interrelationships in TLCM: system complexities,staff, organizational and programmatic influences

7/31/2019 Project Management Science
http://slidepdf.com/reader/full/project-management-science 11/19 E. K.., January 2005
Illustrative Analysis
Sample design/engineering project
WBS Cost Elements
Estimated Percentiles
K$
X10 X50 X90
1.0 Total project/system, CT
1.1 Project/system-level, C1
1.1.1 Project managem ent, C1.1 382 421 499
1.1.2 Systems engineering, C1.2 220 232 257
1.1.3 Integration & test, C1.3 887 1,010 1,256
1.2 Subsystem X, C2
1.2.1 Mechanical components, C2.1 970 1088 1,323
1.2.2 Electrical components, C2.2 742 846 1,054
1.2.3 Integration & test, C2.3 596 724 980
1.3 Subsystem Y, C3
1.3.1 Software development , C3.1 1,069 1,282 1,708
1.3.2 Firmware, C3.2 634 743 961
1.3.3 Integration & test, C3.3 541 656 886
Procedure 1. Establish CWBS
2. Assess cost elements» Direct fractile assessment method
• 3 percentiles
• engineering judgment, experience,& available data
3. Calibrate estimates
4. Fit estimates
» Three-parameter Weibull
5. Allocate budget to each cost element
6. Modify each cost element for MAIMS
7. Model correlation among cost elements
» Two-level correlation model
8. Perform Monte Carlo Simulation
9. Establish PoS10. Determine total cost & contingency
» Modified PM approach
B d t ll ti i t j t

7/31/2019 Project Management Science
http://slidepdf.com/reader/full/project-management-science 12/19 E. K.., January 2005
Budget allocation impacts projectcost and probability of success
Ideal Project - “100% rational” team
- Each cost manager spends money onlyas necessary to satisfy requirements
- Savings are available to support othercost elements on an as-needed basis
Actual costs may be less thanbudgeted costs
Real Projects- Human behavior and organizational
considerations- MAIMS principle
- Budget and contingency managementare important confounding factors
Effects increase with higherallocated budgets and are
substantial
A t l f j t t

7/31/2019 Project Management Science
http://slidepdf.com/reader/full/project-management-science 13/19 E. K.., January 2005
A tale of a project cost overrun(1 of 2)
1. Agency X issues a RFP- Requests cost at 50% CL
2. Contractor A prepares bid possesses limited sophistication;
but not cognizant of MAIMSprinciple
- Develops CWBS- Performs today’s typical PCA
•
P50: 7,348 K$• Min: 5,633 K$
3. Contractor A submits bid of7,348 K$
Confident he will succeed. Thinkscost estimate has a 30% margin.
4. Contractor A is winner!
A t l f j t t

7/31/2019 Project Management Science
http://slidepdf.com/reader/full/project-management-science 14/19 E. K.., January 2005
A tale of a project cost overrun(2 of 2)
5. The project starts & budgets areallocated
- The practice is to baseline the Level-3elements at mean values• Baseline cost: 7,665 K$ But project bid is 7,348 K$!
6. Much time is spent reallocating andprorating budgets
- Budget cost elements at 50% CL • Baseline cost: 7,002 K$• Management reserve: ~ 5%
7. The outcome Everybody works very hard. But the
project runs out of budget and iscancelled.
EpilogueAnother project has succumbed to the MAIMS principle.
Today’s typical PCA models a mythical project.
Future RFPs, contracting agencies & contractors use proposed approach.
It’ NOT l i l ti

7/31/2019 Project Management Science
http://slidepdf.com/reader/full/project-management-science 15/19 E. K.., January 2005
It’s NOT your classical contingencyanymore!
Cost contingency depends on desired probability of success and costmanagement strategy
– MCC(PoS, PBC1,…,PBCn) = TEC(PoS, PBC1,…,PBCn) – PBC.
• MCC: Management Cost Contingency
• TEC: Total Estimated Cost
• PoS: Probability of Success
•
PBCi: Baseline Budget for Cost element Ci • PBC: sum over all cost elements.
» Management strategies and desired probabilities of success vary across businesscategories
Major differences with both deterministic practice and today’s typical PCA» MCC is NOT a fixed percentage of PBC
» MCC incorporates MAIMS principle and depends on the management strategy
» Interactive and iterative process: system analysts, engineers, management
C ti t &

7/31/2019 Project Management Science
http://slidepdf.com/reader/full/project-management-science 16/19 E. K.., January 2005
Realistic budget allocation, adequate contingency, and dynamic allocationare critical to optimal cost and probability of success
Contingency, cost, & successare NOT directly related
High cost NEED NOT provide (1) high PoS or CL and/or (2) high contingency
Low contingency DOES NOT necessarily equate to low cost
High contingency DOES NOT necessarily equate to high cost and/or padding
5,500
6,000
6,500
7,000
7,500
8,000
8,500
9,000
9,500
10,000
10,500
0% 10% 20% 30% 40% 50% 60% 70% 80% 90% 100%
Confidence Level of Total Estimated Cost
T o t a l E s t i m a t e d C o s t , K $
0%
10%
20%
30%
40%
50%
60%
M a n a g e m e n t C o s t C o n t i n g e n c
y
TEC MAIMS_@_mean TEC MAIMS_@_75 TEC MAIMS_@_50 TEC Ideal
MCC MAIMS_@_mean MCC MAIMS_@_75 MCC MAIMS_@_50
Different representation of data in previous figure
Th m f di f t
7/31/2019 Project Management Science
http://slidepdf.com/reader/full/project-management-science 17/19 E. K.., January 2005
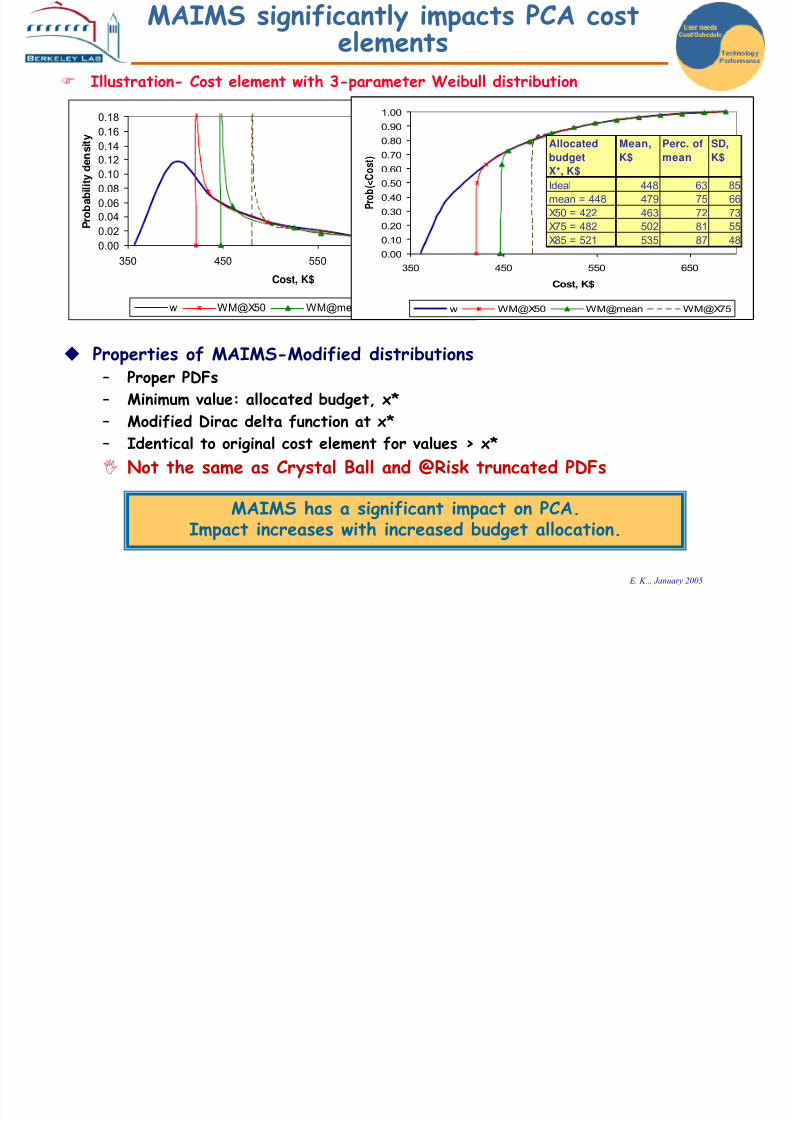
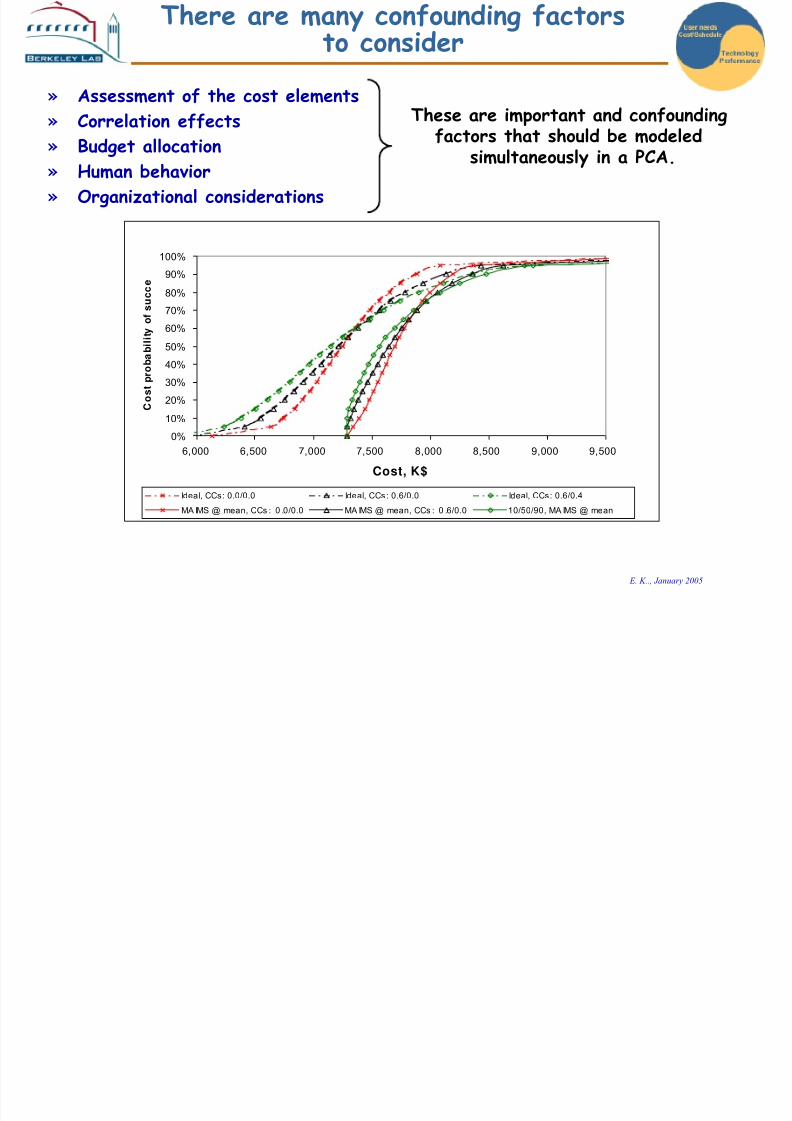
» Assessment of the cost elements
» Correlation effects
» Budget allocation» Human behavior
» Organizational considerations
There are many confounding factorsto consider
These are important and confounding
factors that should be modeledsimultaneously in a PCA.
0%
10%
20%
30%
40%
50%
60%
70%
80%90%
100%
6,000 6,500 7,000 7,500 8,000 8,500 9,000 9,500
Cost, K$
C o s t p r o b a b i l i t y
o f s u c c e
Ideal, CCs: 0.0/0.0 Ideal, CCs: 0.6/0.0 Ideal, CCs: 0.6/0.4
MA IMS @ mean, CCs : 0 .0/0.0 MA IMS @ mean, CCs : 0 .6/0.0 10/50/90, MA IMS @ mean

7/31/2019 Project Management Science
http://slidepdf.com/reader/full/project-management-science 18/19 E. K.., January 2005
Our approach integrates many key concepts
Critical Chain1
RACM2
Today's Typical
PCA
Proposed Approach
Parameter Schedule Cost Cost Cost
Assessment of
uncertainty
- "Realistic" task
schedule = "Safe"
estimate/2
- Gaussian normal
PDFs
- Largely ad-hoc
- Extensive use of
triangular PDFs
- 3 percentiles using DFA
method
- 3-parameter Weibull
- Human
behavior
-Organizational
influences
- Parkinson' s law
- Safe estimates
- Multi-tasking
- MAIMS
- "Hidden"
incentives
"Ideal" project
& "100%
rational" person
- Calibrate cost elements
- Psychological findings
- MAIMS principle
Correlations Basic task
dependencies
None Limited, single
parameter model
Two-level correlation
model
Calculation
method
Deterministic, single-
point estimate
- Analytical/
statistical sum
Monte Carlo
simulation
Monte Carlo simulation
Project
management
- Project buffer
- Feeding buffers
- Project buffer: 25%
of original estimate
- Baseline budget
- Management
reserve
- Statistical costcontrol
- Cost account
level and/or
management
reserve
- Baseline budget
- Management reserve
- Dynamic allocation
1Goldratt's basic approach; numerous variations have been proposed
2C. Gordon, Risk Analysis and Cost Management, Lockheed 1990's

7/31/2019 Project Management Science
http://slidepdf.com/reader/full/project-management-science 19/19
Future directions
Presented work focused on cost and macroscopic perspective– it provides a framework for more accurate predictions
– it results in more realistic expectations– benefits are likely to be significant
• more viable plans, better decisions, reduction in cost overruns.
Much remains to be done– integrate microscopic and macroscopic approaches
– simultaneously treat performance/cost/schedule
– quantitative calibration of data elicitation - single and multiple experts
Greatest challenge- implementation of systems thinking at the personnel,organizational and institutional levels- tool to dynamically adjust budget and modify negative behavior
- SE research to deal with psychological findings on human behavior and judgmentunder uncertainty
Proposed approach is worth the additional effort!