Embed Size (px)
Citation preview
PROJECT MANAGEMENT
STUDY GUIDE
PROGRAMME : MBA Final Year
CREDIT POINTS : 20 points
NOTIONAL LEARNING : 200 hours over 1 semester
Copyright© 2013
MANAGEMENT COLLEGE OF SOUTHERN AFRICA
All rights reserved, no part of this book may be reproduced in any form or by any means, including photocopying machines, without the
written permission of the publisher
REF:PM 2013

Project Management
MANCOSA – MBA Final Year 2
Project Management
MANCOSA – MBA Final Year 3
AIMS OF THE MODULE
The broad aims of this module are to:
Provide an overview of the concepts and techniques used in generic project
management.
Equip the learner with specific knowledge on effective management of the
constraints in project management, namely scope, cost, quality and time.
Enable the learner to apply common techniques and tools used in project
management to manage scope, time, cost and quality.
Equip the learner with leadership skills to ensure proper management of human
resources in project management.
Ensure learners are familiar with project resource management, including project
financial management.
Provide knowledge on tools and techniques to ensure effective project
communication and risk management.
Project Management
MANCOSA – MBA Final Year 4
OUTCOMES OF THE MODULE
Upon completion of this programme, students should be able to:
Understand and apply generic project management concepts and definitions.
Understand the significance and impact of and relationship among the constraints in a
project environment.
Demonstrate an understanding of the use of common tools and techniques used in the
different stages of a project life cycle.
Effectively apply common project management tools and techniques, such as Work
Breakdown Structures, Gantt charts, Network diagrams and Critical Path Method, to
manage project scope and time.
Demonstrate an understanding of potential project resource problems, and apply project
tools to alleviate these problems.
Apply communication and risk management tools and techniques in a project
management environment.
Demonstrate an understanding of leadership expertise required to successfully manage
and lead project teams, and to network with various project stakeholders.
Understand project quality concepts, and apply tools used to monitor and improve
project quality at different stages of the project life cycle.
Each section of the module has a more detailed list of outcomes.
Project Management
MANCOSA – MBA Final Year 5
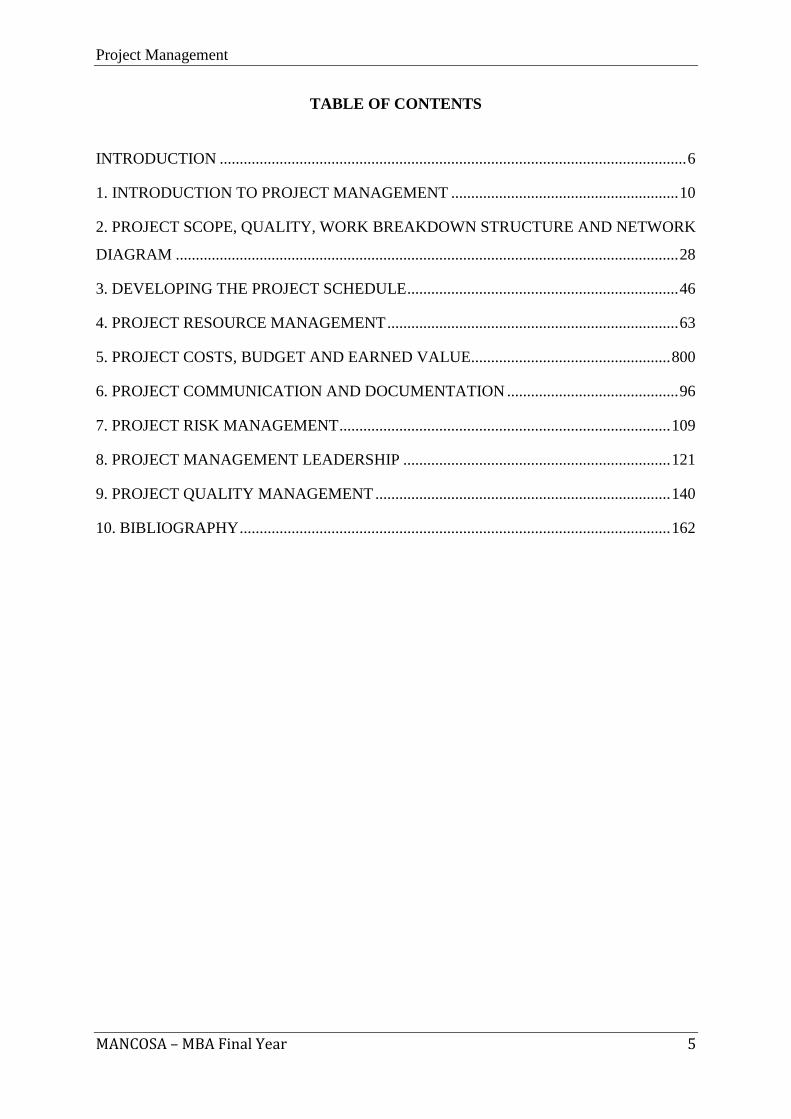
TABLE OF CONTENTS
INTRODUCTION ..................................................................................................................... 6
1. INTRODUCTION TO PROJECT MANAGEMENT ......................................................... 10
2. PROJECT SCOPE, QUALITY, WORK BREAKDOWN STRUCTURE AND NETWORK
DIAGRAM .............................................................................................................................. 28
3. DEVELOPING THE PROJECT SCHEDULE .................................................................... 46
4. PROJECT RESOURCE MANAGEMENT ......................................................................... 63
5. PROJECT COSTS, BUDGET AND EARNED VALUE.................................................. 800
6. PROJECT COMMUNICATION AND DOCUMENTATION ........................................... 96
7. PROJECT RISK MANAGEMENT ................................................................................... 109
8. PROJECT MANAGEMENT LEADERSHIP ................................................................... 121
9. PROJECT QUALITY MANAGEMENT .......................................................................... 140
10. BIBLIOGRAPHY ............................................................................................................ 162

Project Management
MANCOSA – MBA Final Year 6
INTRODUCTION
Project Management
MANCOSA – MBA Final Year 7
1. Welcome
Welcome to the Master of Business Administration Final Year Programme. As part of your
studies, you are required to study and successfully complete this elective module on Project
Management.
2. Context of the Module
Project management is not uniquely confined to a specific context, and is a very adaptable
field that can be applied to the manufacturing and services sectors across various industries.
This module uses a variety of references so that students are to able apply the principles and
concepts of project management to various manufacturing and production, scenarios at local
and international facilities across most industries. The prescribed and recommended
textbooks provide useful examples and some cases studies which enable one to apply the
principles and concepts of project management in different contexts.
3. How to use this Module
This module should be studied using this Study Guide and the prescribed textbook. You
should read about the topic that you intend to study in the appropriate section of this Study
Guide before you start reading in detail in the prescribed and recommended textbooks.
Ensure that you make your own notes/summaries as you work through the textbooks, other
learning resources and this Study Guide.
At the commencement of each section of this Study Guide, you will find a list of
learning outcomes. These learning outcomes outline the main points that you should
understand when you have completed the section with its supporting chapters in the
prescribed textbooks. Avoid reading all the material at once. Each study session should be no
longer than two hours without a break.
As you work through the Study Guide you may come across:
• Think Points
• Activities
• Reading Activities
• Self Assessment Activities
• Study Group Discussion Activities
These are designed to help you study and prepare for the assignment and examination.
Project Management
MANCOSA – MBA Final Year 8
? THINK POINT
A think point asks you to stop and think about an issue. Sometimes you are asked to apply a
concept to your own experience or to think of an example.
ACTIVITY
You may come across activities which ask you to carry out specific tasks. The aim of these
activities is to give you an opportunity to apply what you have learnt and / or explore an issue
relevant to the particular section.
READING ACTIVITY
Some sections of this Study Guide contain a reading activity. The reading activity requires
that you read one or more of the recommended texts and then answer questions relevant to
that text / document. Some of the recommended texts are available from the Emerald library
facility and/or My Mancosa which learners may access via MANCOSA’s website.
SELF ASSESSMENT ACTIVITY
You may come across self-assessment questions which will test your understanding of what
you have learnt so far. You should refer to the Study Guide and prescribed textbooks when
attempting to answer the self-check activities.
STUDY GROUP DISCUSSION ACTIVITY
Study group discussion activities may be provided at the end of each section of
this Study Guide. You must have worked through the relevant section and supporting
chapters in the prescribed textbooks prior to meeting as a study group. The study group
discussion activities provide an opportunity for learners to apply what they have learnt, to
share experiences with fellow learners and to learn from each other.
Project Management
MANCOSA – MBA Final Year 9
4. Reading
• Prescribed Textbook
Several recommended readings are provided in each section of the module guide. However,
the textbook that has been prescribed for this module is:
Clements, J. P. and Gido, J. (2011). Effective Project Management. 5th
Edition.
Boston: Cengage Learning.
• Recommended Reading
Each section has a list of recommended reading material, which will allow you to develop an
understanding of the issues beyond the perspective of the prescribed textbook and Study
Guide. The following material is recommended in addition to the prescribed textbook:
Burke, R. (2009). Project Management Techniques. College Edition. Hampshire:
Burke Publishing.
Burke, R.J. and Barron, S. (2007). Project Management Leadership. Hampshire:
Burke Publishing.
Heizer, J. and Render, B. (2010). “Project Management” (Ch. 3) in Operations
Management. 10th
Edition. New Jersey: Pearson Education Inc.
PMI (2004). A Guide to the Project Management Body of Knowledge (PMBOK
Guide). 3rd
Edition. Pennsylvania: Project Management Institute.
Schwalbe, K. (2009). Introduction to Project Management. 2nd
Edition. Boston:
Cengage Learning.
5. Module Assessment
• Assignment: You will be required to complete and submit an assignment. This assignment
is assessed as part of your coursework. Therefore, it is very important that you complete it.
• Examination: A three-hour examination will be written at the end of the semester. The
assessment strategy will focus more on application of theory to practice.
Project Management
MANCOSA – MBA Final Year 10
SECTION 1
1. INTRODUCTION TO PROJECT
MANAGEMENT
Project Management
MANCOSA – MBA Final Year 11
CONTENTS
Learning outcomes
Reading Material
1.1 Introduction
1.2 Definition and attributes of a project
1.3 Project constraints
1.4 The project life cycle
1.5 Summary of the project management process
1.6 Reasons for successful project management
1.7 Conclusion
Project Management
MANCOSA – MBA Final Year 12
Learning Outcomes:
The overall outcome for this section is that, on its completion, the learner should be able to
demonstrate a basic understanding of the field of project management. This overall outcome
will be achieved through the learner’s mastery of the following specific outcomes, in that the
learner will be able to:
1. Understand the definition and attributes of project management.
2. Explain the project constraints and project environment model.
3. Clearly explain the project life cycle in project management.
4. Provide a summary of the project management process.
5. Discuss the reasons for successful project management.
Project Management
MANCOSA – MBA Final Year 13
Reading Material:
READING
Prescribed reading:
Clements, J. P. and Gido, J. (2011). Effective Project Management. 5th
Edition. Boston:
Cengage Learning.
Recommended reading:
Heizer, J. and Render, B. (2010). “Project Management” (Ch. 3) in Operations Management.
10th
Edition. New Jersey: Pearson Education Inc.
PMI (2004). A Guide to the Project Management Body of Knowledge (PMBOK Guide). 3rd
Edition. Pennsylvania: Project Management Institute.
Schwalbe, K. (2009). Introduction to Project Management. 2nd
Edition. Boston: Cengage
Learning.
Pycraft, M., Singh, H., Phihlela, K., Slack, N., Chambers, S. and Johnston, R. (2010). Operations
Management. 2nd Edition. Cape Town: Pearson Education South Africa (Pty) Ltd.
Project Management
MANCOSA – MBA Final Year 14
1.1 Introduction
Project Management is the application of knowledge, skills, tools and techniques to satisfy
stakeholder expectations from a project (PMBOK Guide, 2004). According to Pycraft et al.
(2010:461), project planning and control is important because all managers will, at some
point, get involved in managing projects. Project management is also an essential skill for all
general managers as new strategies can only be implemented through the careful selection
and implementation of projects (Pycraft et al., 2010:461). Due to time-based competition and
a quality mandate in current business, the value of project management as a strategic asset is
realised.
READING ACTIVITY
Read the Case Study entitled “Feds and Contractor Share Blame for Afghan Plant Delays”
(Chapter 1, page 2) in Clements and Gido (2011). Identify the major pitfalls of the
contractors and subcontractors involved in the project. What could have been done more
effectively to avoid these problems?
1.2 Definition and attributes of a project
Clements and Gido (2011:4) define a project as an “endeavour to accomplish a specific
objective through a unique set of interrelated tasks and the effective utilisation of resources.”
Heizer and Render (2010:90) define a project as “a series of related tasks directed toward a
major output.” A project is a temporary endeavour undertaken to create a unique product, service
or result (PMBOK Guide, 2004). All projects have some elements in common and, according
to Pycraft et al. (2010:464), these include:
An objective. A definable end result, output or product, which is defined in terms of
cost, quality and timing.
Project Management
MANCOSA – MBA Final Year 15
Complexity. Several tasks are required to be undertaken to achieve the objectives. The
relationship between all these tasks can be extremely complex.
Uniqueness. A project is usually a one-off undertaking.
Uncertainty. As all projects are planned before they are executed, they carry a certain
amount of risk.
Life cycle. Projects normally go through three phases – planning, execution and
phase-out.
Temporary nature. Resources may be moved from one project to the next once the
tasks have been completed.
READING ACTIVITY
Read the section entitled “Project Attributes” on page 4 of Chapter 1 in Clements and Gido
(2011) and briefly describe each of the following project attributes:
1. Clear objective: ___________________________________________________________
__________________________________________________________________________
2. Interdependent tasks: _______________________________________________________
___________________________________________________________________________
3. Resource utilisation: _______________________________________________________
___________________________________________________________________________
4. Specific time frame: _______________________________________________________
___________________________________________________________________________
5. Unique or one-time endeavour: _______________________________________________
___________________________________________________________________________
6. Project sponsor or customer: _________________________________________________
___________________________________________________________________________
7. Degree of uncertainty: ______________________________________________________
___________________________________________________________________________
Project Management
MANCOSA – MBA Final Year 16
1.3 Project constraints
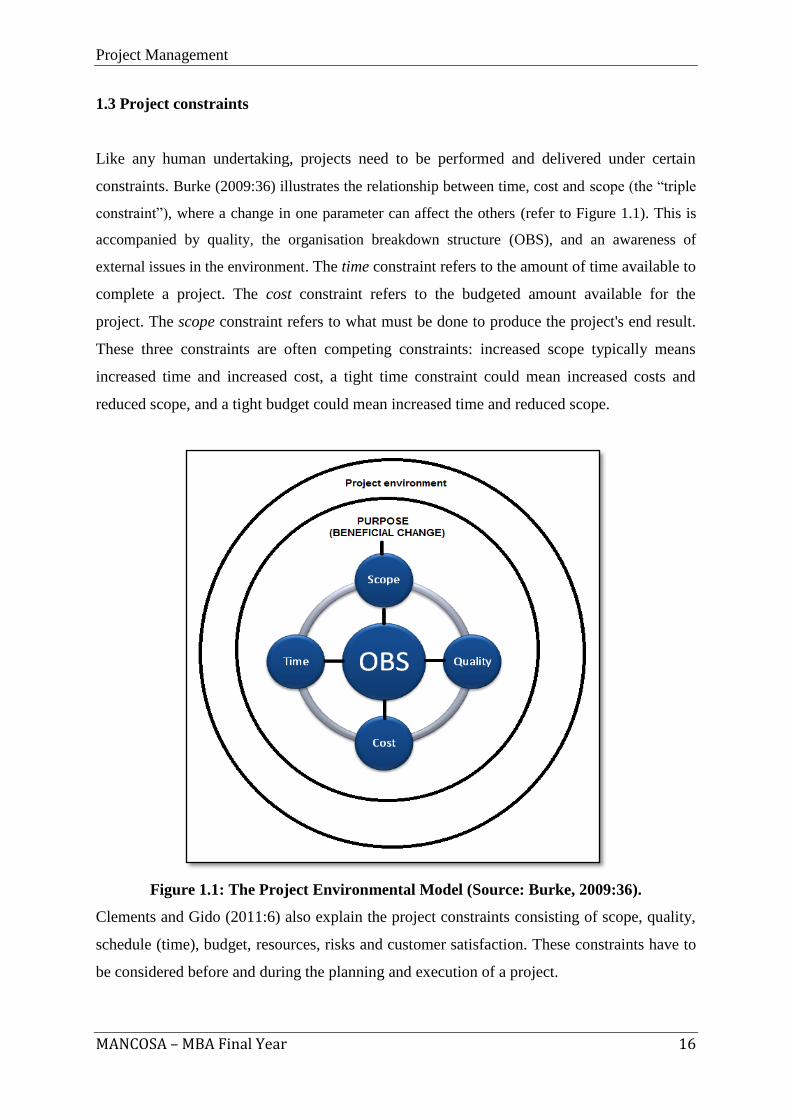
Like any human undertaking, projects need to be performed and delivered under certain
constraints. Burke (2009:36) illustrates the relationship between time, cost and scope (the “triple
constraint”), where a change in one parameter can affect the others (refer to Figure 1.1). This is
accompanied by quality, the organisation breakdown structure (OBS), and an awareness of
external issues in the environment. The time constraint refers to the amount of time available to
complete a project. The cost constraint refers to the budgeted amount available for the
project. The scope constraint refers to what must be done to produce the project's end result.
These three constraints are often competing constraints: increased scope typically means
increased time and increased cost, a tight time constraint could mean increased costs and
reduced scope, and a tight budget could mean increased time and reduced scope.
Figure 1.1: The Project Environmental Model (Source: Burke, 2009:36).
Clements and Gido (2011:6) also explain the project constraints consisting of scope, quality,
schedule (time), budget, resources, risks and customer satisfaction. These constraints have to
be considered before and during the planning and execution of a project.
Project Management
MANCOSA – MBA Final Year 17
1.4 The project life cycle
Project management is achieved by applying and integrating project management processes
which include: initiating, planning, executing, control and monitoring, and closing. These are
referred to as process groups and they dictate the life cycle of a project. Apart from process
groups there are knowledge areas, which are the backbone and knowledge base of project
management. The knowledge areas consist of project integration, scope, time, cost, quality,
human resources, communications, risk, and procurement management.
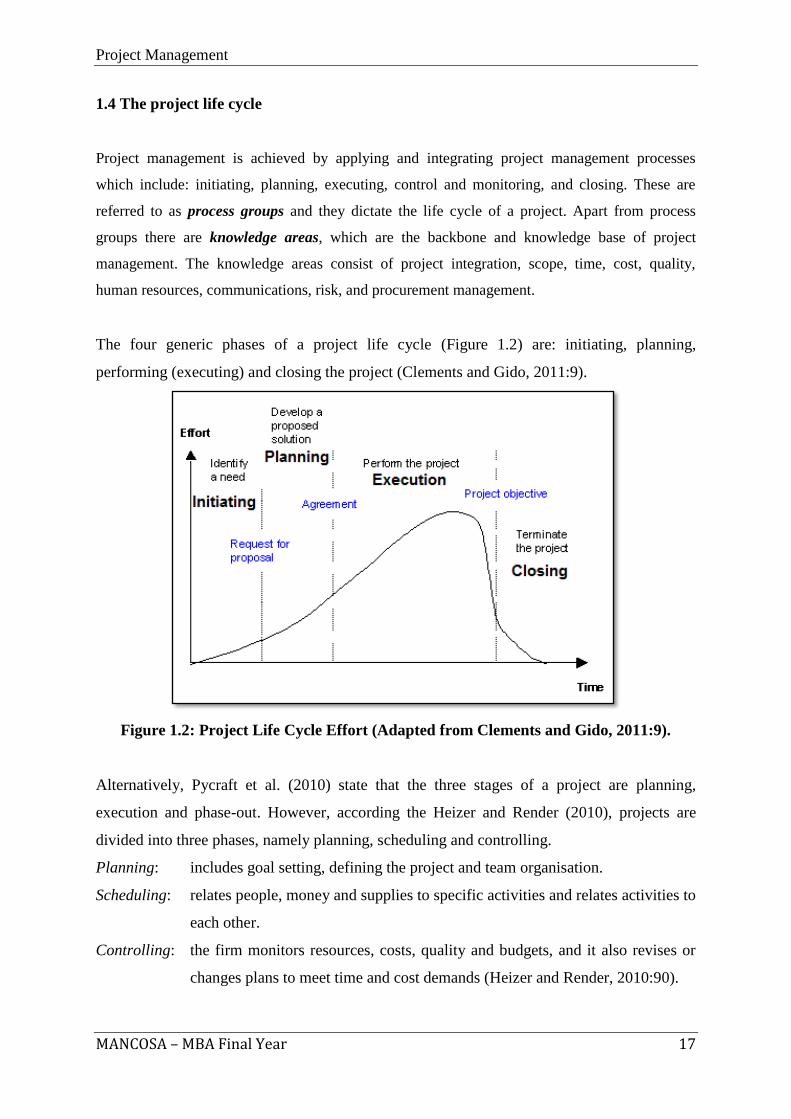
The four generic phases of a project life cycle (Figure 1.2) are: initiating, planning,
performing (executing) and closing the project (Clements and Gido, 2011:9).
Figure 1.2: Project Life Cycle Effort (Adapted from Clements and Gido, 2011:9).
Alternatively, Pycraft et al. (2010) state that the three stages of a project are planning,
execution and phase-out. However, according the Heizer and Render (2010), projects are
divided into three phases, namely planning, scheduling and controlling.
Planning: includes goal setting, defining the project and team organisation.
Scheduling: relates people, money and supplies to specific activities and relates activities to
each other.
Controlling: the firm monitors resources, costs, quality and budgets, and it also revises or
changes plans to meet time and cost demands (Heizer and Render, 2010:90).
Project Management
MANCOSA – MBA Final Year 18
ACTIVITY
You have been tasked with the construction of a house. Using the project life cycle
stages/phases, identify the activities that must be performed at each stage.
1.4.1 Project initiation
Projects are first selected based on the identification of a need, problem or opportunity. A
sponsor of a project usually identifies these needs and provides the funds necessary for the
project. Apart from the sponsor, a range of project stakeholders must also be identified in this
phase of the project. The following is a list of typical stakeholders in a project:
Project Sponsor – The person that provides the financial resources for the project.
Project Manager – The single point responsibility of a project.
PMO – The project management office provides support to the project.
Customer or user – This is the person or entity that will use the project’s product.
Project management team – the members of the project team who are directly
involved in executing the project management functions.
Influencers – People or groups who are directly or indirectly interested or affected by
the project. They can also influence the project positively or negatively.
Investors – A person or entity making the investment in a project.
Contractor – A contractor is normally the person or organization that is entrusted with
supplying the services and/or goods to achieve project deliverables.
Government – The government is in most cases a stakeholder in projects whether they
are public or private sector projects because it has an interest in the project, e.g.
collecting taxes.
Project Management
MANCOSA – MBA Final Year 19
1.4.1.1 Project Selection
Clements and Gido (2011:33) explain the following four steps in the selection of a project:
i. Develop a set of criteria against which the project will be evaluated. This must take
into account, inter alia, the company goals, sales volume and market share,
investment, risks, resources, competitors, regulations, etc.
ii. List the assumptions that will be used as the basis for each project.
iii. Gather data and information for each project.
iv. Evaluate each project against the identified criteria.
According to Schwalbe (2009), project selection may take place using one or more of the
following methods:
Focus on strategy and organisational needs
Performing a financial model
Using weighted scoring model
Implementing a balanced scorecard
Addressing problems, opportunities and directives
Considering project time frames, and
Considering project priorities.
1.4.1.2 Project Charter
Once a project is selected, it is formally authorised and primed using a project charter
(Clements and Gido, 2011). The project charter includes the rationale or justification for the
project and is usually the first official document that initiates a project.
ACTIVITY
Using the prescribed and recommended texts, identify the contents of a project charter and
draft such a document for a project of your choice. Hint: Refer to Chapter 2 of Clements and
Gido (2011:36-40) or Schwalbe (2009:90).
Project Management
MANCOSA – MBA Final Year 20
The typical contents of a project charter are:
Project title and date of authorisation
Background to the project
Key assumptions
Business needs and other commercial needs
Scope of work
Key milestones
Project scheduling including estimated start and finish dates
Project estimated budget
Approach
Roles and responsibilities of project team and project organisation.
1.4.1.3 Project Request for Proposal
A project that is outsourced requires the preparation of a Request for Proposal (RFP)
document, the contents of which are outlined below (Clements and Gido, 2011):
Project objective
Statement of Work (SOW)
Customer requirements
Deliverables
Acceptance criteria
Customer-supplied items
Approvals required by the customer
Type of contract the customer intends to use
Payment terms
Required schedule for completion of the project and key milestones
Instructions for the format and content of the contractor proposals
Due date for proposals
Evaluation criteria
Funds that may be available for the project
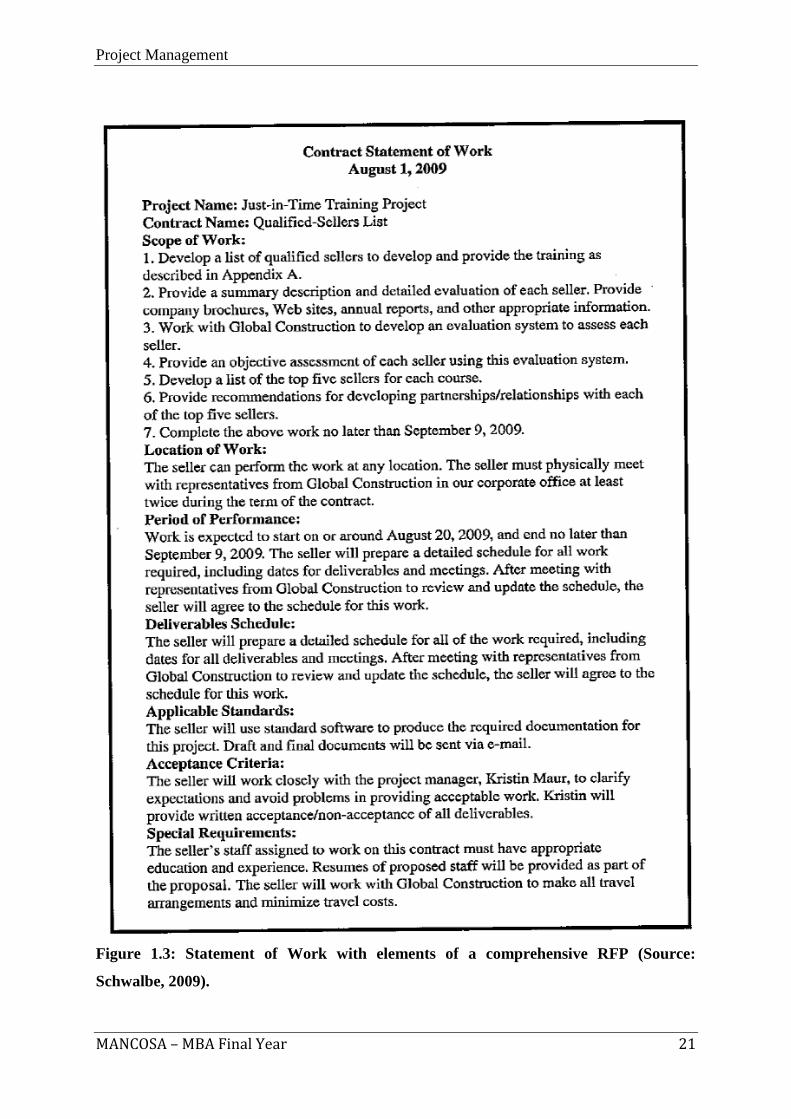
1.4.1.4 Project Statement of Work
Schwalbe (2009) illustrate a typical Statement of Work (Figure 1.3) which also includes
elements of a comprehensive RFP.
Project Management
MANCOSA – MBA Final Year 21
Figure 1.3: Statement of Work with elements of a comprehensive RFP (Source:
Schwalbe, 2009).
Project Management
MANCOSA – MBA Final Year 22
1.4.2 Project planning
The purposes of project planning are as follows:
It determines the cost and duration of the project.
It determines the level of resources that will be needed.
It helps to allocate work and to monitor progress (who is responsible for what).
It helps to assess the impact of any changes to the project (Pycraft et al., 2010).
Planning the project involves determining what needs to be done (scope, deliverables), how it
will get done (sequence of activities), who will perform it (human resources), how long it will
take (schedule), how much it will cost (budget) and what the risks are (Clements and Gido,
2011). These important considerations are generally included in a comprehensive project
proposal (Refer to Chapter 3 of Clements ad Gido, 2011).
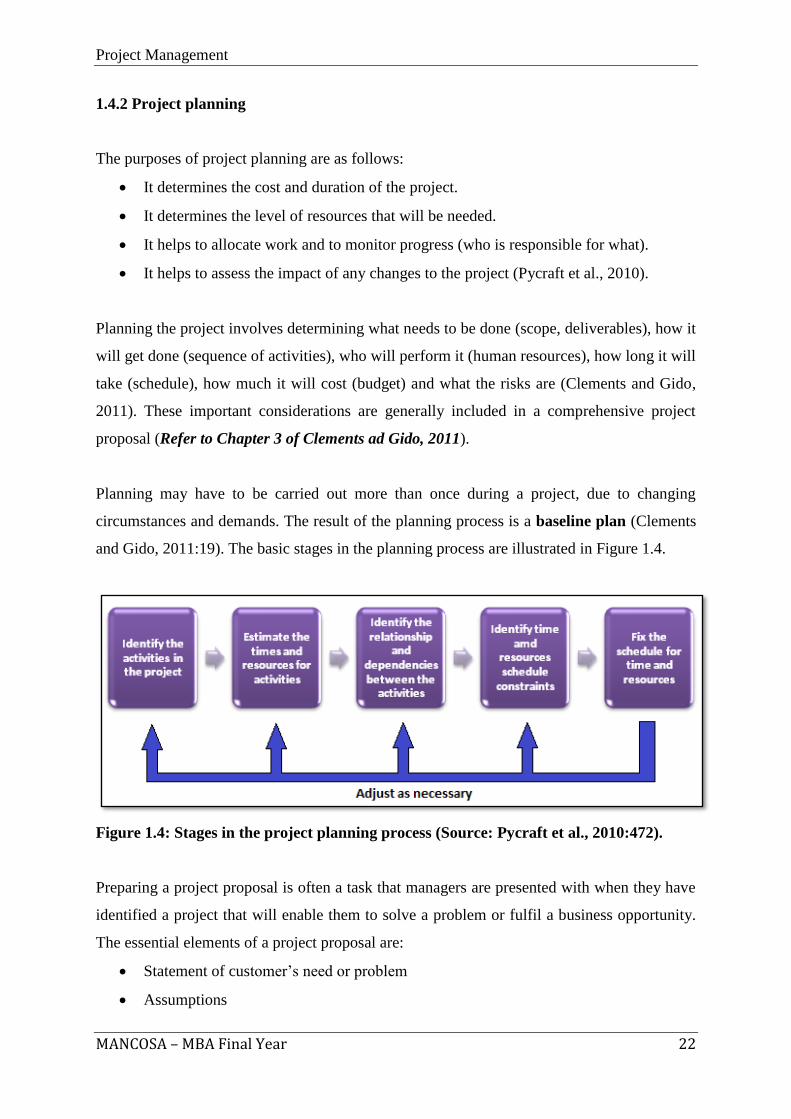
Planning may have to be carried out more than once during a project, due to changing
circumstances and demands. The result of the planning process is a baseline plan (Clements
and Gido, 2011:19). The basic stages in the planning process are illustrated in Figure 1.4.
Figure 1.4: Stages in the project planning process (Source: Pycraft et al., 2010:472).
Preparing a project proposal is often a task that managers are presented with when they have
identified a project that will enable them to solve a problem or fulfil a business opportunity.
The essential elements of a project proposal are:
Statement of customer’s need or problem
Assumptions
Project Management
MANCOSA – MBA Final Year 23
Project scope
Deliverables
Resources
Schedule of the project
Price considerations
Risks
Expected benefits
? THINK POINT
Suppose you were the sponsor of a large project involving the construction of a hotel. What
would be some of the critical success factors you would assess in the project proposal handed
over to you for evaluation and approval?
1.4.3 Project execution (performing)
After planning the project, the third phase involves the accomplishment of the project
objective(s) (Clements and Gido, 2011). The executing process group consists of the processes
used to complete the work defined in the project management plan to accomplish the project’s
requirements. The project team should determine which of the processes are required for the
team’s specific project. This process group involves coordinating people and resources as well as
integrating and performing the activities of the project in accordance with the project
management plan.
Project execution entails fulfilling the deliverables of the project within the client’s accepted
specifications and budget and time constraints. The function that matters most during this
phase is the monitoring and control of progress to ensure that everything is going according
to plan.
Project Management
MANCOSA – MBA Final Year 24
Key outputs of the executing process relating to the project integration management include:
project deliverables, requested changes, implemented change requests, implemented corrective
actions, implemented preventive actions, and implemented defect repair. Executing outputs
relating to project quality management include: requested changes, recommended corrective
actions, organizational process assets update, and updated project management plans. Executing
outputs relating to project human resources management knowledge area include: project staff
assignments, resource availability, updated staffing management plan and, team performance
assessment.
During this phase, monitoring and controlling project work involves collecting, measuring, and
disseminating performance information as well as assessing measurements and analyzing trends
to determine what process improvements can be made. On the other hand, performing integrated
change control involves identifying, evaluating, and managing changes throughout the project’s
life cycle. Every project will experience changes at one point or another. It is therefore important
to develop a process of monitoring controlling and documenting project changes.
1.4.4 Project closure
The closing process group is the most neglected project phase of all the phases in a project. This
phase includes processes used to formally terminate all the activities of the project or phase. The
project success or failure is evaluated and the project is handed over to the client. The project
experiences or lessons learnt are documented. Closing projects involves stakeholder and customer
acceptance of the final product or service, and bringing the project to an orderly end.
1.5 Summary of the project management process
According to Clements and Gido (2011), the project management process comprises the
following steps:
i. Establish project objective.
ii. Define the scope.
iii. Create a work breakdown structure (WBS) by subdividing the scope into pieces or work
packages.
iv. Assign responsibilities.
v. Define specific activities.
vi. Sequence the activities using a network diagram.
Project Management
MANCOSA – MBA Final Year 25
vii. Estimate activity resources.
viii. Estimate activity durations.
ix. Develop a project schedule.
x. Estimate activity costs.
xi. Determine the budget.
1.6 Reasons for successful project management
Pycraft et al. (2010:466) outline the following factors that can contribute to the success of a
project:
Clearly defined goals. This should include the general project philosophy or general
mission of the project and a commitment to those goals on the part of the project team
members.
Competent project manager. A skilled leader who has the technical, interpersonal and
administrative skills.
Top-management support. Senior management commitment to the project must be
openly displayed and communicated to all stakeholders.
Competent project team members. Careful selection of team members is vital.
Choose a ‘winning’ team.
Sufficient resource allocation. Money, labour, machines, materials and other
business related items must be available in the required quantities.
Adequate communication channels. Up-to-date information must be available to the
project team on a continual basis. Communication channels to the various role players
must be established.
Control mechanisms. A system to monitor actual events against planned outcomes
must be set up.
Feedback capabilities. All parties that are involved in the project must be able to
review the project status on a regular basis and make suggestions and corrections
through formal feedback channels or review meetings.
Responsiveness to clients. All stakeholders must be kept informed regularly on the
projects status.
Project Management
MANCOSA – MBA Final Year 26
Trouble-shooting mechanisms. Set up a system or a set of procedures to tackle
problems when they arise and the ability to trace back to the root cause of the
problem.
Project staff continuity. Key project personnel must be kept on for the duration of the
project. Frequent staff turnover results in the project losing the wealth of knowledge,
which may have been accumulated.
1.7 Conclusion
General managers often work closely with project managers in various projects within or
sometimes outside the organisation, and are therefore required to have an understanding of
project management and the techniques used in project planning and scheduling. Effective
project management also allows firms to create products and services for global markets.
However, project management techniques do not solve all project scheduling and
management problems, and for this, good management practices, clear responsibilities for
tasks, timely reporting systems and contingency plans are necessary.
The next section will deal with project scope and time management.
Project Management
MANCOSA – MBA Final Year 27
SELF ASSESSMENT ACTIVITY 1
Consider a project in which you are currently involved (or which you may be familiar with).
a) Describe the objectives, scope, schedule, cost and any assumptions made.
b) Where is the project in its life cycle?
c) Does the project have a baseline plan? If yes, describe it. If not, create it.
d) Are you or is anyone else monitoring the progress of the project? If so, how? If not, how
could you do so?
e) Describe some unexpected circumstances that could jeopardize the success of the project.
f) Describe the anticipated benefits of the project.
SELF ASSESSMENT ACTIVITY 2
Develop an RFP for a real-world project such as landscaping the grounds surrounding a
nearby business office, building a deck for your house, or holding a big graduation
celebration. Be creative in specifying your needs.
Project Management
MANCOSA – MBA Final Year 28
SECTION 2
2. PROJECT SCOPE, QUALITY, WORK
BREAKDOWN STRUCTURE AND NETWORK
DIAGRAM
Project Management
MANCOSA – MBA Final Year 29
CONTENTS
Learning outcomes
Reading Material
2.1 Introduction
2.2 Establishing the project objective
2.3 Defining the scope of the project
2.4 Planning for quality
2.5 Creating a Work Breakdown Structure
2.6 Defining activities
2.7 Activity sequence and network diagrams
2.8 Conclusion
Project Management
MANCOSA – MBA Final Year 30
Learning Outcomes:
The overall outcome for this section is that, on its completion, the learner should be able to
demonstrate an understanding of project scope, quality, responsibility and activity sequence.
This overall outcome will be achieved through the learner’s mastery of the following specific
outcomes, in that the learner will be able to:
1. Identify and describe the knowledge areas of project management.
2. Develop project objectives.
3. Define the scope of a project using tools such as the scope management plan,
scope statement (scope document), Work Breakdown Structure (WBS), and WBS
dictionary.
4. Explain in the detail the meaning and implications of scope creep.
5. Plan for quality and describe the costs of quality.
6. Create a Work Breakdown Structure and describe different approaches to do so.
7. Apply activity sequencing and create network diagrams for projects.
Project Management
MANCOSA – MBA Final Year 31
Reading Material:
READING
Prescribed reading:
Clements, J. P. and Gido, J. (2011). Effective Project Management. 5th
Edition. Boston:
Cengage Learning.
Heizer, J. and Render, B. (2010). “Project Management” (Ch. 3) in Operations Management.
10th
Edition. New Jersey: Pearson Education Inc.
Recommended reading:
PMI (2004). A Guide to the Project Management Body of Knowledge (PMBOK Guide). 3rd
Edition. Pennsylvania: Project Management Institute.
Schwalbe, K. (2009). Introduction to Project Management. 2nd
Edition. Boston: Cengage
Learning.
Project Management
MANCOSA – MBA Final Year 32
2.1 Introduction
The success of the outcome of a project depends largely on the project manager managing the
key components of scope, time, quality and staying within the set budget. Each project is
unique and therefore requires a project plan to guide its execution. There are numerous tools
at the project manager’s disposal in order to meet the desired project outcome. As mentioned
previously, project management includes four core knowledge areas:
Scope management
Time management
Cost management
Quality management
and five broader knowledge areas:
Integration management
Human resource management
Communications management
Risk management, and
Procurement management
Project scope management involves work with stakeholders to define, gain written agreement
on, and manage all work required for project success (Schwalbe, 2009:9). Burke (2009:116)
describes scope management as defining what the project will accomplish, what it will
deliver, what it will produce and where work packages start and finish. Project time
management includes estimating the length of time to completion, developing a schedule
with cost-effective use of resources and keeping the process on track to reach a timely
completion (Schwalbe, 2009:9).
This section deals specifically with:
Clearly defining the project objective
Preparing a project scope document
Understanding the importance of planning for quality
Creating a Work Breakdown Structure (WBS)
Defining specific activities
Creating a network diagram
Project Management
MANCOSA – MBA Final Year 33
2.2 Establishing the project objective
The project objective is the “tangible end product that the project team or contractor must
produce and deliver in order for the sponsor or customer to achieve the expected benefits
from implementing the project” (Clements and Gido, 2011:90). The elements of a project
objective are:
Expected benefits that will arise from the project (i.e. why the project is being done).
Primary project end product or deliverable(s)
Date by which the project needs to be completed
Budget within which the project must be completed.
? THINK POINT
Given the above elements of a project objective, can you come up with three examples of
project objectives? Also remember the acronym “SMART”!
-
-
-
2.3 Defining the scope of the project
Project scope management involves defining and controlling what work is or is not included in a
project. The main planning tasks include scope planning, scope definition and creating the WBS.
The main documents produced are a scope management plan, scope statement (scope
document), WBS and WBS dictionary (Schwalbe, 2009; Clements and Gido, 2011). A WBS
dictionary is a document that describes the actual tasks in detail, with the format differing
according to project needs. It could be a short paragraph describing each work package, or a
whole page describing all responsibilities, resources and costs. The scope management plan is a
synthesis which provides the roadmap for scope planning, i.e. it is a document that includes
descriptions of how the team will prepare the scope statement, create the WBS, verify completion
of the project deliverables, and control requests for changes to the project scope (Schwalbe,
2009). In this module, we will deal with the scope statement and WBS in greater detail.
Project Management
MANCOSA – MBA Final Year 34
The scope of the project defines what needs to be done (all the work that must be done to
achieve the deliverables). The project scope document (scope statement) includes many items
contained in the project charter but in much more detail (Clements and Gido, 2011:91). This
is a document to develop and monitor a common understanding of the project scope.
Preliminary scope statements are often created at the start, with a more detailed statement
prepared at a later stage. An initial scope statement at project initiation means that the project
team can discuss the work related to the project scope. A more detailed scope statement
develops at planning stages. There are often several versions with each one becoming more
detailed as the project progresses. They must all expand on the information provided in the
business case and project charter, or project mission (Schwalbe, 2009:94).
To improve accuracy and assign responsibility to key work areas, it is necessary to outline the
content of the project, how to approach it and how it could solve problems. It identifies all the
items of work required to complete the project, and subdivides the major project deliverables
into smaller, more manageable components (Burke, 2009:118). This helps to improve
accuracy and assign responsibility to the work packages.
2.3.1 Scope document contents
The contents of a scope statement vary according the project type, but they generally include
the product or service requirements and characteristics, a summary of all major deliverables
and the project success criteria. They could refer to other documents, such as specifications
for particular products, policies, procedures and standards. There should also be a process for
ensuring everyone agrees on scope throughout its cycle, and strategies for any changes
(Schwalbe, 2009:95). As more information becomes available and decisions are made that
affect project scope – the project team must update the scope statement. Different iterations
should be named accordingly so the versions can be referred to. A typical scope document
contains the following sections (Clements and Gido, 2011):
Customer requirements
Statement of Work (SOW): As discussed in Section 1, the SOW defines what the
project team or contractor will do.
Deliverables (products or outputs that the project team or contractor will produce.
Acceptance criteria
Project Management
MANCOSA – MBA Final Year 35
Work Breakdown Structure (WBS) (a hierarchical decomposition of the project work
scope into work packages that produce the project deliverables).
ACTIVITY
Outline the major work elements that the SOW might include.
[Hint: Clements and Gido ( 2011:93)]
2.3.2 Scope creep
The project scope document eventually establishes the baseline for any changes that may be
made to the scope during the performance of the project. However, it is very important to
avoid scope creep. The is when the project team or contractor informally makes changes to
the project scope without appropriate approval or control, which may result in overspending
of the budget (Clements and Gido, 2011:95). The project may also not be completed on time
or additional work may be done due to scope creep.
2.3.3 Benefits of the scope document
It’s important to update the scope statement as more information becomes available and
decisions are made, since it:
helps improve the accuracy of time, cost and resource estimates
defines a baseline for performance measurement
aids in communicating clear responsibilities
ensures a common understanding among all parties
ensures customer satisfaction, and
prevents delays or scope creep – the tendency for project scope to continually increase
(Schwalbe, 2009:114).
Project Management
MANCOSA – MBA Final Year 36
2.4 Planning for quality
Project quality planning and management includes the process required to ensure that the
project will satisfy the needs for which it was undertaken. Burke (2007:254) offers two
definitions of project quality management:
- “the processes required to ensure that the project will satisfy the need for which it was
undertaken” (PMBOK Guide, 2004);
- “covering quality planning, quality control and quality assurance.”
Project Quality Management will be covered in greater detail in the last section.
Quality management is concerned with:
Customer Satisfaction – Customer satisfaction is the understanding, evaluation,
definition, and management of expectations so that customer requirements are met.
This approach requires conformance to requirements and a fitness of use for the
product or service.
Prevention over inspection – Prevention over inspection is the common sense
principle that the cost of preventing mistakes is generally much less than the cost of
correcting them. This is true especially when they are uncovered during an inspection.
Management responsibility – Management responsibility to quality is to provide the
resources needed to sustain success.
Continuous improvement – Continuous improve is following the plan-do-check-act
(PDCA) cycle of quality improvement.
Clements and Gido (2011) describe two quality management concepts, namely quality
assurance and quality control. Furthermore, they highlight the importance of planning for
quality by explaining that it prevents poor quality and avoids quality problems. There are also
costs of quality that one needs to be familiar with from a quality management perspective for
managing projects. These are:
Cost of Quality (COQ) – Cost of quality refers to the total cost of all efforts related
to quality. The appraisal, prevention, and failure costs are included in this term.
Cost of Poor Quality (COPQ) – Cost of poor quality addresses the cost of not
performing work correctly the first time or not meeting customers’ expectations.
Project Management
MANCOSA – MBA Final Year 37
Cost of Doing Nothing Different (CODND) – Cost of Doing Nothing Different is
the cost of not changing standard practice, even when it is dysfunctional.
The cost of quality is the sum of costs a project will spend to prevent poor quality and any
other costs incurred as a result of outputs of poor quality. Poor quality is the waste, errors, or
failure to meet stakeholder needs and project requirements. The costs of poor quality can be
broken down into the three categories of prevention, appraisal, and failure costs:
Prevention costs: These are planned costs an organisation incurs to ensure that errors
are not made at any stage during the delivery process of that product or service to a
beneficiary.
Appraisal costs: These include the costs of verifying, checking, or evaluating a
product or service during the delivery process.
Failure costs: A project incurs these costs because the product or service did not meet
the requirements and had to be fixed or replaced, or the service had to be repeated
(www.pm4dev.com).
ACTIVITY
Provide examples of the different costs of poor quality for a project that you may be familiar
with.
Examples of costs of poor quality:
Prevention costs: Examples of prevention costs include quality planning costs,
education and training costs, quality administration staff costs, process control costs,
market research costs, field testing costs, and preventative maintenance costs. The
cost of preventing mistakes are always much less than the costs of inspection and
correction.
Project Management
MANCOSA – MBA Final Year 38
Appraisal costs: Examples of appraisal costs include receiving or incoming inspection
costs, internal production audit costs, test and inspection costs, instrument
maintenance costs, process measurement and control costs, supplier evaluation costs,
and audit report costs.
Failure costs: Costs of a product recall; costs of litigation; costs of negative publicity.
2.5 Creating a Work Breakdown Structure
After the project scope document is created, a detailed Work Breakdown Structure (WBS) must
be created. The Work Breakdown Structure divides a project into tasks, which are subdivided into
more detailed and manageable components; into a set of activities or work packages (and
sometimes) with their related costs (Heizer and Render, 2009:56; Clements and Gido, 2011:97).
It is the deliverable-orientated grouping of work involved, and defines the total scope of the
project, breaking all the work required into discrete tasks and grouping them into hierarchies.
Tasks in the WBS represent work required to complete a project. With many people and many
deliverables, it makes sense to organise in this way, and divide tasks into logical parts based on
how these will be performed. It provides a basis for defining accountability and reporting
mechanisms. Experts believe work should not be done if it is not included in the WBS, so it is
essential to develop a comprehensive one (Schwalbe, 2009:116).
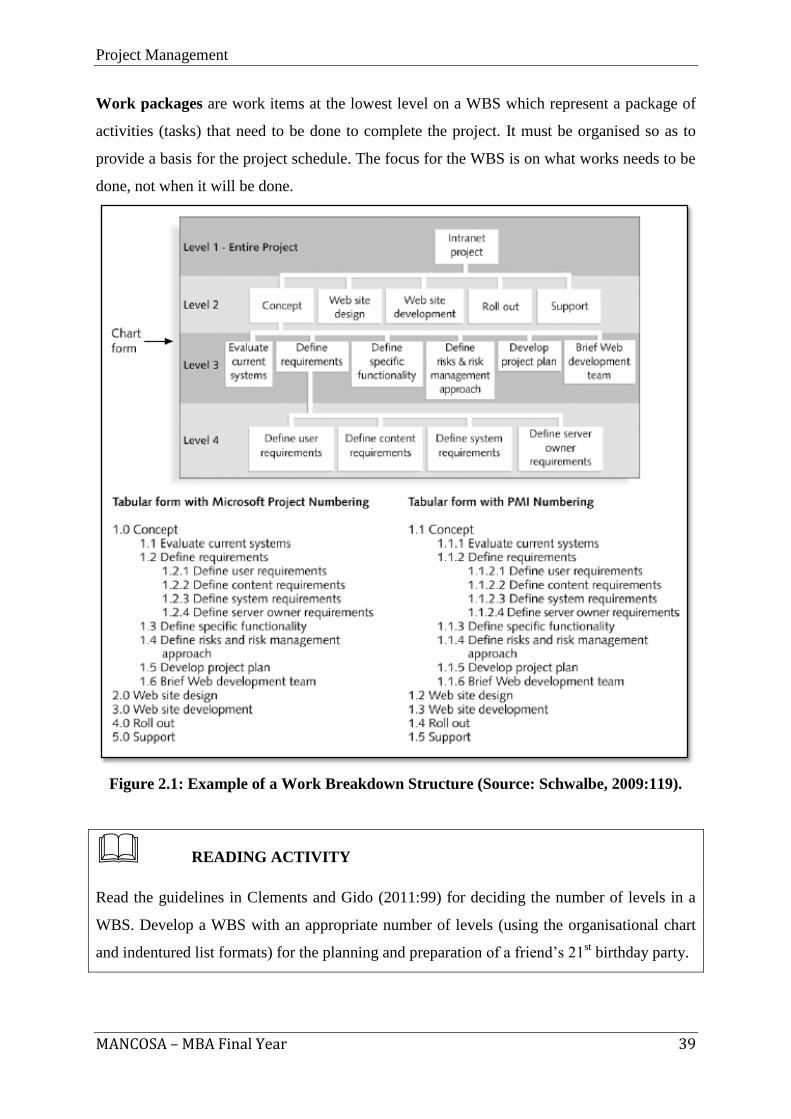
As shown in Figure 2.1, A WBS is often graphical, like an organisational chart, or
represented as an indentured list (Clements and Gido, 2011). Not all branches of the WBS
have to be broken down to the same level (Clements and Gido, 2011).
The name of the project is written in the top box: Level 1. The main groupings for work listed
in the second tier are Level 2, and these can be broken down into further tiers. The organising
must occur around project products, phases or other logical groupings (Schwalbe, 2009:118).
The numbering system e.g. 2.1.3 uniquely identifies all the work packages. The scope of
work is subdivided into further work packages with a corresponding increase in the level of
detail. Three or four levels should be sufficient. The number of levels is influenced by the
level of detail, risk, control, the estimated accuracy, and the work package value (Burke,
2009:135). Clements and Gido (2011:99-100) provide guidelines for deciding how many
levels to includes in the WBS.
Project Management
MANCOSA – MBA Final Year 39
Work packages are work items at the lowest level on a WBS which represent a package of
activities (tasks) that need to be done to complete the project. It must be organised so as to
provide a basis for the project schedule. The focus for the WBS is on what works needs to be
done, not when it will be done.
Figure 2.1: Example of a Work Breakdown Structure (Source: Schwalbe, 2009:119).
READING ACTIVITY
Read the guidelines in Clements and Gido (2011:99) for deciding the number of levels in a
WBS. Develop a WBS with an appropriate number of levels (using the organisational chart
and indentured list formats) for the planning and preparation of a friend’s 21st birthday party.
Project Management
MANCOSA – MBA Final Year 40
Schwalbe (2009) describes five approaches to the development of a WBS:
a. Using Guidelines:
Some organisations prescribe the form and content for the projects. If guidelines for a
project exist, it is very important to follow them.
b. The Analogy Approach:
This uses similar projects’ WBS as a starting point. Many organisations have sample
WBSs from previous projects. It can save a lot of time but must ensure that it addresses
the unique characteristics of the project at hand.
c. Top-Down Approach:
This is a conventional method that starts with the largest items and breaks them into
subordinate items, refining down into greater amounts of detail. After breaking down
the top-level items, resources should then be assigned at work package level. It is best
suited to those who have vast technical insight and a big picture perspective.
d. The Bottom-Up Approach:
It is important to identify as many specific tasks related to the project as possible,
which are aggregated and organised into summary activities or higher levels of the
WBS. Some use post-it notes on the wall which help people to see logical groupings. It
can be time consuming, but is effective and often used for entirely new projects. It can
help create buy-in within the project team.
e. Mind mapping
This is a technique that uses branches which radiate out from a core idea to structure
thoughts and ideas. It unlocks creativity, and increases participation and morale. Each of
the main branches jutting out from the core is a Level 2 item. It can be used when applying
the Top Down or Bottom Up approaches. A mind map could also be done for each major
deliverable, and then merge all to form one large diagram for the project.
ACTIVITY
Imagine you have been appointed as an event manager at the Rugby World Cup in New
Zealand. Outline how you would use the WBS to subdivide the event with attention to:
- the approach to developing the WBS
- the method of subdivision
- the possible number of levels
Project Management
MANCOSA – MBA Final Year 41
2.6 Defining activities
Once the WBS is developed, the resource responsible for each of the work packages must
clearly define the specific activity(ies) that need to be performed to produce the end item or
deliverable for that work package (Clements and Gido, 2011:103). An activity (or task) is
defined as a “piece of work that consumes time” but doesn’t always require the expenditure
of effort by people (Clements and Gido, 2011:103). Once all activities are listed, the next step
would be to sequence them using a network diagram.
2.7 Activity sequence and network diagrams
A project network diagram is an illustrated way of dividing the project in accordance with the
WBS (Heizer and Render, 2009:57). It is a schematic display of the logical relationships
among, or sequencing of, project activities (Schwalbe, 2009:131). Whilst the WBS defines
what needs to be done, the network diagram describes the sequence of how the activities will
get done (Clements and Gido, 2011).
2.7.1 Activity sequence
For effective time management, it is necessary to determine the activity sequencing and to
review the activity list and milestones to determine relationships or dependencies:
mandatory – inherent in the nature of work, unavoidable or “hard logic”;
discretionary – defined by the project team;
external – relationships between project and non-project activities (Schwalbe,
2009:130).
Once the activity list has been drawn up, to ensure all activities are accounted for, a milestone
list is created. Milestones are significant events, and it often takes several activities to
complete a milestone but it acts like a marker. They are useful tools for setting schedule goals
and monitoring progress (Schwalbe, 2009:128).
The next step is activity sequencing, which involves reviewing the activity list, scope statement,
and milestone list to determine the relationships or dependencies. Without defining these it is not
possible to use the powerful schedule tools available to project managers, namely network
Project Management
MANCOSA – MBA Final Year 42
diagrams and critical path analysis. Network diagrams show activity sequencing through a
schematic display of logical relationships among the activities. The main output of activity
sequencing is a network diagram (Schwalbe, 2009:130).
2.7.2 Network diagram
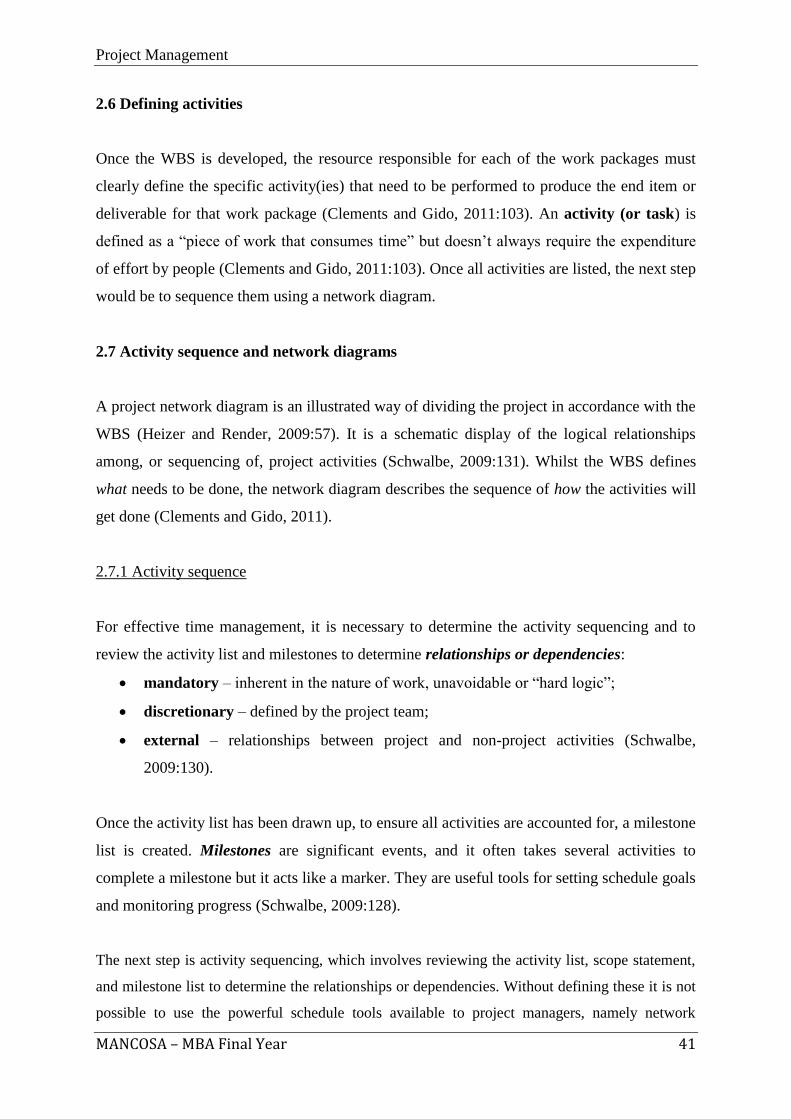
Clements and Gido (2011:104) describe some network principles that must be understood:
Each activity is represented by a box or circle (node) in the network diagram
(configuration of nodes may differ);
The description of the activity or the activity code/number is written within the
box/circle;
Each activity is represented by one box/circle (node) only;
Activities have a dependent (or precedence) relationship and are linked in a logical
sequence;
Arrows linking the activities show the direction of the precedence relationship;
The network diagram is drawn from left to right;
An activity cannot start until all of the preceding activities that are linked to it by
arrows are finished;
Some activities can be done concurrently and some only sequentially.
Laddering is a technique which can be used to indicate that each resource can be used
in the next activity as soon as it is done with one activity.
2.7.3 Creating the network diagram
When determining the sequence of activities, Clements and Gido (2011:106) suggest that the
following questions should be asked:
Which activities should be finished immediately before this activity can be started?
Which activities can be done concurrently with this activity?
Which activities cannot be started until immediately after this activity is finished?
Project Management
MANCOSA – MBA Final Year 43
There are two approaches for drawing a network diagram:
The Activity-on-Arrow (AOA) Approach
The Activity-on-Node (AON) Approach
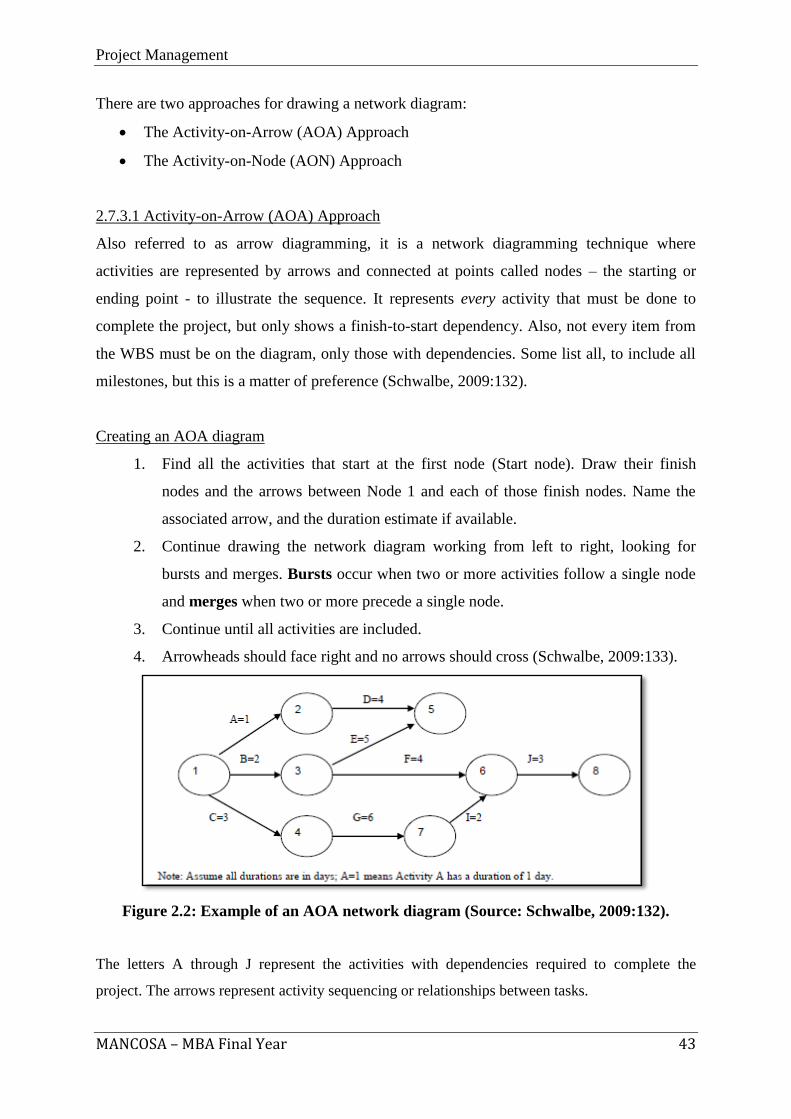
2.7.3.1 Activity-on-Arrow (AOA) Approach
Also referred to as arrow diagramming, it is a network diagramming technique where
activities are represented by arrows and connected at points called nodes – the starting or
ending point - to illustrate the sequence. It represents every activity that must be done to
complete the project, but only shows a finish-to-start dependency. Also, not every item from
the WBS must be on the diagram, only those with dependencies. Some list all, to include all
milestones, but this is a matter of preference (Schwalbe, 2009:132).
Creating an AOA diagram
1. Find all the activities that start at the first node (Start node). Draw their finish
nodes and the arrows between Node 1 and each of those finish nodes. Name the
associated arrow, and the duration estimate if available.
2. Continue drawing the network diagram working from left to right, looking for
bursts and merges. Bursts occur when two or more activities follow a single node
and merges when two or more precede a single node.
3. Continue until all activities are included.
4. Arrowheads should face right and no arrows should cross (Schwalbe, 2009:133).
Figure 2.2: Example of an AOA network diagram (Source: Schwalbe, 2009:132).
The letters A through J represent the activities with dependencies required to complete the
project. The arrows represent activity sequencing or relationships between tasks.
Project Management
MANCOSA – MBA Final Year 44
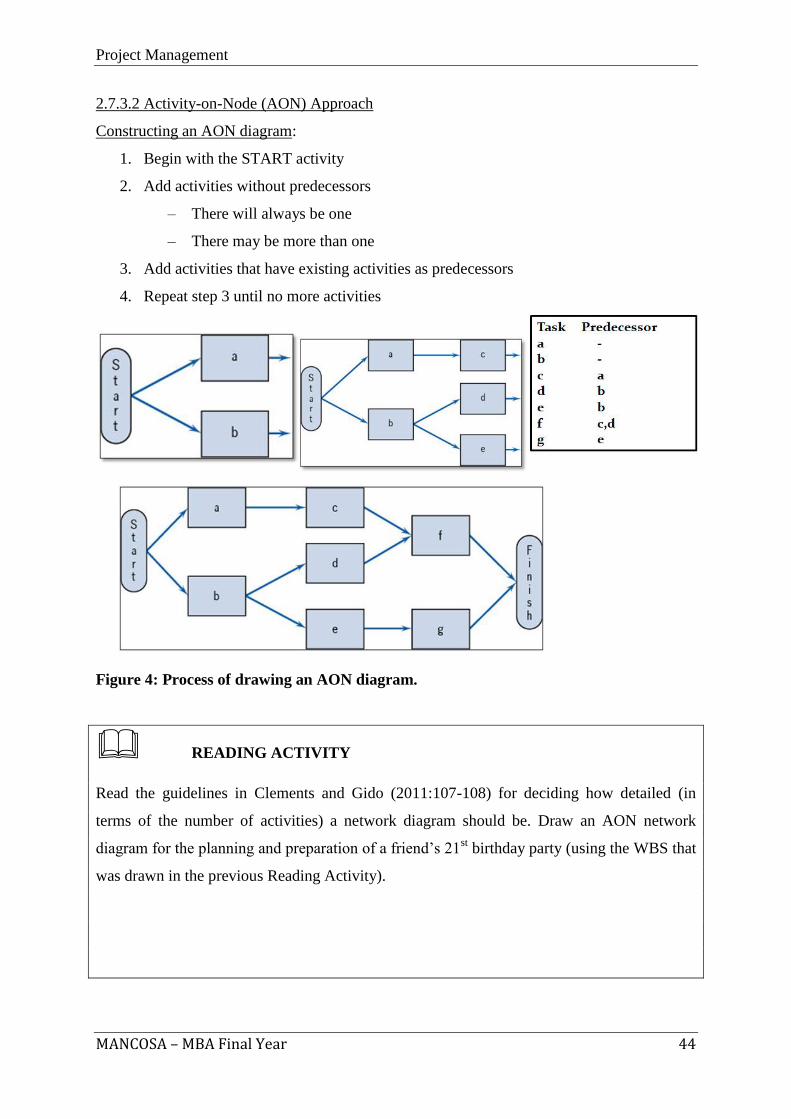
2.7.3.2 Activity-on-Node (AON) Approach
Constructing an AON diagram:
1. Begin with the START activity
2. Add activities without predecessors
– There will always be one
– There may be more than one
3. Add activities that have existing activities as predecessors
4. Repeat step 3 until no more activities
Figure 4: Process of drawing an AON diagram.
READING ACTIVITY
Read the guidelines in Clements and Gido (2011:107-108) for deciding how detailed (in
terms of the number of activities) a network diagram should be. Draw an AON network
diagram for the planning and preparation of a friend’s 21st birthday party (using the WBS that
was drawn in the previous Reading Activity).
Project Management
MANCOSA – MBA Final Year 45
2.8 Conclusion
In planning a project, it is important to ensure that the scope of the project (what needs to be
done) is well understood, and subsequently, the work breakdown structure (which establishes
a framework for how the work will get done) must also be developed. Apart from scope and
time management, quality management is one of the core elements which define the success
of a project. This will be dealt with in greater detail later on. From the WBS, the network
diagram provides a logical relationship between the specific activities that are identified from
the work packages of the WBS. In the next section, we will see how the Gantt chart and
network diagram can be used to schedule the project in order to satisfy time deadlines.
Project Management
MANCOSA – MBA Final Year 46
SECTION 3
3. DEVELOPING THE PROJECT SCHEDULE
Project Management
MANCOSA – MBA Final Year 47
CONTENTS
Learning outcomes
Reading Material
3.1 Introduction
3.2 Gantt charts
3.3 Estimating activity durations
3.4 Developing project scheduling using forward and backward pass
3.5 Critical Path
3.6 Working out the critical path
3.7 Benefits of CPM
3.8 Conclusion
Project Management
MANCOSA – MBA Final Year 48
Learning Outcomes:
The overall outcome for this section is that, on its completion, the learner should be able to
demonstrate an understanding of the field of project scheduling. This overall outcome will be
achieved through the learner’s mastery of the following specific outcomes, in that the learner
will be able to:
1. Describe benefits and disadvantages of Gantt charts when applied to projects.
2. Draw and label Gantt charts from project information that is provided.
3. Estimate activity durations using Programme Evaluation and Review Technique
(PERT).
4. Develop project scheduling using the forward and backward pass methods.
5. Determine the Critical Path of a project using slack time calculations.
6. Describe the benefits of CPM.
Project Management
MANCOSA – MBA Final Year 49
Reading Material:
READING
Prescribed reading:
Clements, J. P. and Gido, J. (2011). Effective Project Management. 5th
Edition. Boston:
Cengage Learning.
Recommended reading:
Burke, R. (2009). Project Management Techniques. College Edition. Hampshire: Burke
Publishing.
Heizer, J. and Render, B. (2010). “Project Management” (Ch. 3) in Operations Management.
10th
Edition. New Jersey: Pearson Education Inc.
Schwalbe, K. (2009). Introduction to Project Management. 2nd
Edition. Boston: Cengage
Learning.
Project Management
MANCOSA – MBA Final Year 50
3.1 Introduction
In the previous section, we looked at scope management (what needs to be done). We will
now look at aspects of project time management (how it should be done within a specific
timeframe). Our particular focus in this section is on Gantt charts and network diagrams
(paying attention to the critical path method or CPM). Since time is one of the major
constraints of any project, it is important for managers to be able to properly schedule
projects using appropriate tools such as Gantt charts and CPM.
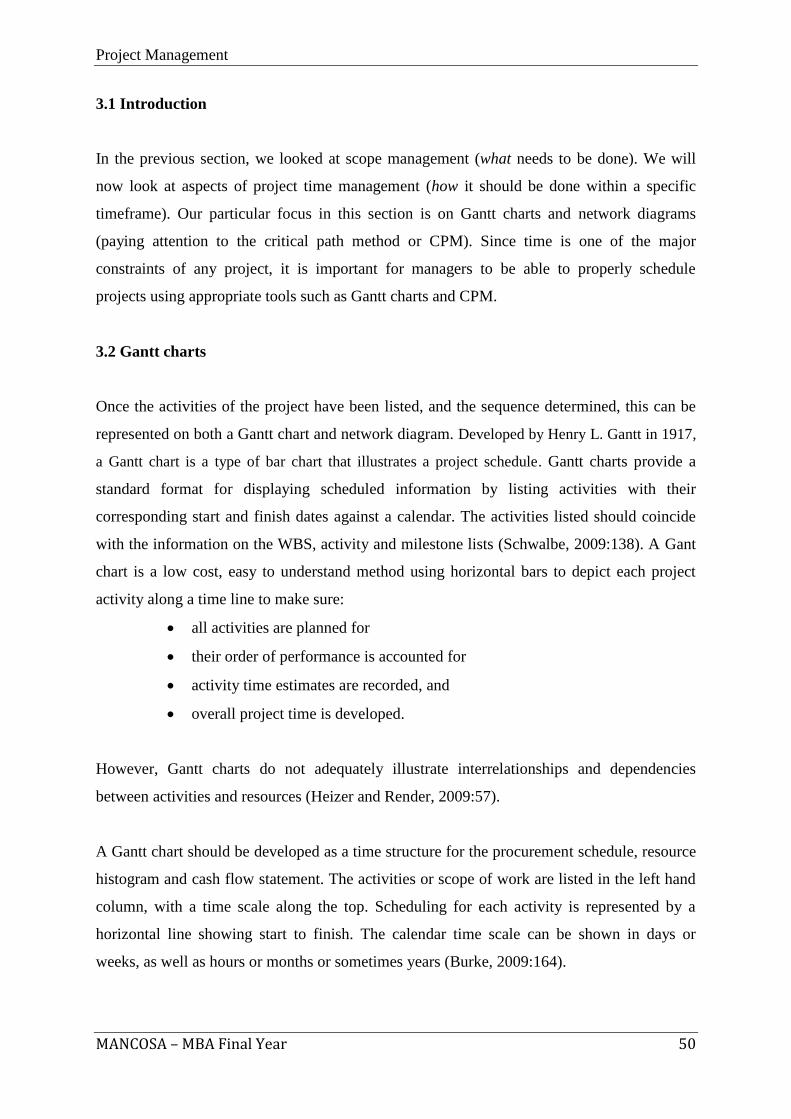
3.2 Gantt charts
Once the activities of the project have been listed, and the sequence determined, this can be
represented on both a Gantt chart and network diagram. Developed by Henry L. Gantt in 1917,
a Gantt chart is a type of bar chart that illustrates a project schedule. Gantt charts provide a
standard format for displaying scheduled information by listing activities with their
corresponding start and finish dates against a calendar. The activities listed should coincide
with the information on the WBS, activity and milestone lists (Schwalbe, 2009:138). A Gant
chart is a low cost, easy to understand method using horizontal bars to depict each project
activity along a time line to make sure:
all activities are planned for
their order of performance is accounted for
activity time estimates are recorded, and
overall project time is developed.
However, Gantt charts do not adequately illustrate interrelationships and dependencies
between activities and resources (Heizer and Render, 2009:57).
A Gantt chart should be developed as a time structure for the procurement schedule, resource
histogram and cash flow statement. The activities or scope of work are listed in the left hand
column, with a time scale along the top. Scheduling for each activity is represented by a
horizontal line showing start to finish. The calendar time scale can be shown in days or
weeks, as well as hours or months or sometimes years (Burke, 2009:164).
Project Management
MANCOSA – MBA Final Year 51
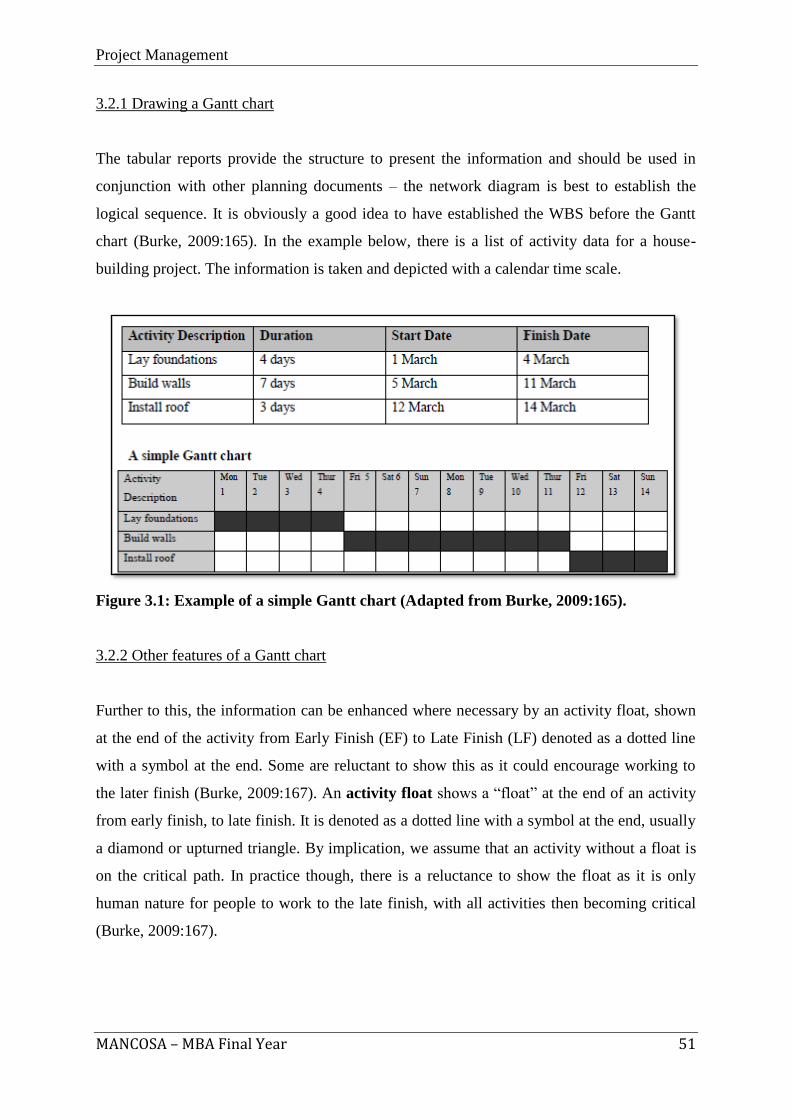
3.2.1 Drawing a Gantt chart
The tabular reports provide the structure to present the information and should be used in
conjunction with other planning documents – the network diagram is best to establish the
logical sequence. It is obviously a good idea to have established the WBS before the Gantt
chart (Burke, 2009:165). In the example below, there is a list of activity data for a house-
building project. The information is taken and depicted with a calendar time scale.
Figure 3.1: Example of a simple Gantt chart (Adapted from Burke, 2009:165).
3.2.2 Other features of a Gantt chart
Further to this, the information can be enhanced where necessary by an activity float, shown
at the end of the activity from Early Finish (EF) to Late Finish (LF) denoted as a dotted line
with a symbol at the end. Some are reluctant to show this as it could encourage working to
the later finish (Burke, 2009:167). An activity float shows a “float” at the end of an activity
from early finish, to late finish. It is denoted as a dotted line with a symbol at the end, usually
a diamond or upturned triangle. By implication, we assume that an activity without a float is
on the critical path. In practice though, there is a reluctance to show the float as it is only
human nature for people to work to the late finish, with all activities then becoming critical
(Burke, 2009:167).
Project Management
MANCOSA – MBA Final Year 52
A hammock activity is a summary activity to gather together a number of sub-activities into
one master activity and can link with the WBS, e.g. in the house planning example, “Build
walls” could be broken down into “Brickwork” and “Fit windows”. The Gantt chart can thus
be used to present at the required level of detail, fundamental to planning and control (Burke,
2009:168).
An event is a key point in time with zero duration – also called a key date or a milestone.
These give focus to when work must be completed and a clear measure of progress.
Remember:
An event has no duration; it is a point in time.
An event may be the start or finish of an activity, or WBS work package.
An event focuses the project on a checkpoint, or a deliverable result.
An event could be the interface between contractors.
Data capture is more accurate if scope is subdivided into milestones
ACTIVITY
If you have access to the Microsoft Project software, carry out the exercise in Appendix 2 of
Chapter 5 in Clements and Gido (2011:184) to practice how to contruct a Gantt chart using
Microsoft Project.
3.2.3 Benefits and shortcomings of Gantt charts
Benefits:
The chart presentation is easy to assimilate
It displays activity progress very simply and clearly
The activity float is easier to comprehend when actually displayed using a Gantt chart
A scheduled Gantt chart is a prerequisite for forecasting the procurement schedule and
the cash flow statement
The revised Gantt chart is an excellent management tool
It can be used to communicate and disseminate schedule information
It is a key document for the management decision-making function (Burke,
2009:176).
Project Management
MANCOSA – MBA Final Year 53
Shortcomings:
Showing interrelationships is difficult
Multiple decision-making is difficult (Burke, 2009:176).
ACTIVITY
Can you think of other benefits and shortcomings of using Gantt charts to schedule projects?
Are there any others?
3.3 Estimating activity durations
Only after estimates are made for the types and quantities of resources required for each
activity in the project can one estimate the duration of each activity (Clements and Gido,
2011:132). It is important to brainstorm and evaluate alternatives related to resources,
especially on projects that involve people from multiple disciplines (Schwalbe, 2009:136).
Duration includes the actual amount of time spent working on an activity plus elapsed time.
This is different to effort, which is the number of work hours it takes to complete a task.
Duration relates to the time estimate, but of course, the two are related and assumptions must
be documented.
A three-point estimate, for example, is an estimate that includes an optimistic, most likely
and a pessimistic estimate (Schwalbe, 2009:136). This is required for performing PERT
estimates – the Program Evaluation and Review Technique which is a network analysis to
estimate project duration when there is a high degree of uncertainty about the individual
activity duration estimates. This helps account for risk in individual activity estimates
(Schwalbe, 2009:136).
Project Management
MANCOSA – MBA Final Year 54
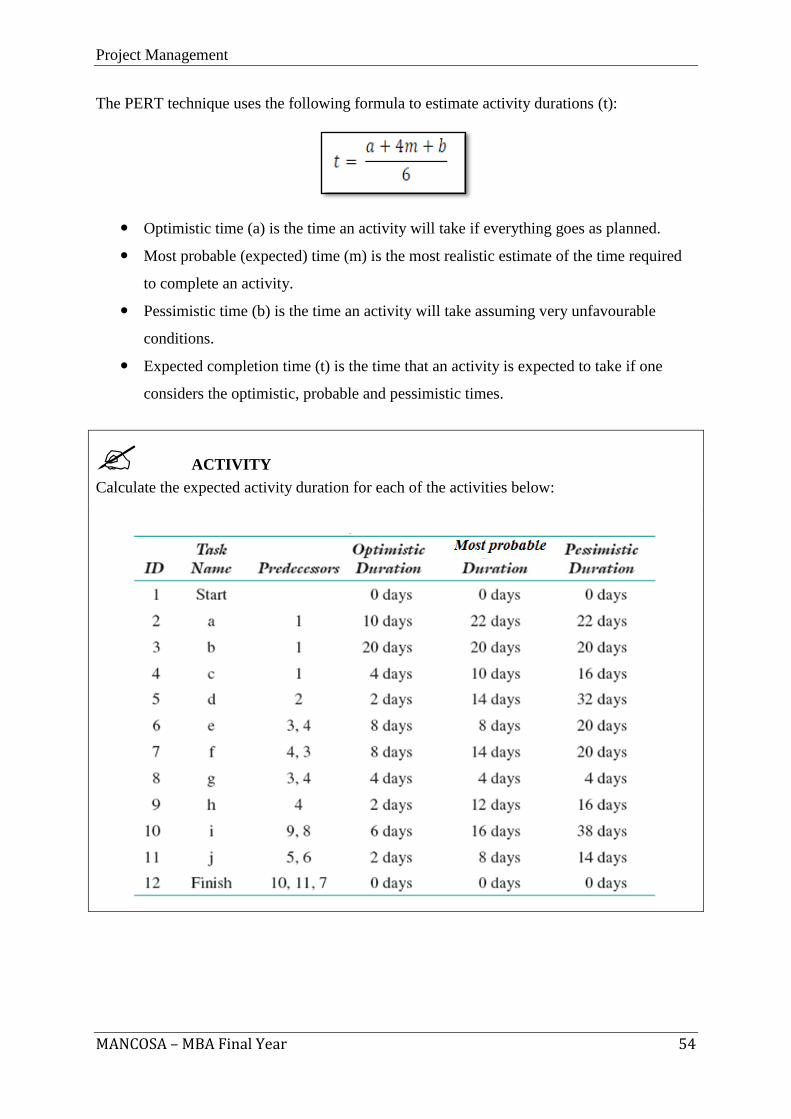
The PERT technique uses the following formula to estimate activity durations (t):
Optimistic time (a) is the time an activity will take if everything goes as planned.
Most probable (expected) time (m) is the most realistic estimate of the time required
to complete an activity.
Pessimistic time (b) is the time an activity will take assuming very unfavourable
conditions.
Expected completion time (t) is the time that an activity is expected to take if one
considers the optimistic, probable and pessimistic times.
ACTIVITY
Calculate the expected activity duration for each of the activities below:
Project Management
MANCOSA – MBA Final Year 55
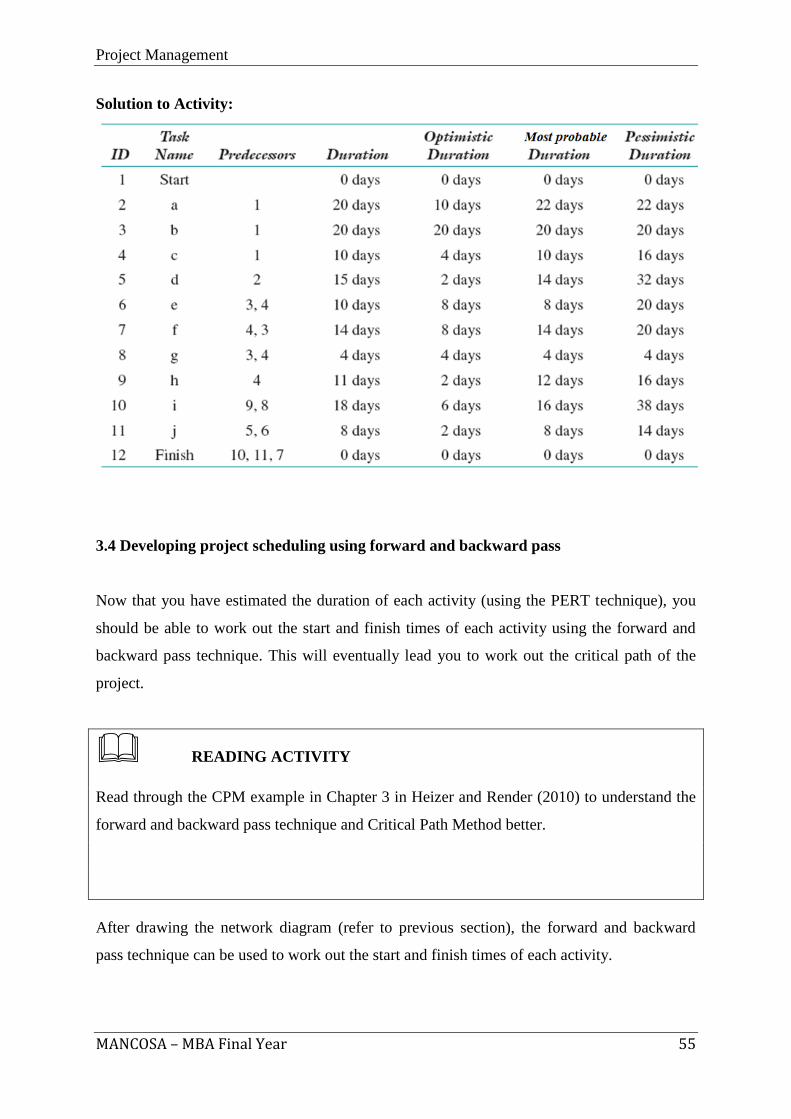
Solution to Activity:
3.4 Developing project scheduling using forward and backward pass
Now that you have estimated the duration of each activity (using the PERT technique), you
should be able to work out the start and finish times of each activity using the forward and
backward pass technique. This will eventually lead you to work out the critical path of the
project.
READING ACTIVITY
Read through the CPM example in Chapter 3 in Heizer and Render (2010) to understand the
forward and backward pass technique and Critical Path Method better.
After drawing the network diagram (refer to previous section), the forward and backward
pass technique can be used to work out the start and finish times of each activity.
Project Management
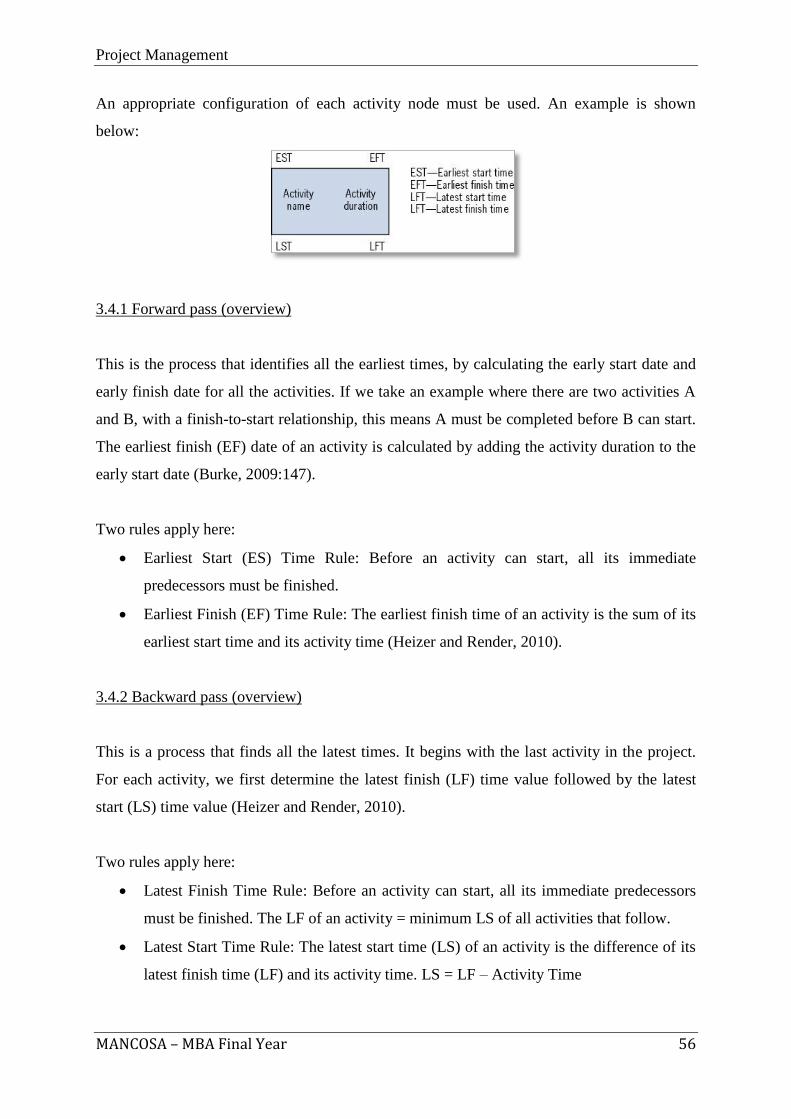
MANCOSA – MBA Final Year 56
An appropriate configuration of each activity node must be used. An example is shown
below:
3.4.1 Forward pass (overview)
This is the process that identifies all the earliest times, by calculating the early start date and
early finish date for all the activities. If we take an example where there are two activities A
and B, with a finish-to-start relationship, this means A must be completed before B can start.
The earliest finish (EF) date of an activity is calculated by adding the activity duration to the
early start date (Burke, 2009:147).
Two rules apply here:
Earliest Start (ES) Time Rule: Before an activity can start, all its immediate
predecessors must be finished.
Earliest Finish (EF) Time Rule: The earliest finish time of an activity is the sum of its
earliest start time and its activity time (Heizer and Render, 2010).
3.4.2 Backward pass (overview)
This is a process that finds all the latest times. It begins with the last activity in the project.
For each activity, we first determine the latest finish (LF) time value followed by the latest
start (LS) time value (Heizer and Render, 2010).
Two rules apply here:
Latest Finish Time Rule: Before an activity can start, all its immediate predecessors
must be finished. The LF of an activity = minimum LS of all activities that follow.
Latest Start Time Rule: The latest start time (LS) of an activity is the difference of its
latest finish time (LF) and its activity time. LS = LF – Activity Time
Project Management
MANCOSA – MBA Final Year 57
3.4.3 Applying the process
3.4.3.1 Forward pass
a) Start with the Start node
b) For each node: use the earliest start (ES) time (the greatest “earliest finish time of all
this node’s predecessors), add in the duration to calculate the earliest finish (EF) time
c) Repeat step 2 for each node in the set.
Forward pass rules:
For Start node, ES= 0
ES Time Rule: ES= Max {EF of immediate predecessors}
EF Time Rule: EF= ES + activity duration
3.4.3.2 Backward pass
a) Start with End node and note its LS time
b) For each predecessor node: set the LF time to the lowest LS time of the successor(s)
and subtract the duration to get the EF time
c) Repeat step 2 for each node, moving right to left.
Backward pass rules:
For last activity, LF = EF
LF= Min {LS of all immediate following activities}
LS= LF – Activity duration
3.5 Critical Path
Once the network diagram is drawn, the activity durations estimated using PERT, and the ES,
EF, LS and LF times are worked out using the forward and backward pass technique, one can
work out the critical path of the project. Activities on the critical path, or the longest time line
through the network, represent tasks that will delay the entire project if they are not
completed on time (Heizer and Render, 2010). This comprises a number of critical dates or
deadlines that must be met as it will impact on subsequent dates (Heizer and Render, 2010).
Project Management
MANCOSA – MBA Final Year 58
The Critical Path Method (CPM) uses network diagramming to predict the total project
duration preventing schedule overruns. The critical path is a series of activities determining
the earliest/shortest time of, and the longest path, to completion (Clements and Gido, 2011;
Schwalbe, 2009:139). The longest path or the path containing the critical tasks is what is
driving the completion date for the project.
One way to find out the critical path of the project is to look for all activities with the least or
zero slack (Clements and Gido, 2011). The critical path has the least amount of slack or float –
the amount of time one activity can be delayed without causing delays to the others or the finish
date. Several tasks can be done in parallel, resulting in multiple paths on the diagram. The project
only finishes when all tasks are completed (Schwalbe, 2009:139).
The activities with zero slack are called critical activities and are said to be on the critical
path. The critical path is a continuous path through the project network that:
Starts at the first activity in the project
Terminates at the last activity in the project
Includes only critical activities – with no slack time (Heizer and Render, 2009:68).
3.6 Working out the critical path
One of two ways can be used to work out the critical path:
a) For simple network diagrams with few pathways from start to finish, calculating the
critical path involves adding the durations for all activities on each path through the
network diagram. The longest path is the critical path; it shows the shortest time in
which a project can be completed. If one or more activities on the critical path take longer
than planned, the whole project will slip unless the project manager takes appropriate
action. (Schwalbe, 2009).
Project Management
MANCOSA – MBA Final Year 59
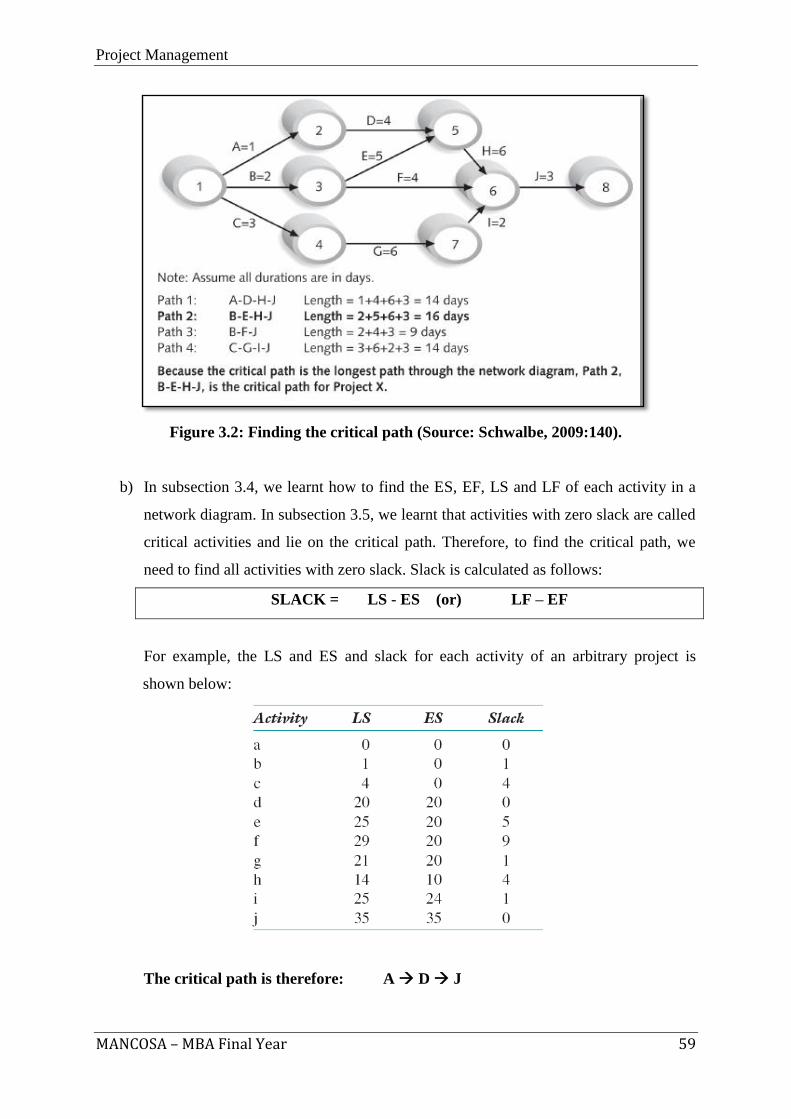
Figure 3.2: Finding the critical path (Source: Schwalbe, 2009:140).
b) In subsection 3.4, we learnt how to find the ES, EF, LS and LF of each activity in a
network diagram. In subsection 3.5, we learnt that activities with zero slack are called
critical activities and lie on the critical path. Therefore, to find the critical path, we
need to find all activities with zero slack. Slack is calculated as follows:
SLACK = LS - ES (or) LF – EF
For example, the LS and ES and slack for each activity of an arbitrary project is
shown below:
The critical path is therefore: A D J
Project Management
MANCOSA – MBA Final Year 60
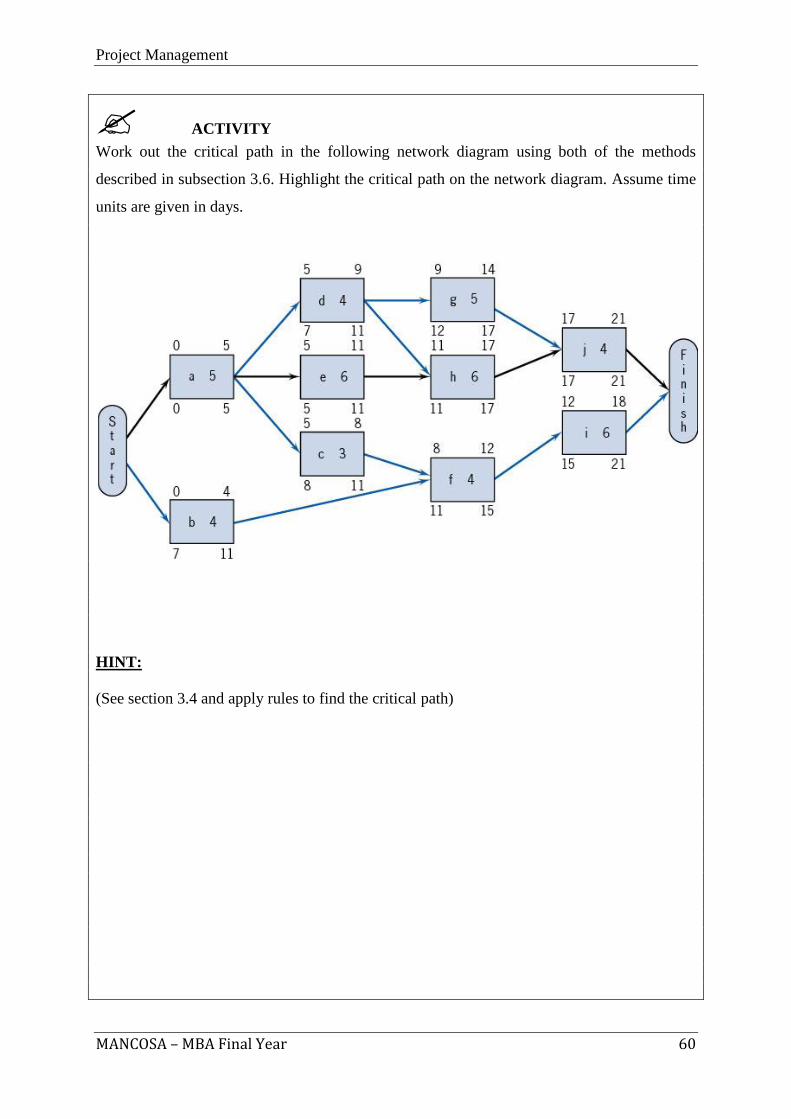
ACTIVITY
Work out the critical path in the following network diagram using both of the methods
described in subsection 3.6. Highlight the critical path on the network diagram. Assume time
units are given in days.
HINT:
(See section 3.4 and apply rules to find the critical path)
Project Management
MANCOSA – MBA Final Year 61
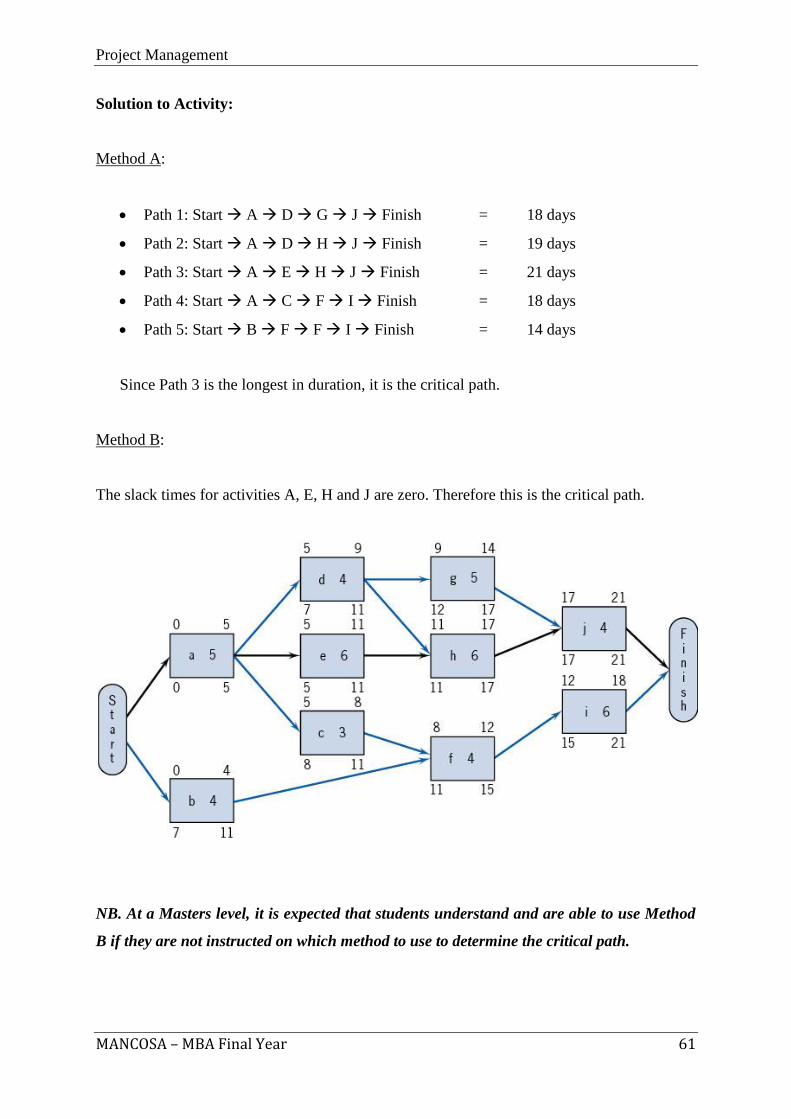
Solution to Activity:
Method A:
Path 1: Start A D G J Finish = 18 days
Path 2: Start A D H J Finish = 19 days
Path 3: Start A E H J Finish = 21 days
Path 4: Start A C F I Finish = 18 days
Path 5: Start B F F I Finish = 14 days
Since Path 3 is the longest in duration, it is the critical path.
Method B:
The slack times for activities A, E, H and J are zero. Therefore this is the critical path.
NB. At a Masters level, it is expected that students understand and are able to use Method
B if they are not instructed on which method to use to determine the critical path.
Project Management
MANCOSA – MBA Final Year 62
3.7 Benefits of CPM
CPM is important has it helps to address the following questions:
a. When will the entire project be completed?
b. What are the critical activities or tasks in the project – which will cause delay if
they are late?
c. Which are the non critical activities – the ones that can run late without causing an
overall delay?
d. What is the probability that the project will be completed by a specific date?
e. At any particular date, is the project on schedule, behind schedule, or ahead?
f. On any given date is the money spend equal to, less than, or greater than the
budgeted figure.
g. Are there enough resources to finish the project on time?
h. If the project is to be finished in a shorter amount of time, what is the best way to
accomplish this goal at the least cost? (Heizer and Render, 2009:59).
3.8 Conclusion
In this section, we learnt how to schedule projects using Gantt charts and network diagrams.
Furthermore, techniques were described on how to go about determining the critical path of a
project. By doing so, managers will be able to identify critical activities which could impact
on the project deadlines. Activities with slack will also be identified. Managers could then
manipulate the schedule and resources of the project by delaying activities with slack time
and/or using methods such as crashing to ensure that the project deliverables are achieved
within the specified constraints.
The next section will deal with project resource management.

Project Management
MANCOSA – MBA Final Year 63
SECTION 4
4. PROJECT RESOURCE MANAGEMENT
Project Management
MANCOSA – MBA Final Year 64
CONTENTS
Learning outcomes
Reading Material
4.1 Introduction
4.2 Project constraints
4.3 Resource scheduling problems
4.4 Resource requirements planning
4.5 Resource Gantt charts
4.6 Resource histograms
4.7 Resource loading and resource levelling (resource smoothing)
4.8 Increasing and reducing resources
4.9 Conclusion
Project Management
MANCOSA – MBA Final Year 65
Learning Outcomes:
The overall outcome for this section is that, on its completion, the learner should be able to
demonstrate an understanding of project resource management. This overall outcome will be
achieved through the learner’s mastery of the following specific outcomes, in that the learner
will be able to:
1. Discuss technical and resource constraints and their impact on a project.
2. Identify resource scheduling problems and explain the characteristics of time-
constrained and resource-constrained resource scheduling.
3. Explain project resource requirements planning.
4. Develop and interpret resource Gantt charts and resource histograms.
5. Discuss resource loading situations and perform resource levelling (resource
smoothing).
6. Explain ways of reducing and increasing resources in a project.
Project Management
MANCOSA – MBA Final Year 66
Reading Material:
READING
Prescribed reading:
Clements, J. P. and Gido, J. (2011). Effective Project Management. 5th
Edition. Boston:
Cengage Learning.
Recommended reading:
Gray, C.F. and Larson, E.W. (2006). Project Management: The Managerial Process. 3rd
Edition. New York: McGraw-Hill.
PMI (2004). A Guide to the Project Management Body of Knowledge (PMBOK Guide). 3rd
Edition. Pennsylvania: Project Management Institute.
Schwalbe, K. (2009). Introduction to Project Management. 2nd
Edition. Boston: Cengage
Learning.
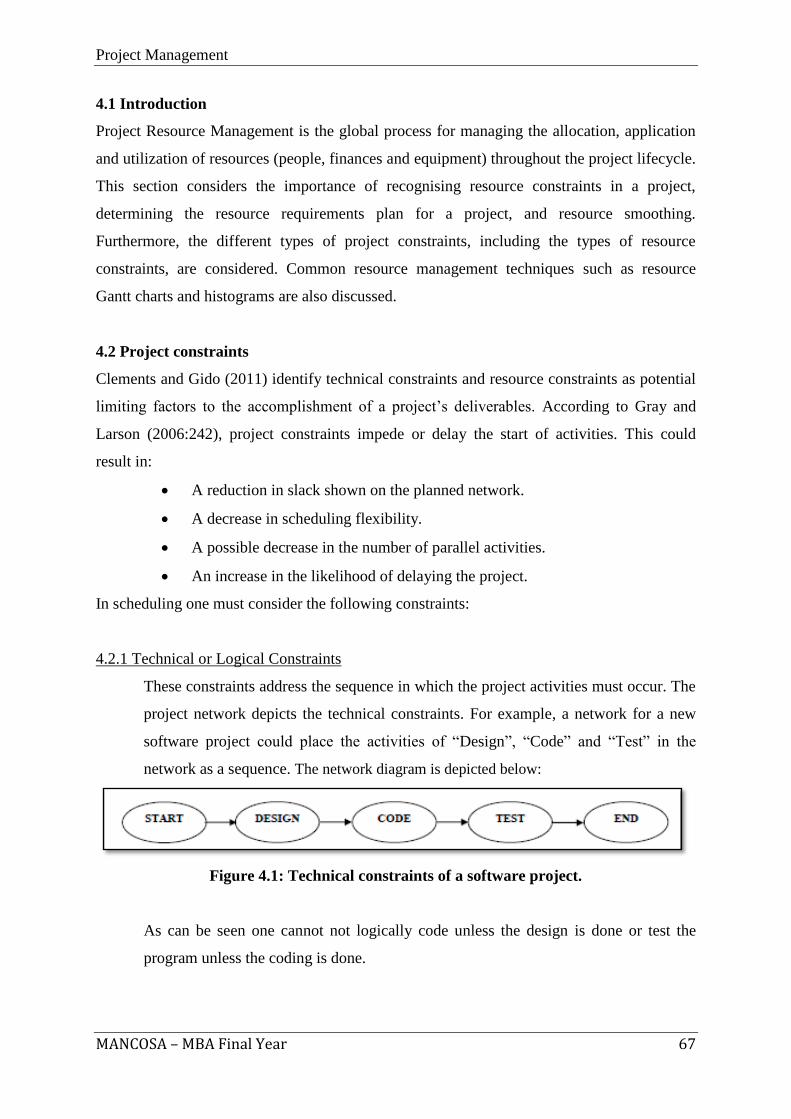
Project Management
MANCOSA – MBA Final Year 67
4.1 Introduction
Project Resource Management is the global process for managing the allocation, application
and utilization of resources (people, finances and equipment) throughout the project lifecycle.
This section considers the importance of recognising resource constraints in a project,
determining the resource requirements plan for a project, and resource smoothing.
Furthermore, the different types of project constraints, including the types of resource
constraints, are considered. Common resource management techniques such as resource
Gantt charts and histograms are also discussed.
4.2 Project constraints
Clements and Gido (2011) identify technical constraints and resource constraints as potential
limiting factors to the accomplishment of a project’s deliverables. According to Gray and
Larson (2006:242), project constraints impede or delay the start of activities. This could
result in:
A reduction in slack shown on the planned network.
A decrease in scheduling flexibility.
A possible decrease in the number of parallel activities.
An increase in the likelihood of delaying the project.
In scheduling one must consider the following constraints:
4.2.1 Technical or Logical Constraints
These constraints address the sequence in which the project activities must occur. The
project network depicts the technical constraints. For example, a network for a new
software project could place the activities of “Design”, “Code” and “Test” in the
network as a sequence. The network diagram is depicted below:
Figure 4.1: Technical constraints of a software project.
As can be seen one cannot not logically code unless the design is done or test the
program unless the coding is done.
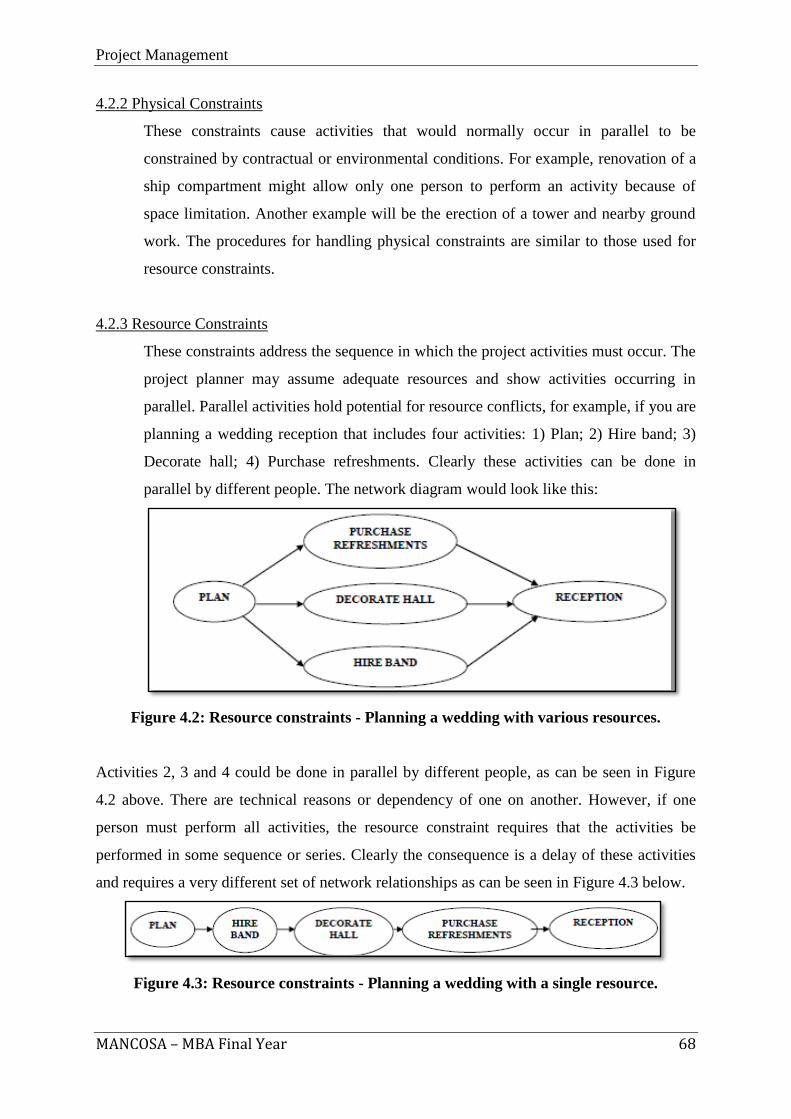
Project Management
MANCOSA – MBA Final Year 68
4.2.2 Physical Constraints
These constraints cause activities that would normally occur in parallel to be
constrained by contractual or environmental conditions. For example, renovation of a
ship compartment might allow only one person to perform an activity because of
space limitation. Another example will be the erection of a tower and nearby ground
work. The procedures for handling physical constraints are similar to those used for
resource constraints.
4.2.3 Resource Constraints
These constraints address the sequence in which the project activities must occur. The
project planner may assume adequate resources and show activities occurring in
parallel. Parallel activities hold potential for resource conflicts, for example, if you are
planning a wedding reception that includes four activities: 1) Plan; 2) Hire band; 3)
Decorate hall; 4) Purchase refreshments. Clearly these activities can be done in
parallel by different people. The network diagram would look like this:
Figure 4.2: Resource constraints - Planning a wedding with various resources.
Activities 2, 3 and 4 could be done in parallel by different people, as can be seen in Figure
4.2 above. There are technical reasons or dependency of one on another. However, if one
person must perform all activities, the resource constraint requires that the activities be
performed in some sequence or series. Clearly the consequence is a delay of these activities
and requires a very different set of network relationships as can be seen in Figure 4.3 below.
Figure 4.3: Resource constraints - Planning a wedding with a single resource.
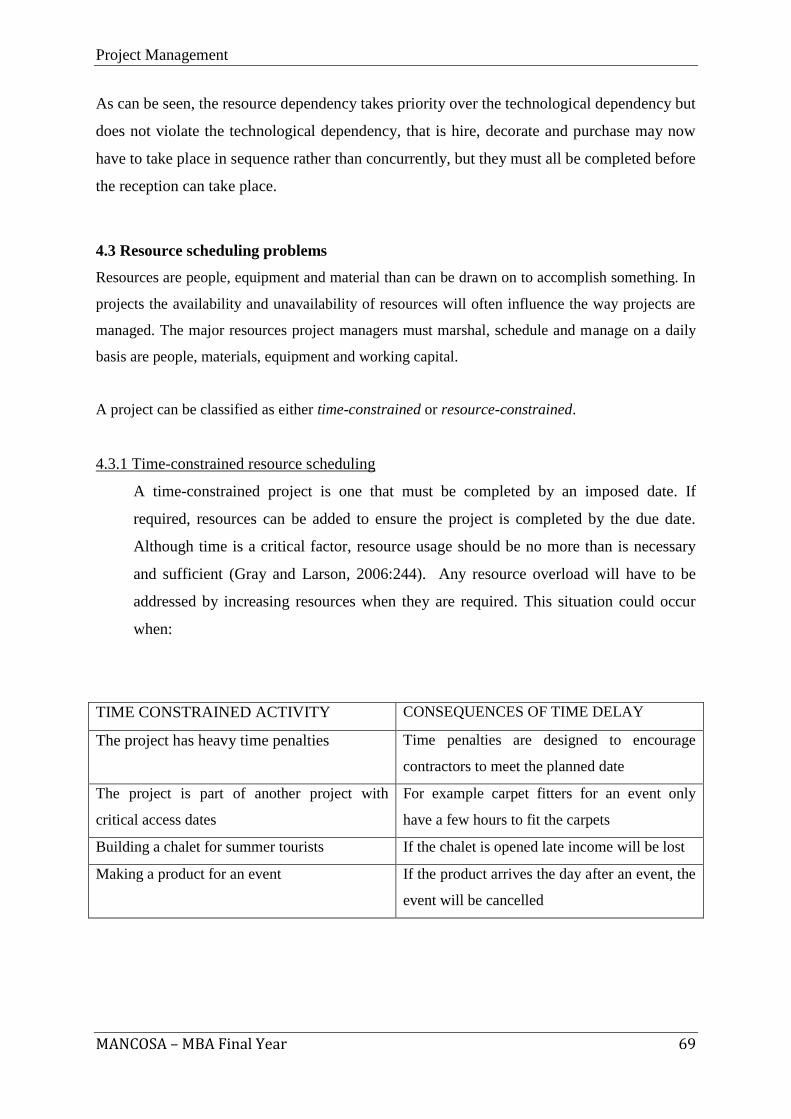
Project Management
MANCOSA – MBA Final Year 69
As can be seen, the resource dependency takes priority over the technological dependency but
does not violate the technological dependency, that is hire, decorate and purchase may now
have to take place in sequence rather than concurrently, but they must all be completed before
the reception can take place.
4.3 Resource scheduling problems
Resources are people, equipment and material than can be drawn on to accomplish something. In
projects the availability and unavailability of resources will often influence the way projects are
managed. The major resources project managers must marshal, schedule and manage on a daily
basis are people, materials, equipment and working capital.
A project can be classified as either time-constrained or resource-constrained.
4.3.1 Time-constrained resource scheduling
A time-constrained project is one that must be completed by an imposed date. If
required, resources can be added to ensure the project is completed by the due date.
Although time is a critical factor, resource usage should be no more than is necessary
and sufficient (Gray and Larson, 2006:244). Any resource overload will have to be
addressed by increasing resources when they are required. This situation could occur
when:
TIME CONSTRAINED ACTIVITY CONSEQUENCES OF TIME DELAY
The project has heavy time penalties Time penalties are designed to encourage
contractors to meet the planned date
The project is part of another project with
critical access dates
For example carpet fitters for an event only
have a few hours to fit the carpets
Building a chalet for summer tourists If the chalet is opened late income will be lost
Making a product for an event If the product arrives the day after an event, the
event will be cancelled
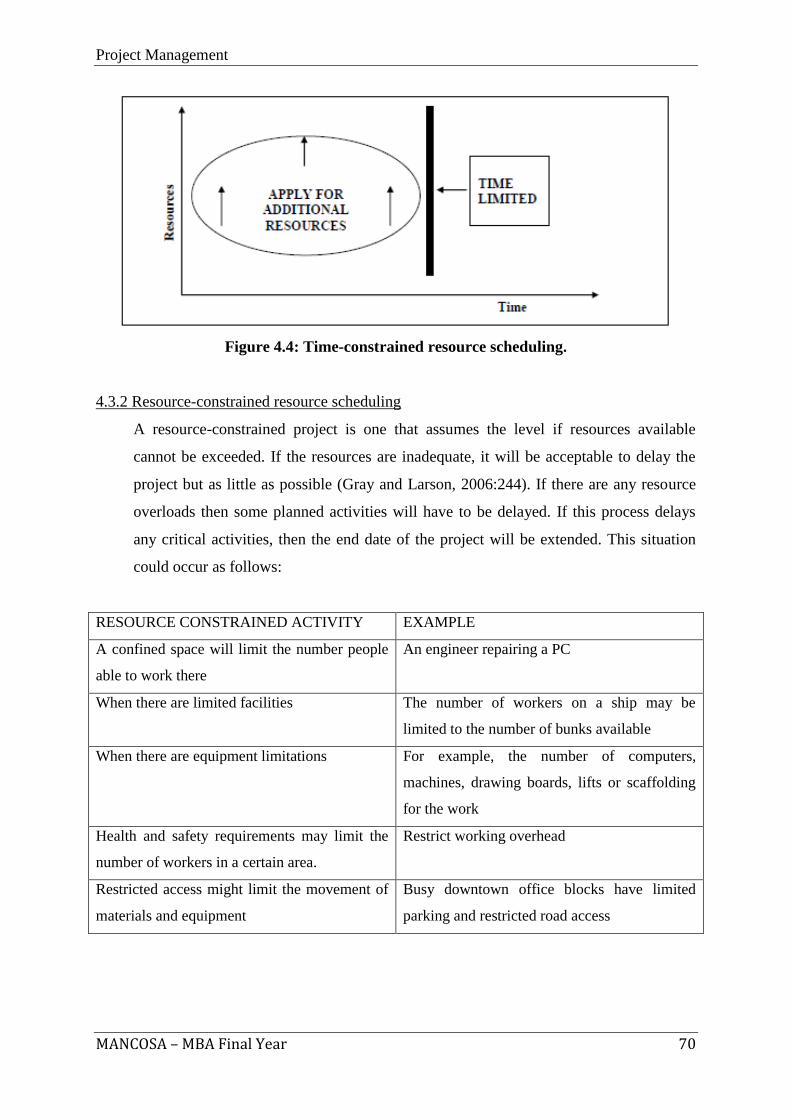
Project Management
MANCOSA – MBA Final Year 70
Figure 4.4: Time-constrained resource scheduling.
4.3.2 Resource-constrained resource scheduling
A resource-constrained project is one that assumes the level if resources available
cannot be exceeded. If the resources are inadequate, it will be acceptable to delay the
project but as little as possible (Gray and Larson, 2006:244). If there are any resource
overloads then some planned activities will have to be delayed. If this process delays
any critical activities, then the end date of the project will be extended. This situation
could occur as follows:
RESOURCE CONSTRAINED ACTIVITY EXAMPLE
A confined space will limit the number people
able to work there
An engineer repairing a PC
When there are limited facilities The number of workers on a ship may be
limited to the number of bunks available
When there are equipment limitations For example, the number of computers,
machines, drawing boards, lifts or scaffolding
for the work
Health and safety requirements may limit the
number of workers in a certain area.
Restrict working overhead
Restricted access might limit the movement of
materials and equipment
Busy downtown office blocks have limited
parking and restricted road access
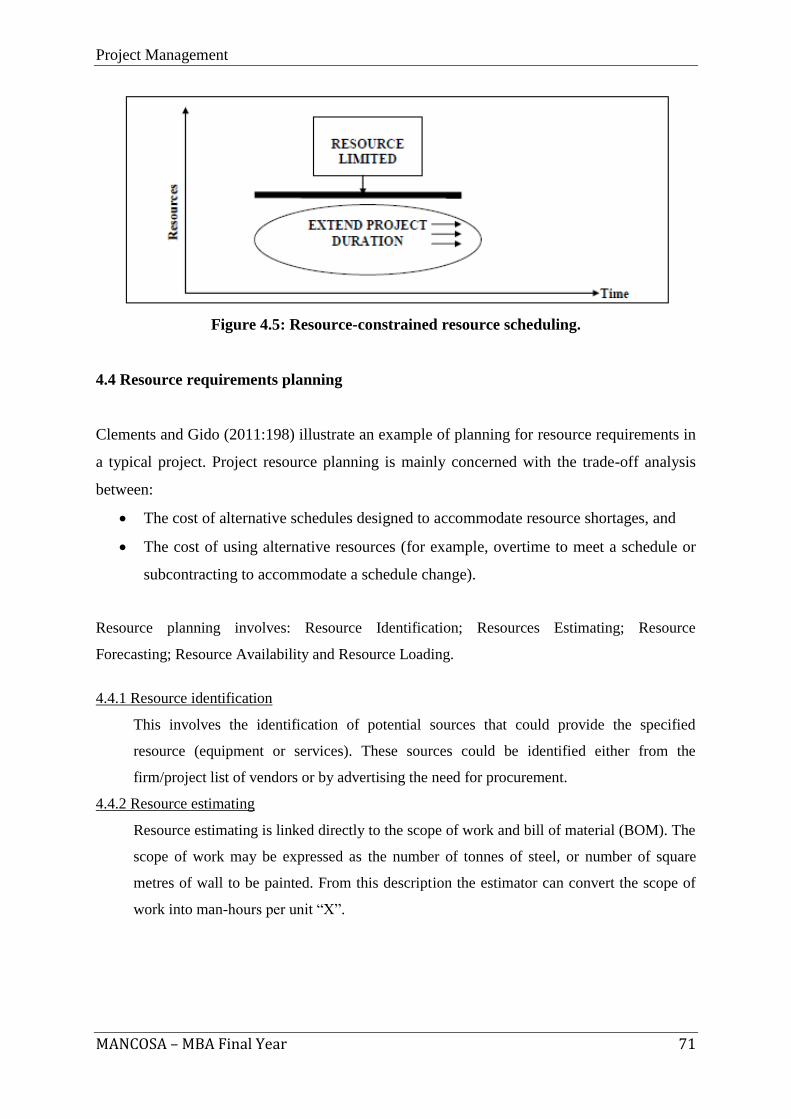
Project Management
MANCOSA – MBA Final Year 71
Figure 4.5: Resource-constrained resource scheduling.
4.4 Resource requirements planning
Clements and Gido (2011:198) illustrate an example of planning for resource requirements in
a typical project. Project resource planning is mainly concerned with the trade-off analysis
between:
The cost of alternative schedules designed to accommodate resource shortages, and
The cost of using alternative resources (for example, overtime to meet a schedule or
subcontracting to accommodate a schedule change).
Resource planning involves: Resource Identification; Resources Estimating; Resource
Forecasting; Resource Availability and Resource Loading.
4.4.1 Resource identification
This involves the identification of potential sources that could provide the specified
resource (equipment or services). These sources could be identified either from the
firm/project list of vendors or by advertising the need for procurement.
4.4.2 Resource estimating
Resource estimating is linked directly to the scope of work and bill of material (BOM). The
scope of work may be expressed as the number of tonnes of steel, or number of square
metres of wall to be painted. From this description the estimator can convert the scope of
work into man-hours per unit “X”.
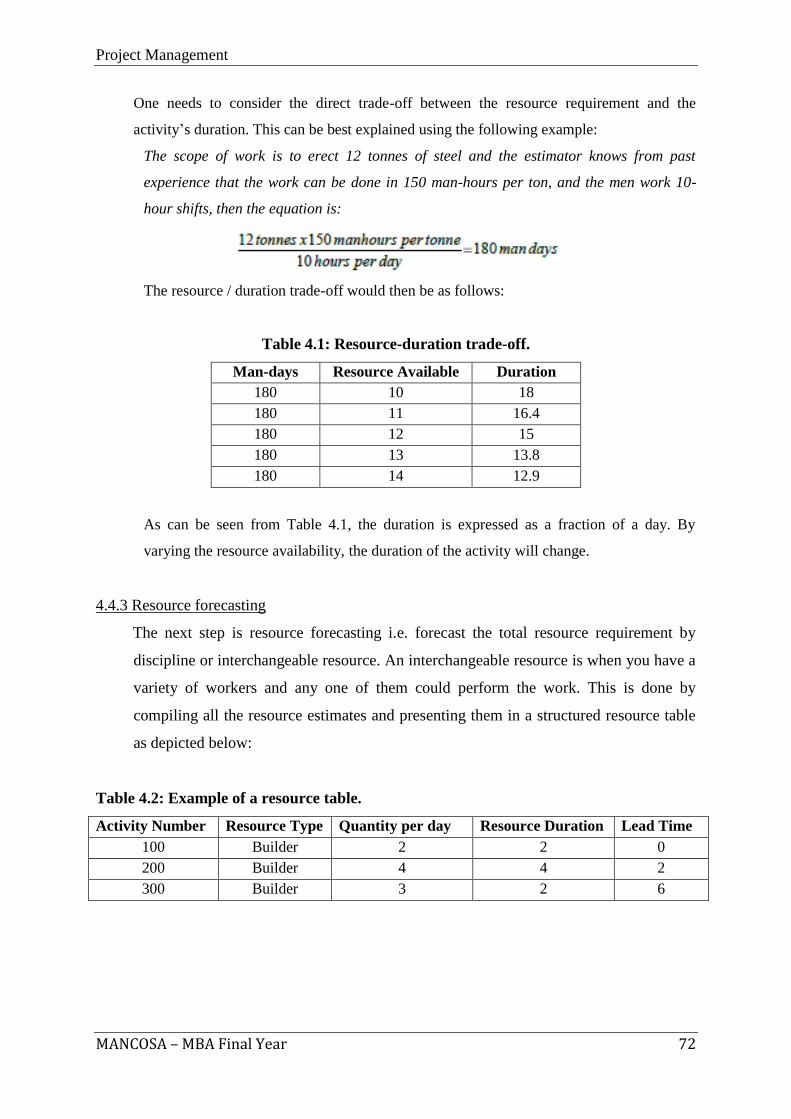
Project Management
MANCOSA – MBA Final Year 72
One needs to consider the direct trade-off between the resource requirement and the
activity’s duration. This can be best explained using the following example:
The scope of work is to erect 12 tonnes of steel and the estimator knows from past
experience that the work can be done in 150 man-hours per ton, and the men work 10-
hour shifts, then the equation is:
The resource / duration trade-off would then be as follows:
Table 4.1: Resource-duration trade-off.
Man-days Resource Available Duration
180 10 18
180 11 16.4
180 12 15
180 13 13.8
180 14 12.9
As can be seen from Table 4.1, the duration is expressed as a fraction of a day. By
varying the resource availability, the duration of the activity will change.
4.4.3 Resource forecasting
The next step is resource forecasting i.e. forecast the total resource requirement by
discipline or interchangeable resource. An interchangeable resource is when you have a
variety of workers and any one of them could perform the work. This is done by
compiling all the resource estimates and presenting them in a structured resource table
as depicted below:
Table 4.2: Example of a resource table.
Activity Number Resource Type Quantity per day Resource Duration Lead Time
100 Builder 2 2 0
200 Builder 4 4 2
300 Builder 3 2 6
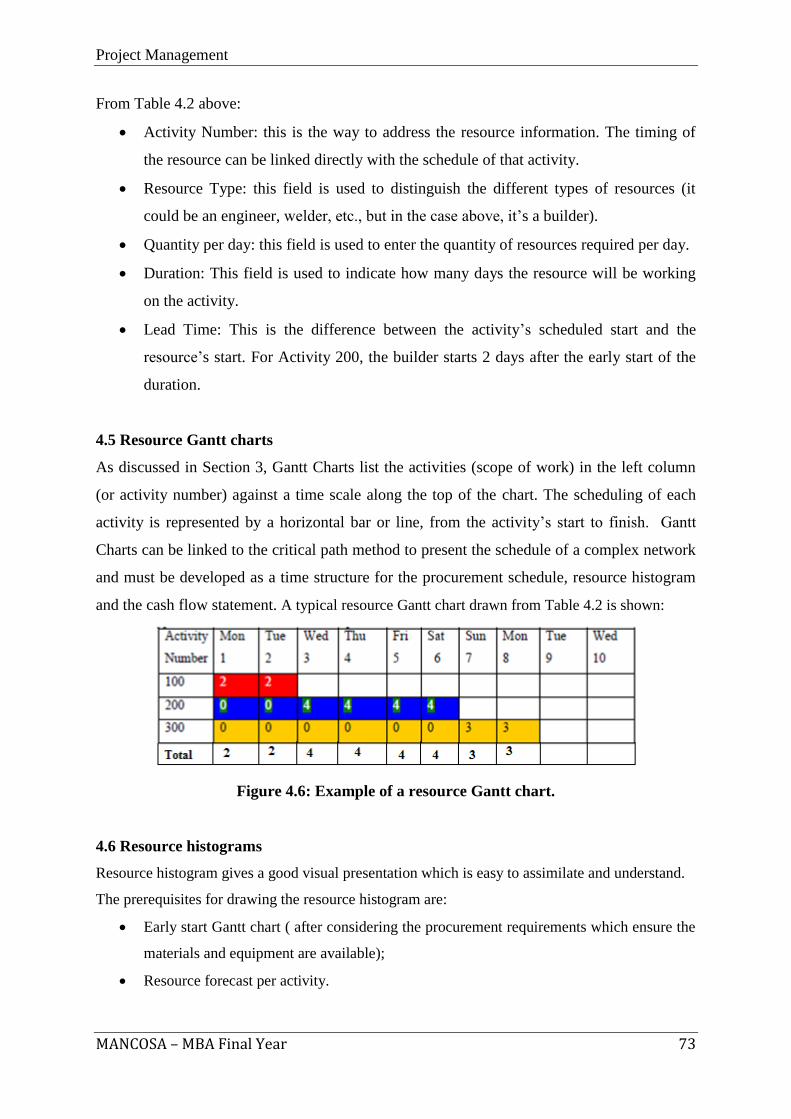
Project Management
MANCOSA – MBA Final Year 73
From Table 4.2 above:
Activity Number: this is the way to address the resource information. The timing of
the resource can be linked directly with the schedule of that activity.
Resource Type: this field is used to distinguish the different types of resources (it
could be an engineer, welder, etc., but in the case above, it’s a builder).
Quantity per day: this field is used to enter the quantity of resources required per day.
Duration: This field is used to indicate how many days the resource will be working
on the activity.
Lead Time: This is the difference between the activity’s scheduled start and the
resource’s start. For Activity 200, the builder starts 2 days after the early start of the
duration.
4.5 Resource Gantt charts
As discussed in Section 3, Gantt Charts list the activities (scope of work) in the left column
(or activity number) against a time scale along the top of the chart. The scheduling of each
activity is represented by a horizontal bar or line, from the activity’s start to finish. Gantt
Charts can be linked to the critical path method to present the schedule of a complex network
and must be developed as a time structure for the procurement schedule, resource histogram
and the cash flow statement. A typical resource Gantt chart drawn from Table 4.2 is shown:
Figure 4.6: Example of a resource Gantt chart.
4.6 Resource histograms
Resource histogram gives a good visual presentation which is easy to assimilate and understand.
The prerequisites for drawing the resource histogram are:
Early start Gantt chart ( after considering the procurement requirements which ensure the
materials and equipment are available);
Resource forecast per activity.
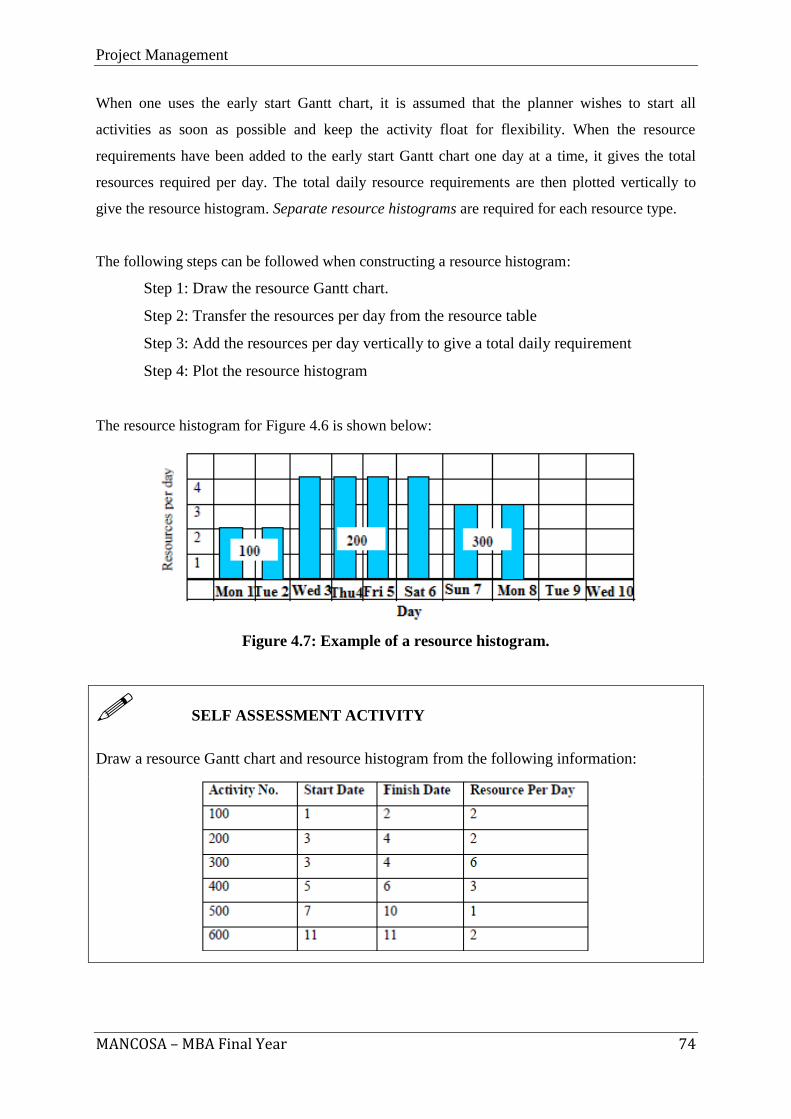
Project Management
MANCOSA – MBA Final Year 74
When one uses the early start Gantt chart, it is assumed that the planner wishes to start all
activities as soon as possible and keep the activity float for flexibility. When the resource
requirements have been added to the early start Gantt chart one day at a time, it gives the total
resources required per day. The total daily resource requirements are then plotted vertically to
give the resource histogram. Separate resource histograms are required for each resource type.
The following steps can be followed when constructing a resource histogram:
Step 1: Draw the resource Gantt chart.
Step 2: Transfer the resources per day from the resource table
Step 3: Add the resources per day vertically to give a total daily requirement
Step 4: Plot the resource histogram
The resource histogram for Figure 4.6 is shown below:
Figure 4.7: Example of a resource histogram.
SELF ASSESSMENT ACTIVITY
Draw a resource Gantt chart and resource histogram from the following information:
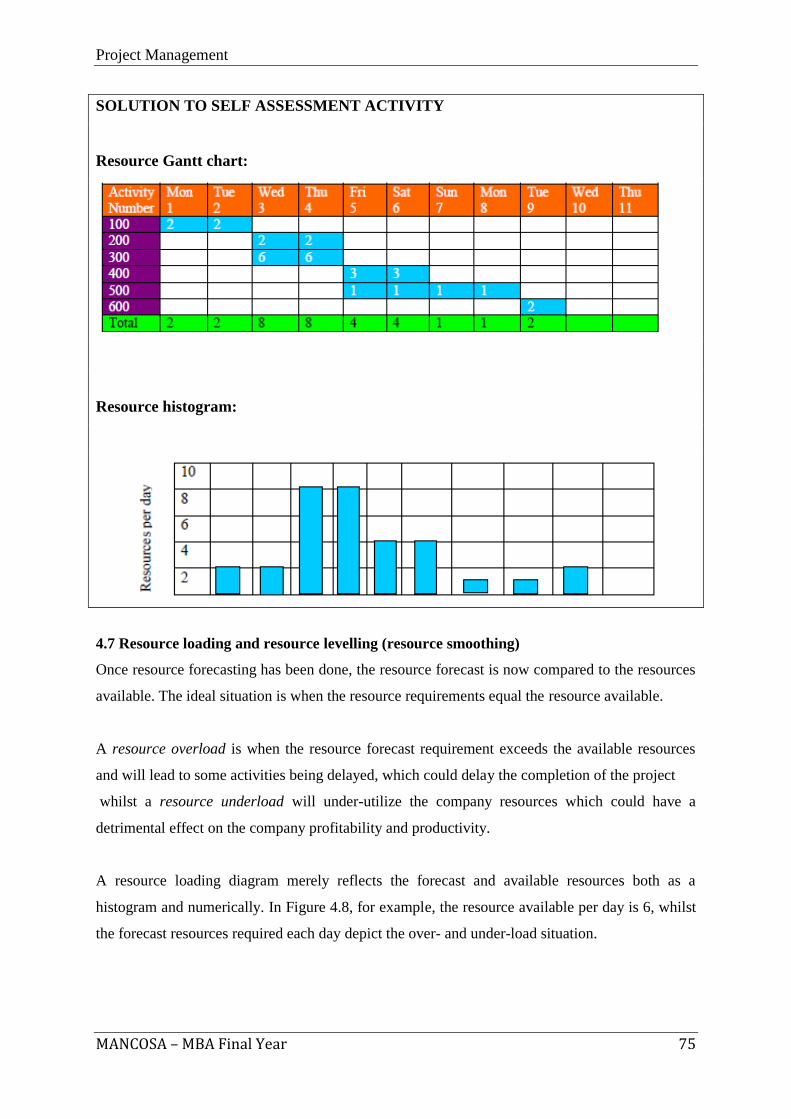
Project Management
MANCOSA – MBA Final Year 75
SOLUTION TO SELF ASSESSMENT ACTIVITY
Resource Gantt chart:
Resource histogram:
4.7 Resource loading and resource levelling (resource smoothing)
Once resource forecasting has been done, the resource forecast is now compared to the resources
available. The ideal situation is when the resource requirements equal the resource available.
A resource overload is when the resource forecast requirement exceeds the available resources
and will lead to some activities being delayed, which could delay the completion of the project
whilst a resource underload will under-utilize the company resources which could have a
detrimental effect on the company profitability and productivity.
A resource loading diagram merely reflects the forecast and available resources both as a
histogram and numerically. In Figure 4.8, for example, the resource available per day is 6, whilst
the forecast resources required each day depict the over- and under-load situation.
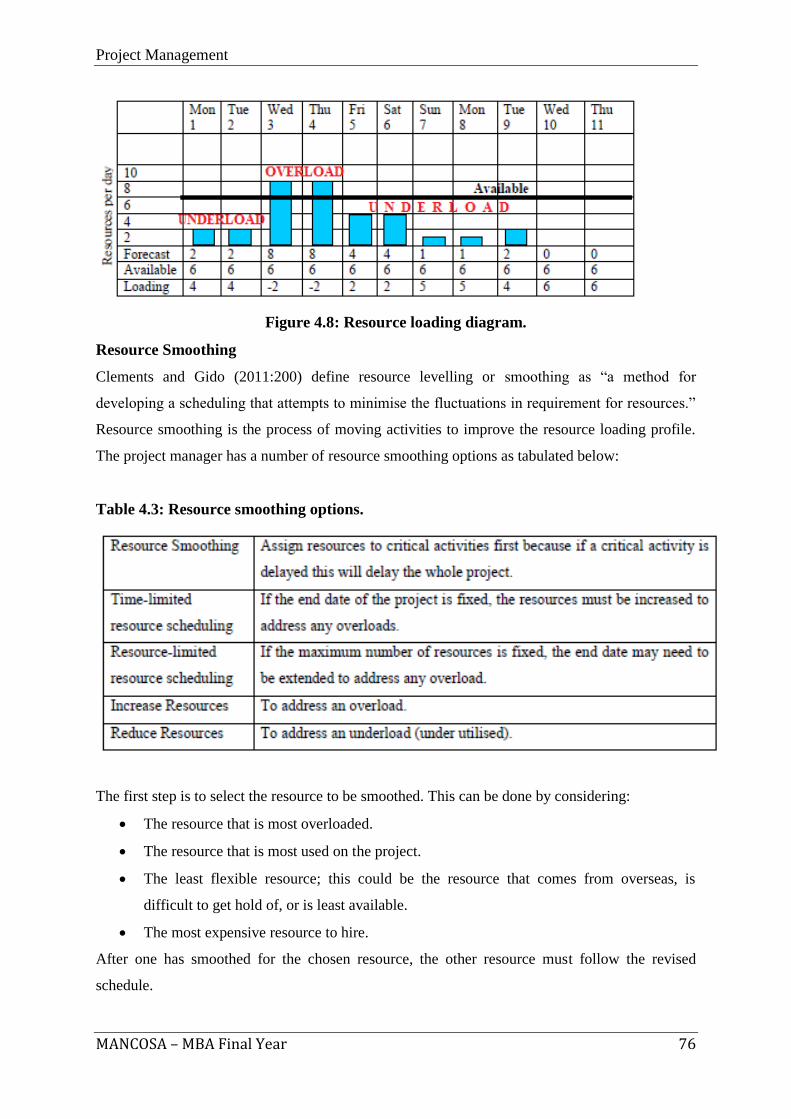
Project Management
MANCOSA – MBA Final Year 76
Figure 4.8: Resource loading diagram.
Resource Smoothing
Clements and Gido (2011:200) define resource levelling or smoothing as “a method for
developing a scheduling that attempts to minimise the fluctuations in requirement for resources.”
Resource smoothing is the process of moving activities to improve the resource loading profile.
The project manager has a number of resource smoothing options as tabulated below:
Table 4.3: Resource smoothing options.
The first step is to select the resource to be smoothed. This can be done by considering:
The resource that is most overloaded.
The resource that is most used on the project.
The least flexible resource; this could be the resource that comes from overseas, is
difficult to get hold of, or is least available.
The most expensive resource to hire.
After one has smoothed for the chosen resource, the other resource must follow the revised
schedule.
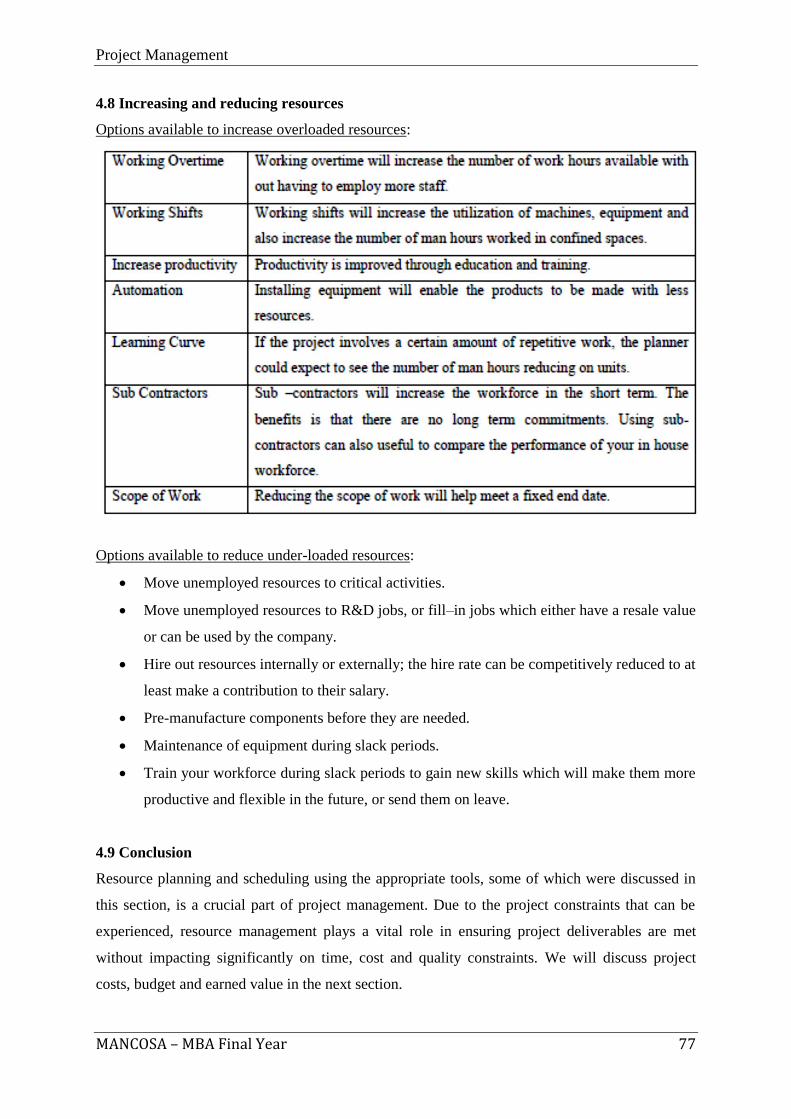
Project Management
MANCOSA – MBA Final Year 77
4.8 Increasing and reducing resources
Options available to increase overloaded resources:
Options available to reduce under-loaded resources:
Move unemployed resources to critical activities.
Move unemployed resources to R&D jobs, or fill–in jobs which either have a resale value
or can be used by the company.
Hire out resources internally or externally; the hire rate can be competitively reduced to at
least make a contribution to their salary.
Pre-manufacture components before they are needed.
Maintenance of equipment during slack periods.
Train your workforce during slack periods to gain new skills which will make them more
productive and flexible in the future, or send them on leave.
4.9 Conclusion
Resource planning and scheduling using the appropriate tools, some of which were discussed in
this section, is a crucial part of project management. Due to the project constraints that can be
experienced, resource management plays a vital role in ensuring project deliverables are met
without impacting significantly on time, cost and quality constraints. We will discuss project
costs, budget and earned value in the next section.
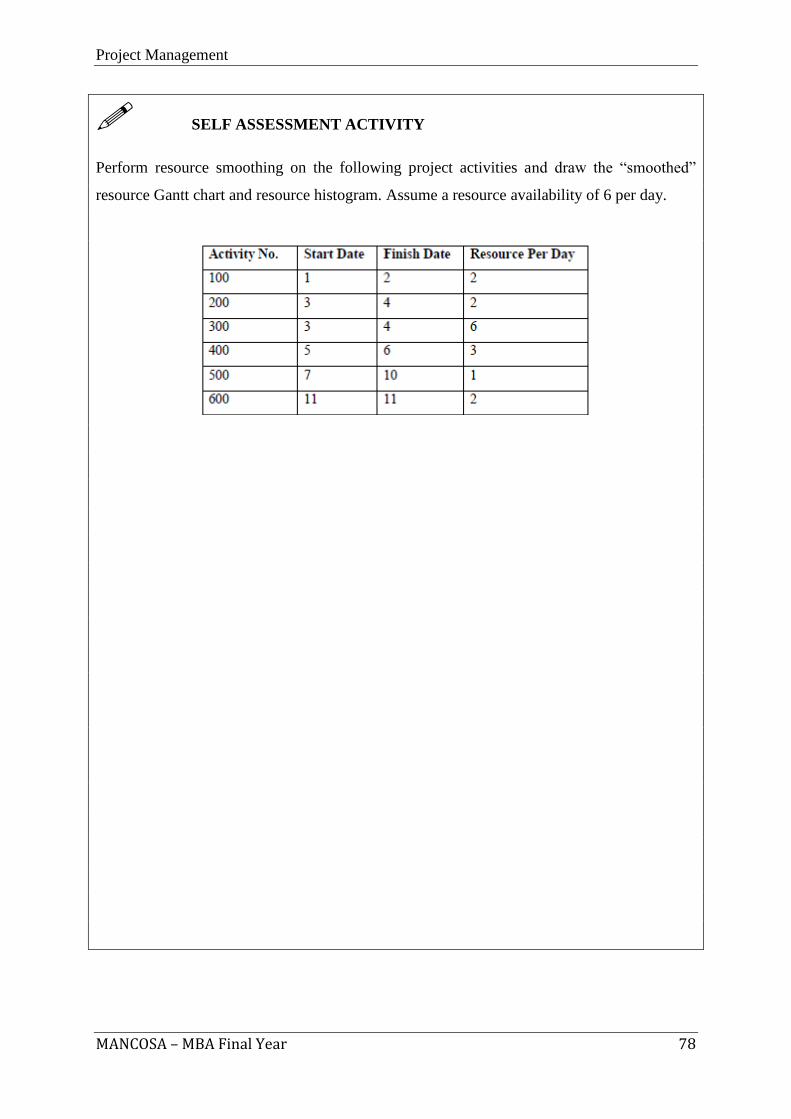
Project Management
MANCOSA – MBA Final Year 78
SELF ASSESSMENT ACTIVITY
Perform resource smoothing on the following project activities and draw the “smoothed”
resource Gantt chart and resource histogram. Assume a resource availability of 6 per day.

Project Management
MANCOSA – MBA Final Year 79
SOLUTION TO SELF ASSESSMENT ACTIVITY
The resource load can be addressed by simply moving activity 200 by 2 days. To see the
impact of moving activity 200 by 2 days one needs to draw a critical path network diagram
first:
As can be seen from the CPM diagram activity 200 has a finish to start relationship with
activity 400, therefore activity 400 will also need to move forward by 2 days. The resulting
Gantt chart and resource smoothed histogram will now look as follows:
Project Management
MANCOSA – MBA Final Year 80
SECTION 5
5. PROJECT COSTS, BUDGET AND EARNED
VALUE
Project Management
MANCOSA – MBA Final Year 81
CONTENTS
Learning outcomes
Reading Material
5.1 Introduction
5.2 Estimating activity costs
5.3 Project budget
5.4 Actual costs
5.5 Earned value management
5.6 Managing cash flow
5.7 Conclusion
Project Management
MANCOSA – MBA Final Year 82
Learning Outcomes:
The overall outcome for this section is that, on its completion, the learner should be able to
demonstrate an understanding of project costs, budget and earned value management. This
overall outcome will be achieved through the learner’s mastery of the following specific
outcomes, in that the learner will be able to:
1. Identify different project costs.
2. Explain different cost estimating techniques.
3. Apply project budgeting and determine actual costs during project execution.
4. Discuss the significance and process of earned value management.
5. Calculate and explain the meaning of each of the earned value management terms.
Project Management
MANCOSA – MBA Final Year 83
Reading Material:
READING
Prescribed reading:
Clements, J. P. and Gido, J. (2011). Effective Project Management. 5th
Edition. Boston:
Cengage Learning.
Recommended reading:
Burke, R. (2006). Project management: Planning and control techniques. 5th
Edition. China:
Burke Publishing.
Chandra, P. (2002). Projects: Planning, Analysis, Financing, Implementation and Review. 5th
Edition. New Delhi: Tata McGraw-Hill Publishing Company Limited.
Goodpasture, J.C. 2004). Quantitative Methods in Project Management. 1st Edition. Mumbai:
Shroff Publishers.
Schwalbe, K. (2009). Introduction to Project Management. 2nd
Edition. Boston: Cengage
Learning.
Turner, J.R. and Simister, S. (2004). Project Management: A Comprehensive Handbook. 1st
Edition. New Delhi: Gower Publishing Limited.
Project Management
MANCOSA – MBA Final Year 84
5.1 Introduction
This section deals with the estimation of costs and determining the project budget. During the
project execution, the actual costs must be monitored against the budget, and the earned value
of the work performed must be determined. Clements and Gido (2011) state that the
following cost-related parameters should be monitored during the project:
Cumulative actual amount spent since the start of the project;
Cumulative earned value of the work performed since the start of the project;
Cumulative budgeted amount planned to be spent, based on the project schedule, from
the start of the project.
Some important financial concepts that students will also become familiar with are:
estimating costs of activities; determining a time-phased baseline budget and earned value of
work performed; analysing, forecasting and controlling project costs; and managing cash
flow.
5.2 Estimating activity costs
Cost estimating involves approximating or estimating the costs of resources required to
complete a project. Cost budgeting involves the allocation of the overall cost estimate to
individual tasks over time to establish a baseline for measuring performance. If a project
manager wants to effectively plan and control a project, accurate estimating is vital.
According to Burke (2009:84), the quality and accuracy of the estimate can be continually
improved as the project is progressively executed, and more accurate and detailed
information comes to the fore. However, the project manager is often forced to do a cost
estimate at the tender or quotation stage when the amount of data and information is usually
limited. Burke (2009:88) subdivides project cost estimates as follows:
Direct and indirect costs
Fixed and variable costs
Time-related costs
Labour, material and equipment costs
Transport costs
Preliminary and general (P&G) costs
Project office costs
Project team costs
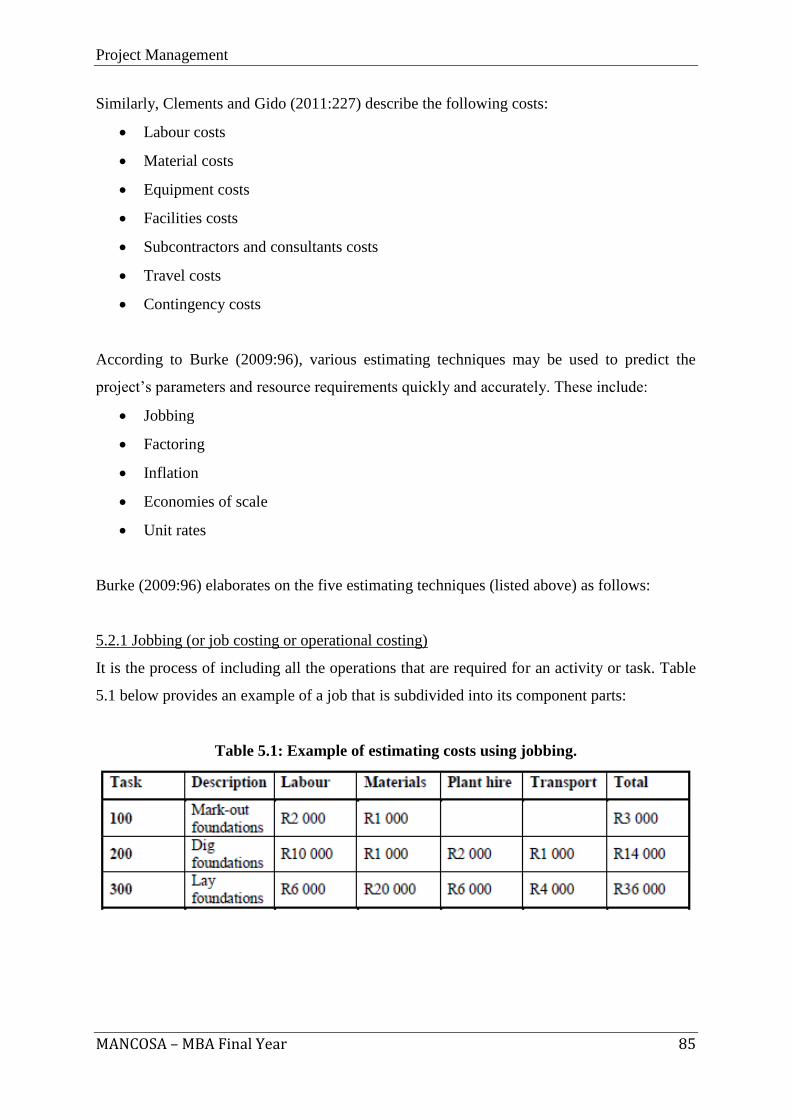
Project Management
MANCOSA – MBA Final Year 85
Similarly, Clements and Gido (2011:227) describe the following costs:
Labour costs
Material costs
Equipment costs
Facilities costs
Subcontractors and consultants costs
Travel costs
Contingency costs
According to Burke (2009:96), various estimating techniques may be used to predict the
project’s parameters and resource requirements quickly and accurately. These include:
Jobbing
Factoring
Inflation
Economies of scale
Unit rates
Burke (2009:96) elaborates on the five estimating techniques (listed above) as follows:
5.2.1 Jobbing (or job costing or operational costing)
It is the process of including all the operations that are required for an activity or task. Table
5.1 below provides an example of a job that is subdivided into its component parts:
Table 5.1: Example of estimating costs using jobbing.
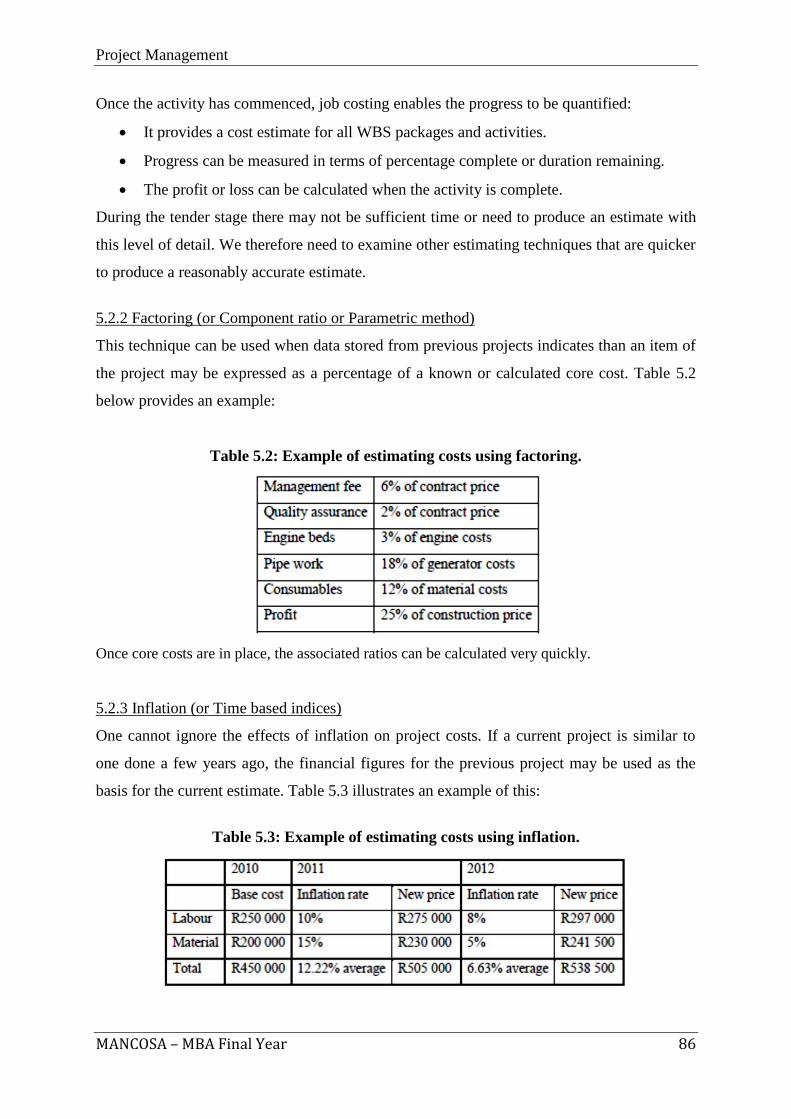
Project Management
MANCOSA – MBA Final Year 86
Once the activity has commenced, job costing enables the progress to be quantified:
It provides a cost estimate for all WBS packages and activities.
Progress can be measured in terms of percentage complete or duration remaining.
The profit or loss can be calculated when the activity is complete.
During the tender stage there may not be sufficient time or need to produce an estimate with
this level of detail. We therefore need to examine other estimating techniques that are quicker
to produce a reasonably accurate estimate.
5.2.2 Factoring (or Component ratio or Parametric method)
This technique can be used when data stored from previous projects indicates than an item of
the project may be expressed as a percentage of a known or calculated core cost. Table 5.2
below provides an example:
Table 5.2: Example of estimating costs using factoring.
Once core costs are in place, the associated ratios can be calculated very quickly.
5.2.3 Inflation (or Time based indices)
One cannot ignore the effects of inflation on project costs. If a current project is similar to
one done a few years ago, the financial figures for the previous project may be used as the
basis for the current estimate. Table 5.3 illustrates an example of this:
Table 5.3: Example of estimating costs using inflation.
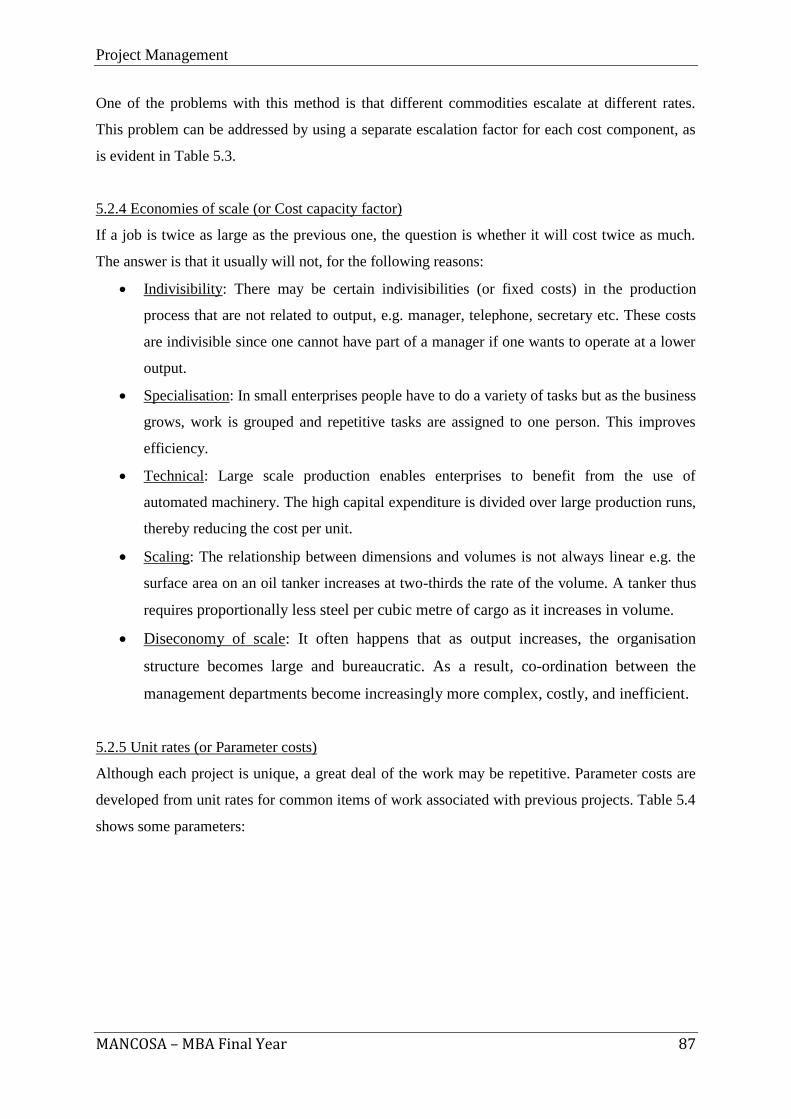
Project Management
MANCOSA – MBA Final Year 87
One of the problems with this method is that different commodities escalate at different rates.
This problem can be addressed by using a separate escalation factor for each cost component, as
is evident in Table 5.3.
5.2.4 Economies of scale (or Cost capacity factor)
If a job is twice as large as the previous one, the question is whether it will cost twice as much.
The answer is that it usually will not, for the following reasons:
Indivisibility: There may be certain indivisibilities (or fixed costs) in the production
process that are not related to output, e.g. manager, telephone, secretary etc. These costs
are indivisible since one cannot have part of a manager if one wants to operate at a lower
output.
Specialisation: In small enterprises people have to do a variety of tasks but as the business
grows, work is grouped and repetitive tasks are assigned to one person. This improves
efficiency.
Technical: Large scale production enables enterprises to benefit from the use of
automated machinery. The high capital expenditure is divided over large production runs,
thereby reducing the cost per unit.
Scaling: The relationship between dimensions and volumes is not always linear e.g. the
surface area on an oil tanker increases at two-thirds the rate of the volume. A tanker thus
requires proportionally less steel per cubic metre of cargo as it increases in volume.
Diseconomy of scale: It often happens that as output increases, the organisation
structure becomes large and bureaucratic. As a result, co-ordination between the
management departments become increasingly more complex, costly, and inefficient.
5.2.5 Unit rates (or Parameter costs)
Although each project is unique, a great deal of the work may be repetitive. Parameter costs are
developed from unit rates for common items of work associated with previous projects. Table 5.4
shows some parameters:
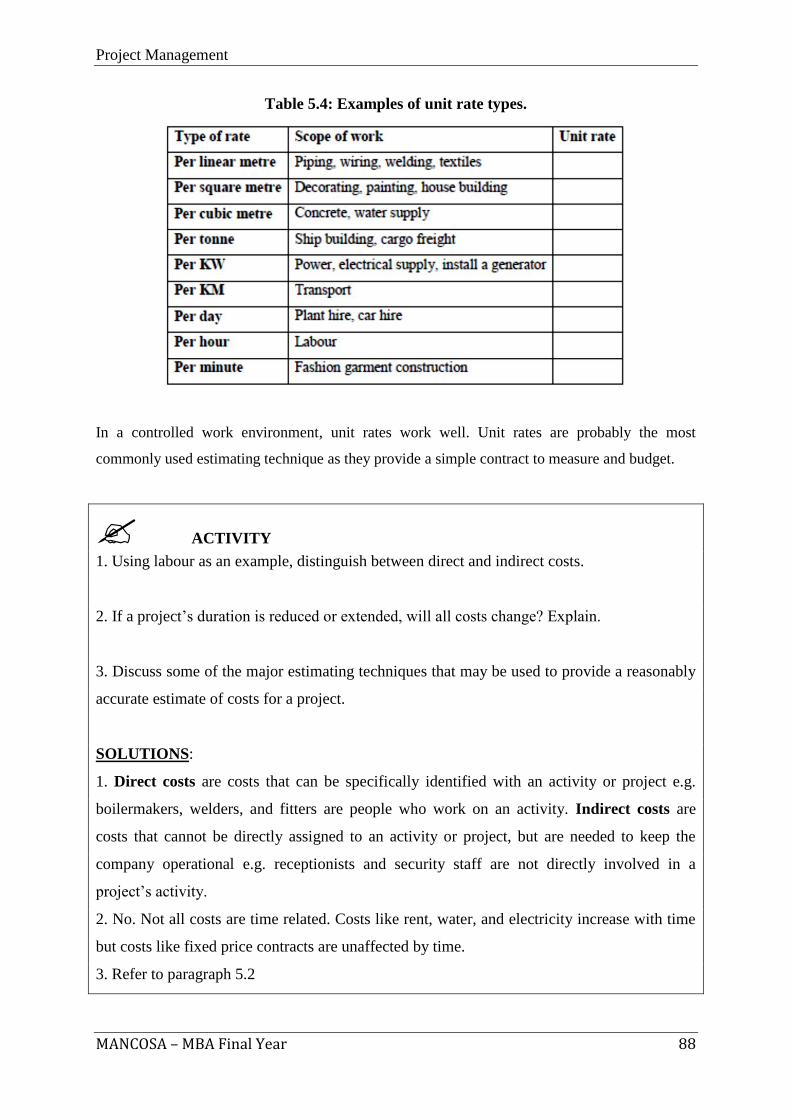
Project Management
MANCOSA – MBA Final Year 88
Table 5.4: Examples of unit rate types.
In a controlled work environment, unit rates work well. Unit rates are probably the most
commonly used estimating technique as they provide a simple contract to measure and budget.
ACTIVITY
1. Using labour as an example, distinguish between direct and indirect costs.
2. If a project’s duration is reduced or extended, will all costs change? Explain.
3. Discuss some of the major estimating techniques that may be used to provide a reasonably
accurate estimate of costs for a project.
SOLUTIONS:
1. Direct costs are costs that can be specifically identified with an activity or project e.g.
boilermakers, welders, and fitters are people who work on an activity. Indirect costs are
costs that cannot be directly assigned to an activity or project, but are needed to keep the
company operational e.g. receptionists and security staff are not directly involved in a
project’s activity.
2. No. Not all costs are time related. Costs like rent, water, and electricity increase with time
but costs like fixed price contracts are unaffected by time.
3. Refer to paragraph 5.2
Project Management
MANCOSA – MBA Final Year 89
5.3 Project budget
According to Schwalbe (2009:151), project cost budgeting involves the allocation of project
cost estimates to different tasks over time. These tasks are based on the work breakdown
structure (WBS) of the project. The main aim of cost budgeting is to produce a cost baseline.
A cost baseline may be defined as a time-phased budget that project managers use to measure
and monitor cost performance. Estimating costs for each major project activity over time
provides project managers and top management with a foundation for project cost control
using earned value management which will be discussed later.
Clements and Gido (2011:229) describe the project budget as a two-step process:
Aggregated total budgeted cost: The aggregated estimated costs of the specific
activities for each work package will establish the total budgeted cost (TBC) or
budget at completion (BAC). This aggregated budgeted cost should not exceed the
total amount of funds that the sponsor budgeted for the project (Clements and Gido,
2011).
Cumulative budgeted cost: Once the TBC for each work package is established, the
next step is to distribute each TBC over the expected time span of its work package
(Clements and Gido, 2011). This time-phased budget is useful to track the actual
spend against the cumulative budgeted cost (CBC) for each time period.
5.4 Actual costs
Clements and Gido (2011) suggest the use of processes, procedures and forms for gathering
data which reflects the costs actually expended. For example, weekly time sheets can be used
to collect actual labour hours. As invoices are received, these must be charged to the correct
work package number. Committed costs (commitments, obligated costs or encumbered costs)
should be treated in a special way as they extend across several cost reporting periods
(Clements and Gido, 2011).
As portions of actual costs, including committed costs, are collected for a particular
work package period (cumulative actual costs or CAC), they must be compared against the
cumulative budgeted cost (CBC).
Project Management
MANCOSA – MBA Final Year 90
5.5 Earned value management
Earned value management may be defined as “a management methodology for integrating scope,
schedule and resources, and for objectively measuring project performance and progress”
(Kloppenborg, 2009:393). Earned value may be described as the value of work completed
expressed in terms of the approved budget allocated to that work. Clements and Gido (2011)
define earned value as “the value of work actually performed” and state that it is a “key parameter
that must be determined throughout the project. Earned value is calculated by collecting data on
the percent complete for each work package, and then converting this percentage to a monetary
value. The formula used is: EV = TBC of work package x Percent complete.
Earned value, according Kloppenborg (2009:393), makes it possible for a project team to
understand their project’s progress with regard to cost and schedule as well as to make forecasts
regarding the project’s schedule and cost control until the completion of the project. Earned value
is an important decision-making tool. The project manager can do a quick assessment of how the
project is doing according to the baseline plan and whether the project would end without any
significant cost/schedule impacts. The earned value data permits a project manager to determine
the status of a project at any given point in time.
When interpreting earned value management, one must consider cost and schedule independently.
Firstly, in terms of the planned schedule, a project can be either ahead or behind; and in terms of
budget, a project can be either over or under. Secondly, all earned value terms relate to one of two
time frames. Each of the above either represents the current status as of the last date that project
data was collected, or a forecast for the end of the project. Table 5.5 lists 12 questions and
answers that reflect all the earned value management terms.
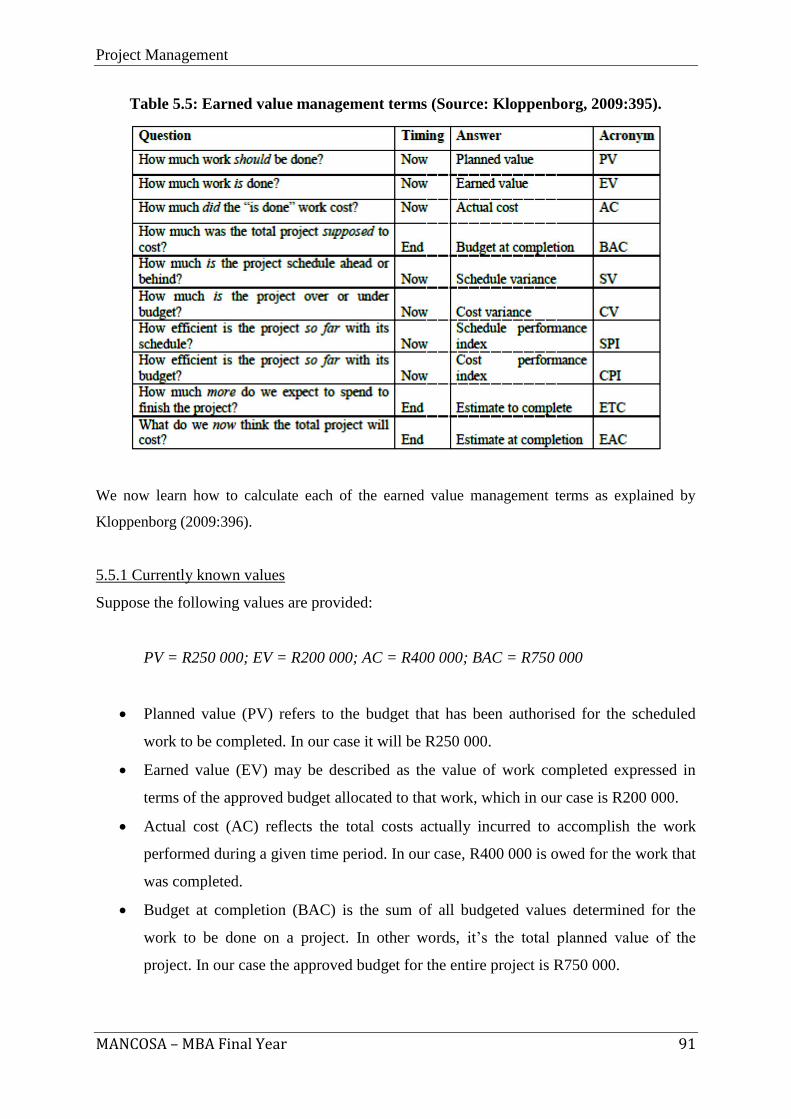
Project Management
MANCOSA – MBA Final Year 91
Table 5.5: Earned value management terms (Source: Kloppenborg, 2009:395).
We now learn how to calculate each of the earned value management terms as explained by
Kloppenborg (2009:396).
5.5.1 Currently known values
Suppose the following values are provided:
PV = R250 000; EV = R200 000; AC = R400 000; BAC = R750 000
Planned value (PV) refers to the budget that has been authorised for the scheduled
work to be completed. In our case it will be R250 000.
Earned value (EV) may be described as the value of work completed expressed in
terms of the approved budget allocated to that work, which in our case is R200 000.
Actual cost (AC) reflects the total costs actually incurred to accomplish the work
performed during a given time period. In our case, R400 000 is owed for the work that
was completed.
Budget at completion (BAC) is the sum of all budgeted values determined for the
work to be done on a project. In other words, it’s the total planned value of the
project. In our case the approved budget for the entire project is R750 000.
Project Management
MANCOSA – MBA Final Year 92
5.5.2 Variances
Schedule variance (SV) measures schedule performance on a project. It is the difference
between EV and PV. In our example the calculation will be:
EV – PV = R200 000 – R250 000 = –R50 000
The negative value is an indication that the project is behind schedule.
Cost variance (CV) measures the cost performance on a project. It is the difference between
EV and AC. In our example the calculation is as follows:
EV – AC = R200 000 – R400 000 = –R200 000
The negative answer shows that the project is over budget.
These two variances shows in monetary terms how well or poorly the project is performing in
terms of cost and schedule. Clearly, the performance is poor in terms of both cost and
schedule.
5.5.3 Indices
Some project managers prefer to use efficiency measures in percentage terms to understand
how well or poorly the project is performing. Schedule performance index (SPI) measures
schedule efficiency on a project. It is calculated as follows:
In our case, SPI will be calculated as follows:
Since only 80% of what was planned has been accomplished, the project is behind schedule.
When performance indexes are used: 100% means right on schedule; <100% means less
efficient than planned; and >100% means more efficient than planned.
Cost performance index (CPI) measures cost efficiency on a project. It is calculated as follows:
In our case, CPI will be calculated as follows:
The project is over budget since only R0.50 (fifty cents) of results was received for every Rand
that was spent.
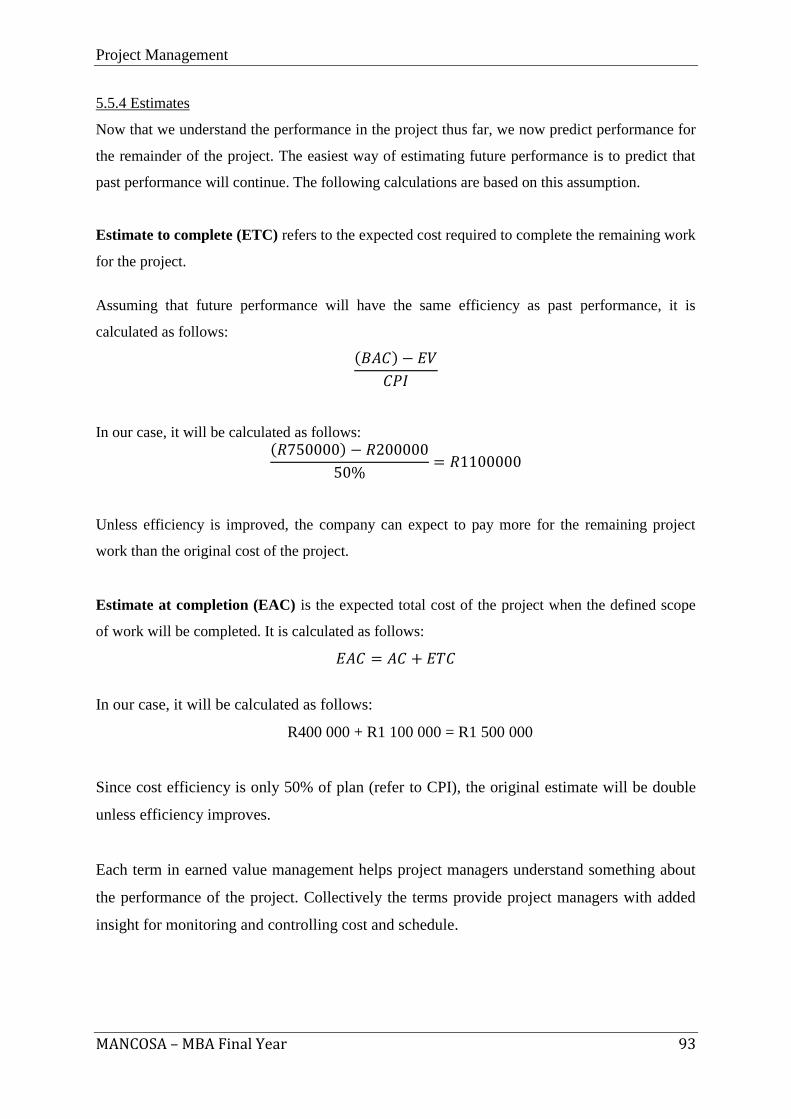
Project Management
MANCOSA – MBA Final Year 93
5.5.4 Estimates
Now that we understand the performance in the project thus far, we now predict performance for
the remainder of the project. The easiest way of estimating future performance is to predict that
past performance will continue. The following calculations are based on this assumption.
Estimate to complete (ETC) refers to the expected cost required to complete the remaining work
for the project.
Assuming that future performance will have the same efficiency as past performance, it is
calculated as follows:
( )
In our case, it will be calculated as follows: ( )
Unless efficiency is improved, the company can expect to pay more for the remaining project
work than the original cost of the project.
Estimate at completion (EAC) is the expected total cost of the project when the defined scope
of work will be completed. It is calculated as follows:
In our case, it will be calculated as follows:
R400 000 + R1 100 000 = R1 500 000
Since cost efficiency is only 50% of plan (refer to CPI), the original estimate will be double
unless efficiency improves.
Each term in earned value management helps project managers understand something about
the performance of the project. Collectively the terms provide project managers with added
insight for monitoring and controlling cost and schedule.
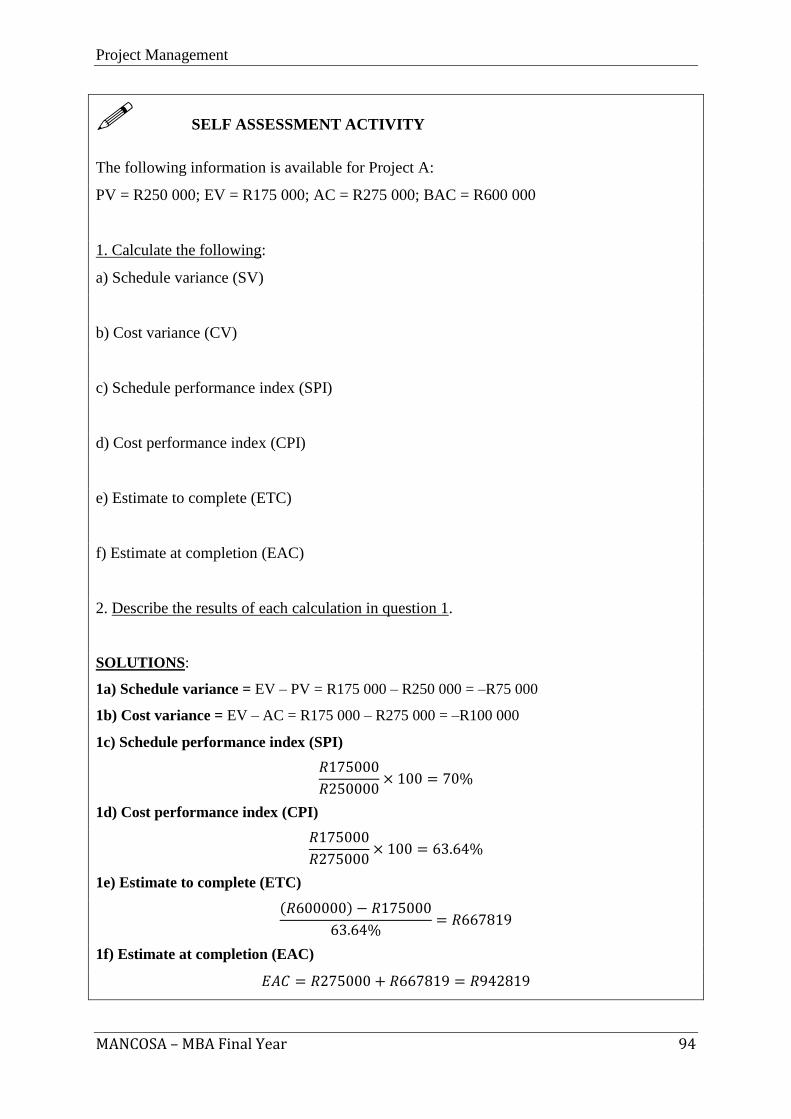
Project Management
MANCOSA – MBA Final Year 94
SELF ASSESSMENT ACTIVITY
The following information is available for Project A:
PV = R250 000; EV = R175 000; AC = R275 000; BAC = R600 000
1. Calculate the following:
a) Schedule variance (SV)
b) Cost variance (CV)
c) Schedule performance index (SPI)
d) Cost performance index (CPI)
e) Estimate to complete (ETC)
f) Estimate at completion (EAC)
2. Describe the results of each calculation in question 1.
SOLUTIONS:
1a) Schedule variance = EV – PV = R175 000 – R250 000 = –R75 000
1b) Cost variance = EV – AC = R175 000 – R275 000 = –R100 000
1c) Schedule performance index (SPI)
1d) Cost performance index (CPI)
1e) Estimate to complete (ETC)
( )
1f) Estimate at completion (EAC)
Project Management
MANCOSA – MBA Final Year 95
SOLUTIONS TO SELF ASSESSMENT ACTIVITY (CONTINUED)
2.
Schedule variance (SV): The project is behind schedule since the variation is negative.
Cost variance (CV): The project is over budget since the variation is negative.
Schedule performance index (SPI): The project is behind schedule since only 70% of what
was planned was accomplished.
Cost performance index (CPI): The project is over budget since only R0.64 worth of results
was received for every Rand spent.
Estimate to complete (ETC): The cost to complete the remaining work for the project is
R667 819 which is even greater than the original cost of the entire project.
Estimate at completion (EAC): Since the cost efficiency is only about two thirds of the
plan, unless there is greater efficiency, it can be expected that the company would have to pay
just over 1½ times the original estimate.
5.6 Managing cash flow
According to Clements and Gido (2011), managing cash flow involves ensuring that the
funds from the sponsor or income from payments received are carried out timeously so that
there is enough money to cover the costs of executing the project. Cash must come in faster
than it can go out. Payments to the contractor must also be made on time. Providing down
payments at the start of the project, making equal monthly payments based on the expected
duration of the project, or providing frequent payments are options to consider (Clements and
Gido, 2011).
5.7 Conclusion
Financing a project is generally the first stage, and is beyond the scope of this module.
Estimating costs is one of the early stages of project cost, budget and earned value
management. This leads the project manager on to determining the budget for the project.
Actual costs must then be gathered during the project and compared against the budget.
Earned value management and its associated parameters is an important way of tracking
project progress in terms of value gained from money spent.
The next section deals with communication and risk management.
Project Management
MANCOSA – MBA Final Year 96
SECTION 6
6. PROJECT COMMUNICATION AND
DOCUMENTATION
Project Management
MANCOSA – MBA Final Year 97
CONTENTS
Learning outcomes
Reading Material
6.1 Introduction
6.2 Communication in a project environment
6.3 Personal communication
6.4 Significance of communication in project management
6.5 Project meetings
6.6 Project presentations
6.7 Project reports
6.8 Project communication plan
6.9 Conclusion
Project Management
MANCOSA – MBA Final Year 98
Learning Outcomes:
The overall outcome for this section is that, on its completion, the learner should be able to
demonstrate an understanding of project communication and documentation. This overall
outcome will be achieved through the learner’s mastery of the following specific outcomes,
in that the learner will be able to:
1. Describe communication in a project environment.
2. Distinguish between verbal and non-verbal communication.
3. Discuss the significance of communication in project management.
4. Identify and describe the different types of project meetings, and discuss the
purpose and hosting of each.
5. Identify and describe the different types of project reports, and discuss the purpose
each.
6. Describe and formulate a project communication plan.
Project Management
MANCOSA – MBA Final Year 99
Reading Material:
READING
Prescribed reading:
Clements, J. P. and Gido, J. (2011). Effective Project Management. 5th
Edition. Boston:
Cengage Learning.
Recommended reading:
Burke, R.J. and Barron, S. (2007). Project Management Leadership. Hampshire: Burke
Publishing.
Schwalbe, K. (2009). Introduction to Project Management. 2nd
Edition. Boston: Cengage
Learning.
Project Management
MANCOSA – MBA Final Year 100
6.1 Introduction
Communication in any institution is critical to its success, and this is certainly true of
projects. The aim of communication is to ensure that the information necessary for the
management of projects is collected and exchanged or distributed on time, and that when
required, is adequately stored for easier retrieval. This requires a communication plan, as part
of the project plan, which specifies what information will be collected and when, who will be
responsible for the collection and analysis of the data, and to whom, how and when it will be
distributed.
Communication skills and planning are essential to address the issues and challenges
associated with project management. Communication is the basis for gaining understanding
between project team members, for discussing project issues and for settling team disputes.
People in an institution must communicate, but the criteria that characterise project activities
means that they must communicate effectively and efficiently if the work is to be well
directed and managed.
The way project outcomes are communicated can affect how people perceive and accept
those outcomes. Project managers and project team members should be effective
communicators. Communication is a key tool that project team members must use in dealing
with the concerns, service needs and enquiries of clients and role players.
In this section, a broad overview of personal communication is provided. Communication is
defined within a project setting, after which the significance of communication in projects is
explained. Project communication planning, documentation management and meeting and
presentation fundamentals, also come under scrutiny. Lastly, the project communication plan
is discussed.
6.2 Communication in a project environment
Communicating is a broader discipline and involves a substantial body of knowledge that is
not unique to the project context.
Project Management
MANCOSA – MBA Final Year 101
For example:
Sender-receiver models (feedback loops, barriers to communication, etc.);
Choice of media (when to communicate in writing versus when to communicate
orally; when to write an informal memo versus when to write a formal report; etc.);
Writing style (active versus passive voice, sentence structure word choice, etc.);
Presentation techniques (body language, design of visual aids, etc.);
Management techniques (preparing a meeting agenda, dealing with conflict, etc.).
Project communication as an academic field embraces a large body of knowledge. Within a
project management context, communication focuses on:
How the project team members communicate with one another;
How the project team, and specifically the project manager, liaise with senior
management and internal stakeholders on project resources and progress;
How the project team liaise with external stakeholders such as the media and
community leaders;
The distribution of information to all project stakeholders and role-players using
appropriate media and technology;
The planning and compilation of a project communication plan;
Project-related documentation (progress reports, etc.).
ACTIVITY
Describe project communication in your own words.
Project Management
MANCOSA – MBA Final Year 102
6.3 Personal communication
Clements and Gido (2011:370) define and describe verbal versus non-verbal communication.
These can be classified as follows:
Oral (Verbal)
According to Healy (1997:232), oral communication is the key form of communication in
any project. Written documents, if often serve simply to record what has already been agreed
upon during discussions. Oral or verbal communication, as part of project problem solving,
takes place without written records. In any managerial hierarchy, work is done through oral
communication, as well as through significant amounts of written records.
Written
There is always potential for conflict between the desire to limit the quantity of
correspondence that is a feature of large projects, and the need to ensure that the essential
communications are properly maintained. All project team members should be instructed to
adopt the “need to know” principle, so that copies of written communications are limited to
those who need the information. The need for clarity and simplicity in written communication
also requires constant emphasis.
Graphical
Design and construction drawings (e.g. housing projects) are an essential basis for project
management. In a large project there will be numerous drawings to be issued and approved.
Charts and graphs are also used to convey information. This applies particularly to planning
and progress data and reports. It is important that this data is presented in a clear and accurate
way, and supported by adequate written explanations so that ambiguity is avoided.
Numerical
Tables of data are also used to convey project information. It is important that adequate
explanatory notes are provided, so that readers gain a rapid and accurate understanding of the
numerical information. Numerical data should be presented in a form that can be readily
understood by management.
Project Management
MANCOSA – MBA Final Year 103
Electronic
In modern project management, applied and computer technology are in general use. There is
a tendency to believe implicitly in the output from computers. However, output should be
regarded critically. It will have the same degree of accuracy as the input.
6.4 Significance of communication in project management
Project communication, according to Healy (1997:227), has a dual purpose: the first is to
cause some action or agreement to take place, and the second is to make a record that might
be needed later. The larger the number of people involved in the project, the more
communication paths there are, and the more project time is spent on simply sharing
information and keeping stakeholders and role players up to date.
Inefficiencies in communication, and especially the lack of communication, can severely
affect a project’s schedule and chances for success. Communication management is even
more necessary if the project team is spread out over different geographical areas and
timelines.
Large projects generate huge quantities of information. If this information is to be used
effectively to manage project activities, it must be organised systematically and structured to
provide suitable information for the various levels of project management.
Proper communication in a project is a critical success factor for managing the expectations
of the customer and the stakeholders. There is a much greater chance of problems and
difficulties occurring due to differing levels of expectations. In fact, in many cases where
conflicts arise, it is not because of the actual problem but because the customer or manager
was surprised. Project communication management provides the critical link among people,
ideas and information that is necessary for success. Everyone involved in the project
‘language’, must understand how the communications they are involved in as individuals,
affect the project as a whole.
Project Management
MANCOSA – MBA Final Year 104
ACTIVITY
Projects are run by good communication. You have been appointed project manager of the
construction of an offshore platform. Your presentation should outline how you will approach
the following:
1. Communication cycle – data capture, processing, dissemination and storage.
2. Lines of communication.
3. Status-review and problem solving meetings.
4. Document control.
6.5 Project meetings
Clements and Gido (2011:374) distinguish between different types of project meetings:
Project kick-off meetings
Status review meetings
Problem solving meetings
Design review meetings
Post-project evaluation meeting
Three of the above types of meetings will be discussed in this section.
6.5.1 Status review meetings
The primary purposes of such a meeting are to inform, identify problems, and to identify
action items. According to Clements and Gido (2011), the following are some of the subjects
that might be discussed as part of the agenda:
Accomplishments since the last meeting
Cost, schedule, and work scope (status)
Cost, schedule, and work scope (trends)
Cost, schedule, and work scope (forecasts)
Cost, schedule, and work scope (variances)
Risk assessment update
Corrective actions
Opportunities for improvement
Action item assignment
Project Management
MANCOSA – MBA Final Year 105
6.5.2 Problem-solving meetings
The purpose is to identify and resolve the problem as early as possible for a project to be
successful. According to Clements and Gido (2011:376), the problem solving meeting should
follow a good problem solving approach, such as:
a) Develop a problem statement.
b) Identify potential causes of the problem.
c) Gather data and verify the most likely causes.
d) Identify possible solutions.
e) Determine the best solution.
f) Revise the project plan.
g) Implement the solution.
h) Determine whether the problem has been solved.
6.5.3 Design review meetings
Projects that involve a design phase, such as an information system project or development of
a new marketing brochure, may require one or more technical design review meetings to
ensure that the customer agrees with, or approves of, the design approach developed by the
project contractor.
The two types of design review meetings are:
A preliminary design review meeting.
A final design review meeting.
Clements and Gido (2011:377) also describe some general steps to effectively prepare for
meetings:
a) Determine whether a meeting is really necessary.
b) Determine the purpose of the meeting.
c) Determine who needs to participate in the meeting.
d) Distribute an agenda well in advance of the meeting.
e) Prepare visual aids or handouts.
f) Make meeting room arrangements.
Clements and Gido (2011:379-381) also describe steps to follow during and after each project
meeting.
Project Management
MANCOSA – MBA Final Year 106
6.6 Project presentations
Clements and Gido (2011) also describe some important points to take note of in preparation
of and during a presentation:
Determine the purpose of the presentation.
Know the audience.
Make an outline of the presentation.
Use simple language that the audience will understand.
Prepare notes or a final outline that you will use or refer to during your presentation.
Prepare visual aids and test them.
Make copies of handout materials.
Go into the meeting room when it is empty or not in use and get a feel for the
surroundings.
Include divergent views or issues.
Break the material into short sections to facilitate questions and discussion.
Create tension slides to help the audience move from one section or point to the next.
Build-in variety, surprise, or changes of pace.
Don’t overwhelm the audience with information- make each slide comprehensible,
simple, and tied with a common thread throughout the presentation.
Identify and make arrangements for audiovisuals and other resources.
Test the presentation equipment before the audience arrives.
Monitor the time.
Develop a strong conclusion related to the presentation content.
Know the first two or three sentences of your presentation.
Speak clearly and confidently.
Use appropriate animation to help make a point.
Do not stand in front of your visual aids.
Keep to the key points in your outline.
When making key points, explain to the audience why they are important.
Allow time for interaction with the audience, if appropriate.
When responding to questions, be sincere, candid, and confident.
Project Management
MANCOSA – MBA Final Year 107
6.7 Project reports
According to Clements and Gido (2011:384), the two most common types of project reports
are: Progress /Status reports and Final Reports.
Items that might be included in a progress report include the following:
Accomplishments.
Current status of project performance.
Progress toward resolution of previously identified problems.
Problems or potential problems since prior report.
Planned corrective actions.
Milestones expected to be reached during the next reporting period.
The project final report is usually a summary of the project. The final report might include:
Customer’s original need.
Original project objective.
Customer’s original requirements.
Actual versus anticipated benefits to the customer as a result of the project.
Degree to which the original project objective was met.
Brief description of the project.
Future considerations.
A list of all deliverables.
6.8 Project communication plan
Communication planning involves determining the information and communication needs of
the stakeholders: Who needs what information? When will they need it? and how will it be
given to them. While all projects share the need to communicate project information, the
informational needs and methods of distribution vary widely. Identifying the informational
needs of the stakeholders, and determining a suitable means of meeting those needs, are
important factors for project success. A project communication plan defines the generation
and distribution of project documentation among stakeholders throughout the project
(Clements and Gido, 2011:388).
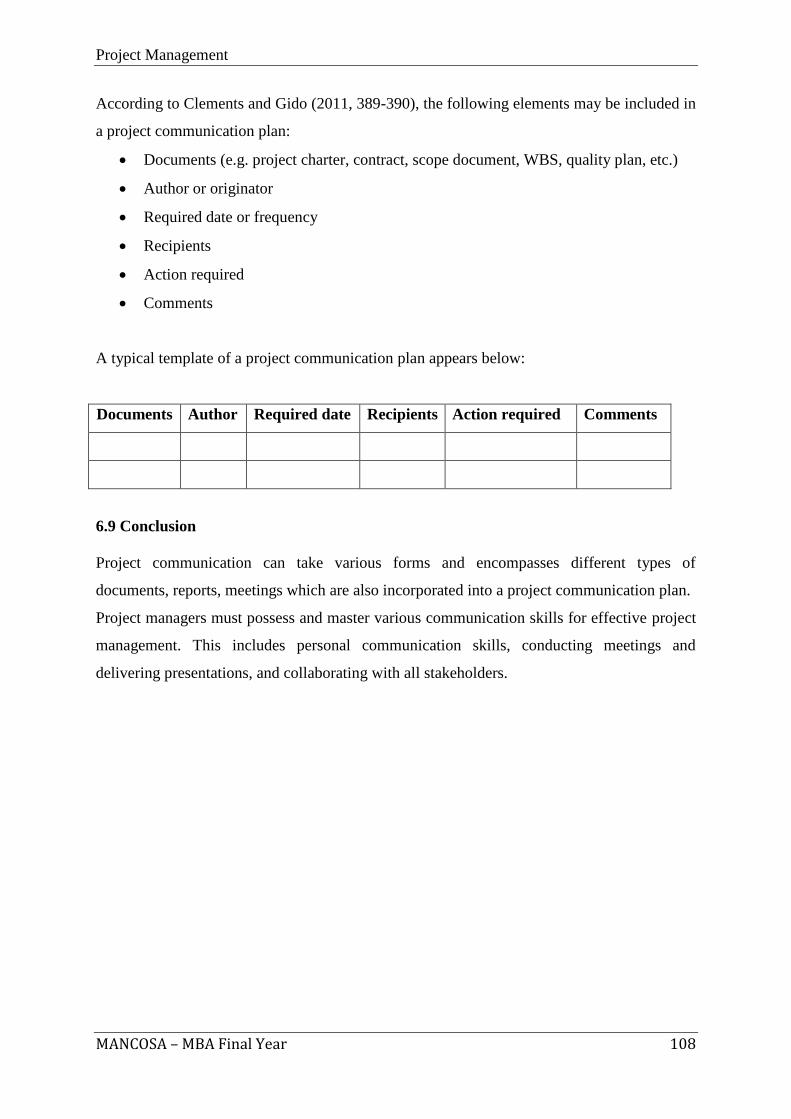
Project Management
MANCOSA – MBA Final Year 108
According to Clements and Gido (2011, 389-390), the following elements may be included in
a project communication plan:
Documents (e.g. project charter, contract, scope document, WBS, quality plan, etc.)
Author or originator
Required date or frequency
Recipients
Action required
Comments
A typical template of a project communication plan appears below:
Documents Author Required date Recipients Action required Comments
6.9 Conclusion
Project communication can take various forms and encompasses different types of
documents, reports, meetings which are also incorporated into a project communication plan.
Project managers must possess and master various communication skills for effective project
management. This includes personal communication skills, conducting meetings and
delivering presentations, and collaborating with all stakeholders.
Project Management
MANCOSA – MBA Final Year 109
SECTION 7
7. PROJECT RISK MANAGEMENT
Project Management
MANCOSA – MBA Final Year 110
CONTENTS
Learning outcomes
Reading Material
7.1 Introduction
7.2 Definitions
7.3 Categories and types of risk
7.4 Risk assessment
7.5 Risk management plan process
7.6 Conclusion
Project Management
MANCOSA – MBA Final Year 111
Learning Outcomes:
The overall outcome for this section is that, on its completion, the learner should be able to
demonstrate an understanding of the field of project risk management. This overall outcome
will be achieved through the learner’s mastery of the following specific outcomes, in that the
learner will be able to:
1. Define terms specifically related to project risk management.
2. Discuss the different categories and types of risk.
3. Carry out a risk assessment in a project environment.
4. Explain and apply the risk management plan process.
Project Management
MANCOSA – MBA Final Year 112
Reading Material:
READING
Prescribed reading:
Clements, J. P. and Gido, J. (2011). Effective Project Management. 5th
Edition. Boston:
Cengage Learning.
Recommended reading:
Burke, R.J. and Barron, S. (2007). Project Management Leadership. Hampshire: Burke
Publishing.
Gray, C.F. and Larson, E.W. (2006). Project Management: The Managerial Process. 3rd
Edition. New York: McGraw-Hill.
Schwalbe, K. (2009). Introduction to Project Management. 2nd
Edition. Boston: Cengage
Learning.
Schwartz, R.J. and Smith, C.W. (1997). Derivatives Handbook: Risk Management and
Control. New York: John Wiley & Sons, Inc.
Project Management
MANCOSA – MBA Final Year 113
7.1 Introduction
This section outlines the most essential knowledge that you should acquire in the field of
project risk management. Be aware that, as a manager or co-ordinator of projects, there will
come a time when your efforts will fall short of necessary requirements. This failure could be
ascribed to numerous factors but, by engaging in constructive project risk management, you
will be able to mitigate the risks to your project.
7.2 Definitions
Risk
According to Clements and Gido (2011), risk is an uncertain event that can jeopardise the
project objective. Risk includes the expected losses (economic, time, infrastructure or
resources) that a particular phenomenon might cause. It is a function of the probability of
particular occurrences and the losses that each would cause (severity).
Risk management
Risk management includes the processes concerned with identifying, analysing and
responding to project risks. It includes both minimising the impact of adverse events and
maximising the likelihood of positive outcomes. Project risk management includes the
processes of risk assessment, risk mitigation and risk response.
Hazard
A hazard in the project management domain can be defined as a rare or extreme event, or the
probability of an occurrence in the natural or human-made environment, that adversely
effects the successful completion of the project, to the extent that it may cause economic,
time, infrastructure or resource loss.
Vulnerability
Vulnerability is the degree of loss to a given element (economic, time, infrastructure or
resources) that is at possible risk from the impact of a hazard of a given severity. It is specific
to a particular project and can be expressed on a scale of 0 to 10 (0 indicating no loss, 10
indicating total damage).
Project Management
MANCOSA – MBA Final Year 114
Probability
Risk probability in a project can be defined as which the risk event that is likely to occur. The
probability of certain risks influencing a project is determined by the nature of the project.
Frequency
Frequency refers to the number of times a particular risk can impact on a project, for example
rain interruption of a building project or systems downtime in an information technology
project.
Severity
The impact of a risk on a project can be defined by its severity. The severity of a risk is
mostly quantified into monetary terms, although other measuring tools are also often used.
7.3 Categories and types of risk
Clements and Gido (2011:271) identify the following categories of risk:
Technical
Schedule
Cost
Human resources
External
Sponsor/customer
Some specific examples of risk include:
Market or price risk
Market or price risk is the risk of a decrease in the value of a financial portfolio as a result of
adverse movement in the market variables such as prices, currency exchange rates and
interest rates. In other words, market risk is the exposure arising from adverse changes in the
market value of a financial instrument or portfolio.
Project Management
MANCOSA – MBA Final Year 115
Interest rates risk
This is the risk of a loss that an organisation could suffer as a result of adverse consequences
due to fluctuations in interest rates. Most financial institutions face interest rate risk. Interest
rate risk is known to fluctuate and is by nature a speculative type of financial risk, since
interest rate movements can result in profits or losses. It can thus be urged that interest rate
risk depends on the state of the economy.
Liquidity
Liquidity is an organisation’s ability to meet its financial obligations within a given time
period. This risk will be reflected in insufficient funds or marketable assets being available.
Legal risk
Legal risk is the risk arising from violations of, or non-compliance with laws, rules,
regulations, prescribed policies and ethical standards. This risk also arises when laws or rules
governing certain products or activities of an organisation’s customers are unclear or
untested. Non-compliance can expose the organisation to fines, financial penalties, payment
of damages, and the voiding of contracts.
Operational risk
Operational risk is the risk of loss occurring as a result of inadequate systems and control,
human error, or management failure. It is the risk of a loss arising from human error,
management failure and fraud, or from shortcomings in systems or controls (Schwartz and
Smith, 1997:322).
7.4 Risk assessment
Risk assessment is the identification, quantification and evaluation of the probability of the
occurrence of risk events and the impact of the risk events on a project. Risk assessment
addresses issues such as: What can go wrong? How likely is this to happen? If it does happen,
what are the consequences? In essence, risk assessment is both proactive and reactive
measures to project risk management. Clements and Gido (2011) suggest the preparation of a
risk assessment matrix which would include the specific risk, the impact of the risk,
probability of the risk, degree of impact of the risk, action trigger, responsibility and
response plan.
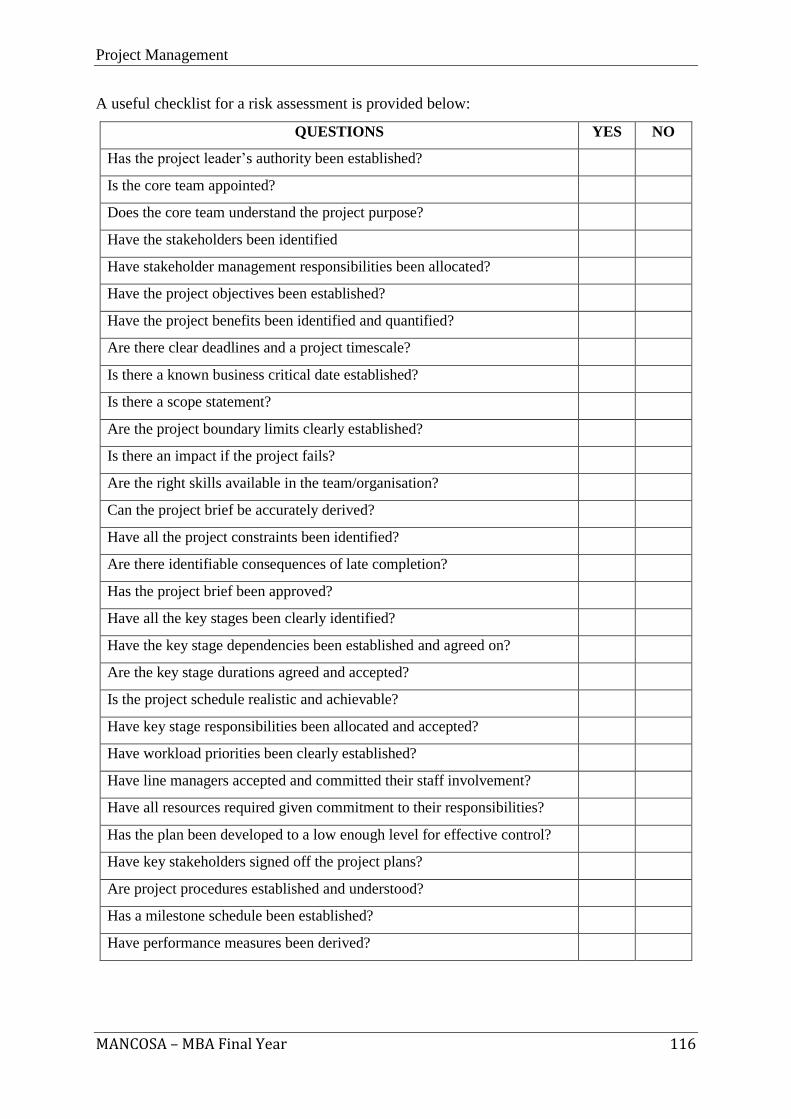
Project Management
MANCOSA – MBA Final Year 116
A useful checklist for a risk assessment is provided below:
QUESTIONS YES NO
Has the project leader’s authority been established?
Is the core team appointed?
Does the core team understand the project purpose?
Have the stakeholders been identified
Have stakeholder management responsibilities been allocated?
Have the project objectives been established?
Have the project benefits been identified and quantified?
Are there clear deadlines and a project timescale?
Is there a known business critical date established?
Is there a scope statement?
Are the project boundary limits clearly established?
Is there an impact if the project fails?
Are the right skills available in the team/organisation?
Can the project brief be accurately derived?
Have all the project constraints been identified?
Are there identifiable consequences of late completion?
Has the project brief been approved?
Have all the key stages been clearly identified?
Have the key stage dependencies been established and agreed on?
Are the key stage durations agreed and accepted?
Is the project schedule realistic and achievable?
Have key stage responsibilities been allocated and accepted?
Have workload priorities been clearly established?
Have line managers accepted and committed their staff involvement?
Have all resources required given commitment to their responsibilities?
Has the plan been developed to a low enough level for effective control?
Have key stakeholders signed off the project plans?
Are project procedures established and understood?
Has a milestone schedule been established?
Have performance measures been derived?
Project Management
MANCOSA – MBA Final Year 117
7.5 Risk management plan process
The risk management plan process includes the following steps:
a) Define objectives
b) Identify risk
c) Quantify risk
d) Develop a response
e) Risk control
a) Define objectives
Risk may be defined as any event or constraint that prevents the project manager or team from
achieving the project’s goals and objectives. It is therefore necessary at the outset to define these
goals and objectives in some detail, and to indicate who is responsible for achieving them.
b) Identify risk
Having defined the business objectives by one of the above breakdown structures, the next
step is to identify what areas of risk, uncertainty and triggers could prevent the progress team
from achieving these stated objectives. Techniques for identifying risk include:
Analysing historical records and closeout reports
Safety reports (health and safety requirements)
Structured questionnaires
Structured interviews
Brainstorming
Structured checklists
Flow charts
Judgement based on knowledge
Scenario analysis
c) Quantify risk
Having identified a range of possible risks, the next step is to quantify the probability
(likelihood) of the risk occurring and the impact or consequence to the project, or to the
amount at stake. These risks should be assessed in consultation with appropriate stakeholders.
Project Management
MANCOSA – MBA Final Year 118
For any given risk, whether it is a natural disaster, a liability, or a worker’s compensation loss
exposure, the following steps should be followed to analyse the frequency and severity of the
risk:
i. Assign a category for the frequency of occurrence of a loss event.
ii. Assign a category for the severity of the loss event.
iii. Multiply the frequency value by the severity value.
iv. Prioritise the ratings for all loss exposures.
ACTIVITY
Consider the following case study and apply it to a risk matrix (use the Internet to read
up more about risk matrices). Use your results to determine the frequency, severity,
probability and risk scores.
You have been appointed as the project manager for a shopping centre construction project.
The area in which you are building is prone to excessive rain and occasional flooding. You
are working with unfamiliar construction teams. After initial consultation with the local
traffic department, it has become clear that they are not satisfied with the road layout as per
your building plans. However, they did give the preliminary go-ahead for the project, with
the proviso that the town engineer and town planner reconsider the plans. To date, all the
suppliers you have contacted can supply all the relevant material but cannot guarantee on-
time delivery.
Project Management
MANCOSA – MBA Final Year 119
d) Develop a response
Risk response includes the development of proactive measures to counteract identified risks
and changes in risk over the course of a contingency planning. Clements and Gido (2011)
suggest the development of a separate risk response plan. Having identified, quantified and
prioritised the risks, you need to develop a risk response plan which defines ways to address
adverse risk and enhance entrepreneurial opportunities before they occur. The range of
responses includes:
Eliminate risk.
Mitigate risk.
Deflect risk.
Accept risk (contingency).
Turn risk into an opportunity.
A contingency plan must also be formulated. A typical contingency plan should contain the
following information:
Title
WBS identification number
Risk/risk events/threats
Trigger events
Contingency actions
Responsible persons
Cost implications
Time implications
Tasks effected
Influence of critical path
Project Management
MANCOSA – MBA Final Year 120
e) Risk control
The risk control function implements the risk management plan to make it happen. This is the
most important part, but surprisingly is often neglected. The risk management plan needs to be
communicated to the entire project team, and where necessary, followed up with appropriate
training and practice runs. The risk management plan should consider:
Changes in the scope work.
Changes in the build method.
Changes in the team members.
Changes in the suppliers.
The ultimate goal of risk management is risk mitigation. Risk mitigation involves defining
the necessary steps to counter threats and to enhance opportunities. It is the active steps taken
to lessen the effects that a particular identified risk might have on a project outcome. It is also
the continuous measures taken during the life cycle of a project in order to ensure proactive
actions to unforeseen circumstances.
7.6 Conclusion
Effective risk management involves:
Commitment to risk management by stakeholders, top management, the project
steering committee, the project manager and project team members, and
An adequate project management approach (a capable project manager should take
responsibility for risk management, and he/she and the project team should have an
understanding of the technical and non-technical issues).
Risk management involves identifying, assessing, and responding to project risks in order to
minimise the likelihood and impact of the consequences of adverse events on the
achievement of the project objective. Risk identification includes determining which risks
may adversely affect the project objective and what the consequences of each risk might be if
they occur. Assessing each risk involves developing an action plan to reduce the impact or
likelihood of each risk, establish a trigger point for when to implement the actions to address
each risk, and assigning responsibility to specific individuals for implementing each response
plan. During the project, it is important to evaluate all risks to determine if there are any of
the risks, also, new risks maybe identified that were not considered as a risk earlier in the
project.
Project Management
MANCOSA – MBA Final Year 121
SECTION 8
8. PROJECT MANAGEMENT LEADERSHIP
Project Management
MANCOSA – MBA Final Year 122
CONTENTS
Learning outcomes
Reading Material
8.1 Introduction
8.2 Project manager responsibilities and skills
8.3 Networking
8.4 Problem-solving and decision-making
8.5 Groups and teams
8.6 Delegation
8.7 Negotiation
8.8 Conclusion
Project Management
MANCOSA – MBA Final Year 123
Learning Outcomes:
The overall outcome for this section is that, on its completion, the learner should be able to
demonstrate an understanding of the field of project leadership. This overall outcome will be
achieved through the learner’s mastery of the following specific outcomes, in that the learner
will be able to:
1. Identify and describe the portfolio of skills and responsibilities of project
managers.
2. Identify and explain the characteristics and traits to consider when selecting
project managers.
3. Discuss some of the leadership styles and theories applicable to project
management.
4. Discuss ways to develop project managers and employees.
5. Explain the significance of networking.
6. Describe and apply the problem-solving and decision-making processes.
7. Explain and apply negotiation strategies and tactics.
8. Describe formation of project groups and teams and suggest how teams can
improve their performance.
9. Explain how to delegate work to project employees.
Project Management
MANCOSA – MBA Final Year 124
Reading Material:
READING
Prescribed reading:
Clements, J. P. and Gido, J. (2011). Effective Project Management. 5th
Edition. Boston:
Cengage Learning.
Burke, R.J. and Barron, S. (2007). Project Management Leadership. Hampshire: Burke
Publishing.
Recommended reading:
Schwalbe, K. (2009). Introduction to Project Management. 2nd
Edition. Boston: Cengage
Learning.
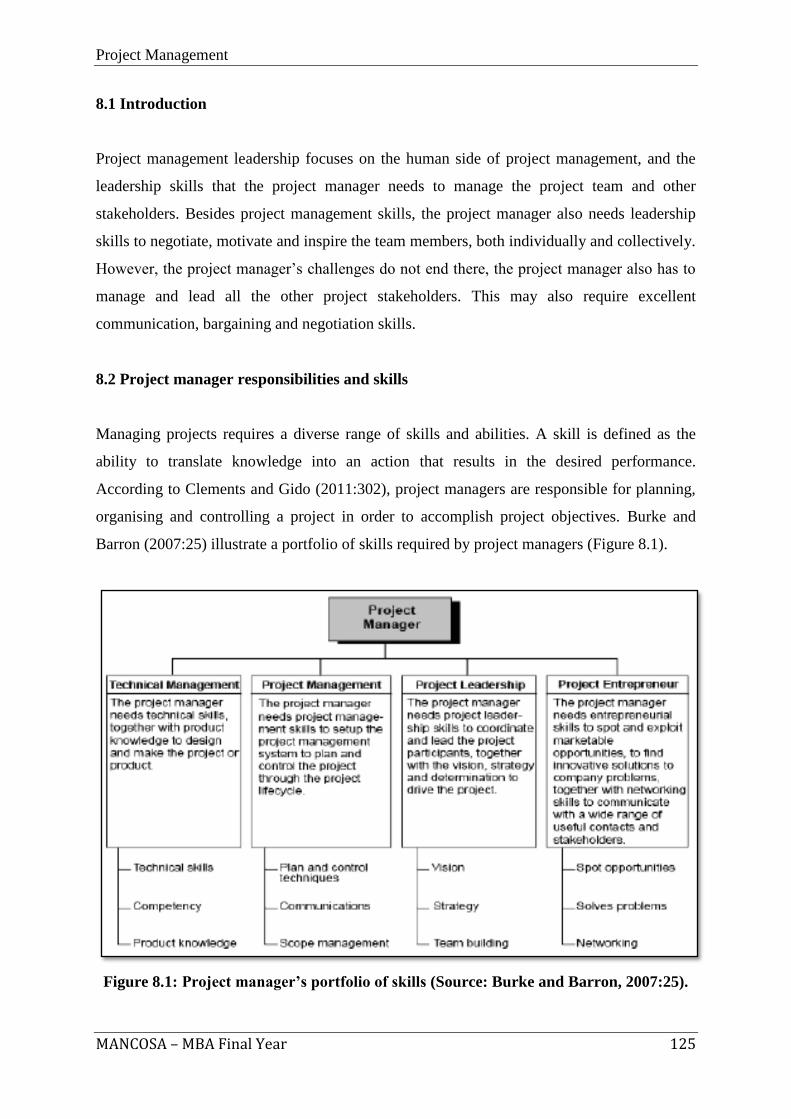
Project Management
MANCOSA – MBA Final Year 125
8.1 Introduction
Project management leadership focuses on the human side of project management, and the
leadership skills that the project manager needs to manage the project team and other
stakeholders. Besides project management skills, the project manager also needs leadership
skills to negotiate, motivate and inspire the team members, both individually and collectively.
However, the project manager’s challenges do not end there, the project manager also has to
manage and lead all the other project stakeholders. This may also require excellent
communication, bargaining and negotiation skills.
8.2 Project manager responsibilities and skills
Managing projects requires a diverse range of skills and abilities. A skill is defined as the
ability to translate knowledge into an action that results in the desired performance.
According to Clements and Gido (2011:302), project managers are responsible for planning,
organising and controlling a project in order to accomplish project objectives. Burke and
Barron (2007:25) illustrate a portfolio of skills required by project managers (Figure 8.1).
Figure 8.1: Project manager’s portfolio of skills (Source: Burke and Barron, 2007:25).
Project Management
MANCOSA – MBA Final Year 126
Clements and Gido (2011:304) also describe the following set of skills necessary for the
success of a project:
a) Leadership ability
o The project management leadership is not an end in itself, but rather its whole
purpose is to make the other managerial skills happen. It is the project
manager’s leadership responsibility to:
i. Lead the generation of entrepreneurial and innovative ideas, spot
opportunities and respond to competition;
ii. Lead the technical design and development of the product and
incorporate new technology;
iii. Oversee the project management planning and control process; and
iv. Negotiate for project resources and inspire the project team.
o The leadership traits theory proposes that ‘leaders are born not made’, meaning
that leaders with genetically ‘inbred superiority’ will naturally emerge as leaders
because of their personal qualities, behaviour and characteristics. Leadership traits
include: visionary, opportunist, inspiring, empowering, charismatic, determined,
passionate, trustworthy, a good communicator, competent, etc.
o Some leadership styles are explained by the following theories:
i. McGregor’s Theory X and Y:
Theory X –Authoritarian Management Style: This style assumes
that the average person will do their best to avoid work and
responsibility and therefore must be directed and forced to work.
Theory Y- Participative Management Style: This style assumes
that people enjoy work and will take responsibility by applying
and directing themselves to further the aims of their project.
ii. Action-centred leadership: The model focuses on leadership action and
suggests that the leader should focus on three responsibilities: Task,
Team and Individual, acting according to the demands of each
iii. Situational leadership: This suggests that different styles are better in
different situations and that effective leaders must be flexible enough
to adapt their style depending on the working maturity of their
followers. Hersey and Blanchard (cited in Burke and Barron, 2007:
242) characterised the situational leadership style in terms of the
Project Management
MANCOSA – MBA Final Year 127
amount of direction and support that the leader provides to their
followers.
Directing or “Telling” Leadership
Coaching or “Selling” Leadership
Supporting Leadership
Delegating Leadership
iv. Emotional Intelligence leadership styles: Goleman (cited in Burke and
Barron, 2007: 248) described six leadership styles that have some
overlapping concepts with the Situational Leadership Model:
Visionary, Coaching, Affiliative, Democratic, Commanding, and
Pacesetting.
b) Ability to develop people
o The following ways can be used to develop a project manager and/or his/her
team (Clements and Gido, 2011:314):
i. Gain experience.
ii. Learn from others.
iii. Interview project managers who have skills that you want to develop in
yourself.
iv. Conduct a self-evaluation, and learn from your mistakes.
v. Get a mentor.
vi. Participate in education and training programmes.
vii. Join relevant organisations, e.g. PMI.
viii. Read journals, books, etc.
ix. Earn a credential, e.g. Project Management Professional (PMP),
Certified Associate of Project Management (CAPM), etc.
x. Volunteer.
c) Communication skills (previously discussed)
d) Interpersonal skills
e) Ability to handle stress
f) Problem-solving and decision-making skills (discussed later)
g) Negotiating skills (discussed later)
h) Time management skills.
Project Management
MANCOSA – MBA Final Year 128
Selecting the project manager
The project’s size, type and location will influence the selection of the type of project
manager. On a small project, the project manager may be expected to do everything, but as
the project increases in size and complexity, the project manager will have to manage the
project through a project team, a project management office (PMO) and a fully integrated
planning and control system. One view is that the project manager should be an expert in the
field of the project. The following points support the argument that the project manager
should be a technical expert: Technical decisions, Judgement, Team selection, Feasibility
study, Respect, Lead technical - coordinating matrix, Knowledge.
Another view is that the project manager should be a generalist. The following points support
this argument:
Corporate ladder – leading and managing the project team assumes more importance
rather than technical issues;
Multi-disciplined project – wide range of technical skills which may not reside in one
person;
A technical expert as a leader can suppress innovation from other team members;
Non-technical skills are required – leadership, human resource management, etc.
The project manager is delegated with responsibility and authority to carry out the following:
Select the team
Establish the project management office (PMO)
Design the project management information system (PMIS)
Estimate and tender
Network
Stakeholders
Client relationships
Correspondence
The first part of the job description focuses on how the project will be managed and work
tenders. After the project has been awarded, the project manager’s job then focuses on the
planning, organising, leading and controlling of the project.
Project Management
MANCOSA – MBA Final Year 129
8.3 Networking
Working with stakeholders and networking is central to the need for the above skills set. It is
an essential project management leadership function to identify all the stakeholders and
determine their needs and expectations – particularly with respect to information and
communication. It is likely that many of these needs and expectations will be different and in
some cases conflicting. This is where project managers need to use their negotiation skills
and influence on a common set of mutually acceptable objectives.
Project managers are expected to use their leadership skills to create an environment where
the stakeholders are encouraged to contribute their skills and knowledge to the project
environment. These needs and expectations should then be managed, influenced, balanced,
and if necessary, prioritised, to ensure a successful outcome.
Networking may be defined as the active development and maintenance of a list of useful
contacts which can help you achieve your objectives. In the project manager’s case, it is the
ability to network with a broad range of contacts who can supply useful information, advice
and resources to make the project. Networking skills are possibly the most important
entrepreneurial trait helping the project manager to achieve the project’s objectives.
8.4 Problem-solving and decision-making
Problem-solving and decision-making are often used interchangeably and seen as part of the
same process, but in the project context, they are in fact quite different:
Problem-solving is the process of generating a number of practical and technical
solutions to solve a problem.
Decision-making is the process of considering the wider aspects of the situation and
gaining commitment from the team and stakeholders for the selection of one course of
action.
The above processes are illustrated in Figure 8.2.
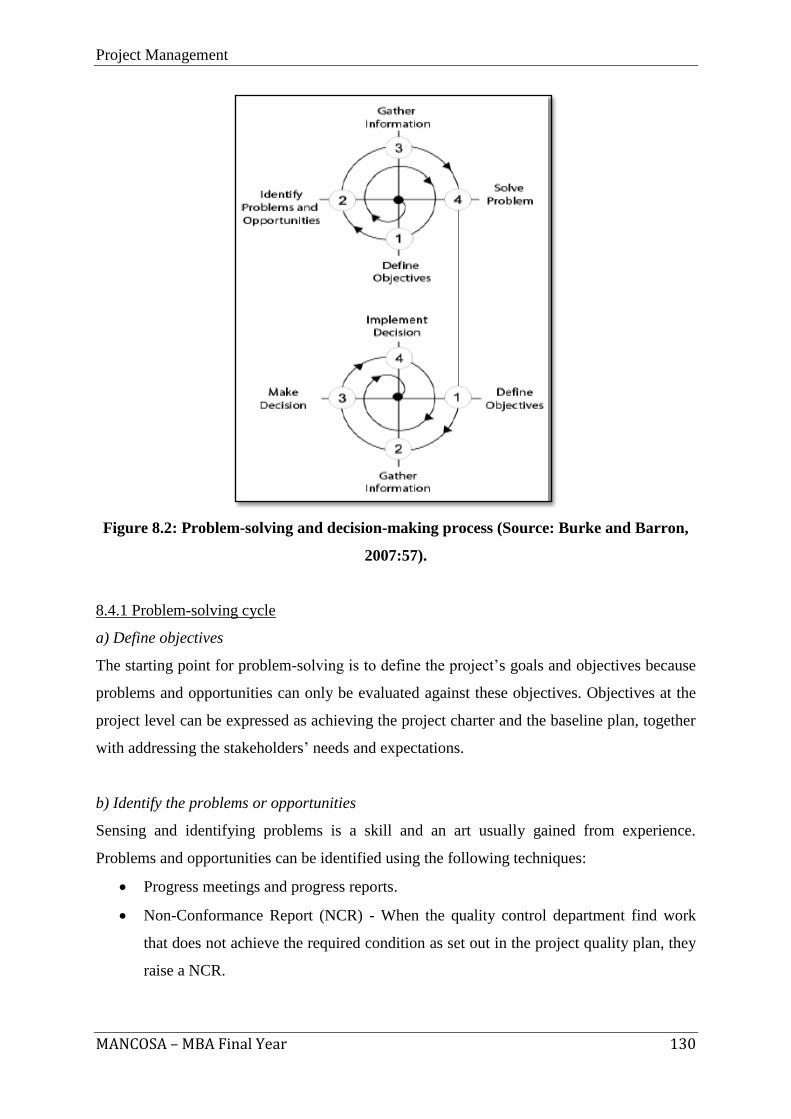
Project Management
MANCOSA – MBA Final Year 130
Figure 8.2: Problem-solving and decision-making process (Source: Burke and Barron,
2007:57).
8.4.1 Problem-solving cycle
a) Define objectives
The starting point for problem-solving is to define the project’s goals and objectives because
problems and opportunities can only be evaluated against these objectives. Objectives at the
project level can be expressed as achieving the project charter and the baseline plan, together
with addressing the stakeholders’ needs and expectations.
b) Identify the problems or opportunities
Sensing and identifying problems is a skill and an art usually gained from experience.
Problems and opportunities can be identified using the following techniques:
Progress meetings and progress reports.
Non-Conformance Report (NCR) - When the quality control department find work
that does not achieve the required condition as set out in the project quality plan, they
raise a NCR.
Project Management
MANCOSA – MBA Final Year 131
Situation appraisal – The following questions should be raised- What is wrong with
the current solution? What would happen if we did not address this problem? In
appraising the situation, and with the help of stakeholders, specific challenges that
help shape the problem can be identified.
c) Gather information
Useful sources include: Internet; Closeout reports; Stakeholders; Audits.
d) Solve the problem
This involves a combination of structured and unstructured methods for example:
Sense making – This is an important part of problem solving. It is how we make sense
of situations, how we determine what it means to us, and what it means to the project.
As we review information about the problem, we internalize the knowledge and this
forms part of our developing and understanding of the problem. It is useful to ask
questions like: What? Why? When? How? Where? Who?
Breaking down the problem – Choosing a goal that involves less uncertainty, or a
level of uncertainty that is manageable, makes it achievable. In defining the problem,
it should be written down in clear and concise terms that specifically states: what the
expected benefit will be, the objectives and measures and the mandatory constraints.
Brainstorming – This is also called a “mind shower”. The process is usually used with
a group, but can also work as a solo technique.
Configuration management system – A project’s configuration management system is
designed to formally consider proposed changes to the scope of work. This enables all
the nominated responsible people and stakeholders to consider the proposals, make
comments, suggestions and recommendations.
Quality circles - In the project context, the quality circle could include a
representative from the project management office, the functional department, the
supplier, the contractor and the client.
e) Present solutions and options
The output from the problem solving process is a number of possible solutions and options to
solve the problem or take advantage of the opportunity.
Project Management
MANCOSA – MBA Final Year 132
8.4.2 Decision-making cycle
a) Determine objectives
Whereas the objectives in problem-solving referred to the project charter and the baseline
plan, the objectives in the decision-making process also need to refer to the wider objectives
of the project environment, the company and the external stakeholders. These objectives need
to be known because a problem, by definition, is a situation which threatens the achievement
of the objectives. Therefore, a decision needs to be made when the objectives are threatened
and/or an opportunity is spotted which can enhance the project’s competitive advantage. The
need to make a decision will be triggered both by the project problem solving process and
events threatening the other company objectives.
b) Gather information
The gathering of information function should try to obtain all relevant information, facts,
figures and opinions together with identifying possible causes of problems, and establishing
time constraints.
c) Decision-making
The next step is to decide on a course of action. One of the key features of decision-making is
the power to influence the other people who must accept the decision. This may require a
combination of negotiation and persuasion skills. The choice of an autocratic versus
democratic leadership style also influences the decision-making process.
d) Issue instructions
The final step in the decision-making process is to make a decision and issue instructions.
The implementation of the instructions has all the elements of a project and should be
planned, monitored and controlled as a project. The project manager needs feedback on the
performance of the decision because if the problem is not resolved, further corrective action
may be required.
Project Management
MANCOSA – MBA Final Year 133
8.5 Groups and teams
A project team is a “group of individuals working independently to accomplish the project
objective” (Clements and Gido, 2011:330). The terms “project team” and “project group” are
often used interchangeably to describe a number of people who have complementary skills
and who work to achieve a common goal, but in the project context that is where the
similarity ends. The important distinction between a team and a group is how the people are
managed and how they interact together, because they may be doing exactly the same work.
True teamwork implies participation and empowerment to give the team sufficient authority
and autonomy to make their own decisions on a day-to- day basis. This helps make the team
members feel motivated, responsible and accountable for their work. Group work implies that
the project manager is the key person with a number of followers. All communication passes
through the project manager, and the project manager makes all the decisions – this restricts
group problem solving and decision-making and effectively kills creativity. Without the team
member interaction, there is no cross-flow of information and therefore no team synergy.
Clements and Gido (2011:332-336) describe Tuckman’s 4-stage model of team development:
Forming
o Initial stage which involves the transition from working as an individual to
working as a team member.
Storming
o Team members feel frustrated, angry and hostile due to conflicting individual
goals, before the project scope and objective become clearer to them.
Norming
o After struggling through the storming phase, team members develop strong
relationships and interpersonal conflicts are resolved. Trust begins to develop.
Performing
o The team members become committed and eager to accomplish the project
objectives.
Project Management
MANCOSA – MBA Final Year 134
Clements and Gido (2011) list five characteristics of effective teams:
Clear understanding of the project objective
Clear expectations of roles and responsibilities
Results orientation
High degree of cooperation and collaboration
High level of trust
Katzenbach and Smith (cited in Burke and Barron, 2007:164) provide a series of suggestions
for how teams can develop their performance:
Themes and identity – Teams often adopt a theme or mission that establishes or
conveys meaning about their purpose and identity. It is important that the themes have
richness in their meaning to the team.
Enthusiasm and energy level – Teams both work and play hard and with enthusiasm;
they put in extra time (without being asked) in order to achieve their goals, and to
outsiders, the energy and enthusiasm within the team are easily recognised.
Personal commitment – When there is strong commitment to one another’s
development and success, there is always enrichment of the team’s aspirations and
sense of purpose. This trait is most prevalent in a high performing team and cannot be
dictated from outside the team.
Performance results – Effective teams need clearly established measures of
performance that set expectations. These measures are the drivers for the team and
indicate how their effectiveness can be assessed.
8.6 Delegation
Delegation involves “empowering the project team to accomplish the project objective and
empowering each team member to achieve expected results for his/her area of responsibility”
(Clements and Gido, 2011:315). There are two main reasons for delegating work:
Delegate to take control of your time.
Delegate to grow your people.
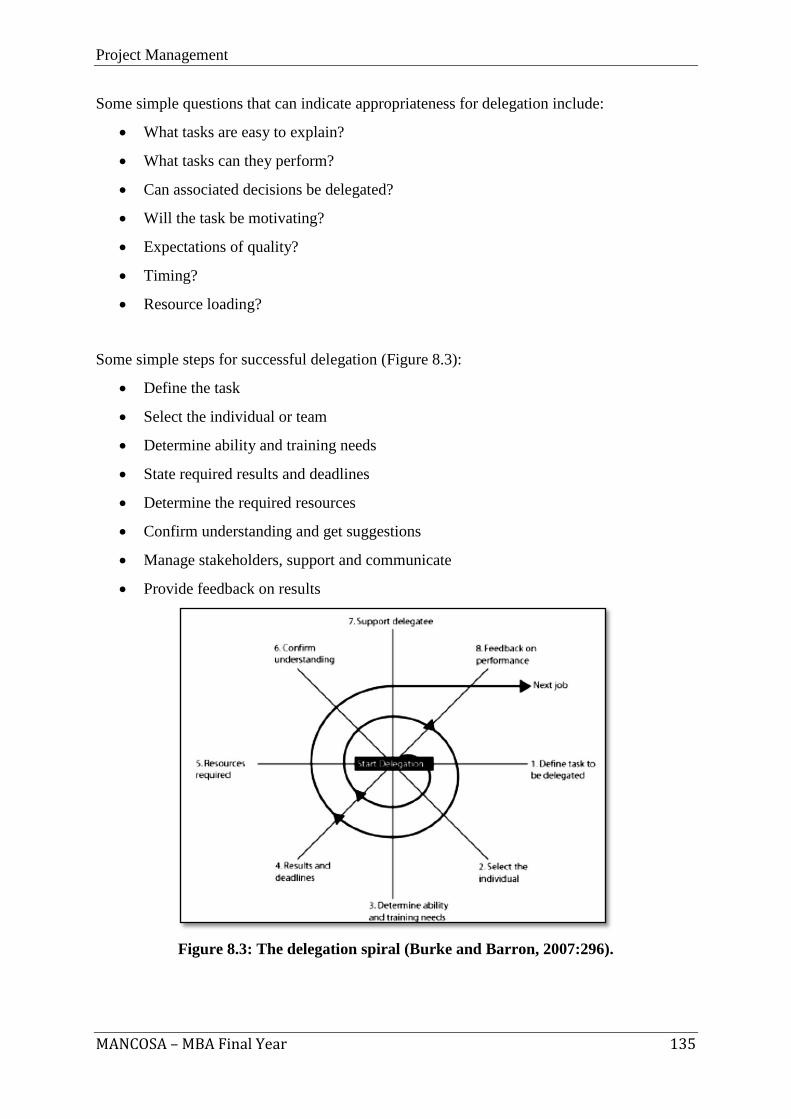
Project Management
MANCOSA – MBA Final Year 135
Some simple questions that can indicate appropriateness for delegation include:
What tasks are easy to explain?
What tasks can they perform?
Can associated decisions be delegated?
Will the task be motivating?
Expectations of quality?
Timing?
Resource loading?
Some simple steps for successful delegation (Figure 8.3):
Define the task
Select the individual or team
Determine ability and training needs
State required results and deadlines
Determine the required resources
Confirm understanding and get suggestions
Manage stakeholders, support and communicate
Provide feedback on results
Figure 8.3: The delegation spiral (Burke and Barron, 2007:296).
Project Management
MANCOSA – MBA Final Year 136
8.7 Negotiation
Negotiation is the method used to reach an agreement by compromise, which is open to
discussion or modification. Negotiation is the process of trying to get a better deal for the
project than the project manager would get without negotiation.
The three basic negotiation strategies are:
a) Win-lose strategy: This strategy is a competitive adversarial bargaining approach
where each party is searching for the other party’s weakness and desires to capitalise
on any weakness discovered. The consequence of this approach is that there is little or
no sharing of information with the other party and consequently, no attempt is made
to understand the other party’s needs and expectations. There is also very little trust
between the parties, which essentially kills effective two-way communication and
goodwill. This strategy does not encourage teamwork or collaboration with functional
managers which are two of the key leadership objectives.
b) Win-win strategy: This strategy is a collaborative approach where each party is trying
to achieve the best deal for both parties – a mutually agreeable solution. Information
is openly shared between parties in order to improve their understanding of each
other’s position. For this strategy to succeed there has to be a demonstrable climate of
trust and honesty between the parties that allows an open exchange of views and
expectations. The win-win strategy is essential when the functional managers’ input
and commitment are crucial to achieving the desired outcomes for the project now
and in the future.
c) Lose-lose strategy: This strategy basically says: ‘If I lose, I will make sure that you
lose’. The implementation of this spiteful approach creates unnecessary enemies that
could come back to haunt you in future negotiations. It is far better for long term
business relations to ensure that each party leaves the negotiation table having won
something.
Project Management
MANCOSA – MBA Final Year 137
The following outline provides a number of useful negotiation approaches which should
improve the project manager’s chances of getting a better deal:
Prepare
Develop a battle plan
Exaggerate your position to weaken the other party’s argument
Organise frequent meetings
Recognise that opinions are often temporary
Solve easy differences first
Give concessions on minor issues
Force the issue
Bargaining is the process of giving up something to gain something – preferably giving up a
little to gain a lot. To bargain effectively, you need to exaggerate your position and understate
the other party’s position – this gives you room to ‘negotiate’. The settlement range is the
area of mutually agreeable solutions. In the settlement range, both parties would rather
compromise from their initial position, than stop the deal.
8.8 Conclusion
Project management leadership and managing project teams are part of the same spectrum of
people management. Project managers are often faced with difficult problems that involve
people management, and therefore they require a comprehensive set of skills, including
problem-solving and decision-making skills to tackle adverse situations. Project managers’
leadership traits and styles also influence team performance and effectiveness. The success of
a project is thus heavily reliant on leadership skills of the project manager.
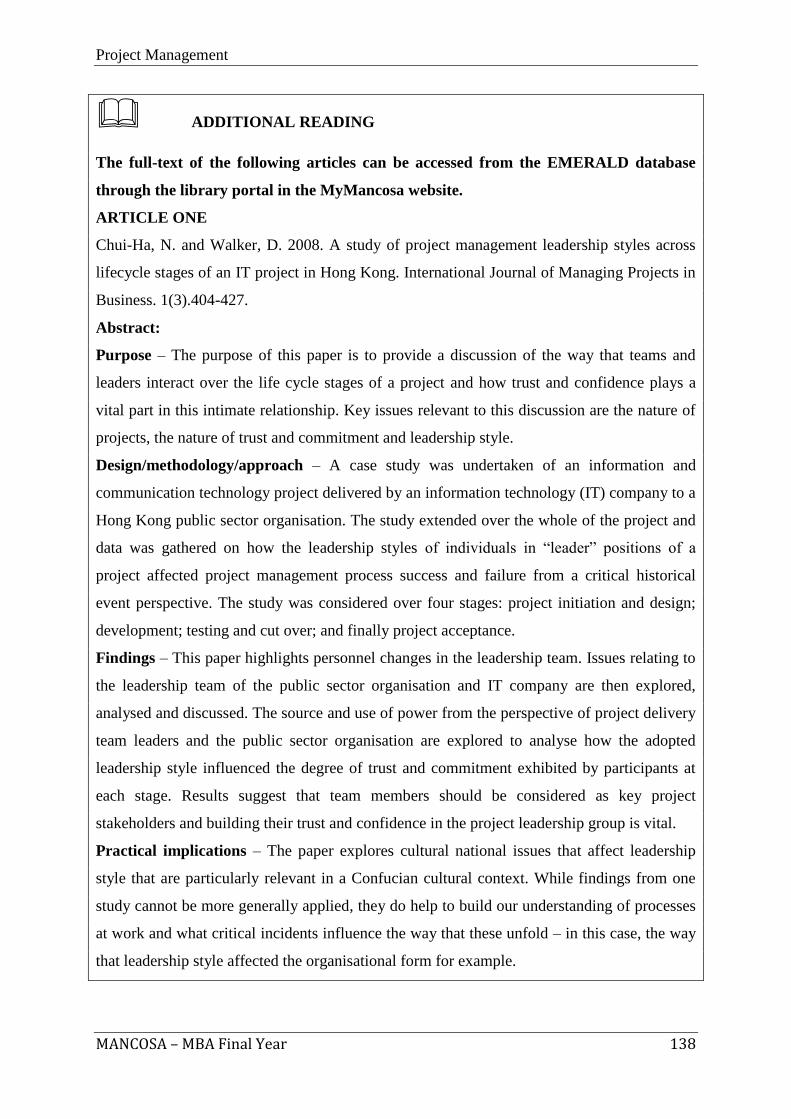
Project Management
MANCOSA – MBA Final Year 138
ADDITIONAL READING
The full-text of the following articles can be accessed from the EMERALD database
through the library portal in the MyMancosa website.
ARTICLE ONE
Chui-Ha, N. and Walker, D. 2008. A study of project management leadership styles across
lifecycle stages of an IT project in Hong Kong. International Journal of Managing Projects in
Business. 1(3).404-427.
Abstract:
Purpose – The purpose of this paper is to provide a discussion of the way that teams and
leaders interact over the life cycle stages of a project and how trust and confidence plays a
vital part in this intimate relationship. Key issues relevant to this discussion are the nature of
projects, the nature of trust and commitment and leadership style.
Design/methodology/approach – A case study was undertaken of an information and
communication technology project delivered by an information technology (IT) company to a
Hong Kong public sector organisation. The study extended over the whole of the project and
data was gathered on how the leadership styles of individuals in “leader” positions of a
project affected project management process success and failure from a critical historical
event perspective. The study was considered over four stages: project initiation and design;
development; testing and cut over; and finally project acceptance.
Findings – This paper highlights personnel changes in the leadership team. Issues relating to
the leadership team of the public sector organisation and IT company are then explored,
analysed and discussed. The source and use of power from the perspective of project delivery
team leaders and the public sector organisation are explored to analyse how the adopted
leadership style influenced the degree of trust and commitment exhibited by participants at
each stage. Results suggest that team members should be considered as key project
stakeholders and building their trust and confidence in the project leadership group is vital.
Practical implications – The paper explores cultural national issues that affect leadership
style that are particularly relevant in a Confucian cultural context. While findings from one
study cannot be more generally applied, they do help to build our understanding of processes
at work and what critical incidents influence the way that these unfold – in this case, the way
that leadership style affected the organisational form for example.
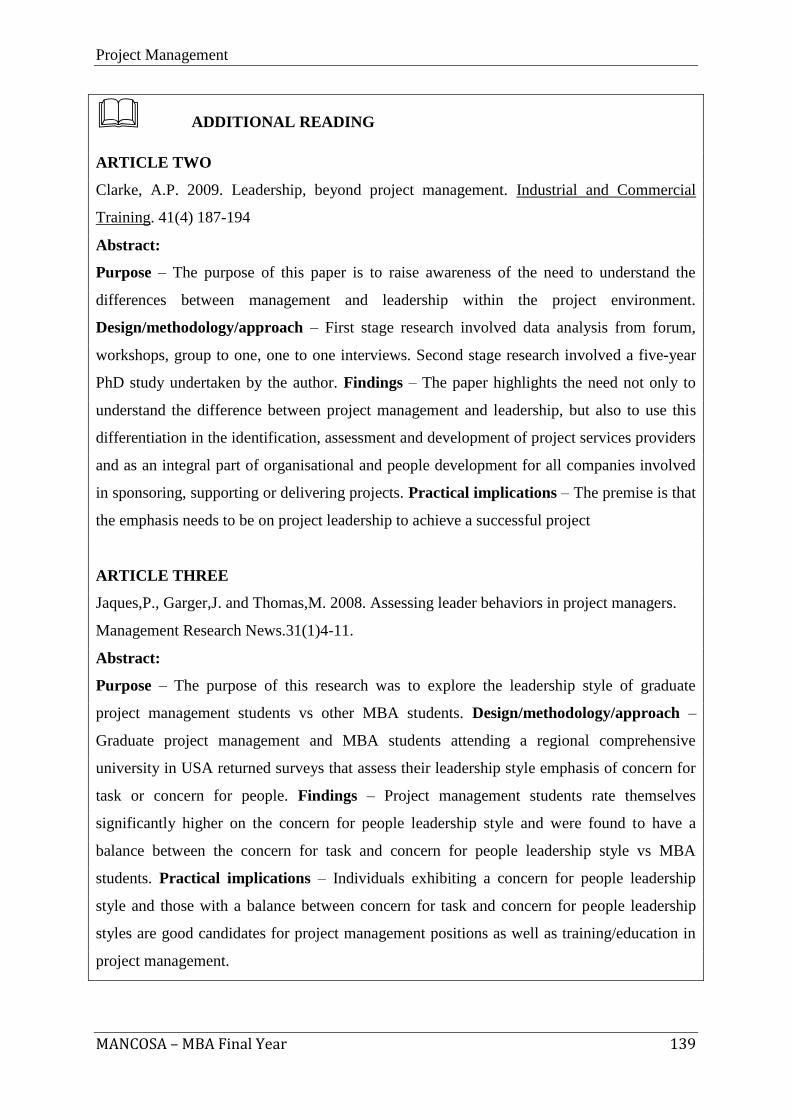
Project Management
MANCOSA – MBA Final Year 139
ADDITIONAL READING
ARTICLE TWO
Clarke, A.P. 2009. Leadership, beyond project management. Industrial and Commercial
Training. 41(4) 187-194
Abstract:
Purpose – The purpose of this paper is to raise awareness of the need to understand the
differences between management and leadership within the project environment.
Design/methodology/approach – First stage research involved data analysis from forum,
workshops, group to one, one to one interviews. Second stage research involved a five-year
PhD study undertaken by the author. Findings – The paper highlights the need not only to
understand the difference between project management and leadership, but also to use this
differentiation in the identification, assessment and development of project services providers
and as an integral part of organisational and people development for all companies involved
in sponsoring, supporting or delivering projects. Practical implications – The premise is that
the emphasis needs to be on project leadership to achieve a successful project
ARTICLE THREE
Jaques,P., Garger,J. and Thomas,M. 2008. Assessing leader behaviors in project managers.
Management Research News.31(1)4-11.
Abstract:
Purpose – The purpose of this research was to explore the leadership style of graduate
project management students vs other MBA students. Design/methodology/approach –
Graduate project management and MBA students attending a regional comprehensive
university in USA returned surveys that assess their leadership style emphasis of concern for
task or concern for people. Findings – Project management students rate themselves
significantly higher on the concern for people leadership style and were found to have a
balance between the concern for task and concern for people leadership style vs MBA
students. Practical implications – Individuals exhibiting a concern for people leadership
style and those with a balance between concern for task and concern for people leadership
styles are good candidates for project management positions as well as training/education in
project management.
Project Management
MANCOSA – MBA Final Year 140
SECTION 9
9. PROJECT QUALITY MANAGEMENT
Project Management
MANCOSA – MBA Final Year 141
CONTENTS
Learning outcomes
Reading Material
9.1 Introduction
9.2 Concepts and definitions associated with quality management
9.3 Total Quality Management, International Organisation for Standardisation and Six Sigma
9.4 Costs of quality
9.5 Core project quality concepts
9.6 Project quality planning
9.7 Quality assurance
9.8 Quality control
9.9 Quality management tools
9.10 Conclusion
Project Management
MANCOSA – MBA Final Year 142
Learning Outcomes:
The overall outcome for this section is that, on its completion, the learner should be able to
demonstrate an understanding of project quality management. This overall outcome will be
achieved through the learner’s mastery of the following specific outcomes, in that the learner
will be able to:
1. Explain concepts and definitions associated with quality management.
2. Discuss and apply the core values, principles and/or processes of Total Quality
Management, International Organisation for Standardisation and Six Sigma.
3. Identify and define the costs of quality.
4. Discuss the core project quality concepts.
5. Explain and apply quality planning, and the tools of quality control and assurance.
6. Differentiate between quality assurance and control.
7. Describe and apply common quality management tools and techniques.
Project Management
MANCOSA – MBA Final Year 143
Reading Material:
READING
Prescribed reading:
Clements, J. P. and Gido, J. (2011). Effective Project Management. 5th
Edition. Boston:
Cengage Learning.
Recommended reading:
Burke, R. (2009). Project Management Techniques. College Edition. Hampshire: Burke
Publishing.
Kloppenborg, T.J. (2009). Project Management: A Contemporary Approach. Boston:
Cengage Learning.
Rose, K.H. (2005). Project Quality Management: Why, What and How. Florida: J. Ross
Publishing.
Schwalbe, K. (2009). Introduction to Project Management. 2nd
Edition. Boston: Cengage
Learning.
Project Management
MANCOSA – MBA Final Year 144
9.1 Introduction
The Project Management Institute defines quality as “the degree to which a set of inherent
characteristics fulfil requirements” (Rose, 2005:6). Rose (2005:12) states that:
- Quality involves products, defects, processes, customers and systems.
- Quality is the ability of a set of inherent characteristics of a product, system, or
process to fulfil requirements of customers and other interested parties.
- Quality is a fourth among equals in relation to the project triple constraint of time,
cost and scope
Project quality management includes the process required to ensure that the project will
satisfy the needs for which it was undertaken. Burke (2007:254) offers two definitions of
project quality management:
- “the processes required to ensure that the project will satisfy the need for which it was
undertaken” (PMBOK Guide, 2004);
- “covering quality planning, quality control and quality assurance.”
Project quality management is about the synergy of continuous improvement of the project and
the principle of project delivery. Using a quality approach plays a key role in assuring that the
project meets customer requirements. Quality management is the process for ensuring that all
project activities necessary to design, plan and implement a project are effective and efficient
with respect to the purpose of the objective and its performance.
This section covers the broad concepts associated with quality management, the different costs of
quality, quality planning, assurance and control, and quality management tools.
9.2 Concepts and definitions associated with quality management
Garvin developed a list of eight quality dimensions which describe product quality:
- Performance: the efficiency with which a product achieves its intended purpose;
- Features: attributes of a product that supplement the basic performance;
- Reliability: propensity of a product to perform consistently over its useful design life;
- Conformance: compliance with numeric dimensions (specifications);
- Durability: the degree to which a product tolerates stress or trauma without failing;
Project Management
MANCOSA – MBA Final Year 145
- Serviceability: the ease of repair of a product;
- Aesthetics: subjective sensory characteristics such as taste, feel, sound, look and
smell. Quality is measured as the degree to which product attributes are matched to
customer preferences in terms of aesthetics;
- Perceived quality: based on customer opinion (Foster, 2007:6).
Burke (2007: 255) provides the following definitions:
- Quality Management philosophy – the involvement of all project participants in order
to ensure that the goals and objectives of the project and the resulting product or
service meets the needs of the client, project team and other stakeholders.
- Quality Assurance - a systematic process of defining planning, implementing and
reviewing the management processes in order to provide adequate confidence that the
product will be consistently produced to the required condition.
- Quality Planning – the process of identifying the standards the project needs to
comply with order to achieve the required condition.
- Quality Control – defines the method of inspection (testing), in-process inspection and
final inspection to confirm that the product meets the required condition.
- Quality Audit – “a structured review of other quality management (QM) activities”.
- Project Quality Plan – a detailed document explaining how the company will assure
that the product will be made to the client’s requirements.
- Project Quality Management includes the processes and activities that determine the
quality policies, objectives, and responsibilities necessary to assure that project
requirements are met. Processes critical to the Quality Management System include
Quality Planning, Quality Assurance, and Quality Control.
- Quality Planning is an integral part of project management. It identifies relevant
quality standards and determines how they can best be satisfied.
- Quality Assurance ensures that project management utilizes the quality processes
needed to meet project requirements in a planned and systematic manner.
- Quality Control monitors specific project outputs and determines compliance with
applicable standards. It also identifies project risk factors, their mitigation, and looks
for ways to prevent and eliminate unsatisfactory performance.
Project Management
MANCOSA – MBA Final Year 146
The work of quality ‘gurus’ has been incorporated into three popular quality frameworks: Total
Quality Management (TQM), International Organisation for Standardisation (ISO) and Six
Sigma. Many organisations use these frameworks to define and organize their quality initiatives
(Kloppenberg, 2009:284).
9.3 Total Quality Management, International Organisation for Standardisation and Six
Sigma
Total Quality Management (TQM) considers the wider aspects of quality by integrating
quality management components into a quality management system. TQM is a systems
approach to quality management that focuses on the system and not any particular
components of the system. TQM has a people focus and an outcome focus. It advances the
rationale that each project needs a unique quality management system. It first identifies what
the client really wants and how it can best be achieved. It keeps an emphasis on continuous
improvement, but always endeavours to keep the customer satisfied. For quality to be
effective, it needs to be introduced to all members and all aspects of the operations. TQM is
underpinned by the following concepts:
- Quality is defined by customers,
- There must be a respect for people,
- All levels of the organization must want to participate,
- There must be an emphasis on continuous improvement,
- Prevention is better than detection (Burke, 2007:266).
Kloppenborg (2009:285) highlights the core values of TQM:
- Organisational and personal learning,
- Valuing employees,
- Agility,
- Focus on the future,
- Managing for innovation,
- Management by fact,
- Social responsibility,
- Focus on results and creating value,
- Systems perspective.
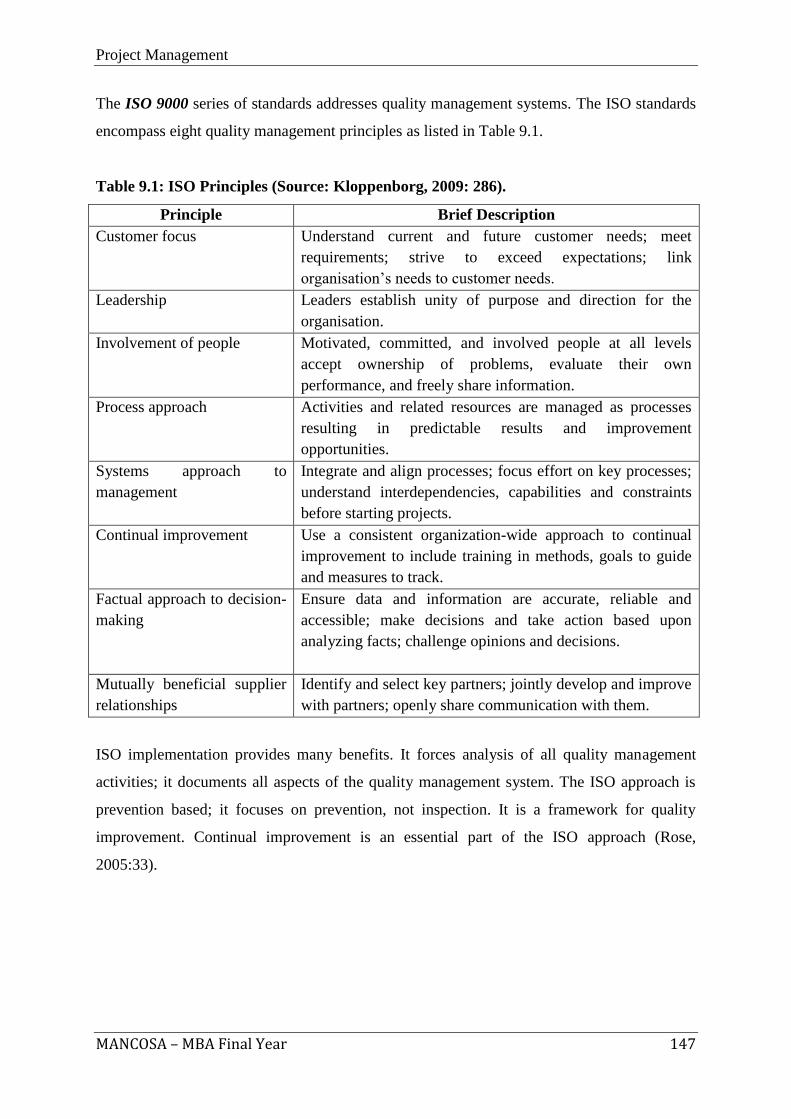
Project Management
MANCOSA – MBA Final Year 147
The ISO 9000 series of standards addresses quality management systems. The ISO standards
encompass eight quality management principles as listed in Table 9.1.
Table 9.1: ISO Principles (Source: Kloppenborg, 2009: 286).
Principle Brief Description
Customer focus
Understand current and future customer needs; meet
requirements; strive to exceed expectations; link
organisation’s needs to customer needs.
Leadership
Leaders establish unity of purpose and direction for the
organisation.
Involvement of people
Motivated, committed, and involved people at all levels
accept ownership of problems, evaluate their own
performance, and freely share information.
Process approach
Activities and related resources are managed as processes
resulting in predictable results and improvement
opportunities.
Systems approach to
management
Integrate and align processes; focus effort on key processes;
understand interdependencies, capabilities and constraints
before starting projects.
Continual improvement
Use a consistent organization-wide approach to continual
improvement to include training in methods, goals to guide
and measures to track.
Factual approach to decision-
making
Ensure data and information are accurate, reliable and
accessible; make decisions and take action based upon
analyzing facts; challenge opinions and decisions.
Mutually beneficial supplier
relationships
Identify and select key partners; jointly develop and improve
with partners; openly share communication with them.
ISO implementation provides many benefits. It forces analysis of all quality management
activities; it documents all aspects of the quality management system. The ISO approach is
prevention based; it focuses on prevention, not inspection. It is a framework for quality
improvement. Continual improvement is an essential part of the ISO approach (Rose,
2005:33).
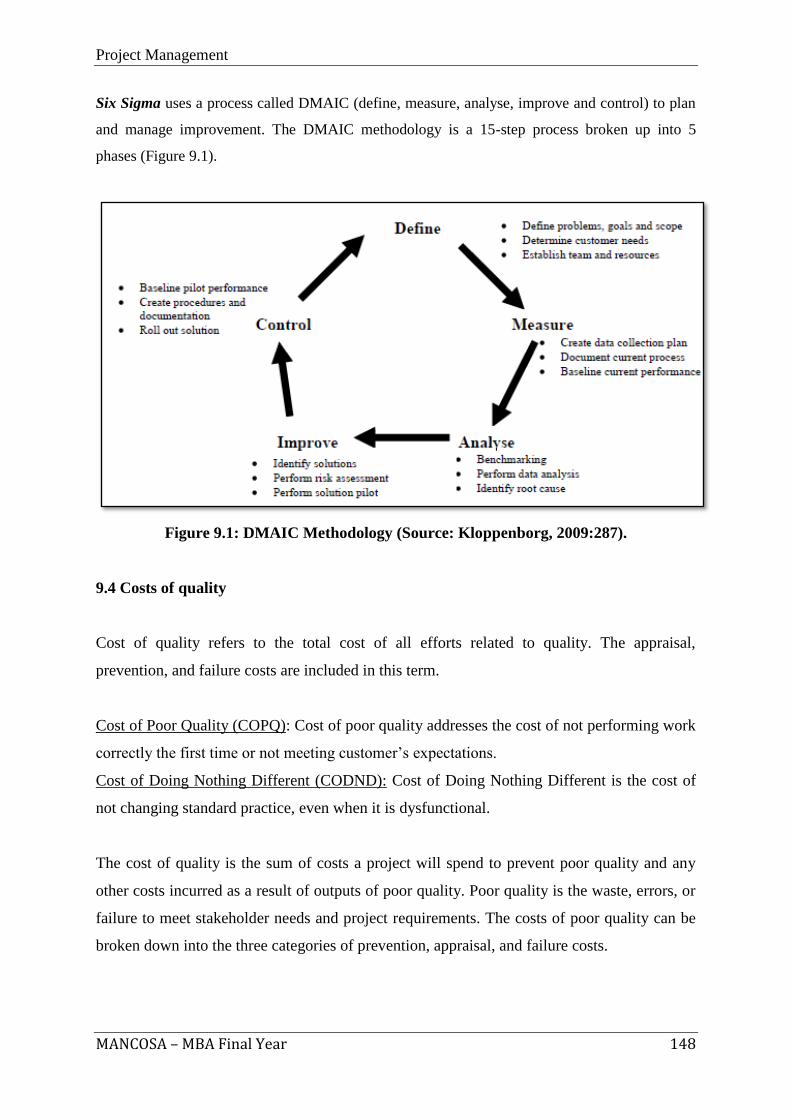
Project Management
MANCOSA – MBA Final Year 148
Six Sigma uses a process called DMAIC (define, measure, analyse, improve and control) to plan
and manage improvement. The DMAIC methodology is a 15-step process broken up into 5
phases (Figure 9.1).
Figure 9.1: DMAIC Methodology (Source: Kloppenborg, 2009:287).
9.4 Costs of quality
Cost of quality refers to the total cost of all efforts related to quality. The appraisal,
prevention, and failure costs are included in this term.
Cost of Poor Quality (COPQ): Cost of poor quality addresses the cost of not performing work
correctly the first time or not meeting customer’s expectations.
Cost of Doing Nothing Different (CODND): Cost of Doing Nothing Different is the cost of
not changing standard practice, even when it is dysfunctional.
The cost of quality is the sum of costs a project will spend to prevent poor quality and any
other costs incurred as a result of outputs of poor quality. Poor quality is the waste, errors, or
failure to meet stakeholder needs and project requirements. The costs of poor quality can be
broken down into the three categories of prevention, appraisal, and failure costs.
Project Management
MANCOSA – MBA Final Year 149
Prevention costs: These are planned costs an organisation incurs to ensure that errors are not
made at any stage during the delivery process of that product or service to a beneficiary.
Examples of prevention costs include quality planning costs, education and training costs,
quality administration staff costs, process control costs, market research costs, field testing
costs, and preventive maintenance costs (www.pm4dev.com).
Appraisal costs: These include the costs of verifying, checking, or evaluating a product or
service during the delivery process. Examples of appraisal costs include receiving or
incoming inspection costs, internal production audit costs, test and inspection costs,
instrument maintenance costs, process measurement and control costs, supplier evaluation
costs and audit report costs (www.pm4dev.com).
Failure costs: A project incurs these costs because the product or service did not meet the
requirements and had to be fixed or replaced, or the service had to be repeated.
(www.pm4dev.com).
9.5 Core project quality concepts
Kloppenborg (2009: 285) describes four core project quality concepts:
a. Stakeholder satisfaction
b. Process management
c. Fact-based management
d. Empowered performance
a) Stakeholder satisfaction
Stakeholder satisfaction consists of identifying all stakeholders, using a structured process to
determine relevant quality standards, and understanding the ultimate quality goals with
respect to stakeholders. The decision-process for developing relevant quality standards on a
project consists of the following steps:
i. Identify all stakeholders
ii. Prioritise among the stakeholders
iii. Understand the prioritized stakeholders requirements
iv. Develop standards to ensure the requirements are met
v. Make trade-off decisions.
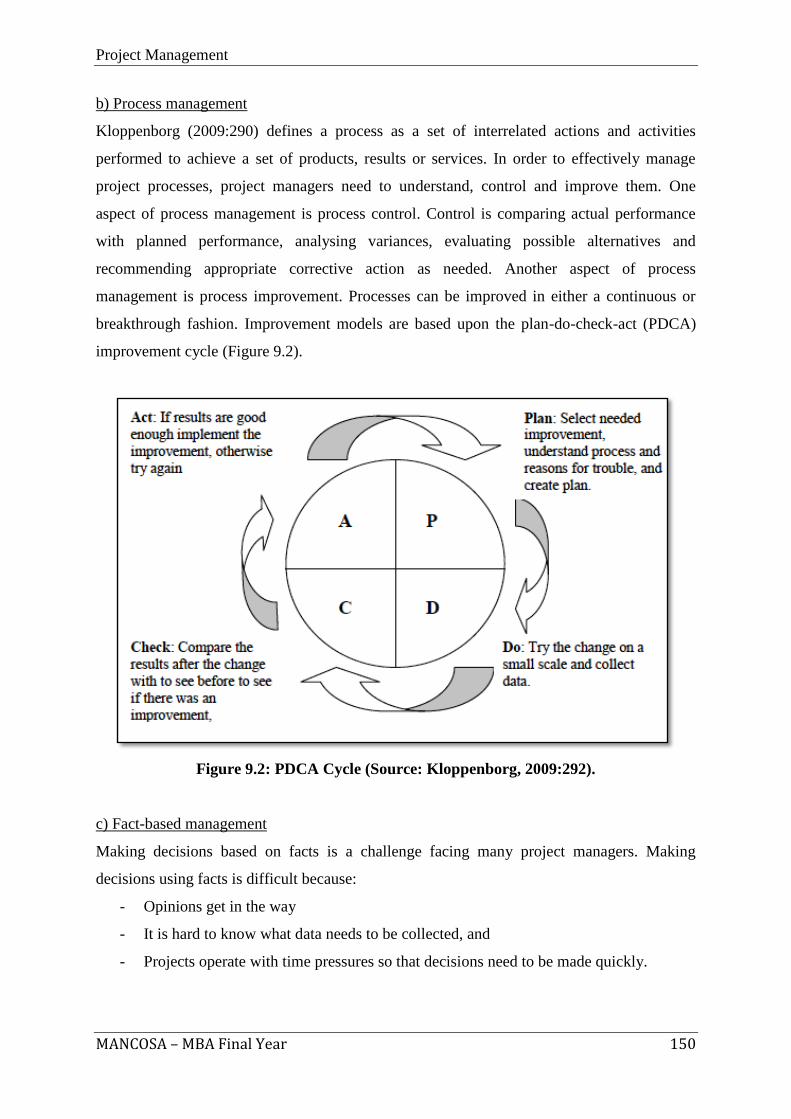
Project Management
MANCOSA – MBA Final Year 150
b) Process management
Kloppenborg (2009:290) defines a process as a set of interrelated actions and activities
performed to achieve a set of products, results or services. In order to effectively manage
project processes, project managers need to understand, control and improve them. One
aspect of process management is process control. Control is comparing actual performance
with planned performance, analysing variances, evaluating possible alternatives and
recommending appropriate corrective action as needed. Another aspect of process
management is process improvement. Processes can be improved in either a continuous or
breakthrough fashion. Improvement models are based upon the plan-do-check-act (PDCA)
improvement cycle (Figure 9.2).
Figure 9.2: PDCA Cycle (Source: Kloppenborg, 2009:292).
c) Fact-based management
Making decisions based on facts is a challenge facing many project managers. Making
decisions using facts is difficult because:
- Opinions get in the way
- It is hard to know what data needs to be collected, and
- Projects operate with time pressures so that decisions need to be made quickly.
Project Management
MANCOSA – MBA Final Year 151
Project decision-makers need to understand the difference between two types of variation
(Kloppenborg, 2009). Common cause is a source of variation that is inherent in a system and
predictable. On the other hand, special cause is a source of variation that is not inherent in a
system, is not predictable and is intermittent. It is important to determine when there is a
variation on a project whether it is within the range of what can be expected for that
particular work activity or deliverable (common cause) or whether something unusual is
happening (special cause). If the variation is common cause, and the results are not
acceptable, some change will need to be made to the system (the way in which the work is
accomplished). However, if the change is due to a particular cause, then the way to improve
is to change that particular cause and not the entire system. Management by facts requires an
understanding that variation can be either common or special cause, a determination to
discover which type, and the resolve to act appropriately on that discovery (Kloppenborg,
2009).
d) Empowered performance
The goal of empowered performance is to have capable and willing workers at every level and
every function within a project. Kloppenborg (2009:295) lists four components of empowered
performance in order to create capable and willing workers:
- The recognition of individuality
- Being able to capitalise on individual strengths
- Emphasizing individual responsibilities, and
- Using appropriate collaboration.
9.6 Project quality planning
Rose (2005:57) provides a summary of project quality planning:
Quality management includes quality planning, quality assurance, quality control, and
quality improvement.
The quality management plan is part of the project plan. It includes the quality policy
(intended direction of the organisation regarding quality) and answers the questions:
Who is in charge (infrastructure and responsibilities)? Where are we going (goals)?
How are we going to get there (processes)?
Project Management
MANCOSA – MBA Final Year 152
Quality planning is identifying which quality standards are relevant to the project and
how to satisfy them.
Customers (internal or external) are the base in project quality.
Customer and requirement identification and prioritisation should be performed early
in project planning so that the project starts in the right direction.
Identifying specifications is also part of the quality journey. Specifications are
specific and measurable statements of requirements.
Operational definitions provide a link between requirements and specifications.
Operational definitions remove ambiguity of terms by describing what something is
and how it is measured.
Standards are closely related to specifications. Standards address how something is to
be done. Specifications provide specific targets for performance.
The inputs to quality planning are:
Quality policy
This is the overall intentions and direction of an organization with regard to quality,
as formally expressed by the top management. In the case of a joint venture, a quality
policy for the individual project should be developed. The management team is
responsible for dissipating the quality policy to all project stakeholders through
appropriate information distribution channels.
Scope statement
The scope statement is a key input to quality planning because it documents major
project deliverables as well as project objectives which serve to define important
stakeholder requirements.
Product description
Although the elements of the product description may be embodied in the scope
statement, the product description often contains details of technical issues and other
concerns that may affect quality planning.
Standards and regulations
The project management team any application-area-specific standards or regulations
that may affect the project.
Project Management
MANCOSA – MBA Final Year 153
Other process outputs
In addition to the scope statement and product description, processes in other
knowledge areas may produce outputs that should be considered as part of the quality
planning.
The tools and techniques for quality planning are:
Benefit / cost analysis
The planning process must consider benefit/cost tradeoffs. The primary benefit is less
work, higher productivity, lower costs and increased stakeholder satisfaction. The
primary cost is the expenses associated with project quality management activities.
Benchmarking
Benchmarking involves comparing actual or planned project practices to those of
other projects to generate ideas for improvement and provide a standard for
measurement of performance.
Flowcharting
The flowcharting techniques in quality management generally include cause and
effect diagrams and system or process flow charts. Flowcharting can help in
anticipating probable quality problems and thus helps to develop approaches for
dealing with them.
Design of experiments
This is an analytical technique which aims to define variables that have most
influence on the overall outcome.
The outputs from quality planning are:
Quality Management Plan
The quality management plan should describe how a project management team will
implement its quality policy. The plan should define the organisational structure, roles
and responsibilities and resources needed for implementation of quality management.
The quality management plan should address Quality Control of the project, Quality
Assurance and Quality Improvement of the project.
Quality metrics and quality checklists
Process improvement plan and quality baseline.
Project Management
MANCOSA – MBA Final Year 154
9.7 Quality assurance
Quality assurance is evaluating the overall project performance on a regular basis to provide a
confidence that the project will satisfy the relevant quality standards.
Inputs to Quality Assurance
Quality management plan
Operational definitions
Results of quality control measurements which are records of quality control
testing and measurement in a format of comparison or analysis.
Tools and techniques for Quality Assurance
Quality planning tools and techniques
Quality audits which are a structured review of other quality management
activities. They may be timely or carried out randomly. They may be carried
out by properly trained internal auditors or by third parties such as quality
systems registration agencies.
Outputs from Quality Assurance
Quality Improvement
Quality improvement includes taking action to increase the effectiveness and
efficiency of the project to be able to provide added benefits to the
stakeholders of that project. In many cases, the implementation of quality
improvements will require preparation of change requests or taking corrective
actions and will be handled according to procedure for overall change control.
Recommended corrective actions
Organisational process assets updates
Project management plan updates.
Project Management
MANCOSA – MBA Final Year 155
9.8 Quality control
Quality control involves monitoring specific project results to determine if they comply with
relevant standards and identifying ways to eliminate causes of unsatisfactory results. Project
results mentioned include both product results such as deliverables and management results
such as cost and schedule performance. The project management team should have a working
knowledge of statistical quality control especially sampling and probability to help evaluate
and control outputs.
The project manager and team should be aware of the following:
- Prevention (keeping errors out of the process)
- Inspection (keeping errors out of the customer’s hand)
- Special cause (unusual events)
- Random causes (normal process variations)
- Tolerances (where results should fall within a defined tolerance range)
- Control limits (the process is in control if it falls within these defined limits).
The inputs to Quality Control are:
Work results: including both product results and process results
The quality management plan
Operational definitions
Checklists.
Tools and techniques for Quality Control
Inspection
Inspection includes activities such as measuring, examining and testing
undertaken to determine whether results conform to requirements. Inspection
can be carried out on the level of a single activity or a final product.
Inspections can be called reviews, product reviews, audit and walk-throughs.
Project Management
MANCOSA – MBA Final Year 156
Control charts
These charts are graphical representations that display the result of a process
over time and are used to determine if the process is “in control”. Control
charts may be used to monitor any type of output variable. Control charts are
most often used to monitor repetitive activity in production but can also be
used to monitor cost and schedule variances.
Pareto diagram
A Pareto diagram is a histogram ordered by frequency of occurrence which
shows how many results were generated by what category or identified cause.
Typically the Pareto diagram reflects that a relatively small number of causes
are responsible for the majority of the problems or defects.
Statistical sampling involves choosing a part of a population of interest for
inspection.
Flowcharting is used in quality control to help analyse how a problem occurs.
Trend analysis involves the use of mathematical techniques to forecast future
outcomes based on historical results. It is often used to monitor technical
performance and cost and schedule performance.
The outputs for Quality Control are:
Quality improvement
Acceptance decisions, where the inspected items will either be accepted or
rejected and those rejected may be reworked.
Rework, which is action taken to bring defects or nonconforming items into
compliance with requirements and specifications. Rework is a frequent cause
of project over-runs.
Completed checklists
Process adjustments which involves immediate corrective or preventive action
as a result of quality control measurements. In some cases the adjustment may
need to be handled according to procedures for overall change control.
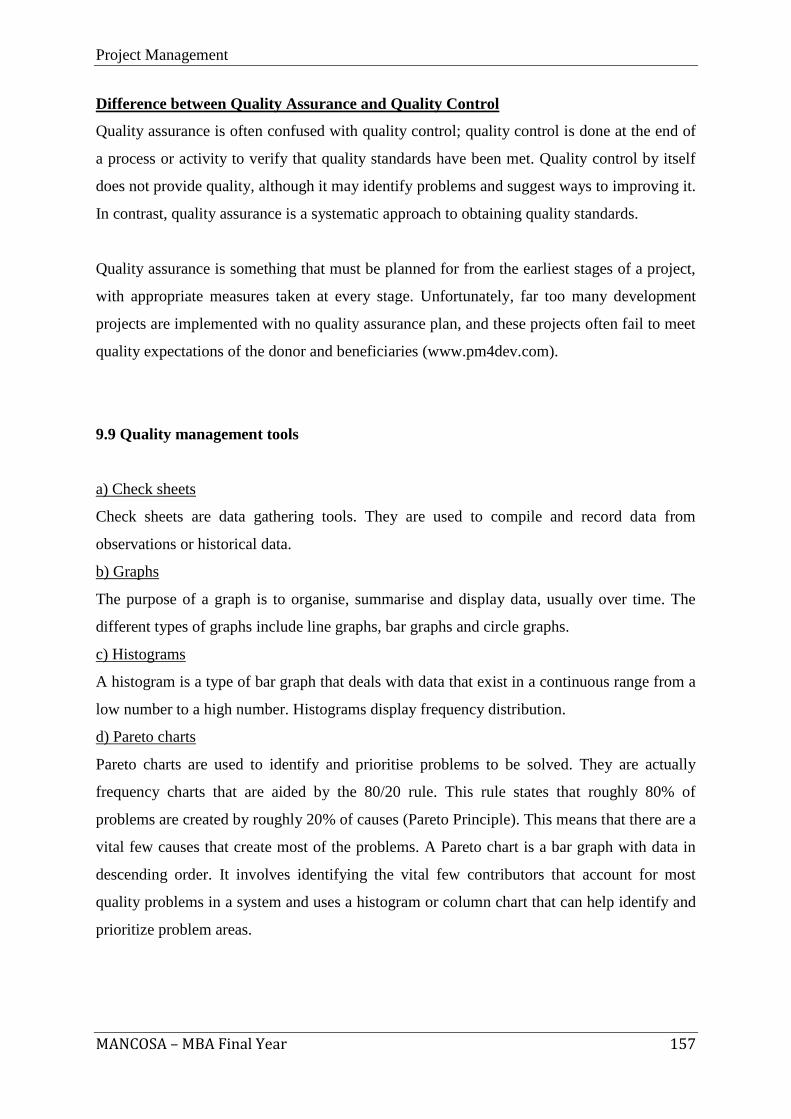
Project Management
MANCOSA – MBA Final Year 157
Difference between Quality Assurance and Quality Control
Quality assurance is often confused with quality control; quality control is done at the end of
a process or activity to verify that quality standards have been met. Quality control by itself
does not provide quality, although it may identify problems and suggest ways to improving it.
In contrast, quality assurance is a systematic approach to obtaining quality standards.
Quality assurance is something that must be planned for from the earliest stages of a project,
with appropriate measures taken at every stage. Unfortunately, far too many development
projects are implemented with no quality assurance plan, and these projects often fail to meet
quality expectations of the donor and beneficiaries (www.pm4dev.com).
9.9 Quality management tools
a) Check sheets
Check sheets are data gathering tools. They are used to compile and record data from
observations or historical data.
b) Graphs
The purpose of a graph is to organise, summarise and display data, usually over time. The
different types of graphs include line graphs, bar graphs and circle graphs.
c) Histograms
A histogram is a type of bar graph that deals with data that exist in a continuous range from a
low number to a high number. Histograms display frequency distribution.
d) Pareto charts
Pareto charts are used to identify and prioritise problems to be solved. They are actually
frequency charts that are aided by the 80/20 rule. This rule states that roughly 80% of
problems are created by roughly 20% of causes (Pareto Principle). This means that there are a
vital few causes that create most of the problems. A Pareto chart is a bar graph with data in
descending order. It involves identifying the vital few contributors that account for most
quality problems in a system and uses a histogram or column chart that can help identify and
prioritize problem areas.
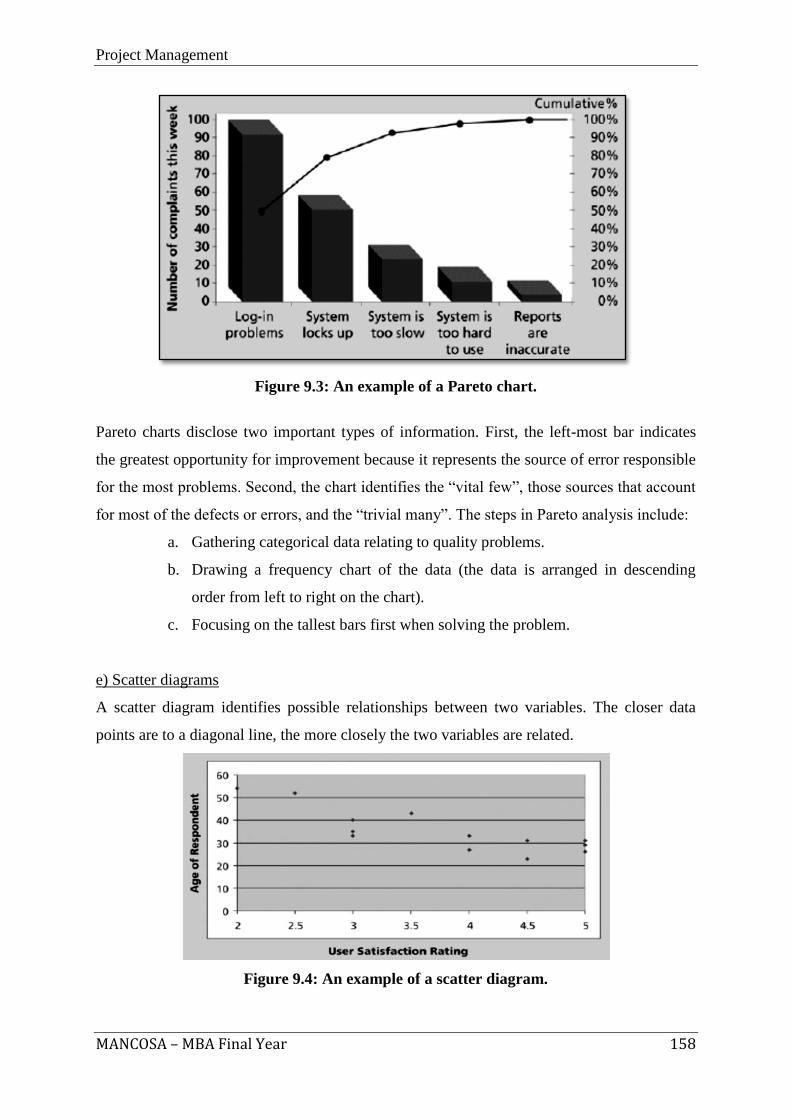
Project Management
MANCOSA – MBA Final Year 158
Figure 9.3: An example of a Pareto chart.
Pareto charts disclose two important types of information. First, the left-most bar indicates
the greatest opportunity for improvement because it represents the source of error responsible
for the most problems. Second, the chart identifies the “vital few”, those sources that account
for most of the defects or errors, and the “trivial many”. The steps in Pareto analysis include:
a. Gathering categorical data relating to quality problems.
b. Drawing a frequency chart of the data (the data is arranged in descending
order from left to right on the chart).
c. Focusing on the tallest bars first when solving the problem.
e) Scatter diagrams
A scatter diagram identifies possible relationships between two variables. The closer data
points are to a diagonal line, the more closely the two variables are related.
Figure 9.4: An example of a scatter diagram.
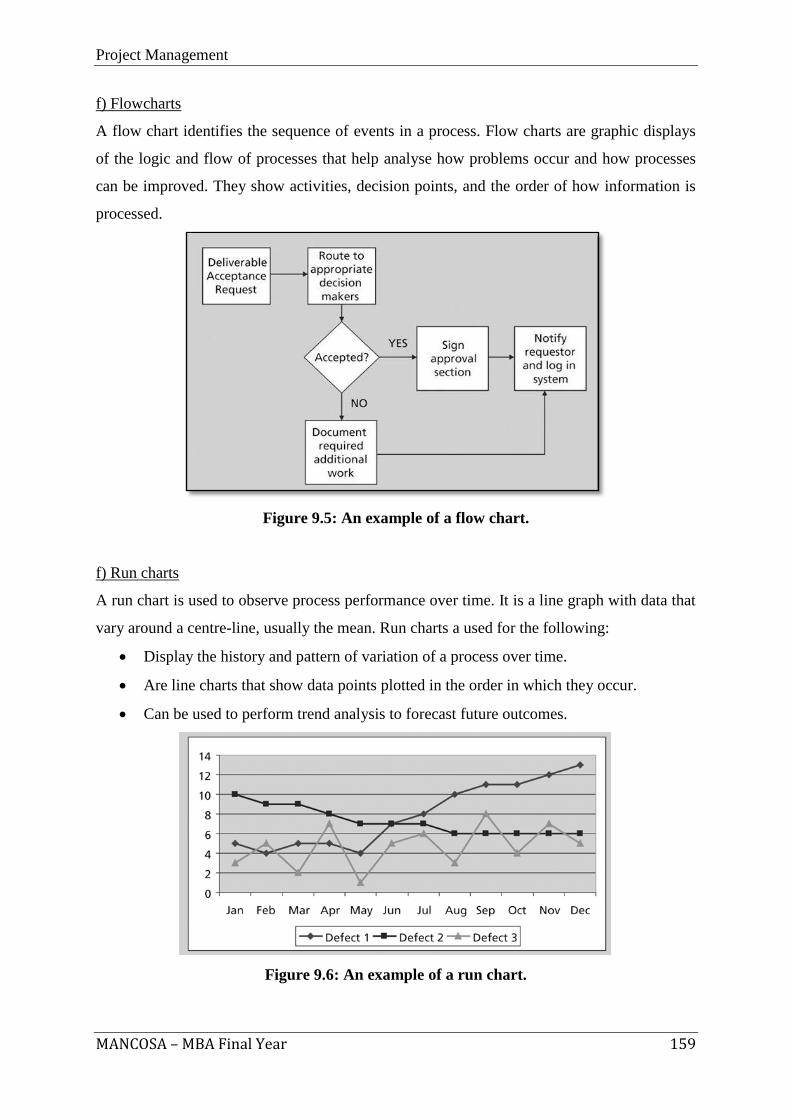
Project Management
MANCOSA – MBA Final Year 159
f) Flowcharts
A flow chart identifies the sequence of events in a process. Flow charts are graphic displays
of the logic and flow of processes that help analyse how problems occur and how processes
can be improved. They show activities, decision points, and the order of how information is
processed.
Figure 9.5: An example of a flow chart.
f) Run charts
A run chart is used to observe process performance over time. It is a line graph with data that
vary around a centre-line, usually the mean. Run charts a used for the following:
Display the history and pattern of variation of a process over time.
Are line charts that show data points plotted in the order in which they occur.
Can be used to perform trend analysis to forecast future outcomes.
Figure 9.6: An example of a run chart.
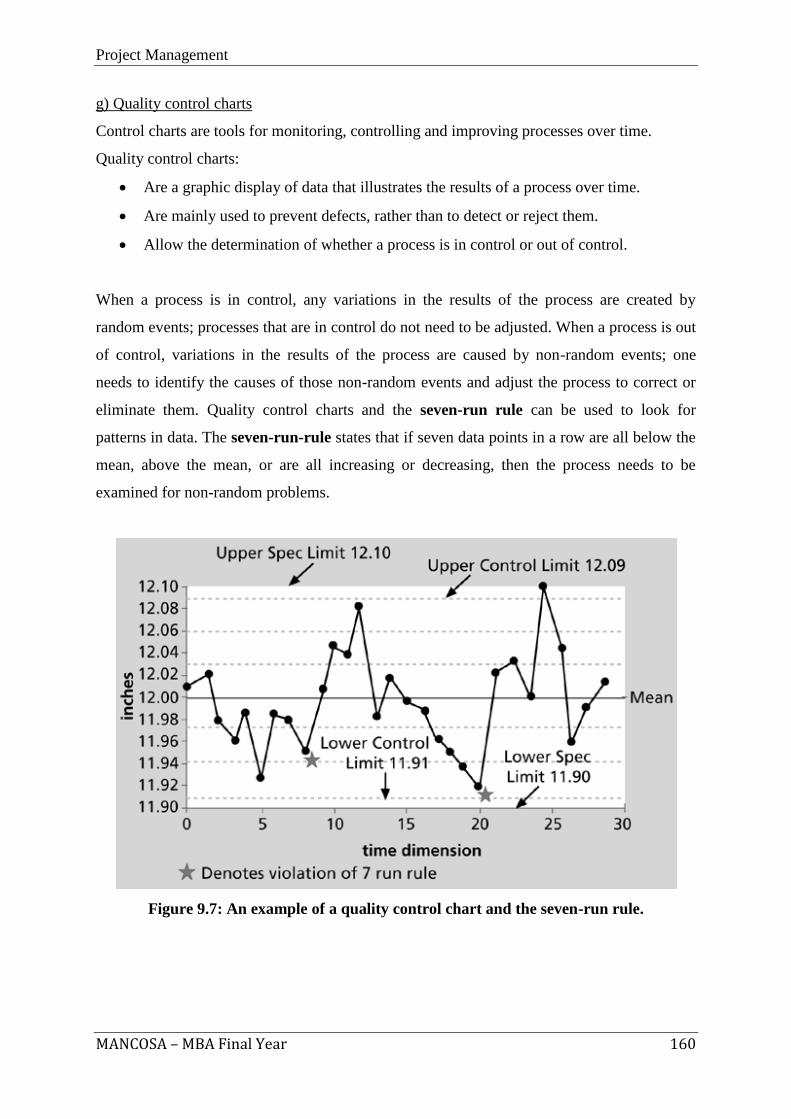
Project Management
MANCOSA – MBA Final Year 160
g) Quality control charts
Control charts are tools for monitoring, controlling and improving processes over time.
Quality control charts:
Are a graphic display of data that illustrates the results of a process over time.
Are mainly used to prevent defects, rather than to detect or reject them.
Allow the determination of whether a process is in control or out of control.
When a process is in control, any variations in the results of the process are created by
random events; processes that are in control do not need to be adjusted. When a process is out
of control, variations in the results of the process are caused by non-random events; one
needs to identify the causes of those non-random events and adjust the process to correct or
eliminate them. Quality control charts and the seven-run rule can be used to look for
patterns in data. The seven-run-rule states that if seven data points in a row are all below the
mean, above the mean, or are all increasing or decreasing, then the process needs to be
examined for non-random problems.
Figure 9.7: An example of a quality control chart and the seven-run rule.
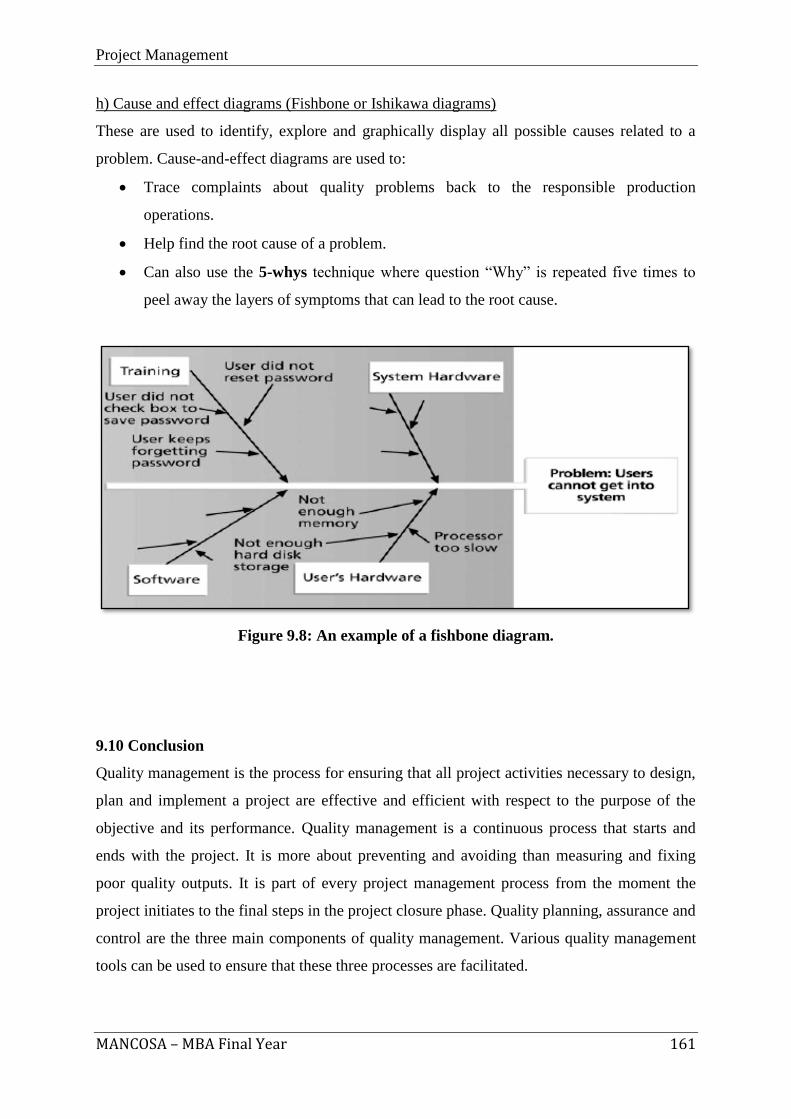
Project Management
MANCOSA – MBA Final Year 161
h) Cause and effect diagrams (Fishbone or Ishikawa diagrams)
These are used to identify, explore and graphically display all possible causes related to a
problem. Cause-and-effect diagrams are used to:
Trace complaints about quality problems back to the responsible production
operations.
Help find the root cause of a problem.
Can also use the 5-whys technique where question “Why” is repeated five times to
peel away the layers of symptoms that can lead to the root cause.
Figure 9.8: An example of a fishbone diagram.
9.10 Conclusion
Quality management is the process for ensuring that all project activities necessary to design,
plan and implement a project are effective and efficient with respect to the purpose of the
objective and its performance. Quality management is a continuous process that starts and
ends with the project. It is more about preventing and avoiding than measuring and fixing
poor quality outputs. It is part of every project management process from the moment the
project initiates to the final steps in the project closure phase. Quality planning, assurance and
control are the three main components of quality management. Various quality management
tools can be used to ensure that these three processes are facilitated.
Project Management
MANCOSA – MBA Final Year 162
10. BIBLIOGRAPHY
Burke, R. (2009). Project Management Techniques. College Edition. Hampshire: Burke
Publishing.
Burke, R.J. and Barron, S. (2007). Project Management Leadership. Hampshire: Burke
Publishing.
Clements, J. P. and Gido, J. (2011). Effective Project Management. 5th
Edition. Boston:
Cengage Learning.
Gray, C.F. and Larson, E.W. (2006). Project Management: The Managerial Process. 3rd
Edition. New York: McGraw-Hill.
Grütter, A. (2010). Introduction to Operations Management – A Strategic Approach. Cape
Town: Pearson Education South Africa (Pty) Ltd.
Heizer, J. and Render, B. (2010). “Project Management” (Ch. 3) in Operations Management.
10th
Edition. New Jersey: Pearson Education Inc.
Kloppenborg, T.J. (2009). Project Management: A Contemporary Approach. Boston:
Cengage Learning.
PMI (2004). A Guide to the Project Management Body of Knowledge (PMBOK Guide). 3rd
Edition. Pennsylvania: Project Management Institute.
Pycraft, M., Singh, H., Phihlela, K., Slack, N., Chambers, S. and Johnston, R. (2010).
Operations Management. 2nd Edition. Cape Town: Pearson Education South Africa (Pty)
Ltd.
Rose, K.H. (2005). Project Quality Management: Why, What and How. Florida: J. Ross
Publishing.
Project Management
MANCOSA – MBA Final Year 163
Schwalbe, K. (2009). Introduction to Project Management. 2nd
Edition. Boston: Cengage
Learning.
Schwartz, R.J. and Smith, C.W. (1997). Derivatives Handbook: Risk Management and
Control. New York: John Wiley & Sons, Inc.
.


![[GSB] - MANCOSA - Management College of Southern Africa · The programme will be delivered at the Mancosa [GSB], ... strategic human resource management and organisational behaviour](https://img.pdfslide.us/doc/110x75/5b4ef9007f8b9a206e8b4e72/gsb-mancosa-management-college-of-southern-the-programme-will-be-delivered.jpg)


![PROSPECTUS 2018 - · PDF fileMember Institution of Honoris United Universities | | 2018 5 What we stand for During 2017, Mancosa [GSB] became a proud member of](https://img.pdfslide.us/doc/110x75/5a79d9607f8b9a5c3a8d54fb/prospectus-2018-member-institution-of-honoris-united-universities-2018-5.jpg)


![PROSPECTUS 2020 - MANCOSA · The Mancosa [GSB] Master of Business Administration (MBA) degree is offered throughout the world with over 3000 graduates adding value to themselves,](https://img.pdfslide.us/doc/110x75/5e6ef13a73326e0d2c7b5990/prospectus-2020-mancosa-the-mancosa-gsb-master-of-business-administration-mba.jpg)