Embed Size (px)
DESCRIPTION
Project Management. Chapter 13 OPS 370. Projects. Project Management. Five Phases Initiation Planning Execution Control Closure. Project Initiation. Project Planning. A. Creation of a Number of Planning Documents: Project Plan Activities, Interdependencies, Time Estimates - PowerPoint PPT Presentation
Citation preview
Project Management
Chapter 13OPS 370
Projects
Project Management
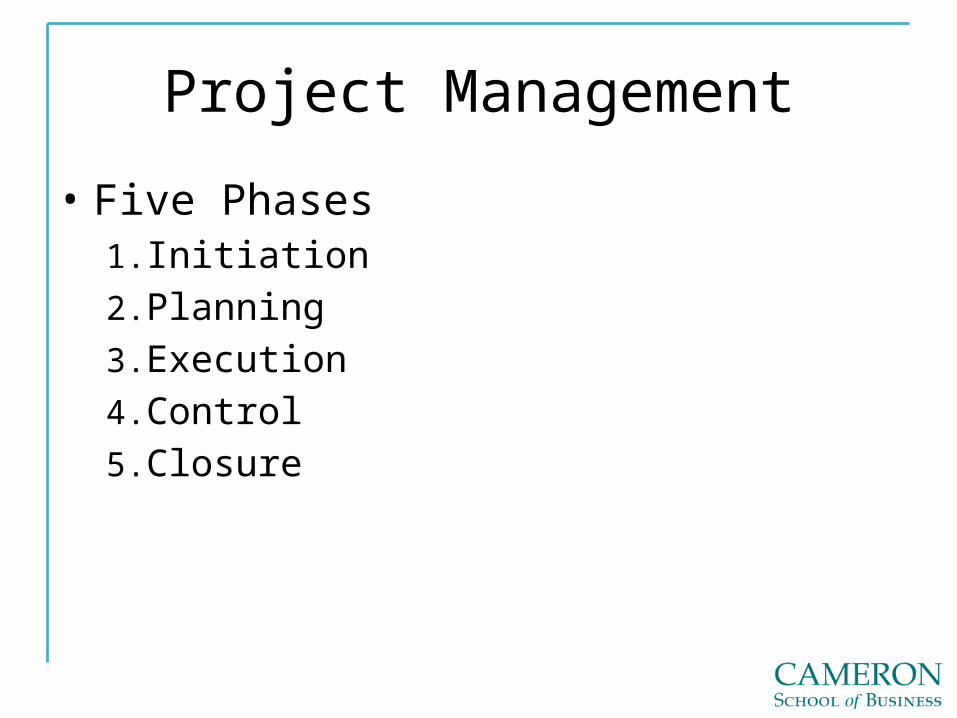
• Five Phases1. Initiation2. Planning3. Execution4. Control5. Closure
Project Initiation
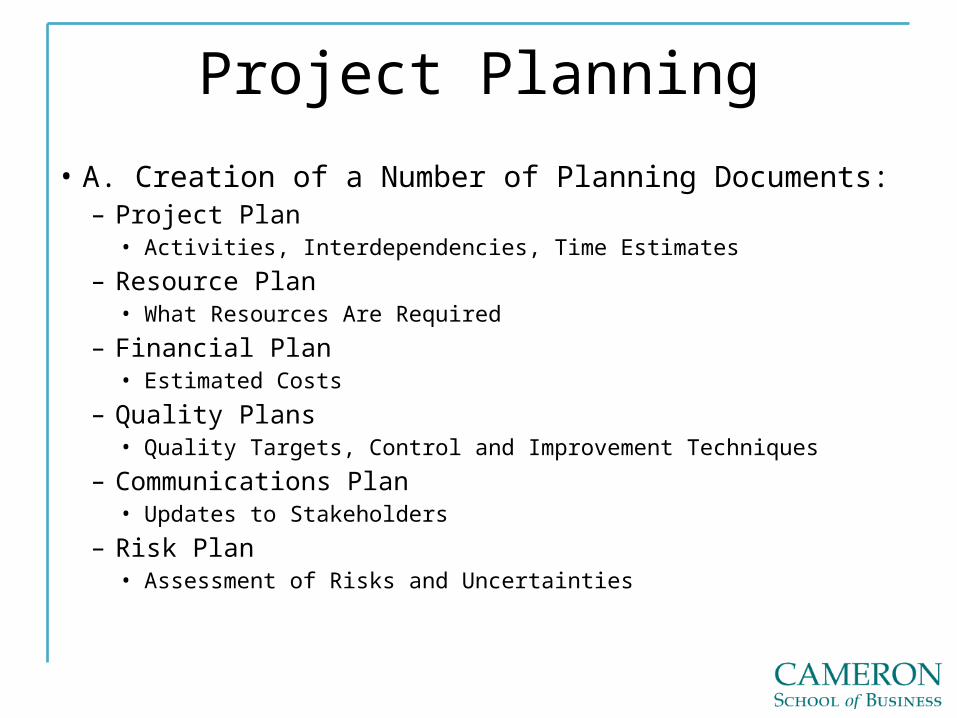
Project Planning• A. Creation of a Number of Planning Documents:
– Project Plan • Activities, Interdependencies, Time Estimates
– Resource Plan• What Resources Are Required
– Financial Plan• Estimated Costs
– Quality Plans• Quality Targets, Control and Improvement Techniques
– Communications Plan• Updates to Stakeholders
– Risk Plan• Assessment of Risks and Uncertainties
Project Execution
Project Control
Project Closure
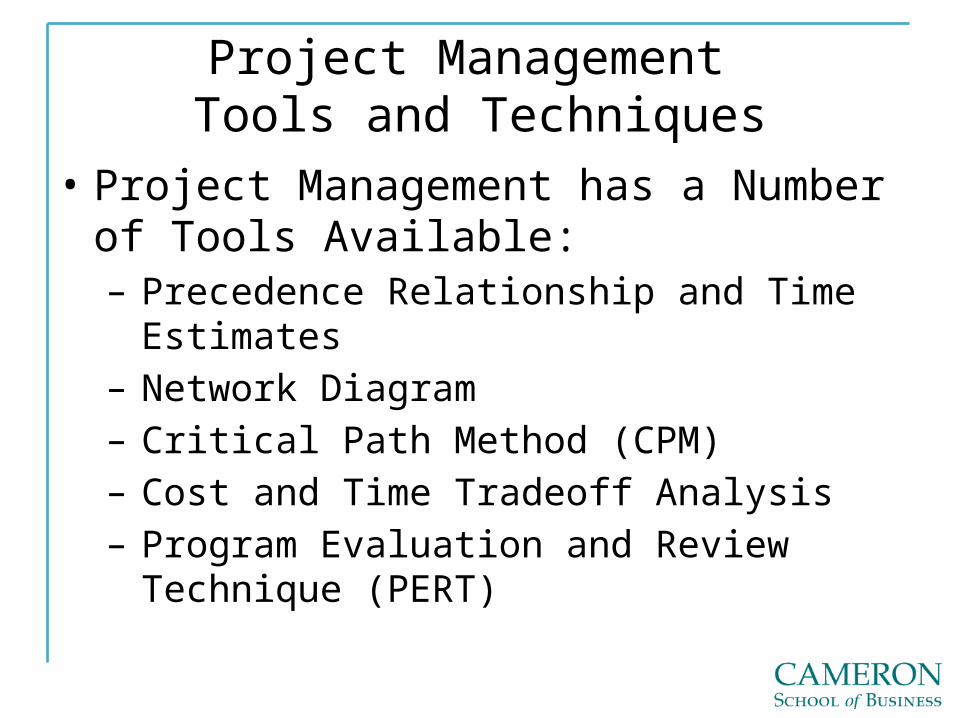
Project Management Tools and Techniques
• Project Management has a Number of Tools Available:– Precedence Relationship and Time Estimates– Network Diagram– Critical Path Method (CPM)– Cost and Time Tradeoff Analysis– Program Evaluation and Review Technique
(PERT)
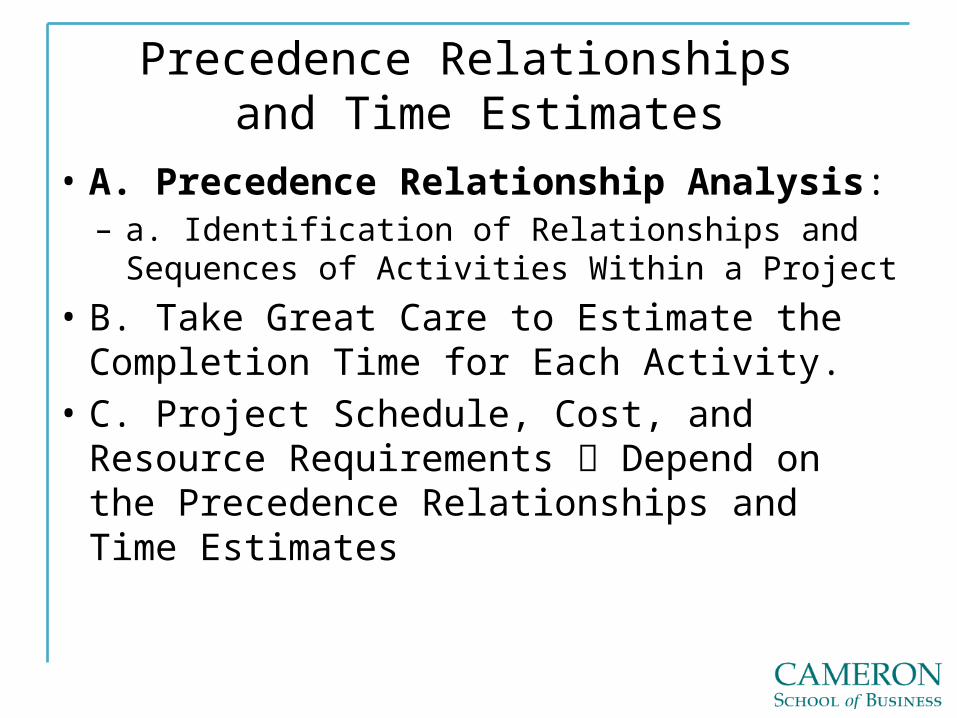
Precedence Relationships and Time Estimates
• A. Precedence Relationship Analysis:– a. Identification of Relationships and Sequences of
Activities Within a Project• B. Take Great Care to Estimate the
Completion Time for Each Activity.• C. Project Schedule, Cost, and Resource
Requirements Depend on the Precedence Relationships and Time Estimates
Network Diagrams
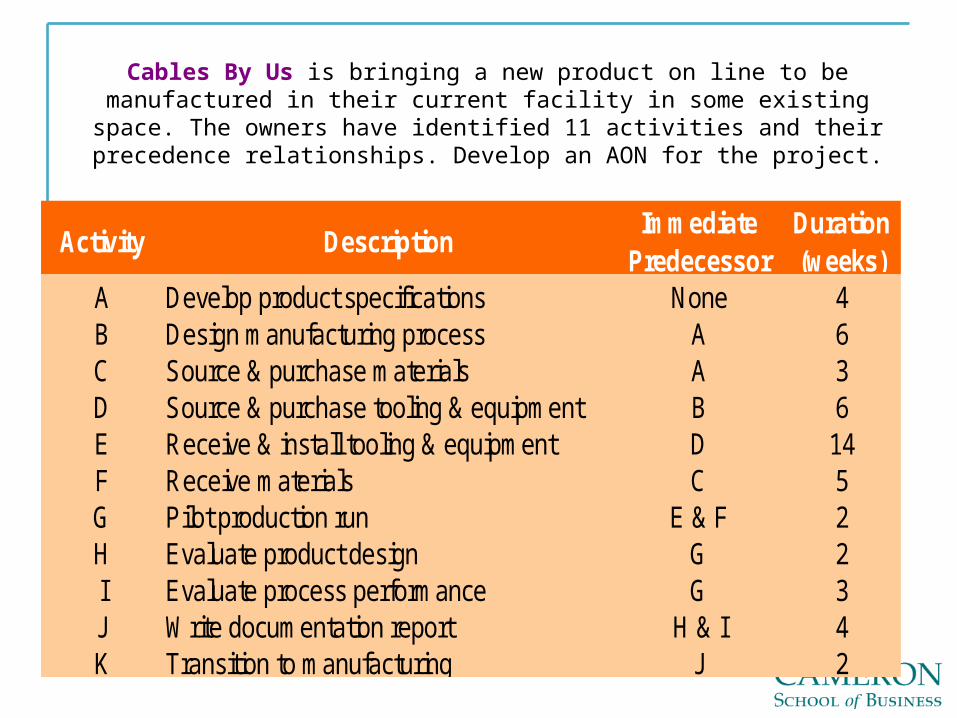
Cables By Us is bringing a new product on line to be manufactured in their current facility in some existing space. The owners have identified
11 activities and their precedence relationships. Develop an AON for the project.
Activity Description Immediate Predecessor
Duration (weeks)
A Develop product specifications None 4B Design manufacturing process A 6C Source & purchase materials A 3D Source & purchase tooling & equipment B 6E Receive & install tooling & equipment D 14F Receive materials C 5G Pilot production run E & F 2H Evaluate product design G 2I Evaluate process performance G 3J Write documentation report H & I 4K Transition to manufacturing J 2
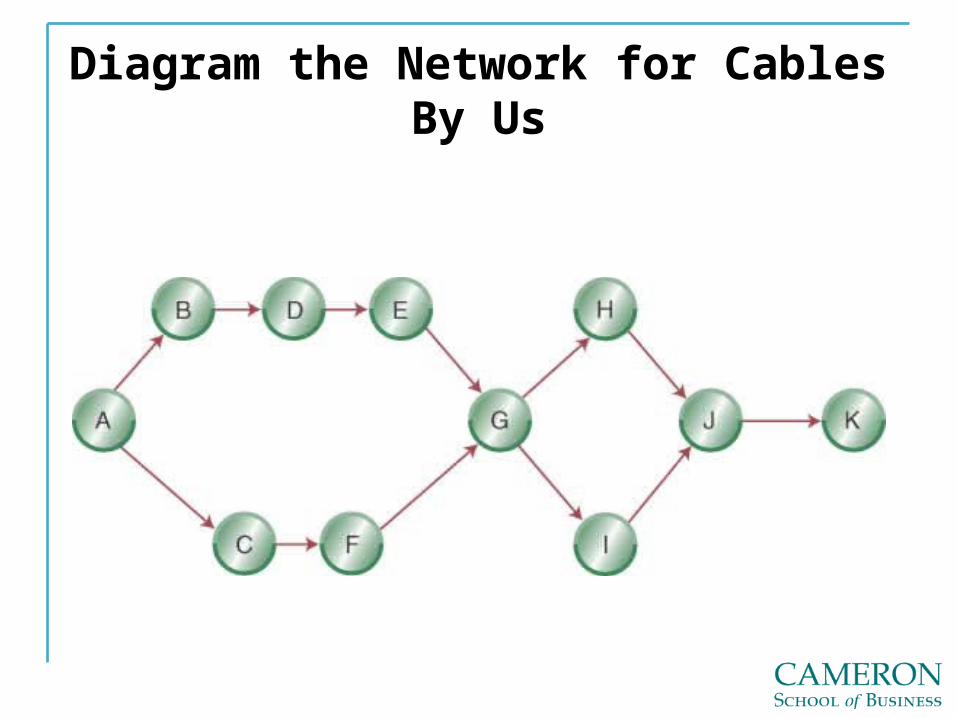
Diagram the Network for Cables By Us
Construct a Network
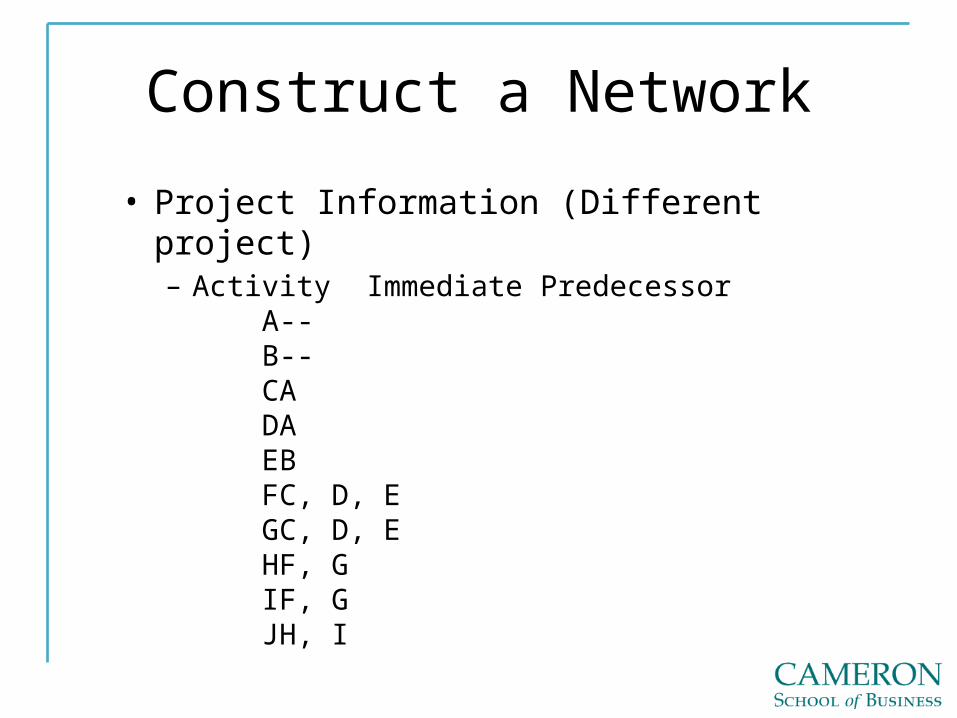
• Project Information (Different project)– Activity Immediate Predecessor
A -- B -- C A D A E B F C, D, E G C, D, E H F, G I F, G J H, I
Construct a Network
Critical Path Method
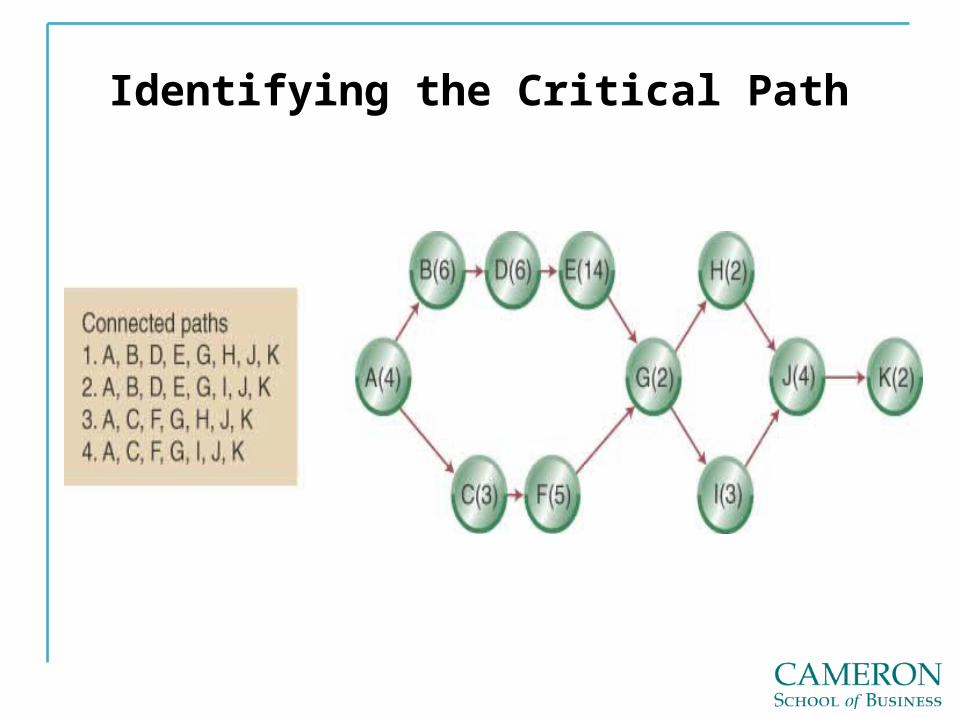
Identifying the Critical Path
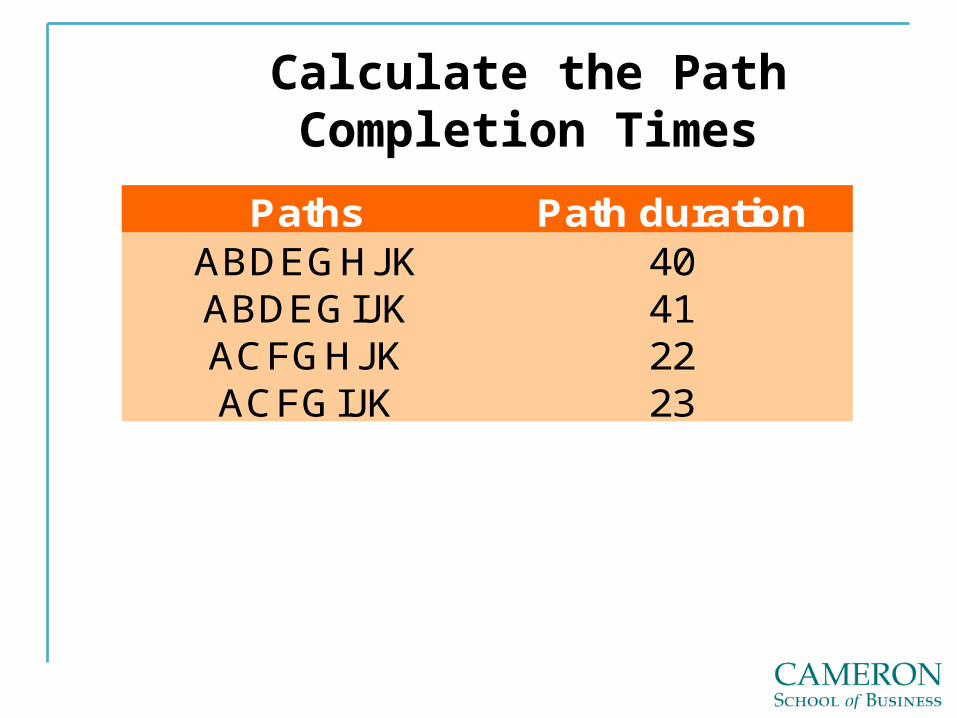
Calculate the Path Completion Times
Paths Path durationABDEGHJK 40ABDEGIJK 41ACFGHJK 22ACFGIJK 23
Some Network Definitions
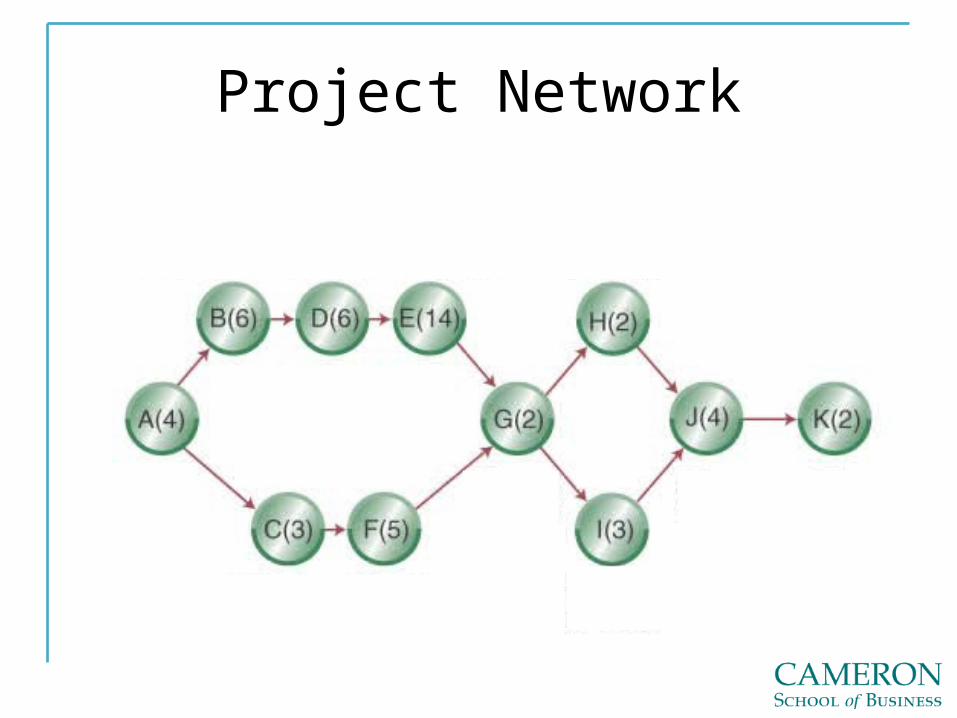
Project Network
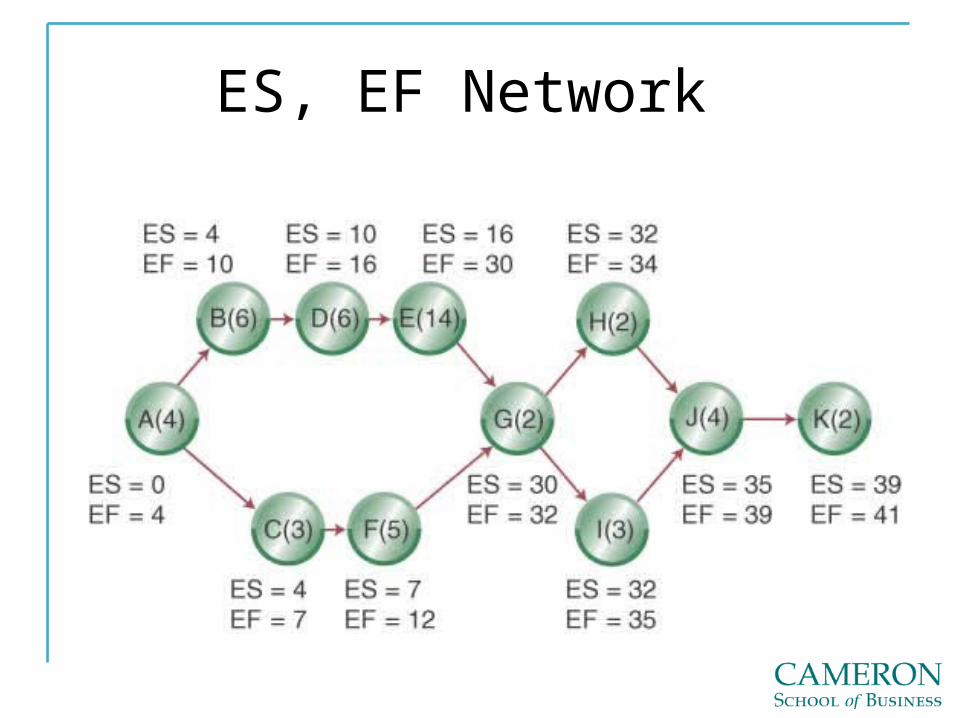
ES, EF Network
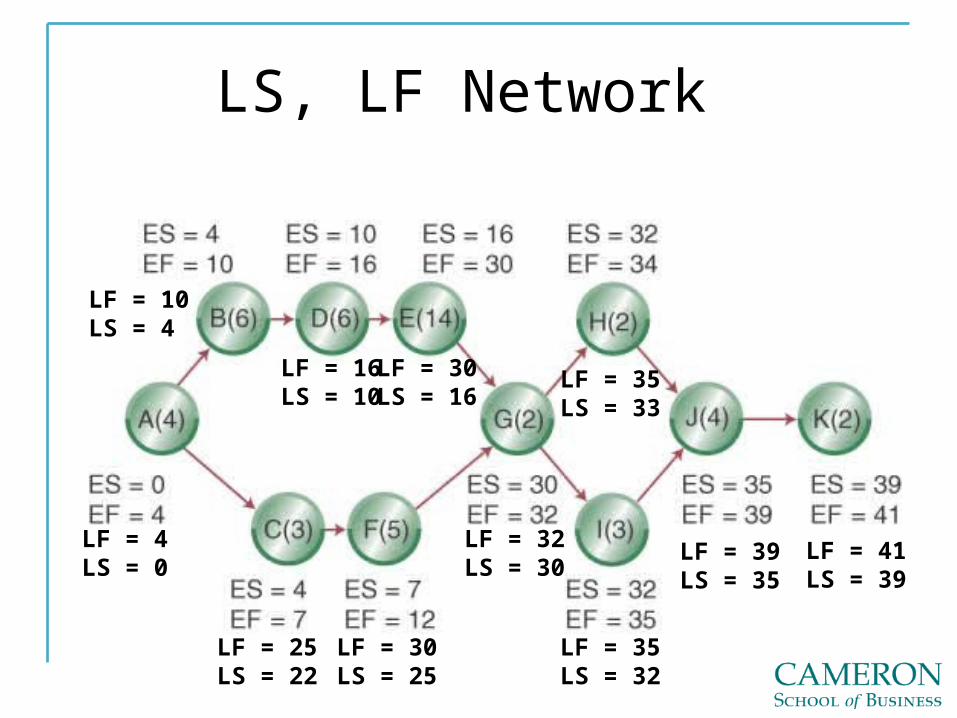
LS, LF Network
LF = 41LS = 39
LF = 39LS = 35
LF = 35LS = 32
LF = 35LS = 33
LF = 32LS = 30
LF = 30LS = 16
LF = 30LS = 25
LF = 25LS = 22
LF = 16LS = 10
LF = 10LS = 4
LF = 4LS = 0
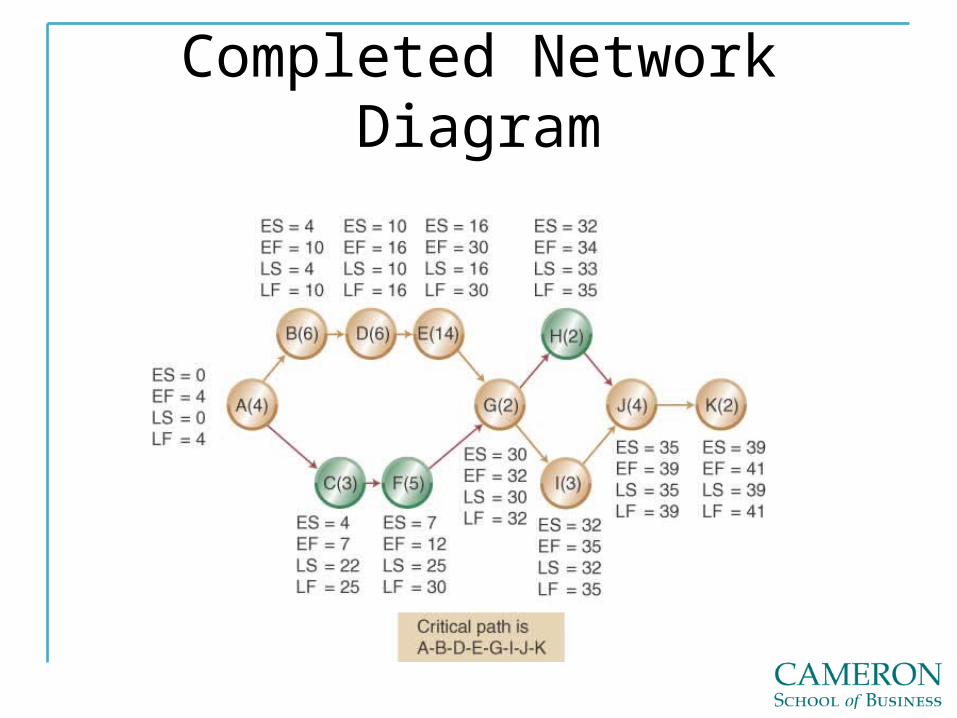
Completed Network Diagram
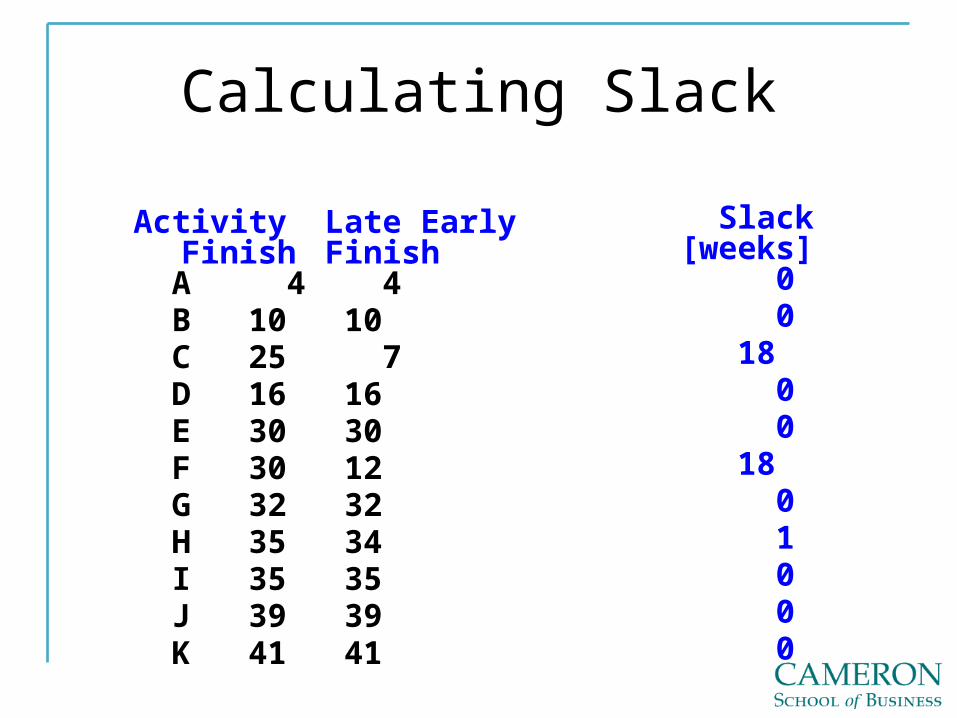
Calculating Slack
Activity Late EarlyFinish Finish
A 4 4 B 10 10 C 25 7 D 16 16 E 30 30 F 30 12 G 32 32 H 35 34 I 35 35 J 39 39 K 41 41
Slack[weeks] 0 0 18 0 0 18 0 1 0 0 0
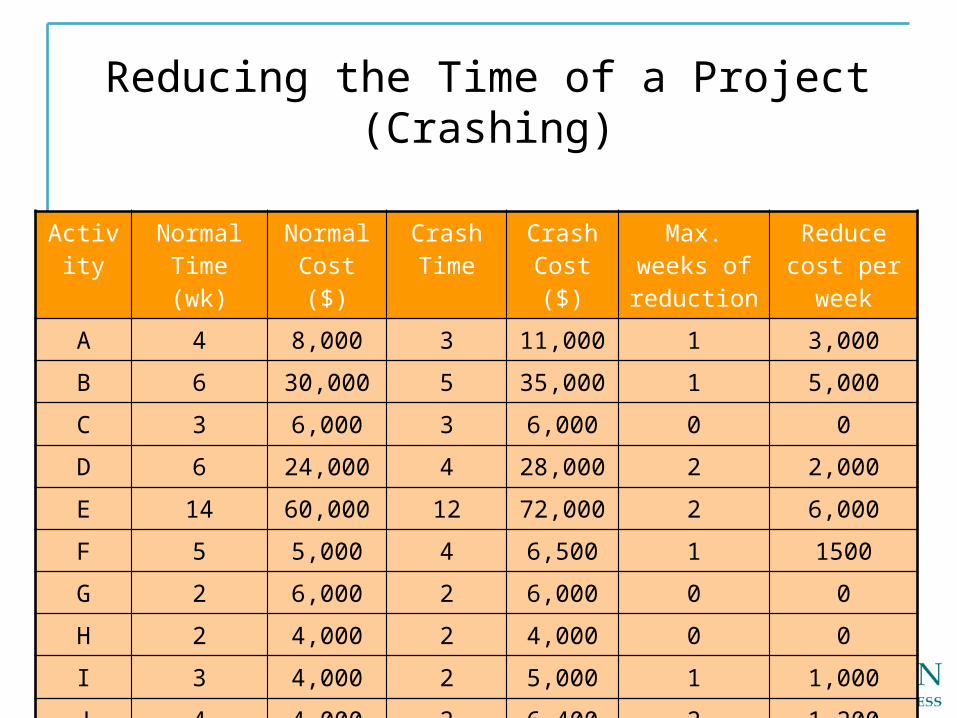
Reducing the Time of a Project (Crashing)
Activity
Normal Time (wk)
Normal Cost ($)
Crash Time
Crash Cost ($)
Max. weeks of reduction
Reduce cost per
weekA 4 8,000 3 11,000 1 3,000B 6 30,000 5 35,000 1 5,000C 3 6,000 3 6,000 0 0D 6 24,000 4 28,000 2 2,000E 14 60,000 12 72,000 2 6,000F 5 5,000 4 6,500 1 1500G 2 6,000 2 6,000 0 0H 2 4,000 2 4,000 0 0I 3 4,000 2 5,000 1 1,000J 4 4,000 2 6,400 2 1,200K 2 5,000 2 5,000 0 0
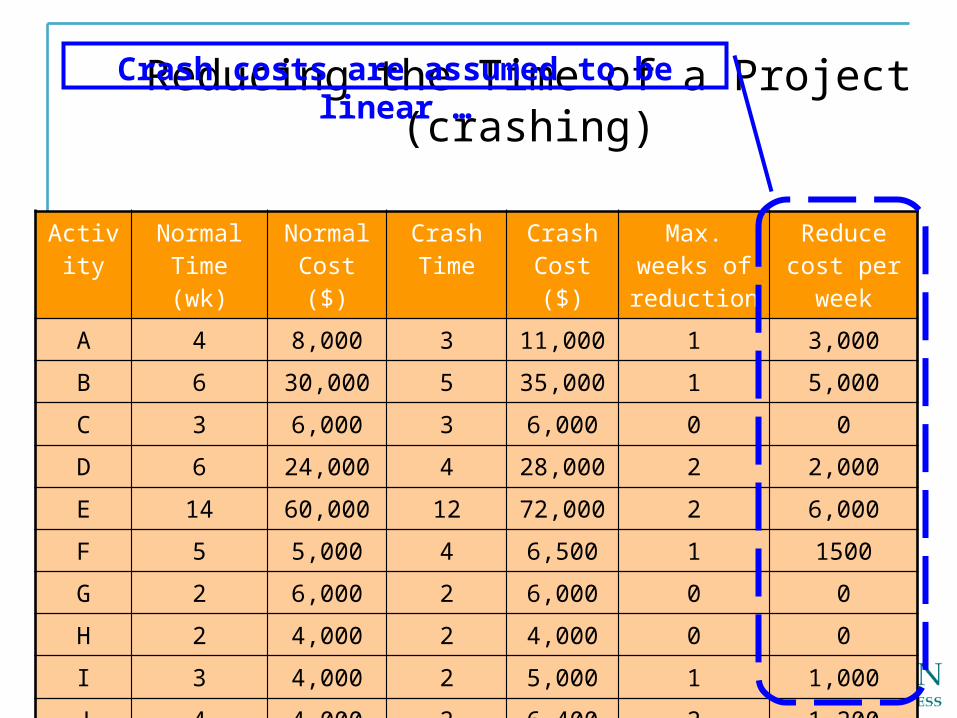
Reducing the Time of a Project (crashing)
Activity
Normal Time (wk)
Normal Cost ($)
Crash Time
Crash Cost ($)
Max. weeks of reduction
Reduce cost per
weekA 4 8,000 3 11,000 1 3,000B 6 30,000 5 35,000 1 5,000C 3 6,000 3 6,000 0 0D 6 24,000 4 28,000 2 2,000E 14 60,000 12 72,000 2 6,000F 5 5,000 4 6,500 1 1500G 2 6,000 2 6,000 0 0H 2 4,000 2 4,000 0 0I 3 4,000 2 5,000 1 1,000J 4 4,000 2 6,400 2 1,200K 2 5,000 2 5,000 0 0
Crash costs are assumed to be linear …
Crashing Example: Suppose the Cables By Us project manager wants to reduce the new product project from 41 to
36 weeks.
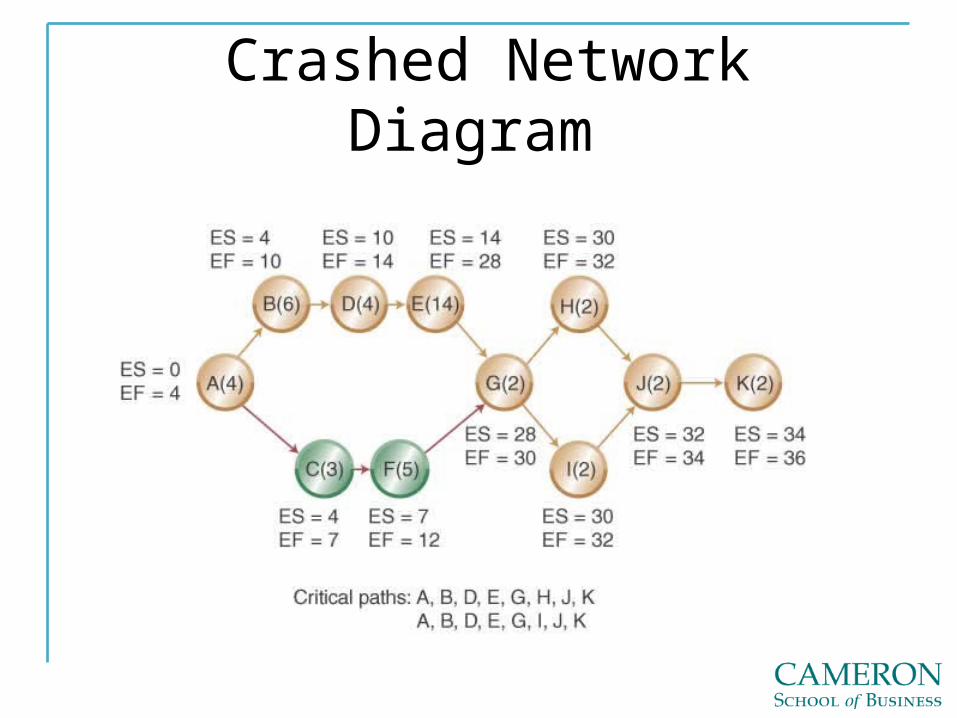
Crashed Network Diagram
PERT• A. Program Evaluation and Review Technique: Addresses
the Impact of Uncertainties in Activity Time Estimates on the Duration of the Entire Project
• B. Different Estimates for Activity Times are Developed:
PERT

PERT
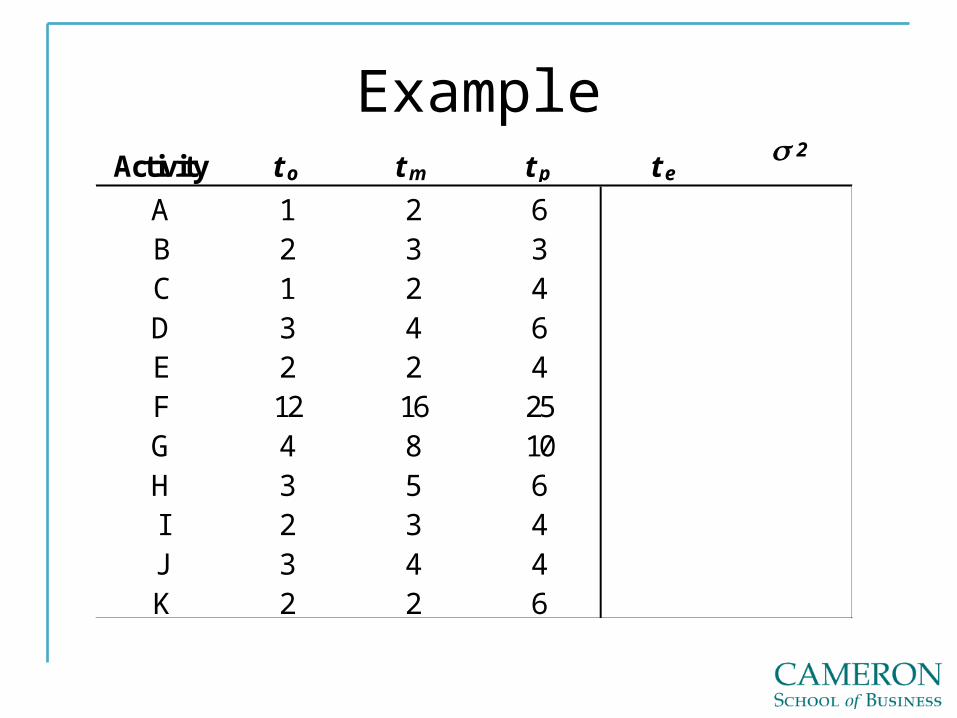
ExampleActivity t o tm t p t e s 2
A 1 2 6B 2 3 3C 1 2 4D 3 4 6E 2 2 4F 12 16 25G 4 8 10H 3 5 6I 2 3 4J 3 4 4K 2 2 6
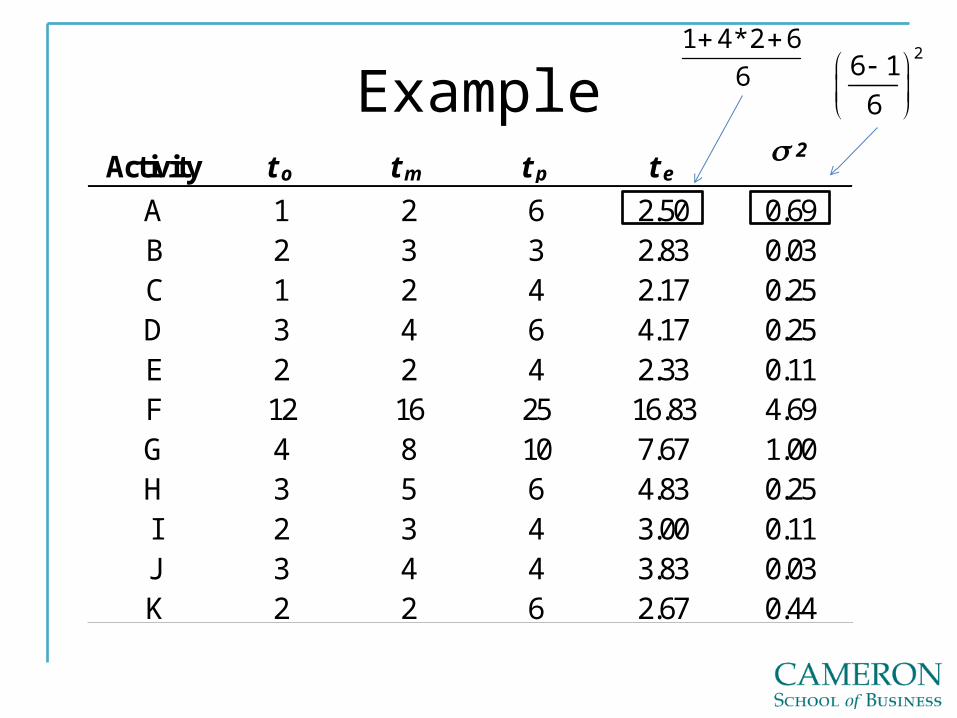
ExampleActivity t o tm t p t e s 2
A 1 2 6 2.50 0.69B 2 3 3 2.83 0.03C 1 2 4 2.17 0.25D 3 4 6 4.17 0.25E 2 2 4 2.33 0.11F 12 16 25 16.83 4.69G 4 8 10 7.67 1.00H 3 5 6 4.83 0.25I 2 3 4 3.00 0.11J 3 4 4 3.83 0.03K 2 2 6 2.67 0.44
26 16
1 4*2 66
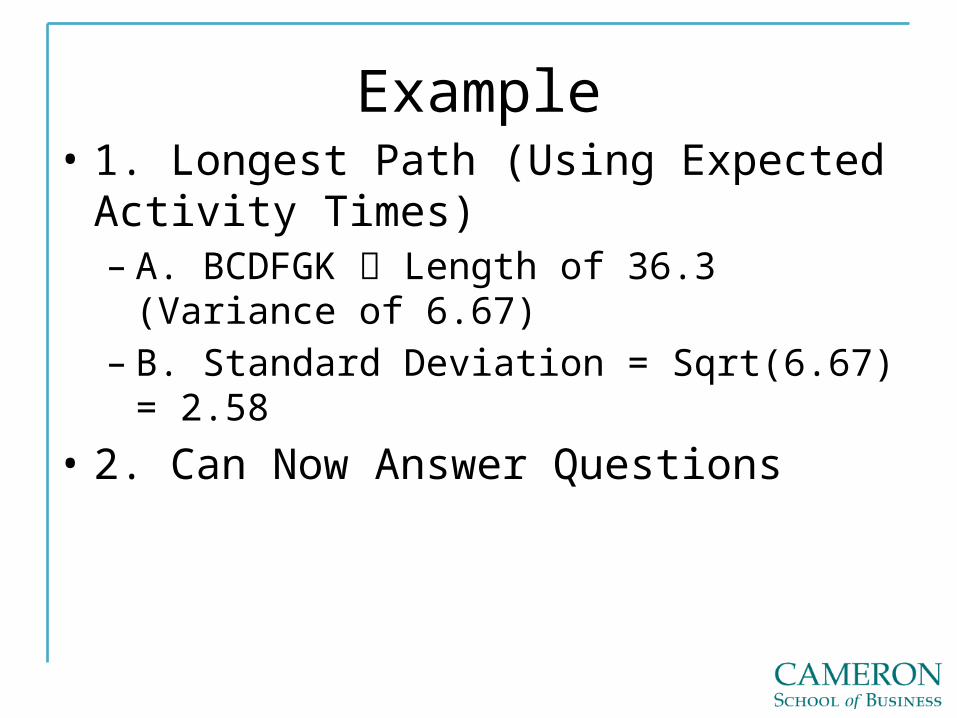
Example• 1. Longest Path (Using Expected Activity
Times)– A. BCDFGK Length of 36.3 (Variance of 6.67)– B. Standard Deviation = Sqrt(6.67) = 2.58
• 2. Can Now Answer Questions
Example
• 1. Continued– A. With 95% Probability, What Is the Date the
Project Can Be Expected to Be Completed?