Embed Size (px)
Citation preview
No. 19
October 1998
Project for the Analysis ofLand Tenure and AgriculturalProductivity in theRepublic of Macedonia
Jolyne Melmed-Sanjak, Peter Bloch, Robert Hanson
PROJECT FOR THE ANALYSIS OF LAND TENURE
AND AGRICULTURAL PRODUCTIVITY IN
THE REPUBLIC OF MACEDONIA
assembled by
Jolyne Melmed-Sanjak, Peter Bloch,
Robert Hanson
WORKING PAPER, NO. 19
Land Tenure Center
University of Wisconsin–Madison
October 1998
ii
Prepared for the Land Tenure Center of the University of Wisconsin–Madison.Funding from USAID–Skopje, Macedonia. Completed with the participation ofFaculty of Agriculture, Faculty of Law, and Institute of Sociological, Juridical andPolitical Research of The University of St. Cyril and Methodius.
All views, interpretations, recommendations, and conclusions expressed in this paperare those of the authors and not necessarily those of the supporting or cooperatinginstitutions. The Land Tenure Center has formatted this paper to conform with others inthe Working Paper Series but has not formally edited the contents.
Copyright © 1998 by Jolyne Melmed-Sanjak,Peter Bloch, Robert Hanson. All rights reserved.
Readers may make verbatim copies of thisdocument for noncommercial purposes by anymeans, provided that this copyright noticeappears on all such copies.
iii
TABLE OF CONTENTSPage
LIST OF TABLES vi
ACKNOWLEDGMENTS viii
I: INTRODUCTION 1
A. Background 1B. Project activities 3
1. Land-related constraints to increased productivity and profitability of private farms 32. Land-related constraints to increased productivity and profitability of socially owned farms 53. Legislation, regulations, and institutions affecting land tenure and land use 5
II: THE INSTITUTIONAL FRAMEWORK FOR AGRICULTURAL LAND TENURE AND LAND USE IN THEREPUBLIC OF MACEDONIA 6
A. Constitutional foundation of land policy 6B. Land policy according to current legislation 6C. Historical background of land tenure and land use policy 9
1. Transformation of usufruct into ownership 92. Historical aspects of the development of landownership in Macedonia 10
D. Analysis of current policy in the agricultural sector 161. Private ownership 162. Derivative types of ownership 173. Common property 18
E. Other legal relations on agricultural land 181. Servitude 182. Rights of pledge and mortgage 203. Rights of neighbor 204. Disposal of agricultural land 205. Inheritance 21
F. Social ownership and its transformation 21G. Agricultural land and the law on denationalization 25H. Cooperative ownership: past and future 25I. Reallocation of holdings (arondacija) 29
J. Registration of ownership of agricultural land 30K. Conclusion 31
III: THE PRIVATE FARM ECONOMY 32
A. Background 32B. Sample selection and survey design 35
1. Survey instruments 36C. Results of empirical research for the private agricultural sector 37
1. Demographic results 372. Age and education structure 40
D. Land acquisition in the Republic of Macedonia 441. Inheritance 44
iv
2. Purchase 463. Leasing 47
E. The Market for land 471. General characteristics 472. Prices 48
F. Land use 491. Uncultivated land 502. Land use of leased and purchased agricultural land 51
G. Patterns of production in Macedonia’s private farm economy 511. Orientation of production 512. Productivity 563. Irrigation 59
H. Evaluating of the extent and effects of fragmentation 591. Introduction 592. Fragmentation in Macedonia 603. Causes of fragmentation 604. Advantages and disadvantages of fragmentation 605. Degree of fragmentation 616. Measurement of fragmentation 627. Effect of fragmentation on agricultural productivity 64
I. Agricultural marketing 641. Output markets 642. Input markets 65
J. Agricultural services 66K. Conclusions 66
IV: SOCIALLY OWNED AGRICULTURAL ENTERPRISES 69
A. Background 69B. Sample selection methodology 69C. Brief description of the surveyed enterprises 70D. Method of analysis 72E. Results of the analysis of the sample farms 73
1. Land use 742. Mechanization 753. Professional and skill structure of the labor force 764. Production and productivity 77
F. Conclusions 85
V. A COMPARATIVE REVIEW OF LAND USE AND PRODUCTIVITY ACROSS THE SOCIAL AND PRIVATESECTORS 87
A. Land use 87B. Land acquisition 87C. Resource access 88D. Relative productivity 88E. Some problems of comparison 92F. Conclusion 92
v
VI: SUMMARY OF RESEARCH FINDINGS AND POLICY RECOMMENDATIONS 94
A. Summary of results 941. Comparative productivity and profitability of small farms and agrokombinats 942. Effects of fragmentation on productivity and profitability of small private farms 943. Economics of the land market 954. Legal and institutional constraints to increasing productivity and efficient land market operation 955. Market orientation of the private farm sector 96
B. Land policy adjustments to promote the increased productivity and profitability of the agriculturalsector 96
1. Land market development 962. Linkage to the credit market 973. Transactions costs on land sales 974. Intrafamily land transfers (inheritance, etc.) 985. Protection of agricultural land 996. Equity considerations 1017. Conflict resolution 1018. Cadastral property registration system 1019. Consolidation of fragmented private farm holdings 10210. Social sector restructuring: leasing of publicly owned agricultural land 10311. Market information and public education 105
C. Summary legislative reform agenda 105D. Financial and technical assistance to support the development of land markets to promote efficient,
sustainable, and equitable increases in agricultural incomes 1071. Legal reform 1072. Upgrading the cadastral land registration system 1083. Reinforcement of public land administration capacity 1084. Establishment of monitoring and policy analysis capacity to support market-oriented agriculture and
land market development 1095. Consolidation 1106. Market information and public education 111
APPENDIX 1: PERSONNEL 113
APPENDIX 2: BACKGROUND LITERATURE REFERENCES 114
APPENDIX 3: STRUCTURE OF THE OPTIMAL SAMPLE BY REGION, MUNICIPALITIES, AND VILLAGES 115
APPENDIX 4: HOUSEHOLD LEVEL SURVEY INSTRUMENT 117
APPENDIX 5: VILLAGE LEVEL SURVEY INSTRUMENT 128
APPENDIX 6: LITERATURE REVIEW ON FRAGMENTATION, WITH REFERENCES: 134
vi
LIST OF TABLES
Table 3.1: Number of farms in the Republic of Macedonia according to the census of 1931 33
Table 3.2: Holding structure of households according to 1981 census 34
Table 3.3: Population and sample farm size structure 36
Table 3.4: Number of rural households and their size 38
Table 3.5: Average size of the private farms, according to the holding size 38
Table 3.6: Some basic socioeconomic indices of the private farms in the regions studied 39
Table 3.7: Landholdings and family size of private farm sector 39
Table 3.8: Labor force utilization on private farms by holding size 40
Table 3.9: Age structure of the head of household by regions 41
Table 3.10: Level of education of the head of the household 41
Table 3.11: Land too fragmented? 42
Table 3.12: Interest in consolidation 43
Table 3.13: Support for government initiated consolidation 43
Table 3.14: Land acquisition strategies by farm size 45
Table 3.15: Average prices of rented land 49
Table 3.16: Land use by crop for the sample population according to the percentage of landarea and percentage of parcels 50
Table 3.17: Land use by crop for rented land in the private agricultural sector 51
Table 3.18: Percentage of farmers cultivating specific crops by region 52
Table 3.19: Uses of production by farm size for wheat 53
Table 3.20:Uses of production by farm size for corn 54
Table 3.21: Uses of production by farm size for tomatoes 55
Table 3.22: Output per hectare in kilograms, 1995 56
Table 3.23: Input use and output per hectare of wheat cultivated 58
Table 3.24: Mechanization in the private farm sector 58
Table 3.25: Value of inputs and output by hectare of wheat cultivated 59
Table 3.26: Degree of land fragmentation by farm operation size 62
Table 3.27: Percentage of farmers acquiring seed inputs from various sources 66
vii
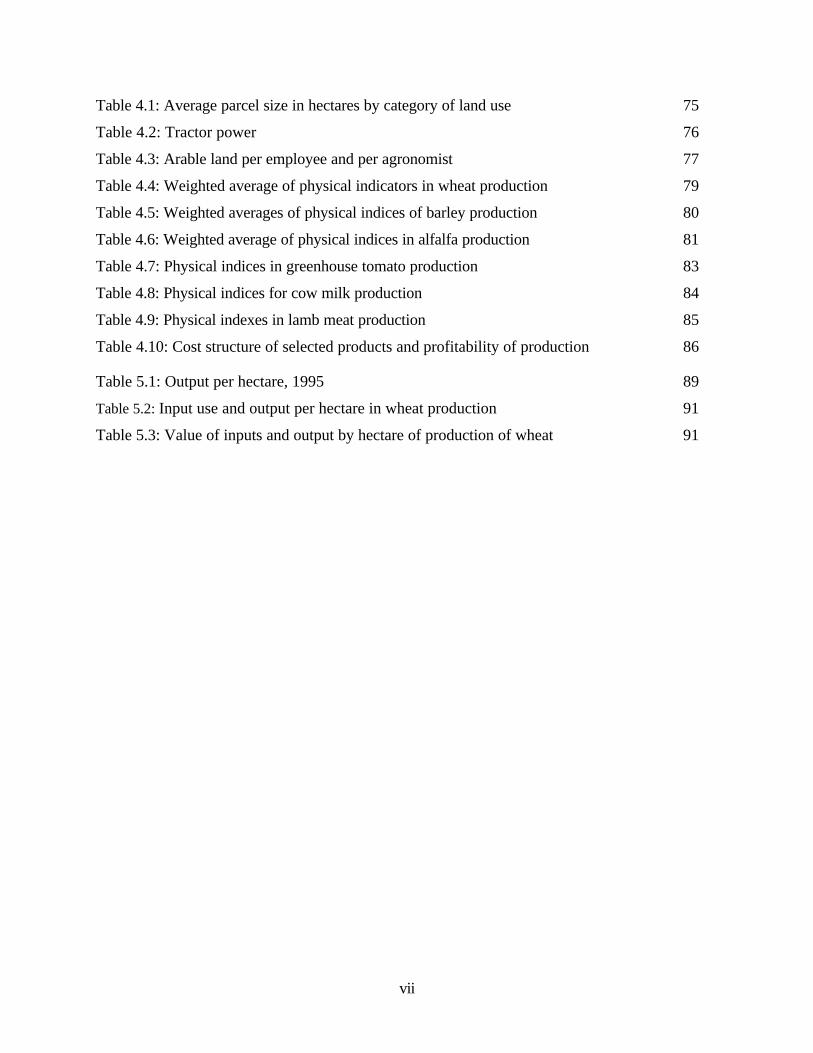
Table 4.1: Average parcel size in hectares by category of land use 75
Table 4.2: Tractor power 76
Table 4.3: Arable land per employee and per agronomist 77
Table 4.4: Weighted average of physical indicators in wheat production 79
Table 4.5: Weighted averages of physical indices of barley production 80
Table 4.6: Weighted average of physical indices in alfalfa production 81
Table 4.7: Physical indices in greenhouse tomato production 83
Table 4.8: Physical indices for cow milk production 84
Table 4.9: Physical indexes in lamb meat production 85
Table 4.10: Cost structure of selected products and profitability of production 86
Table 5.1: Output per hectare, 1995 89
Table 5.2: Input use and output per hectare in wheat production 91
Table 5.3: Value of inputs and output by hectare of production of wheat 91
viii
ACKNOWLEDGMENTS
The project dealt with complex issues, requiring the accumulation of detailed data at theindividual farm level and in-depth analyses of legal and historical processes. There was nosubstantial precedent for this kind of analysis in the Republic of Macedonia, and the projectneeded to be completed in a short period of time. Additionally, there were divergent conceptualperceptions of the problems we addressed and the respective methods of analysis. Therefore,great credit must be given to all those participants in this project who worked diligently andcooperatively to make our endeavor a success. In Appendix 1 we recognize and thank those whocontributed.
Dr. Jolyne Melmed-Sanjak, Project Manager
Dr. Peter Bloch, Land Tenure Center, University of Wisconsin–Madison, Project Supervisor
Mr. Robert Hanson, University of Wisconsin–Madison, Land Tenure Center
I: INTRODUCTION
A. BACKGROUND
The agricultural sector in Macedonia is characterized by two very different farm enterprise types:small family farms operating on privately owned land, and large socially owned farms. The lattercan be further classified into two types: (1) agrokombinats, vertically integrated agribusinesses,which have large landholdings and are engaged in primary production, extensive agro-industrialprocessing, commercial storage, and marketing services; and (2) socially owned agriculturalcompanies, which have smaller holdings and engage to a much lesser extent in nonprimaryproduction activities. The total arable land in Macedonia is 662,000 hectares, of which 204,000,or about 30 percent, belong to socially owned farms. Most of the balance belong to the privatefarm sector; the cooperative sector occupies a small percentage of the arable land.1
Many farm households derive a significant proportion of their incomes from nonfarm activities; bythe official definition, only 14 percent of the population of Macedonia engages in full-timefarming. This definition, however, is very strict: if any member of the household, not necessarilythe head or spouse, earns income from off-farm employment, the household is considered to beengaged in part-time farming. The definition is clearly inappropriate. Around the world, thenumbers of farmers who derive all of their income from farming have steadily declined. Today inmost places, farm households which earn some of their income from nonfarm sources (e.g., off-farm wage employment and remittances) are predominant. Future research on the data collectedunder this project will explore the possibility of alternative distinctions, including the identificationof market-oriented farmers, or those who are likely to respond to agricultural policy in abusinesslike manner, as contrasted with “hobby” farmers and subsistence farmers, or those whoare less likely to respond advantageously to policy change.
There has also been substantial out-migration from regions where farm sizes are small or whereagriculture is only marginally profitable. Furthermore, the population engaged in farming containsa high proportion of aging and elderly persons. The family farm sector comprises a wide range offarm operations, but most of them are small: the average farm size is 2.5–2.8 hectares. Somefarms have been able to achieve larger sizes through land leasing (until 1988, the legal ownershipmaximum was 10 hectares2). An important characteristic of the family farms is that they arefragmented: a family’s landholding is composed of not one parcel, but rather several (sometimesmore than twenty) noncontiguous parcels. The fragmentation is generally due to inheritance
1 There are serious discrepancies among data sources even for such fundamental numbers as the cultivatedarea. As Chapter 3 shows, the 1994 Census reports that private farms cultivate about half the amount thatthe Statistics Office reports. There is also imperfect reporting of the subdivisions within the social sector,among the organized social sector (agrokombinats), the unorganized social sector (scattered parcelsacquired by the state over time), and the cooperative sector.2 Currently there is no limit; farm sizes still reflect the historical legacy of inheritance, land scarcity, andsocial limits on the amount of landholding per family.
2
practices and a long history of informal land market activity constrained by lack of capital andlabor. A major concern of the Ministry of Agriculture is that this fragmentation causes productioninefficiency and low output levels. The Ministry has suggested that consolidation is the bestsolution to fragmentation.
Another major problem facing family farms is the lack of both factor and product markets. Smallfarms are not able to take advantage of economies of scale in marketing. They have difficulty inobtaining inputs, lack access to agricultural credit and extension services or other informationsources, have few market outlets, and get low prices for their products. The socially owned farmsector has acted as both factor and product market for the family farm sector surrounding it. Sincemany of the agrokombinats contained large processing plants, they purchased certain productssuch as wheat, vegetables, and fruits from the family farms. The agrokombinats have alsoprovided family farms with necessary inputs and extension services. Many of these enterpriseshave greatly reduced their operations, however, because state subsidies have been cut and credithas been practically eliminated. Thus they are no longer able to provide the same level of servicesto the family farm sector, particularly at attractive prices or on convenient terms. In addition, theyare purchasing less of the family farm production and delaying payment for what they do buy.While these tendencies reflect movement toward a more efficient agricultural sector, thedevelopment of alternative forms of providing key services is important during the transition to aprivate economy.
The large enterprises also absorbed surplus labor from private farms in their areas. This importantsource of employment and wages for land-poor families will continue to shrink considerably withthe restructuring of the agrokombinats and other socially owned farms. While this reflectsdownsizing toward more efficient production strategies, in the immediate term it is leading toincreasing unemployment, which has driven many toward the already constrained small-scaleproduction for subsistence and perhaps longer-run employment.
Privatization of the agrokombinats and socially owned farms is now inevitable, but thegovernment is determined to maintain production levels in agriculture. The government hasassumed that the productivity of the large-scale farming enterprise is considerably greater thanthat of the small-scale, private farming sector due to economies of scale; it therefore insists onmaintaining the large fields that typify agrokombinat agricultural production. One exception is theland that was expropriated from private owners since the late 1940s (by one estimate, thisrepresents approximately 10 percent of the land used by socially owned enterprises). The previousowners or their heirs will be able to receive their land via a restitution process. Most of the landused by socially owned enterprises, however, has been under state ownership since before WorldWar II and has been rehabilitated by the state through irrigation and drainage projects.
Although the size, land tenure structure, and type of production diverge significantly across thesocial and private farm sectors, there has been and continues to be a symbiotic relationshipbetween the two sectors.3 The socially owned enterprises have acted as both factor and productmarkets for neighboring family farms. The transition period policy agenda, which is being defined
3 This project found, however, that the closeness of this relationship varied widely, with some privatefarmers having no dealings at all with the agrokombinats and others entering into formal marketingcontracts with them.
3
for the two sectors, arises out of the fact that the government has significantly modified itspolicies and priorities with regard to these two types of farming enterprise. State policiespreviously supported production of the socially owned farm sector, to a large extent neglectingthe private farm sector. Legislation and policies currently in development seek to makeagricultural production a market-driven activity, abandon agricultural production by the state, andencourage the family farm sector to increase its productivity. This policy shift, together withgeneral economic conditions and other macroeconomic policy changes, means that both theprivate and the socially owned farm enterprises are experiencing significant changes and facingnew challenges. This project’s objective was to conduct research whose results would enable thegovernment to develop informed land tenure policy for a future in which the two subsectors willconverge.
B. PROJECT ACTIVITIES
The Land Productivity Action Plan developed by the Ministry of Agriculture, with assistance fromthe team of the Land Markets Project, outlined five tasks to be completed over the six-monthterm of the project:
• Assess the appropriateness of legislation, regulations, and institutions affecting land tenureand land use.
• Document and assess the land-related constraints to increased productivity andprofitability of private farms.
• Document and assess the land-related constraints to increased productivity andprofitability of socially owned farms.
• Propose land policy adjustments that would promote increased productivity andprofitability of the agricultural sector.
• Identify financial and technical assistance to support the development of land markets thatpromote efficient, sustainable, and equitable increases in agricultural incomes.
Chapters 2, 3, and 4 report, respectively, the results of the first three tasks. Chapter 5 presents acomparative review of the land tenure and productivity results for both the private and the socialsector. This comparison forms a basis for policy dialogue. Chapter 6 concludes with a synopsis ofthe main observations made in earlier chapters and with a comprehensive discussion of the policyrecommendations that stem from our research.
1. Land-related constraints to increased productivity and profitability ofprivate farms
With the transition to a market economy, the government must address several issues with regardto the private sector. At present, the principal constraints to increased productivity andprofitability of private farming appear to be related to the great uncertainty about marketopportunities, which is aggravated by the current decline and transformation of the socially owned
4
enterprises and the inadequate development of alternative structures to provide services to theprivate farm sector.
As the government’s agricultural policy begins to confront these problems immediately faced bysmall farms, it may be constrained by land tenure realities. As noted, farms are small andfragmented, and farming is frequently a part-time occupation of the landowners. There appear tobe substantial constraints to the efficient use of land and labor resources due to excessivefragmentation; for example, excessive amounts of cultivable land are wasted on border markingand possible crop damage occurs due to incursion of tractors and persons accessing neighboringplots. The market for agricultural land, other than for seasonal leases, is not active and hashistorically contributed to fragmentation rather than consolidation.
In order to document the significance of these issues, a large sample of private farm householdswas selected in four of Macedonia’s agroclimatic regions: Western, Skopje-Kumanovo,Pelegonia, and Mediterranean. The Mediterranean region includes the communities of Tito Velas,Svetinikole, Stip, Kocani, Radovis, Vinica, Strumica, Valandovo, Gevgelia, Negotino, andKavadarci. Due to the climatic influence of the Mediterranean Sea, this region is a prime producerof horticultural crops. It also has substantial areas in which vineyards, wheat, and rice arecultivated as well as significant production of industrial grains such as sunflowers for oil. ThePelegonia region includes Bitola, Prilep, Demirhisar, and Kruchevo. It contains extensiveirrigation infrastructure and is the main area for wheat production in addition to industrial cropsincluding sugar beets, sunflowers, and tobacco. The Skopje-Kumanovo region, which includesonly Skopje and Kumanovo, is more arid and very windy. Its products include wheat, vineyards,fruits, and some tobacco. The Western region includes Tetovo, Gostivar, Debar, Kicevo, andMakedonski Brod. It is predominantly hilly and mountainous and produces orchard crops andlivestock (principally sheep). This area also differs from others in the predominance of farmers ofAlbanian ethnicity. The samples were drawn from these agroclimatic regions in a manner toinclude important agroeconomic and sociocultural variation. The Big Lakes and Eastern regionswere considered less likely to contain farms with the potential for increased productivity inresponse to policy reforms and were not included in the sample.4
Information was gathered from the selected households by way of formal questionnaire. Thequestionnaire enabled the team to collect information on:
• demographic composition of the farm household and patterns of migration;.• landholdings (size, number of parcels, land quality, parcel acquisition history);• land tenure (means of acquisition, disputes, membership in cooperatives, expropriation,
documentation, access, ownership rights);• land market (recent purchases, sales, leases, mortgages, etc.);• land use (cropping pattern, rotation, perennial, irrigation, grazing); and
4 The Eastern region includes Kriva Polanka, Kratovo, Probi Stip, Delcevo, and Berovo. It is also hilly andmountainous land, which produces orchard crops and livestock. Ethnically, the farmers are predominantlyMacedonian. Finally, the Big Lakes region incorporates Ohrid, Struga, and Resen and produces mainlyorchard crops, especially apples.
5
• farm management (production by crop, price expected and received, marketing arrangements,capital equipment, labor and other inputs, financing, maintenance).
Research was also conducted via detailed case studies in several villages, with the principal aim ofgaining deeper insight into land transactions costs and inheritance practices, and via a village-levelsurvey, with the aim of assessing local variations in infrastructure, market access, andsociodemographic features.
2. Land-related constraints to increased productivity and profitability ofsocially owned farms
The average size of the arable landholdings of the socially owned farms is about 1,000 hectares,with considerable dispersion between the largest and the smallest (<50 hectares to >5,000hectares). The current policy is to privatize the business operations of the agrokombinats andsocially owned agricultural companies yet to retain the agricultural land in state ownership; theland would be leased, according to as-yet-undetermined procedures, to private farmers orsuccessor enterprises of the agrokombinats. The government is reluctant to break up the largefields into smaller units suitable for cultivation by individual farmers because it fears loss ofeconomies of scale as well as repetition of the process of fragmentation, which has occurred in theprivate sector.
The project studied the land use, productivity, and profitability of farming on land currently underthe control of the agrokombinats. Field-level data were collected from a sample of ten farms andwere combined, as far as possible, with disaggregated input and output information in bothphysical and financial terms. In addition, the research team assembled documentation onworldwide experiences with leasing of publicly owned agricultural land.
3. Legislation, regulations, and institutions affecting land tenure andland use
Macedonia is in a period of considerable change in the legal and administrative environment of theagricultural sector. Several fundamental laws, such as those governing denationalization andprivatization, either have recently been enacted or are in advanced stages of legislative action.Others, such as the Land Use Law, are in the process of being drafted. Government agencies suchas the Ministry of Agriculture, whose past role was to manage the now-disappearing socialistproduction and marketing system, and the cadastral land registration system, which cannot nowhandle transactions such as mortgages and leases, will require significant adjustment in ordereffectively to support the market economy. The project undertook a comprehensive assessment ofthe legal and regulatory framework of the agricultural sector and assessed the capability ofgovernment institutions to both guide the transition and regulate the private sector activity in thefuture. Additionally, an assessment was made of the potential constraints to the success of landmarket development and land consolidation programs due to conflicts from overlappingtraditional rules and official regulations such as the impact of inheritance customs and theprocessing of claims of ex-owners to socially owned land.
6
II: THE INSTITUTIONAL FRAMEWORK FOR AGRICULTURAL LANDTENURE AND LAND USE IN THE REPUBLIC OF MACEDONIA
A. CONSTITUTIONAL FOUNDATION OF LAND POLICY
Legal protection of ownership rights and the freedom of market and enterprise are emphasized inthe Constitution of the Republic of Macedonia of 1991. These constitutional provisions arespecified in Article 30, which guarantees ownership rights and inheritance rights, and in Art. 55,which guarantees freedom of the market and entrepreneurship. The Constitution provides thatownership creates both rights and responsibilities; hence it should serve the well-being of both theindividual and the community. The Constitution embodies two ideals: it bans the violation ofprivate property rights, and it promotes the social functions of ownership. Accordingly, the rightsand liabilities of the owner depend on the nature of the object. In other words, there aredifferences in the rights and responsibilities of the owners of a pack of cigarettes, a parcel of land,or a form of enterprise. In addition, in guaranteeing ownership rights, the Constitution (Art. 30,paragraph 3) provides that no one can be deprived of his/her ownership rights and no one canrestrict the ownership rights of others, except in the case of statutorily defined public interest.Furthermore, in the case of expropriation or restriction of ownership rights due to public interest,the Constitution provides that compensation must be paid in an amount not less than the marketvalue of the object.
Article 55 of the Constitution guarantees freedom of the market and entrepreneurship byproviding equality of all legal entities on the market. Therefore, Macedonia should take measuresagainst monopolistic positions and monopolistic behaviors on the market. Freedom of the marketand of entrepreneurship can be restricted only in cases of defense of the republic, protection of theenvironment, and health of the people.
Land is a natural resource and a part of the public wealth of the Republic of Macedonia and, assuch, it enjoys special protection. This is stipulated in Art. 56, paragraph 1, of the Constitution of1991. The Constitution stipulates the manner and the conditions under which one can be granteduse rights on public assets (Art. 56, paragraph 3). In addition, Article 8 of the Constitutionprovides that one of the basic values of the constitutional system is the protection of nature.According to a provision in Art. 57, the republic must provide incentives for economicdevelopment, balanced spatial and regional development, and faster economic growth ofunderdeveloped regions.
B. LAND POLICY ACCORDING TO CURRENT LEGISLATION
The constitutional provision in Article 56, paragraph 3, which pertains to use rights of publicassets, is the basis for the regulation of land use. The Republic of Macedonia has retained thepractice of having two separate laws governing land use: (1) the Law on Construction Lands(there is currently a proposal for drafting a new version of this law), and (2) the Law on Land Use(drafting a new version of this law is also under way).
7
The Constitution provides the normative base for the transition from the former socialist societyinto a society based on private ownership and the market economy. However, there is a shortageof time to establish an adequate legal system. Therefore, by the Constitutional Law for theImplementation of the Constitution, the present Republic of Macedonia has adopted the overallset of regulations from the Socialist Republic of Macedonia, with the condition that formerlegislation may not contradict the provisions from the new constitution. In other words, lawspassed since 1945 are in effect until amended, modified, abolished, or ruled unconstitutional bythe Constitutional Court. Thus, during the “transition” there are difficulties in “reading” the oldlaws through the prism of the new constitution. This is especially true when it concerns sociallyowned land and, in particular, the constitutional provision on acquired rights to this land. Practicalapplication of this provision is necessary since transformation will introduce new forms of privatelandownership.
Currently, there are 22 laws within the broad area of agriculture, forestry, livestock breeding, andwatershed management that provide major or minor restrictions on ownership. However, if inprinciple these restrictions have a constitutional basis, each must be justified as having to do withthe protection of the public interest. Therefore, a detailed study of each of these laws is necessary.
A major disadvantage of the current legislation relating to land is that in many ways it isincompatible with the new constitution. Specifically, it contains restrictions on land use anddisposal of land that are not related to the protection of public interest, and it creates unequaltreatment of entities on the market according to type of ownership (i.e., it favors the social overthe private sector).
Private ownership in Macedonia was specifically regulated by the Law on Basic Legal OwnershipRelations of 1980, which contains a number of serious flaws despite the changes to it after 1990.This law also regulates derivative types of ownership, including common ownership and co-ownership, usufruct, real servitudes, and mortgages, which are important for agricultural land.
The Law on Obligations, adopted in 1978, regulates contracts for sale, lease, pledge, andexchange. This law does not regulate contract for gift. Two types of contract are regulated withthe Law on Succession, distribution of the holdings during life and obligation for lifetime support(intestate and testate inheritance), which refer specifically to agricultural land and could beotherwise regulated by the Law on Obligations. The Law on Succession does not need substantialmodification since it incorporates the constitutional provisions about the equality of citizens andsocial protection. The problems in practice are of a social nature due to difficulties in overcomingtradition and the lack of contemporary legal regulations.
In order to respect and to enable transfer of ownership rights on land and immovables, it isnecessary to identify the titleholder. Such identification is absolutely necessary, since the transferof the right is done not by legal action, but rather by transfer of tapija5 and registration in a publicland registry. For this reason, the issues of title registration and the land law are so significant inthe legal systems of other states. The tapija system was never put in practice thoroughly in theRepublic of Macedonia, and the system of unified registration introduced by the Law on Land 5 The tapija were originally issued by the Turkish and Serbian administrations and are still consideredpowerfully valid title documents proving ownership rights. New ownership documentation is recorded inthe local cadastral offices. The cadastral offices issue title documents, called posedoven list.
8
Survey, Cadastre, and Registration of Immovables of 1986, with amendments of 1991, is not yetimplemented throughout the country. The question of registration is a separate topic that needs tobe addressed further within this report.
The regulation of ownership rights on immovables, mortgage, neighbor’s rights, lease, sale,exchange, gift, and inheritance and the registration of immovables with new laws or in a civil codeof the Republic of Macedonia will play key roles in determining the new legislative direction foragricultural land. It is important to note that the Ministry of Justice has a project that will resolvethe codifying of civil law by means of two options: by codifying all property rights, or bytemporary compliance with adjustments and changes in the current legislation. A civil code in anyform and the decisions incorporated in it will have serious implications for land tenure and landuse policies.
Among those laws that have provisions indirectly related to agricultural land is the Law onCooperatives. This law brought forth the importance of the cooperatives and cooperativeownership for the Macedonian society and was intended to restore faith in this institution, whichis haunted by prior experience with essentially nonvoluntary implementation. Cooperativeinstitutions successfully operate in many aspects of the economy in the West, particularly inagriculture and credit. However, the regulations (Articles 32, 36, and 37 of the Law onCooperatives) on the restitution of the cooperative property, which were intended to start thetransformation in the agricultural sector, were not put in practice. There were estimates that onthe basis of these provisions the cooperatives would claim 60,000 hectares of land and around300 buildings. These regulations were not enforced by any other law (as was done in the Republicof Slovenia); on the other hand, they were not repealed by any other law. Compared to the otherformer owners, the cooperatives were placed in an inferior position by the Law on Transformationof Enterprises with Social Capital, since only natural persons were able to make claims, not legalpersons, such as compared to the other former owners, cooperatives.
An example to illustrate the difficulties of “reading” the current laws through the prism of the newconstitution is the Law on Land Use of 1986 with amendments of 1991. Article 44 imposedrestrictions on the transfer of agricultural land (potentially slowing down the process of sale forthree years) but was amended by Art. 6 of the Law on Amendments of the Law on Protection andUse of Agricultural Land of 1991, which reduced the restrictions regarding to whom land couldbe offered for sale. Specifically, instead of offering the land to social entities (promoting socialownership), the owner was obliged to offer it to citizens or legal persons from the cadastral areawhere the land was located. In discussions in 1993, the Constitutional Court decided thatParagraph 1 of Art. 6 creates inequalities among citizens from other cadastral municipalities whoown neighboring parcels, because it restricts the right of certain citizens to buy land which is onthe market only because they reside in another cadastral municipality. Another provision in Art.43 of the same law states that “upon inheritance, sale, or gift of agricultural land, the size of theparcels in the cadastral areas cannot be decreased by physical division.” In legal theory, it isbelieved that, though restrictive, this provision is beneficial to the community since it preventsfurther fragmentation.
Other relevant laws that were enacted after 1991 (in addition to those previously mentionedamendments to old laws) include the Law on Expropriation, the Law on Concessions, some of theprovisions of the Law on Family, and particularly the Law on Transformation of Enterprises andCooperatives That Manage Socially Owned Land. The issues of land policy and property rights on
9
land is a separate topic according to the draft Law on Denationalization, which is currently underparliamentary discussion.
C. HISTORICAL BACKGROUND OF LAND TENURE AND LAND USE POLICY
Usufruct as a state related to land has legal significance. It concerns a situation of control andactual power over the land. Usufruct in some legal systems is the right of use, which is not thecase in the Macedonian legal system. The legal significance of usufruct is seen in the fact that itcan be transformed into ownership, under certain conditions, because it enjoys legal protectiontogether with ownership rights even in cases when it is not legally acquired. Whenever one talksabout land rights, usufruct is present. The most basic and most important legal relation related toland is the ownership right. According to legislation in Macedonia, ownership is a subjectivecomplex of rights. It comprises three basic rights: use rights (jus utendi), right on collecting fruits(jus fruendi), and right of disposal (jus abutendi). All of these authorities (rights) are performedby the owner (the titleholder), who also has usufruct on the object of ownership. Civil lawsystems typically rely on Roman law, where usufruct and ownership are predominant. Legalregulation of the land in the Republic of Macedonia also relies on this system.
1. Transformation of usufruct into ownership
Until the First Balkan War in 1912, Macedonia was under the Ottoman Empire and propertyrights were defined by the timar-spahija system. According to this system, all the land wasconsidered to be state owned, that is, property of the Sultan. Some spahijas (or feudal lords) hadrights over land, which they leased for cultivation to farmers. In that manner, the farmer wouldacquire use rights (tesafur) over the given land. The farmer was required to pay a tax for his landrights (tapu resmi or tapu, for short). A certificate recording land rights, called tapu sendi (nowcalled tapija), was then issued to any farmer who had paid this tax. These land rights weretransferable, and the transfer of a tesafur title was done by mutual agreement of the two parties, alegal action inter vivos. Sometimes the original document (tapija) was not exchanged; the rightsexchanged were simply agreed upon. In all cases, the tax (tapu) was paid again, irrespective ofwhether the transfer of title was done with or without compensation.
In the second half of the nineteenth century, a reform commenced by which usufruct propertyrights were to be transformed into actual proprietary rights. Two laws are important with regardto this reform: Law on Tapu of 1860, and Emlach Law of 1874. According to these laws, no onewas to have tesafur over state land or rights over immovables (mulk) without tapija. The tapijawas used to prove the tesafur rights and the establishment of a mortgage. The Ottoman tapijasystem was a register organized by name of landowners; detail about any piece of land subject to atapija could be located only by searching the register by owner name and, hence, obtainingreference to other information.
The tax, tapu, paid for obtaining the tapija was registered in the defter. The name of thetitleholder and the tapija itself were registered in Istanbul’s registry (defterhana). This process ofregistration had no importance for the legal validity of the issued tapija. Despite being registeredin the defterhana, tapija were valid only with the Sultan’s monogram and the seal of Istanbul’s
10
defterhana. In other words, tapija did not have value if it were not written in the defters. TheTurkish defters served only as fiscal cadastre books. The defters were public books in which thedata for the immovables and the names of the titleholders were registered. Such defters arecurrently kept in the Archives of Macedonia and are occasionally published.
The decline of the Ottoman Empire interrupted the process of transformation of usufruct rightsinto actual landownership. This process continued in Macedonia and was completed in thosecountries that divided Macedonia among themselves after the Balkan Wars (Serbia, Bulgaria, andGreece). In the period between the Balkan Wars and post-World War I, the regulatory basis forthe transformation of landownership within the territory of Macedonia was the Serbian Civil Codeof 1844, which created a tapija-intabulacija system (inscription in the property registry). A tapijawas issued for landownership rights, and the transfer of these rights was made with the transfer ofthe tapija. The mortgage and the deed were established by the intabulacija. The tapija system inthe Kingdom of Yugoslavia was established with Law on Tapu of 1929, and its corrected versionpassed in 1931. According to these two laws, the tapija is a document to prove the right oflandownership, and the transfer of that right is made by transfer of the tapija. The issuing of thetapija and the transfer of tapija are registered in the Book of Tapija.
The acceptance of the Serbian tapija system has raised some question about the validity of theTurkish tapija, since these documents were still in use for a certain period of time after the fall ofthe Turkish Empire. These Turkish titles still emerge in disputes. Therefore, some people thinkthat the Turkish tapija should have the same authority as those issued by the Serbian andYugoslav authorities. However, from the viewpoint of contemporary Macedonian legal theory,such opinions are unacceptable, especially since they have arisen after the enactment of the firstlaw on issuing tapija in 1929. In the post-war period (after 1945), new ownership documentswere issued and have been (and still are) recorded in the local cadastral offices. These documents,called posedoven lists, are found in cadastral offices. The posedoven list contains the name, thesize, and the location of the parcel. The cadastral office maintains parcel maps as well.
2. Historical aspects of the development of landownership inMacedonia
During the period of the National Liberation Movement (NOB), from 1941 to 1945, regulationswere issued in the Republic of Macedonia that referred to the ownership of land and immovables(Decision for Confiscation of the People’s Enemies’ and Enemy Collaborators’ Estates).However, there were indications of land reform even during the war. The authorities wereengaged in taking land of people killed during the war, collaborators, church estates, and ownersof large estates. At that point, such taking stemmed primarily from the question of providing foodfor the soldiers and was not an issue of progressive land tenure policy. In 1945, land reform andcolonization became the main objective of Yugoslav Federal Government. The governmentadopted the principal directives from the KPJ (Yugoslav Communist Party ) for the distribution ofestates to the villagers with little or no land. After the war (World War II), the issue was raisedwhether the land taken under the land reform should be nationalized first and distributedafterward, or distributed to the villagers as privately owned land. The final decision was to give allland to the villagers as privately owned land. The main reason for this was the villagers’ desire forland and the need to satisfy the impoverished rural population, which was expecting private
11
ownership over the land. Two main principles governed the land reform: that land belongs tothose who cultivate it, and that the land would be given, free of charge, as private propertytogether with the movable and immovable inventories.
The Law on Land Reform and Colonization was enacted in 1945 by the DFJ’s (DemocraticFederal Yugoslavia) Temporary People’s Assembly. The law imposed expropriation of all largeestates, larger than 45 hectares, or 25–35 hectares of arable land (for grains, meadows, orchards,and vineyards) that were leased out or farmed with hired labor. Expropriation covered all landowned by banks, enterprises, and share-holding companies (cooperative banks and savingsassociations, etc.). The land over 10 hectares belonging to the church and other institutions wasalso confiscated and, in some cases concerning religious buildings of specific historicalimportance, land over 30 hectares of arable land or forests. Rural and nonrural holdings above thespecified maximum were expropriated. For rural agricultural families, the maximum specified was20–35 hectares, depending on the location, the number of household members, and the types ofcrops that were grown. For the holdings of part-time farmers6 that were being leased out and didnot fall into the category of large holdings, the maximum size of the holding was between 3 and 5hectares. In this instance, there was an exception to the maxim that “the land belongs to thosewho cultivate it,” since part-time farmers were allowed to keep a small amount of land.
The republic’s legislation also provided that farmers in households comprised of severalimmediate families in the regions where such families are known as extended families (extendedfamily or “zadruga”), as well as the farmers who live in the regions where the land has lowerquality and is cultivated extensively, can have collective ownership rights over the arable land witha total amount of 15 hectares. While the Constitution of 1974 guaranteed ownership rights(private ownership) to the full-time farmers (stating that the land will not be nationalized andforcefully collectivized), part-time farmers had restricted ownership rights under specifiedconditions that were subject to change, meaning that the right could in due time be abolished.
Additionally, a certain land maximum was stipulated for the religious communities. The religiouscommunity, religious institution, and charitable foundations as civil persons could have land rightsto 10 hectares of agricultural land. According to Art. 88 of the Law on Land Reform andColonization, this maximum could be increased to 30 hectares if it concerned religiouscommunities or institutions (church or monastery) of a greater importance or historicalsignificance (which was determined for each individual case).
According to the data from the Agricultural Committee of (FNRJ) Federal People’s Republic ofYugoslavia, of 23 March 1946, 37,886 hectares of the total amount of land incorporated in theLand Reform of (NRM) People’s Republic of Macedonia were arable and 39,952 were fallow;also included were 16,000 hectares of forestland and 21,000 hectares of improved pastures.
In 1946, legislation for the development of agricultural cooperatives7 (“village workingcooperatives”) similar to the Russian kolkhoz was adopted and such cooperatives were created by
6 In the Macedonian context, a “part-time” farming household is any household in which one or moremembers is engaged in off-farm work.7 The first cooperative was established in Macedonia in 1892. Co-ops were formed along conventional linesdealing with honey, handicrafts, etc. No true co-ops were formed after 1941.
12
villagers pooling their land and livestock. In 1949, purposeful acceleration of the process ofestablishment of agricultural cooperatives occurred. This reflected the state’s perception of a needto increase the supply of agricultural products and of the need to push forward the adjustment ofthe village to the new socialist environment—thus, state control over the land would become thedominant modus in agriculture just as in industry. The idea was that conditions for planning in theeconomy could be created and technological backwardness could be overcome only by enlargingthe socialist sector of agricultural production. However, in practice the manner of establishmentof the agricultural cooperatives abandoned the principle of benevolence, and participation becameessentially nonvoluntary.
The number of cooperatives increased in 1949 and stabilized by the beginning of the 1950s. Then,expansion of the socialist sector occurred by means of incorporating more households as membersof existing cooperatives. By 1952, the cooperatives possessed 364,220 hectares, of which225,705 were arable. The cooperatives provided the villagers with food and cash in exchange forworking the land. However, even at their “peak,” the cooperatives included less than 15% of thetotal number of agricultural households and held only 12% of the arable land. Only the very smallprivate and land-poor farmers enrolled while the owners of the larger estates resisted. Privatefarms remained dominant (holding 80% of the land) even during the period of the most severepressure for collectivization. The Resolution from the 6th KPJ Congress led to a turning point andthe tendency was then directed toward enhancing production through increased productivity andmodernization of the production process.
In 1953, the concept of the village workers’ cooperatives was abandoned and a new concept ofsocially owned farms (land and enterprise) was introduced. Most cooperatives were disintegratedand individual families were given back their land in holdings up to 10 hectares (a new, lower limiton holdings of private individuals). The Law on Public8 Land and Distribution of Land toWorkers’ Agricultural Organizations was enacted in the spring of 1953. This law regulated thenew changes in proprietary relations and set the land maximum of privately owned land at 10hectares (this is considered as the second land reform). According to this law, if the members ofthe cooperatives had arable land over 10 hectares, upon leaving the cooperative they would begiven only that part, which together with the house plot (the part of land that was not pooled inthe cooperative) that totaled 10 hectares. In this manner, social or public land was “created,” andland-poor families were given additional land. Public land was allocated for the establishment oflarge, socially owned agricultural enterprises (some of the remaining cooperatives were alsomerged for this purpose). Most of the land thus allocated, however, consists of reclaimed land(marginal land made arable by the state through irrigation or by draining swampland). Villagepastureland was also given to the socially owned enterprises (SOE). Social ownership came tomean that all members of an SOE were jointly assigned permanent usufruct rights to theenterprise and its immovables while society at large maintained ownership rights. Documentationof such social ownership in the name of the enterprise was registered with a posedoven list. Ascarriers of high productivity, the SOE were expected to achieve cooperation with the remaining,small-scale private farms and, in that manner, to secure adequate agricultural production for thecountry.
8 “Public”: property of common concern (in the context of the previous system).
13
Recent legislation implies that social ownership over agricultural land has been transformed tostate ownership for the purpose of allowing subsequent denationalization of land and privatizationof the agricultural SOE. It is said that some of the posedoven lists which recorded socialownership have already been modified such that the landholdings of the socially owned enterprisesare the property of the Republic of Macedonia, which assigns use rights to the enterprises. Anunknown amount of the land, which was, in one form or another, part of the agrarian reformprocess just described, will be subject now to a process of denationalization such that formerowners who have legal documentation may make claims for their land or for compensation forthat land. As privatization of the SOE occurs, the state intends to maintain lands unclaimed in theprocess of denationalization under state ownership and lease them to users.
The Constitution of the Republic of Macedonia of 1963 rendered the landholding maximum in theprivate sector as a constitutional provision, whereas the limits and the conditions for determininglandownership of part-time farmers, as well as the ownership of other types of land, were left tothe legislators. The amendments to the Constitution of 1971 introduced a novelty in relation withthe landholding maximum in the hilly and mountainous areas. Considering the low fertility in theseareas as opposed to the flat areas, they determined a higher maximum for the former, meaningthat the legislature began to abandon the policy of giving strict restraints to private ownership andstarted to adjust regulations to the actual circumstances in the country.
The ownership rights to agricultural land in this period were regulated by the Basic Law on LandUse (Official Gazette of SFRJ, no. 26/65). The Law on Transfer of Land and Buildings of 1965enabled free transfer among legal persons, although ownership rights over land were restrictedwith the right of first purchase and the right of first lease to agricultural land in favor of theagricultural enterprise that had land in the district. Certain authority regarding land rights wasceded to the municipal governments; it could, for example, prescribe the maximum rental rate forvarious land uses.
According to the regulations of the Constitution of 1974, grain plots, vegetable beds, orchards,meadows, vineyards, and all lands apt for cultivation are considered as agricultural land.Titleholders of proprietary rights (private ownership) over agricultural land could be farmers andnonfarmers (individuals) as well as legal persons. Farmers were guaranteed private ownershiprights over up to 10 hectares of arable land per household. It could be determined by law whetherthe amount of arable land in the hilly and mountainous regions over which the farmers hadownership rights would be limited to 10 hectares per household. Conditions under which thefarmers can have private ownership over other types of land, as well as those under which othercitizens can have ownership rights over agricultural and other types of land, were also regulatedby law.
In case a person acquired ownership rights to land over the maximum area stipulated by theConstitution and the laws, by means of a separate procedure, the excess land was transferred andadjoined to socially owned land. The treatment differed if the land was acquired by inheritance orcontract. If the land was acquired by inheritance and if, together with the land that the owneralready had, was over the given landholding maximum, the person was allowed, within the givenmaximum, to chose the land that he was going to keep and which land was going to be transferredinto social ownership (Art. 15 of the Law on Transfer of Land and Buildings and from the Law onTransfer of Real Estate of RM). The owner of land that was acquired by inheritance and was
14
transferred into social ownership as excess land was compensated according to a rate stated in thegiven Law on Expropriation from that period.
If land was acquired by legal act (e.g., contract), then the owners had no right to choose whichland, up to the given maximum, they was going to keep. The municipal authorities in charge ofthe land tenure issues decided that this land (over the determined maximum) became sociallyowned land. In that case the owners were not compensated. Under legal theory of that time, therewere opinions that the owners who acquired land over the given maximum should be allowed toalienate the land, that is, to sell it within a given period; if they did not accomplish that, the excessland was to be transferred into social ownership without compensation. The owners of the landhad the right to use it and dispose of it within the legal regulations. However, according to Art.85 of the Constitution of 1974, the land was labeled as a good of public interest and as such wasprotected and used under conditions and in a manner that was stipulated by law; thus the ownerswere obliged to execute their rights in their own as well as in the social interest. Therefore, theBasic Provisions from the Constitution of 1974 stipulated, that by having land rights, the farmerswere obliged to use the land and improve the private farm in their own interest and in the interestof the socialist community. Due to its importance for the economy, the free disposition of the landused by the farmers was restricted by the emphasis on the social interest expressed through therights and obligations imposed on the owners for executing their land rights. Article 86, paragraph1, of the Constitution of 1974 stated that “land, forests, waters, springs and mining resources haveto be used under legal, regulated conditions that provide for their optimal use and other socialinterests.” The legislation from that period, after the 1974 Constitution, contains a series ofregulations that determine land rights.
After the land reform and the liquidation of rural estates over 10 hectares in size, there was nointerference with the private ownership of the farmers. Nevertheless, the community wasinterested in the types of land use, because the land was viewed as a public commodity whichsupports the life of all of its members. The first regulations relating to the use of agricultural landwere published in 1945. After the Law on Land Reform and Colonization, of 23 August 1945, anOrder for Obligatory Cultivation and Seeding of the land was issued; it applied to state-controlledland as well as private. The owners of the land that was covered by this land reform had tocultivate the land as before. If they failed to do so, the seeding and cultivation were to be done bythe People’s Board. The purpose of this measure was to plant all available areas to preventendangering the food security of the population.
Restriction of private ownership, i.e., restriction of the free disposal of real estate, was containedin the Law for Cultivation of Barren Land of 25 February 1957, Art. 1. From this law, there wasan implied obligation for all owners or users of arable land to cultivate their land in at least themanner and on the same level as the norm in the given area. People’s Boards in the municipalitieswere to provide for the implementation of this obligation. The arable land that was not cultivatedwithin a year from the last harvest, unless fallow, was temporarily taken from the owners for aperiod of 1 to 3 years and was given for use to the cooperatives and, if that was not possible, thento the private farmers.
The obligation of the owners of agricultural land for positive action was clearly defined in theBasic Law on Land Use of 2 June 1965 (amended text of the same Law of 1959). Since theissuance of this law, there are claims that all the land, whether in private or social ownership, hasto be cultivated in accordance with the conditions of production that are most suitable for the
15
given natural conditions in the economy. For the lands of the agricultural enterprises, it wasstressed that to enable optimal land use cultivation should be based on the most modern andcontemporary principles. Municipal assemblies were authorized to stipulate a minimum ofagrotechnical measures or reclamation measures that needed to be applied when cultivating theland. These measures were applicable to all owners and users of agricultural land. The privateowners had to use the land for agricultural production; they were not allowed to voluntarilychange the purpose of the land use, for example, to designate it as construction land in order toavoid the obligation to cultivate.
Because it was often the case that the land was used by another person and not the ownersthemselves, the term “user” was often applied (referring to renters, etc.) in the regulations fromthis period. The legislature was not interested in who the owners of the land were or if the landwas privately or socially owned. It was interested in an optimal cultivation of the land. Due tothis, in order to avoid the sanctions that were stipulated in the law persons who were not capableof cultivating their land could transfer their use rights to a cooperative or agricultural enterprise orto other private persons. The lessees were thereby obliged to cultivate the land under the sameconditions under which they were cultivating their own land; the lessees, not the owners (thelessors), were responsible for the cultivation of the land that they leased.
Each enterprise managing a water system (reservoir) in an area made a basic plan for land use forthe whole district. All owners were obliged to use their land according to the basic plan. Therewas a possibility of issuing new agrotechnical and forestry measures for the erosive areas,imposing a temporary or permanent ban on plowing of meadows and pasturelands and convertingthem into fields with one-season crops, and requiring an obligatory change of the crop patternwith one-season and perennial crops. If the owners themselves were not in a position to makeagrotechnical improvements due to lack of technical equipment, they could enter into anagreement with an agricultural enterprise that would ensure the application of these measures. Incase they did not succeed in making this agreement, the conditions for application ofagrotechnical measures were determined by a committee of the municipal assembly. The basicplan covered all land in the area of the water system, irrespective of whether the land wasprivately or socially owned. All users were obliged to use the land in accordance with the basicplan or they were placed under forceful management, from 5 to 10 years. Because the watersystems required large investments, all users of these systems were obliged to pay compensationfor use.
In the period between 1974 and 1988, in addition to the question of the landholding maximum,the issue of the minimum parcel size was important because of fragmentation of the land andcorresponding constraints to increased farm productivity. This attitude was expressed in the Lawon Protection and Use of Agricultural Land of 1986, according to which the cadastral parcelscould not be physically divided by inheritance, sale, or gift (Art. 43, paragraph 1). This law clearlystipulated that “land of the first to fourth class cannot be used for other purposes than agriculturalones, unless otherwise determined in the spatial plan, that is, the urban plan” (Art. 13). The lawimposed high compensation fees for permanent change of land use (Art. 180 refers to retainingthe land for agricultural use). The law authorized the municipality to take steps toward optimalland use, to put barren and fallow land into use, to identify land use, and to distinguish betweendifferent types of land according to its use (Art. 22). It specifically emphasized that themunicipalities determine the land for perennials (Art. 24). It is apparent that these regulations on
16
the part of the municipalities restrict the execution of land rights. However, these are actions thatfall into the category of special legal requirements for commodities of public interest, amongwhich is agricultural land. Hence, that law, too, included the option for taking the land and givingit to other persons (physical persons) for use in case of failure to cultivate (Art. 29, paragraph 3).
One of the land rights of the owner is the right to lease. The law permits leasing within the “socialsector” and between sectors. The owner of socially owned land in the area of a municipality (Art.40, paragraph 4) has the right to lease land that is not privately owned. With respect to the leaseright, the law allowed acquisition over the landholding maximum. Hence, if a person would leaseland in the hilly and mountainous regions, there was no limit as to size, the only requirement beingcultivation of the land. If the land was in flat areas, the land maximum was extended by 20% (Art.41). Despite the fact that this regulation was not entirely constitutional and legal, the legislaturehoped to induce cultivation of agricultural land.
The right to dispose of agricultural land was also limited by the right of purchase by the socialsector. In this sense, the Law on Protection and Land Use made it difficult to transfer privatelyowned land. Apart from the former obligatory offer for sale of land to the social enterprise in thedistrict or in the municipality where the land was located, the law considered the municipalityitself to have the right to purchase during the period of the first year. If the municipality refused,then the land was offered to the social enterprise (social legal person) of the neighboring district.If the neighboring socially owned enterprise likewise refused, then, after three years, the ownerhad the right to sell the land to a fellow farmer, either a physical or a legal person. This three-yearperiod caused difficulties in the transfer of land and inconveniences in the cultivation of the land.The provision has been canceled with the decisions of the Constitutional Court of RM of 1994and 1995.
In order to protect social assets, the Law on Protection and Use of Agricultural Land of 1986provided for the seller of agricultural land to pay, to the social funds, the profit that was equal tothe increased value of the land as a result of the social assets (Art. 44).
The amendments of 1988, which increased the land maximum to 30 hectares per household, wereinadequate, for all other quantitative restrictions for the private ownership had been repealed.
D. ANALYSIS OF CURRENT POLICY IN THE AGRICULTURAL SECTOR
Considering the constitutional and legal framework just discussed, in this section we talk aboutdifferent types of ownership of agricultural land that exist in the Republic of Macedonia. Theseinclude derivative types of ownership (co-ownership and common ownership) as well as basiclegal relations that occur in conjunction with agricultural land, that is, disposal of agricultural land(sale, transactions, gift, lease, mortgage, etc.).
1. Private ownership
Every natural person and certain legal persons can be holders of the right of private ownership.Natural persons are citizens of the Republic whose property rights as well as basic economicrights are guaranteed by the Constitution of the Republic of Macedonia (Art. 30, paragraph 1).
17
Natural persons can be landowners, farmers, and part-time farmers. Legal persons can beenterprises with assets in private ownership, including the following forms: stock-holdingcompanies, limited liability companies, partnership companies and general partnerships, stores,agricultural enterprises, unions, associations of citizens, parties, religious affiliations andinstitutions, private educational institutions, and others. According to the Constitution, foreignnatural and legal persons can be holders of private ownership of land but will be regulated by aspecial law.
2. Derivative types of ownership
The derivative types of ownership which appear in the legislation of the Republic of Macedoniaare co-ownership and common ownership. Co-ownership appears when several entities have therights to a specific parcel of agricultural land. If the co-owned parts are not marked or specified, itis assumed that they are equal. Co-ownership can be simple and mixed. In co-ownership, eachholder is entitled to use and dispose of land together with the other co-owners proportionally totheir shares without violating the rights of the other co-owners. Each individual owner has suchrights; still, co-ownership requires that co-owners always take into account the interests of theother co-owners in the association when exercising land rights. The co-owners have the land incommon ownership and they can agree in a certain period of time to transfer the usufruct of theland from one to another owner. The co-owners exercise their use rights proportionally to theirshares; therefore, the using of the land by each owner should not be a disadvantage to the otherco-owners. Each co-owner can exercise the right of disposal without previous agreement with theother co-owners. This right implies the possibility of selling the share of one co-owner, except forthe part of real and personal servitude (use), by putting a pledge or mortgage on the land. Whenthe co-owner exercises the right of disposal of his share, the other co-owners have the right ofpriority purchase, a special characteristic of the use rights that the co-owners exercise jointly,unless otherwise stipulated by an agreement or the decision of the majority of co-owners or of acourt. The co-owners would use the rights in the same manner; otherwise, if maintenance of theland is necessary and one of the co-owners violates his use rights, the court will preside. On theother hand, for a change of use, a lease, or a mortgage (Art. 15, paragraph 4, of the Law on BasicLegal Ownership Relation), it is necessary to have agreement of all co-owners. The right of landmanagement can be entrusted to one or several co-owners or to another entity. The co-ownersbear the costs for exercising use rights and the right of disposal and other pledges proportionallyto their shares. The right of disposal is expressed in the right of each co-owner to require divisionof the land if it is in agreement with the law. The co-owner may withdraw the right to require adivision of the land and the agreement in that sense is invalid with the possibility to agree uponnot dividing the land in a certain period of time. The court decides in case the co-owners do notagree contractually on the division of the land. The court decides whether the division will bemade by sale if the physical division of the land cannot take place. The other co-owners guaranteethe material and legal properties of the land that they own in common within the value of theirshares for the part that is granted to one of the co-owner after the division.
18
3. Common property
Common ownership occurs when several entities have property rights on undivided agriculturalland, whose shares are not determined. It differs from the co-ownership by the fact that theundivided land does not belong to separate entities by parts, but it belongs to all partners. Hence,the property right is on the whole land and partners are unable to dispose of their parts (shares).
There are several types of common ownership: (1) common ownership of a family cooperative(zadruga); (2) common ownership by spouses; (3) common ownership by heirs; and (4)ownership of residences without the land underneath. Common ownership, as well as co-ownership, can be simple and mixed with the same meaning. Common ownership of a familycooperative (zadruga) exists upon all the property of co-owners who are blood related. The co-owners have no ownership over other objects outside the family. That type of ownership on theland still exists in some villages (especially among the ethnic Albanian families).
Common ownership by spouses exists on the object that they acquired within the marital period.That object (the land) is included in the property of the spouses (their common property—Art.205 of the Law on Families of the Republic of Macedonia of 1992). It should be pointed out thatthere is also a common ownership of divorced spouses over the object that they have acquiredduring their marital period. The rights of common ownership are executed by the spouses jointlyand by agreement; one spouse cannot execute the right of disposal of a common propertyindependently. The execution of these rights can be entrusted to one of the spouses. Suchagreement cannot be broken unless it violates the rights of the other spouse. After divorce, eitherthe former spouses can agree upon division of the common object or the court will decide. Thecourt, taking in consideration the fact that the object can be divided in equal parts, will make thedecision about determining of the parts of the object. One of the spouses can claim a bigger partof the common object if only he/she can prove that his/her contribution in the share of the objectis larger than that of the other spouse. If a common object is used to perform a handicraft,activity, or was personally used by one of the spouses, it will belong to him/her. In someparticular cases, the object will be divided. The spouse can acquire rights over such an objectunder the condition that he/she is properly compensated by the other spouse or under anagreement to exchange that object for another. If, upon the division of the common object, it isdetermined that one of the spouses receives a substantially smaller part, the court will determine,upon the request of one of the spouses, that part is compensated in money.
E. OTHER LEGAL RELATIONS ON AGRICULTURAL LAND
1. Servitude
The right of servitude is divided in two basic groups: real servitude and personal servitude. Realservitude derives from a legal relationship in which the partners are owners of two immovableobjects. Personal servitude is always related to the person of the titleholder. The right of servitudeis different from the neighboring rights and the contract for lease or any similar contract.
19
A real servitude is the right of the owner of an immovable property to perform certain activitieson the immovable property of another owner (servant property) or to request from the owner ofservant property to restrain from activities that he/she is otherwise entitled to perform on his/herown immovable property (Art. 42 paragraph in the Law on Basic Ownership Relations).
From the referenced legal regulations, it seems that servitude embodies a legal relation betweenimmovables, where one owner has ownership rights on a dominant immovable whereas the othertitleholder has ownership rights on a subservient immovable. The Law on Basic OwnershipRelations (Art. 49, paragraph 2) recognizes the division of the temporary and the occasional realservitude. The temporary servitude is established for a certain period of time.
Republic laws on public roads, water, forests, and others, especially the Law on Expropriation,incorporate a series of servitudes, such as the right of installation of water pipes, sewage systems,electricity, telephone and other lines, which are not defined, but can be commonly called publicutility servitudes. The Law on Basic Ownership Relations abolishes certain real servitudes andretains others such as the right of crossing the land 10 meters from the fishing area for sport’sfishermen (Art. 30 from the Law on Fisheries of the Republic of Macedonia).
The content of the real servitude depends on the type of servitude. What all of these servitudeshave in common is the right of use of a subservient immovable to a certain extent and in a certainmanner. The owner of that servitude holds this right. In case it is necessary to use a device orundertake certain activity which involves costs, the titleholder of the dominant object will coverthose costs. If the use of the device or the undertaken activity serves the interest of owner of thesubservient property , the costs will be covered proportionally by both owners of the dominantand subservient property. (Art. 50, paragraph 2 and 3, Law on Basic Ownership Relations).
Personal servitude is the right of one entity (possessor of the fruits) to entirely use the object ofthe owner (other person’s property). A personal servitude differs from a real servitude in the factthat there is only one object—which can be movable or immovable. It is related to the personalityof the owner and can last until his death. The personal servitude can appear in two types:collection of fruits, and use.
The collection of the fruits as a use right on another person’s property is similar to use rights onone’s own property; therefore, the possessor of the fruits is exercising his/her rights in the sameway as an owner. The possessor of the fruits is obliged to exercise his/her right on the otherperson’s property by certain civil standards—as a good owner (landlord), that is ,to protect therights of the owner from violation on the part of the possessor. The possessor of the fruits has theright to collect the fruits of the object and by separating the fruits from the object he/she becomestheir owner. The normal costs are the expense of the possessor, whereas the extra costs, forinstance, the investment for maintenance of the object, are the expense of the owner of the object.In case the possessor uses the object contrary to given standards, the owner can request the courtto deprive the possessor of the object and entrust it to a third person, with the costs ofmaintenance to be covered by the possessor. The possessor can transfer his/her rights to anotherentity by legal action.
20
2. Rights of pledge and mortgage
The right of mortgage is a subjective real right, which entitles the owner to dispose of anotherperson’s property by which his/her loan has been secured. There are several types of rights ofpledge. According to the nature of the collateral, the right of pledge can be on movable orimmovable things, in other words, manual pledge or mortgage. The Law on Basic OwnershipRelations (Art. 61) and the Law on Obligations (Arts. 989–996) regulate the right of pledge onthe loan. Due to the problems with registration, transformation, and the process ofdenationalization in the Republic of Macedonia there were few possibilities to place land undermortgage for obtaining certain credits.
3. Rights of neighbor
A neighbor’s right is a legal restriction on the right of use of two contiguous immovables. Theserestrictions can be mutual or one sided. Due to this, the neighbor’s right is a heterogeneous rightthat mainly appears in three forms: (1) a tree on the border or close to the borders of twoimmovable properties; (2) markers on borders, and (3) operations on one’s land. The tree thatgrows on the border of two contiguous parcels belongs to the owners of that land and each ownercan pick the fruits from the branches that fall on his/her side or cut the branches that are sproutingon his/her side. Cutting of the tree can be done only by the decision of the owner of the tree.Markers and border signs (fences, ditches, and the like) are shared equally between the owners ofcontiguous parcels and both owners are obliged to maintain the marker and the border sign eventhough these may belong to the other of them.
While exercising the right of use on his/her immovable property, the owner is obliged to refrainfrom certain activities which will cause a disadvantage to the use of the other immovables(emission of smoke, odors, heat, quake, noise, outflow of sewage waters, etc.).
Neighbor rights differ from contracts for lease or similar legal obligations in the fact that thelatter’s effectiveness is toward the contractual parties of these legal obligations whereas theneighbor’s right is effective toward all entities of civil law.
4. Disposal of agricultural land
The transfer of agricultural land held in private ownership is also regulated with the Law on LandUse from 1986. But we must mention that the provisions of that law were and are not respectedin practice, including those provisions which are in accordance with the new Constitution and thepolicy for consolidation of land (which we documented with a survey of the lawyers in certainareas of the Republic of Macedonia). The restriction of the transfer of land and its registration arethe high taxes paid involving the transfer of agricultural land. This tax has now been reduced to3% of the market value of the immovable. The lawyers are recording an increase in the rate oftransfers (sales, gift) in recent years due to the repeal of the provisions for compulsory offer andobligatory purchase and the reduction in the taxes, which contributed to regulation of the landtransactions which were not previously registered.
21
The leasing of agricultural land is regulated with a Law on Land Use and by the generalprovisions for lease from the Law on Obligations. All rights and liabilities of the lessor aretransferred to the lessee (e.g., liabilities on reclamation systems, land cultivation, and so on).Agricultural enterprises that manage socially owned land usually sign contracts for cooperationwith the private farmers instead of entering a classical contract on lease. In this way, the limits onthe land maximum for the private owners, which were valid during the lease, were avoided; someof the ban was incorporated in other laws which permitted leasing of socially owned land.Agricultural enterprises have tended to lease land from the private farmers without a contractualbasis.
5. Inheritance
Inheritance in the Republic of Macedonia is regulated by the Law on Succession of 1973. Aperson can inherit on the basis of law and will (this law contains a provision that property withoutheirs becomes socially owned property). The law provides for the legal heirs and the successorchain. The owner can dispose of the inheritance intestate. The part of the inheritance that belongsto the closest heirs is one-half of the part that each heir will receive according to the legal way ofsuccession, irrespective of the fact that some of the heirs may give up their part of the inheritance.The means of disposal of agricultural land before death are the contract for lifetime support andthe contract for distribution of property during life (testate and intestate inheritance are regulatedby provisions 120–126 and provisions 109–119 of the Law on Succession, respectively).
The Ministry of Justice has proposed enactment of a new Law on Succession. The novelties in thenew law will respect the fundamental values of the Constitution, that is, equality of the citizens,equality of the spouses, and equality between legitimate and illegitimate children. According tothis draft law, inheritance will be legal. Gifts received 90 days before the person was deceased arenot accounted in the total value of the inheritance. With respect to inheritance rights of foreignpersons, they have the same right as Macedonian citizens under the condition that the principle ofreciprocity applies to their state.
F. SOCIAL OWNERSHIP AND ITS TRANSFORMATION
Prior to 1993, “social-ownership” was used to label property which belonged to everyone and yetto no one in particular. The state, as representative of its citizenry, assigned usufruct rights overits property to specific groups of persons organized as socially owned enterprises. Theseenterprises were expected to use the land to contribute to the development and protection of thesociety at large. In the Macedonian constitutions (under Yugoslavia) of 1946, 1963, and 1974,land was treated variously. According to the Constitution of 1946, “the land belongs to those thatcultivate it” (Art. 18, paragraph 1), whereas “all Earth’s mine resources, including the mineralwaters, spas and natural resources are common people’s property” (Art. 13, paragraph 2, ofNRM’s Constitution, People’s Republic of Macedonia). The Constitution of the SocialisticRepublic of Macedonia determined that “the land is considered as a good of common concern,”and therefore that each landed property had to be used in compliance with the law regulatingconditions for rational land use and other common concerns, including mining and other naturalresources, and that land is considered as held under social ownership. Similarly, according to the
22
Constitution of 1974, “land and other natural resources are goods of common concern,” havespecial protection, and are used under conditions governed by the law.
Constitutionally and legally, social ownership has been defined in the provisions of theConstitution of SFRJ, that is, SRM of 1974, together with the Law on Associated Labor of 1976,the Constitutional amendments of the above in 1988, and the Law on Enterprises of 1988 and itsamendments in 1989. Hence, it can be concluded that these provisions define the most currentlegal conception of social ownership. Accordingly, it is provided that the means of production,other means of associated labor, the products of associated labor, the income generated byassociated labor, social consumer needs, natural resources, and public property are sociallyowned. Furthermore, it is provided that no one can acquire ownership rights over social means ofproduction in a basic organization of associated labor or on the assets of self-managingcommunities of interest and other socially owned enterprises.
According to these laws, it is provided that agricultural and construction land, forests and forestland, natural resources and public property cannot be alienated from social ownership unlessotherwise stipulated by law.
According to the amendments to the Constitution of SFRJ and SRM of 1988(9-37), which referto property rights, a line between commercial and social businesses in the sector of the socialownership was drawn. Hence, workers in the associated labor can exchange products on themarket or by free exchange of labor. Therefore, the assessment of the results of workers’ labor inthe organization of associated labor that is engaged in economic activity are achieved on the basisof market forces, whereas for the workers of the same organizations that are engaged in socialactivities (e.g., education, science, culture, health, social care, and others) results are acquired byfree exchange of labor. Recognition of market forces as a constitutional solution is a newqualitative change in the current legal physiognomy of the social ownership. Considering the factthat social ownership represents the system of socioeconomic relations where market forces,among other things, play a substantial role in disposing with social assets, in this way socialownership has been drawn closer to private ownership rights; and in the area of economy, there isa tendency of abandoning the nonproprietary concept of social ownership and the appearance ofseveral types of social ownership by building pluralistic concepts about its legal nature, taking intoconsideration its social functions.
The Law on Enterprises abandons the concept of organizations of associated labor whererelations among workers were established on the basis of the operation of social assets, in otherwords, associating labor and self-management (self-managing enterprise). Instead of this typeenterprise, a new enterprise type was introduced as an entity of a market economy, that is, theenterprise as a basic form of organization and production of goods or services for the market(market enterprise). This law introduces some formerly abandoned legal categories like socialcapital, property, and rights of the enterprise. The principle that labor is the basis of management,in other words, that labor and capital are equal bases for acquiring rights in the sense ofmanagement and acquisition, is abandoned. The citizens can invest private capital into theenterprise on the basis of which they can acquire a certain compensation not according to theirlabor share but according to their proprietary monopoly (share-holding ownership). Theenterprise as a legal entity is founded on the basis of property. The property of the enterprise, likewith any other legal person, is a guarantee for its participation in the turnover of goods (trade). Itseems that the process of extinction of social ownership, that is, its transformation to a
23
proprietary type of ownership, began with the aforementioned constitutional amendments and theLaw on Enterprises. During the process of transformation of enterprises with social capital of1993, privatization should take place, that is, transformation of social ownership into privateshould be completed, within the next seven years, or five years, depending on the extent to whichthe assets (capital) of the large, medium, or a small enterprise are currently socially owned.
However, the above-mentioned law does not provide for transformation, that is, privatization ofcertain types of enterprise that have assets in social ownership (total of 388 enterprises). Theseare the enterprises that manage the waters, forests, land, and other public property, residential andbusiness spaces, the national lottery, and other enterprises that have monopolistic position. Thebanks, financial organizations, insurance companies, and the co-operatives will not betransformed, that is, privatized. Around 50% of the total business assets of the enterprises withsocially owned assets are concentrated in these enterprises. The rights and liabilities of social legalentities in the transfer of social assets are provided in Art. 196 of the Law on Enterprises of 1988,with changes of 1989, whereas the right to use social asset (which is part of the real subjectiveright and is restricted by obligations of public character) is part 6 of the famous Law onAssociated Labor (Arts. 113–183).
The right to dispose of social assets which represents alienation of these assets by the holder ofthat right (state, private, co-operative ownership), their transfer to another social legal person,and their exchange is also restricted by public and legal obligations. Therefore, the social means ofproduction and other means of common expenditure cannot be alienated without compensation.
The agricultural and construction land, forests and forest land could not be alienated as they wereprotected social assets. Hence, social ownership as a legal relation contains characteristics thatmake it differ from the other types of ownership. The land in social ownership could not bealienated except in cases stipulated by law. Such cases were provided by three laws. The Law onTransfer of Land and Buildings permits land transfer between social legal entities; this transferdoes not change anything since the land is still in social ownership. There were exceptions in twocases: (a) exchange with privately owned land (Art. 18), and (b) sale, when the land is transferredinto private ownership, with the obligation that the money acquired from the transaction by theagricultural enterprise was used for purchase of another tract of land (Law on Land Transfer, Art.30). In both cases the amount of land under social ownership did not decrease. Land exchangewas also provided for in the cases of consolidation and reallocation of holdings (arondacija).Also, the Law on Expropriation stipulated that socially owned agricultural land can be given bythe agricultural enterprise (which is the user of the expropriation) as compensation forexpropriated privately owned land. Although the agricultural land in social ownership wastransferred, this transfer was controlled and conditional.
The social sector covers a relatively small part of the land, around 15–20%. Yet, considering thefacts that (1) the sector controlling the socially owned land has a share of nearly 50% in the totalmarketing of production and is the locus of the concentration of capital and of labor force, (2) byvirtue of well-known reasons it had a monopolistic position on the market, and (3) it has thecharacteristic of underutilization of resources, it is clear that the problem of transformation ofsuch land will entail substantial changes.
The privatization of the social sector in agriculture faces two major problems. First, due to thelarge size of the social enterprises it is impossible to transform them to a more rational size in a
24
quick fashion, without immense changes in the employment of human resources and a potentialloss of use of high technology capital that is available in some of the AIK. Second, the increasedmobility of resources will lead to an increase of the offer of land on the limited and still notinstitutionalized market, which, speaking in real terms, will lead to a serious depreciation of thevalue of the land. Third, there is still strong political resistance to change. An approach which isbased on gradation seems likely to be the only possible alternative in this case.
Currently, concepts of ownership are once again being redefined in Macedonia as the formersocialist state is transformed toward a market economy. The constitution now does not evenrecognize the term social ownership as a legitimate property rights category. The question thushas arisen as to whom the former “social” property belongs—the well-defined group of formermember-workers (management and salaried workers) who dedicated their careers to stewardshipof social property, sometimes reinvesting earnings, or the state via authority vested in a particularministry. In 1993, the Government of Macedonia opted for the latter in the case of agriculturalland, as is implied in the Law on Transformation of Enterprises with Socially Owned Capitalinterpreted together with the Constitution of the Republic of Macedonia. According to this law,privatization represents a change of the status of the enterprise, so that the enterprise with socialcapital becomes an enterprise with private capital. The transformation is made by the sale of thesocial capital or of all the assets of the enterprise. Transformation under this law exemptedenterprises that operate for a public interest and have a status of a public enterprise or publicservice. Specifically relevant is Art. 6, paragraph 1, which stipulates that immovable assets(construction) on agricultural land would be exempted from the total estimate of the value of theenterprise. Art. 6, paragraph 2, provides that these enterprises would continue to use and manageconstruction and agricultural land until the issuance of a valid decision of denationalization.
The Law for the Transformation of Enterprises which Manage Agricultural Land makes explicitthe decision to hold such land in state ownership. This law was enacted in April 1996, andprovides for the transformation of the agricultural landholding enterprises and cooperativesthrough transformation into stock companies and limited liability companies. All land used bythese enterprises, however, is defined as state-owned and conditions for obtaining contracts forlease of the land, by current users, are delineated in the text of this law.
Thus, rights over the land held by “socially owned enterprises” (which are now being privatized)are being transferred to the Republic of Macedonia and are to be administered9 by the Ministry ofAgriculture under terms favorable to the former users, i.e., state ownership. The state views thischoice as correct even in instances in which private mechanisms such as purchase of land fromprivate owners is being induced, either directly or indirectly, by state policy and financialassistance for the well-being of the society. State ownership is also justified from the perspectivethat agricultural land is still defined as a good of public interest10 which the state must
9 The Ministry of Agriculture and Water Resources will manage the leasing of state-owned agriculturalland and will regulate its use as per a new land use law which is currently being drafted.10 Goods of public interest are all natural resources, the flora and fauna, goods of common use, and objectsof cultural and historical importance governed by law (Article 56, paragraph 1, of the Constitution of theRepublic of Macedonia). The same situation is true of land which was categorized as “construction land”explicit prior to 1991, whether constructed or not.
25
constitutionally protect. Finally, the strategy of nationalizing “socially owned” land is viewed bymany as protecting the rights of the former owners whose land was expropriated forcefully untilthe enactment of the Law on Denationalization. Until a law on state ownership (currently in draft)is enacted, there will be discrepancies in the regulation of the rights of state ownership, mostimportantly, whether it can ever be sold to private entities, i.e., privatized.
G. AGRICULTURAL LAND AND THE LAW ON DENATIONALIZATION
Article 21 of the draft Law on Denationalization regulates the restitution of agricultural land tothe former owners. Paragraph 1 of this article provides that agricultural land, pastures,uncultivated village land, and forests which are considered a natural scarcity will not be restituted.It appears that the restitution of scarce resources should not be disputable but the state shouldprovide a special system of using the land. The basic decision (Art. 21) incorporates protection ofthe interests of extant large agribusiness complexes by suggesting that if a parcel is to berestituted as a part of the property of a former owner, that owner can be compensated by a parcelof the same quality of land and same quantity of yields in another location.
An alternative solution for the treatment of the land in denationalization is that the parcel wouldstay in the block of current use with the former owner becoming a co-owner with sharedeconomic benefit. Yet, the former owner would be deprived of the right of disposal. The formerowner would not be able to make transactions with his/her parcel; instead the state wouldmaintain that right. Under a transfer, the former owner would have to be compensated for anydamages to his/her interests. Another problem which will be regulated by the law is the co-ownership relation between the private person and the state.
Another alternative found in Art. 21 is more restrictive and does not comply with theconstitutional provision for protection of private ownership, providing that land not be restitutedif it is part of a large block with a minimum of 20 hectares of constructed infrastructure(permanent plantings, seedlings, explicit and buildings). In this case, the former owners willreceive indemnity with another parcel or acquisition of rights of shares and stocks in the enterprisemanaging the land for the value of the land that is claimed under denationalization. The statecannot afford to compensate the damages in money.
H. COOPERATIVE OWNERSHIP: PAST AND FUTURE
Cooperative ownership, as a legal relationship, has the same meaning as the other forms ofownership. Bearers of cooperative ownership rights are from all types of groups: agricultural,handicraft, residential, youth and other cooperatives, enterprises in cooperative ownership, andcooperative associations. Property subject to cooperative ownership can be grouped from anytype of property except for objects under state ownership. Bearers of the rights of cooperativeownership over movable and immovable objects serve the common interest of the cooperativemembers, that is, the common interest of the cooperative organizations (Art. 11 on the Law ofBasic Ownership Relations).
26
Cooperative ownership consists of the rights which are present in other types of ownership: topossess, to use, to dispose of, and to manage the property which is the object of the right ofcooperative ownership, in which each member of the cooperative on the basis of his share in theassets of the cooperative participates. This share entitles the cooperative member to one vote inthe decision of the meetings of the assembly as the highest collective body comprising allcooperative members.
It should be pointed out that the cooperative members or the members of the cooperativeenterprise are entitled to share the profit according to criteria determined by themselves.
These rights are based on the principle of majority voting in the collective bodies of thecooperatives; the cooperative organizations are directed toward fulfilling the common interest ofcooperative members. However, this could be against the interest of the individual cooperativemembers. In that case, the cooperative members can renounce their membership in thecooperative or cooperative organization and can claim restitution of the share in money, whichwill lead to decreasing of the assets of the cooperative. It should be emphasized that in the legalsystem in the former Republic of Macedonia, cooperative ownership existed, but it has graduallyvanished in practice as one of the types of ownership.
With the amendments in the Constitution of SFRJ and SRM of 1974, which were adopted in1988, the cooperative movement was again organized on the classical principles which are wellknown in the world. Membership was regulated as was members’ position in the cooperatives.The Constitution determines the objective of grouping the farmers and the main means of doingso. Also, the distribution of income of the cooperative was regulated as was the right of thecooperative members in case of leaving the cooperative; this was not a case of constitutionalregulation before the constitutional changes.
In regulating the issue of ownership of land, means of production, and other means which thefarmers contributed to the cooperatives, there were some novelties. The possibility of retainingthe right of ownership on all the objects which were contributed to the cooperative was the basicrule, but it was not possible to transfer these means to joint or social ownership. With theprevious constitutional provision (1974), the farmers could keep their ownership right to theobjects they contributed to the cooperatives or could determine a means of getting them backaccording to the contract or the statute of the cooperative.
There is no special law for cooperatives in the Republic of Macedonia. In legal terms, thecooperatives are regulated with the federal Law on Cooperatives of 1990, which reaffirmed all thecooperative principles and the cooperative movement. This law was adopted in RM without anychanges. According to this law, there is no requirement that the government approve theestablishment of a cooperative. By registering, a cooperative gains legal standing. Three businessentities are needed for establishing a cooperative (it is not noted whether they have to be physical,legal, foreign, or domestic entities or whether it is necessary for them to be fully capable ofbusiness management). The cooperative founding act is the basic and constitutive act of thecooperative. Management of the cooperative is based on the principle of one cooperative member,one vote. But it is possible for the cooperative members to regulate the cooperative in a differentway. There should be a managing board and a supervisory board in the cooperative and also be abusiness board for guidance. It is determined that the holding of the cooperative consists ofobjects, assets, and rights. Cooperative ownership consists of the stakes/share of the cooperative
27
members, assets obtained as a result of its operation, and assets obtained by other means, whilethe land and other socially owned assets can be transferred to the cooperative as assets in socialownership.
According to this law, the property of the cooperative can be in the following forms of ownership:(1) private ownership of the cooperative member; (2) common ownership of the cooperativemembers; (3) cooperative ownership; and (4) social ownership. According to Art. 20, it is notedthat with the dissolution of the cooperative, the assets in cooperative ownership, after payment ofliabilities to the creditors, are distributed among the cooperative members and are transferred intoprivate ownership of the cooperative members unless it is otherwise noted in the cooperativestatute. Because the statute is enacted by cooperative members, they are the only subjects thatdecide about the cooperative ownership after the dissolution of the cooperative.
With the Federal Law for Cooperatives enacted in 1990 , there was a possibility that the property,which on the basis of the provisions from 1953 and 1954 was transferred into social ownershipand was transferred to other users without compensation (Art. 37), should be restituted to thelegitimate holders. It was deemed that a holding acquired by the formation of a cooperative after1 July 1953, that was transferred to the other users without compensation, on the bases of thedocumented claims, would be given back to the cooperatives, i.e., to their legal successors in amanner and under terms established with the law. Also in this Law it is noted that the business andhousing property which were in the cooperative associations’ ownership from 1 July 1953, until21 December 1965, and were transferred to the other users without compensation, on the basis ofa documented claim, would be given back to the associations in a manner and under termsdetermined within the law.
But the enforcement of the provisions, which were a type of denationalization or giving back thecooperative holding to the cooperatives and cooperatives’ associations, was not implemented(unlike some other republics, like Serbia and Slovenia, where these provisions were realized withrepublic laws). According to the laws discussed above, today in the Republic of Macedonia thereare three types of ownership in cooperatives: private ownership, cooperative ownership, andsocial ownership. These are the only types of ownership that can undergo the process oftransformation.
There are problems in several areas: (1) how and whether cooperative and private capital can beexactly identified and differentiated from socially owned capital in order that something that isalready privately owned is not to be transformed; (2) how to provide a clear relation of the newlaw with the provisions of the Law for Cooperatives, which implied a possibility for giving backthe cooperative holdings on the basis of denationalization, especially when it is taken intoconsideration that, with the Law for Denationalization, cooperatives are not considered asclaimants; and (3) how to find a way to identify the real cooperatives in RM and to differentiatethem from the enterprises that use the legal form of cooperatives but are not organized oncooperative principles. The priority task is for all of these issues to be solved with a modern lawfor cooperatives which, above all, will have to take into consideration the need for flexibility whenit comes to cooperative organization and principles and the needs of the potential cooperativemembers.
During the 15th Congress of the International Cooperative Association, held in London in 1934,the following authentic principles were determined: (1) democratic management; (2) free entry and
28
exit of the cooperative based on voluntary principles; (3) distribution of profit according to share of thecooperative member in the cooperative; (4) limited liability; (5) principle of neutrality; (6) payment in cash;and (7) cooperative education.
The legal nature of cooperative ownership in the countries with developed market economies isindisputable—it is private ownership. In ex-socialist countries, there were some disputes about thelegal nature of this form of ownership. There are two groups of opinion. In the first group,cooperative ownership is seen as a lower form of state ownership with a tendency to make ittotally equal with the state holding of common concern (USSR and Bulgaria). In the secondgroup, cooperative ownership is considered as a form of collective (group) private ownershipwhose titleholder is the cooperative as a legal entity (Czechoslovakia).
At the World Congress of Cooperative Members, held in Brussels in 1987, the expressed attitudewas that because of the character of cooperative ownership, cooperative membership is neither apart of the capitalist economic structure nor a part of the state social structure in socialistcountries. In the scientific theories of the western countries, the attitudes toward the cooperativemovement are toward “the third sector of the capitalist economy as an alternative of the privateand state public sector.”
What are the bases of cooperative ownership in the Republic of Macedonia according to thecurrent legal framework?
1. Cooperative ownership is a democratic basis for managing the cooperative which is characterized withequal relations among cooperative members and cooperative management regardless of their share,race, and social background.
2. The titleholder of the cooperative ownership is the cooperative as a legal entity and the personnelshould comprise cooperative members only.
3. The object of the cooperative ownership comprises the shares of the cooperative members and otherassets acquired by the functioning of the cooperative.
4. The content of the cooperative ownership comprises not only the classical use and disposal rights butalso the liabilities, that is, the assets in cooperative ownership should be renewed, increased, protected,and orderly used, which are not liabilities regulated with a law, but coming out of the nature of a viableentity working with assets in private ownership.
5. Cooperative ownership is a basis for the proprietary independence of the cooperative and itsindependent liabilities toward third persons.
6. Cooperative ownership in its legal nature is a group form of a private ownership.
If the attitude that cooperative ownership in its legal nature is a form of private ownership isaccepted, the difficulties about the methodological process for its transformation into anindividual form of a private ownership should be less problematic than those in relation to theprivatization of the state and social ownership.
In the Republic of Macedonia, we are facing the above-mentioned difficulty that, although thecooperatives transformed their statutes according to the Law in 1990, they did not transform theirownership according to this law, for the republican law for enforcement of the statutes in terms ofrestoring the cooperative holdings to the cooperative members has not been enacted.
29
The second difficulty during the transformation will be the fact that after the enactment of theLaw in 1990, many of the cooperatives enumerated only their members on their cooperative lists.So the transformation might raise the issue of cooperative employees: whether they will stay orwill be considered as “employees” and conclude employment contracts, or to what extent theirnumber will be reduced.
No one can talk about the privatization of cooperatives in which the capital assets are in privateownership, or rather joint ownership. Privatization of the cooperatives can only be achieved if thecooperatives operate with assets which are in social ownership. We can talk about cooperativeownership only conditionally because it is a collective form of private ownership in its legal naturewhose titleholder is the cooperative as a legal entity and a form of collectivity which belongs onlyand exclusively to the cooperative members; in other words “privatization” in this case is aprocedure that leads toward transferring collective organized titleholder into individual bearers ofprivate ownership without any changes in its content, which can be achieved withindividualization of its bearer. Also, if traditional cooperative principles are not taken intoconsideration, if we bear in mind the fact that many of the cooperatives in Macedonia are notcooperatives in the real meaning of the word, and if the employees are considered as cooperativemembers, it will be normal if some of the cooperatives convert into limited liability companies,especially when that possibility is given in the Law of 1996.
I. REALLOCATION OF HOLDINGS (ARONDACIJA)
Arondacija is type of land consolidation (agricultural land, forests, forestry land) for the purposeof achieving optimal land use, mechanizing the process of production, carrying out reclamationand erosion prevention actions, viable production units, planting of perennials, planting of foresttrees, and afforestation. This was a typical agropolitical measure that served to create largerblocks of arable land (previously in social ownership). The decision for arondacija is issued by acommittee appointed by one or several municipal assemblies. The owner (either full-time or part-time farmer) of the land that was consolidated by means of arondacija received compensation inmoney or in land with the same cadastral class, crop, and possibly same location by the user. Incase a different land class is given, larger parcels were given to adjust fairly. Part-time farmersreceived compensation in money according to the regulations in power (also for expropriatedland). The mortgages would lose their legal validity and were erased from the registries, with theoption for entering the erased pledges on the land that was given in compensation.
Arondacija is a combination of expropriation and appropriation. The user submits a proposal forarondacija, and municipal bodies were to carry out the arondacija. Since 1946 this measure hasbeen regulated by numerous acts during different periods, such as federal and sublegalenactments: Law on Land Reform and Colonization of 1945, Basic Law on Cooperatives of 1946,Regulation for Arondacija of State Goods of Common Concern of 1946, Statute for Arondacijaof 1947, Law on Expropriation of 1947, Basic Law on Cooperatives 1949, Statute for Arondacijaof Agricultural Products and Village Cooperatives of 1951, and Law on Land Use of 1959. As ameans of acquiring state (social) ownership over land, arondacija can still be considered as aforceful measure, together with other forms of consolidation. The land acquired by means of thesemeasures will not be subject to nationalization, but it still will be considered, since there are cases
30
without actual agreement where compensation was carried out according to the regulations forexpropriation, but where equitable compensation was not introduced.
J. REGISTRATION OF OWNERSHIP OF AGRICULTURAL LAND
Concerning the transfer of ownership rights on immovable to other persons, it is necessary toidentify the titleholder. This identification is absolutely necessary, since the transfer of the right isnot done by court action. It is necessary to transfer the tapija or posedoven list and register thetransaction in the public registry. Until 1986, the registration of the immovables was done by themeans of the tapija system. The tapija system in Yugoslavia was established with the Law onTapija of 1931. According to this law tapija is the document which proves the ownership rightson land, and the transfer of that right is a transfer of tapija. The mortgage and the servitudes arebased on the intabulacija system. The issuance of the tapija and the transfer of the tapija areregistered in the book of tapija. Intabulacija is recorded in the book of intabulacija. Since 1986,the Law on Land Survey, Cadastre and Registration of the Rights on Immovables has been inforce. By this law the registration of the rights on immovables is made in the land registry book,or cadastre. Currently, the establishment of certain cadastral municipalities in the Republic ofMacedonia is being carried out. According to the new law, the rights on immovables (ownership,mortgage, and servitude) will be acquired by registration in the cadastre. The law was subject toamendments in 1991 (Off. Gazette of the Republic of Macedonia, no. 17/91). The law is in itsinitial implementation for the land survey and registration.
The regulations by which the land (and other immovables) was transformed into social ownershipcharacteristically always insisted on registering the changes in the ownership, on issuance oftapija, and sometimes against the legal regulations of the tapija law. All these regulations provideofficial obligations of the courts and authorities as well as the responsibilities of the titleholders onsocially owned movables for official registration of the transactions and the rights on the sociallyowned land. However, in practice this obligation has been neglected.
Before the enactment of the new regulations in 1947, when tapijas were issued, registration wasalso done on the following kinds of property: state property of FNRJ, property of NRM, propertyof peoples’ committees, state property, state institutions, state business enterprises, and propertyof the former self-governing bodies (Art. 5 from the Act on Registration of the Ownership Righton the State-Owned Immovable Property). Since 1947, subenactments have been adopted, thefirst one dating from 1965: Act on Registration of the Ownership Right on the State-OwnedImmovable Property (Off. Gazette of FNRJ, no. 58/47); instructions for the manner of registrationof ownership rights on buildings constructed on public (social) property in the land registry books(Off. Gazette of FNRJ, no. 44/51), instruction for land registries of the nationalized buildings andconstruction land (Off. Gazette of SFRJ, no. 49/59), and Law on Registration on Immovables inSocial Ownership (Off. Gazette of SFRJ, no. 12/65).
The Law of 1965 as well as other regulations provide registration only for ownership and theregistration of the use rights is only considered as a note (registration of a lower rank whichrecords relevant circumstances). According to the law under which the land was registered, theland registry books for the socially owned land are managed by the municipal assembly, accordingto Art. 14 of the Law. Paragraph 2 of the quoted provision provides the registration of the use
31
rights for the agricultural enterprise. The registration of the social ownership is made at therequest of the authorities in charge of land tenure issues, whereas the registration of use rights ismade on request of the agricultural enterprise.
K. CONCLUSION
The above discussion of the legal framework as it affects landownership and land use wasconducted to present the institutional context in which the entire agricultural sector operates. Ahistorical review of the origin of laws and regulations which influence landownership and land useis crucial to determine the scope and direction of potential reforms. During the current transitiontoward a market economy in the Republic of Macedonia, the legal and regulatory framework hasbeen under critical review and revision. As Macedonia is in the midst of the daunting task oflegislative and regulatory reform, many ambiguities, confusions, and potential contradictions exist.The complexities of transforming social ownership, for example, involve issues that require muchtime and consideration for any reform to be beneficial to the common concern. This review haspresented the background from which current reforms can be interpreted and assessed. Such areview needs to continue as the process of legislative and regulatory reform progresses. Oursuggestions concerning the legislative reform agenda are made in Chapter 6.
Note: This chapter was originally written in Macedonian by Jadranka Dabovic Anastasovska. Ithas been translated by our team of translators and edited by the LTC team. The complexity ofthe web of laws and of legal language combined to make the task of generating this English-language version rather daunting. We hope that this effort, albeit imperfect, will serve thoseexpatriates involved in technical assistance to Macedonia as a base for untangling the legal webin which Macedonian agriculture is enmeshed.
32
III: THE PRIVATE FARM ECONOMY
A. BACKGROUND11
In comparison to the other regions of former Federal Yugoslav Republic, individual farms wereestablished much later in the Republic of Macedonia. Feudal relations were dominant in theterritory of today’s Republic of Macedonia until 1912, in addition to the existence of freepeasants, chivchian, who occupied about 30% of the total number of the villages, most of themgravitating to rivers and plains and the mountains villages which consisted of chivchian and feudalholdings. As an illustration, Skopje’s valley consisted of 622 villages; 222 of them were with freepeasants, and the others with chivchii or mixed villages. The free peasants had smallholdings ofland property. Seventy-five percent of all free peasants owned less than 5 hectares of land.
In 1931 an obvious concentration of the number of farms with smallholdings of land was evident,with a corresponding concentration of land within farms with larger holdings. For example, 22%of the total number of farms in the category with holdings smaller than 2 hectares owned only2.6% of the total land area. Farms with holdings over 50 hectares comprised only 0.2% of thetotal number of farms and they owned about 9% of the total land area. In comparison to the otherrepublics of former Yugoslavia, the Republic of Macedonia had the relatively largest number ofsmall farms. For the period of 1931 to 1941 there are no statistical data on the farm sizedistribution, so the dynamics of the landholding structure cannot be followed. Meanwhile, it wasprojected (P. Markovic 1970, p. 109) that the tendency of land fragmentation was continuing; i.e.,the number of smallholding farms increased to 27% .
11 Chapter 2 contains a thorough historical background to the development of the contemporary farmeconomy in Macedonia. In this section, more detail is presented regarding the changing agrarian structureand patterns of land fragmentation.
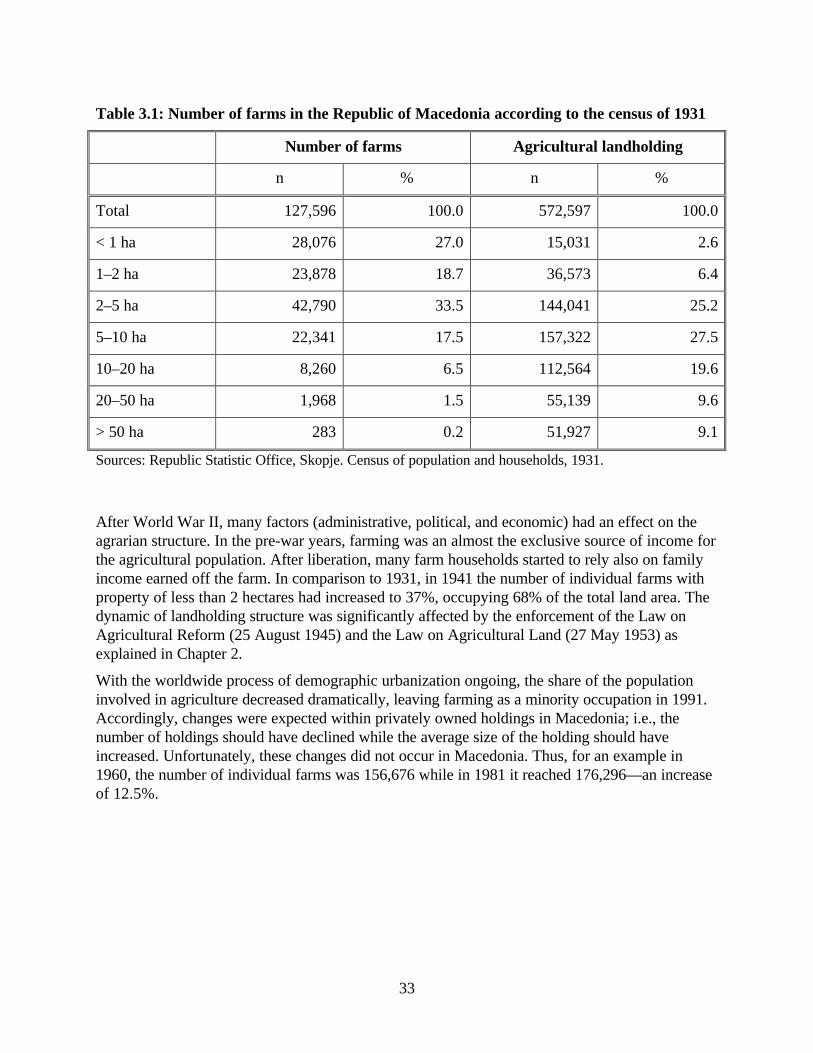
33
Table 3.1: Number of farms in the Republic of Macedonia according to the census of 1931
Number of farms Agricultural landholding
n % n %
Total 127,596 100.0 572,597 100.0
< 1 ha 28,076 27.0 15,031 2.6
1–2 ha 23,878 18.7 36,573 6.4
2–5 ha 42,790 33.5 144,041 25.2
5–10 ha 22,341 17.5 157,322 27.5
10–20 ha 8,260 6.5 112,564 19.6
20–50 ha 1,968 1.5 55,139 9.6
> 50 ha 283 0.2 51,927 9.1
Sources: Republic Statistic Office, Skopje. Census of population and households, 1931.
After World War II, many factors (administrative, political, and economic) had an effect on theagrarian structure. In the pre-war years, farming was an almost the exclusive source of income forthe agricultural population. After liberation, many farm households started to rely also on familyincome earned off the farm. In comparison to 1931, in 1941 the number of individual farms withproperty of less than 2 hectares had increased to 37%, occupying 68% of the total land area. Thedynamic of landholding structure was significantly affected by the enforcement of the Law onAgricultural Reform (25 August 1945) and the Law on Agricultural Land (27 May 1953) asexplained in Chapter 2.
With the worldwide process of demographic urbanization ongoing, the share of the populationinvolved in agriculture decreased dramatically, leaving farming as a minority occupation in 1991.Accordingly, changes were expected within privately owned holdings in Macedonia; i.e., thenumber of holdings should have declined while the average size of the holding should haveincreased. Unfortunately, these changes did not occur in Macedonia. Thus, for an example in1960, the number of individual farms was 156,676 while in 1981 it reached 176,296—an increaseof 12.5%.
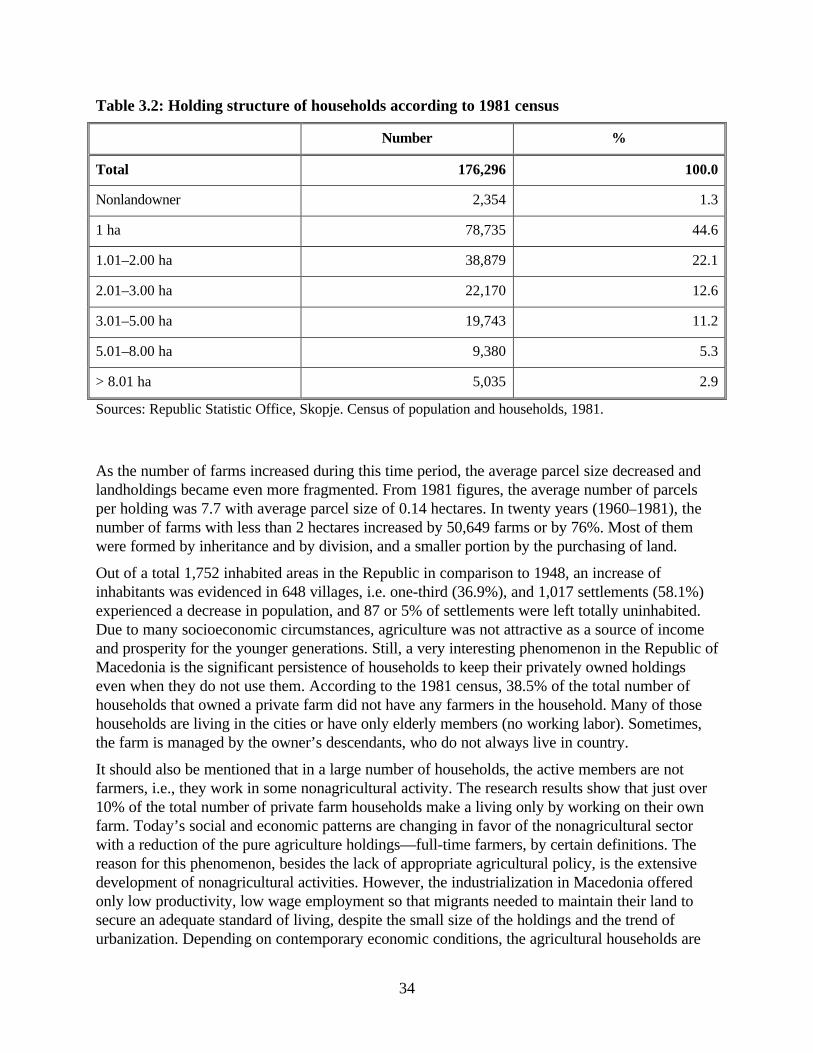
34
Table 3.2: Holding structure of households according to 1981 census
Number %
Total 176,296 100.0
Nonlandowner 2,354 1.3
1 ha 78,735 44.6
1.01–2.00 ha 38,879 22.1
2.01–3.00 ha 22,170 12.6
3.01–5.00 ha 19,743 11.2
5.01–8.00 ha 9,380 5.3
> 8.01 ha 5,035 2.9
Sources: Republic Statistic Office, Skopje. Census of population and households, 1981.
As the number of farms increased during this time period, the average parcel size decreased andlandholdings became even more fragmented. From 1981 figures, the average number of parcelsper holding was 7.7 with average parcel size of 0.14 hectares. In twenty years (1960–1981), thenumber of farms with less than 2 hectares increased by 50,649 farms or by 76%. Most of themwere formed by inheritance and by division, and a smaller portion by the purchasing of land.
Out of a total 1,752 inhabited areas in the Republic in comparison to 1948, an increase ofinhabitants was evidenced in 648 villages, i.e. one-third (36.9%), and 1,017 settlements (58.1%)experienced a decrease in population, and 87 or 5% of settlements were left totally uninhabited.Due to many socioeconomic circumstances, agriculture was not attractive as a source of incomeand prosperity for the younger generations. Still, a very interesting phenomenon in the Republic ofMacedonia is the significant persistence of households to keep their privately owned holdingseven when they do not use them. According to the 1981 census, 38.5% of the total number ofhouseholds that owned a private farm did not have any farmers in the household. Many of thosehouseholds are living in the cities or have only elderly members (no working labor). Sometimes,the farm is managed by the owner’s descendants, who do not always live in country.
It should also be mentioned that in a large number of households, the active members are notfarmers, i.e., they work in some nonagricultural activity. The research results show that just over10% of the total number of private farm households make a living only by working on their ownfarm. Today’s social and economic patterns are changing in favor of the nonagricultural sectorwith a reduction of the pure agriculture holdings—full-time farmers, by certain definitions. Thereason for this phenomenon, besides the lack of appropriate agricultural policy, is the extensivedevelopment of nonagricultural activities. However, the industrialization in Macedonia offeredonly low productivity, low wage employment so that migrants needed to maintain their land tosecure an adequate standard of living, despite the small size of the holdings and the trend ofurbanization. Depending on contemporary economic conditions, the agricultural households are
35
oriented more toward the market or more toward fulfilling their own needs, regardless theirmembers’ professional orientation to nonagricultural activities.
As stated in the introductory chapter, the main objectives of this research were to documentcurrent patterns in agrarian structure and, more importantly, link these patterns to patterns ofproductivity and draw conclusions about land-related constraints to the developing marketeconomy. Section 2 describes the methodology used to obtain the information needed to achievethese goals. The results of analyzing the information gathered are presented in Section 3.
B. SAMPLE SELECTION AND SURVEY DESIGN
As discussed in Chapter 1, the research plan involved the selection of a large sample distributedacross 4 of Macedonia’s 6 agricultural regions. These 4 regions encompass 22 municipalities. Asample of 48 villages was selected from across these municipalities. The villages were stratifiedand chosen to include topographic variation (flat, hilly, and mixed villages; high mountain villageswere excluded as there is little crop cultivation in these areas) and to include a range ofsocioeconomic conditions. A sample of 820 individual farm households was selected usingstratified random sampling procedures. Stratification was according to farm size category asexplained below and random selection of household was conducted from property registry booksheld by the municipal cadastral offices.
The farm size categories used are a simplification of the stratification scheme used by the NationalStatistical Office. Farms are grouped as follows: <1.00 ha, 1.01–2.00 ha, 2.01–5.00 ha, and >5.01ha. Table 3.3 presents the population distribution of farms across this structure according to 1981census data as well as the distribution of the sample. The number of the individual farms smallerthan 1 ha was reduced 30% in the sample and the number of farms larger than 2 ha wasaccordingly increased. This was done to ensure adequate presence of larger farms in the sample tobe able to address issues pertaining to size effects on productivity. During the analysis, the resultsare weighted to account for this distortion from the population distribution. Also, farmers withoutland are excluded from the sample. Appendix 3 presents the complete distribution of farms acrossregions, municipalities, villages, and farm-size groups.
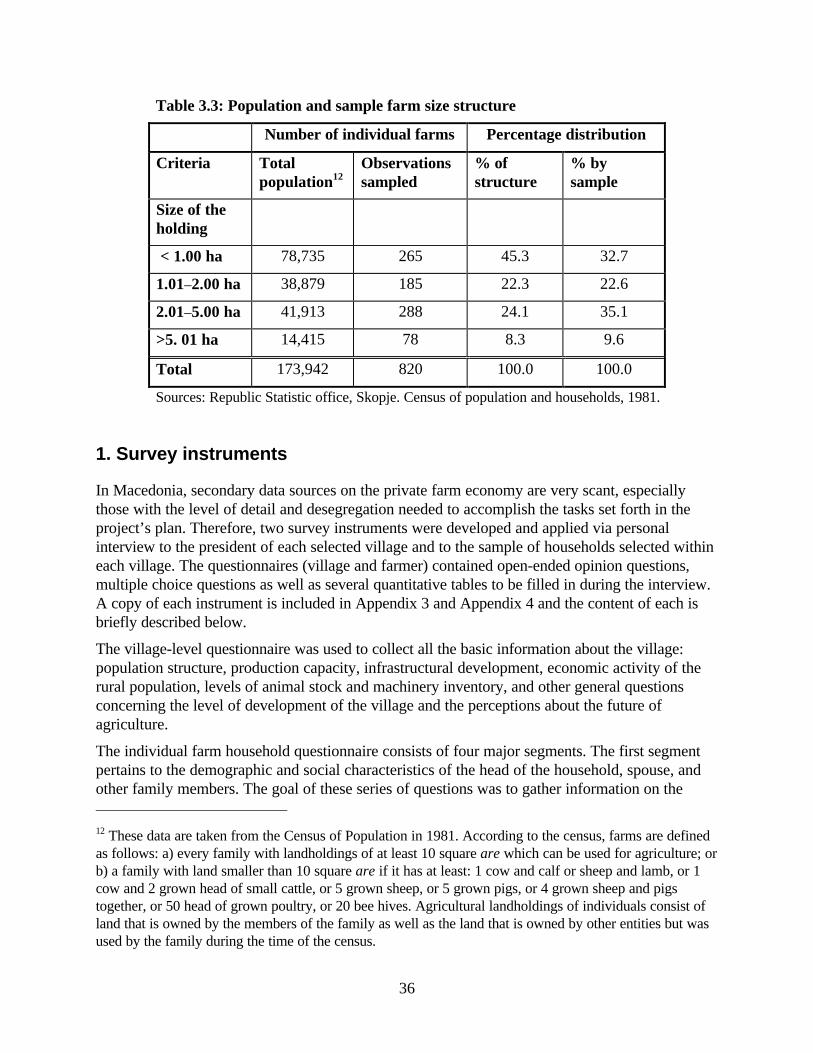
36
Table 3.3: Population and sample farm size structure
Number of individual farms Percentage distribution
Criteria Totalpopulation12
Observationssampled
% ofstructure
% bysample
Size of theholding
< 1.00 ha 78,735 265 45.3 32.7
1.01–2.00 ha 38,879 185 22.3 22.6
2.01–5.00 ha 41,913 288 24.1 35.1
>5. 01 ha 14,415 78 8.3 9.6
Total 173,942 820 100.0 100.0
Sources: Republic Statistic office, Skopje. Census of population and households, 1981.
1. Survey instruments
In Macedonia, secondary data sources on the private farm economy are very scant, especiallythose with the level of detail and desegregation needed to accomplish the tasks set forth in theproject’s plan. Therefore, two survey instruments were developed and applied via personalinterview to the president of each selected village and to the sample of households selected withineach village. The questionnaires (village and farmer) contained open-ended opinion questions,multiple choice questions as well as several quantitative tables to be filled in during the interview.A copy of each instrument is included in Appendix 3 and Appendix 4 and the content of each isbriefly described below.
The village-level questionnaire was used to collect all the basic information about the village:population structure, production capacity, infrastructural development, economic activity of therural population, levels of animal stock and machinery inventory, and other general questionsconcerning the level of development of the village and the perceptions about the future ofagriculture.
The individual farm household questionnaire consists of four major segments. The first segmentpertains to the demographic and social characteristics of the head of the household, spouse, andother family members. The goal of these series of questions was to gather information on the 12 These data are taken from the Census of Population in 1981. According to the census, farms are definedas follows: a) every family with landholdings of at least 10 square are which can be used for agriculture; orb) a family with land smaller than 10 square are if it has at least: 1 cow and calf or sheep and lamb, or 1cow and 2 grown head of small cattle, or 5 grown sheep, or 5 grown pigs, or 4 grown sheep and pigstogether, or 50 head of grown poultry, or 20 bee hives. Agricultural landholdings of individuals consist ofland that is owned by the members of the family as well as the land that is owned by other entities but wasused by the family during the time of the census.
37
demographic features and patterns which might impact on the problems of land fragmentation andagricultural productivity. Of particular importance are the age, gender, ethnicity, and migrationvariables. The second segment of the questionnaire pertains to the land acquisition and land usehistory of the individual farm. Data on agricultural production (including input and output data,capital stock and animal stocks) and agricultural marketing are the subjects of the final twosegments of this questionnaire. In addition a few open-ended, opinion questions were included tocapture the farmer’s individual perspective on the future of agriculture and the policy agenda. Thequestionnaires were subject to several rounds of pre-testing and revision before they wereimplemented for the selected sample.
These questionnaires were applied by a group of trained enumerators. The enumerators wereselected because they had prior experience in agriculture or sociological surveys and because theyreside in the municipalities to which they were assigned. This latter criteria for enumeratorselection assures better quality responses as there is substantial language, dialect, and culturalvariation across Macedonia. The enumerators were brought to Skopje in small groups forintensive classroom training about the project and the questionnaires and were then taken in verysmall groups by the project staff to the field for field-level training (practice interviews with farmhouseholds not selected for the sample).
C. RESULTS OF EMPIRICAL RESEARCH FOR THE PRIVATE AGRICULTURAL
SECTOR
1. Demographic results
In the last few decades, the socioeconomic transition in the Republic of Macedonia, among otherthings, has changed the agricultural household structure. There has been an increase in the numberof agricultural households as well as a decline in their size; i.e., the average number of householdmembers has decreased. The reasons for these changes are embedded in the overall process ofsocial development, including economic factors which have affected population dynamics.
Under the influence of industrialization and urbanization, traditional households as production-consumption units are falling apart due to off-farm employment opportunities and migration to thecities. These factors contribute to the increase in the number of the households and the decrease intheir size. The following table illustrates this phenomenon.
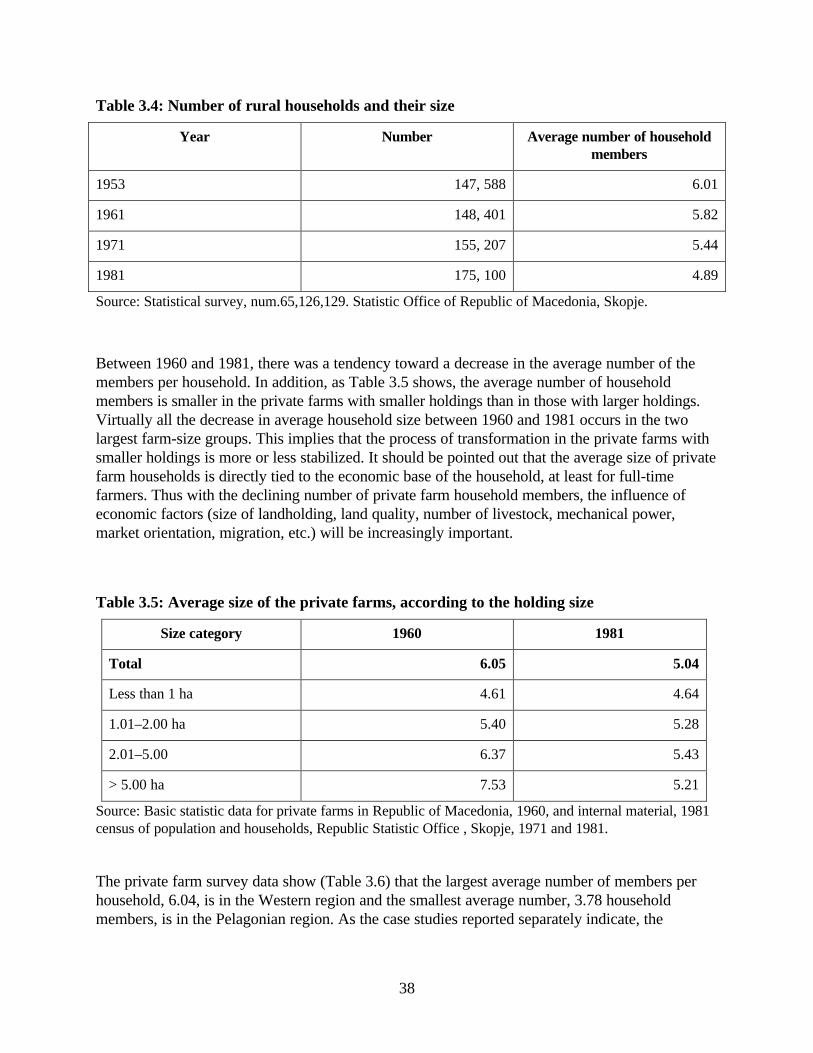
38
Table 3.4: Number of rural households and their size
Year Number Average number of householdmembers
1953 147, 588 6.01
1961 148, 401 5.82
1971 155, 207 5.44
1981 175, 100 4.89
Source: Statistical survey, num.65,126,129. Statistic Office of Republic of Macedonia, Skopje.
Between 1960 and 1981, there was a tendency toward a decrease in the average number of themembers per household. In addition, as Table 3.5 shows, the average number of householdmembers is smaller in the private farms with smaller holdings than in those with larger holdings.Virtually all the decrease in average household size between 1960 and 1981 occurs in the twolargest farm-size groups. This implies that the process of transformation in the private farms withsmaller holdings is more or less stabilized. It should be pointed out that the average size of privatefarm households is directly tied to the economic base of the household, at least for full-timefarmers. Thus with the declining number of private farm household members, the influence ofeconomic factors (size of landholding, land quality, number of livestock, mechanical power,market orientation, migration, etc.) will be increasingly important.
Table 3.5: Average size of the private farms, according to the holding size
Size category 1960 1981
Total 6.05 5.04
Less than 1 ha 4.61 4.64
1.01–2.00 ha 5.40 5.28
2.01–5.00 6.37 5.43
> 5.00 ha 7.53 5.21
Source: Basic statistic data for private farms in Republic of Macedonia, 1960, and internal material, 1981census of population and households, Republic Statistic Office , Skopje, 1971 and 1981.
The private farm survey data show (Table 3.6) that the largest average number of members perhousehold, 6.04, is in the Western region and the smallest average number, 3.78 householdmembers, is in the Pelagonian region. As the case studies reported separately indicate, the
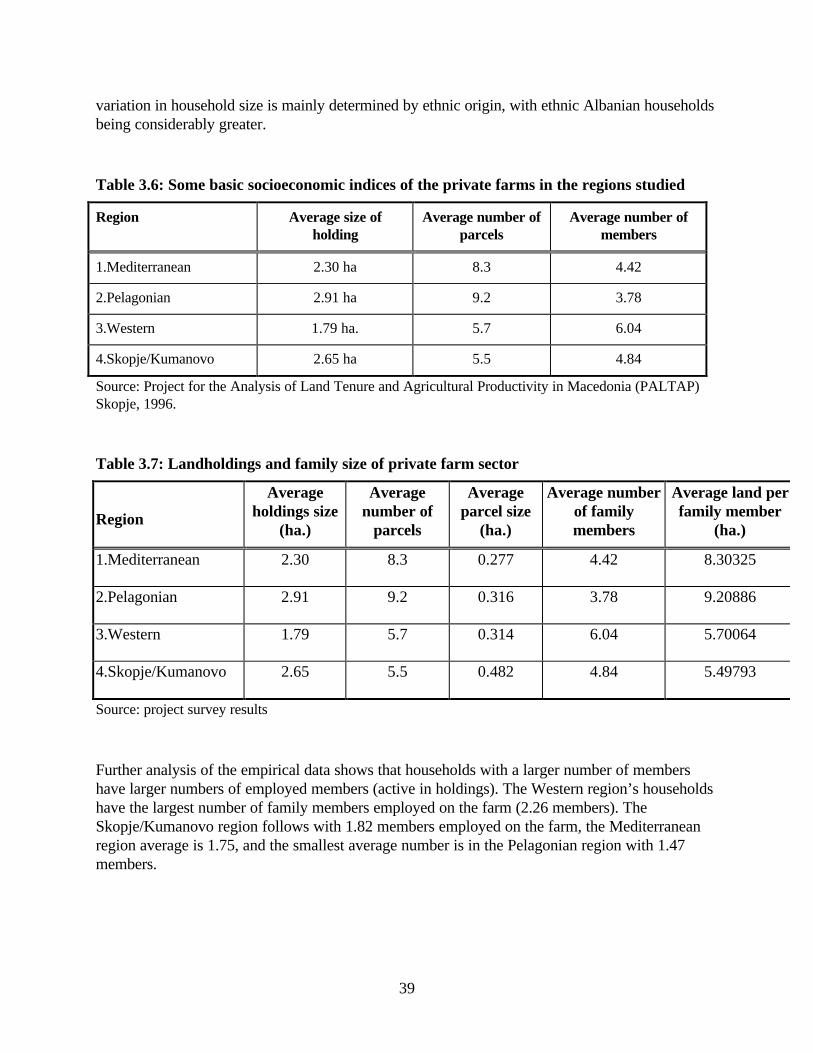
39
variation in household size is mainly determined by ethnic origin, with ethnic Albanian householdsbeing considerably greater.
Table 3.6: Some basic socioeconomic indices of the private farms in the regions studied
Region Average size ofholding
Average number ofparcels
Average number ofmembers
1.Mediterranean 2.30 ha 8.3 4.42
2.Pelagonian 2.91 ha 9.2 3.78
3.Western 1.79 ha. 5.7 6.04
4.Skopje/Kumanovo 2.65 ha 5.5 4.84
Source: Project for the Analysis of Land Tenure and Agricultural Productivity in Macedonia (PALTAP)Skopje, 1996.
Table 3.7: Landholdings and family size of private farm sector
Region
Averageholdings size
(ha.)
Averagenumber of
parcels
Averageparcel size
(ha.)
Average numberof familymembers
Average land perfamily member
(ha.)
1.Mediterranean 2.30 8.3 0.277 4.42 8.30325
2.Pelagonian 2.91 9.2 0.316 3.78 9.20886
3.Western 1.79 5.7 0.314 6.04 5.70064
4.Skopje/Kumanovo 2.65 5.5 0.482 4.84 5.49793
Source: project survey results
Further analysis of the empirical data shows that households with a larger number of membershave larger numbers of employed members (active in holdings). The Western region’s householdshave the largest number of family members employed on the farm (2.26 members). TheSkopje/Kumanovo region follows with 1.82 members employed on the farm, the Mediterraneanregion average is 1.75, and the smallest average number is in the Pelagonian region with 1.47members.
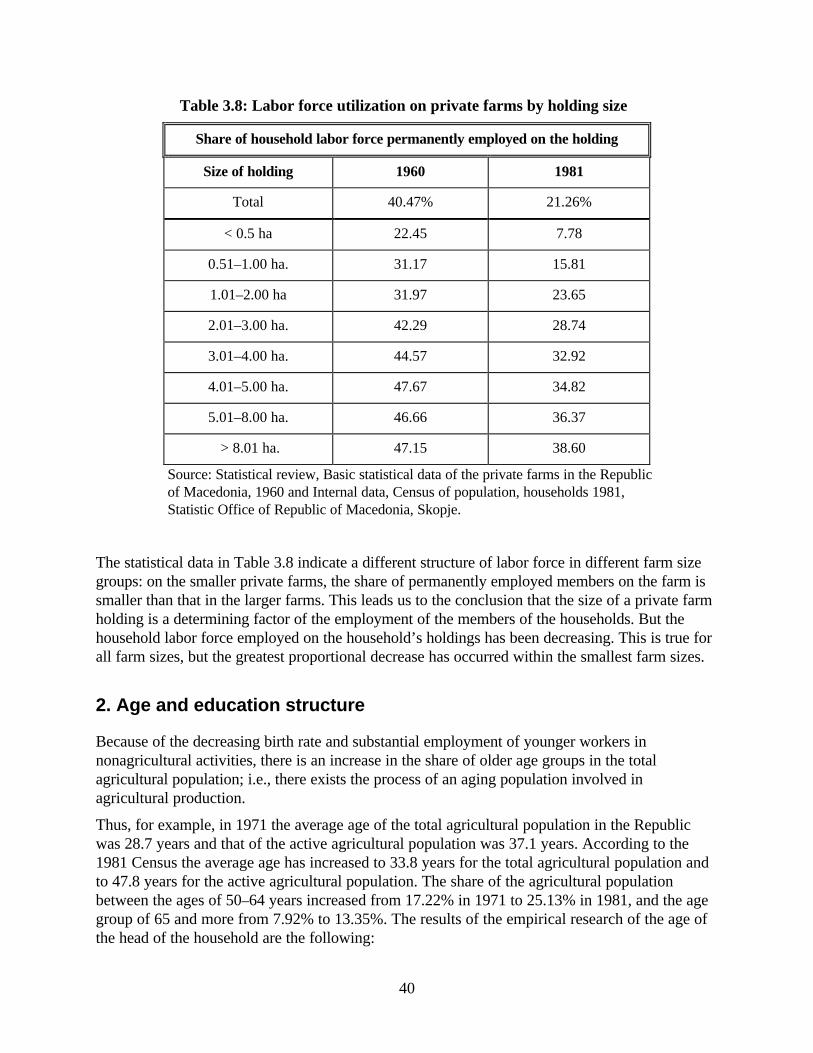
40
Table 3.8: Labor force utilization on private farms by holding size
Share of household labor force permanently employed on the holding
Size of holding 1960 1981
Total 40.47% 21.26%
< 0.5 ha 22.45 7.78
0.51–1.00 ha. 31.17 15.81
1.01–2.00 ha 31.97 23.65
2.01–3.00 ha. 42.29 28.74
3.01–4.00 ha. 44.57 32.92
4.01–5.00 ha. 47.67 34.82
5.01–8.00 ha. 46.66 36.37
> 8.01 ha. 47.15 38.60
Source: Statistical review, Basic statistical data of the private farms in the Republicof Macedonia, 1960 and Internal data, Census of population, households 1981,Statistic Office of Republic of Macedonia, Skopje.
The statistical data in Table 3.8 indicate a different structure of labor force in different farm sizegroups: on the smaller private farms, the share of permanently employed members on the farm issmaller than that in the larger farms. This leads us to the conclusion that the size of a private farmholding is a determining factor of the employment of the members of the households. But thehousehold labor force employed on the household’s holdings has been decreasing. This is true forall farm sizes, but the greatest proportional decrease has occurred within the smallest farm sizes.
2. Age and education structure
Because of the decreasing birth rate and substantial employment of younger workers innonagricultural activities, there is an increase in the share of older age groups in the totalagricultural population; i.e., there exists the process of an aging population involved inagricultural production.
Thus, for example, in 1971 the average age of the total agricultural population in the Republicwas 28.7 years and that of the active agricultural population was 37.1 years. According to the1981 Census the average age has increased to 33.8 years for the total agricultural population andto 47.8 years for the active agricultural population. The share of the agricultural populationbetween the ages of 50–64 years increased from 17.22% in 1971 to 25.13% in 1981, and the agegroup of 65 and more from 7.92% to 13.35%. The results of the empirical research of the age ofthe head of the household are the following:
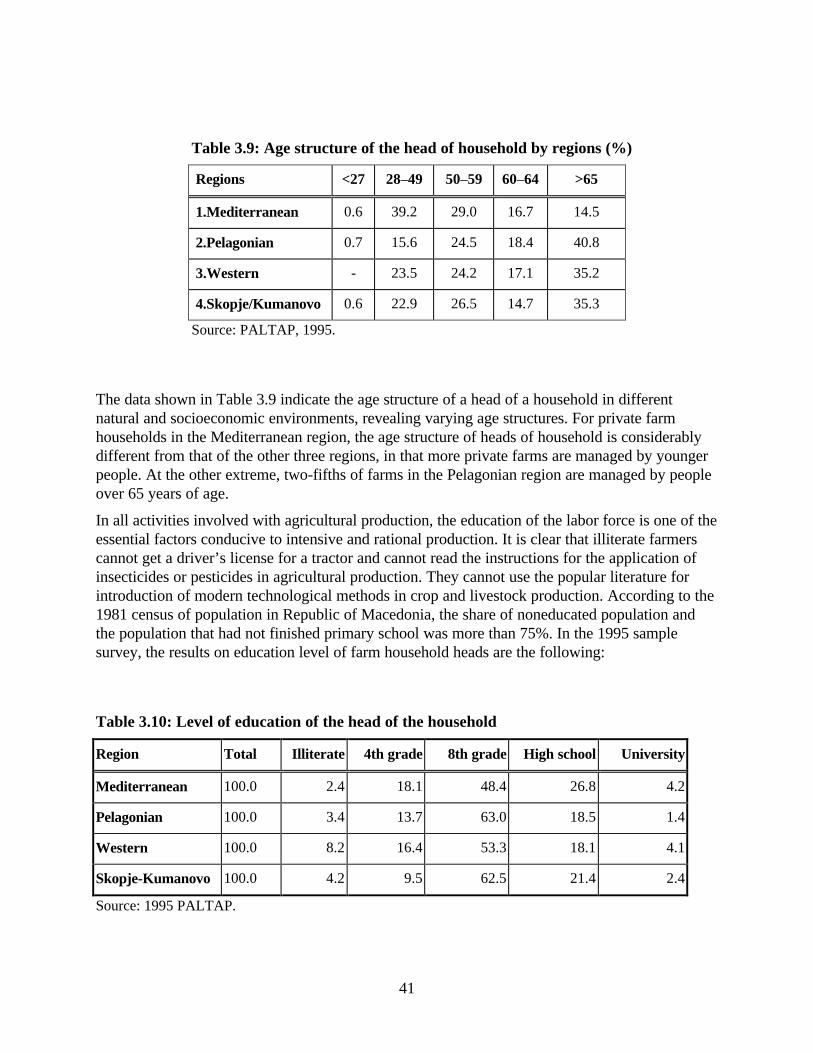
41
Table 3.9: Age structure of the head of household by regions (%)
Regions <27 28–49 50–59 60–64 >65
1.Mediterranean 0.6 39.2 29.0 16.7 14.5
2.Pelagonian 0.7 15.6 24.5 18.4 40.8
3.Western - 23.5 24.2 17.1 35.2
4.Skopje/Kumanovo 0.6 22.9 26.5 14.7 35.3
Source: PALTAP, 1995.
The data shown in Table 3.9 indicate the age structure of a head of a household in differentnatural and socioeconomic environments, revealing varying age structures. For private farmhouseholds in the Mediterranean region, the age structure of heads of household is considerablydifferent from that of the other three regions, in that more private farms are managed by youngerpeople. At the other extreme, two-fifths of farms in the Pelagonian region are managed by peopleover 65 years of age.
In all activities involved with agricultural production, the education of the labor force is one of theessential factors conducive to intensive and rational production. It is clear that illiterate farmerscannot get a driver’s license for a tractor and cannot read the instructions for the application ofinsecticides or pesticides in agricultural production. They cannot use the popular literature forintroduction of modern technological methods in crop and livestock production. According to the1981 census of population in Republic of Macedonia, the share of noneducated population andthe population that had not finished primary school was more than 75%. In the 1995 samplesurvey, the results on education level of farm household heads are the following:
Table 3.10: Level of education of the head of the household
Region Total Illiterate 4th grade 8th grade High school University
Mediterranean 100.0 2.4 18.1 48.4 26.8 4.2
Pelagonian 100.0 3.4 13.7 63.0 18.5 1.4
Western 100.0 8.2 16.4 53.3 18.1 4.1
Skopje-Kumanovo 100.0 4.2 9.5 62.5 21.4 2.4
Source: 1995 PALTAP.
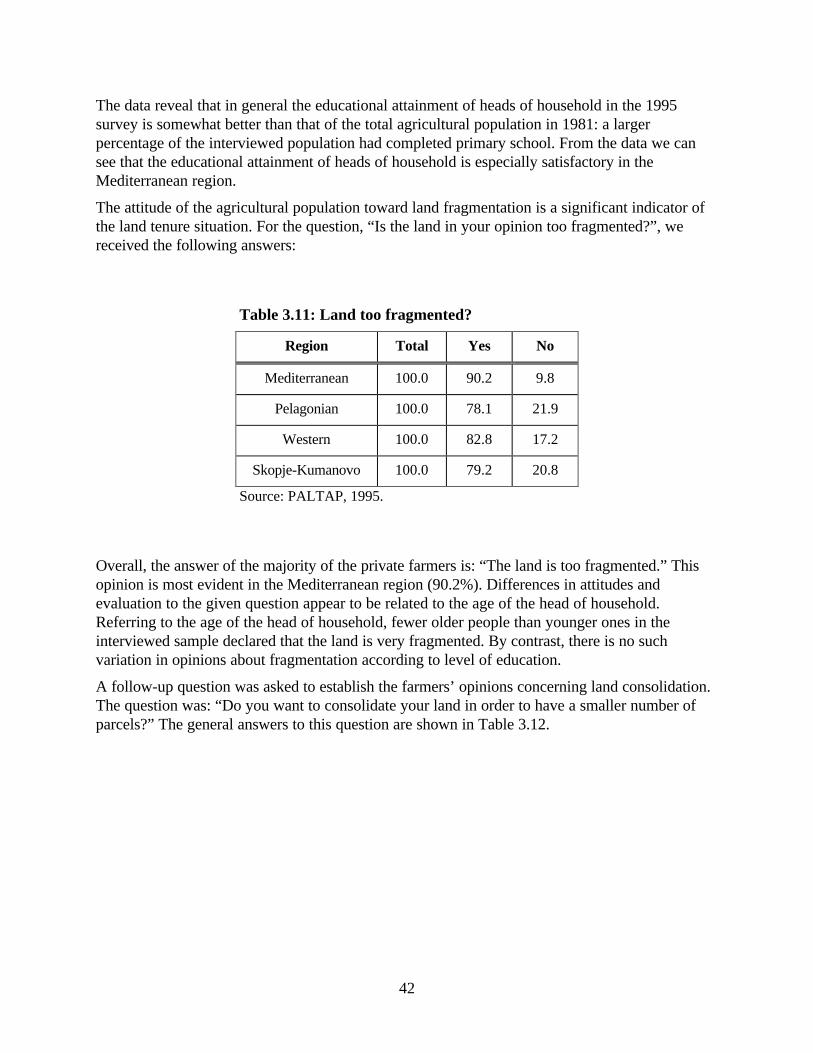
42
The data reveal that in general the educational attainment of heads of household in the 1995survey is somewhat better than that of the total agricultural population in 1981: a largerpercentage of the interviewed population had completed primary school. From the data we cansee that the educational attainment of heads of household is especially satisfactory in theMediterranean region.
The attitude of the agricultural population toward land fragmentation is a significant indicator ofthe land tenure situation. For the question, “Is the land in your opinion too fragmented?”, wereceived the following answers:
Table 3.11: Land too fragmented?
Region Total Yes No
Mediterranean 100.0 90.2 9.8
Pelagonian 100.0 78.1 21.9
Western 100.0 82.8 17.2
Skopje-Kumanovo 100.0 79.2 20.8
Source: PALTAP, 1995.
Overall, the answer of the majority of the private farmers is: “The land is too fragmented.” Thisopinion is most evident in the Mediterranean region (90.2%). Differences in attitudes andevaluation to the given question appear to be related to the age of the head of household.Referring to the age of the head of household, fewer older people than younger ones in theinterviewed sample declared that the land is very fragmented. By contrast, there is no suchvariation in opinions about fragmentation according to level of education.
A follow-up question was asked to establish the farmers’ opinions concerning land consolidation.The question was: “Do you want to consolidate your land in order to have a smaller number ofparcels?” The general answers to this question are shown in Table 3.12.
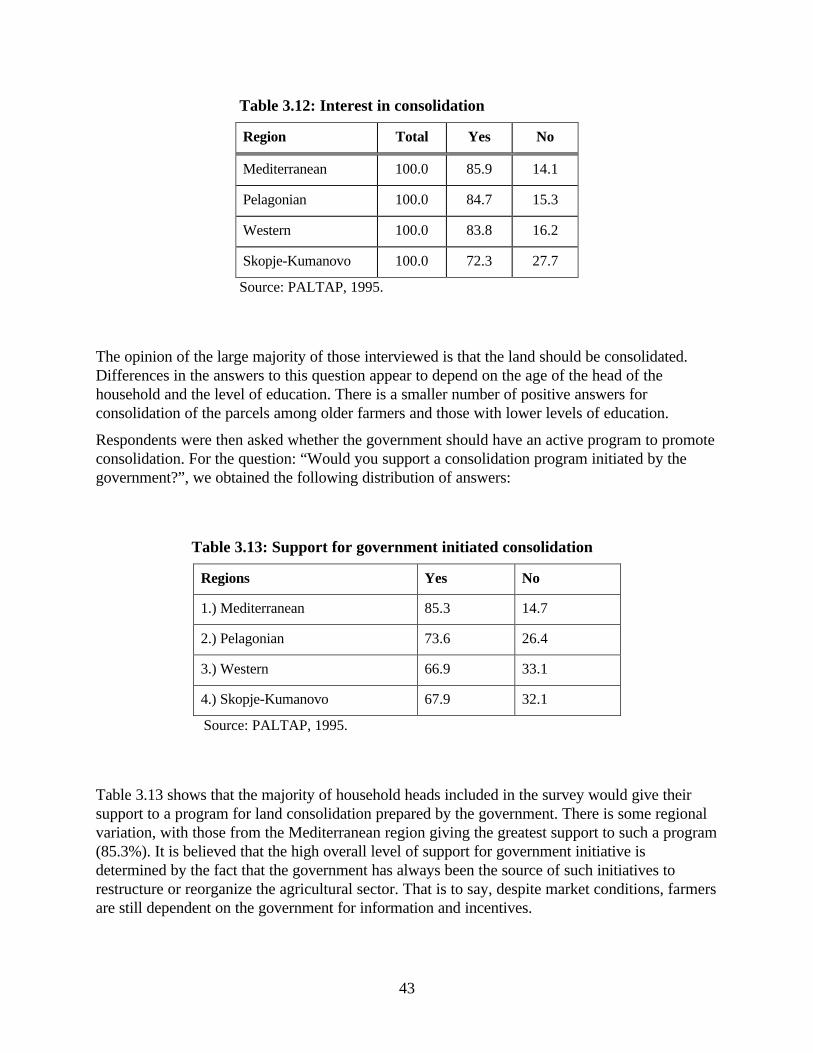
43
Table 3.12: Interest in consolidation
Region Total Yes No
Mediterranean 100.0 85.9 14.1
Pelagonian 100.0 84.7 15.3
Western 100.0 83.8 16.2
Skopje-Kumanovo 100.0 72.3 27.7
Source: PALTAP, 1995.
The opinion of the large majority of those interviewed is that the land should be consolidated.Differences in the answers to this question appear to depend on the age of the head of thehousehold and the level of education. There is a smaller number of positive answers forconsolidation of the parcels among older farmers and those with lower levels of education.
Respondents were then asked whether the government should have an active program to promoteconsolidation. For the question: “Would you support a consolidation program initiated by thegovernment?”, we obtained the following distribution of answers:
Table 3.13: Support for government initiated consolidation
Regions Yes No
1.) Mediterranean 85.3 14.7
2.) Pelagonian 73.6 26.4
3.) Western 66.9 33.1
4.) Skopje-Kumanovo 67.9 32.1
Source: PALTAP, 1995.
Table 3.13 shows that the majority of household heads included in the survey would give theirsupport to a program for land consolidation prepared by the government. There is some regionalvariation, with those from the Mediterranean region giving the greatest support to such a program(85.3%). It is believed that the high overall level of support for government initiative isdetermined by the fact that the government has always been the source of such initiatives torestructure or reorganize the agricultural sector. That is to say, despite market conditions, farmersare still dependent on the government for information and incentives.
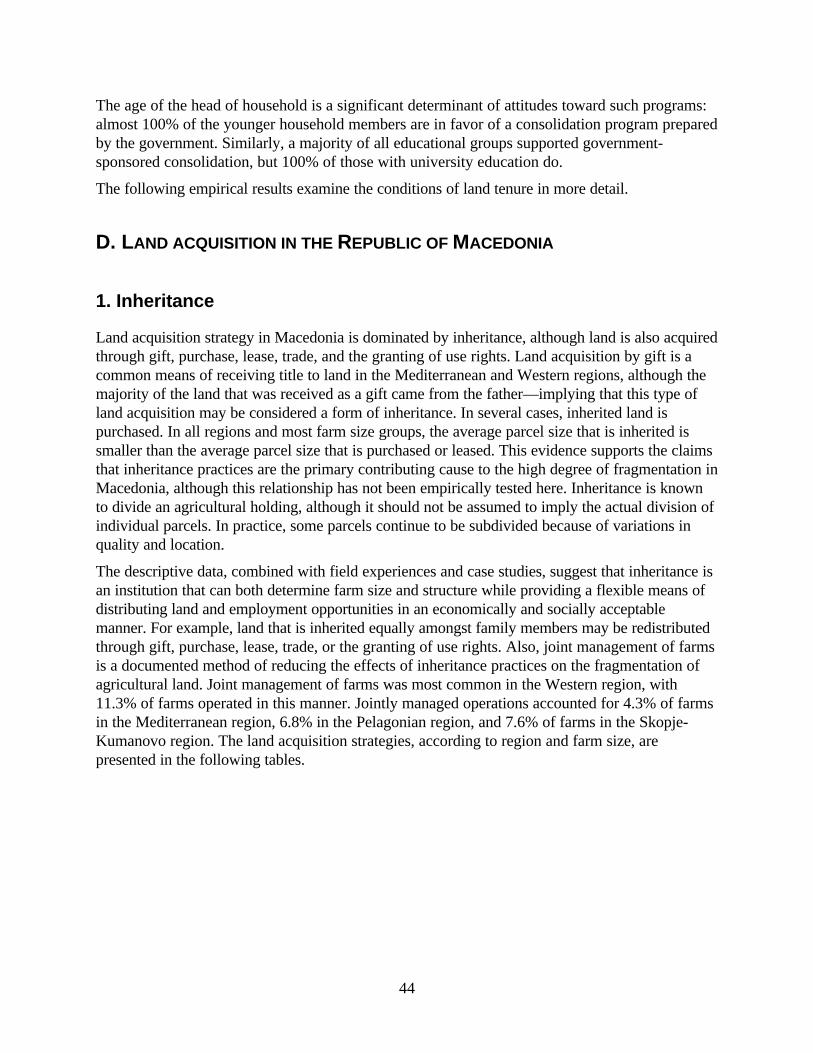
44
The age of the head of household is a significant determinant of attitudes toward such programs:almost 100% of the younger household members are in favor of a consolidation program preparedby the government. Similarly, a majority of all educational groups supported government-sponsored consolidation, but 100% of those with university education do.
The following empirical results examine the conditions of land tenure in more detail.
D. LAND ACQUISITION IN THE REPUBLIC OF MACEDONIA
1. Inheritance
Land acquisition strategy in Macedonia is dominated by inheritance, although land is also acquiredthrough gift, purchase, lease, trade, and the granting of use rights. Land acquisition by gift is acommon means of receiving title to land in the Mediterranean and Western regions, although themajority of the land that was received as a gift came from the father—implying that this type ofland acquisition may be considered a form of inheritance. In several cases, inherited land ispurchased. In all regions and most farm size groups, the average parcel size that is inherited issmaller than the average parcel size that is purchased or leased. This evidence supports the claimsthat inheritance practices are the primary contributing cause to the high degree of fragmentation inMacedonia, although this relationship has not been empirically tested here. Inheritance is knownto divide an agricultural holding, although it should not be assumed to imply the actual division ofindividual parcels. In practice, some parcels continue to be subdivided because of variations inquality and location.
The descriptive data, combined with field experiences and case studies, suggest that inheritance isan institution that can both determine farm size and structure while providing a flexible means ofdistributing land and employment opportunities in an economically and socially acceptablemanner. For example, land that is inherited equally amongst family members may be redistributedthrough gift, purchase, lease, trade, or the granting of use rights. Also, joint management of farmsis a documented method of reducing the effects of inheritance practices on the fragmentation ofagricultural land. Joint management of farms was most common in the Western region, with11.3% of farms operated in this manner. Jointly managed operations accounted for 4.3% of farmsin the Mediterranean region, 6.8% in the Pelagonian region, and 7.6% of farms in the Skopje-Kumanovo region. The land acquisition strategies, according to region and farm size, arepresented in the following tables.
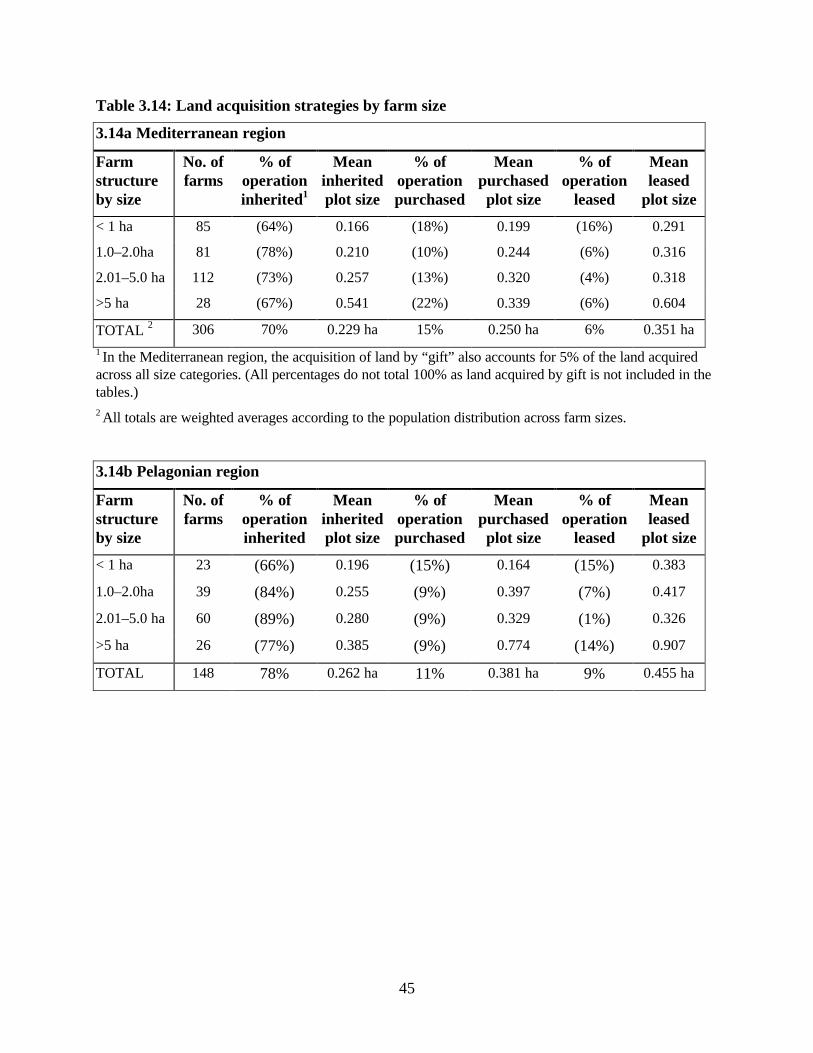
45
Table 3.14: Land acquisition strategies by farm size
3.14a Mediterranean region
Farmstructureby size
No. offarms
% ofoperationinherited1
Meaninheritedplot size
% ofoperationpurchased
Meanpurchasedplot size
% ofoperation
leased
Meanleased
plot size
< 1 ha 85 (64%) 0.166 (18%) 0.199 (16%) 0.291
1.0–2.0ha 81 (78%) 0.210 (10%) 0.244 (6%) 0.316
2.01–5.0 ha 112 (73%) 0.257 (13%) 0.320 (4%) 0.318
>5 ha 28 (67%) 0.541 (22%) 0.339 (6%) 0.604
TOTAL 2 306 70% 0.229 ha 15% 0.250 ha 6% 0.351 ha
1 In the Mediterranean region, the acquisition of land by “gift” also accounts for 5% of the land acquiredacross all size categories. (All percentages do not total 100% as land acquired by gift is not included in thetables.)2 All totals are weighted averages according to the population distribution across farm sizes.
3.14b Pelagonian region
Farmstructureby size
No. offarms
% ofoperationinherited
Meaninheritedplot size
% ofoperationpurchased
Meanpurchasedplot size
% ofoperation
leased
Meanleased
plot size
< 1 ha 23 (66%) 0.196 (15%) 0.164 (15%) 0.383
1.0–2.0ha 39 (84%) 0.255 (9%) 0.397 (7%) 0.417
2.01–5.0 ha 60 (89%) 0.280 (9%) 0.329 (1%) 0.326
>5 ha 26 (77%) 0.385 (9%) 0.774 (14%) 0.907
TOTAL 148 78% 0.262 ha 11% 0.381 ha 9% 0.455 ha
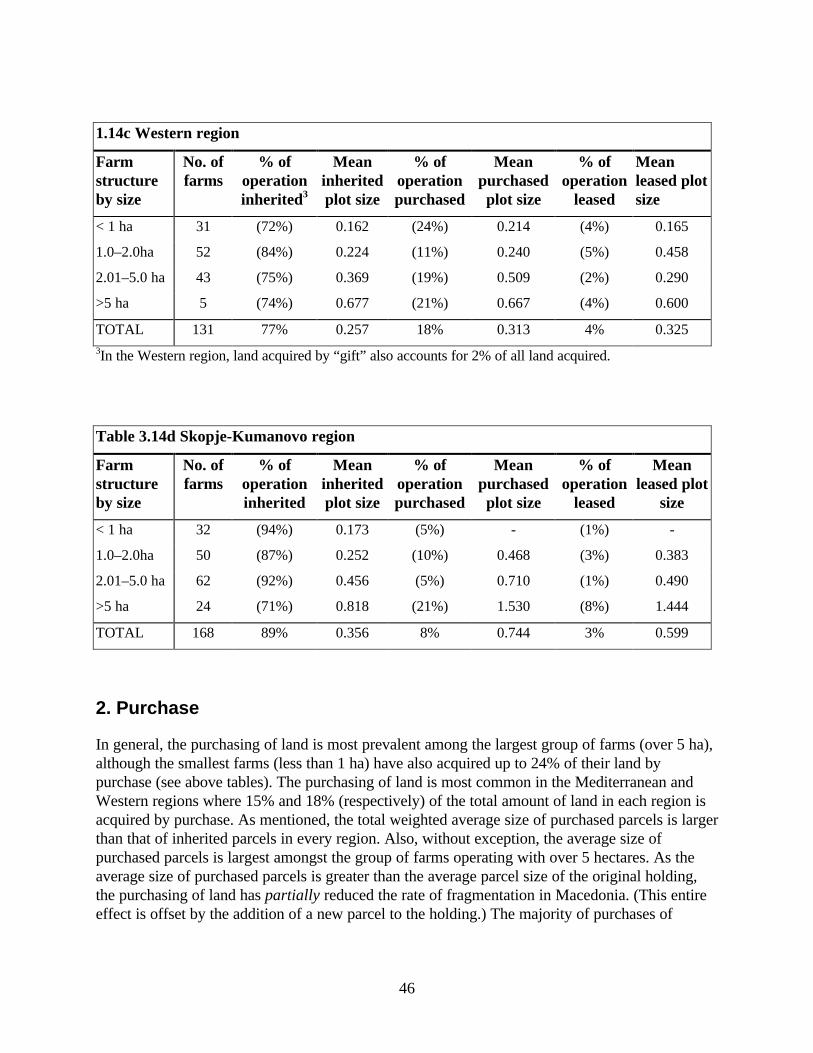
46
1.14c Western region
Farmstructureby size
No. offarms
% ofoperationinherited3
Meaninheritedplot size
% ofoperationpurchased
Meanpurchasedplot size
% ofoperation
leased
Meanleased plotsize
< 1 ha 31 (72%) 0.162 (24%) 0.214 (4%) 0.165
1.0–2.0ha 52 (84%) 0.224 (11%) 0.240 (5%) 0.458
2.01–5.0 ha 43 (75%) 0.369 (19%) 0.509 (2%) 0.290
>5 ha 5 (74%) 0.677 (21%) 0.667 (4%) 0.600
TOTAL 131 77% 0.257 18% 0.313 4% 0.3253In the Western region, land acquired by “gift” also accounts for 2% of all land acquired.
Table 3.14d Skopje-Kumanovo region
Farmstructureby size
No. offarms
% ofoperationinherited
Meaninheritedplot size
% ofoperationpurchased
Meanpurchasedplot size
% ofoperation
leased
Meanleased plot
size
< 1 ha 32 (94%) 0.173 (5%) - (1%) -
1.0–2.0ha 50 (87%) 0.252 (10%) 0.468 (3%) 0.383
2.01–5.0 ha 62 (92%) 0.456 (5%) 0.710 (1%) 0.490
>5 ha 24 (71%) 0.818 (21%) 1.530 (8%) 1.444
TOTAL 168 89% 0.356 8% 0.744 3% 0.599
2. Purchase
In general, the purchasing of land is most prevalent among the largest group of farms (over 5 ha),although the smallest farms (less than 1 ha) have also acquired up to 24% of their land bypurchase (see above tables). The purchasing of land is most common in the Mediterranean andWestern regions where 15% and 18% (respectively) of the total amount of land in each region isacquired by purchase. As mentioned, the total weighted average size of purchased parcels is largerthan that of inherited parcels in every region. Also, without exception, the average size ofpurchased parcels is largest amongst the group of farms operating with over 5 hectares. As theaverage size of purchased parcels is greater than the average parcel size of the original holding,the purchasing of land has partially reduced the rate of fragmentation in Macedonia. (This entireeffect is offset by the addition of a new parcel to the holding.) The majority of purchases of
47
agricultural land are made from other farmers, although in the Western region, 29% of thepurchase transactions were made with the father.
These purchases are also distributed over time, with recorded purchases from the sample datingback to 1936. The purchasing of land in Macedonia has been quite frequent during certain periodsof time. Notably, however, the purchasing of land has considerably declined in recent years.Considering the difficulties faced by the private agricultural sector, this reduction in purchasesmay be attributable to a lack of interest in investing in agriculture and not necessarily a failure ofthe land market. The land market in Macedonia will be given more consideration below.
3. Leasing
Leasing accounts for only 3% to 9% of agricultural land acquired as part of the farm operation inthe four regions, although leasing is still a significant form of acquisition for all categories ofhousehold. As with purchased land, the average parcel size of leased land is greater than that ofinherited land, with the group of farmers operating with more than 5 hectares leasing in the largestparcels. Leasing is most common in the Mediterranean and Pelagonian regions, with 25% and22% of all farmers leasing in land. The leasing of land can also be examined over time. Long-termleasing is relatively rare, as the majority of leasing arrangements recorded from the sample wereinitiated in 1995. This suggests the prevalence of year-to-year leasing, although time series dataare not available to investigate this possibility in greater detail. Most of these leases are arrangedby form of contract, some of which are informal in nature and include oral agreements. In all ofthe regions surveyed, land was most frequently leased from other farmers. In the Mediterranean,Pelagonian, and Skopje-Kumanovo regions, slightly more than 10% of leased land was leasedfrom an agrokombinat. In the Western region, no land was reported to have been leased from anagrokombinat. Despite the small area of land leased relative to the farm operation size, and theshort-term nature of leases, roughly 50% of farmers in all regions are interested in leasing moreland. The constraint most frequently cited which inhibited farmers’ ability to lease land was accessto credit. The lack of land was cited as a constraint among a small percentage of farmers,although other information indicates the possibility of land shortages amongst private farmers incertain regions. This possibility and information on land use will be discussed further below.
E. THE MARKET FOR LAND
1. General characteristics
Due to the private ownership of agricultural land, land transactions are facilitated to a certaindegree. The data regarding the purchase and lease of agricultural land in the four sampled regionsin Macedonia suggest that a land market does exist; however, activity is relatively unstable.Purchases have declined sharply over the past several years, and long-term leasing is relativelyrare. Pending private claims to socially owned agricultural land, lack of credit and difficultpolitical and marketing conditions are all possible contributing factors to the low interest in land-type investments. Current legislation and legal processes also make the sale and purchase of land
48
somewhat complex. Transactions costs, as a result, are reported to be quite high as theprocedures for selling and purchasing land usually require a lawyer and involve approval fromnumerous agents. According to existing regulations, an individual interested in selling land mustfirst, usually through a lawyer, obtain the following documentation:
• contract for purchase to register the contract;
• certificate from the cooperative and/or agrokombinat in the cadastral area stating that it is notinterested in purchasing the land;
• statements from the owners of neighboring plots, stating that they are not interested inpurchasing the land;
• certificate from the Municipal Office of the Ministry of Civil Engineering, stating that the landis not part of construction land; and
• certificate from the Municipal Office of the Ministry of Finance stating that the land has notbeen nationalized.
The legal aspects of the land tenure situation in Macedonia are discussed in greater detail inChapter 2 of this report.
2. Prices
At the time of the writing of this report, the prices of purchased agricultural land have not beenconverted to reflect current values. Due to the introduction of new currency in Macedonia in1992, inflation, and the use of foreign currencies, the standardization of these prices is somewhatcomplicated. An initial examination of the price data, however, reveals that there appear to begreat variations in agricultural land prices across regions. This variation in price is believed to bethe result of the relative scarcity of land across micro-regions, the source of the land, land qualityfactors including irrigation, and micro-regional access to market opportunities. These hypothesesneed to be followed up in more detail, perhaps from a larger sample. Rental prices are easier toevaluate as the majority of the transactions are current. Average rental prices for agricultural landin the four regions are presented below. These figures should be interpreted only as roughguidelines due to the low number of transactions recorded. Some rental prices are also paid inkind by a pre-determined percentage of the crop yield.
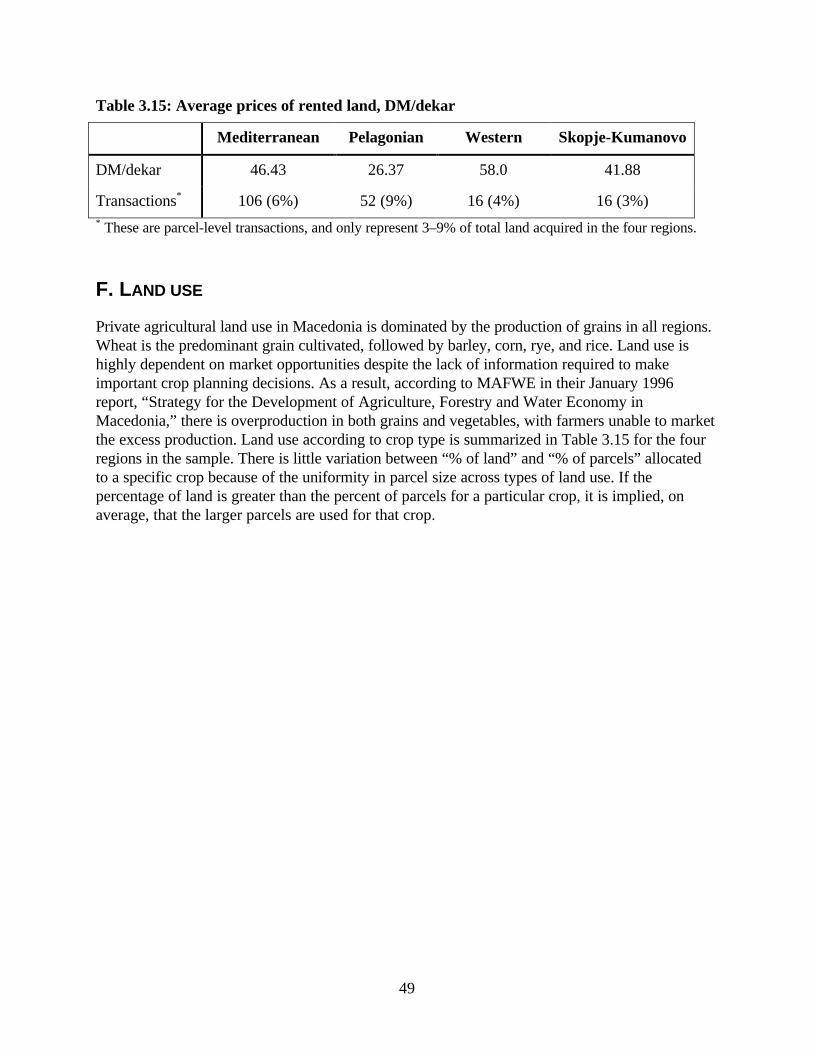
49
Table 3.15: Average prices of rented land, DM/dekar
Mediterranean Pelagonian Western Skopje-Kumanovo
DM/dekar 46.43 26.37 58.0 41.88
Transactions* 106 (6%) 52 (9%) 16 (4%) 16 (3%)* These are parcel-level transactions, and only represent 3–9% of total land acquired in the four regions.
F. LAND USE
Private agricultural land use in Macedonia is dominated by the production of grains in all regions.Wheat is the predominant grain cultivated, followed by barley, corn, rye, and rice. Land use ishighly dependent on market opportunities despite the lack of information required to makeimportant crop planning decisions. As a result, according to MAFWE in their January 1996report, “Strategy for the Development of Agriculture, Forestry and Water Economy inMacedonia,” there is overproduction in both grains and vegetables, with farmers unable to marketthe excess production. Land use according to crop type is summarized in Table 3.15 for the fourregions in the sample. There is little variation between “% of land” and “% of parcels” allocatedto a specific crop because of the uniformity in parcel size across types of land use. If thepercentage of land is greater than the percent of parcels for a particular crop, it is implied, onaverage, that the larger parcels are used for that crop.
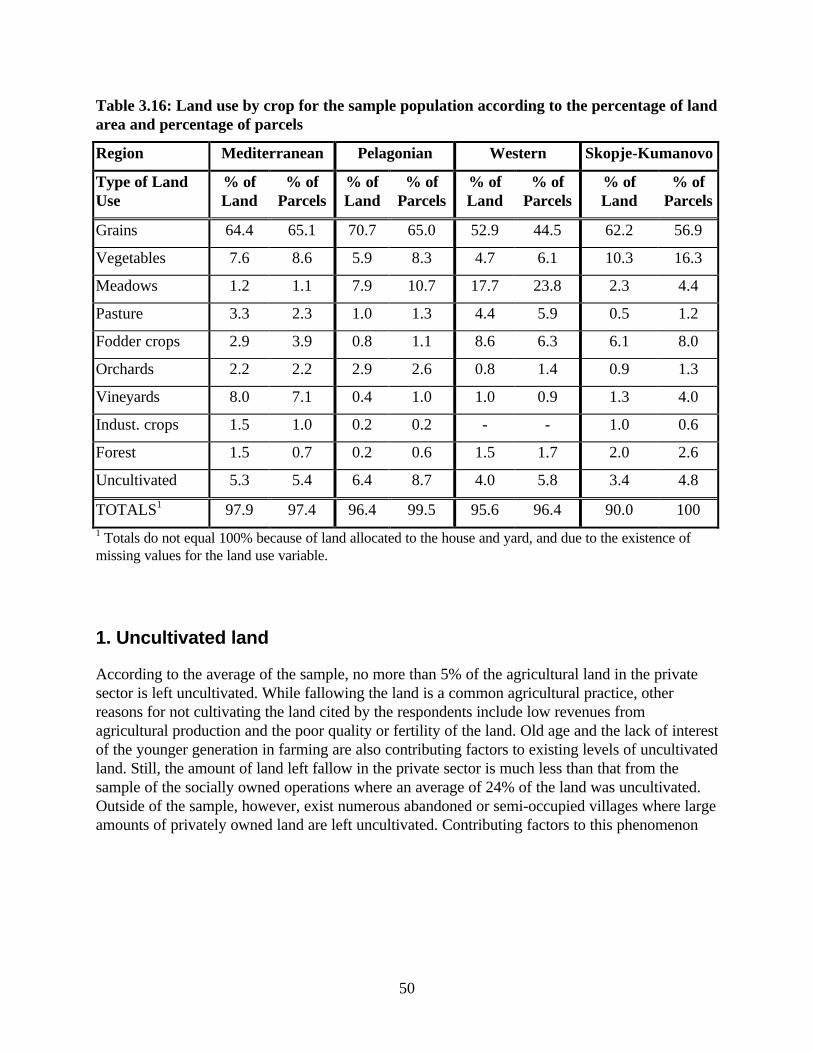
50
Table 3.16: Land use by crop for the sample population according to the percentage of landarea and percentage of parcels
Region Mediterranean Pelagonian Western Skopje-Kumanovo
Type of LandUse
% ofLand
% ofParcels
% ofLand
% ofParcels
% ofLand
% ofParcels
% ofLand
% ofParcels
Grains 64.4 65.1 70.7 65.0 52.9 44.5 62.2 56.9
Vegetables 7.6 8.6 5.9 8.3 4.7 6.1 10.3 16.3
Meadows 1.2 1.1 7.9 10.7 17.7 23.8 2.3 4.4
Pasture 3.3 2.3 1.0 1.3 4.4 5.9 0.5 1.2
Fodder crops 2.9 3.9 0.8 1.1 8.6 6.3 6.1 8.0
Orchards 2.2 2.2 2.9 2.6 0.8 1.4 0.9 1.3
Vineyards 8.0 7.1 0.4 1.0 1.0 0.9 1.3 4.0
Indust. crops 1.5 1.0 0.2 0.2 - - 1.0 0.6
Forest 1.5 0.7 0.2 0.6 1.5 1.7 2.0 2.6
Uncultivated 5.3 5.4 6.4 8.7 4.0 5.8 3.4 4.8
TOTALS1 97.9 97.4 96.4 99.5 95.6 96.4 90.0 1001 Totals do not equal 100% because of land allocated to the house and yard, and due to the existence ofmissing values for the land use variable.
1. Uncultivated land
According to the average of the sample, no more than 5% of the agricultural land in the privatesector is left uncultivated. While fallowing the land is a common agricultural practice, otherreasons for not cultivating the land cited by the respondents include low revenues fromagricultural production and the poor quality or fertility of the land. Old age and the lack of interestof the younger generation in farming are also contributing factors to existing levels of uncultivatedland. Still, the amount of land left fallow in the private sector is much less than that from thesample of the socially owned operations where an average of 24% of the land was uncultivated.Outside of the sample, however, exist numerous abandoned or semi-occupied villages where largeamounts of privately owned land are left uncultivated. Contributing factors to this phenomenon
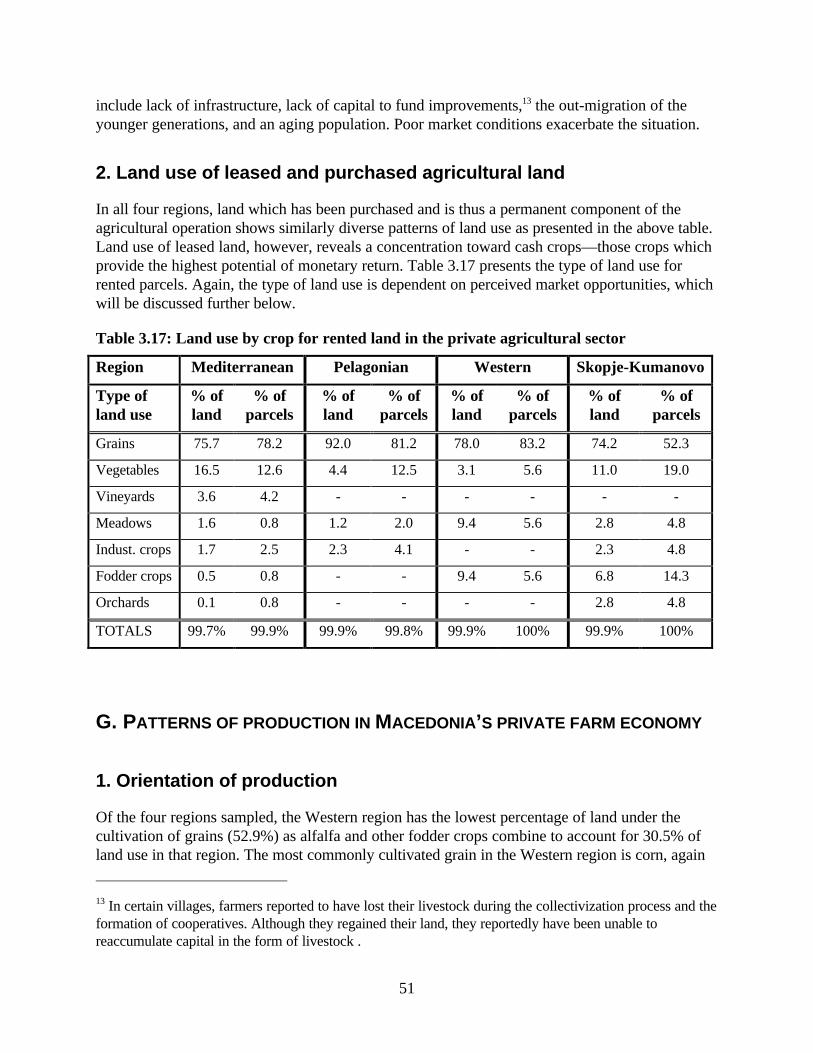
51
include lack of infrastructure, lack of capital to fund improvements,13 the out-migration of theyounger generations, and an aging population. Poor market conditions exacerbate the situation.
2. Land use of leased and purchased agricultural land
In all four regions, land which has been purchased and is thus a permanent component of theagricultural operation shows similarly diverse patterns of land use as presented in the above table.Land use of leased land, however, reveals a concentration toward cash crops—those crops whichprovide the highest potential of monetary return. Table 3.17 presents the type of land use forrented parcels. Again, the type of land use is dependent on perceived market opportunities, whichwill be discussed further below.
Table 3.17: Land use by crop for rented land in the private agricultural sector
Region Mediterranean Pelagonian Western Skopje-Kumanovo
Type ofland use
% ofland
% ofparcels
% ofland
% ofparcels
% ofland
% ofparcels
% ofland
% ofparcels
Grains 75.7 78.2 92.0 81.2 78.0 83.2 74.2 52.3
Vegetables 16.5 12.6 4.4 12.5 3.1 5.6 11.0 19.0
Vineyards 3.6 4.2 - - - - - -
Meadows 1.6 0.8 1.2 2.0 9.4 5.6 2.8 4.8
Indust. crops 1.7 2.5 2.3 4.1 - - 2.3 4.8
Fodder crops 0.5 0.8 - - 9.4 5.6 6.8 14.3
Orchards 0.1 0.8 - - - - 2.8 4.8
TOTALS 99.7% 99.9% 99.9% 99.8% 99.9% 100% 99.9% 100%
G. PATTERNS OF PRODUCTION IN MACEDONIA’S PRIVATE FARM ECONOMY
1. Orientation of production
Of the four regions sampled, the Western region has the lowest percentage of land under thecultivation of grains (52.9%) as alfalfa and other fodder crops combine to account for 30.5% ofland use in that region. The most commonly cultivated grain in the Western region is corn, again
13 In certain villages, farmers reported to have lost their livestock during the collectivization process and theformation of cooperatives. Although they regained their land, they reportedly have been unable toreaccumulate capital in the form of livestock .
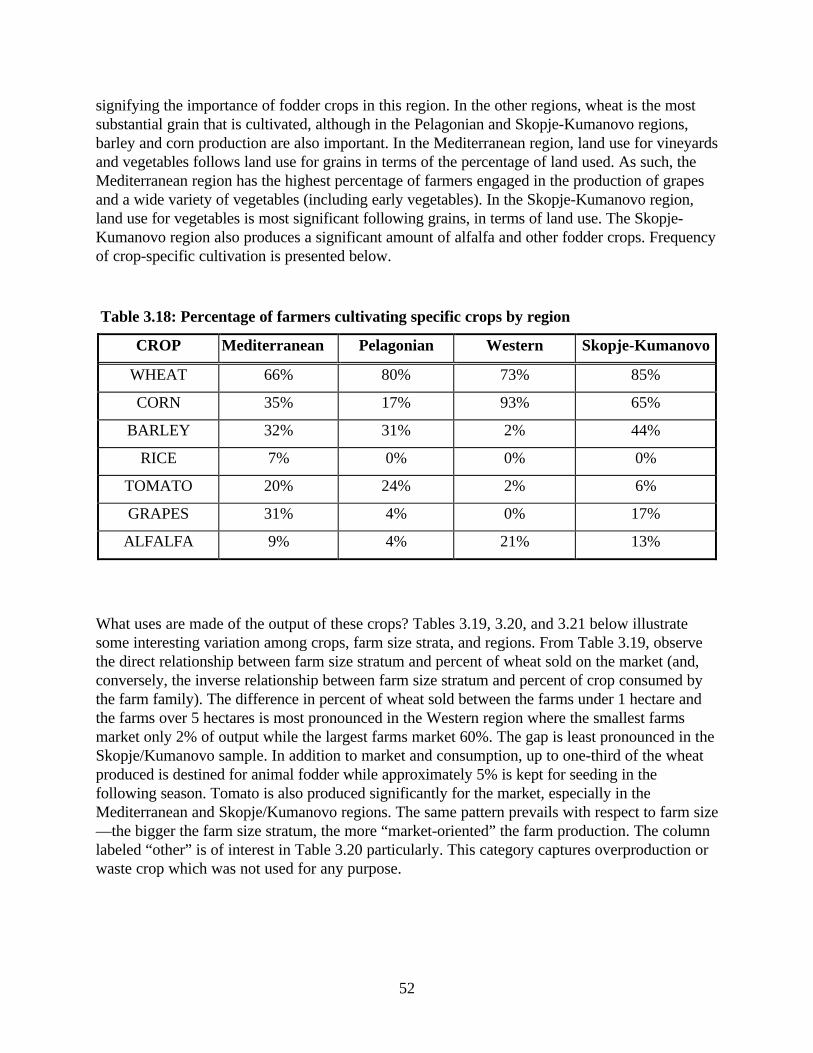
52
signifying the importance of fodder crops in this region. In the other regions, wheat is the mostsubstantial grain that is cultivated, although in the Pelagonian and Skopje-Kumanovo regions,barley and corn production are also important. In the Mediterranean region, land use for vineyardsand vegetables follows land use for grains in terms of the percentage of land used. As such, theMediterranean region has the highest percentage of farmers engaged in the production of grapesand a wide variety of vegetables (including early vegetables). In the Skopje-Kumanovo region,land use for vegetables is most significant following grains, in terms of land use. The Skopje-Kumanovo region also produces a significant amount of alfalfa and other fodder crops. Frequencyof crop-specific cultivation is presented below.
Table 3.18: Percentage of farmers cultivating specific crops by region
CROP Mediterranean Pelagonian Western Skopje-Kumanovo
WHEAT 66% 80% 73% 85%
CORN 35% 17% 93% 65%
BARLEY 32% 31% 2% 44%
RICE 7% 0% 0% 0%
TOMATO 20% 24% 2% 6%
GRAPES 31% 4% 0% 17%
ALFALFA 9% 4% 21% 13%
What uses are made of the output of these crops? Tables 3.19, 3.20, and 3.21 below illustratesome interesting variation among crops, farm size strata, and regions. From Table 3.19, observethe direct relationship between farm size stratum and percent of wheat sold on the market (and,conversely, the inverse relationship between farm size stratum and percent of crop consumed bythe farm family). The difference in percent of wheat sold between the farms under 1 hectare andthe farms over 5 hectares is most pronounced in the Western region where the smallest farmsmarket only 2% of output while the largest farms market 60%. The gap is least pronounced in theSkopje/Kumanovo sample. In addition to market and consumption, up to one-third of the wheatproduced is destined for animal fodder while approximately 5% is kept for seeding in thefollowing season. Tomato is also produced significantly for the market, especially in theMediterranean and Skopje/Kumanovo regions. The same pattern prevails with respect to farm size—the bigger the farm size stratum, the more “market-oriented” the farm production. The columnlabeled “other” is of interest in Table 3.20 particularly. This category captures overproduction orwaste crop which was not used for any purpose.
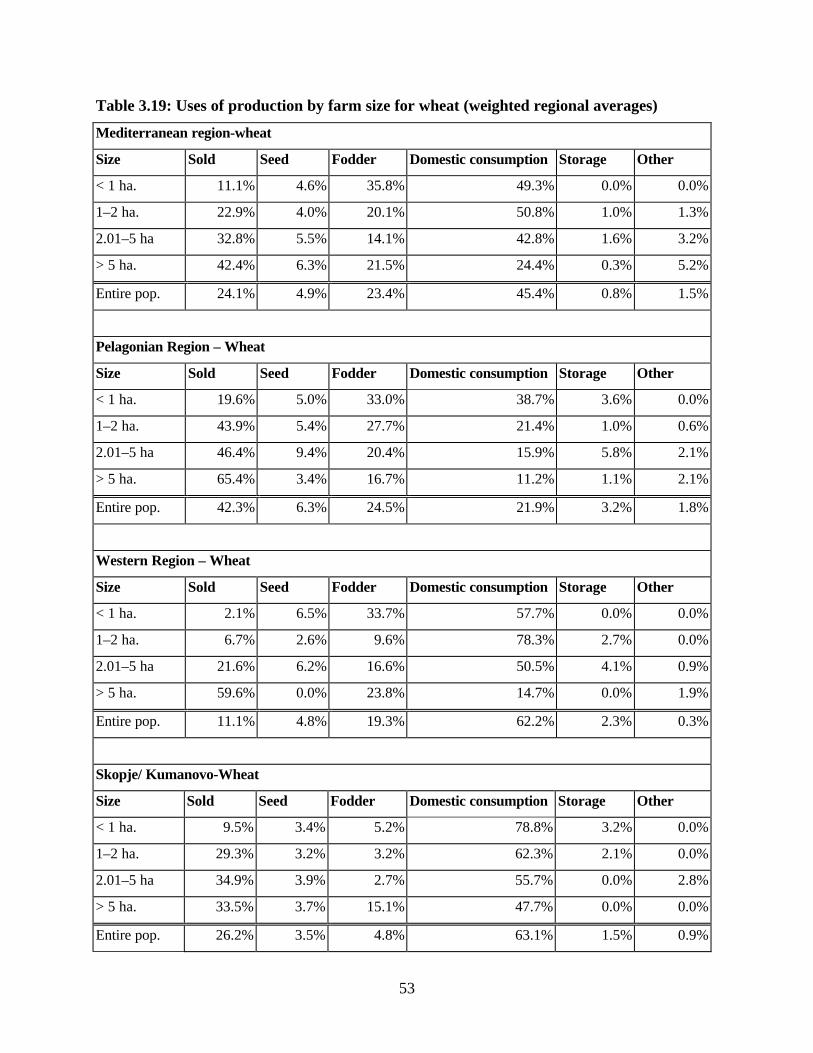
53
Table 3.19: Uses of production by farm size for wheat (weighted regional averages)
Mediterranean region-wheat
Size Sold Seed Fodder Domestic consumption Storage Other
< 1 ha. 11.1% 4.6% 35.8% 49.3% 0.0% 0.0%
1–2 ha. 22.9% 4.0% 20.1% 50.8% 1.0% 1.3%
2.01–5 ha 32.8% 5.5% 14.1% 42.8% 1.6% 3.2%
> 5 ha. 42.4% 6.3% 21.5% 24.4% 0.3% 5.2%
Entire pop. 24.1% 4.9% 23.4% 45.4% 0.8% 1.5%
Pelagonian Region – Wheat
Size Sold Seed Fodder Domestic consumption Storage Other
< 1 ha. 19.6% 5.0% 33.0% 38.7% 3.6% 0.0%
1–2 ha. 43.9% 5.4% 27.7% 21.4% 1.0% 0.6%
2.01–5 ha 46.4% 9.4% 20.4% 15.9% 5.8% 2.1%
> 5 ha. 65.4% 3.4% 16.7% 11.2% 1.1% 2.1%
Entire pop. 42.3% 6.3% 24.5% 21.9% 3.2% 1.8%
Western Region – Wheat
Size Sold Seed Fodder Domestic consumption Storage Other
< 1 ha. 2.1% 6.5% 33.7% 57.7% 0.0% 0.0%
1–2 ha. 6.7% 2.6% 9.6% 78.3% 2.7% 0.0%
2.01–5 ha 21.6% 6.2% 16.6% 50.5% 4.1% 0.9%
> 5 ha. 59.6% 0.0% 23.8% 14.7% 0.0% 1.9%
Entire pop. 11.1% 4.8% 19.3% 62.2% 2.3% 0.3%
Skopje/ Kumanovo-Wheat
Size Sold Seed Fodder Domestic consumption Storage Other
< 1 ha. 9.5% 3.4% 5.2% 78.8% 3.2% 0.0%
1–2 ha. 29.3% 3.2% 3.2% 62.3% 2.1% 0.0%
2.01–5 ha 34.9% 3.9% 2.7% 55.7% 0.0% 2.8%
> 5 ha. 33.5% 3.7% 15.1% 47.7% 0.0% 0.0%
Entire pop. 26.2% 3.5% 4.8% 63.1% 1.5% 0.9%
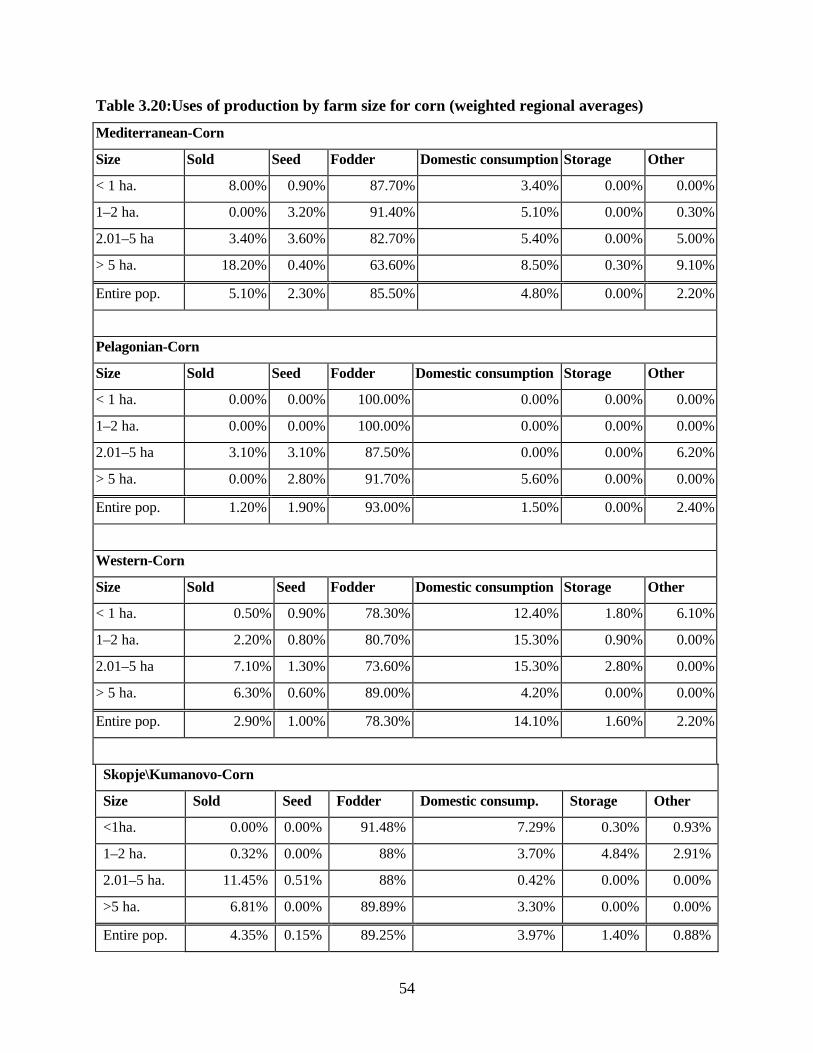
54
Table 3.20:Uses of production by farm size for corn (weighted regional averages)
Mediterranean-Corn
Size Sold Seed Fodder Domestic consumption Storage Other
< 1 ha. 8.00% 0.90% 87.70% 3.40% 0.00% 0.00%
1–2 ha. 0.00% 3.20% 91.40% 5.10% 0.00% 0.30%
2.01–5 ha 3.40% 3.60% 82.70% 5.40% 0.00% 5.00%
> 5 ha. 18.20% 0.40% 63.60% 8.50% 0.30% 9.10%
Entire pop. 5.10% 2.30% 85.50% 4.80% 0.00% 2.20%
Pelagonian-Corn
Size Sold Seed Fodder Domestic consumption Storage Other
< 1 ha. 0.00% 0.00% 100.00% 0.00% 0.00% 0.00%
1–2 ha. 0.00% 0.00% 100.00% 0.00% 0.00% 0.00%
2.01–5 ha 3.10% 3.10% 87.50% 0.00% 0.00% 6.20%
> 5 ha. 0.00% 2.80% 91.70% 5.60% 0.00% 0.00%
Entire pop. 1.20% 1.90% 93.00% 1.50% 0.00% 2.40%
Western-Corn
Size Sold Seed Fodder Domestic consumption Storage Other
< 1 ha. 0.50% 0.90% 78.30% 12.40% 1.80% 6.10%
1–2 ha. 2.20% 0.80% 80.70% 15.30% 0.90% 0.00%
2.01–5 ha 7.10% 1.30% 73.60% 15.30% 2.80% 0.00%
> 5 ha. 6.30% 0.60% 89.00% 4.20% 0.00% 0.00%
Entire pop. 2.90% 1.00% 78.30% 14.10% 1.60% 2.20%
Skopje\Kumanovo-Corn
Size Sold Seed Fodder Domestic consump. Storage Other
<1ha. 0.00% 0.00% 91.48% 7.29% 0.30% 0.93%
1–2 ha. 0.32% 0.00% 88% 3.70% 4.84% 2.91%
2.01–5 ha. 11.45% 0.51% 88% 0.42% 0.00% 0.00%
>5 ha. 6.81% 0.00% 89.89% 3.30% 0.00% 0.00%
Entire pop. 4.35% 0.15% 89.25% 3.97% 1.40% 0.88%
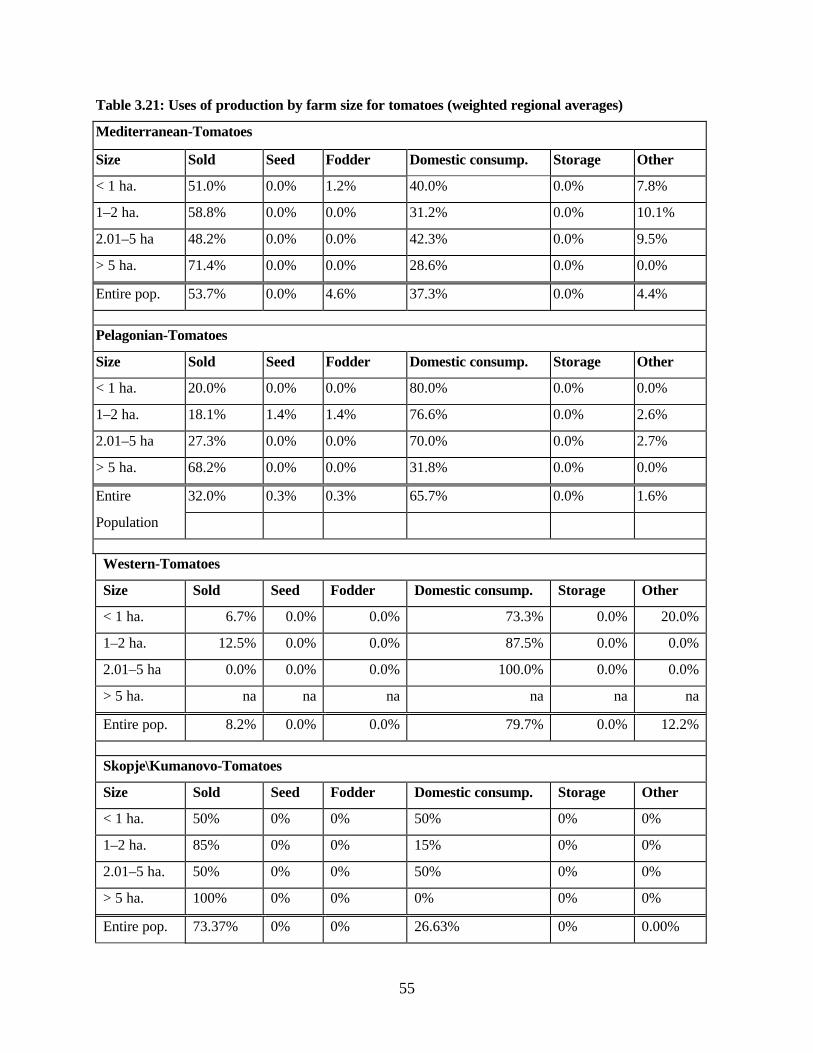
55
Table 3.21: Uses of production by farm size for tomatoes (weighted regional averages)
Mediterranean-Tomatoes
Size Sold Seed Fodder Domestic consump. Storage Other
< 1 ha. 51.0% 0.0% 1.2% 40.0% 0.0% 7.8%
1–2 ha. 58.8% 0.0% 0.0% 31.2% 0.0% 10.1%
2.01–5 ha 48.2% 0.0% 0.0% 42.3% 0.0% 9.5%
> 5 ha. 71.4% 0.0% 0.0% 28.6% 0.0% 0.0%
Entire pop. 53.7% 0.0% 4.6% 37.3% 0.0% 4.4%
Pelagonian-Tomatoes
Size Sold Seed Fodder Domestic consump. Storage Other
< 1 ha. 20.0% 0.0% 0.0% 80.0% 0.0% 0.0%
1–2 ha. 18.1% 1.4% 1.4% 76.6% 0.0% 2.6%
2.01–5 ha 27.3% 0.0% 0.0% 70.0% 0.0% 2.7%
> 5 ha. 68.2% 0.0% 0.0% 31.8% 0.0% 0.0%
Entire 32.0% 0.3% 0.3% 65.7% 0.0% 1.6%
Population
Western-Tomatoes
Size Sold Seed Fodder Domestic consump. Storage Other
< 1 ha. 6.7% 0.0% 0.0% 73.3% 0.0% 20.0%
1–2 ha. 12.5% 0.0% 0.0% 87.5% 0.0% 0.0%
2.01–5 ha 0.0% 0.0% 0.0% 100.0% 0.0% 0.0%
> 5 ha. na na na na na na
Entire pop. 8.2% 0.0% 0.0% 79.7% 0.0% 12.2%
Skopje\Kumanovo-Tomatoes
Size Sold Seed Fodder Domestic consump. Storage Other
< 1 ha. 50% 0% 0% 50% 0% 0%
1–2 ha. 85% 0% 0% 15% 0% 0%
2.01–5 ha. 50% 0% 0% 50% 0% 0%
> 5 ha. 100% 0% 0% 0% 0% 0%
Entire pop. 73.37% 0% 0% 26.63% 0% 0.00%
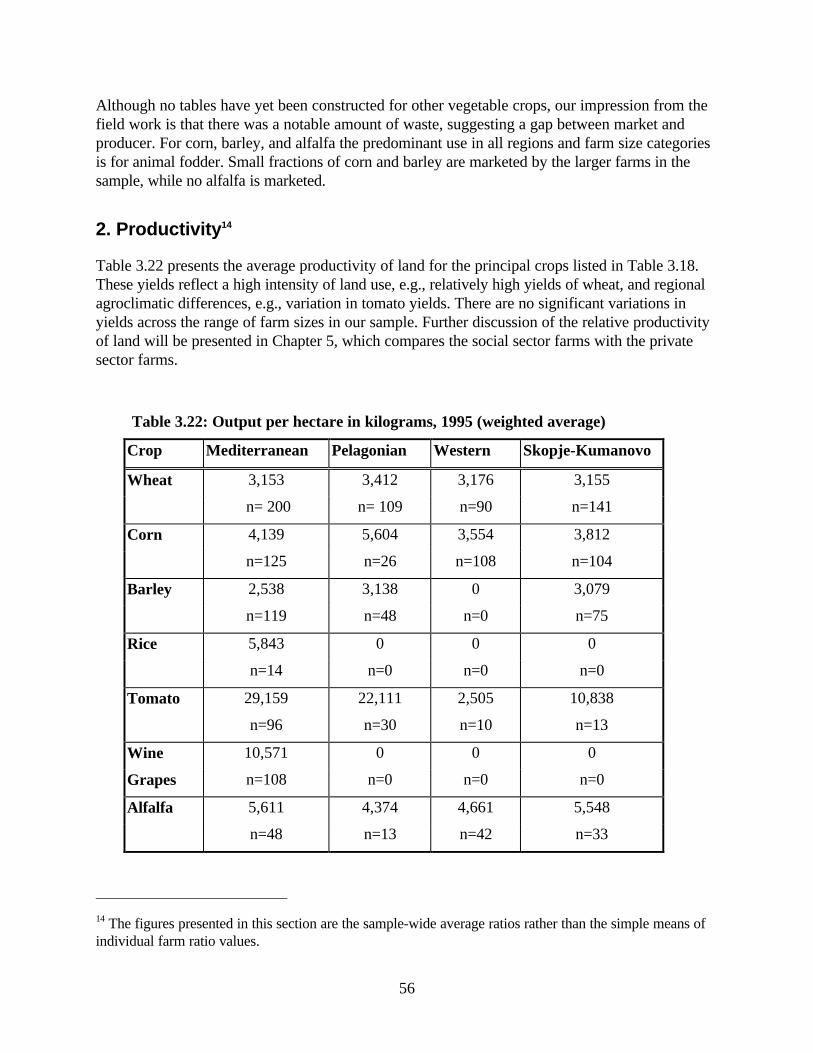
56
Although no tables have yet been constructed for other vegetable crops, our impression from thefield work is that there was a notable amount of waste, suggesting a gap between market andproducer. For corn, barley, and alfalfa the predominant use in all regions and farm size categoriesis for animal fodder. Small fractions of corn and barley are marketed by the larger farms in thesample, while no alfalfa is marketed.
2. Productivity14
Table 3.22 presents the average productivity of land for the principal crops listed in Table 3.18.These yields reflect a high intensity of land use, e.g., relatively high yields of wheat, and regionalagroclimatic differences, e.g., variation in tomato yields. There are no significant variations inyields across the range of farm sizes in our sample. Further discussion of the relative productivityof land will be presented in Chapter 5, which compares the social sector farms with the privatesector farms.
Table 3.22: Output per hectare in kilograms, 1995 (weighted average)
Crop Mediterranean Pelagonian Western Skopje-Kumanovo
Wheat 3,153 3,412 3,176 3,155
n= 200 n= 109 n=90 n=141
Corn 4,139 5,604 3,554 3,812
n=125 n=26 n=108 n=104
Barley 2,538 3,138 0 3,079
n=119 n=48 n=0 n=75
Rice 5,843 0 0 0
n=14 n=0 n=0 n=0
Tomato 29,159 22,111 2,505 10,838
n=96 n=30 n=10 n=13
Wine 10,571 0 0 0
Grapes n=108 n=0 n=0 n=0
Alfalfa 5,611 4,374 4,661 5,548
n=48 n=13 n=42 n=33
14 The figures presented in this section are the sample-wide average ratios rather than the simple means ofindividual farm ratio values.
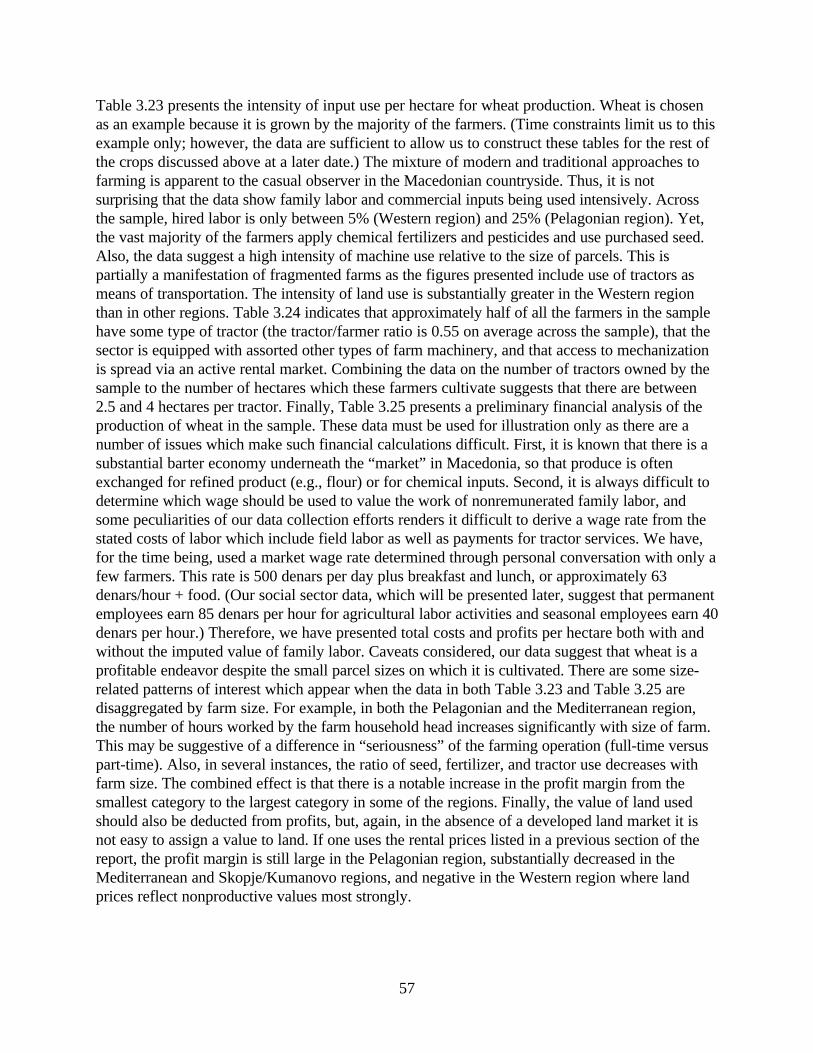
57
Table 3.23 presents the intensity of input use per hectare for wheat production. Wheat is chosenas an example because it is grown by the majority of the farmers. (Time constraints limit us to thisexample only; however, the data are sufficient to allow us to construct these tables for the rest ofthe crops discussed above at a later date.) The mixture of modern and traditional approaches tofarming is apparent to the casual observer in the Macedonian countryside. Thus, it is notsurprising that the data show family labor and commercial inputs being used intensively. Acrossthe sample, hired labor is only between 5% (Western region) and 25% (Pelagonian region). Yet,the vast majority of the farmers apply chemical fertilizers and pesticides and use purchased seed.Also, the data suggest a high intensity of machine use relative to the size of parcels. This ispartially a manifestation of fragmented farms as the figures presented include use of tractors asmeans of transportation. The intensity of land use is substantially greater in the Western regionthan in other regions. Table 3.24 indicates that approximately half of all the farmers in the samplehave some type of tractor (the tractor/farmer ratio is 0.55 on average across the sample), that thesector is equipped with assorted other types of farm machinery, and that access to mechanizationis spread via an active rental market. Combining the data on the number of tractors owned by thesample to the number of hectares which these farmers cultivate suggests that there are between2.5 and 4 hectares per tractor. Finally, Table 3.25 presents a preliminary financial analysis of theproduction of wheat in the sample. These data must be used for illustration only as there are anumber of issues which make such financial calculations difficult. First, it is known that there is asubstantial barter economy underneath the “market” in Macedonia, so that produce is oftenexchanged for refined product (e.g., flour) or for chemical inputs. Second, it is always difficult todetermine which wage should be used to value the work of nonremunerated family labor, andsome peculiarities of our data collection efforts renders it difficult to derive a wage rate from thestated costs of labor which include field labor as well as payments for tractor services. We have,for the time being, used a market wage rate determined through personal conversation with only afew farmers. This rate is 500 denars per day plus breakfast and lunch, or approximately 63denars/hour + food. (Our social sector data, which will be presented later, suggest that permanentemployees earn 85 denars per hour for agricultural labor activities and seasonal employees earn 40denars per hour.) Therefore, we have presented total costs and profits per hectare both with andwithout the imputed value of family labor. Caveats considered, our data suggest that wheat is aprofitable endeavor despite the small parcel sizes on which it is cultivated. There are some size-related patterns of interest which appear when the data in both Table 3.23 and Table 3.25 aredisaggregated by farm size. For example, in both the Pelagonian and the Mediterranean region,the number of hours worked by the farm household head increases significantly with size of farm.This may be suggestive of a difference in “seriousness” of the farming operation (full-time versuspart-time). Also, in several instances, the ratio of seed, fertilizer, and tractor use decreases withfarm size. The combined effect is that there is a notable increase in the profit margin from thesmallest category to the largest category in some of the regions. Finally, the value of land usedshould also be deducted from profits, but, again, in the absence of a developed land market it isnot easy to assign a value to land. If one uses the rental prices listed in a previous section of thereport, the profit margin is still large in the Pelagonian region, substantially decreased in theMediterranean and Skopje/Kumanovo regions, and negative in the Western region where landprices reflect nonproductive values most strongly.
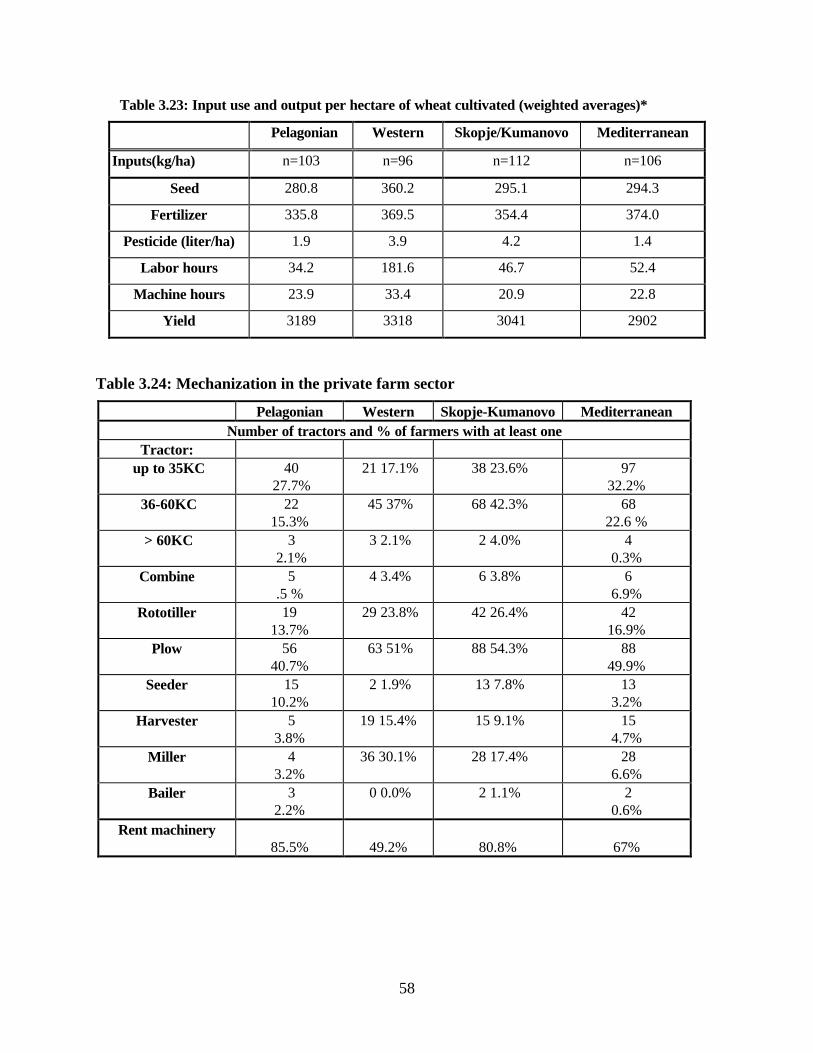
58
Table 3.23: Input use and output per hectare of wheat cultivated (weighted averages)*
Pelagonian Western Skopje/Kumanovo Mediterranean
Inputs(kg/ha) n=103 n=96 n=112 n=106
Seed 280.8 360.2 295.1 294.3
Fertilizer 335.8 369.5 354.4 374.0
Pesticide (liter/ha) 1.9 3.9 4.2 1.4
Labor hours 34.2 181.6 46.7 52.4
Machine hours 23.9 33.4 20.9 22.8
Yield 3189 3318 3041 2902
Table 3.24: Mechanization in the private farm sector
Pelagonian Western Skopje-Kumanovo MediterraneanNumber of tractors and % of farmers with at least one
Tractor: up to 35KC 40
27.7% 21 17.1% 38 23.6% 97
32.2% 36-60KC 22
15.3% 45 37% 68 42.3% 68
22.6 % > 60KC 3
2.1% 3 2.1% 2 4.0% 4
0.3%Combine 5
.5 % 4 3.4% 6 3.8% 6
6.9%Rototiller 19
13.7% 29 23.8% 42 26.4% 42
16.9%Plow 56
40.7% 63 51% 88 54.3% 88
49.9%Seeder 15
10.2% 2 1.9% 13 7.8% 13
3.2%Harvester 5
3.8%19 15.4% 15 9.1% 15
4.7%Miller 4
3.2%36 30.1% 28 17.4% 28
6.6%Bailer 3
2.2% 0 0.0% 2 1.1% 2
0.6%Rent machinery
85.5% 49.2% 80.8% 67%
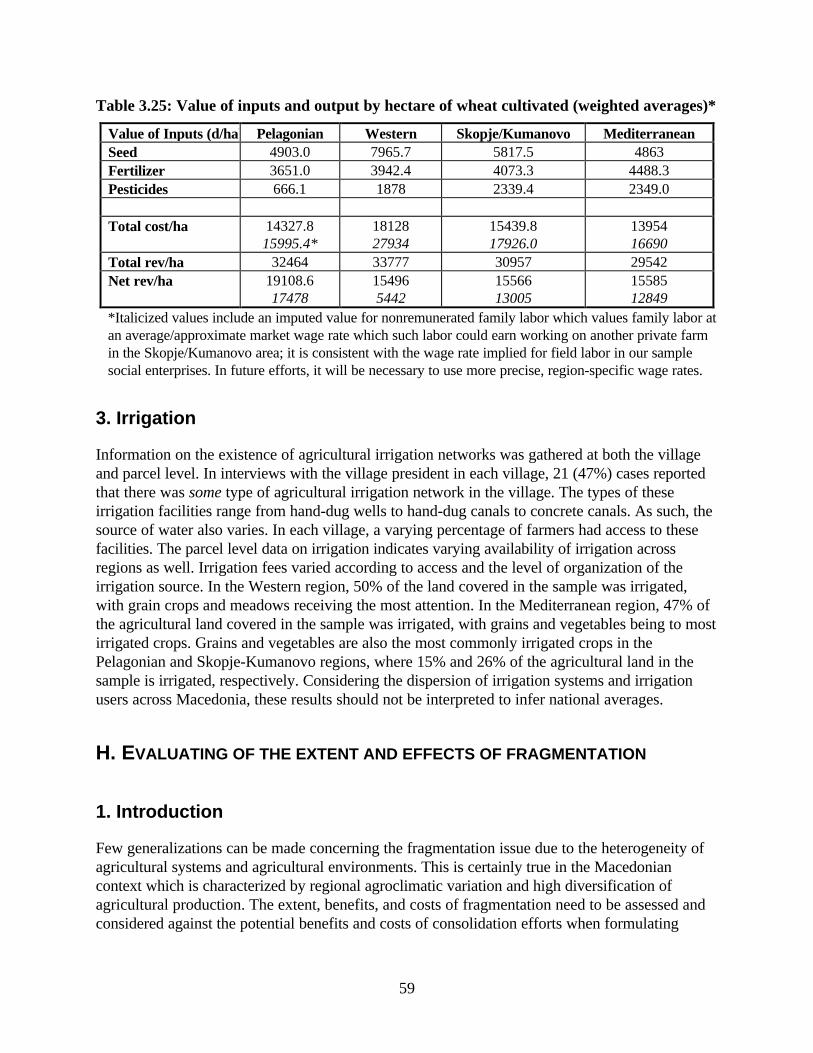
59
Table 3.25: Value of inputs and output by hectare of wheat cultivated (weighted averages)*
Value of Inputs (d/ha) Pelagonian Western Skopje/Kumanovo MediterraneanSeed 4903.0 7965.7 5817.5 4863Fertilizer 3651.0 3942.4 4073.3 4488.3Pesticides 666.1 1878 2339.4 2349.0
Total cost/ha 14327.815995.4*
1812827934
15439.817926.0
1395416690
Total rev/ha 32464 33777 30957 29542Net rev/ha 19108.6
17478154965442
1556613005
1558512849
*Italicized values include an imputed value for nonremunerated family labor which values family labor atan average/approximate market wage rate which such labor could earn working on another private farmin the Skopje/Kumanovo area; it is consistent with the wage rate implied for field labor in our samplesocial enterprises. In future efforts, it will be necessary to use more precise, region-specific wage rates.
3. Irrigation
Information on the existence of agricultural irrigation networks was gathered at both the villageand parcel level. In interviews with the village president in each village, 21 (47%) cases reportedthat there was some type of agricultural irrigation network in the village. The types of theseirrigation facilities range from hand-dug wells to hand-dug canals to concrete canals. As such, thesource of water also varies. In each village, a varying percentage of farmers had access to thesefacilities. The parcel level data on irrigation indicates varying availability of irrigation acrossregions as well. Irrigation fees varied according to access and the level of organization of theirrigation source. In the Western region, 50% of the land covered in the sample was irrigated,with grain crops and meadows receiving the most attention. In the Mediterranean region, 47% ofthe agricultural land covered in the sample was irrigated, with grains and vegetables being to mostirrigated crops. Grains and vegetables are also the most commonly irrigated crops in thePelagonian and Skopje-Kumanovo regions, where 15% and 26% of the agricultural land in thesample is irrigated, respectively. Considering the dispersion of irrigation systems and irrigationusers across Macedonia, these results should not be interpreted to infer national averages.
H. EVALUATING OF THE EXTENT AND EFFECTS OF FRAGMENTATION
1. Introduction
Few generalizations can be made concerning the fragmentation issue due to the heterogeneity ofagricultural systems and agricultural environments. This is certainly true in the Macedoniancontext which is characterized by regional agroclimatic variation and high diversification ofagricultural production. The extent, benefits, and costs of fragmentation need to be assessed andconsidered against the potential benefits and costs of consolidation efforts when formulating
60
agrarian strategy. A complete literature review of the fragmentation issue is presented inAppendix 6.
2. Fragmentation in Macedonia
Fragmentation has been defined as the phenomenon of agricultural land distributed in undersizedholdings as well as holdings that consist of noncontiguous and spatially dispersed plots of land.Both types of fragmentation exist in Macedonia. In general, farmers are operating on verysmallholdings which are composed of numerous, spatially dispersed parcels.
3. Causes of fragmentation
In Macedonia, the major causes of fragmentation are cited as being partial inheritance, landshortage (in certain regions), and political and historical legacy. The political and historical originsof land tenure arrangements in Macedonia are discussed in the introductory component of thisreport. Traditional inheritance practices of transferring property equally to all children (or at leastto all sons) in each generation has, over time, divided land in Macedonia into increasingly smallerholdings. The extent to which inheritance has fragmented actual parcels is difficult to determine asthe division of a holding does not necessarily imply the division of individual parcels. The LandUse Law of 1986 prohibits the subdivision of parcels under 6 dekars, but this provision has sincebeen declared unconstitutional. The division of parcels continues in practice due to differences inland quality and location. The influence of inheritance on fragmentation has been reduced by thejoint operation of separately inherited holdings, the redistribution of land among families by gift,lease, or purchase, and land market transactions with other farmers.
The sources of fragmentation which are somewhat influenced by historical and political legacyrelate to the collectivization process and the formation of cooperative farms after World War II.During this period (described in detail in Chapter 2 and earlier in this chapter), land in excess ofthe 10 hectare limit to private ownership became part of the area’s cooperative farm. Althoughthis legal limit to landholdings is no longer in effect, it has made a significant impact on the sizestructure of family farms. The extent to which fragmentation continues to exist as a result of landshortage is also difficult to determine due to relatively low levels of land market activity. Whilethe origin of fragmentation will vary and is often disputed, the advantages and disadvantages offragmentation may be analyzed independently of the source of fragmentation (Simmons 1987).
4. Advantages and disadvantages of fragmentation
Disadvantages:
In the small-scale private agricultural sector in Macedonia, the most common and frequently citeddisadvantages of fragmentation include increased labor costs, increased transportation time andcost, land lost to border markings and access roads, and difficulty in accessing the parcels. Highlevels of fragmentation also have the effect of limiting access to irrigation networks and reducingthe effectiveness of mechanization. The potential public costs of fragmentation in Macedoniainclude low levels of production and difficulty in organizing regional agricultural strategy. For the
61
purposes of this report, the negative effect of fragmentation has been evaluated in terms of itseffect on agricultural productivity in the small-scale private farm sector. These results arepresented separately in this chapter.
Advantages:
The advantages of fragmentation in Macedonia are related to the ability of farmers to disperse riskby cultivating a diverse variety of crops on numerous plots, each with distinct characteristics. Thewide variety of agricultural environments and microclimates in Macedonia allows for a highdiversification of production, with approximately 50 different varieties of fruits, vegetables,grains, and industrial crops being cultivated. This diversity of production is directly related tovariations in agricultural microclimates, and fragmentation is a mechanism which allows farmersto benefit from these variations. For example, in Ciflik, in the municipality of Kochani, farmers areable to cultivate wheat on the north side of the village, and rice on the south side of the villagewhere a network of irrigation canals exists. By owning parcels which are located on either side ofthe village, farmers are able to reduce the risk of crop failure, crop damage, and marketdisruptions.
In terms of crop scheduling, fragmentation allows farmers to grow a variety of crops, includingcrops that mature and ripen at different times. Such a form of crop scheduling allows farmers toconcentrate their labor on different plots, at different times, thereby avoiding household laborbottlenecks. Farmers in Macedonia appear to benefit from these variations as nearly 90% offarmers in the sample reported that they plan their crops according to variations in parcelcharacteristics. Farmers interviewed have also mentioned a reduction in weather damage to cropson account of their ability to plant different (or the same) crops in different places. Theseadvantages reduce some of the costs of fragmentation, although the additional time and costs oftransportation are always present.
In addition to risk management and reduction through crop diversification, fragmentation mayoffer social (noneconomic) benefits. Inheritance, which is noted as being a cause of fragmentation,has social goals in addition to those of maximizing production. This is evident in the Macedoniancontext by the existence of civil code which allows for three types of land transfer during life: giftcontract, lifetime support contract, and contract for the distribution of property during lifetime.From this perspective, inheritance does not imply fragmentation. Inheritance in all of its forms canbe interpreted as an institution which allows farmers to meet the economic as well as the socialgoals of the agricultural system.
5. Degree of fragmentation
There are six parameters used to identify the degree of fragmentation: farm size (total holdings),plot number, plot size, plot shape, spatial distribution of plots, and the size distribution of theplots. Four of these parameters were used to assess the degree of fragmentation among theprivate small-scale farm sector in Macedonia: farm operation size (including rented land),plot size,plot number, and distance.
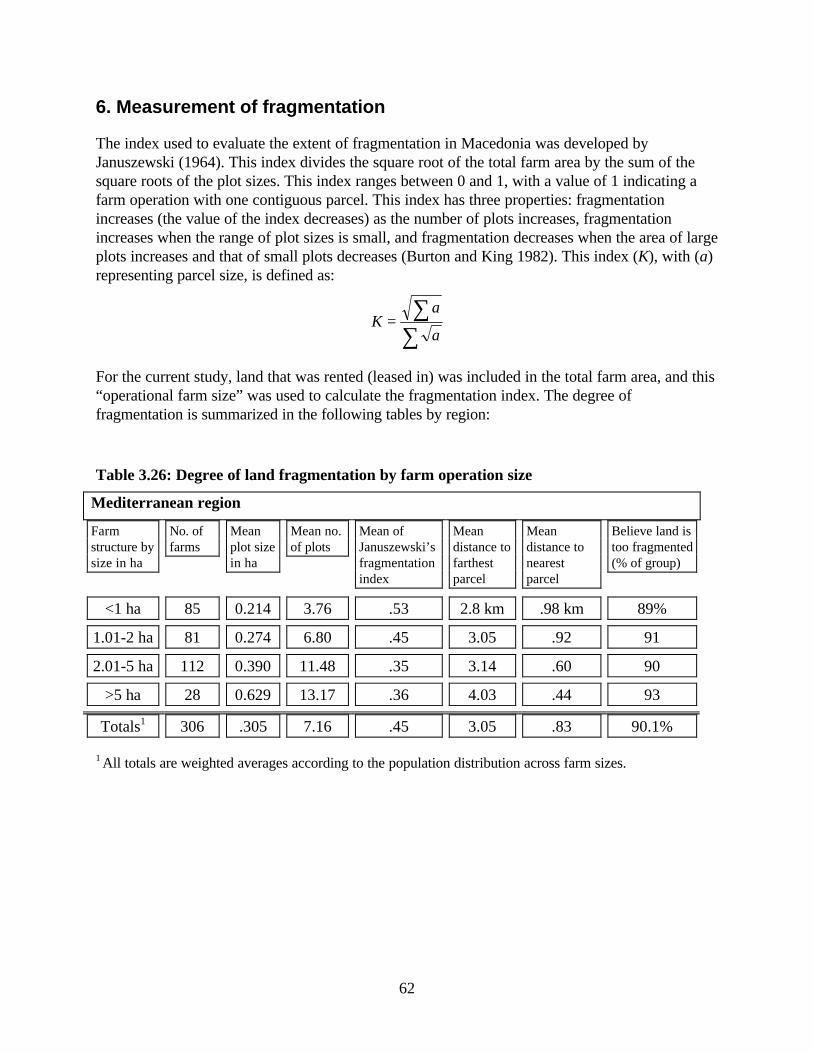
62
6. Measurement of fragmentation
The index used to evaluate the extent of fragmentation in Macedonia was developed byJanuszewski (1964). This index divides the square root of the total farm area by the sum of thesquare roots of the plot sizes. This index ranges between 0 and 1, with a value of 1 indicating afarm operation with one contiguous parcel. This index has three properties: fragmentationincreases (the value of the index decreases) as the number of plots increases, fragmentationincreases when the range of plot sizes is small, and fragmentation decreases when the area of largeplots increases and that of small plots decreases (Burton and King 1982). This index (K), with (a)representing parcel size, is defined as:
Ka
a=
∑∑
For the current study, land that was rented (leased in) was included in the total farm area, and this“operational farm size” was used to calculate the fragmentation index. The degree offragmentation is summarized in the following tables by region:
Table 3.26: Degree of land fragmentation by farm operation size
Mediterranean region
Farmstructure bysize in ha
No. offarms
Meanplot sizein ha
Mean no.of plots
Mean ofJanuszewski’sfragmentationindex
Meandistance tofarthestparcel
Meandistance tonearestparcel
Believe land istoo fragmented(% of group)
<1 ha 85 0.214 3.76 .53 2.8 km .98 km 89%
1.01-2 ha 81 0.274 6.80 .45 3.05 .92 91
2.01-5 ha 112 0.390 11.48 .35 3.14 .60 90
>5 ha 28 0.629 13.17 .36 4.03 .44 93
Totals1 306 .305 7.16 .45 3.05 .83 90.1%
1 All totals are weighted averages according to the population distribution across farm sizes.
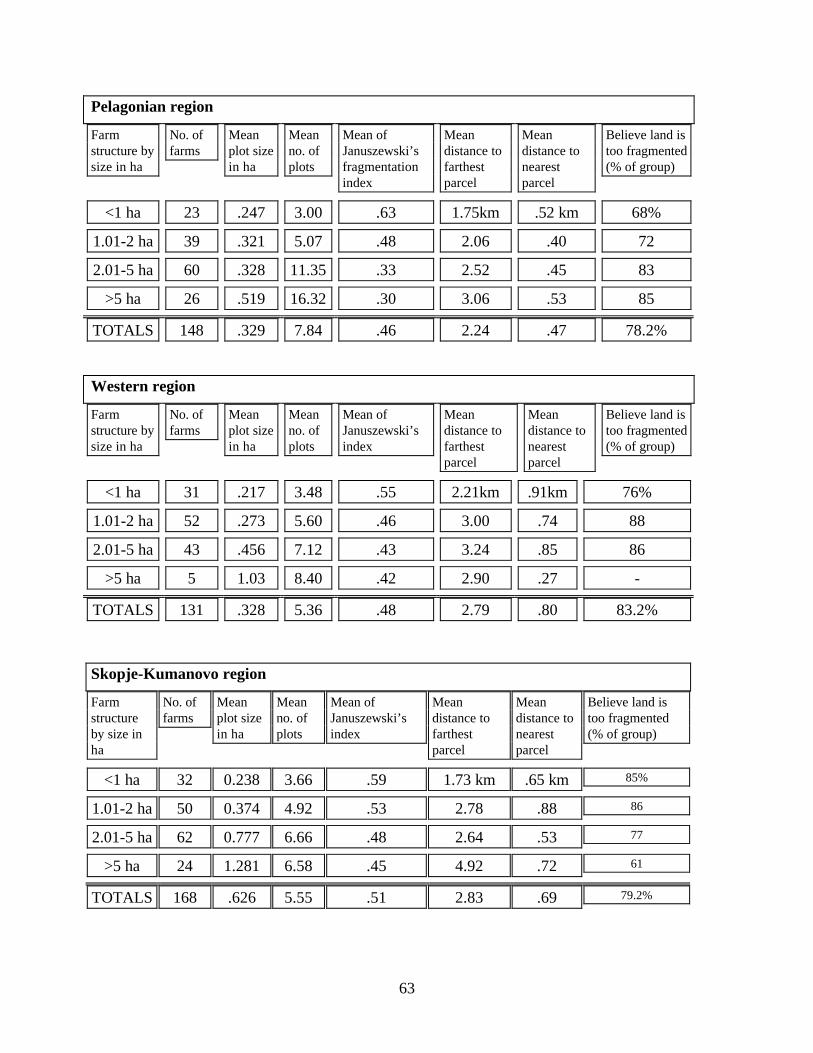
63
Pelagonian region
Farmstructure bysize in ha
No. offarms
Meanplot sizein ha
Meanno. ofplots
Mean ofJanuszewski’sfragmentationindex
Meandistance tofarthestparcel
Meandistance tonearestparcel
Believe land istoo fragmented(% of group)
<1 ha 23 .247 3.00 .63 1.75km .52 km 68%
1.01-2 ha 39 .321 5.07 .48 2.06 .40 72
2.01-5 ha 60 .328 11.35 .33 2.52 .45 83
>5 ha 26 .519 16.32 .30 3.06 .53 85
TOTALS 148 .329 7.84 .46 2.24 .47 78.2%
Western region
Farmstructure bysize in ha
No. offarms
Meanplot sizein ha
Meanno. ofplots
Mean ofJanuszewski’sindex
Meandistance tofarthestparcel
Meandistance tonearestparcel
Believe land istoo fragmented(% of group)
<1 ha 31 .217 3.48 .55 2.21km .91km 76%
1.01-2 ha 52 .273 5.60 .46 3.00 .74 88
2.01-5 ha 43 .456 7.12 .43 3.24 .85 86
>5 ha 5 1.03 8.40 .42 2.90 .27 -
TOTALS 131 .328 5.36 .48 2.79 .80 83.2%
Skopje-Kumanovo region
Farmstructureby size inha
No. offarms
Meanplot sizein ha
Meanno. ofplots
Mean ofJanuszewski’sindex
Meandistance tofarthestparcel
Meandistance tonearestparcel
Believe land istoo fragmented(% of group)
<1 ha 32 0.238 3.66 .59 1.73 km .65 km 85%
1.01-2 ha 50 0.374 4.92 .53 2.78 .88 86
2.01-5 ha 62 0.777 6.66 .48 2.64 .53 77
>5 ha 24 1.281 6.58 .45 4.92 .72 61
TOTALS 168 .626 5.55 .51 2.83 .69 79.2%
64
Farms are categorized by size consistent with the methodology used to draw the sample. Mostimportantly, according to the fragmentation index, all holdings in all regions and in all ranges offarm sizes are considerably fragmented. As the Januszewski index does not account for distance,the above tables include the average distance to the farthest and nearest parcels. The evidencesuggests that the distance parameter further contributes to the high degree of fragmentation as theaverage one-way distance to the farthest parcel is over 2 kilometers for each of the regionssampled. Farmer opinion also coincides with these results as approximately 84% of all farmersinterviewed in Macedonia believe that the land is too fragmented.
The average (mean) plot size is increasing as the size of the farm operation increases, and thisincrease is statistically significant between most farm size groups for all of the regions. However,the level of fragmentation is also significantly increasing from the smallest to the largest holdingcategories across all regions. Thus, any reduction in the level of fragmentation from the increasein average parcel size for the farms over 5 hectares is offset by the addition of noncontiguousparcels to the holding. These results are important as they reveal that the largest farms, those withthe highest level of agricultural output (both produced and marketed), are operating under thegreatest degree of fragmentation. In the Pelagonian region, fragmentation among the largest farmsis most severe; the average parcel size is just over .5 hectares with farmers operating on anaverage of over 16 parcels. Nonetheless, the weighted average of the fragmentation index doesnot vary much across regions.
7. Effect of fragmentation on agricultural productivity
Strictly as a first attempt to evaluate the impact of fragmentation of production, simple correlationcoefficients were estimated between the fragmentation index and yield and the per hectare costsand per hectare profits in wheat production. It is essential that further work be done to link thefragmentation to overall enterprise productivity and not just that of a single crop. In thePelagonian and Mediterranean regions, no significant correlation was observed. In the Westernregion, the index of fragmentation is negatively and significantly correlated with wheat yields andper hectare production costs. In the Skopje-Kumanovo region, the index correlates significantlybut positively with costs of production and negatively with profits. This could reflect thecombination of the positive relation between farm size and index, on one hand, and a possible qualitativechange in the package of inputs used in the larger farms.
I. AGRICULTURAL MARKETING
1. Output markets
In conversation, most farmers made great emphasis on the lack of a market for their agriculturaloutput. From the entire sample, 90% of the farmers responded that the purchase of agriculturalproducts has been irregular in recent years. For most farmers, a “market” implies organizedpurchases (preferably by contract) for guaranteed prices. Marketing problems cited by farmersinclude a lack of buyers, low prices, and late payments. In previous years, the agrokombinats haveserved as an outlet for much of the private sector production of grains, vegetables, fruits, and
65
industrial crops including sugar beet, tobacco, and sunflower. This relationship has deteriorated asa result of the privatization and transformation process, and current purchases are characterizedby barter and late payment. Export opportunities have also suffered as the result of recent regionalpolitical events. Although the current forces of transition are expected to bring new marketopportunities, most farmers appear to be operating with great uncertainty regarding their ability tomarket their output. Also, despite the move toward the privatization of the agricultural sector, themajority of the farmers interviewed continue to believe that the government of Macedonia shouldbe responsible for the organization of agricultural marketing.
In the Mediterranean and Pelagonian regions, slightly over 20% of all wheat sales were madeunder contract with an agrokombinat. The majority of wheat sales in all regions were made withan agrokombinat without a contract. The Western region recorded the highest percentage ofwheat sales on the open market and with private traders when compared to other regions. Cropsales with a contract were almost nonexistent in the Western and Skopje-Kumanovo regions withthe exception of some tobacco sales in the Skopje area. Nearly all of the tobacco sales in theMediterranean and Pelagonian regions were made under contract, although reportedly withdelayed payment. The majority of vegetable production in all regions is sold on the open market,with the exception of the Pelagonian region, where just over half the tomato sales were madeunder contract with an agrokombinat.
Regardless of the type of sales transaction, the frequency of the transactions was very low for the1995 season. For example, in the Pelagonian region, only 60% of the farmers producing wheatactually sold it on the market. In the Skopje-Kumanovo and Western regions, only 35% and 20%of producers sold wheat on the market in 1995, respectively. Sales were more infrequent for theother grains. In the Mediterranean and Skopje-Kumanovo regions, a high percentage of vegetableproduction was marketed, although again with few transactions recorded. The marketing ofvegetables is very low in the Western region. “Specialty” crops such as watermelon andstrawberries in the Mediterranean and Skopje-Kumanovo regions, although somewhat uncertaininvestments, are marketed highly (on the open market), by their nature.
The low level of marketing opportunities has forced most households to rely on nonagriculturalsources of income, and many households produce mainly for domestic consumption. As a result,the majority of the households in the sample are considered part-time farming households by mostdefinitions. Nonetheless, the private farms which market the highest percentage of theirproduction seem to share characteristics which set them apart from subsistence or “hobby”farmers. These characteristics will be identified in further analysis intended to reclassify andexamine household structure according to market orientation.
2. Input markets
The previous relationship between the private sector and the socially owned agriculturalenterprises also allowed for the provision of seed and fertilizer inputs by sale or trade, or freeunder production contract. Many private farmers have considered these terms to be unfavorable,and new private seed, pesticide, and fertilizer suppliers are beginning to emerge. The privatetraders also seem to rely on a considerable level of barter as form of payment. Accordingly,supplies and prices of key inputs continue to vary widely throughout Macedonia. A considerable
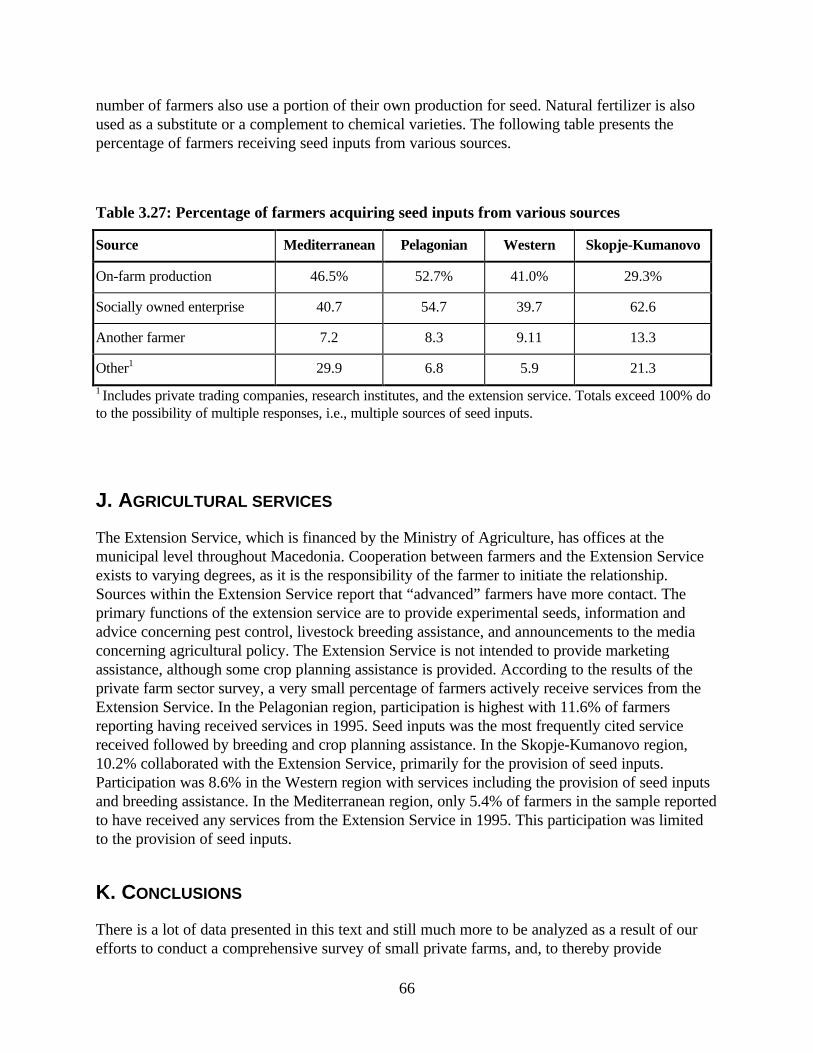
66
number of farmers also use a portion of their own production for seed. Natural fertilizer is alsoused as a substitute or a complement to chemical varieties. The following table presents thepercentage of farmers receiving seed inputs from various sources.
Table 3.27: Percentage of farmers acquiring seed inputs from various sources
Source Mediterranean Pelagonian Western Skopje-Kumanovo
On-farm production 46.5% 52.7% 41.0% 29.3%
Socially owned enterprise 40.7 54.7 39.7 62.6
Another farmer 7.2 8.3 9.11 13.3
Other1 29.9 6.8 5.9 21.3
1 Includes private trading companies, research institutes, and the extension service. Totals exceed 100% doto the possibility of multiple responses, i.e., multiple sources of seed inputs.
J. AGRICULTURAL SERVICES
The Extension Service, which is financed by the Ministry of Agriculture, has offices at themunicipal level throughout Macedonia. Cooperation between farmers and the Extension Serviceexists to varying degrees, as it is the responsibility of the farmer to initiate the relationship.Sources within the Extension Service report that “advanced” farmers have more contact. Theprimary functions of the extension service are to provide experimental seeds, information andadvice concerning pest control, livestock breeding assistance, and announcements to the mediaconcerning agricultural policy. The Extension Service is not intended to provide marketingassistance, although some crop planning assistance is provided. According to the results of theprivate farm sector survey, a very small percentage of farmers actively receive services from theExtension Service. In the Pelagonian region, participation is highest with 11.6% of farmersreporting having received services in 1995. Seed inputs was the most frequently cited servicereceived followed by breeding and crop planning assistance. In the Skopje-Kumanovo region,10.2% collaborated with the Extension Service, primarily for the provision of seed inputs.Participation was 8.6% in the Western region with services including the provision of seed inputsand breeding assistance. In the Mediterranean region, only 5.4% of farmers in the sample reportedto have received any services from the Extension Service in 1995. This participation was limitedto the provision of seed inputs.
K. CONCLUSIONS
There is a lot of data presented in this text and still much more to be analyzed as a result of ourefforts to conduct a comprehensive survey of small private farms, and, to thereby provide
67
information to feed the contemporary agrarian policy debates. Without disregard for theimportance of many of the specific details discussed above, conclusions from our analysis can bepackaged into three basic points:
(The policy content of these conclusions will be discussed in greater detail in Chapter 6).
• Fragmentation is not the primary constraint to private production in Macedonia and is not bestaddressed by regulation.
• The distinction between part-time and full-time farming (or, between consumption orientedproduction versus market/business oriented farming) needs to be clearly defined and publicsupport targeted to the latter group.
• The small private farm sector is productive but suffers from lack of access to key markets.
Fragmentation is not the primary constraint to private production in Macedonia and is not bestaddressed by regulation.
While we have documented a relatively extreme degree of fragmentation, we have alsodemonstrated that fragmentation is not uniform in origin nor in impact. Therefore, the attempt tosolve fragmentation by the use of national legislation which does not account for a variety ofsituations will not likely work, as it has not in the past in Macedonia. It is also important tohighlight the difference between farmers’ stated perceptions of fragmentation as a problem (thevast majority list fragmentation as a prime concern) and their actions toward achievingconsolidation. In the absence of market imperfections and/or cultural barriers, one would expectfarmers to move toward consolidation if the costs of fragmentation are so high. With thedevelopment of land markets and some form of decentralized initiative to assist in the process ofreallocation of property, consolidation might occur. Also, some of the demographic trendsdiscussed earlier, suggest that there should be a change in the land/man ratio in the farm sectorwithin a generation, especially in the Pelagonian region but less so in the Western region.
The distinction between part-time and full-time farming (or between consumption-orientedproduction versus market/business-oriented farming) needs to be clearly defined and pubicsupport targeted to the latter group:
By the technical definition of part-time farming used in Macedonia, part-time farmers make upvirtually the whole sector. We think that a more constructive definition can be used to distinguish“serious” farmers from gardeners and hobby farmers. The basic notion is that there seems to be agroup of competitive, market-oriented farmers who might flourish as land, credit, and productmarket imperfection are diminished. These farmers should be the subject of government efforts tostimulate production and productivity in the agricultural sector. The large number of smallerfarmers, on the other hand, which seem to cultivate primarily to help the family (extended family)economy, might not be a major concern from the perspective of agrarian policy. Note that such astatement does not deny that this group is extremely important as a safety valve during thetransition (and possibly after) for dampening the impact of macroeconomic instability, in particularfood price inflation and unemployment
The small private farm sector is productive but suffers from lack of access to key markets:
The capacity of the small farmers is constrained by lack of access to land, markets or marketing,and credit. The land market is not well developed due to historical legacy and to extant legal
68
fetters. Most farmers also have limited access to medium- and long-term credit which could beused to finance land purchase in the absence of other sources of finance such as remittances fromabroad. The legal and institutional constraints to the availability of such credit are discussed atvarious other points in this report. Some farmers also suggest that short-term credit for workingcapital prevents them from entering rental contracts, but more frequently noted is the absence ofan adequate supply of land for sale or lease. Finally, it is clear that market access and marketingare problematic. Farmers are not oriented toward producing as the market demands, do not haveaccess to information that would signal them to make appropriate choices, and, like Macedonia’seconomy in general, suffer from the impact of political problems involved in the break-up ofYugoslavia and from the impact of irrational macroeconomic policies.
69
IV: SOCIALLY OWNED15 AGRICULTURAL ENTERPRISES
A. BACKGROUND
There are over 200 socially owned enterprises which engage in agricultural production activities in allregions of the country. These farms span a wide-range of landholding sizes, with 42 having less than 50hectares and 30 having greater than 5,000 hectares of land. These farms have been the focus of almost allthe prior research efforts of the Economics Department at the Faculty of Agriculture of the University ofSts. Cyril and Methodius. Generally, this prior research reports very broad indices of productivity forspecific crops and/or for specific socially owned enterprises. Therefore, the results of these studies do notyield much information that can contribute to the contemporary policy debate. The general characteristicsof the socially owned farm sector as presented by the official data sources (Statistical Office and theMinistry of Agriculture) were presented earlier in this report. In this chapter, the methodology used for ourinvestigation of a sample of socially owned enterprises and their primary production activities is detailedand the results are presented. Reflection on the context of the investigation and the analysis of the data areprovided as a conclusion. Policy recommendations are built into the final chapter of this report.
B. SAMPLE SELECTION METHODOLOGY
For our purposes, as delineated in the introduction to this report, ten enterprises were selected to includevarying agronomic, climatic, organizational, and economic conditions. Particularly significant factors in thechoice of enterprises which we analyzed were the size of the agricultural and arable area landholdings, thefarm’s location, crop patterns, as well as the status of the records maintained within the enterprises (suchwritten records were used for collecting data and achieving the objectives of the research). Because accessto social sector data is difficult and because of the complex and uncertain situation surrounding theseenterprises currently, we chose to follow a case-study approach for a representative group of enterprisesrather than using random sampling.16
Based on these criteria, we selected the following ten enterprises which are stratified into threesize categories:
Small agricultural enterprises (with land area up to 1,000 hectares):
1. Limited Liability Company “Vardar”-Tetovo
2. Stockholding Company “Agroplod”-Resen
3. Stockholding Company “Malina”-Kriva Palanka
15 We continue to use this term because at the time of analysis these farms were known as such even thoughtechnically they have become state owned and will soon be privatized.16 It should be noted that a factor for selection of the enterprises was also the existence of prior contact withthe enterprise via prior research or otherwise. Despite this fact, the data were objectively reported to theextent that objective data existed in the farm’s records.
70
Medium agricultural enterprises (with land area of 1,000–5,000 hectares):
4. Agricultural enterprise “Dubrovo”-Negotino
5. AIK “Malesh”-Berovo
6. AIK ‘Topolchani”-Prilep
7. Agricultural Cooperative “Mosha Pijade”-Kochani
Large agricultural enterprises (with land area over 5,000 hectares):
8. AIK “Kumanovo”-Kumanovo
9. AK “Lozar”-Veles
10. AIK “Strumica”-Strumica
The location of these agricultural enterprises is determined by region. Each region has its owncharacteristics (described in the introductory chapter to this report) which were taken intoconsideration while making the choice of the representative sample.
Each enterprise was visited on multiple occasions. The first visit set the stage for implementationof the survey and to gather general enterprise descriptions. On the second visit, a detailedquestionnaire regarding the enterprises land acquisition history and its 1995 land use andproduction activities was delivered (questionnaire forms are appended to the document). A personfrom the farm’s technical managerial staff was selected to provide the responses to the questions.Further visits for review and assistance in completion of the questionnaires were conducted asneeded according to the case.
C. BRIEF DESCRIPTION OF THE SURVEYED ENTERPRISES
The ten agricultural enterprises in the sample are dispersed over the whole territory of theRepublic of Macedonia. The chosen companies differ in many characteristics (their location, size,production mix, economic results, etc.). Every company has agriculture as a substantial part of itsvocation and all of them farm on public land. This section presents a very brief outline of eachenterprise in the sample, highlighting some of its unique features:
1. “ZIK-D.O.O. Bardar-Brvenica.” The headquarters of this company is in the village Brvenica-Tetovo. The basic activity of the company is orchards. The company was formed in 1946 bycombining three smaller agricultural firms; it started out using 250 hectares of land. Over itsexistence, the company had several changes of status; in the period from 1967 through thebeginning of 1995, the company was managed by another company “Z.I.K Tetovo-Tetovo.”Today, the company has 261 hectares of land available, of which 70 hectares were purchasedfrom individual farmers in the past. There are 69 workers employed in the company.
2. “Agroplod A.D.” for production, processing, marketing, and export-import. The center of thecompany is in Resen. Of all of the analyzed companies, this one is unique because theproduction of industrial food products is its biggest source of earnings. It was formed in 1967
71
as a new company. At that time it did not have land, but with time some other agriculturalfarms were merged with the company and introduced agricultural land; the company nowowns 889 hectares. The company has completed the ownership transformation of the assetsexcluding land under the Law for Transition of Companies Working with Public Assets; it is74.2% in private hands.
3. “A.D. Malina”-Kriva Palanka. Agricultural production and animal breeding are the basicactivities of this company. It was formed in 1967 with 150 hectares of land. The enterprise’scurrent structure was created by the combination of three enterprises in the Kriva Palankamunicipality. Today the company has 1,057 hectares of land, of which 764 were purchasedfrom private farmers.
4. “Dubrovo”-Negotino. This an agricultural trade and production enterprise. It was formed outof the dissolution of the former “Z.I.K. Povardarie” in 1991. The company owns 2,105hectares of land.
5. “Males”-Berovo. In spite of its unfavorable location, the primary activity of this enterprise isagricultural production. It was formed in 1969 with the approval of the administration of theMunicipality of Berovo, with 50 hectares of land provided by the state. From formation untilnow, three other agricultural enterprises were merged into “Males” with all their agriculturaland other assets. Today the company has 700 hectares of land, mostly fields and gardens.Some 150 hectares of their land are subject to unclear property rights, given that some matterswere not fully settled during consolidation efforts in the past. This company has had severaltransformations of status to date. Today the company is in the process of bankruptcy.
6. “POS ZIK Topolcani”-Prilep. This enterprise was formed in 1991 with the dissolution of “ZIKPrilep.” The company has 3,879 hectares of land, 3,721 of which are suitable for agriculture.The primary activities of the company are agricultural production (wheat, barley, sunflower),vineyards, and animal husbandry (cow and sheep milk). This enterprise has no processingfacilities. Cooperation with the private farm sector is based on the purchase of lamb andsupplying of cattle feed.
7. “Mosa Pijade”-Polog-Kocani. This agricultural enterprise was formed from several smallerfarms in 1947. It is a classic example of a “cooperative” which is no different from an agro-industrial kombinat. It has 355 hectares of agricultural land. This enterprise has developedcontract farming relations with a large number of individual farmers, especially with farmersgrowing rice seeds. The enterprise owns a factory for processing rice and for producing riceseedlings. Some other significant sources of income besides the rice-processing factoryinclude machinery for post-processing and packing of granular products (e.g., sugar, spices,coffee), greenhouse production (6 hectares), and a dairy farm (94 cows). Greenhouseproducts from this enterprise are known by their quality because of the modern technology ofproduction, a technology based on using the natural hot waters of the area for heating thegreenhouses, and biological protection from insect damage.
8. “ZIK Kumanovo”-Kumanovo. Kumanovo is one of the largest agricultural organizations inthe Republic of Macedonia, representative of those which include all activities of theagricultural sector from primary agricultural production to processing, post-processing, andsale of the final products on domestic and foreign markets. This enterprise was formed in1960 with the integration of several agricultural farms and separate processing capacities. It
72
has 8,723 hectares of land, 6,794 hectares of which are suitable for field crop production. Theenterprise owns a winery for processing grapes, with an annual capacity of 16,500,000kilograms. It also owns a slaughterhouse with a capacity of 12,000 head of cattle, 50,000pigs, and 200,000 lamb and sheep; a dairy which can produce 6,000,000 liters of milk; asection for processing fruits and vegetables (freezing, drying, and canning) and making juices;and a refrigerator storage center with 6,500,000 kg capacity.
9. “Lozar”-Titov Veles. This enterprise was formed in 1953 with the integration of many smallerpublic agricultural companies and farms. The enterprise has 8,891 hectares of agriculturalland, of which 2,280 hectares were purchased, 1,338 hectares were obtained via expropriationor confiscation, and the rest were “given” by the community, i.e., inherited from integrationwith the development of the enterprise.
10. “ZIK Strumica”-Strumica. This is the third huge enterprise in the sample. It has 6,711 hectaresof land, 3,915 of which are suitable for agriculture. The largest part of the land is in the lowerpart of the “Strumica Field” and is characterized by its extremely small size of parcels, whichis atypical of the other big agricultural enterprises. The primary products of the enterprise aregreenhouse tomatoes and cucumbers, wine, grapes, wheat, milk, peaches, and apricots.
D. METHOD OF ANALYSIS
The analysis of 1995 production on the sampled farms was disaggregated by the land-usecategories employed by the Republic Statistical Office. Analysis was done for nonirrigated as wellas for irrigated land, noting the number and the size of parcels by the main categories of land.17
The following key crops were analyzed: wheat, barley, sunflower, alfalfa, fodder peas, greenhousetomatoes, grapes, apples, cow milk, and lamb meat.
The analysis of the survey information includes both physical indicators (e.g., area, yield) andfinancial data (total revenue, market value of output, total costs, net revenue). The values arecalculated per hectare and per kilogram. Such data are presented for each of the three sizecategories of enterprises as well as for the complete sample. In order to make a complete analysisof the costs of production, a cost-accounting calculation is applied which incorporates the directand indirect material costs, management costs, and depreciation into the cost of production foreach crop.
17The Macedonian government defines land according to the “appropriate” land uses from a agronomicpoint of view.
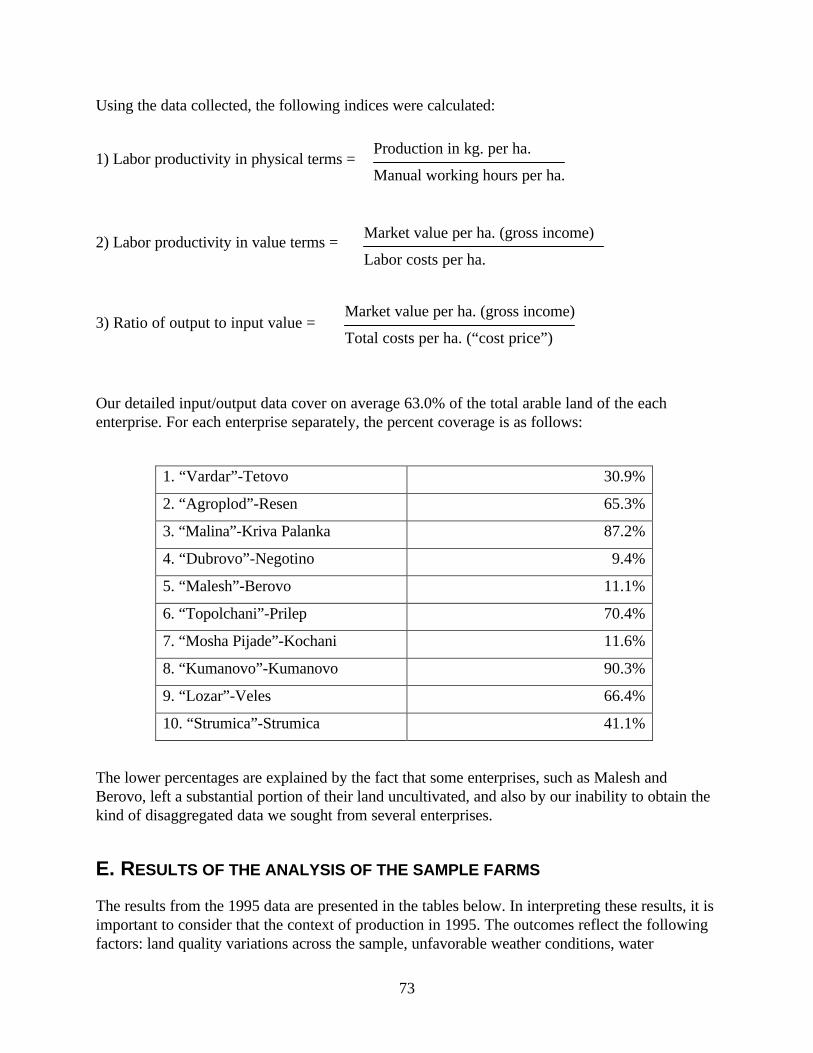
73
Using the data collected, the following indices were calculated:
1) Labor productivity in physical terms =
2) Labor productivity in value terms =
3) Ratio of output to input value =
Our detailed input/output data cover on average 63.0% of the total arable land of the eachenterprise. For each enterprise separately, the percent coverage is as follows:
1. “Vardar”-Tetovo 30.9%
2. “Agroplod”-Resen 65.3%
3. “Malina”-Kriva Palanka 87.2%
4. “Dubrovo”-Negotino 9.4%
5. “Malesh”-Berovo 11.1%
6. “Topolchani”-Prilep 70.4%
7. “Mosha Pijade”-Kochani 11.6%
8. “Kumanovo”-Kumanovo 90.3%
9. “Lozar”-Veles 66.4%
10. “Strumica”-Strumica 41.1%
The lower percentages are explained by the fact that some enterprises, such as Malesh andBerovo, left a substantial portion of their land uncultivated, and also by our inability to obtain thekind of disaggregated data we sought from several enterprises.
E. RESULTS OF THE ANALYSIS OF THE SAMPLE FARMS
The results from the 1995 data are presented in the tables below. In interpreting these results, it isimportant to consider that the context of production in 1995. The outcomes reflect the followingfactors: land quality variations across the sample, unfavorable weather conditions, water
Production in kg. per ha.
Manual working hours per ha.
Market value per ha. (gross income)
Labor costs per ha.
Market value per ha. (gross income)
Total costs per ha. (“cost price”)
74
insufficiency in the vegetative period,18 and inefficient organization and irregularities within theenterprises. Additionally, the following conditions had a impact on the performance ofMacedonian agriculture in 1995: closed markets, high transport costs, poorly organized marketingof agricultural products in both domestic and foreign markets, as well as a shortage of legalinstruments for quick and efficient marketing of agricultural products.
1. Land use
In the group of small enterprises, the data show that in 1995 the land in grains and vegetablesamounted to 60.8% of parcels and 66.1% of the total area. Orchards covered 19.6% of theparcels and 15.2% of the land. In the medium-size enterprises, land cultivated with grains andvegetables is 40.9% of parcels and 81.8% of arable land. In large enterprises, land in grains andvegetables cover 81.7% of the arable land.
Wheat is produced in all 10 enterprises on a total area of 10,132 hectares, and on averageoccupies 32.5% of the total arable area, with a range from 6.4% to 38.4%. Barley is grown on4,834 hectares, and on average occupies 15.5% out of the total arable area; like wheat, there isconsiderable variation, from 3.9% to 29.6%, of the arable area. Sunflower covers 1,226 hectares,and occupies on average 3.9% of the total arable area of the enterprises. Alfalfa is grown on 344hectares, and on average occupies 1.1% of the arable land with little variation across enterprises.Fodder peas are very minor, covering only 202 hectares, and on average only 0.7% of the totalarable area. Perennial vineyards account for 2,654 hectares of the sample’s land, or 8.5% of thetotal arable area.
One of the objectives of this research was to ascertain the average size of parcels by category ofuse in order to investigate the hypothesis that land privatization could not be done withoutsignificant fragmentation of the current fields. The parcel size varies with the size of theenterprise, its location, and technical and organizational planning. The average parcel size acrossthe three size groups for arable land used for grains and vegetables is 12.2 hectares; for allagricultural area, 10.2 hectares; and for the overall farm area, 10.3 hectares. The average size ofparcels by land use category is given in Table 4.1. These results do not support the hypothesis thatparcel size is a serious constraint to privatization of land; in many cases, it appears that currentfield boundaries and irrigation networks are of a scale which is within the reach of commerciallyoriented private farmers.
18 These first three factors should also qualify the results in the small farm sector, since there is noparticular difference across sectors in average soil quality and the samples are spread across the sameregions of Macedonia.
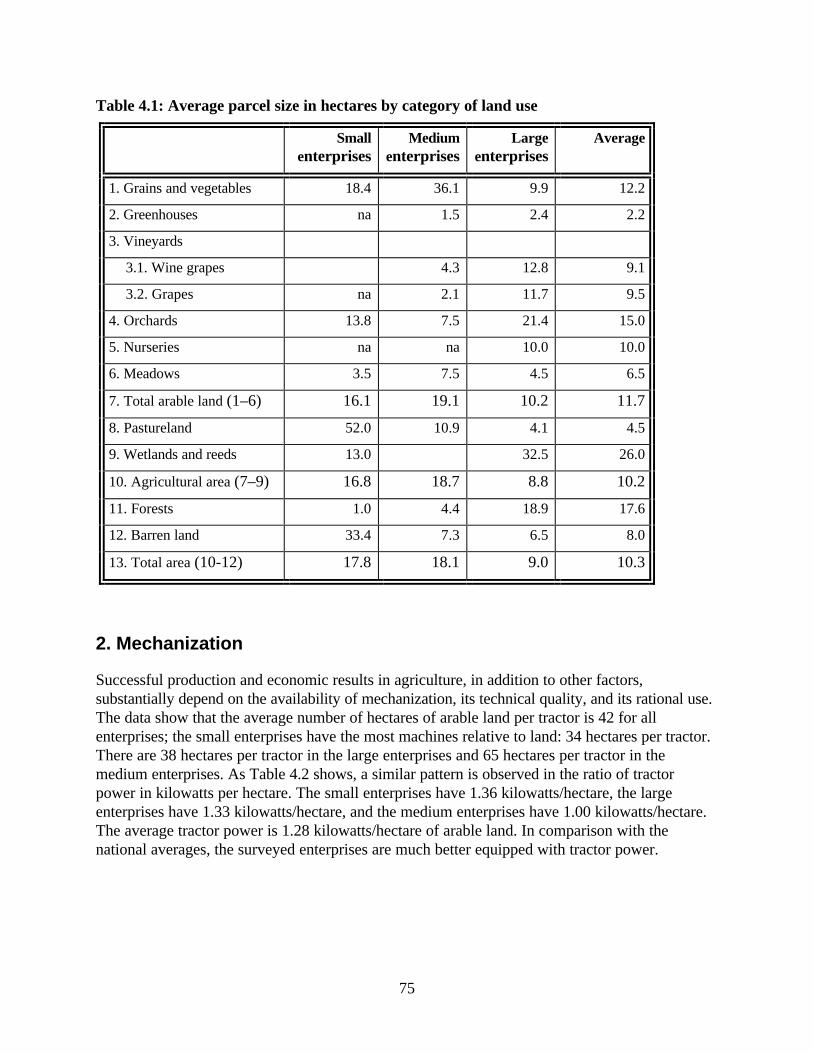
75
Table 4.1: Average parcel size in hectares by category of land use
Smallenterprises
Mediumenterprises
Largeenterprises
Average
1. Grains and vegetables 18.4 36.1 9.9 12.2
2. Greenhouses na 1.5 2.4 2.2
3. Vineyards
3.1. Wine grapes 4.3 12.8 9.1
3.2. Grapes na 2.1 11.7 9.5
4. Orchards 13.8 7.5 21.4 15.0
5. Nurseries na na 10.0 10.0
6. Meadows 3.5 7.5 4.5 6.5
7. Total arable land (1–6) 16.1 19.1 10.2 11.7
8. Pastureland 52.0 10.9 4.1 4.5
9. Wetlands and reeds 13.0 32.5 26.0
10. Agricultural area (7–9) 16.8 18.7 8.8 10.2
11. Forests 1.0 4.4 18.9 17.6
12. Barren land 33.4 7.3 6.5 8.0
13. Total area (10-12) 17.8 18.1 9.0 10.3
2. Mechanization
Successful production and economic results in agriculture, in addition to other factors,substantially depend on the availability of mechanization, its technical quality, and its rational use.The data show that the average number of hectares of arable land per tractor is 42 for allenterprises; the small enterprises have the most machines relative to land: 34 hectares per tractor.There are 38 hectares per tractor in the large enterprises and 65 hectares per tractor in themedium enterprises. As Table 4.2 shows, a similar pattern is observed in the ratio of tractorpower in kilowatts per hectare. The small enterprises have 1.36 kilowatts/hectare, the largeenterprises have 1.33 kilowatts/hectare, and the medium enterprises have 1.00 kilowatts/hectare.The average tractor power is 1.28 kilowatts/hectare of arable land. In comparison with thenational averages, the surveyed enterprises are much better equipped with tractor power.
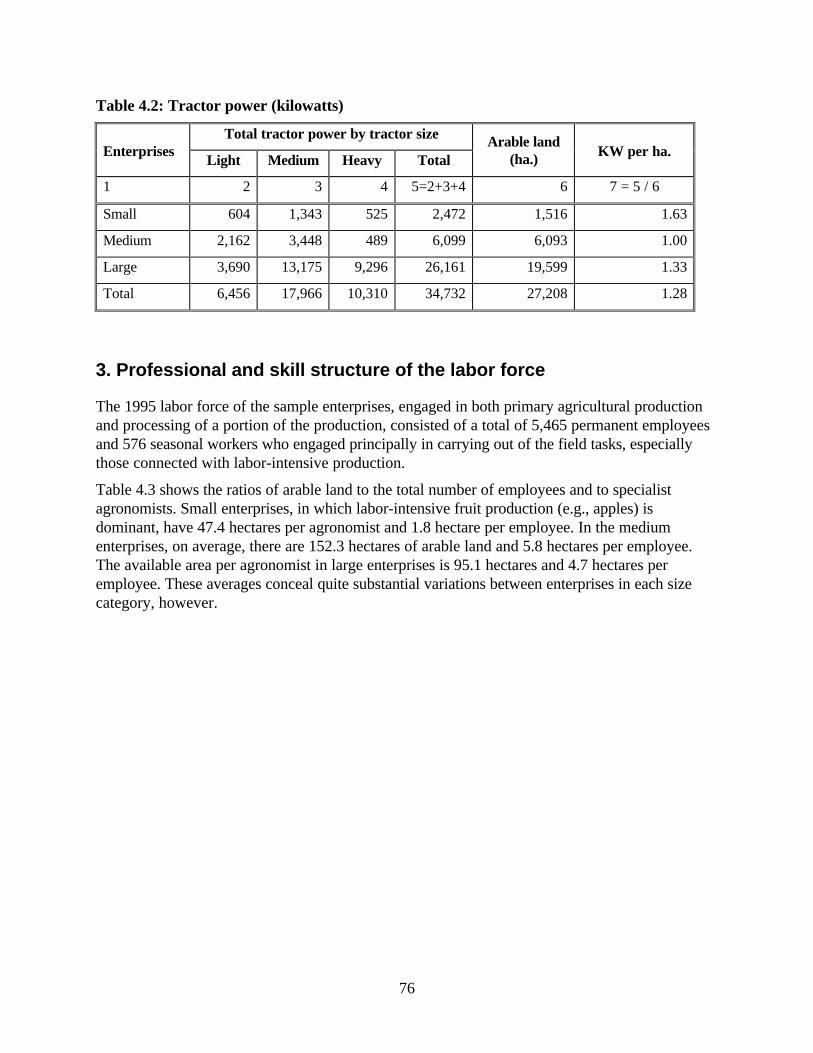
76
Table 4.2: Tractor power (kilowatts)
Total tractor power by tractor sizeEnterprises
Light Medium Heavy TotalArable land
(ha.) KW per ha.
1 2 3 4 5=2+3+4 6 7 = 5 / 6
Small 604 1,343 525 2,472 1,516 1.63
Medium 2,162 3,448 489 6,099 6,093 1.00
Large 3,690 13,175 9,296 26,161 19,599 1.33
Total 6,456 17,966 10,310 34,732 27,208 1.28
3. Professional and skill structure of the labor force
The 1995 labor force of the sample enterprises, engaged in both primary agricultural productionand processing of a portion of the production, consisted of a total of 5,465 permanent employeesand 576 seasonal workers who engaged principally in carrying out of the field tasks, especiallythose connected with labor-intensive production.
Table 4.3 shows the ratios of arable land to the total number of employees and to specialistagronomists. Small enterprises, in which labor-intensive fruit production (e.g., apples) isdominant, have 47.4 hectares per agronomist and 1.8 hectare per employee. In the mediumenterprises, on average, there are 152.3 hectares of arable land and 5.8 hectares per employee.The available area per agronomist in large enterprises is 95.1 hectares and 4.7 hectares peremployee. These averages conceal quite substantial variations between enterprises in each sizecategory, however.
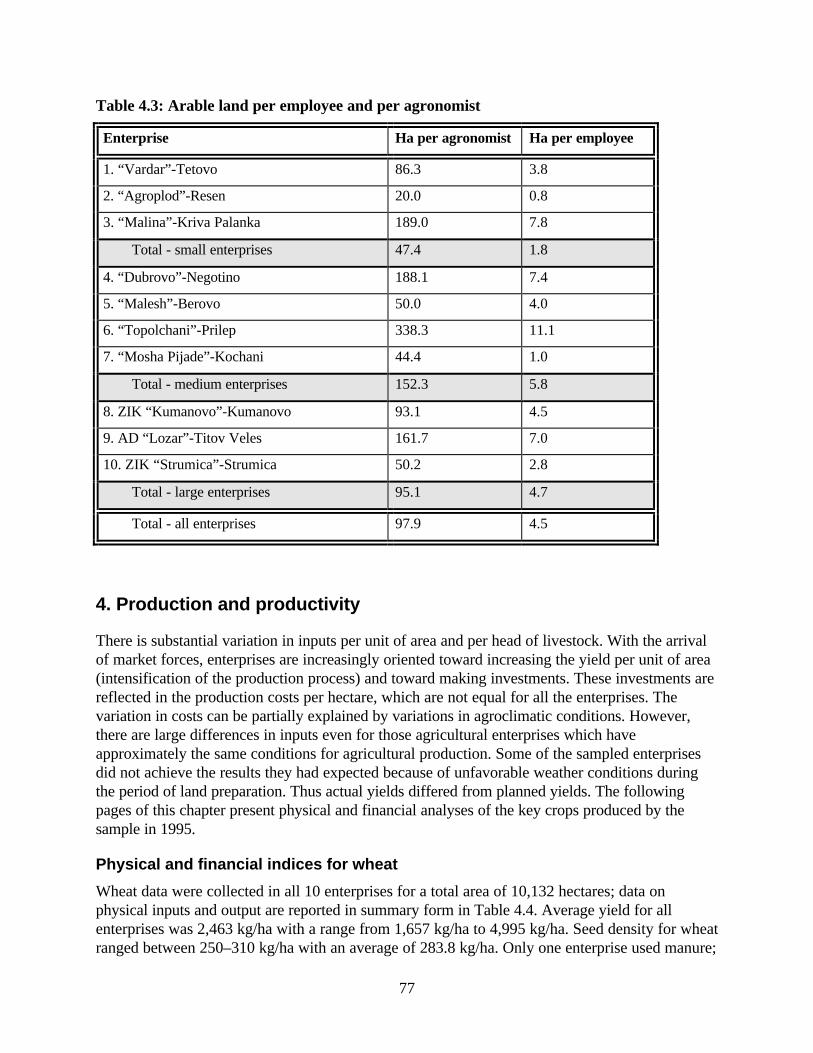
77
Table 4.3: Arable land per employee and per agronomist
Enterprise Ha per agronomist Ha per employee
1. “Vardar”-Tetovo 86.3 3.8
2. “Agroplod”-Resen 20.0 0.8
3. “Malina”-Kriva Palanka 189.0 7.8
Total - small enterprises 47.4 1.8
4. “Dubrovo”-Negotino 188.1 7.4
5. “Malesh”-Berovo 50.0 4.0
6. “Topolchani”-Prilep 338.3 11.1
7. “Mosha Pijade”-Kochani 44.4 1.0
Total - medium enterprises 152.3 5.8
8. ZIK “Kumanovo”-Kumanovo 93.1 4.5
9. AD “Lozar”-Titov Veles 161.7 7.0
10. ZIK “Strumica”-Strumica 50.2 2.8
Total - large enterprises 95.1 4.7
Total - all enterprises 97.9 4.5
4. Production and productivity
There is substantial variation in inputs per unit of area and per head of livestock. With the arrivalof market forces, enterprises are increasingly oriented toward increasing the yield per unit of area(intensification of the production process) and toward making investments. These investments arereflected in the production costs per hectare, which are not equal for all the enterprises. Thevariation in costs can be partially explained by variations in agroclimatic conditions. However,there are large differences in inputs even for those agricultural enterprises which haveapproximately the same conditions for agricultural production. Some of the sampled enterprisesdid not achieve the results they had expected because of unfavorable weather conditions duringthe period of land preparation. Thus actual yields differed from planned yields. The followingpages of this chapter present physical and financial analyses of the key crops produced by thesample in 1995.
Physical and financial indices for wheat
Wheat data were collected in all 10 enterprises for a total area of 10,132 hectares; data onphysical inputs and output are reported in summary form in Table 4.4. Average yield for allenterprises was 2,463 kg/ha with a range from 1,657 kg/ha to 4,995 kg/ha. Seed density for wheatranged between 250–310 kg/ha with an average of 283.8 kg/ha. Only one enterprise used manure;
78
this input is not regularly used in the production of wheat. There is a large range in the quantity ofartificial fertilizer applied, going from 97.8 kg/ha to 700 kg/ha, with an average of 278.4 kg/ha; allbut three enterprises used between 200 and 500 kg./ha.19 Interviews with farm managers revealedthat some of the enterprises reduced the quantity of artificial fertilizer below optimal levels in1995 as a means of reducing costs in a time of financial stress, while others used the samequantity of fertilizer as in previous years.
Mechanization is a very significant input in the production of wheat; wheat is “the mostmechanized” crop. Almost all the enterprises use medium-size tractors for all their agriculturalproduction activities. The average use of medium tractors is 8.8 hours/ha, and for all types ofmachinery, the average is 14.7 hours/ha. The labor force engaged in the production of wheat isalso significant, with an average of 39.8 hours/ha including 36.9 hours/ha worked by permanentemployees. The labor productivity index, in physical terms, shows that on average across all 10enterprises, 61.9 kg/working hour are produced. As is typical, larger enterprises have the highestlevel of labor productivity (80.6 kg/ha). The smallest enterprises are more labor and machineintensive in the cultivation of wheat.
The financial indicators for wheat production in 1995 for the sample suggest that half of theenterprises made a small loss per hectare of wheat produced; the analysis shows that the marketprice of wheat covers only 98.2% of the cost of the wheat per hectare. Large enterprises showpositive economic results although the average yield per hectare is highest in the small enterprises.The percentage share of some input values in total costs are: seed costs, 19.8%; tractor services(medium tractors), 13.1%; labor costs (direct wages), 11.3%; chemical fertilizer costs, 9.0%;costs of interest on invested assets, 8.7%; and management costs, 8.3%. Other inputs are minor.
19 One cannot exclude the possibility of data collection errors in the cases of the two enterprises withextreme values. It is useful to note, however, that the enterprise using the most fertilizer also reported thehighest wheat yield. This example demonstrates the point that physical yield comparisons are insufficient indiscussing the advantages of one sector or another; one can nearly always achieve higher yields by applyinggreater input doses, but generally with an important negative impact on profitability.
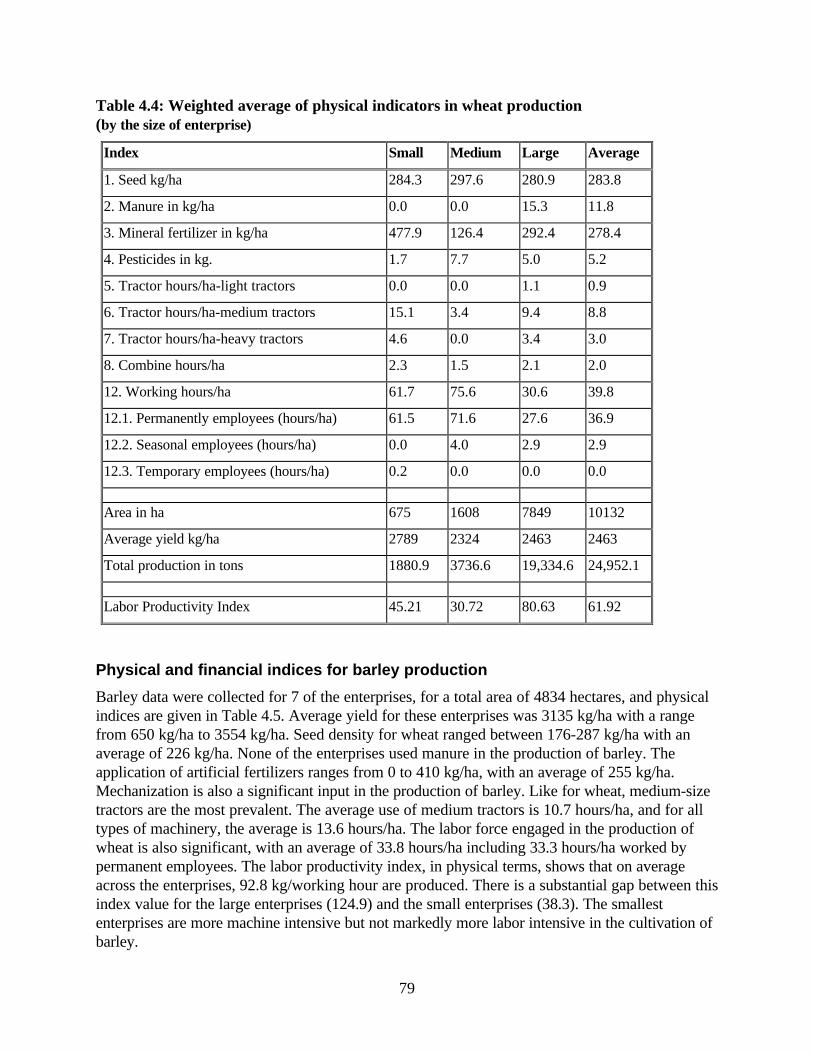
79
Table 4.4: Weighted average of physical indicators in wheat production(by the size of enterprise)
Index Small Medium Large Average
1. Seed kg/ha 284.3 297.6 280.9 283.8
2. Manure in kg/ha 0.0 0.0 15.3 11.8
3. Mineral fertilizer in kg/ha 477.9 126.4 292.4 278.4
4. Pesticides in kg. 1.7 7.7 5.0 5.2
5. Tractor hours/ha-light tractors 0.0 0.0 1.1 0.9
6. Tractor hours/ha-medium tractors 15.1 3.4 9.4 8.8
7. Tractor hours/ha-heavy tractors 4.6 0.0 3.4 3.0
8. Combine hours/ha 2.3 1.5 2.1 2.0
12. Working hours/ha 61.7 75.6 30.6 39.8
12.1. Permanently employees (hours/ha) 61.5 71.6 27.6 36.9
12.2. Seasonal employees (hours/ha) 0.0 4.0 2.9 2.9
12.3. Temporary employees (hours/ha) 0.2 0.0 0.0 0.0
Area in ha 675 1608 7849 10132
Average yield kg/ha 2789 2324 2463 2463
Total production in tons 1880.9 3736.6 19,334.6 24,952.1
Labor Productivity Index 45.21 30.72 80.63 61.92
Physical and financial indices for barley production
Barley data were collected for 7 of the enterprises, for a total area of 4834 hectares, and physicalindices are given in Table 4.5. Average yield for these enterprises was 3135 kg/ha with a rangefrom 650 kg/ha to 3554 kg/ha. Seed density for wheat ranged between 176-287 kg/ha with anaverage of 226 kg/ha. None of the enterprises used manure in the production of barley. Theapplication of artificial fertilizers ranges from 0 to 410 kg/ha, with an average of 255 kg/ha.Mechanization is also a significant input in the production of barley. Like for wheat, medium-sizetractors are the most prevalent. The average use of medium tractors is 10.7 hours/ha, and for alltypes of machinery, the average is 13.6 hours/ha. The labor force engaged in the production ofwheat is also significant, with an average of 33.8 hours/ha including 33.3 hours/ha worked bypermanent employees. The labor productivity index, in physical terms, shows that on averageacross the enterprises, 92.8 kg/working hour are produced. There is a substantial gap between thisindex value for the large enterprises (124.9) and the small enterprises (38.3). The smallestenterprises are more machine intensive but not markedly more labor intensive in the cultivation ofbarley.
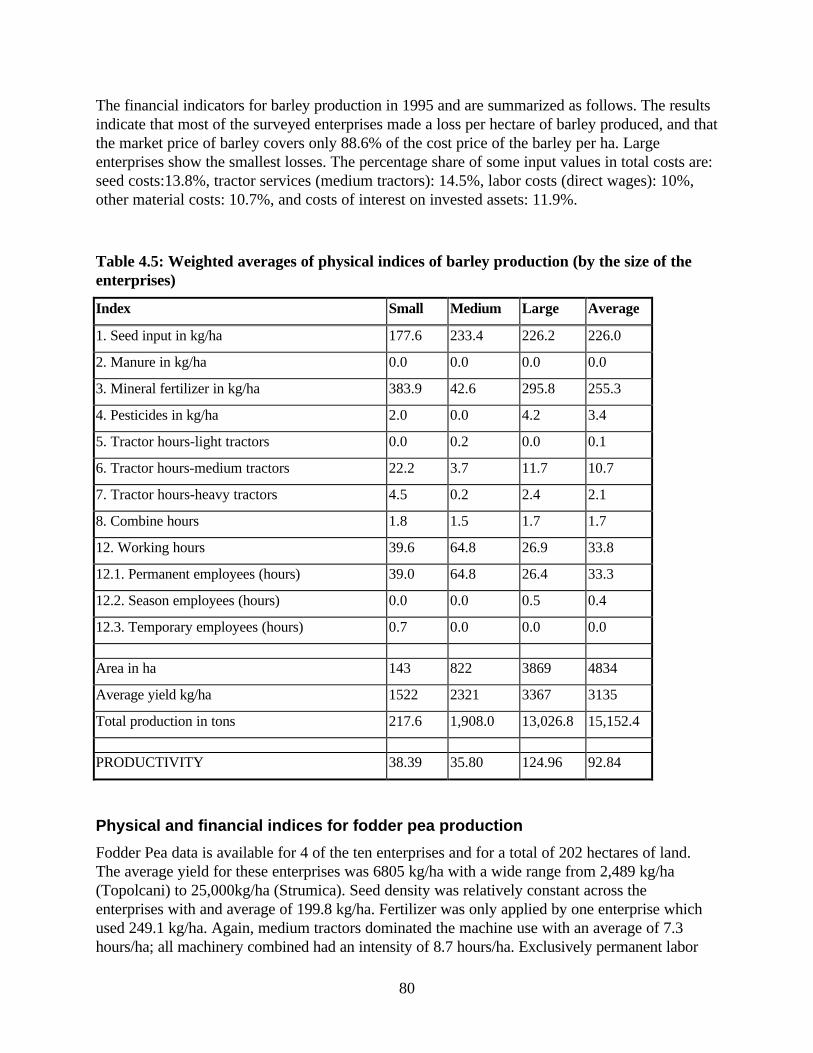
80
The financial indicators for barley production in 1995 and are summarized as follows. The resultsindicate that most of the surveyed enterprises made a loss per hectare of barley produced, and thatthe market price of barley covers only 88.6% of the cost price of the barley per ha. Largeenterprises show the smallest losses. The percentage share of some input values in total costs are:seed costs:13.8%, tractor services (medium tractors): 14.5%, labor costs (direct wages): 10%,other material costs: 10.7%, and costs of interest on invested assets: 11.9%.
Table 4.5: Weighted averages of physical indices of barley production (by the size of theenterprises)
Index Small Medium Large Average
1. Seed input in kg/ha 177.6 233.4 226.2 226.0
2. Manure in kg/ha 0.0 0.0 0.0 0.0
3. Mineral fertilizer in kg/ha 383.9 42.6 295.8 255.3
4. Pesticides in kg/ha 2.0 0.0 4.2 3.4
5. Tractor hours-light tractors 0.0 0.2 0.0 0.1
6. Tractor hours-medium tractors 22.2 3.7 11.7 10.7
7. Tractor hours-heavy tractors 4.5 0.2 2.4 2.1
8. Combine hours 1.8 1.5 1.7 1.7
12. Working hours 39.6 64.8 26.9 33.8
12.1. Permanent employees (hours) 39.0 64.8 26.4 33.3
12.2. Season employees (hours) 0.0 0.0 0.5 0.4
12.3. Temporary employees (hours) 0.7 0.0 0.0 0.0
Area in ha 143 822 3869 4834
Average yield kg/ha 1522 2321 3367 3135
Total production in tons 217.6 1,908.0 13,026.8 15,152.4
PRODUCTIVITY 38.39 35.80 124.96 92.84
Physical and financial indices for fodder pea production
Fodder Pea data is available for 4 of the ten enterprises and for a total of 202 hectares of land.The average yield for these enterprises was 6805 kg/ha with a wide range from 2,489 kg/ha(Topolcani) to 25,000kg/ha (Strumica). Seed density was relatively constant across theenterprises with and average of 199.8 kg/ha. Fertilizer was only applied by one enterprise whichused 249.1 kg/ha. Again, medium tractors dominated the machine use with an average of 7.3hours/ha; all machinery combined had an intensity of 8.7 hours/ha. Exclusively permanent labor
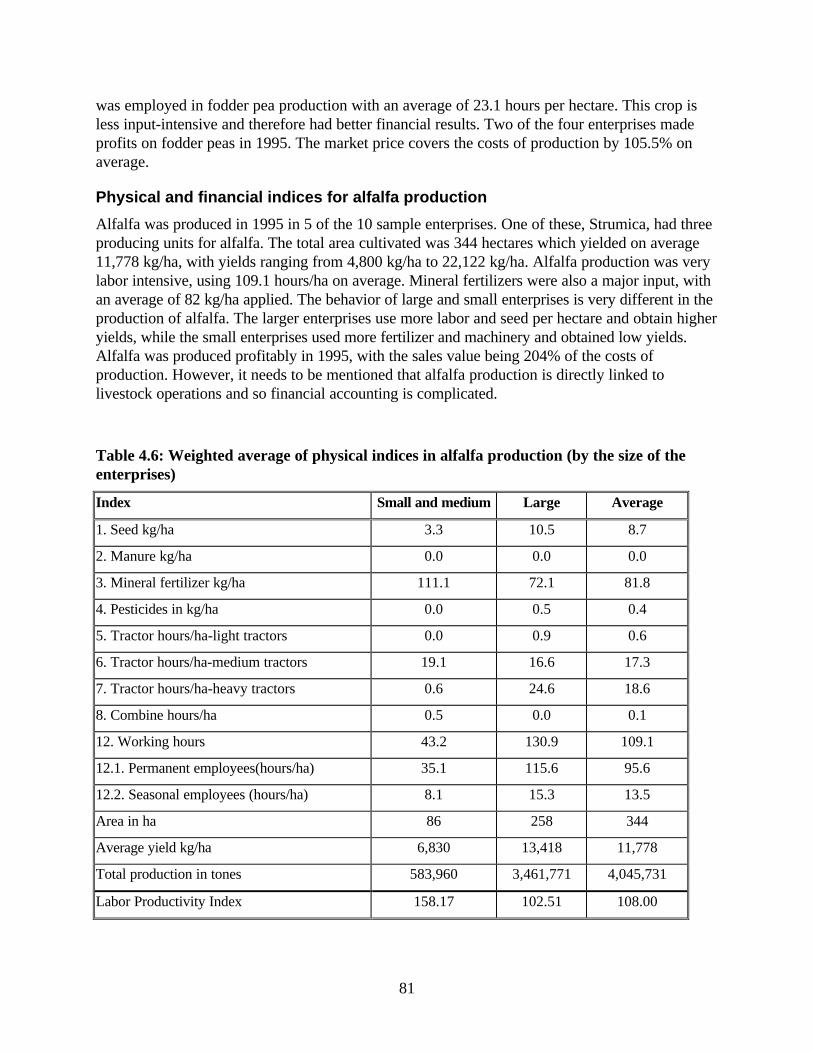
81
was employed in fodder pea production with an average of 23.1 hours per hectare. This crop isless input-intensive and therefore had better financial results. Two of the four enterprises madeprofits on fodder peas in 1995. The market price covers the costs of production by 105.5% onaverage.
Physical and financial indices for alfalfa production
Alfalfa was produced in 1995 in 5 of the 10 sample enterprises. One of these, Strumica, had threeproducing units for alfalfa. The total area cultivated was 344 hectares which yielded on average11,778 kg/ha, with yields ranging from 4,800 kg/ha to 22,122 kg/ha. Alfalfa production was verylabor intensive, using 109.1 hours/ha on average. Mineral fertilizers were also a major input, withan average of 82 kg/ha applied. The behavior of large and small enterprises is very different in theproduction of alfalfa. The larger enterprises use more labor and seed per hectare and obtain higheryields, while the small enterprises used more fertilizer and machinery and obtained low yields.Alfalfa was produced profitably in 1995, with the sales value being 204% of the costs ofproduction. However, it needs to be mentioned that alfalfa production is directly linked tolivestock operations and so financial accounting is complicated.
Table 4.6: Weighted average of physical indices in alfalfa production (by the size of theenterprises)
Index Small and medium Large Average
1. Seed kg/ha 3.3 10.5 8.7
2. Manure kg/ha 0.0 0.0 0.0
3. Mineral fertilizer kg/ha 111.1 72.1 81.8
4. Pesticides in kg/ha 0.0 0.5 0.4
5. Tractor hours/ha-light tractors 0.0 0.9 0.6
6. Tractor hours/ha-medium tractors 19.1 16.6 17.3
7. Tractor hours/ha-heavy tractors 0.6 24.6 18.6
8. Combine hours/ha 0.5 0.0 0.1
12. Working hours 43.2 130.9 109.1
12.1. Permanent employees(hours/ha) 35.1 115.6 95.6
12.2. Seasonal employees (hours/ha) 8.1 15.3 13.5
Area in ha 86 258 344
Average yield kg/ha 6,830 13,418 11,778
Total production in tones 583,960 3,461,771 4,045,731
Labor Productivity Index 158.17 102.51 108.00
82
Physical and financial indices for sunflower production
Sunflower data are available for only two of the enterprises - AIK “Kumanovo” and AIK“Topolchani,” Prilep. The total area of cultivation is 1,226 hectares from which 926 hectares arein Kumanovo and 300 hectares in Prilep. The yields are substantially different in the two caseswith a low of 817 kg/ha in Prilep compared to a high of 1,514 kg/ha in Kumanovo. The averagelabor productivity is 38.2 kg per working hour. Seed input on average was 7.2 kg/ha with a bigdifference between the two enterprises. The amount of seed used in Prilep is 11.0 kg/ha whereasalmost half of that amount was used in Kumanovo i.e., 6.0 kg/ha. Mineral fertilizer was not usedin the sunflower production in Prilep and in Kumanovo 201.9 kg/ha were applied. Machine hourstotaled 17 hours per hectare in Kumanovo and only 2.4 in Prilep. Labor hours were moreconsistent across the two enterprises and averaged 35.2 per hectare. The end resultwas that Prilepmade a loss on sunflower production while Kumanovo made a profit.
Physical and financial indices for greenhouse tomatoes
Greenhouse tomatoes production is analyzed in three enterprises, one of which has three separateproducing units. The total area cultivated was 25.8 hectares in 1995. The average yield for allenterprises is 97,541 kg/ha with a range of 28,980 to 144,132 kg/ha and an average laborproductivity index of 5.2 kg/working hour. This is a labor-intensive crop which employed onaverage of 18,679 hours/ha. For fertilization, 78 tones of manure were used per hectare onaverage. The rest of the details of input use are presented in Table 4.7 below. The end result wasthat only one of the enterprises showed a profit for tomato production in 1995. Some factorswhich contributed to such losses were the restrictive monetary policy, stagnating export levels andlow domestic prices due to lack of purchasing power in the local population and, perhaps, tooversupply of the market. Also, the interest component allocated to greenhouse investments wasvery high).
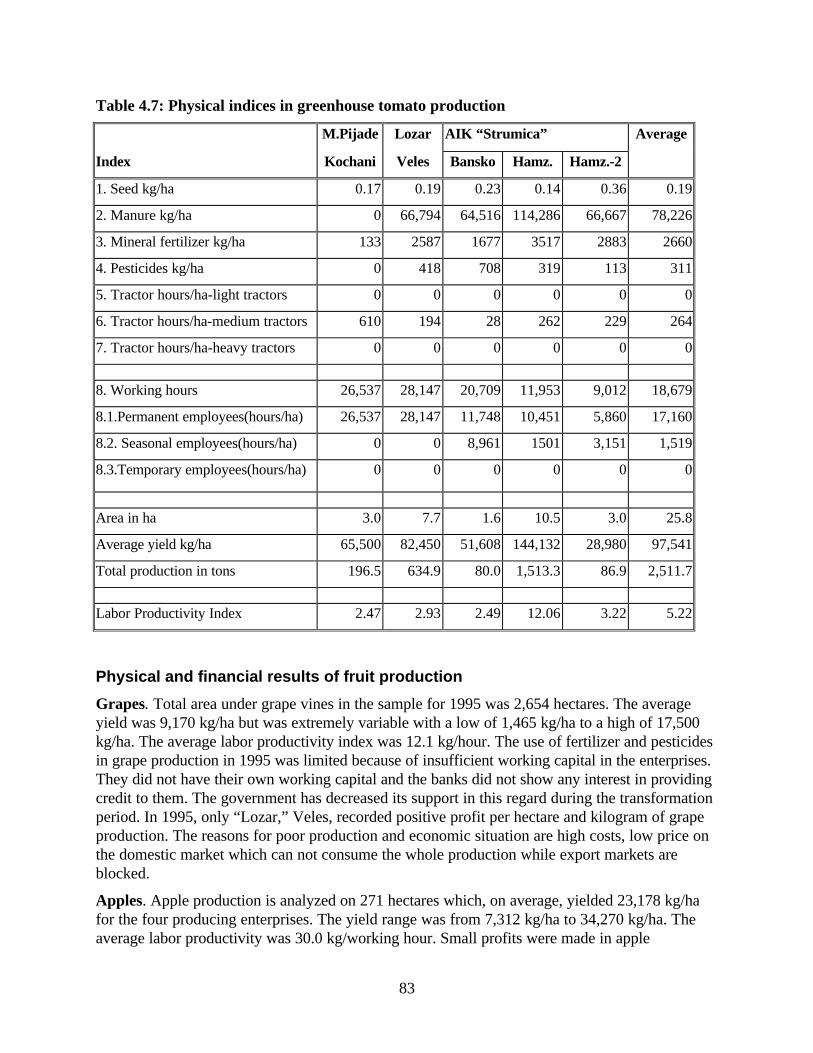
83
Table 4.7: Physical indices in greenhouse tomato production
M.Pijade Lozar AIK “Strumica” Average
Index Kochani Veles Bansko Hamz. Hamz.-2
1. Seed kg/ha 0.17 0.19 0.23 0.14 0.36 0.19
2. Manure kg/ha 0 66,794 64,516 114,286 66,667 78,226
3. Mineral fertilizer kg/ha 133 2587 1677 3517 2883 2660
4. Pesticides kg/ha 0 418 708 319 113 311
5. Tractor hours/ha-light tractors 0 0 0 0 0 0
6. Tractor hours/ha-medium tractors 610 194 28 262 229 264
7. Tractor hours/ha-heavy tractors 0 0 0 0 0 0
8. Working hours 26,537 28,147 20,709 11,953 9,012 18,679
8.1.Permanent employees(hours/ha) 26,537 28,147 11,748 10,451 5,860 17,160
8.2. Seasonal employees(hours/ha) 0 0 8,961 1501 3,151 1,519
8.3.Temporary employees(hours/ha) 0 0 0 0 0 0
Area in ha 3.0 7.7 1.6 10.5 3.0 25.8
Average yield kg/ha 65,500 82,450 51,608 144,132 28,980 97,541
Total production in tons 196.5 634.9 80.0 1,513.3 86.9 2,511.7
Labor Productivity Index 2.47 2.93 2.49 12.06 3.22 5.22
Physical and financial results of fruit production
Grapes. Total area under grape vines in the sample for 1995 was 2,654 hectares. The averageyield was 9,170 kg/ha but was extremely variable with a low of 1,465 kg/ha to a high of 17,500kg/ha. The average labor productivity index was 12.1 kg/hour. The use of fertilizer and pesticidesin grape production in 1995 was limited because of insufficient working capital in the enterprises.They did not have their own working capital and the banks did not show any interest in providingcredit to them. The government has decreased its support in this regard during the transformationperiod. In 1995, only “Lozar,” Veles, recorded positive profit per hectare and kilogram of grapeproduction. The reasons for poor production and economic situation are high costs, low price onthe domestic market which can not consume the whole production while export markets areblocked.
Apples. Apple production is analyzed on 271 hectares which, on average, yielded 23,178 kg/hafor the four producing enterprises. The yield range was from 7,312 kg/ha to 34,270 kg/ha. Theaverage labor productivity was 30.0 kg/working hour. Small profits were made in apple
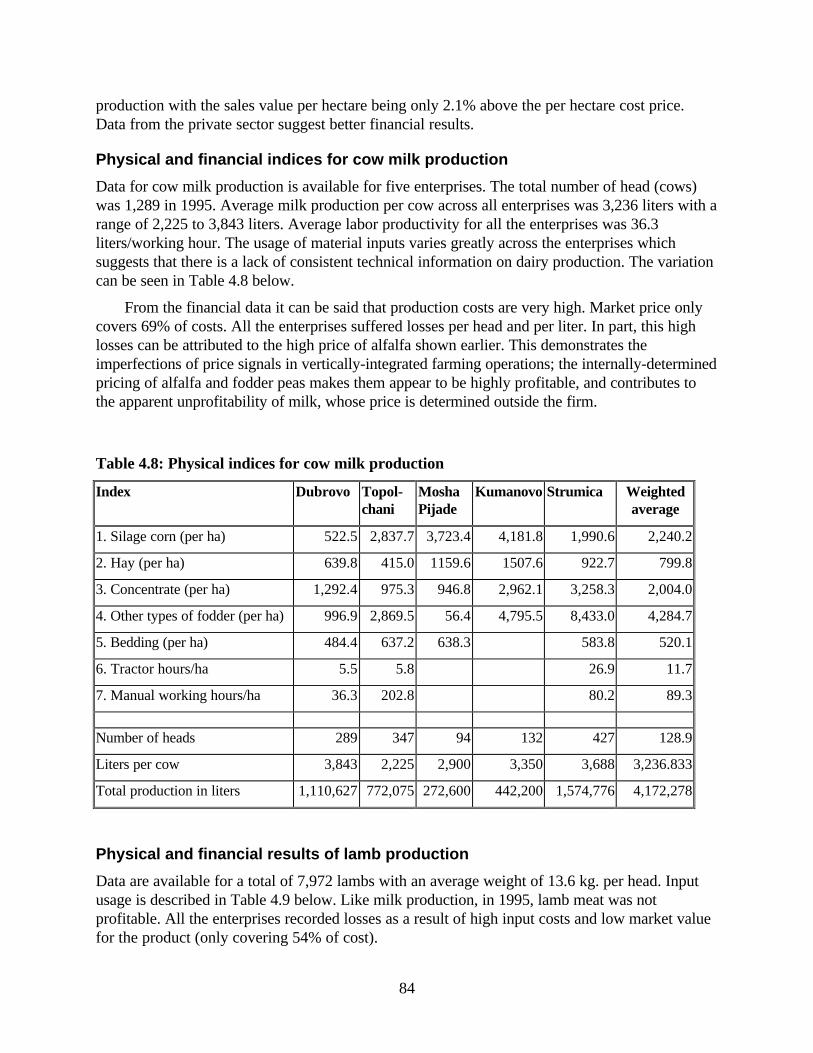
84
production with the sales value per hectare being only 2.1% above the per hectare cost price.Data from the private sector suggest better financial results.
Physical and financial indices for cow milk production
Data for cow milk production is available for five enterprises. The total number of head (cows)was 1,289 in 1995. Average milk production per cow across all enterprises was 3,236 liters with arange of 2,225 to 3,843 liters. Average labor productivity for all the enterprises was 36.3liters/working hour. The usage of material inputs varies greatly across the enterprises whichsuggests that there is a lack of consistent technical information on dairy production. The variationcan be seen in Table 4.8 below.
From the financial data it can be said that production costs are very high. Market price onlycovers 69% of costs. All the enterprises suffered losses per head and per liter. In part, this highlosses can be attributed to the high price of alfalfa shown earlier. This demonstrates theimperfections of price signals in vertically-integrated farming operations; the internally-determinedpricing of alfalfa and fodder peas makes them appear to be highly profitable, and contributes tothe apparent unprofitability of milk, whose price is determined outside the firm.
Table 4.8: Physical indices for cow milk production
Index Dubrovo Topol-chani
MoshaPijade
Kumanovo Strumica Weightedaverage
1. Silage corn (per ha) 522.5 2,837.7 3,723.4 4,181.8 1,990.6 2,240.2
2. Hay (per ha) 639.8 415.0 1159.6 1507.6 922.7 799.8
3. Concentrate (per ha) 1,292.4 975.3 946.8 2,962.1 3,258.3 2,004.0
4. Other types of fodder (per ha) 996.9 2,869.5 56.4 4,795.5 8,433.0 4,284.7
5. Bedding (per ha) 484.4 637.2 638.3 583.8 520.1
6. Tractor hours/ha 5.5 5.8 26.9 11.7
7. Manual working hours/ha 36.3 202.8 80.2 89.3
Number of heads 289 347 94 132 427 128.9
Liters per cow 3,843 2,225 2,900 3,350 3,688 3,236.833
Total production in liters 1,110,627 772,075 272,600 442,200 1,574,776 4,172,278
Physical and financial results of lamb production
Data are available for a total of 7,972 lambs with an average weight of 13.6 kg. per head. Inputusage is described in Table 4.9 below. Like milk production, in 1995, lamb meat was notprofitable. All the enterprises recorded losses as a result of high input costs and low market valuefor the product (only covering 54% of cost).
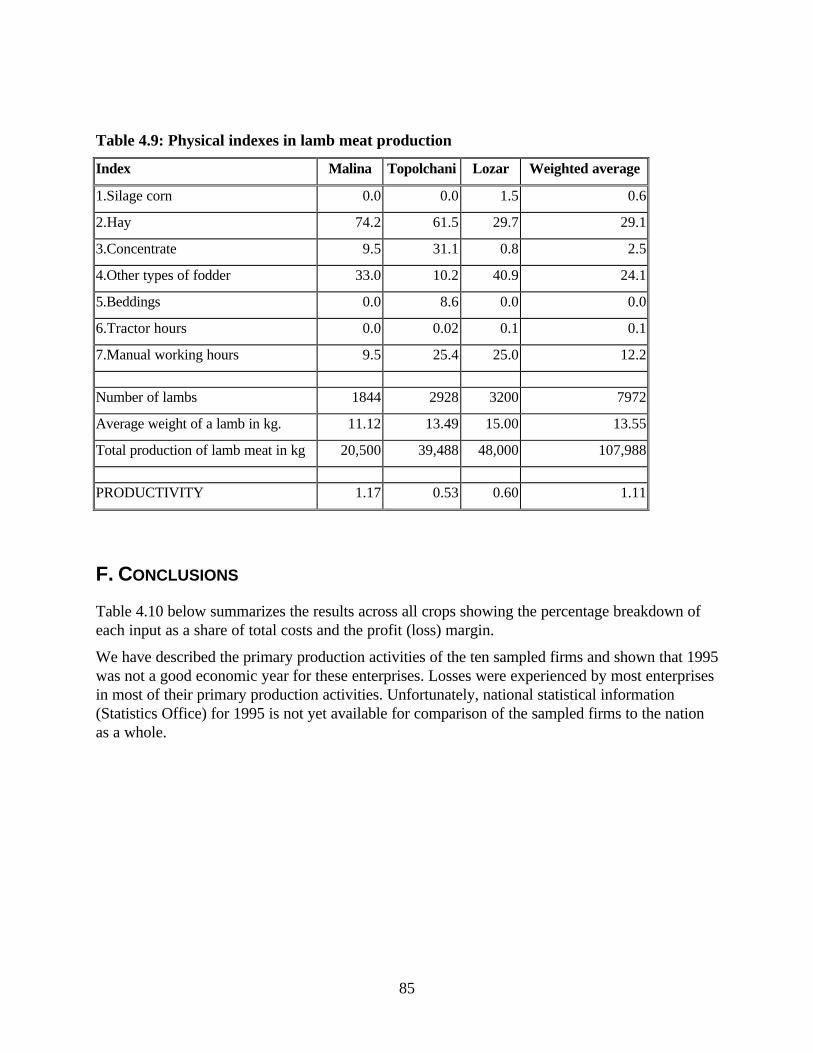
85
Table 4.9: Physical indexes in lamb meat production
Index Malina Topolchani Lozar Weighted average
1.Silage corn 0.0 0.0 1.5 0.6
2.Hay 74.2 61.5 29.7 29.1
3.Concentrate 9.5 31.1 0.8 2.5
4.Other types of fodder 33.0 10.2 40.9 24.1
5.Beddings 0.0 8.6 0.0 0.0
6.Tractor hours 0.0 0.02 0.1 0.1
7.Manual working hours 9.5 25.4 25.0 12.2
Number of lambs 1844 2928 3200 7972
Average weight of a lamb in kg. 11.12 13.49 15.00 13.55
Total production of lamb meat in kg 20,500 39,488 48,000 107,988
PRODUCTIVITY 1.17 0.53 0.60 1.11
F. CONCLUSIONS
Table 4.10 below summarizes the results across all crops showing the percentage breakdown ofeach input as a share of total costs and the profit (loss) margin.
We have described the primary production activities of the ten sampled firms and shown that 1995was not a good economic year for these enterprises. Losses were experienced by most enterprisesin most of their primary production activities. Unfortunately, national statistical information(Statistics Office) for 1995 is not yet available for comparison of the sampled firms to the nationas a whole.
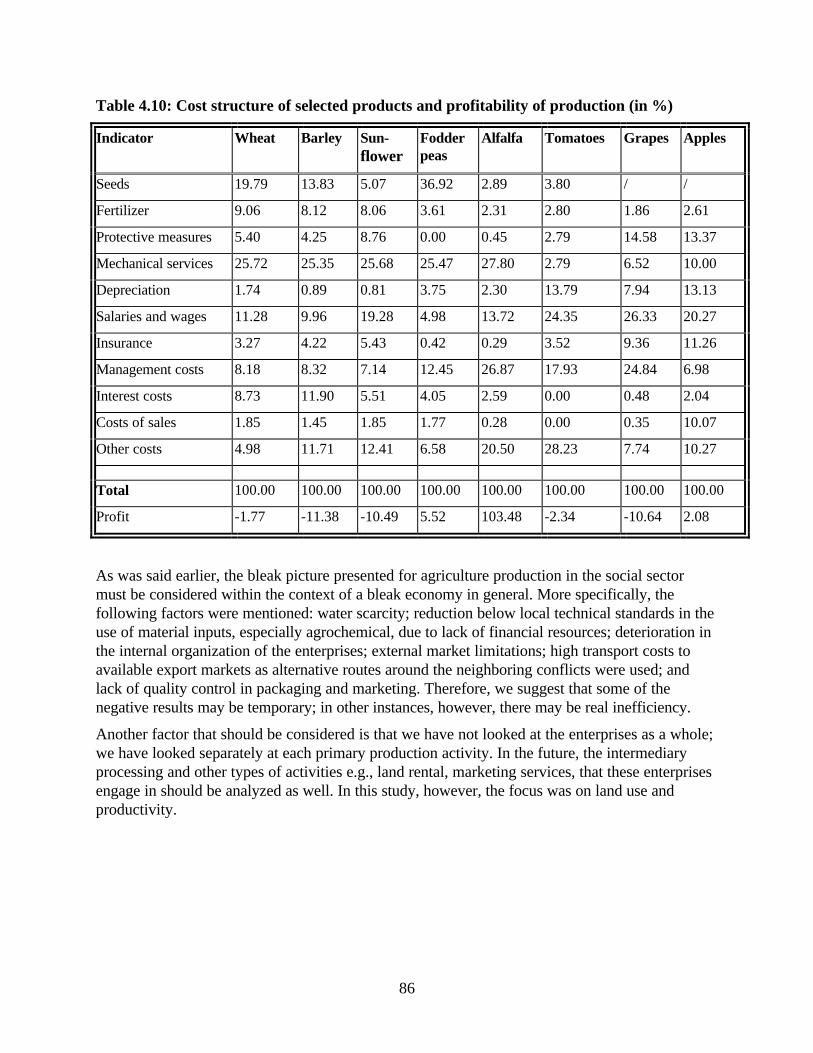
86
Table 4.10: Cost structure of selected products and profitability of production (in %)
Indicator Wheat Barley Sun-flower
Fodderpeas
Alfalfa Tomatoes Grapes Apples
Seeds 19.79 13.83 5.07 36.92 2.89 3.80 / /
Fertilizer 9.06 8.12 8.06 3.61 2.31 2.80 1.86 2.61
Protective measures 5.40 4.25 8.76 0.00 0.45 2.79 14.58 13.37
Mechanical services 25.72 25.35 25.68 25.47 27.80 2.79 6.52 10.00
Depreciation 1.74 0.89 0.81 3.75 2.30 13.79 7.94 13.13
Salaries and wages 11.28 9.96 19.28 4.98 13.72 24.35 26.33 20.27
Insurance 3.27 4.22 5.43 0.42 0.29 3.52 9.36 11.26
Management costs 8.18 8.32 7.14 12.45 26.87 17.93 24.84 6.98
Interest costs 8.73 11.90 5.51 4.05 2.59 0.00 0.48 2.04
Costs of sales 1.85 1.45 1.85 1.77 0.28 0.00 0.35 10.07
Other costs 4.98 11.71 12.41 6.58 20.50 28.23 7.74 10.27
Total 100.00 100.00 100.00 100.00 100.00 100.00 100.00 100.00
Profit -1.77 -11.38 -10.49 5.52 103.48 -2.34 -10.64 2.08
As was said earlier, the bleak picture presented for agriculture production in the social sectormust be considered within the context of a bleak economy in general. More specifically, thefollowing factors were mentioned: water scarcity; reduction below local technical standards in theuse of material inputs, especially agrochemical, due to lack of financial resources; deterioration inthe internal organization of the enterprises; external market limitations; high transport costs toavailable export markets as alternative routes around the neighboring conflicts were used; andlack of quality control in packaging and marketing. Therefore, we suggest that some of thenegative results may be temporary; in other instances, however, there may be real inefficiency.
Another factor that should be considered is that we have not looked at the enterprises as a whole;we have looked separately at each primary production activity. In the future, the intermediaryprocessing and other types of activities e.g., land rental, marketing services, that these enterprisesengage in should be analyzed as well. In this study, however, the focus was on land use andproductivity.
87
V: A COMPARATIVE REVIEW OF LAND USE AND PRODUCTIVITYACROSS THE SOCIAL AND PRIVATE SECTORS
This study is comprised of separate investigations of the social and private sector farms, yet ourobjectives as set out in the introductory chapter clearly express the need to formulate a consistentlegal and policy framework for the development of the entire agricultural sector. Therefore, anattempt is made here to draw some comparison across the two sub-sectors of producers, whohistorically have been addressed separately from one another. The historical and still prevalentview is that the social sector is the source of livelihood for agricultural development and for theeconomy. The private sector was addressed primarily from a sociological perspective. Because ofthese differences in historical participation in the economy and also simply due to drasticstructural difference between farms in each sector, such a comparison is plagued with difficulties.We will thus, present a limited and qualified comparison.
A. LAND USE
There is substantial overlap in land use patterns in each sector. Both sectors dedicate substantialportions of their landholdings to cultivation of grains. Also, cultivation of fodder crops andintensive vegetable beds are important components of the production in both sectors, withexpected regional variations in extent of cultivation. Fruits (grapes, apples, cherries) are alsoproduced in both sectors, but are more dominant in the crop mix of the social sector farms . Thesame is true of several industrial crops and high tech vegetable production, like greenhousetomatoes and cucumbers, which are exclusive to the social sector. Tobacco is produced almostexclusively by small farmers but only with permission and contract from the social sector whichhas a created monopoly in the processing and marketing of tobacco. Fallow and idle arable landexists in both sectors as is to be expected at any point in time. However, there is a substantialdifference between the percent left unused in each sector. Recall that the average amount offallow land in the private sample in 1995 was around 5%. Data available from nine of the tensocial sector enterprises interviewed suggest that the percent of arable land left fallow or unusedranges from 5% to 64% and averages 24%. This suggests that there is a substantial amount of idleland due to reasons other than fallowing as a productive part of strategy of soil management.20
Especially in today’s environment of reduced government support, many of the social sector farmsdo not have the resources to cultivate the land which they hold. The sum total land idle from theseenterprises is 3203 hectares of arable land (and these are only 5% of all the social sector farms).
B. LAND ACQUISITION
As was explained in earlier parts of this report, there are quite obvious differences across thesectors in land acquisition histories. Less well known, however, is the active participation of the 20 This amount of fallow land is in addition to land which is categorized as barren in the previous chapter ofour report.
88
social sector farms in the land market. Most have some amount of land which was acquired viadirect market exchange with private farmers (even though the resources available for suchinvestments and the supply of land on the market can be largely attributed to various governmentinterventions in the rural economy in the 1960s). For example, Zik Kumanovo holds 3575hectares of purchased land (41% of its total land). The other farms in the social sector sample forwhich we have land purchase data purchased from 3% to 64% of the land they currently manage.Also, several of these farms, as well as other socially owned enterprises which we visited, havesome amount of land rented to private farmers and a few rent land from private farmers. Rentalcontracts are typically annual and for small parcels (1 - 2 hectares), although there are examplesof private farmers renting from 10 to more than 100 hectares of land from the social sector.
A surprising aspect of our comparative analysis is that the gap in average parcel size across thesectors was not as big as anticipated with the average parcel size in the social sector being 10-12hectares. This amount of land is huge compared to the average parcel size of 0.2xx hectares in oursmall farm sample; however, from the vantage point of European agriculture, this is just about thesize of the average farm (14 hectares on average, typically divided into 5-6 parcels). One can inferthat at least a portion of the fields currently managed by the social sector are of sizes manageableby private producers.
C. RESOURCE ACCESS
The idea of creating the socially owed enterprises was to develop large-scale, modern agricultureby pooling the resources of the society for the benefit of the society. This meant that landresources for private individuals were limited. While the social sector farms were allowed to andassisted in expanding from their initial appropriations of land. Likewise, nonland resources wereconcentrated in the social sector and made available to the private sector principally through thesocial sector farms. Such targeting of development efforts was manifest in the concentration oftechnology (irrigation systems, greenhouses, technical information), the abundance of agronomistsand other skilled professionals in the workforce, the control of input and output marketing, theaccess to the state e.g., the extension service and the ministry of agriculture, and preferentialaccess to subsidized inputs and credit. All of these aspects of favoring the social sector are nolonger feasible nor constitutional and are, perhaps, beginning to change. Change comes slowly,however, and farmers in both sectors still maintain a view of the world based on this past.
D. RELATIVE PRODUCTIVITY
Table 5.1 provides the weighted average yields for seven crops which are of importance in thefarm economy in Macedonia. The yields are given by region for each regional sample of privatefarms and for the social sector farm sample (column headed ‘AIK’). Of note is that the yield ofwheat is significantly higher in the private sector (although there is a wide variance of yield acrossindividual farms/fields in both sectors). For barley, there is no clear advantage of one sector overthe other, only that the yield of barley production in the Mediterranean region is significantlylower than the other values. For tomato production, there is a gigantic gap between the highestprivate sector yield in the Mediterranean region and the social sector yield. This gap is easily
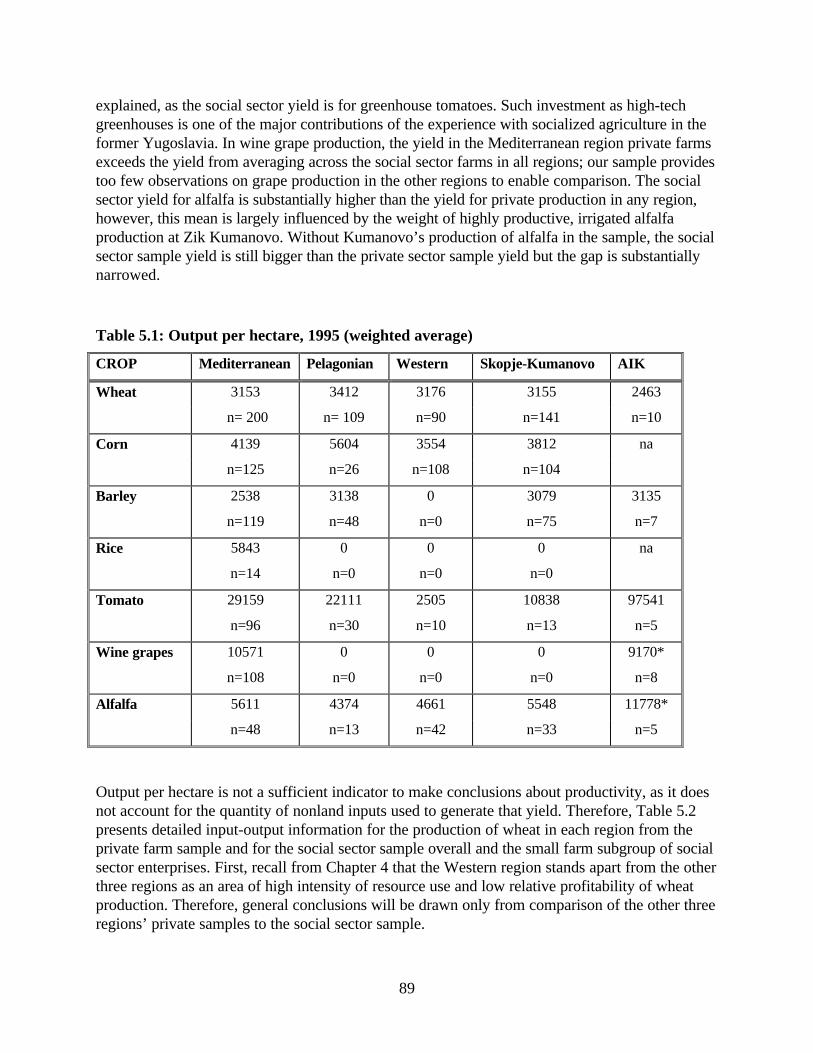
89
explained, as the social sector yield is for greenhouse tomatoes. Such investment as high-techgreenhouses is one of the major contributions of the experience with socialized agriculture in theformer Yugoslavia. In wine grape production, the yield in the Mediterranean region private farmsexceeds the yield from averaging across the social sector farms in all regions; our sample providestoo few observations on grape production in the other regions to enable comparison. The socialsector yield for alfalfa is substantially higher than the yield for private production in any region,however, this mean is largely influenced by the weight of highly productive, irrigated alfalfaproduction at Zik Kumanovo. Without Kumanovo’s production of alfalfa in the sample, the socialsector sample yield is still bigger than the private sector sample yield but the gap is substantiallynarrowed.
Table 5.1: Output per hectare, 1995 (weighted average)
CROP Mediterranean Pelagonian Western Skopje-Kumanovo AIK
Wheat 3153 3412 3176 3155 2463
n= 200 n= 109 n=90 n=141 n=10
Corn 4139 5604 3554 3812 na
n=125 n=26 n=108 n=104
Barley 2538 3138 0 3079 3135
n=119 n=48 n=0 n=75 n=7
Rice 5843 0 0 0 na
n=14 n=0 n=0 n=0
Tomato 29159 22111 2505 10838 97541
n=96 n=30 n=10 n=13 n=5
Wine grapes 10571 0 0 0 9170*
n=108 n=0 n=0 n=0 n=8
Alfalfa 5611 4374 4661 5548 11778*
n=48 n=13 n=42 n=33 n=5
Output per hectare is not a sufficient indicator to make conclusions about productivity, as it doesnot account for the quantity of nonland inputs used to generate that yield. Therefore, Table 5.2presents detailed input-output information for the production of wheat in each region from theprivate farm sample and for the social sector sample overall and the small farm subgroup of socialsector enterprises. First, recall from Chapter 4 that the Western region stands apart from the otherthree regions as an area of high intensity of resource use and low relative profitability of wheatproduction. Therefore, general conclusions will be drawn only from comparison of the other threeregions’ private samples to the social sector sample.
90
The data indicate the following. Seed use is similar across sectors although the cost per hectarefor seed is slightly greater in the social sector. This might be explained by differences in quality ofseed or by the fact that the social sector often serves as the distributor of seed, selling at a mark-up over its acquisition costs. Also, in both sectors, some of the farms use their own seed and thevaluation they give it may not be adequate. Private farmers apply more fertilizer per hectare thandoes the social sector sample, although the three small social sector farms in the sample usesubstantially more fertilizer per hectare than did the small private farmers sampled. Perhaps thereis a declining use of fertilizers in the social sector as a result of decreased subsidization and thefinancial crisis which faces many of the larger social sector farms. It might also be suggested thatthe small farmers overuse chemicals to try to maximize the yield of their very limited landholdings.The application of pesticides was substantially higher in the social sector sample than the averagefrom each of the regional private farm samples. However, again, the small social sector farmsubsample ratio of pesticide to unit of land is much more similar to the private sector ratio. Thereis a big discrepancy in the relative amounts used and the relative costs for acquisition of pesticidesacross the sectors with the social sector using far more liters per hectare and paying substantiallyless. Perhaps this reflects the biases of subsidies and in access mentioned before.
Comparing the overall social sector average labor/land and machine/land ratios suggests that thesmall private farms are both more labor intensive and more machine intensive in their cultivation.This matches the view held by many Macedonians that the private sector inefficiently appliesmachine technology. However, if one again looks at the average values for only the small socialsector farms, the numbers are relatively similar across sectors. In fact, the number of labor hoursis higher in that group. This is surprising from the point of view of the stereotype of peasantexploitation of family labor but not so surprising given the use of the social sector farms as a netfor underemployment (surplus employment). From the latter perspective, it should also be notedthat the social sector labor force is differently composed, having a higher ratio of management tofield labor and having a much more educated and technically trained labor force.
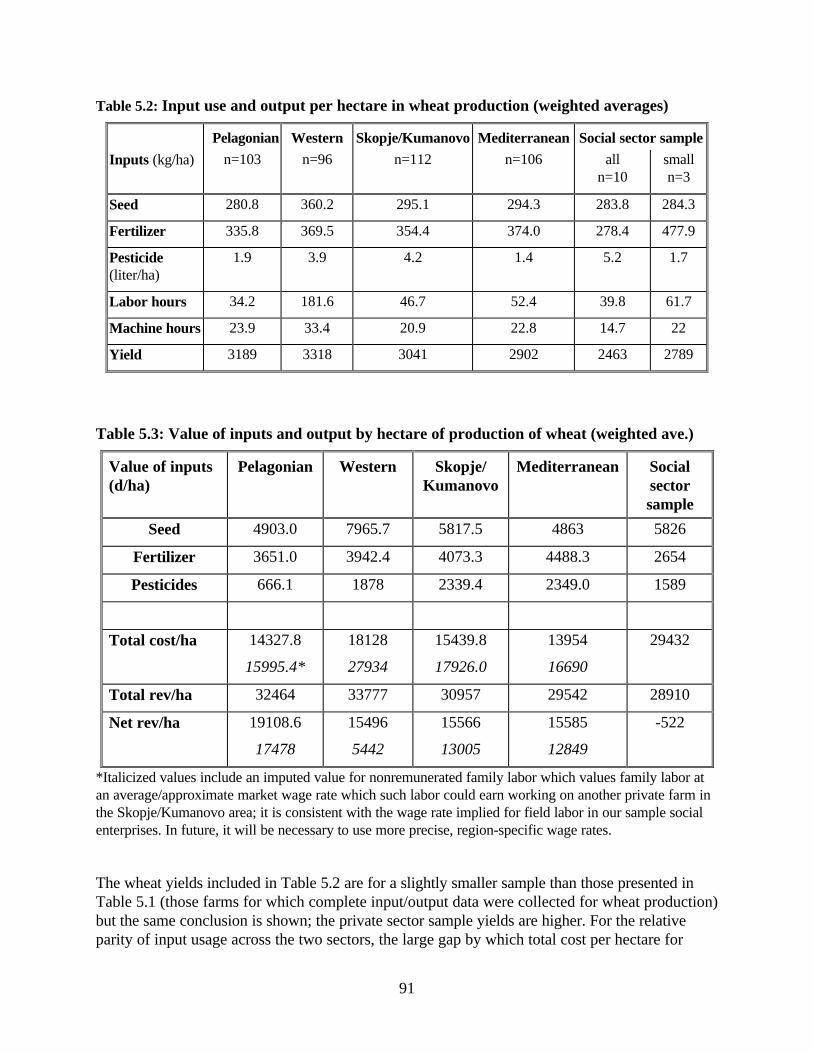
91
Table 5.2: Input use and output per hectare in wheat production (weighted averages)
Pelagonian Western Skopje/Kumanovo Mediterranean Social sector sample
Inputs (kg/ha) n=103 n=96 n=112 n=106 alln=10
smalln=3
Seed 280.8 360.2 295.1 294.3 283.8 284.3
Fertilizer 335.8 369.5 354.4 374.0 278.4 477.9
Pesticide(liter/ha)
1.9 3.9 4.2 1.4 5.2 1.7
Labor hours 34.2 181.6 46.7 52.4 39.8 61.7
Machine hours 23.9 33.4 20.9 22.8 14.7 22
Yield 3189 3318 3041 2902 2463 2789
Table 5.3: Value of inputs and output by hectare of production of wheat (weighted ave.)
Value of inputs(d/ha)
Pelagonian Western Skopje/Kumanovo
Mediterranean Socialsectorsample
Seed 4903.0 7965.7 5817.5 4863 5826
Fertilizer 3651.0 3942.4 4073.3 4488.3 2654
Pesticides 666.1 1878 2339.4 2349.0 1589
Total cost/ha 14327.8
15995.4*
18128
27934
15439.8
17926.0
13954
16690
29432
Total rev/ha 32464 33777 30957 29542 28910
Net rev/ha 19108.6
17478
15496
5442
15566
13005
15585
12849
-522
*Italicized values include an imputed value for nonremunerated family labor which values family labor atan average/approximate market wage rate which such labor could earn working on another private farm inthe Skopje/Kumanovo area; it is consistent with the wage rate implied for field labor in our sample socialenterprises. In future, it will be necessary to use more precise, region-specific wage rates.
The wheat yields included in Table 5.2 are for a slightly smaller sample than those presented inTable 5.1 (those farms for which complete input/output data were collected for wheat production)but the same conclusion is shown; the private sector sample yields are higher. For the relativeparity of input usage across the two sectors, the large gap by which total cost per hectare for
92
production of wheat in the social sector exceeds the private sector ratio may be surprising. On theother hand, it should be no surprise that the cost figures for the social sector incorporate a numberof costs which are irrelevant or not calculated in the small farm sector, such as management,overhead, depreciation, insurance and interest costs. Nonetheless, the bottom line is that wheatproduction yields positive net revenue in the private sector in our 1995 sample while the sameyear, the social sector farm data show a small net loss. These figures, in both cases, abstract fromthe other activities of the farm family or firm and, therefore, must be interpreted accordingly.
E. SOME PROBLEMS OF COMPARISON
At this point it is necessary to mention a gamut of difficulties with the comparison across thesectors of private and social farm enterprises which should qualify the use of the descriptionprovided above. First, there is substantial difference in the sampling methodology and the methodof data collection used to generate the data presented. For both sectors, the samples were chosento include a range of sizes and of agroclimatic regions. However, the social sector sample waspicked selectively according to prior information and contacts with the firms. Attempt was madeto include firms with a range of financial conditions and a diversity of historical circumstance. Theresult is a nonrandom sample of a small number of highly varied social sector farm enterprises.The sample covers 4% of the population but is representative in an illustrative sense. For theprivate sector, the sampling strategy was stratified random sampling; stratifying only by regionand farm size. The sample includes 820 farms covering 0.5% of the population. It is morehomogeneous and is suited to statistical analysis. The main difference in the method of datacollection for the sampled farms is that the social sector data comes from written recordsmaintained by each enterprise whereas the small farm data rely on farmer recall in a lengthy anddetailed interview with trained enumerators. Each method has weaknesses and it would be usefulin the future to employ a method of tracking farms over a year with the research teamparticipating in and monitoring the collection of physical and financial records.
As already mentioned the macro environments in which the sampled farms operate within are verydifferent (although both sectors suffer from overvalued exchange rates, inflation and politicalinstability in the region). The resultant differential in qualities and quantities of resources (labor,seed, fertilizer, land, and capital) available for production are not easy to account for in evaluatingthe relative productivity of the sectors. Furthermore, there exist noncomparable aspects of theinput set (insurance, overhead, debt). Finally, there is a serious problem of accurate valuation ofboth inputs and outputs stemming from a history of planned/controlled prices and the existence ofa substantial barter economy which both sectors participate in. Thus, conclusions about relativeresource/factor productivity in the production of individual crops must be used with caution. Evenmore problematic to generate are comparative statements about total factor productivity orefficiency of agricultural enterprises.
F. CONCLUSION
Despite the above caveats, a fair conclusion is that despite many disadvantages, the small farmersare producing profitably; and, in spite of many advantages, the social sector is not. The data and
93
analysis presented herein challenge some prevailing stereotypes. For example, it is said that thesocial sector farms can not be privatized nor their land restructured for several reasons. First,because the social sector is, and has always been, more productive—from a smaller land base,20% of the nation’s arable land, 50% of the nation’s agricultural product is generated. Second,the social sector farms produce at a scale and level of technology which small farmers can notmanage. Third, the small farmers are backward and unproductive. Our data have challenged thesestereotypical images and instead presented a much more varied picture. For example, our reportdampens the impact of the statement about the relative productivity based on the percent ofland/percent of output comparison. We have noted the following qualifications to suchcomparison: the concentration of marketing capacity in the social sector, the favorable access toinputs that the social sector farms historically had, the relatively good private sector yields forcertain crops, and the discrepancy in how much land is under the management of private farmersas reported in the census and the amount of land the official statistics includes under the categoryof private sector. Next, while there are certain clear achievements in the social sector which mightnot have been accomplished from the pre-socialist private farm sector (such as investments inextensive greenhouses and processing facilities), the private sector is beginning to demonstrate anability to enter the processing side of agriculture e.g. some private dairies doing well, a privaterice mill in Kocani and private input suppliers are emerging. Also, it we pointed to the fact thatthe average parcel size farmed in the social sector is not beyond the scope of individual farmer orsmall, private agricultural enterprise management. Finally, we provide some evidence ofproductivity in the sector of small, private farms.
Our conclusion, is therefore, that restructuring in the sector is needed so that the mismatch inallocation of land and labor resources are eliminated, i.e., the underutilization of land in socialsector, the over-skilled and -sized workforce in the social sector combined with the converseconditions in the private farm economy farm sector. As long as an appropriate framework forrestructuring is created and the legal and institutional bases of a market economy are developed ,restructuring should yield a rationalization of enterprise and production strategies. This will occuras incentive-based decisions lead to eliminating diseconomies of scope which characterize thehuge, complex social sector farm enterprises, and to the guiding of land to its most productiveuses and users. These uses and users will be diverse and will include in some instances acontinuation of the present management of land and in other instances will entail reallocation.
94
VI: SUMMARY OF RESEARCH FINDINGS AND POLICYRECOMMENDATIONS
A. SUMMARY OF RESULTS
The results of the research conducted on the two subsectors and the legal environment in whichthey operate are given in detail in the preceding chapters of this report. In Section A, our resultsare summarized in order to provide justification for the policy recommendations made in SectionB. In Section C, a list of specific legal reforms is proposed as an agenda for the developing marketeconomy in agriculture. Section D discusses financial and technical assistance needs flowing fromthe policy and legislative agenda proposed herein.
1. Comparative productivity and profitability of small farms andagrokombinats21
• For some crops, including wheat and barley, the productivity of small private farms, asmeasured by yields per hectare, is as great as or greater than that of the agrokombinats. Forothers, such as tomatoes and alfalfa, the agrokombinats achieve significantly greater yields.
• Agrokombinats did not produce any crops profitably except for alfalfa and fodder peas, bothintermediate goods whose profitability may have been artificially determined by high internaltransfer prices.22 By contrast, private farmers achieved profitability on many crops, even whenfamily labor was valued at the market wage. A major explanation for the unprofitability ofagrokombinat production was the high level of overhead costs (management expenses,interest on debt, etc.).
• The macroeconomic situation (overvalued exchange rate, inflation, unemployment) andpolitical difficulties (border closures) have had negative effects on the performance of bothsubsectors, as both export and domestic markets have declined.
2. Effects of fragmentation on productivity and profitability of smallprivate farms
• Fragmentation of private farmers’ landholdings has costs in terms of travel time and difficultyof using efficient cultivation techniques, but it also has benefits in terms of spreading the risk,
21 There is no evidence of systematic bias in reporting by private farms as compared to social-sector farms.If there were such a bias, however, the Macedonian members of the research team suggest that privatefarmers would tend to underestimate their yields and social-sector farms to overestimate theirs.22 Evidence for this is that lamb meat and cow’s milk, for the production of which alfalfa and peas areimportant intermediate goods, are among the least profitable outputs of the agrokombinats.
95
crop diversification, and equitable sharing of available land resources (e.g., subdivision of eachparcel via inheritance).
• There is not a systematic, significant relationship between fragmentation and the productivityof small farms. In other words, fragmentation does not appear to be a generalized problem. Incertain regions and for certain crops, however, productivity might be increased if parcels werelarger.
• Many farmers, especially the younger ones, consider fragmentation to be a problem andexpress willingness to participate in consolidation programs.
• Land market activity of private farmers—purchasing and leasing—increases the operationalsize of holdings and has a positive impact on measures of fragmentation.
3. Economics of the land market
• There is a significant potential demand for agricultural land from private farmers who desire toincrease the size of their holdings.
• There is a significant potential supply of agricultural land from older farmers and those whowould prefer nonagricultural employment.
• Land markets are less active in rural Macedonia now than they were in the past. This is due at leastin part to increased perceptions of risk due to macroeconomic, sectoral, and political factors:inflation, overvalued exchange rates, removal or revision of subsidies, and closed national borders.A return to higher levels of transactions will await the resolution of macroeconomic andsectoral problems, as well as the removal of significant legal impediments.
4. Legal and institutional constraints to increasing productivity andefficient land market operation
• A large number of laws currently in force concerning land and related agrarian issues haveprovisions that are in violation of the Constitution, especially its guarantee of private propertyrights.
• The recently passed Law on Transformation, with its provision to lease the land currently heldby agrokombinats to the privatized successor enterprises without rental payments for fiveyears, will create perverse incentives that will reduce the prospects for increased productivityand profitability.
• The current transitional legal situation, which has been prolonged by delays in the enactmentof the Law on Denationalization, has increased uncertainty and has likely contributed to amarked decline in purchases and sales of agricultural land since independence.
• Transactions costs such as legal fees, number of approvals required, and time are a significantdeterrent to purchase, sale, leases, mortgages, and inheritance transfers of private land.
• Inheritance practice, unlike inheritance law, systematically discriminates against the land rightsof female heirs, who “voluntarily” renounce their rights in favor of their brothers or sons.
96
5. Market orientation of the private farm sector
• In spite of small farm size, fragmentation, and market problems, there are a substantial numberof “serious” farmers who will respond positively to appropriate incentives for increasedagricultural production.
• Many small farmers market substantial proportions of their output of many crops; this isespecially true of the larger of the small farmers—those with 2–3 hectares or more.
• Land market participants, especially renters, specialize in cash crops on newly acquired land,suggesting good prospects for nonsale transactions (including leasing of agrokombinat land).
B. LAND POLICY ADJUSTMENTS TO PROMOTE THE INCREASED
PRODUCTIVITY AND PROFITABILITY OF THE AGRICULTURAL SECTOR
This section discusses the policy themes that must be addressed to enable market forces togenerate appropriate incentives for landholders to optimize the use of their land. It concludes witha summary of the legislation that will be required to support the policies adopted.
1. Land market development
Land markets are less active in rural Macedonia now than they were in the past. This is due atleast in part to increased perceptions of risk due to macroeconomic, sectoral, and political factors:inflation, overvalued exchange rates, removal or revision of subsidies, and closed national borders.The stagnant period in the demand for land is likely to end soon. The demand for land for residentialpurposes on what has hitherto been agricultural land is increasing rapidly. The economic constraintson the supply and demand for land through market transactions have been reinforced in the past bymacroeconomic changes as well as sectoral policies influencing the profitability of agriculture; both are nowunder revision and should pose fewer difficulties in the future. Finally, Macedonia in 1996 hasopen borders on all sides for the first time in many years.
There are many potential participants on both demand and supply sides of the land market. Inaddition to private farmers and entrepreneurs, potential purchasers or lessors include agrokombinatadministrators, technicians, spouses employed full-time off the farm, and perhaps foreign investors.However, unregulated land markets can create problems; there can be inequalities created as thosewith capital accumulate land and those without capital are forced to sell, and there can also beserious land degradation if new owners misuse their land through ignorance of good conservationpractices or through inappropriately short-term perspectives. The creation of dynamic land marketswhich are also accessible to wide sectors of the population and which preserve the land base for futuregenerations is a difficult challenge.
There are many legal and institutional impediments to land market operation. These are detailed insubsequent sections.
97
2. Linkage to the credit market
To mobilize the often substantial capital required for the acquisition of immovable properties, peoplecan draw on their savings or on loans from family and friends, or they can apply to financial institutionsfor the needed capital. Typically in transition countries the restructuring of financial institutions goesthrough a stage of instability; often financial institutions are bankrupt in a context of high inflation.During this stage, capital for long-term loans typically is greatly limited and/or interest rates are veryhigh. Temporary measures are required, such as mobilizing remittances from abroad, and long-terminstitutional innovations are needed (financial sector reforms, secure and all- encompassing immovableproperty registration system, and simplified procedures for mortgaging immovable properties).
In mature market economies, a significant proportion of medium- and long-term lending is secured byusing immovable property as collateral. Institutional support for this relationship has to be created,including legal procedures for registering mortgages and for enabling foreclosure upon nonpayment ofloans, general public knowledge of such arrangements and acceptance of their legality, and protectionof the rights of the borrowers against arbitrary foreclosures.
3. Transactions costs on land sales
The transaction of buying and selling agricultural land is still quite bureaucratized. In Tetovo, forexample, a seller has to obtain the following documentation, usually through a lawyer, in order tosell agricultural land legally:
• contract for purchase (to register the transaction);
• certificate from the cooperative and/or agrokombinat in the area, stating that it is notinterested in purchasing the land;
• statements from people owning the neighboring plots, saying that they are not interested inpurchasing the plot;
• certificate from the Tetovo office of the Ministry of Civil Engineering, saying that the land isnot part of construction land; and
• certificate from the Tetovo office of the Ministry of Finance, stating that it is not land that hasbeen nationalized.
Lawyers estimate that the paperwork for a land sale can be done in about 5 days at a cost of 300to 500 DM in lawyer’s fees, but the time estimate does not include possible—and even likely—delays in obtaining the various certificates. In addition, there is a transfer fee of 3 % of thedeclared purchase value.23 The buyer pays that fee and the lawyer’s fee. The buyer and sellernormally use the same lawyer. The seller pays the fees for the various certificates but they are verysmall and this is taken out of the money the seller receives.
23 The fee was recently reduced from 20% of declared sales value, a level at which avoidance andunderreporting were undoubtedly severe.
98
The procedures are burdensome and the costs are fairly high. Legal fees represent approximatelyas much as the transfer fee in a typical transaction on agricultural land; an average parcel of 3dekars (0.3 ha) might be worth 15,000 DM, so that the legal fees would amount to about 2–3%of the sales price. This is higher than in countries like the United States, known for its hightransactions costs on land because of its outmoded deeds registration system, where typical legalfees and other costs (such as title insurance) amount to at most 1% of the purchase price.
It is essential for land market development that transactions costs be reduced. The most importantof these are not the monetary fees, but rather the certifications required from government,agrokombinats, and neighbors, which ensure that a transaction involves many more actors thanjust the buyer and seller. This may have a chilling effect on transfers in many cases.
4. Intrafamily land transfers (inheritance, etc.)
The Constitution assures equality of Macedonian citizens regardless of gender or race. Accordingto Macedonian Family Law, legal heirs include both legitimate and illegitimate children. In actualpractice, in rural areas most daughters, particularly ethnic Albanian daughters, renounce theirlegal rights to inherit from their parents, leaving property in the estate to their brothers todistribute among themselves. There are cases in which a daughter will legally inherit land becauseshe is under 18 years of age (heirs under 18 years of age cannot give up their inheritance rights).However, she and the family actually allocate that land to brothers or other male relatives who useand manage the land as if it is theirs. Thus, although a daughter may have legally inherited andlegally accepted property and is the formal owner of it, she is not the effective owner.
The Law on the Family specifies that a widow should receive half of the property a couple haveaccumulated and the children the other half. If the husband contributed more to the estate than thewife, she get less than 50% of the estate. If there are disputes, people go to court and provideevidence on the contribution of the spouses to the estate. Among ethnic Macedonian families, awidow will sometimes claim all or part of her inheritance right, particularly if the children areyoung or if she feels that she cannot rely on her children’s looking after her and she needs toensure her livelihood. In Albanian families, however, widows do not inherit any property whentheir spouses die; the eldest male in the family is generally the heir rather than the widow, or thebrother of the deceased if there is no son.
The law provides options for parents to transfer real property to their offspring while they are stillliving as well as after death. There are three types of transfer during life: (1) gift contract, (2)lifetime support contract, and (3) contract for distribution of property during lifetime. Thesetransfers are governed by the 1872 Serbian Civil Code; they are not regulated by the Law onObligations. They are considered “practical” because they eliminate or reduce land transfer fees:first-generation heirs are exempt from paying the transfer fees on a gift or other lifetime transfer.
The law can do little to change people’s behavior in cases like the inheritance rights of women. Iflaw contradicts custom and there is neither a means nor a will to enforce the law, customarypractices will prevail. As in most societies, however, nonlegal phenomena such as an increase inthe educational attainment of women will eventually lead to changes in custom.
99
5. Protection of agricultural land
The issue of conserving the quality and quantity of agricultural land was not part of the LandProductivity Action Plan per se. It is advisable, however, to anticipate future problems in landdegradation (quality) and conversion to other uses (quantity) as part of an overall strategy of landmarket development. The detail given here for the protection from environmental degradation isthe nucleus of a future “land protection action plan.”
Protection from inappropriate conversion to other uses
Within the zone of economic influence of cities and towns, an unregulated land market willinevitably lead to the conversion of prime agricultural land to other uses: residential, commercial,or infrastructure; this threatens the capacity of the country to feed itself and to generate an exportableagricultural surplus. This is one of the principal areas within a market economy where regulation bygovernment is justified. Attention should be given to the development of a land use planning andzoning system that is responsive to both present economic pressures for conversion and future nationalneeds for productive agricultural land.
The government’s current approach to land use planning is manifest in the Land Use Law, a newversion of which is being drafted, and in regulations on “construction land,” land reserved forbuildings in the future even if the current use is agricultural. The Land Use Law, and apparentlyalso its successor, is very restrictive and authoritarian. For example, it contains a provisionrequiring that all agricultural land be cultivated; if the land is not used for two years, the ownermust offer it for sale. The construction land provisions are important, since construction land isformally owned by the state and therefore is not subject to purchase or sale, although anybuildings on it are.
Future land use planning and zoning must be conducted not by government officials from Skopje,but rather via a participatory process at the municipality or village level. Local variations in thedemand for housing and the productivity of agricultural land are large, and local authorities andcommunities are more likely to understand and have vested interest in locally appropriate land-useplanning. The legislation on land use should be harmonized with constitutional principles, shouldreplace prohibitions with incentives, and should permit local governance.
Protection from environmental degradation
Future generations have the right of access to immovable property within a sustainableenvironment; the design of immovable property market institutions must reflect this right. Whilemarkets may be the optimal institutions for allocation of resources in the short run, they may failto give proper weight to long-run considerations such as future productive capacity. Some buyersof immovable properties may have very short time horizons, intending to recoup their investmentsrapidly. This can lead to destructive land use practices. Buyers have to be made aware of sociallydesirable limitations on their use of the land, and these limitations have to be real rather than just legalexpressions of empty desires.
The degradation of land resources is a serious impediment to the welfare of the current population aswell as that of future generations. Soil erosion is a key problem that relates not only to environmentalquality but also to food security. In addition, the potential for catastrophic flooding is great in many
100
transition countries because of widespread deforestation, loss of soil through erosion, andsedimentation in reservoirs that reduces the storage capacity. The lower plains are susceptible toflooding. The pollution of soil, water, and air by agriculture and industry directly affect health andwelfare.
There are several steps that can be taken that will complement market forces to ensuresustainability:
• Document land degradation problems, identifying the nature, extent, and geographical location ofthe land degradation, with special attention to high-risk areas.
• Conduct research on land degradation: air, soil, and water quality should be monitored on a routinebasis. Applied research that is needed to improve the productivity of agricultural ecosystemsinclude: (1) study of alternatives to gravity irrigation systems, (2) ways to maintain drainagechannels in reclaimed areas of the plains, and (3) farming systems approaches to avoiding soilerosion. Applied research is also needed to clearly identify and map the high-quality agriculturalland surrounding urban areas as well as the location of the urban boundaries.
• Design educational programs to inform farmers and the general public about the types of landdegradation, their causes, the extent of the problems, their effects on the welfare, health, and safetyof all people, and methods for prevention and protection of the environment. The general publicshould be educated on the prevention of land degradation because public support is necessary foran effective land protection program.
• Examine existing legislation for adequacy in a land protection program. It is likely that there is aneed for developing a Soil and Water Conservation Law that includes provisions for controllingsoil erosion on the land and preventing surface and ground water pollution from sedimentation,nutrients, and pesticides resulting from soil erosion. Such a law should involve both national andlocal governments in soil erosion and water pollution control programs, with responsibilitiesassigned to both levels.
• Public resources will be needed to address the different types of land degradation by sharing thecosts with owners of land or enterprises. It will also be necessary for those owners of land orenterprises where degradation is most severe to share in the costs of correcting the deficiencies.
• Implement a land information system to monitor different types of land degradation. Detailedresource mapping is usually available in transition countries concerning natural resources.However, few of the data have been digitized, and few reproducible maps have been prepared todepict the potential and actual extent of land degradation, particularly the high-risk areas. Many ofthe data presently are stored in notebooks that survived the initial shocks of government reform.Accordingly, it is essential that these data be archived on computer, at a minimum to show thegeographic distribution of various forms of land degradation, especially in areas of high risk.
• Another component of this strategy is the clear and active consideration of what land should beexempted from normal market activities, such as greenbelts around cities and lands whereenvironmental conditions are fragile or biological diversity is seriously threatened. In such areas the“development rights” of private owners will have to be limited, but in ways perceived as fair andnot as confiscation of private ownership rights. This structure for the appropriate limitation ofdevelopment rights should be rapidly considered, while people are learning what private ownershipmeans for property in which they have not invested much personal, private capital.
101
6. Equity considerations
For land and other immovable property markets to work properly, there have to be many participantson both the demand and the supply side. Market participants must also have access to reliable, up-to-date information on property availability, prices, and conditions. Moreover, in order to avoidtensions due to the polarization of society the immovable property market has to be open to all thepeople, those with initial capital and those without, to women as well as men, to people of differentethnic backgrounds. Examples of programs which are needed include:
• publicly accessible information on property prices and availability;
• special programs for young people and/or people without capital to assist their competing for landand immovable properties (mortgage guarantees, subsidized loans for beginning farmers, localgovernment land-bank programs);
• removal of biases against certain social groups’ rights to buy and rent properties;
• protection of the rights of family members, especially spouses, to participate in transactions toavoid irresponsible behavior of family heads;
• simple rules for family management of immovable properties when the family head is absent; and
• clear and simple rules applicable to all social groups for the transfer of ownership, for leasing andrenting, for inheritances, and for mortgaging of immovable property.
7. Conflict resolution
Privatization and denationalization of land inevitably engenders disagreements among recipientsand between recipients and the government. Sometimes this is inherent in the process: mostCentral and Eastern European countries restituted some, but rarely all, land to the previousowners; in other countries, such as Albania, ex-owners are generally being compensated in moneyinstead of land. In neither situation can everyone be accommodated completely. In addition,boundary conflicts and inheritance disputes will gradually arise as land is more clearly perceived asa valuable asset. Not all of these disputes will be able to be handled at the local level, and the civilcourt system is likely to be inadequate to handle the volume of litigation, especially because itsresponsibilities unrelated to land have also increased during the transition. In some countries a specialadministrative tribunal has been created to relieve the pressures on the courts by the very numerousconflicts among people concerning the facts of ownership and use of land. Such a tribunal would operatewith more flexible rules of evidence and would include both lawyers and nonlawyer land specialists asmembers of the tribunal.
8. Cadastral property registration system
Potential buyers, lessees, renters, and mortgagors will not readily offer to acquire the ownership or useof properties unless they are able to identify the true owner or use-right holder and be confidentthat the rights are securely held. The public identification of the true users and owners of immovableproperties is one of the main functions of an immovable property registration system.
102
The current cadastral land registration system is in the process of modernization, with updating ofmaps and storage techniques as well as verification of current land titles. The system has twoserious flaws, however:
• The only registered interest contained in the cadastre is ownership. Such interests asmortgages, leases, tax liens, and so forth are not included in the registry. The problem withthis is that potential purchasers or lenders cannot learn whether the title to a parcel is free andclear, and therefore must devote considerable effort to title search, and even then must facerisks. This has not been a problem in the past, when interests other than ownership were trivialin Macedonia, but will be in the future when transactions become more frequent.
• Many transactions have been unregistered in the cadastre although they have been registeredin the court system. This is partly due to the high level of the former transfer fee; there is someevidence that since the fee was reduced and people are registering prior transactions, thecurrent volume of registrations is an overestimate of the current volume of transactions.
There is ample regional experience with the development of immovable property registrationsystems that could be brought to bear in Macedonia. Most countries, following the lead of nearlyall industrial nations, have adopted the principle of a unified system, with all types of land andother immovable property entering into the same system. In other words, the cadastre covers notonly agricultural land owned by private farmers but also land owned by the state and given in useor lease to the social sector or others, as well as land used for residential, commercial, pasture,forests, protected areas, roads, administrations, etc. Thus every square meter of land in thecountry is in an identifiable parcel, with all relevant interests in land recorded.
The advantages of a unified title registration system are numerous. First, it reduces transactionscosts because the information is all in one place; persons interested in a parcel would save timeand money (for example, if the parcel were on construction land that information would beincluded). Second, it is much easier to use the information for planning; a single database wouldbe sufficient to construct a comprehensive cadastral map for any one of a number of purposes,e.g., siting of utilities, determining appropriate urbanization districts, or identifying alternativeconsolidation patterns.
It is extremely important that the registration system be accessible to all users, both thoseregistering their interests in land and those desiring to obtain information about parcels. Thisimplies that the registration process should be as streamlined and low-cost as possible (full costrecovery is possible, as experience in other countries shows) and that anyone be able to consultthe records on short notice. In other words, the registration system should be a public servicerather than an administrative agency.
9. Consolidation of fragmented private farm holdings
The experience with administrative efforts to promote consolidation of fragmented farm holdingsis not promising, in either Macedonia or elsewhere. Benefits of successful consolidation are not aslarge or as widespread in practice as they are in theory, as the LTC survey research shows; parcelsize and comprehensive indexes of fragmentation do not show a strong negative relationship withproductivity. Furthermore, costs of consolidation programs are high, farmers are reluctant, andfrequently there is reversion to old boundaries once the formal exercise is complete. In Hungary,
103
for example, an expensive, donor-supported program using computer-graphical techniques todemonstrate the equivalence in productive potential of rationalized parcels has been completelyunable to convince key local decision-makers to agree to participate.
While it is preferable for market forces to play a major role in determining appropriate farm sizes andlevels of fragmentation, in the early stages of market operation such forces may not give sufficientlyclear signals. Therefore, it will be necessary to develop a system of targeted incentives to encouragefarmers to seek means of consolidation, by entering into agreements with relatives and neighbors toexchange parcels, to increase farm size or increase the average size of their parcels by other means. Theincentives could consist of tax credits, differential access to credit, or other government-supportedinitiatives, or could be tied to other programs such as access to leasing of state-owned land or technicalsupport from the extension service. However the program is structured, it should be preceded byserious efforts to understand the entire set of constraints to consolidation and also by a campaign ofpublic information about the goals and mechanisms of the consolidation program.
10. Social sector restructuring: leasing of publicly owned agriculturalland
It is clear now that the agrokombinats will be privatized in some manner over the next few years.To some extent, current employees and managers have a privileged view of their enterprises, andthey are therefore essential participants in the restructuring process. On the other hand, theyshould not have complete decision-making power, because the enterprises were developed andsupported by state resources (i.e., resources of the entire population). Since national interests areinvolved, representatives of those interests—both government and nongovernment—should beincluded in the design of restructuring. The Land Markets Project is concerned not with theoverall privatization process of the agrokombinats, but only with the productive use of the landthey now hold. The current government strategy is not to privatize that land, but to retain it instate ownership and to lease it out to private users on a long-term basis.
The land resources currently held by the agrokombinats are to be made available to private users,both the successor enterprises and individuals. The provision in the Law on Transformationpermitting the privatized successors to have exclusive use of the land, rent-free, for five years is aviolation of both the principles embodied in the Constitution and the national interest in thedevelopment of a land market that encourages land to move toward its most productive use.Rent-free land, as a “free good,” will be insulated from market forces; the enterprises will have noincentive to consider it a scarce resource. Justifications given for the provision vary; the mostcompelling are that the agrokombinats have made investments in the land that should becompensated by forgiveness of rent, and that the current debt burden of the agrokombinats doesnot permit them to pay rent. The former is inconsistent with government policy that prevented theagrokombinats from owning “privately” the land they have purchased; furthermore, theagrokombinats have had the land rent-free for years already, which is adequate compensation forinvestments. The burden of the debt is evident, but there are better ways to deal with the problem,such as rescheduling or assumption of the debt by the state.
If the law cannot be amended to remove the provision granting land rent-free to the privatizedsuccessors of the agrokombinats, regulations should be drafted to distinguish among different
104
types of land. There are two dimensions: the mode of acquisition, and the current use ofagrokombinat land:
Mode of acquisition
• acquired from the state via nationalization since World War II;• acquired from the state via reclamation, other investments, or simply by appropriation of commons;
and• acquired via purchase from private farmers.
Current use
• farmed productively by the agrokombinat;• leased to private farmers; and• unused by the agrokombinat.
The six categories clearly should not be treated equally in terms of determining rents. It would beseriously counterproductive for unused land to be leased rent-free, and according the same benefitland currently leased to private farmers would be a pure gift to the new enterprises. Similarly,there is a public interest in the land given to the agrokombinats by the state (except for thatsubject to denationalization) which implies that a lease should not be rent-free. The only type ofland where a serious argument for rent forgiveness can be made is land that was purchased by theagrokombinat and is currently used productively by it. It should be possible to develop languagein the contract to be signed within thirty days of privatization between the government and theprivatized successor enterprises that requires the enterprise to use the land productively, or paymarket rents, and possibly also to distinguish between land it purchases and land it is granted bythe state.24
Assuming that at least a portion of the land currently held by agrokombinats will be publiclyavailable for lease (and eventually purchase, according to planned legal change), it is important toformulate policies about the terms of the leases. The principal factors to be considered are:
• allocation rules: who is eligible (existing farms, current employees, anyone)? how to allocate(auction; lottery; entitlements)?
• rental fees: what criteria (market value; fixed rate nationally; free, or nominal)?• length of the lease: longer term may encourage investment and conservation but reduce potential
for reallocation in case of inefficient use;• renewability and inheritability;• compensation for investments made during the lease term;• conditionalities: what land use is acceptable (cropping controls, environmental protection)?• administration: what government structures are required to manage leaseholds?
A related issue concerns other state land with productive potential. Substantial portions of theforests and communal grazing land are retained in formal public ownership, but are used by privatepeople and companies under different arrangements with different entities of public administration. It is 24 Care must be taken to avoid excessive supervision requirements and unenforceable land userequirements, however. The distinction between productive fallow and objective abandonment can probablybe made.
105
necessary to find new ways to empower local communities, whose members themselves have interestsin using these resources, to benefit from and monitor the private concessions, leases, or rentals ofpublicly owned pastures and forests.
11. Market information and public education
One of the most dramatic changes in the last few years has been the collapse of the marketingsystem for most agricultural products. Unless private farmers are able to secure contracts withagrokombinats for their output, which they are less able to do than before, they have no sourcesof market information upon which to make cropping decisions. Their response has generally beeneither to diversify in order to increase the likelihood that at least one of their products will bemarketable (the “lottery strategy,” as one farmer put it) or to concentrate on the few crops, suchas wheat and tobacco, for which there is a fairly certain outlet.
It is essential to develop mechanisms by which farmers can get market information so they canmake production decisions rationally. One possibility is to assign this task to the extension service,which now concentrates its limited resources on improved seeds, plant protection, and livestockproduction; or to a university research institute; or to the print and electronic media. Anotherpossibility is to encourage the development of nongovernmental organizations, both nonprofit andfor-profit, which could provide market information. One appropriate type of organization is amarketing association, whose performance would be enhanced if its potential clients were awareof market conditions. Such associations could therefore serve as information intermediaries aswell as suppliers of inputs and/or purchasers of outputs.
There is also a need for more general information about the impact on people’s lives of the marketeconomy, the reduced role of the state, and the transformation of the social sector. In the samplesurvey, private farmers expressed astonishing confidence that the government would again be thesource of support to their livelihoods, once the unpleasant transition passes. They must bedisabused of this notion. They must be made to realize that in the future they will have to relymore on themselves and more on nongovernmental intermediaries. A public education campaign isneeded that outlines the legal and structural changes in the relationship between the governmentand the private economy, as well as more practical information such as how to prepareapplications for credit and the existence of emerging opportunities for private initiative.
Finally, the overall agricultural information system requires a major overhaul. Inconsistenciesbetween reporting sources are substantial (see footnote 1) and there are very limited data availableon the private farm sector. Now that the government is committed to encouraging privateinitiative in agriculture, it must have the information available for it to fulfill its new role.
C. SUMMARY LEGISLATIVE REFORM AGENDA
Much legal work is required, but legislation must be drafted in a manner that fits the policycontext rather than the legal theory alone. If laws are too prescriptive, they will be unable to adaptas the socioeconomic realities change. If they are too general, they lose all practical meaning. Thelegislation most likely to succeed in achieving its purpose sets a framework within whichgovernment and the private sector understand the rules with certainty and can act rationally in
106
response to market incentives. The following legislative initiatives should be given priority in order toachieve the goal of secure and marketable titles to private properties.
• Analyze all relevant legislation to ensure that it is in harmony with the constitutional guarantee ofthe right to private property; amend or replace where necessary; and identify gaps to be filled andlegal uncertainties to be clarified. In the perspective of association with the European Union, alsoverify conformity of the legislation to EU principles.25
• Verify the validity of existing titles to private land and buildings. (The Cadastral Office isundertaking a program of modernization, due to be completed in 2001. However, bureaucraticdelays are common, as are disputes among the recipients of properties.)
• Modify legislation on land registration to enable the cadastral offices to register other interests onland, such as leases, mortgages, and tax liens.
• Develop legislation on private immovable property services, such as surveyors, real estate brokers,and valuers/appraisers, to ensure efficient, low-cost transactions.
• Modify legislation on mortgages and use of immovable properties as collateral in order to integratethe land and credit markets more fully.
• Adapt land use legislation to incorporate a transparent system for the leasing of state-ownedagricultural land and an equally transparent system for its eventual sale. In addition, remove fromlegislation the restrictive and authoritarian provisions that mandate the productive use of land.
• Clarify the restitution provisions of the draft Law on Denationalization, concerning agriculturalland as well as pastures and village land.
• Amend or replace the current legislation on consolidation of agricultural holdings, replacingcompulsory elements with incentives and enabling consolidation to be tied to other programs suchas the leasing of state land, differential access to credit or extension services, or denationalization.
• Clarify the ownership, management, and use of communal lands, such as pastures and forests closeto villages (it is not necessary to privatize these, but only to ensure that owners, managers andusers have transparent and equitable relationships).
• Clarify the ownership and use rights to dwelling units and surrounding land through modificationsin the legislation on construction land.
• Modify legislation on resolution of conflicts over land due to inheritance and boundary disputes,envisioning the possibility of establishing a special land tribunal.
• Develop and implement condominium legislation and assist in the organization of associations tomanage common areas of buildings (governments have been anxious to privatize state-owneddwelling units, but have neglected to establish the condominium arrangements for managingcommon areas in apartment buildings).
25 Report 3 outlines the corpus of relevant legislation and points out many of the important contradictions,but much more work is needed, especially because of the need to adhere to European Union principles andbecause of the continuing work of the Constitutional Court.
107
• Define the rights of the constituent members of the various types of associations and commercialcompanies which will own and lease land. Privatization of land often means that not just individualsor families become the owners of rights, but that partnerships composed of several families holdthose rights to land. The rights of the members to the assets of the collective are often inadequatelydefined; this has led to the gradual bankrupting of the collective.
• Clarify and legalize the easements on private or privately used parcels of land, both rural and urban.The breakup of large fields into smaller parcels often overlooks the question of access to parcelsnot bordering on access roads or water sources.
D. FINANCIAL AND TECHNICAL ASSISTANCE TO SUPPORT THE
DEVELOPMENT OF LAND MARKETS TO PROMOTE EFFICIENT, SUSTAINABLE,AND EQUITABLE INCREASES IN AGRICULTURAL INCOMES
On the basis of the research results and their policy implications, the Land Markets Project teamproposes a series of follow-on activities which will enhance the prospect for successfuldevelopment of land markets and the consequent improvements in agricultural productivity andprofitability. Six themes are identified: (1) legal reform; (2) upgrading the cadastral landregistration system; (3) improving public land administration capacity; (4) establishing monitoringand policy analysis capacity; (5) consolidation; and (6) market information and public education.International donor assistance will be required for all of these activities, to varying degrees; theyare not necessarily independent “projects,” but could be easily combined in some manner.
1. Legal reform
The Republic of Macedonia has a good number of well-trained attorneys to analyze and draftlegislation. Their exposure to market-oriented, democratically based legal concepts and legislativeprocesses is, however, limited. Furthermore, the best legislation is grounded in an understandingof political, economic, social, and technical realities that are rarely part of the typical legaleducation. There is a need for technical assistance from Europe or North America to assist theappropriate government agencies in undertaking the substantial amount of legislative workdetailed above.
Based on experiences in other countries, the technical assistance should consist of a mix of long-term and short-term support. At a minimum, there should be one broadly trained expatriate legaladvisor, housed in the Ministry of Justice;26 it would be preferable to have another advisor in theMinistry of Agriculture, either an economist with ample experience in legal reform or a lawyer
26 For legal development it is essential that the advisors be closely connected to the Ministry of Justice,because that is the agency responsible for guiding the legislation through the process from drafting toenactment. If the principal advisor is in the Ministry of Agriculture or any other sectoral ministry, draftlaws and regulations tend to receive lower priority by the government and the Parliament.
108
with solid understanding of agricultural economics.27 The long-term assistance should becomplemented by a cadre of legal, economic, and social consultants who would address specificissues at the recommendation of the long-term advisors.
It is estimated that this legal reform program could be accomplished in two to three years, thusrequiring four to six person-years of long-term expatriate technical assistance and approximatelythirty-six person-months of short-term expatriate technical assistance. An equivalent amount ofMacedonian technical assistance would be needed. Material assistance should include adequateoffice equipment.
2. Upgrading the cadastral land registration system
The current project of the Geodetic Administration to update all cadastral maps and title registersis due to be completed by 2001. That project will need to be complemented by a broadening ofthe content of the registry to supplement the current information on ownership with otherinterests in land, such as leases, mortgages, and tax liens. In addition, the registry offices will haveto be reorganized so that they can provide the public service required by an active land market:inexpensive and open access to information on land parcels. A new title document must bedeveloped, new administrative procedures defined, and information systems designed andequipped.
Technical and financial assistance to this effort will complement the substantial Macedoniancapacity in land titling and registration. Experience from other countries with unified titleregistration systems will be brought to bear. It is estimated that this program would require one totwo person-years of long-term expatriate assistance in the initial stages of a project whose lifewould be approximately five years, together with short-term assistance in informationmanagement and registry procedures and substantial support to office reconstruction andcomputerization.
3. Reinforcement of public land administration capacity
Whether the government persists in its determination to retain the ownership of substantialagricultural land or instead decides on eventual privatization, it will retain ownership of a largearea of productive land, both rural and urban, and also will continue to have an interest inproductive use of private land. In the market context it must develop a streamlined landadministration system, both to determine the most appropriate use of the land and to receiveincome from land, its most valuable single asset. There are three elements of public landadministration that need to be addressed, apart from the immovable property registration systemdetailed above: (1) land taxation, (2) administration of leases and other forms of land use permits,and (3) land use planning and zoning.
27 Depending on the extent to which parliamentary processes are a constraint to timely legislative reform, itmight also be desirable to have a long-term advisor to the appropriate committees of Parliament.
109
1. Development of an appropriate land taxation system is important not only because its proceedscould contribute substantially to the revenues of local governments, but also because it could giveincentives to landowners to use their land appropriately. Assistance from countries whereproperty taxation is a major source of revenue and is used as an active land-use policy tool will behighly useful. An expatriate advisor with expertise in property valuation in transition countries,housed in the Ministry of Finance, could assist the government in the creation of such a systemwithin two years. The advisor should have access to short-term consultant resources in legalissues and database management.
2. The Ministry of Agriculture is currently responsible for land management for several hundredsocially owned agricultural enterprises as well as for leases of small, scattered parcels of“unorganized” social sector land. In the future, the number of enterprises using state land will begreater. In addition, it is likely that pastures and forests will be managed under leasehold or othertypes of permits granted to private land users. A completely new administrative structure will berequired. That structure will have to maintain records on applications for land use, current leasesand permits, rental payments, and renewal documents. It must also determine procedures toallocate land access among competing applicants, set the appropriate rental rates, adoptmechanisms to enforce timely payment, and develop criteria and procedures for the eventual saleof some of the state’s land assets once this becomes legally possible.
International experience in leasing publicly owned agricultural land is limited, but sufficientexpertise exists to assist Macedonia in developing an efficient and transparent system. Agenciessuch as the US Bureau of Land Management (BLM) or its Western European equivalents couldprovide expertise in establishing the initial conditions for leasing, and monitoring and policyanalysts (see D., below) could gather and analyze the information required to assess theperformance of leaseholders, and could recommend adjustments in lease terms if required.
3. In order to manage the inevitable expansion of towns and cities and the concomitantdepopulation of villages, it is important for the government to develop serious land-use planningand zoning capabilities. The procedures should be participatory and decentralized, and shouldtake account of both the need for increases in residential and commercial land use and thepreservation of high-quality agricultural land.
A possible project would involve pilot work in several municipalities with varying degrees ofpressure for conversion of land use. Given the lack of experience with decentralized decision-making in Macedonia, external assistance will be required. Expertise in participatory decision-making, graphical and other techniques of spatial planning, and land economics would be availablefrom Western consultancy firms, nonprofit organizations, or academic institutions.
4. Establishment of monitoring and policy analysis capacity to supportmarket-oriented agriculture and land market development
The Ministry of Agriculture and the research and educational establishments concerned withagriculture have historically concentrated their efforts on the management of social-sector farms.There is little understanding of the process of policy analysis and formulation. There is noexperience and no capacity for support to, or understanding of, the problems of privateagriculture. There are few private entrepreneurs with the background required to provide essential
110
services to the private farm sector. This is true both in the specific case of land issues and in themore general case of agricultural development.
The Ministry of Agriculture and the Extension Service must convert their staffs from their currentadministrative vocation to policy development for, support to, and assessment of privateagriculture. This will require substantial retraining of existing employees and recruitment of new,well-trained employees. It will also require equipment, means of transportation, and nonnegligibleoperating costs.
The Macedonian educational system’s capacity for training and retraining is inadequate. Asubstantial effort is required for development of new degree programs at the University of Cyriland Methodius and perhaps other secondary and higher educational institutions as well asnumerous nondegree courses for mid-career training. The program outlined here includes not onlyelements directly tied to land, but also those which are closely complementary. The subjectsshould include technical content and policy formulation and research methodology in thefollowing areas:
• agricultural economics: production analysis; farm management; farming systems research;land, labor, and credit market analysis; marketing; natural resource economics;
• rural sociology: household division of labor, community resource management, migration;• agrarian law: European Union agricultural law, comparative agrarian law, property rights,
transactions, inheritance; and• geographical information systems / land information systems: database management, graphical
representation of spatial data, electronic surveying techniques, remote sensing
International assistance to this program should be provided by a Western European or NorthAmerican educational institution (such as CIRAD in France, Wageningen in the Netherlands,University of Wisconsin or Michigan State University in the United States) with significantexperience in the development of educational and research capacities in developing countries. Aninstitutional contract between such an institution and the Ministry of Education, for a minimumduration of five years and preferably seven to ten, would comprise:
• curriculum development and production of appropriate educational materials in theMacedonian language;
• degree and nondegree training abroad for current research and instructional staff ofMacedonian educational institutions to enable them to train current and future Ministry ofAgriculture staff;
• courses taught by expatriate educators while current Macedonian staff are in training abroad;• upgrading of research capability via collaborative research programs and improved equipment;
and• support to retraining programs for government officials and training programs for private land
market intermediaries
5. Consolidation
It is not recommended that there be a major program to re-engineer the private agricultural sectorvia consolidation. There are, however, possible approaches that may accelerate a consolidation

111
process that the land market would eventually achieve. Incentives can be developed, eitherdirectly via tax policy or differential access to credit or indirectly via linking participation in otherprograms to participation in consolidation. For example, private farmers wishing to lease stateland might be encouraged to trade or sell parcels distant from their residences. Any programshould be preceded by serious efforts to understand the entire set of constraints to consolidationand also by campaigns of public information about the goals and mechanisms of the consolidationprogram.
Modern graphical techniques such as Geographical Information Systems (GIS) can be ofassistance in designing more rational landholding patterns, especially in zones where land is ofroughly equal quality from parcel to parcel. Despite the lack of success of the Hungarian examplecited above, GIS techniques can be powerful contributors to a transparent and participatoryprocess that demonstrates understanding of the historical and economic processes that have led tofragmentation.
The extension service, in spite of its limitations, is the most relevant government agency tocatalyze any consolidation efforts or farmer initiatives. It should initiate pilot programs, perhapsbased on an assessment of the Land Markets Project database, to identify areas wherefragmentation is a problem, where farmers recognize it to be a problem, and where they expresswillingness to participate in consolidation.
6. Market information and public education
Macedonia must reconstruct its information gathering and delivery infrastructure. Thegovernment must play a central role by reorienting the Office of Statistics and the Ministry ofAgriculture toward the collection and dissemination of information that is useful to agriculturalenterprises and by developing a public information strategy that educates market participantsabout the implications of the market economy for the relative responsibilities of individuals,enterprises, communities, and the state. On the other hand, the government is not necessarily theappropriate entity to determine either what information is required or by what means it should bemade available to the public.
The most appropriate way to begin work on this theme is to conduct an assessment of currentstatistics and market information, alternative dissemination sources, and potential demand, and toformulate a strategy for improvement. An expatriate team, composed of a media specialist, anexpert in agricultural market statistics (perhaps from the US Department of Agriculture’sEconomic Research Service), and a rural sociologist and/or agricultural economist could provideimportant technical assistance to this assessment.
113
APPENDIX 1: PERSONNEL
Research team:Dr. Jolyne Melmed-Sanjak, team leader , Land Tenure CenterMr. Dragi Dimitrievski, co-team leader, Faculty of Agriculture, University of Cyril and Methodius (UCM)Dr. Dragan Gjsevski, Faculty of Agriculture, UCMDr. Metodi Milanov, Faculty of Agriculture, Director, Department of Economics, UCMMs. Jadranka Dabovic Anastasovska, Faculty of Law, UCMDr. Jorde Jakimovski, Director, Institute for Sociological, Juridical and Political ResearchRobert Hanson, Research Assistant, Land Tenure Center
Short-term participants:Dr. Susana Lastarria, Land Tenure CenterDr. John Bruce, Land Tenure CenterDr. Peter Bloch, Land Tenure CenterMr. William Chatterton, Legal ConsultantMs. Anica Dragovic, Macedonian SociologistDr. Mari Clark, USAID, Washington
Steering committee:Mr. Tome Zimbakov, Assistant to Minister, Ministry of Agriculture, Forestry and Water EconomyMr. Jordan Ampov, private farmerMr. Branco Simonovski, AIK Director, KumanovoMs. Marika Damjanovska, Stopanska BankMr. Stojan Stojanovski, Skopje Region Extension ServiceMr. Pero Pavlovski, AIK Director, SkopjeMr. Cvetko Petrusevski, private farmerMr. Saltir Mitev, representative of Agricultural Bank, Skopje
Project administration:Ms. Orhideja Zlatkova-Kocareva
Project translators:Ms. Olivia DimovaMr. Vasco Kuzmanovski
Recognition is also due to others who contributed their efforts to our work in many ways. Amongthese are Mr. Arben Abdullahu (interpreter and computer consultant), Ms. Mimoza Abdullahu(interpreter), Ms. Elizabet Kicevska (research assistant, economics), Mr. Isak Sinani (researchassistant, economics), Ms. Viki Vecevska (data entry), and Ms. Vesna Dokuzovska (data entry).
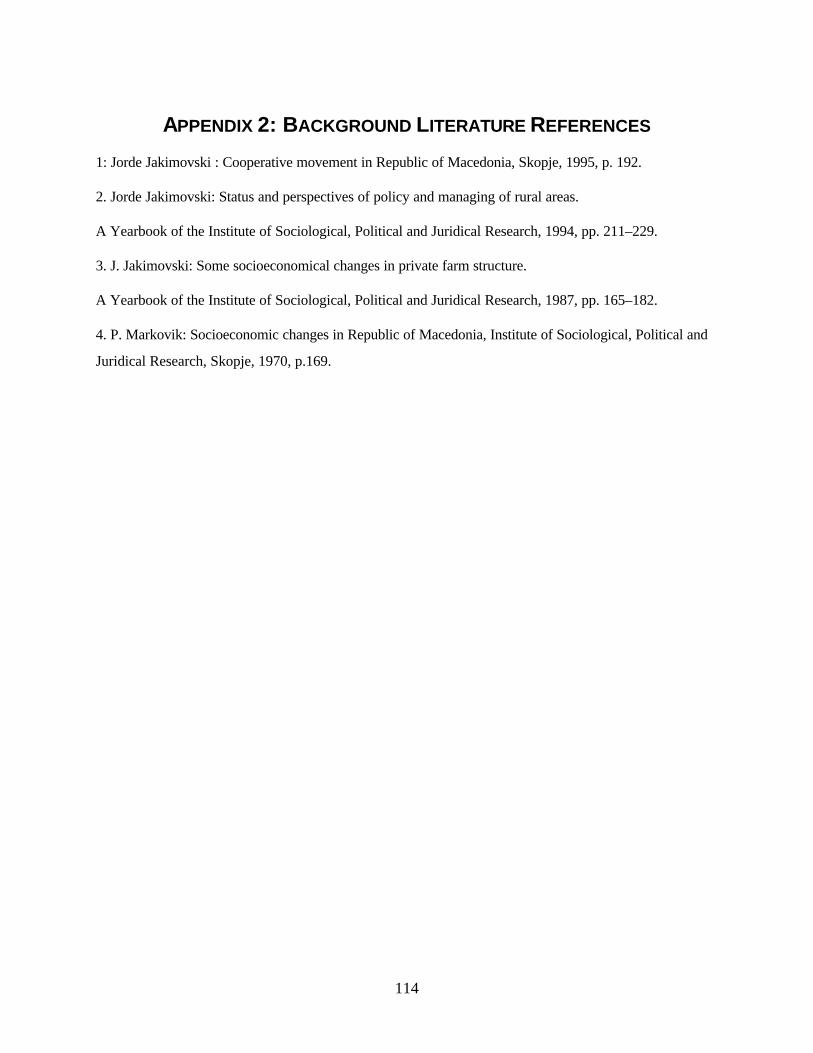
114
APPENDIX 2: BACKGROUND LITERATURE REFERENCES
1: Jorde Jakimovski : Cooperative movement in Republic of Macedonia, Skopje, 1995, p. 192.
2. Jorde Jakimovski: Status and perspectives of policy and managing of rural areas.
A Yearbook of the Institute of Sociological, Political and Juridical Research, 1994, pp. 211–229.
3. J. Jakimovski: Some socioeconomical changes in private farm structure.
A Yearbook of the Institute of Sociological, Political and Juridical Research, 1987, pp. 165–182.
4. P. Markovik: Socioeconomic changes in Republic of Macedonia, Institute of Sociological, Political and
Juridical Research, Skopje, 1970, p.169.
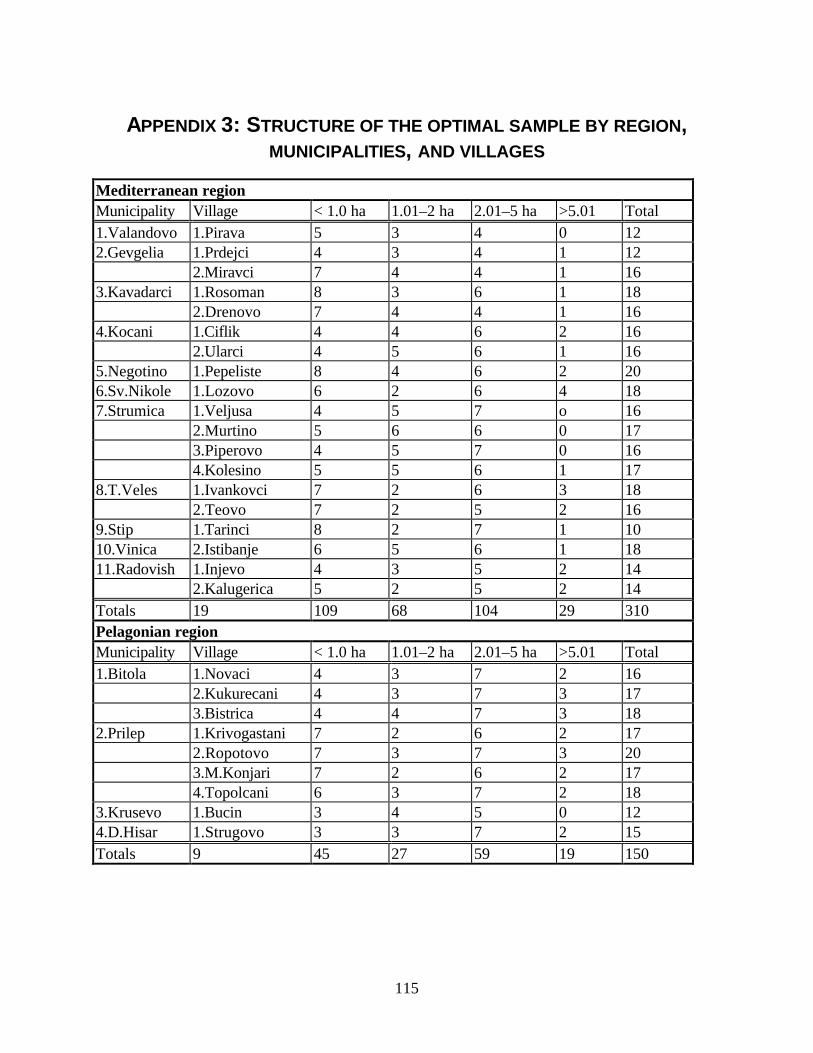
115
APPENDIX 3: STRUCTURE OF THE OPTIMAL SAMPLE BY REGION,MUNICIPALITIES, AND VILLAGES
Mediterranean regionMunicipality Village < 1.0 ha 1.01–2 ha 2.01–5 ha >5.01 Total1.Valandovo 1.Pirava 5 3 4 0 122.Gevgelia 1.Prdejci 4 3 4 1 12
2.Miravci 7 4 4 1 163.Kavadarci 1.Rosoman 8 3 6 1 18
2.Drenovo 7 4 4 1 164.Kocani 1.Ciflik 4 4 6 2 16
2.Ularci 4 5 6 1 165.Negotino 1.Pepeliste 8 4 6 2 206.Sv.Nikole 1.Lozovo 6 2 6 4 187.Strumica 1.Veljusa 4 5 7 o 16
2.Murtino 5 6 6 0 173.Piperovo 4 5 7 0 164.Kolesino 5 5 6 1 17
8.T.Veles 1.Ivankovci 7 2 6 3 182.Teovo 7 2 5 2 16
9.Stip 1.Tarinci 8 2 7 1 1010.Vinica 2.Istibanje 6 5 6 1 1811.Radovish 1.Injevo 4 3 5 2 14
2.Kalugerica 5 2 5 2 14Totals 19 109 68 104 29 310Pelagonian regionMunicipality Village < 1.0 ha 1.01–2 ha 2.01–5 ha >5.01 Total1.Bitola 1.Novaci 4 3 7 2 16
2.Kukurecani 4 3 7 3 173.Bistrica 4 4 7 3 18
2.Prilep 1.Krivogastani 7 2 6 2 172.Ropotovo 7 3 7 3 203.M.Konjari 7 2 6 2 174.Topolcani 6 3 7 2 18
3.Krusevo 1.Bucin 3 4 5 0 124.D.Hisar 1.Strugovo 3 3 7 2 15Totals 9 45 27 59 19 150
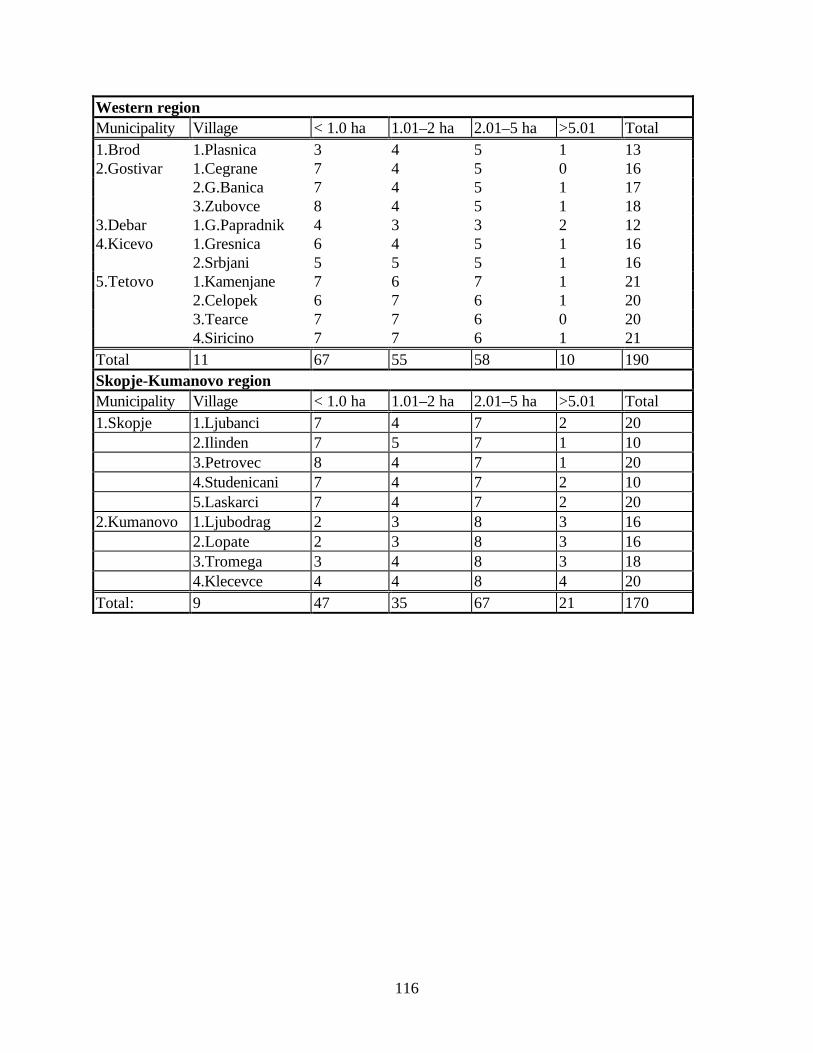
116
Western regionMunicipality Village < 1.0 ha 1.01–2 ha 2.01–5 ha >5.01 Total1.Brod 1.Plasnica 3 4 5 1 132.Gostivar 1.Cegrane 7 4 5 0 16
2.G.Banica 7 4 5 1 173.Zubovce 8 4 5 1 18
3.Debar 1.G.Papradnik 4 3 3 2 124.Kicevo 1.Gresnica 6 4 5 1 16
2.Srbjani 5 5 5 1 165.Tetovo 1.Kamenjane 7 6 7 1 21
2.Celopek 6 7 6 1 203.Tearce 7 7 6 0 204.Siricino 7 7 6 1 21
Total 11 67 55 58 10 190Skopje-Kumanovo regionMunicipality Village < 1.0 ha 1.01–2 ha 2.01–5 ha >5.01 Total1.Skopje 1.Ljubanci 7 4 7 2 20
2.Ilinden 7 5 7 1 103.Petrovec 8 4 7 1 204.Studenicani 7 4 7 2 105.Laskarci 7 4 7 2 20
2.Kumanovo 1.Ljubodrag 2 3 8 3 162.Lopate 2 3 8 3 163.Tromega 3 4 8 3 184.Klecevce 4 4 8 4 20
Total: 9 47 35 67 21 170
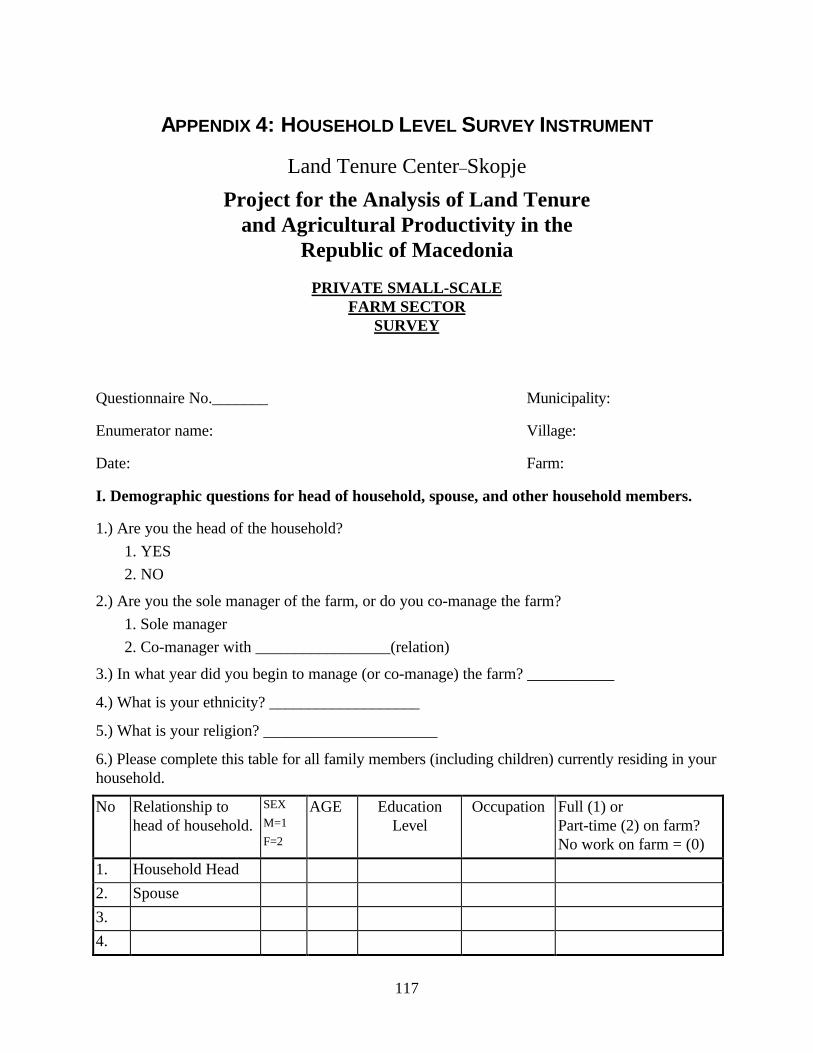
117
APPENDIX 4: HOUSEHOLD LEVEL SURVEY INSTRUMENT
Land Tenure Center–Skopje
Project for the Analysis of Land Tenureand Agricultural Productivity in the
Republic of Macedonia
PRIVATE SMALL-SCALEFARM SECTOR
SURVEY
Questionnaire No._______ Municipality:
Enumerator name: Village:
Date: Farm:
I. Demographic questions for head of household, spouse, and other household members.
1.) Are you the head of the household?
1. YES
2. NO
2.) Are you the sole manager of the farm, or do you co-manage the farm?
1. Sole manager
2. Co-manager with _________________(relation)
3.) In what year did you begin to manage (or co-manage) the farm? ___________
4.) What is your ethnicity? ___________________
5.) What is your religion? ______________________
6.) Please complete this table for all family members (including children) currently residing in yourhousehold.
No Relationship tohead of household.
SEX
M=1
F=2
AGE EducationLevel
Occupation Full (1) orPart-time (2) on farm?No work on farm = (0)
1. Household Head
2. Spouse
3.
4.
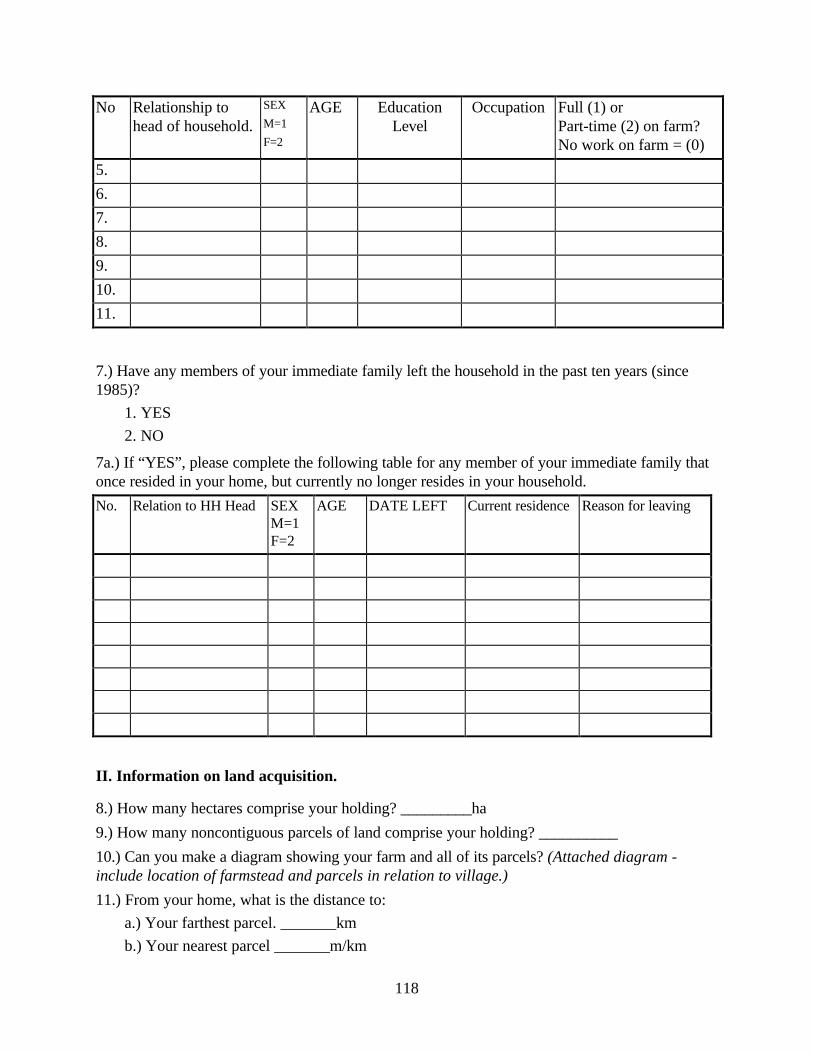
118
No Relationship tohead of household.
SEX
M=1
F=2
AGE EducationLevel
Occupation Full (1) orPart-time (2) on farm?No work on farm = (0)
5.
6.
7.
8.
9.
10.
11.
7.) Have any members of your immediate family left the household in the past ten years (since1985)?
1. YES
2. NO
7a.) If “YES”, please complete the following table for any member of your immediate family thatonce resided in your home, but currently no longer resides in your household.
No. Relation to HH Head SEXM=1F=2
AGE DATE LEFT Current residence Reason for leaving
II. Information on land acquisition.
8.) How many hectares comprise your holding? _________ha
9.) How many noncontiguous parcels of land comprise your holding? __________
10.) Can you make a diagram showing your farm and all of its parcels? (Attached diagram -include location of farmstead and parcels in relation to village.)
11.) From your home, what is the distance to:
a.) Your farthest parcel. _______km
b.) Your nearest parcel _______m/km
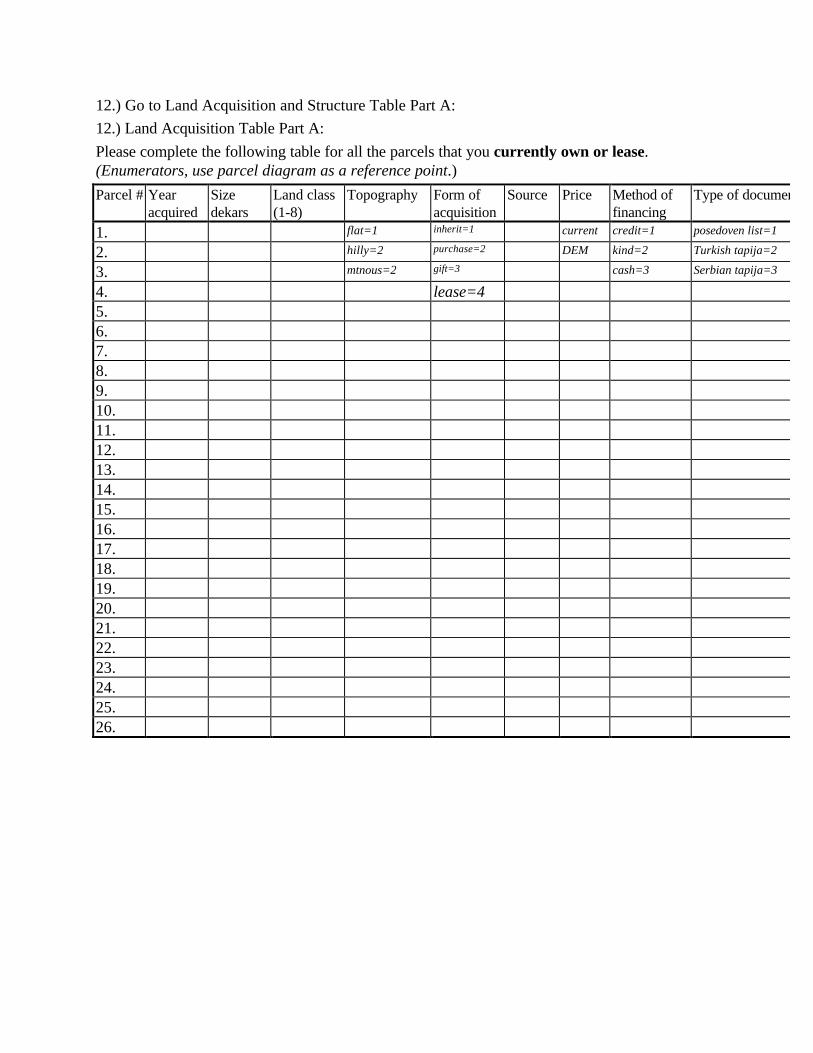
12.) Go to Land Acquisition and Structure Table Part A:
12.) Land Acquisition Table Part A:
Please complete the following table for all the parcels that you currently own or lease.(Enumerators, use parcel diagram as a reference point.)
Parcel # Yearacquired
Sizedekars
Land class(1-8)
Topography Form ofacquisition
Source Price Method offinancing
Type of document
1. flat=1 inherit=1 current credit=1 posedoven list=1
2. hilly=2 purchase=2 DEM kind=2 Turkish tapija=2
3. mtnous=2 gift=3 cash=3 Serbian tapija=3
4. lease=45.6.7.8.9.10.11.12.13.14.15.16.17.18.19.20.21.22.23.24.25.26.

13.) Have you sold or permanently transferred any of your holdings to other farmers in the pastten years?
1. YES
2. NO
13a.) If “YES”, please complete this table for all parcels which you have sold or permanentlytransferred to other users.
Land Acquisition Table Part B:
ParcelinDekars
Yearoriginallyacquired
Form ofAcq’tion
Year oftransfer
Form oftransfer
Documentused
Price Trans.costs
Reason
inherit=1 pos. list=1
purchase=2
tapija=2
gift=3 Serbtapija=3
lease=4
14.) If you inherited your holding, did you inherit the entire holding of your parents?
1. YES
2. NO
14a.) If “NO”, how was your parent’s original holding divided?
RELATION SIZE OF HOLDING INHERITED
self _____dekars
__________ _____dekars
__________ _____dekars
__________ _____dekars
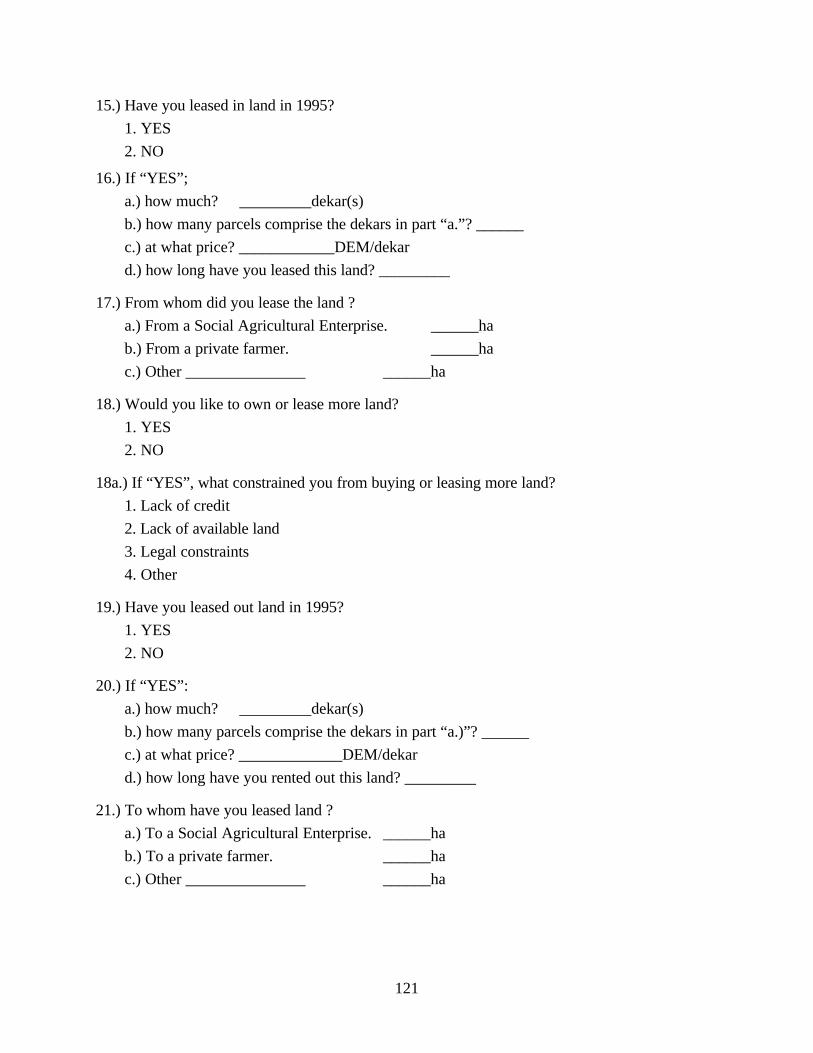
121
15.) Have you leased in land in 1995?
1. YES
2. NO
16.) If “YES”;
a.) how much? _________dekar(s)
b.) how many parcels comprise the dekars in part “a.”? ______
c.) at what price? ____________DEM/dekar
d.) how long have you leased this land? _________
17.) From whom did you lease the land ?
a.) From a Social Agricultural Enterprise. ______ha
b.) From a private farmer. ______ha
c.) Other _______________ ______ha
18.) Would you like to own or lease more land?
1. YES
2. NO
18a.) If “YES”, what constrained you from buying or leasing more land?
1. Lack of credit
2. Lack of available land
3. Legal constraints
4. Other
19.) Have you leased out land in 1995?
1. YES
2. NO
20.) If “YES”:
a.) how much? _________dekar(s)
b.) how many parcels comprise the dekars in part “a.)”? ______
c.) at what price? _____________DEM/dekar
d.) how long have you rented out this land? _________
21.) To whom have you leased land ?
a.) To a Social Agricultural Enterprise. ______ha
b.) To a private farmer. ______ha
c.) Other _______________ ______ha
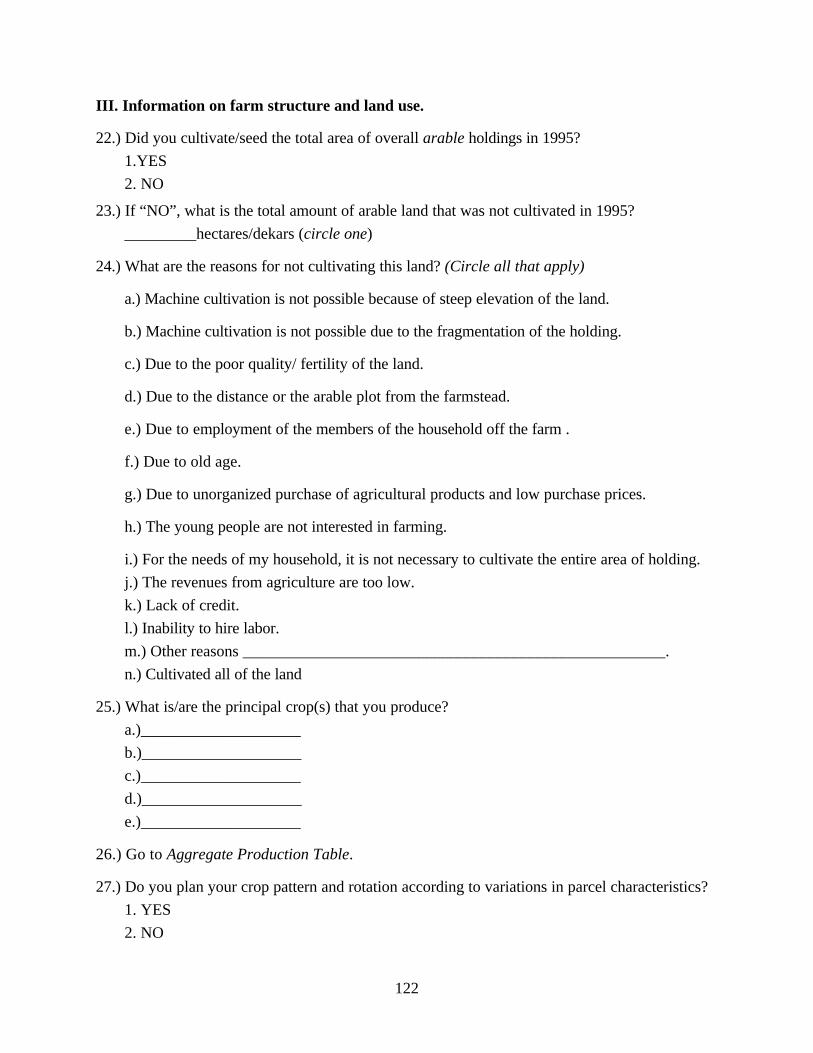
122
III. Information on farm structure and land use.
22.) Did you cultivate/seed the total area of overall arable holdings in 1995?
1.YES
2. NO
23.) If “NO”, what is the total amount of arable land that was not cultivated in 1995?
_________hectares/dekars (circle one)
24.) What are the reasons for not cultivating this land? (Circle all that apply)
a.) Machine cultivation is not possible because of steep elevation of the land.
b.) Machine cultivation is not possible due to the fragmentation of the holding.
c.) Due to the poor quality/ fertility of the land.
d.) Due to the distance or the arable plot from the farmstead.
e.) Due to employment of the members of the household off the farm .
f.) Due to old age.
g.) Due to unorganized purchase of agricultural products and low purchase prices.
h.) The young people are not interested in farming.
i.) For the needs of my household, it is not necessary to cultivate the entire area of holding.
j.) The revenues from agriculture are too low.
k.) Lack of credit.
l.) Inability to hire labor.
m.) Other reasons _____________________________________________________.
n.) Cultivated all of the land
25.) What is/are the principal crop(s) that you produce?
a.)____________________
b.)____________________
c.)____________________
d.)____________________
e.)____________________
26.) Go to Aggregate Production Table.
27.) Do you plan your crop pattern and rotation according to variations in parcel characteristics?
1. YES
2. NO
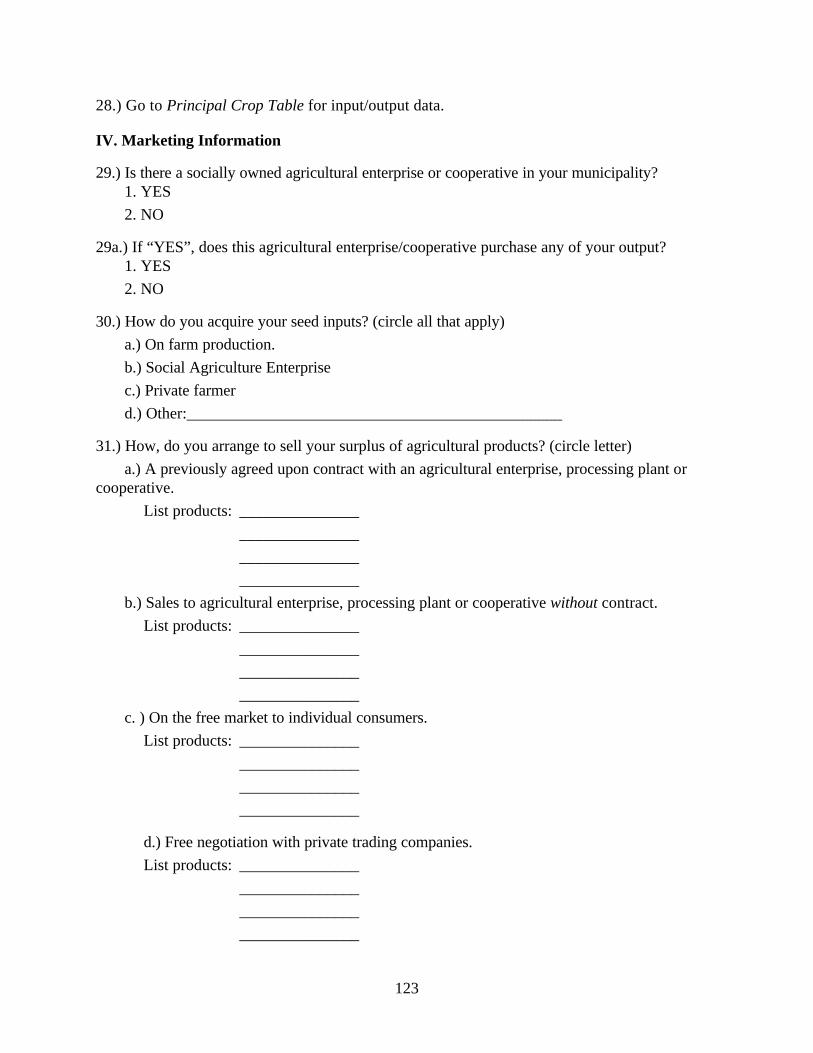
123
28.) Go to Principal Crop Table for input/output data.
IV. Marketing Information
29.) Is there a socially owned agricultural enterprise or cooperative in your municipality?1. YES
2. NO
29a.) If “YES”, does this agricultural enterprise/cooperative purchase any of your output?1. YES
2. NO
30.) How do you acquire your seed inputs? (circle all that apply)
a.) On farm production.
b.) Social Agriculture Enterprise
c.) Private farmer
d.) Other:_______________________________________________
31.) How, do you arrange to sell your surplus of agricultural products? (circle letter)
a.) A previously agreed upon contract with an agricultural enterprise, processing plant orcooperative.
List products: _______________
_______________
_______________
_______________
b.) Sales to agricultural enterprise, processing plant or cooperative without contract.
List products: _______________
_______________
_______________
_______________
c. ) On the free market to individual consumers.
List products: _______________
_______________
_______________
_______________
d.) Free negotiation with private trading companies.
List products: _______________
_______________
_______________
_______________
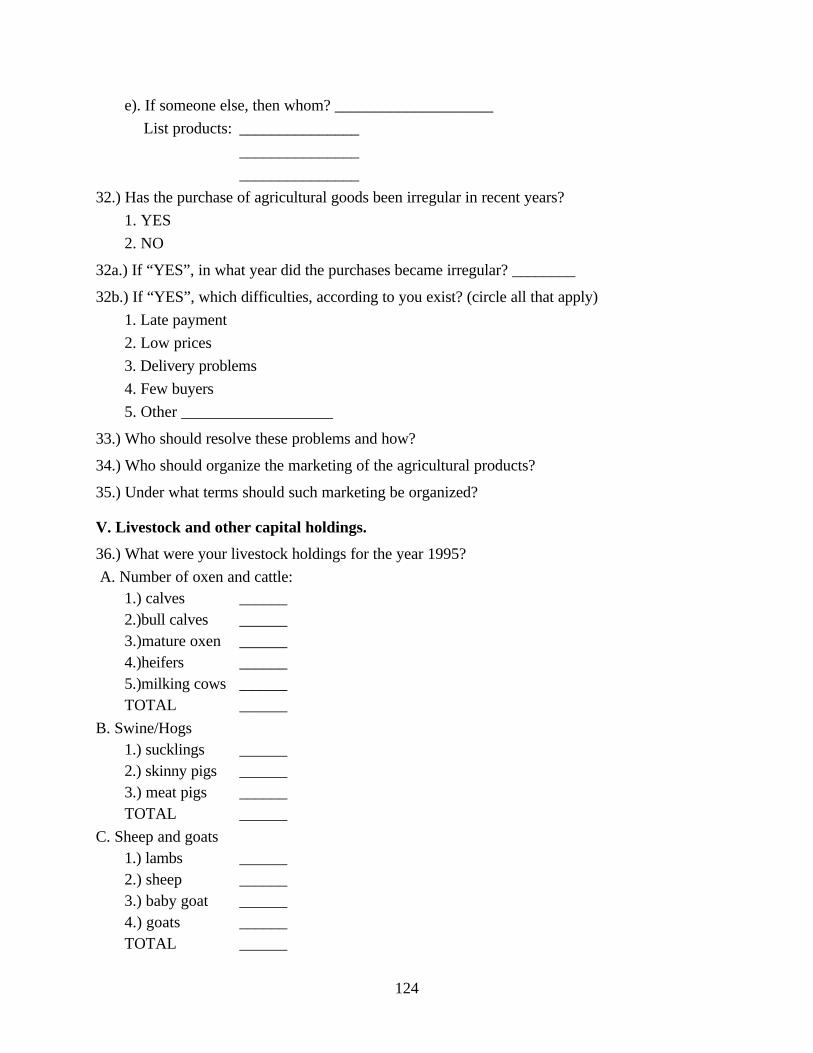
124
e). If someone else, then whom? ____________________
List products: _______________
_______________
_______________
32.) Has the purchase of agricultural goods been irregular in recent years?
1. YES
2. NO
32a.) If “YES”, in what year did the purchases became irregular? ________
32b.) If “YES”, which difficulties, according to you exist? (circle all that apply)
1. Late payment
2. Low prices
3. Delivery problems
4. Few buyers
5. Other ___________________
33.) Who should resolve these problems and how?
34.) Who should organize the marketing of the agricultural products?
35.) Under what terms should such marketing be organized?
V. Livestock and other capital holdings.
36.) What were your livestock holdings for the year 1995?
A. Number of oxen and cattle:1.) calves ______
2.)bull calves ______ 3.)mature oxen ______
4.)heifers ______5.)milking cows ______TOTAL ______
B. Swine/Hogs 1.) sucklings ______
2.) skinny pigs ______3.) meat pigs ______TOTAL ______
C. Sheep and goats 1.) lambs ______
2.) sheep ______3.) baby goat ______4.) goats ______TOTAL ______

125
D. Horses and asses ______
E. Poultry ______
F. Milk production in liters: ______
G. Egg production: ______
37.) How has this stock varied over the last 5 to 10 years?
1. Stock has been reduced
2. Stock has been increased
3. Stock has stayed the same
38.) Do you use livestock (oxen or horses) for farm work? (circle all that apply)
1. Traction
2. Transportation
3. No livestock used for farm work
39.) Which type of mechanization do you own, and how many pieces?
a.) Tractors NUMBER: AGE:
1. Up to 35 HP ______ ______
2. 36–60 HP ______ ______
3. Over 60 ______ ______
b.) Rototiller ______ ______
c.) Combine ______ ______
d.) Additional parts
1. Plows ______ ______
2. Seeder ______ ______
3. Harvester ______ ______
4. Topper ______ ______
5. Bailer ______ ______
6. Miller ______ ______
7. Trailer ______ ______
8. Other ______ ______
9. Other ______ ______
e.) Animal traction
1. Horses ______ ______
2. Oxen ______ ______
3. Additional hitches ______ ______
40.) Do you rent or borrow equipment?
1. YES
2. NO
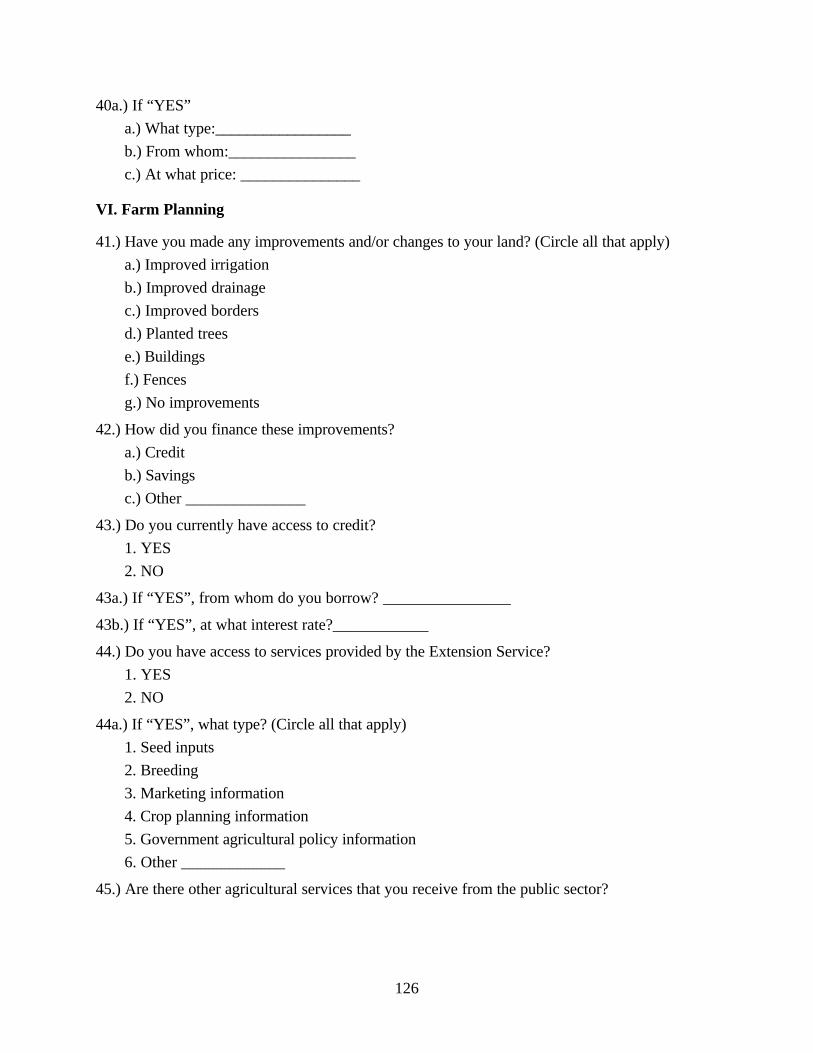
126
40a.) If “YES”
a.) What type:_________________
b.) From whom:________________
c.) At what price: _______________
VI. Farm Planning
41.) Have you made any improvements and/or changes to your land? (Circle all that apply)
a.) Improved irrigation
b.) Improved drainage
c.) Improved borders
d.) Planted trees
e.) Buildings
f.) Fences
g.) No improvements
42.) How did you finance these improvements?
a.) Credit
b.) Savings
c.) Other _______________
43.) Do you currently have access to credit?
1. YES
2. NO
43a.) If “YES”, from whom do you borrow? ________________
43b.) If “YES”, at what interest rate?____________
44.) Do you have access to services provided by the Extension Service?
1. YES
2. NO
44a.) If “YES”, what type? (Circle all that apply)
1. Seed inputs
2. Breeding
3. Marketing information
4. Crop planning information
5. Government agricultural policy information
6. Other _____________
45.) Are there other agricultural services that you receive from the public sector?
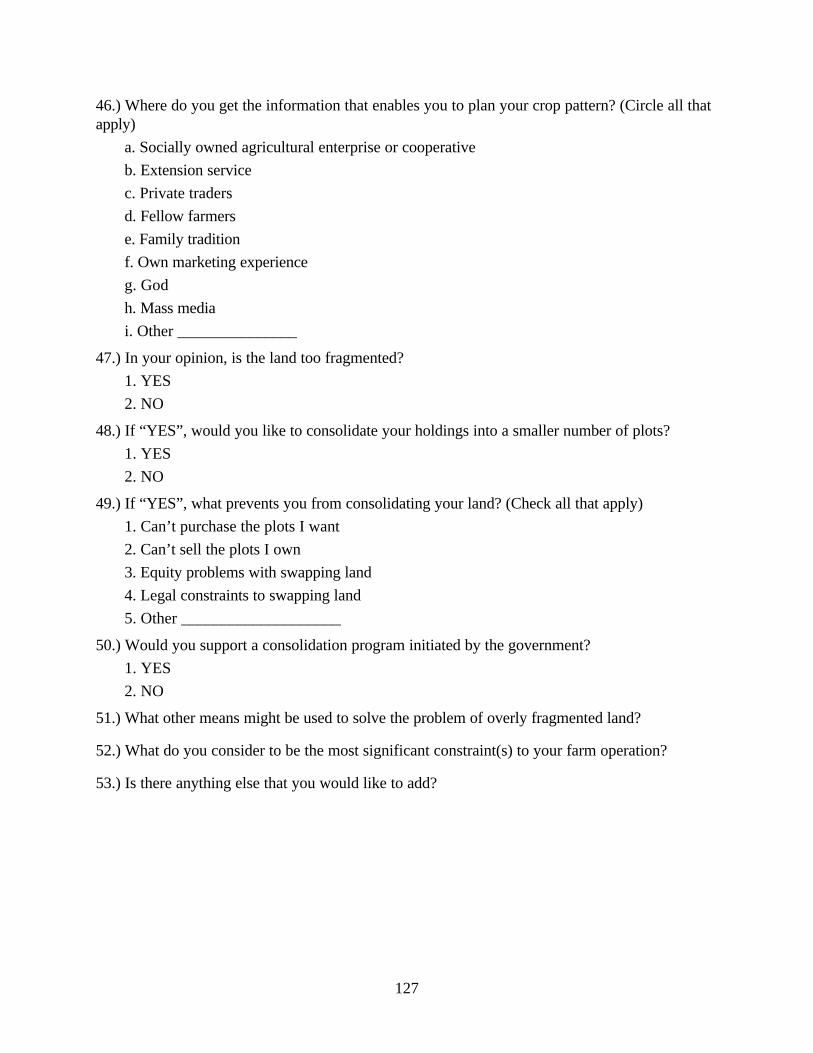
127
46.) Where do you get the information that enables you to plan your crop pattern? (Circle all thatapply)
a. Socially owned agricultural enterprise or cooperative
b. Extension service
c. Private traders
d. Fellow farmers
e. Family tradition
f. Own marketing experience
g. God
h. Mass media
i. Other _______________
47.) In your opinion, is the land too fragmented?
1. YES
2. NO
48.) If “YES”, would you like to consolidate your holdings into a smaller number of plots?
1. YES
2. NO
49.) If “YES”, what prevents you from consolidating your land? (Check all that apply)
1. Can’t purchase the plots I want
2. Can’t sell the plots I own
3. Equity problems with swapping land
4. Legal constraints to swapping land
5. Other ____________________
50.) Would you support a consolidation program initiated by the government?
1. YES
2. NO
51.) What other means might be used to solve the problem of overly fragmented land?
52.) What do you consider to be the most significant constraint(s) to your farm operation?
53.) Is there anything else that you would like to add?
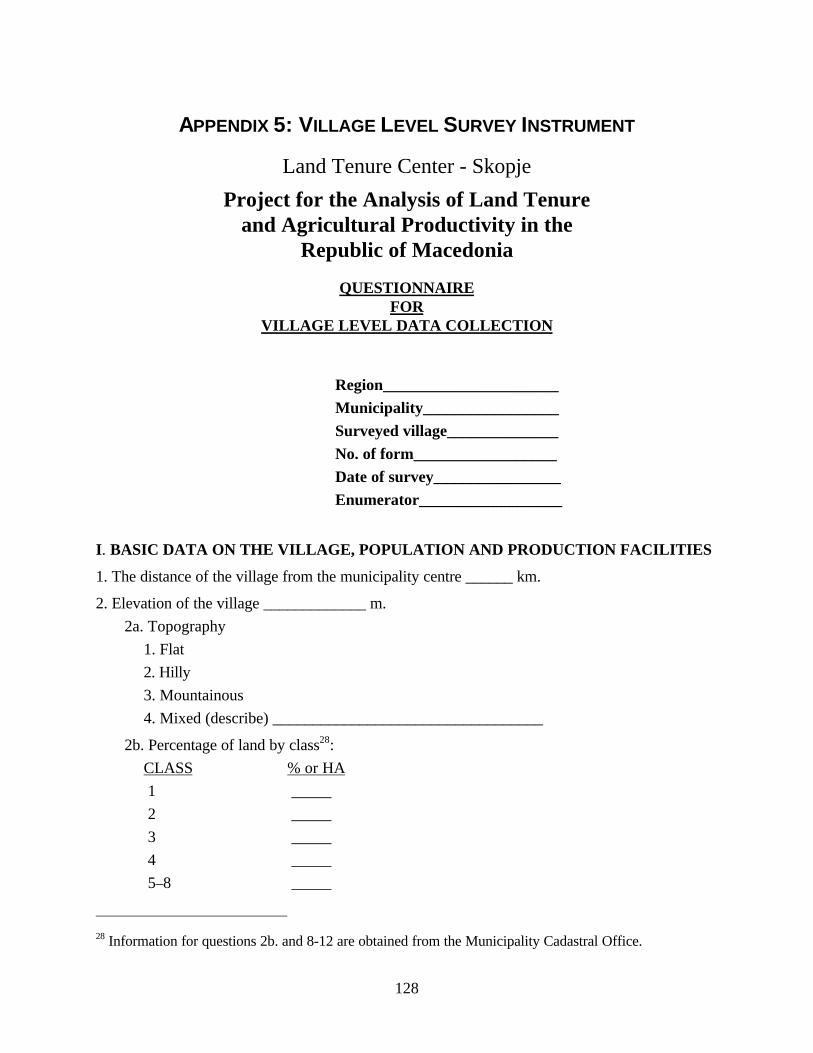
128
APPENDIX 5: VILLAGE LEVEL SURVEY INSTRUMENT
Land Tenure Center - Skopje
Project for the Analysis of Land Tenureand Agricultural Productivity in the
Republic of Macedonia
QUESTIONNAIREFOR
VILLAGE LEVEL DATA COLLECTION
Region______________________Municipality_________________Surveyed village______________No. of form__________________Date of survey________________Enumerator__________________
I. BASIC DATA ON THE VILLAGE, POPULATION AND PRODUCTION FACILITIES
1. The distance of the village from the municipality centre ______ km.
2. Elevation of the village _____________ m.
2a. Topography
1. Flat
2. Hilly
3. Mountainous
4. Mixed (describe) __________________________________
2b. Percentage of land by class28:
CLASS % or HA
1 _____
2 _____
3 _____
4 _____
5–8 _____
28 Information for questions 2b. and 8-12 are obtained from the Municipality Cadastral Office.
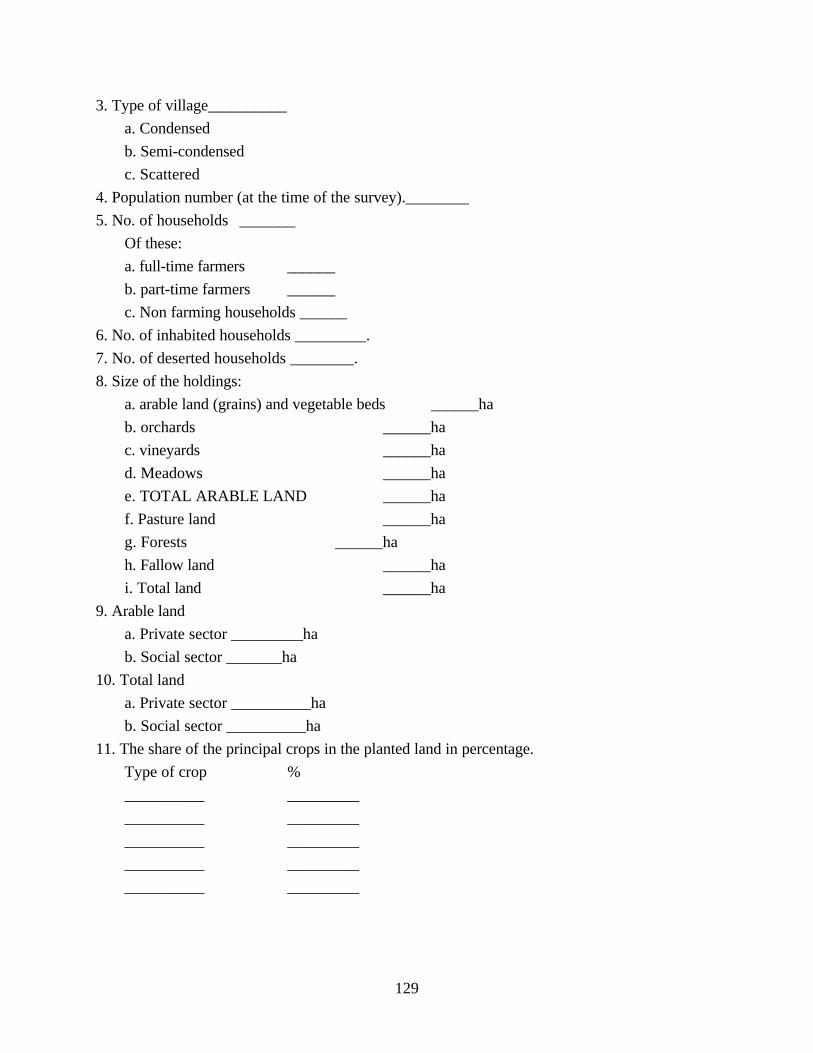
129
3. Type of village__________
a. Condensed
b. Semi-condensed
c. Scattered
4. Population number (at the time of the survey).________
5. No. of households _______
Of these:
a. full-time farmers ______
b. part-time farmers ______
c. Non farming households ______
6. No. of inhabited households _________.
7. No. of deserted households ________.
8. Size of the holdings:
a. arable land (grains) and vegetable beds ______ha
b. orchards ______ha
c. vineyards ______ha
d. Meadows ______ha
e. TOTAL ARABLE LAND ______ha
f. Pasture land ______ha
g. Forests ______ha
h. Fallow land ______ha
i. Total land ______ha
9. Arable land
a. Private sector _________ha
b. Social sector _______ha
10. Total land
a. Private sector __________ha
b. Social sector __________ha
11. The share of the principal crops in the planted land in percentage.
Type of crop %
__________ _________
__________ _________
__________ _________
__________ _________
__________ _________
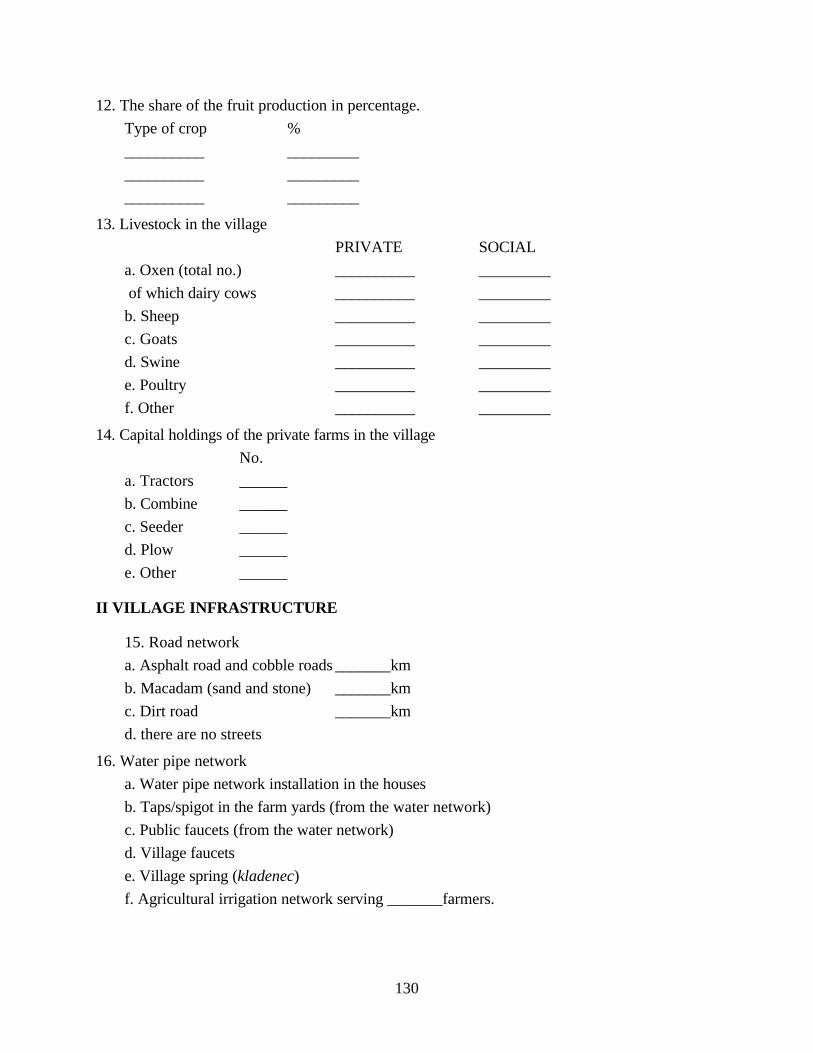
130
12. The share of the fruit production in percentage.
Type of crop %
__________ _________
__________ _________
__________ _________
13. Livestock in the village
PRIVATE SOCIAL
a. Oxen (total no.) __________ _________
of which dairy cows __________ _________
b. Sheep __________ _________
c. Goats __________ _________
d. Swine __________ _________
e. Poultry __________ _________
f. Other __________ _________
14. Capital holdings of the private farms in the village
No.
a. Tractors ______
b. Combine ______
c. Seeder ______
d. Plow ______
e. Other ______
II VILLAGE INFRASTRUCTURE
15. Road network
a. Asphalt road and cobble roads _______km
b. Macadam (sand and stone) _______km
c. Dirt road _______km
d. there are no streets
16. Water pipe network
a. Water pipe network installation in the houses
b. Taps/spigot in the farm yards (from the water network)
c. Public faucets (from the water network)
d. Village faucets
e. Village spring (kladenec)
f. Agricultural irrigation network serving _______farmers.
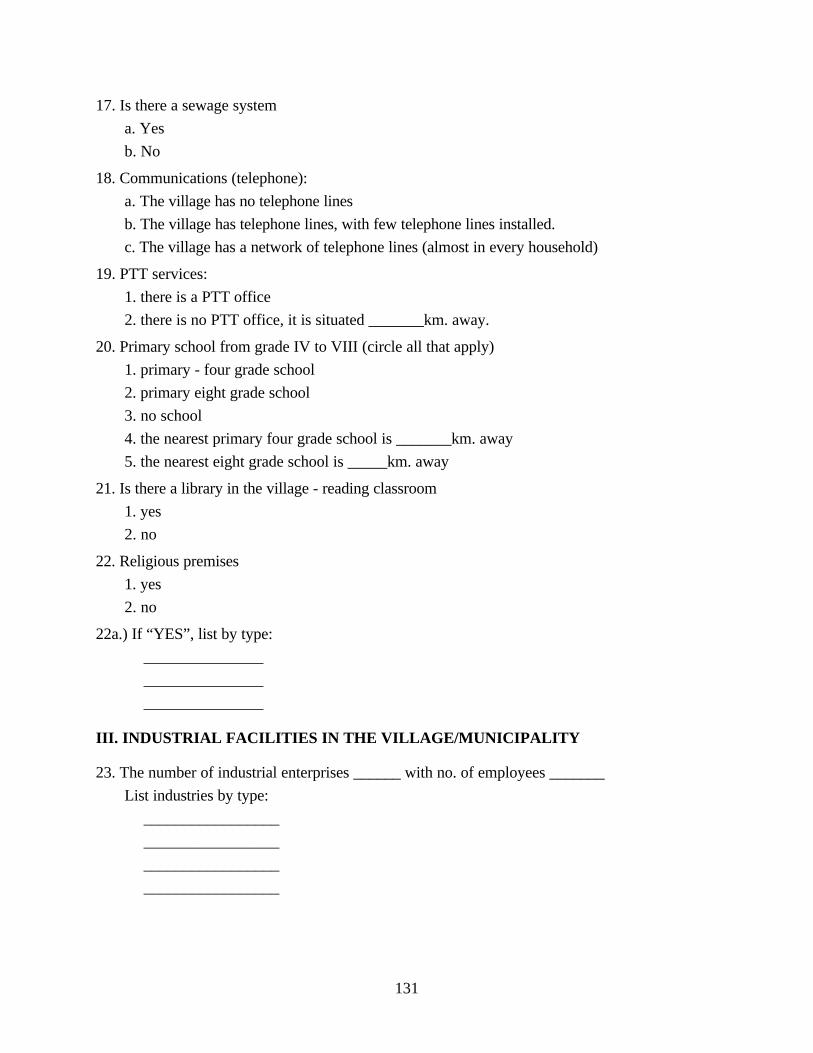
131
17. Is there a sewage system
a. Yes
b. No
18. Communications (telephone):
a. The village has no telephone lines
b. The village has telephone lines, with few telephone lines installed.
c. The village has a network of telephone lines (almost in every household)
19. PTT services:
1. there is a PTT office
2. there is no PTT office, it is situated _______km. away.
20. Primary school from grade IV to VIII (circle all that apply)
1. primary - four grade school
2. primary eight grade school
3. no school
4. the nearest primary four grade school is _______km. away
5. the nearest eight grade school is _____km. away
21. Is there a library in the village - reading classroom
1. yes
2. no
22. Religious premises
1. yes
2. no
22a.) If “YES”, list by type:
_______________
_______________
_______________
III. INDUSTRIAL FACILITIES IN THE VILLAGE/MUNICIPALITY
23. The number of industrial enterprises ______ with no. of employees _______
List industries by type:
_________________
_________________
_________________
_________________
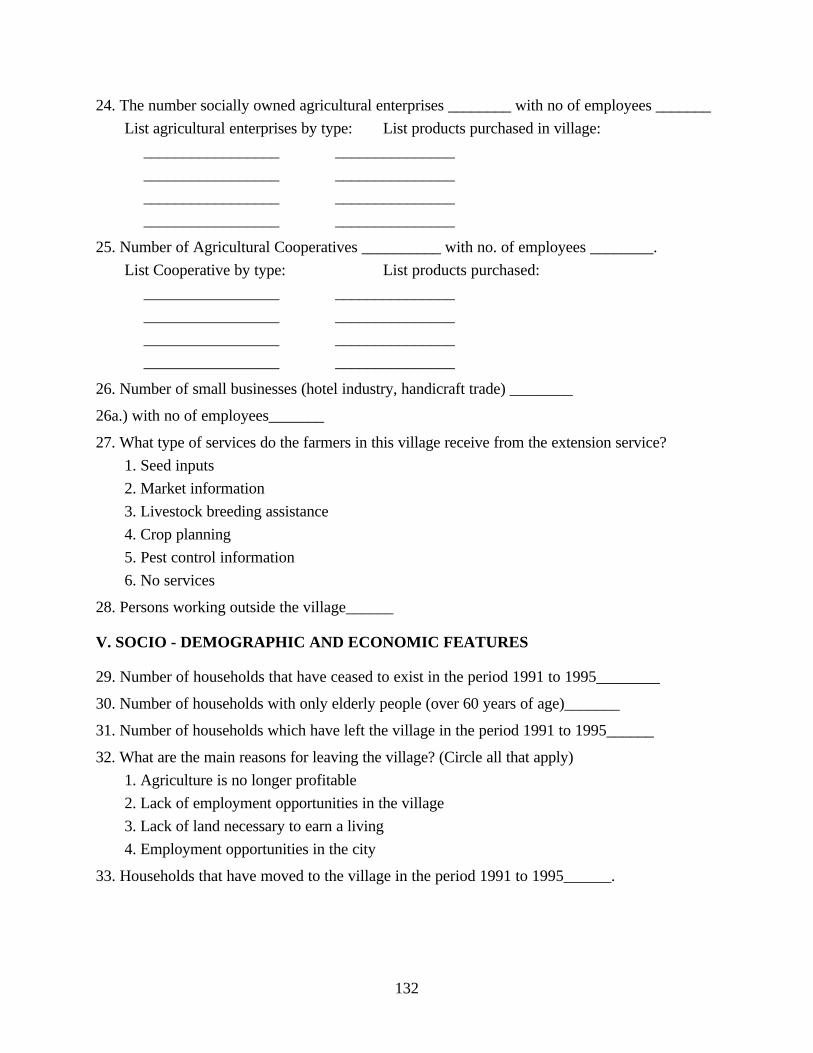
132
24. The number socially owned agricultural enterprises ________ with no of employees _______
List agricultural enterprises by type: List products purchased in village:
_________________ _______________
_________________ _______________
_________________ _______________
_________________ _______________
25. Number of Agricultural Cooperatives __________ with no. of employees ________.
List Cooperative by type: List products purchased:
_________________ _______________
_________________ _______________
_________________ _______________
_________________ _______________
26. Number of small businesses (hotel industry, handicraft trade) ________
26a.) with no of employees_______
27. What type of services do the farmers in this village receive from the extension service?
1. Seed inputs
2. Market information
3. Livestock breeding assistance
4. Crop planning
5. Pest control information
6. No services
28. Persons working outside the village______
V. SOCIO - DEMOGRAPHIC AND ECONOMIC FEATURES
29. Number of households that have ceased to exist in the period 1991 to 1995________
30. Number of households with only elderly people (over 60 years of age)_______
31. Number of households which have left the village in the period 1991 to 1995______
32. What are the main reasons for leaving the village? (Circle all that apply)
1. Agriculture is no longer profitable
2. Lack of employment opportunities in the village
3. Lack of land necessary to earn a living
4. Employment opportunities in the city
33. Households that have moved to the village in the period 1991 to 1995______.
133
34. The directions of the migration from the village?
a. At the municipality center
b. To another village
c. To another municipality/town.
d. To the capital of the Republic (Skopje)
e. Abroad
35. Compile opinions and attitudes of the youngsters toward the farming as a future vocation.
36. What are your attitudes or opinions about the future of the agriculture and the village?
134
APPENDIX 6: LITERATURE REVIEW ON FRAGMENTATION,WITH REFERENCES:
Introduction:
The literature on fragmentation that has emerged in recent years reflects a significant shift in theperception of the effects of fragmentation on agricultural productivity. Previous literature haspredominantly focused on the negative aspects of fragmentation (in terms of productivity), thussupporting consolidation programs. Recent literature, supported by substantial research, has alsohighlighted the advantages of fragmented holdings. Recent literature has also taken better note ofthe costs of consolidation and has benefited from an examination of worldwide consolidationexperiences, including successes and failures. For certain, few generalizations can be madeconcerning the issue due to the heterogeneity of agricultural systems and agriculturalenvironments. For each specific agricultural region or subregion, substantial research is requiredin order to assess and weigh the advantages and disadvantages of fragmentation against the costsand benefits of consolidation. The following summary of the literature on fragmentationestablishes the background from which an examination of the fragmentation issue in theMacedonian context may be realized.
Definition:
The literature notes two distinct interpretations of fragmentation. In one sense, fragmentation ismeant to imply the subdivision of farm property into undersized units which are too small forrational (efficient) cultivation. This sense of fragmentation refers to undersized farms as a result ofoverpopulation and land shortage. The second type of fragmentation refers to the spatialdispersion of farmers’ plots over a wide area. This sense of fragmentation implies that the plotsare noncontiguous but are intermixed with plots operated by other farmers (Burton and King1982). Both types of fragmentation commonly coexist. Defined as such, fragmentation is aphenomenon that affects farming systems of all types and all sizes throughout the world. The1970 Food and Agriculture Organization’s (FAO) World Census on Agriculture estimates that80% of the world’s farmland is fragmented (Simmons 1987).
Causes of fragmentation:
The causes of fragmentation fall into two broad categories. First, fragmentation might be anexogenous imposition on farmers. This is often referred to as a “supply side” explanation and ismost commonly related to population pressure and land scarcity. Exogenously determinedfragmentation levels can also be the result of public policies and/or existing institutions. Second,fragmentation might be the result of choices taken by the farmer. This is referred to as a “demandside” explanation and presumes that the private benefits of fragmentation exceed the private costs(Blarel et al. 1992). Specifically, the major causes of fragmentation are cited as being partialinheritance, overpopulation, land shortage, and political and historical legacy. It is mentioned that
135
certain causes of fragmentation might be adaptive. For example, inheritance practices may be ameans of distributing land in socially and environmentally adaptive ways. It is also noted,however, that field structures that once were adaptive may no longer be effective due to changesin technology. For example, small and oddly shaped plots are unsuitable for efficient cultivation bytractor. While the origin of fragmentation will vary, the advantages and disadvantages offragmentation may be analyzed independently of the source of fragmentation (Simmons 1987).
Advantages and disadvantages of fragmentation:
I. DISADVANTAGES:
The disadvantages associated with high levels of fragmentation are identified by the inefficientallocation of resources (labor and capital) and the resulting increased costs of agriculturalproduction.
The disadvantages of fragmentation are provided in a concise form by Simmons (1987) in thefollowing table:
A. Physical Problems
-Labor time
-Land loss (border marking, access roads)
-Fencing/border construction cost
-Transportation cost
-Limitations on access
B. Operational Difficulties
-Equipment
-Farming techniques and systems
-Management and supervision (of labor)
-Pest control
-Plot abandonment
C. Forgone Improvements
-Irrigation
-Drainage
-Conservation
D. Social Externalities
-Road and Irrigation Systems
-Regional Agricultural Planning
-National Output
The final category of problems associated with fragmentation refers to the inefficiencies that areshifted onto a society in its entirety as a result of fragmentation. Low levels of productivity andrelatively high food prices are examples of the costs that are shifted onto the consumer as a resultof fragmentation. As these “costs” to the consumer are not considered in the operation strategy ofthe farmer, the optimal level of fragmentation for private farmers may be higher than the socialoptimum. Again it must be noted that each agricultural system and environment is unique, and
136
that these factors must be carefully considered for each situation in order to guide research andinform policy.
II. ADVANTAGES
Fragmentation allows farmers with scattered plots to benefit from risk management through theuse of multiple ecozones and the practice of crop scheduling (Bentley 1987). The advantages offragmentation are related to the diversity of crop production that the fragmentation provides,although there are also advantages for farmers growing the same crop on several different plots.In general, fragmentation allows farmers to disperse and reduce risk by using a variety of soils andother microclimatic and microenvironmental variations. These variations include differences in soiltype, moisture level, altitude, wind, and degree of sunlight. In terms of crop scheduling,fragmentation allows farmers to grow a variety of crops, including crops that mature and ripen atdifferent times. Such a form of crop scheduling allows farmers to concentrate their labor ondifferent plots at different times, thereby avoiding household labor bottlenecks.
In addition to risk management and reduction through crop diversification, fragmentation mayoffer social (noneconomic) benefits. Inheritance, which is noted as being a cause of fragmentation,has social goals in addition to those of maximizing production. The goal of preserving a farmlarge enough to support a family is often seen to conflict with the goal of making an equitabledistribution of that land to ones heirs. But land is often combined through marriage or from theacquisition of land from noncultivating family members. In practice, inheritance can be interpretedas an institution which allows farmers to meet the economic as well as the social goals of theagricultural system.
Degree of fragmentation:
While fragmentation may be a common phenomenon, the extent of fragmentation varies greatlyfrom country to country, and from farm to farm. The literature identifies six main parameterswhich may be used to measure the extent of fragmentation. These are; farm size (total holdings),plot number, plot size, plot shape, spatial distribution of plots, and the size distribution of theplots. Of these parameters, size and distance are often considered to be most significant. The sizedistribution of the plots captures both of these aspects, as it takes into account the location of thelarger fields (closer to, or farther from the farmstead). The shape of the plots is an importantparameter as mechanization is introduced into an agricultural system. That is to say, farmmachinery is most efficient on rectangular plots.
Measurement of fragmentation:
Numerous indices exist to measure the extent of fragmentation at the farm level. The indexintroduced by Dovring (1960) is somewhat arbitrary and is summarized here only as a point ofreference. The Januswerski (1964) index is more empirically sound and is used commonly toevaluate levels of fragmentation in contemporary agricultural systems. These indices aresummarized as follows.
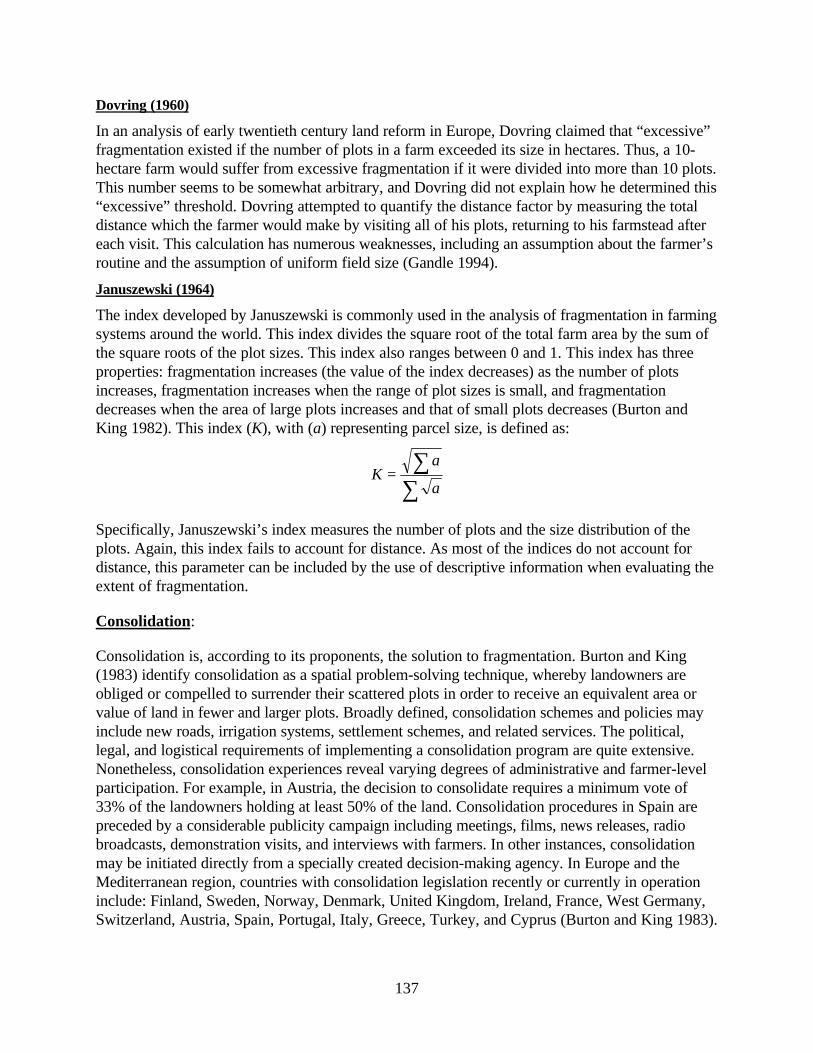
137
Dovring (1960)
In an analysis of early twentieth century land reform in Europe, Dovring claimed that “excessive”fragmentation existed if the number of plots in a farm exceeded its size in hectares. Thus, a 10-hectare farm would suffer from excessive fragmentation if it were divided into more than 10 plots.This number seems to be somewhat arbitrary, and Dovring did not explain how he determined this“excessive” threshold. Dovring attempted to quantify the distance factor by measuring the totaldistance which the farmer would make by visiting all of his plots, returning to his farmstead aftereach visit. This calculation has numerous weaknesses, including an assumption about the farmer’sroutine and the assumption of uniform field size (Gandle 1994).
Januszewski (1964)
The index developed by Januszewski is commonly used in the analysis of fragmentation in farmingsystems around the world. This index divides the square root of the total farm area by the sum ofthe square roots of the plot sizes. This index also ranges between 0 and 1. This index has threeproperties: fragmentation increases (the value of the index decreases) as the number of plotsincreases, fragmentation increases when the range of plot sizes is small, and fragmentationdecreases when the area of large plots increases and that of small plots decreases (Burton andKing 1982). This index (K), with (a) representing parcel size, is defined as:
Ka
a=
∑∑
Specifically, Januszewski’s index measures the number of plots and the size distribution of theplots. Again, this index fails to account for distance. As most of the indices do not account fordistance, this parameter can be included by the use of descriptive information when evaluating theextent of fragmentation.
Consolidation:
Consolidation is, according to its proponents, the solution to fragmentation. Burton and King(1983) identify consolidation as a spatial problem-solving technique, whereby landowners areobliged or compelled to surrender their scattered plots in order to receive an equivalent area orvalue of land in fewer and larger plots. Broadly defined, consolidation schemes and policies mayinclude new roads, irrigation systems, settlement schemes, and related services. The political,legal, and logistical requirements of implementing a consolidation program are quite extensive.Nonetheless, consolidation experiences reveal varying degrees of administrative and farmer-levelparticipation. For example, in Austria, the decision to consolidate requires a minimum vote of33% of the landowners holding at least 50% of the land. Consolidation procedures in Spain arepreceded by a considerable publicity campaign including meetings, films, news releases, radiobroadcasts, demonstration visits, and interviews with farmers. In other instances, consolidationmay be initiated directly from a specially created decision-making agency. In Europe and theMediterranean region, countries with consolidation legislation recently or currently in operationinclude: Finland, Sweden, Norway, Denmark, United Kingdom, Ireland, France, West Germany,Switzerland, Austria, Spain, Portugal, Italy, Greece, Turkey, and Cyprus (Burton and King 1983).
138
An alternative approach to consolidation is to use government resources to relax some of theconstraints which inhibit private consolidation. Simmons (1986) notes that by improving theeconomic environment of farmers, farmer behavior may lead naturally toward consolidation.Improved access to credit, agricultural markets, and related agricultural infrastructure such astransportation and irrigation all improve the production incentives of farmers. By incorporatingpolicies and legislation which improve the quantity and quality of information concerning land andland transactions, land markets will be strengthened. Thus, by pursuing agricultural developmentpolicies and objectives, private consolidation can be achieved simultaneously without theintroduction of additional inefficiencies.
Evaluating the success of consolidation experiences is somewhat complicated. There is anoticeable lack of empirical evidence on the subject due to the difficulties of comparingconsolidated areas with previous holdings or having an appropriate control. Often the evaluationof consolidation projects highlights the organizational properties of the scheme while assumingthat economic and social benefits automatically occur. While the statistical measurement of thebenefits of land consolidation are probably impossible (Oldenburg 1990), it is possible to speak ofthe benefits and costs of consolidation in general terms.
Consolidation has benefits and costs which are both public and private in nature. The privatebenefits of consolidation are most obvious to the extent that they address the disadvantages offragmentation. These benefits include locating all of one’s landholdings in one place, obtainingplots with straight-line boundaries and a rectangular shape, and gaining better access to roads,water channels, and other infrastructure. The public benefits may include increased productionand national income, including export earnings. The public costs for consolidation programs,however, are very high. For situations where there is a lack of a land market and a subsequentlack of information necessary to place a relative value on land, the technical and administrativecosts (surveying, mapping) can be quite excessive (Johnson 1970). Private farmers often bear theindirect costs of consolidation. The consolidation process can disrupt the crop cycle for two tothree years (Burton and King 1982) and the ecological benefits of fragmentation are alsodisrupted. It is also documented that large farms tend to benefit at the expense of small farms(Dovring 1965; King and Burton 1983; Bentley 1987). This is primarily due to the lower labor-to-land ratio of large farmers. That is to say, farmers with large holdings achieve larger relativereductions in transportation costs as a result of consolidating their holdings.
References on farm fragmentation:
Ballabh, Vishwa ,and Walker,T.S. 1992. “Land Fragmentation and Consolidation in Dry Semi-AridTropics of India.” Artha Vijnana 34(4): 363–387.
Bentley, Jeffery W. 1990. “Wouldn’t You Like To Have all of Your Land in One Place? LandFragmentation in Northwest Portugal.” Human Ecology 18(1).
Bentley, Jeffery W. 1987. “Economic and Ecological Approaches to Land Fragmentation: in Defense of aMuch-Maligned Phenomenon.” Annual Review of Anthropology 16: 31–67.
Blarel, Benoit et al. 1992. “The Economics of Farm Fragmentation: Evidence from Ghana and Rwanda.”World Bank Economic Review 6(2): 233–254.
Busch, Ruth, Charles Busch, and Naki Uner. 1979. “Field Fragmentation on an Irrigated Plain in Turkey.”Human Organization 38(1).
139
Chaudhry, M. Ghaffar. 1990. “Land Agglomeration under Changing Technology: Some Inferences fromPakistan.” Pakistan Development Review 29(2): 111–122.
Gandle, David L. 1994. “Land Fragmentation and the Present Situation in Albanian Agriculture.”Madison: Land Tenure Center, University of Wisconsin–Madison, August.
Johnson, Omotunde E.G. 1970. “A Note on the Economics of Fragmentation.” Nigerian Journal ofEconomic and Social Studies 12(2).
Karouzis, George. 1991. Land Consolidation in Cyprus (1970–1990). Nicosia: Republic of Cyprus,Ministry of Agriculture and Natural Resources, Land Consolidation Department, November.
King, Russell, and Steve Burton. 1982. “Land Fragmentation: Notes on a Fundamental Rural SpatialProblem.” Progress in Human Geography 6(4): 475–495.
McPherson, Malcolm F. 1983. “Land Fragmentation in Agriculture: Adverse? Beneficial? And forWhom?” Development Discussion Paper, no. 145. Cambridge, Mass.: Harvard Institute forInternational Development, March.
Mencinger, Joze. 1984/85. “The Limit on Landholdings (Yugoslavia).” Eastern European Economics.
Oldenburg, Philip. 1990. “Land Consolidation as Land Reform in India.” World Development 18(2): 183–195.
Pryor, Frederic L. 1982. “An International Perspective on Land Scattering.” Explorations in EconomicHistory 19: 296–320.
Simons, Scott. 1986. “Land Fragmentation in Developing Countries: The Optimal Choice and PolicyImplications.” Agriculture in a Turbulent World Economy: Proceedings of the NineteenthInternational Conference of Agricultural Economists. Cambridge: University of Oxford, Institute ofAgricultural Economics.
Simmons, Scott. 1987. “Land Fragmentation and Consolidation: A Theoretical Model of LandConfiguration with an Empirical Analysis of Fragmentation in Thailand.” Dissertation submitted tothe University of Maryland.
Report of the Mission on Land Consolidation and Registration in Kenya, 1965–1966.