Embed Size (px)
Citation preview

Final report Project WFD82
GUIDANCE ON ENVIRONMENTAL FLOW RELEASES FROM IMPOUNDMENTS TO IMPLEMENT THE WATER FRAMEWORK
DIRECTIVE
Project Extension 1 – Practical methodology for assessment GES for impoundments
March 2008

Project Extension 1 – Practical methodology for assessment GES for impoundments – March 2008
© SNIFFER 2007 All rights reserved. No part of this document may be reproduced, stored in a retrieval system or transmitted, in any form or by any means, electronic, mechanical, photocopying, recording or otherwise without the prior permission of SNIFFER. The views expressed in this document are not necessarily those of SNIFFER. Its members, servants or agents accept no liability whatsoever for any loss or damage arising from the interpretation or use of the information, or reliance upon views contained herein.
Dissemination status Unrestricted
Research contractor This document was produced by: The Centre for Ecology & Hydrology and Wallingford HydroSolutions Ltd, Crowmarsh Gifford, Maclean Building, WALLINGFORD OX10 8BB, UK Report authors: M.G.R. Holmes1, A.R.Young1 and M C Acreman2
1Wallingford HydroSolutions Ltd
2Centre for Ecology and Hydrology
SNIFFER’s project manager SNIFFER’s project manager for this contract is: John Aldrick, Environment Agency
SNIFFER’s project steering group members are: John Aldrick, Environment Agency Antonio Ioris, Scottish Environment Protection Agency Hilary Smithers, Scottish Environment Protection Agency Andrew MacKenney-Jeffs, Environment Agency Gary Mills, Department of Environment Northern Ireland Alison Murdock, Department of Environment Northern Ireland Kirsty Irving, SNIFFER
SNIFFER First Floor, Greenside House 25 Greenside Place EDINBURGH EH1 3AA
www.sniffer.org.uk

Project Extension 1 – Practical methodology for assessment GES for impoundments – March 2008
Use of the report The development of UK-wide classification methods and environmental standards that aim to meet the requirements of the Water Framework Directive (WFD) is being sponsored by UK Technical Advisory Group (UKTAG) for WFD on behalf its member and partners. This technical document has been developed through a collaborative project, managed and facilitated by SNIFFER and has involved the members and partners of UKTAG. It provides background information to support the ongoing development of the standards and classification methods. Whilst this document is considered to represent the best available scientific information and expert opinion available at the stage of completion of the report, it does not necessarily represent the final or policy positions of UKTAG or any of its partner agencies.

Project Extension 1 – Practical methodology for assessment GES for impoundments – March 2008

Project Extension 1 – Practical methodology for assessment GES for impoundments – March 2008
Executive summary Implementation of the EC Water Framework Directive (WFD) requires the development of procedures to ensure the adequate mitigation of the negative impacts created by water abstraction and impoundments. Flow regime releases from impoundments, such as reservoir dams, will be included in the licence conditions to allow the proper mitigation of negative impacts caused by their construction and operation. This report provides a practical methodology for implementing the WFD82 Standards for the initial assessment of whether a water body is likely to fail to meet Good Ecological Status (GES) because of changes to the flow regime (indexed by simple flow regime statistics). The availability of information on the release of water (spills and compensation flows) from reservoirs is the biggest barrier to implementing a methodology for testing whether a water body is likely to fail to meet GES. The methodology is a risk based framework based upon the use of the reservoir impact simulation model within the Low Flows 2000 software system in conjunction with a simple, water balance based reservoir simulation model. The approach enables regulators to apply the methodology in a screening level mode using worst case, minimum data scenario. The framework then provides the opportunity to improve the accuracy of the assessment by improving the data used to predict the releases from the reservoir, and hence improving the release profile used within the Low Flows 2000 reservoir impact simulation model. All guidance is provided within the limits of current knowledge of the flow regime requirements of river ecosystems, the likely impacts of flow alterations of ecosystem status and the current modelling capabilities of the Low Flows 2000 system.

Project Extension 1 – Practical methodology for assessment GES for impoundments – March 2008

Project Extension 1 – Practical methodology for assessment GES for impoundments – March 2008
Table of contents 1 Background.................................................................................................................... 1
1.1 An overview of the WFD82 guidelines.................................................................... 1 1.2 Objectives of the study........................................................................................... 3
2 Summary of the Low Flows 2000 software ..................................................................... 4 Catchment Definition ...................................................................................................... 4 Catchment Analysis........................................................................................................ 4 Evaluation of natural and influenced flow regimes.......................................................... 5
3 Compilation of meta-data on reservoirs .......................................................................... 7 4 Development of an impact propagation model over a representative reservoir dataset .. 9
4.1 Overview................................................................................................................ 9 Implications of using release profiles.............................................................................. 9
4.2 Modelling methodology .........................................................................................10 4.3 Discussion of results .............................................................................................10
5 Evaluation of the potential for developing an impact propagation method for GIS implementation.....................................................................................................................13 6 Practical implementation of the WFD82 Guidelines: a risk based approach ..................16
6.1 The risk-based approach ......................................................................................16 6.2 The Derwent Reservoir: A case study application of the Risk based approach .....17
7 Conclusions...................................................................................................................23 8 References....................................................................................................................25 9 Appendix 1: Compilation of meta-data on reservoirs .....................................................26 10 Appendix 2: RESSIM and use within the WFD82 project ..........................................31
10.1 Application of RESSIM to predict downstream propagation of impact ...................32 Release profiles estimated using RESSIM (Method A)..................................................33 Release profiles derived from gauged data (Method B).................................................34 LF2000 WFD82 Risk assessment downstream .............................................................36 Summary.......................................................................................................................37
11 Appendix 4: Summary of propagation of downstream impact modelling ...................41

Project Extension 1 – Practical methodology for assessment GES for impoundments – March 2008

Project Extension 1 – Practical methodology for assessment GES for impoundments – Dec 2007 1
1 Background
1.1 An overview of the WFD82 guidelines The implementation of the EC Water Framework Directive (WFD) requires the development of procedures to ensure the adequate mitigation of the negative impacts created by water abstraction and impoundments. Flow releases from impoundments, such as reservoir dams, in the form of compensation flows and freshets will be included in the licence conditions to allow the proper mitigation of negative impacts caused by their construction and operation. The SNIFFER WFD82 project has been established to produce guidance on the setting of compensation flows and freshets from impoundments. This guidance was published in May 2007 (SNIFFER, 2007). The guidance is aimed at environmental regulators, dam operators and other stakeholders and it is equally applicable in all UK member countries. The published guidance is divided into three parts:
1. A step by step guide, supported by a flow chart, that describes the process of defining the target river ecosystem status, setting flow regime releases from impoundments and monitoring their effectiveness in achieving that status. The steps include revision of the flow release regime according to impoundment capability, purpose and designation.
2. A method for initial assessment of whether a water body is likely to fail to meet Good
Ecological Status because of changes to the flow regime (indexed by simple flow regime statistics), which can be used where appropriate biological assessment tools are not adequate.
3. A procedure for defining an environmental flow regime release based on the requirements of riverine species for basic elements (building blocks) of the natural flow regime. Three levels of assessment (desk-top flow assessment, hydraulic assessment and biological assessment) provide a risk-based approach in which greater investment in the assessment yields lower uncertainty in results. In all three levels, assessments should be carried out by a team of experts that normally includes physical scientists, such as a hydrologist, hydrogeologist and geomorphologist, and biological scientists, such as an macro-invertebrate ecologist, a freshwater botanist and a fish biologist.
The application of the first step within the guidelines requires an assessment of a water body to determine if it is likely to fail to achieve Good Ecological Status (GES). This will determine whether the water body should be considered provisionally as a Heavily Modified Water Body (HMWB). The determination is based on whether the hydrological flow regime has been altered significantly from its reference conditions (often the natural flow regime). This is a surrogate for comparison of current biological elements against reference conditions for which suitable tools do not exist at present. The flow regime of any river system is complex (particularly flow regimes on impermeable substrates which hold the majority of impoundments) and requires a large number of parameters to describe it accurately, preferably based on analysis of time-series of river flow (Poff et al, 1997; Junk et al., 1989; Richter et al. 1996; Black et al. 2000 & 2005). The WFD82 project identified the logistical challenges of sourcing long, low uncertainty time-series of river flow for both the pre and post impoundment situation. Based on studies of flow regimes from 290 upland catchments (BFI <0.5) in England, Wales and Scotland the WFD82 guidelines propose that UK flow regimes may be characterised adequately by 10 parameters (Table 1) that, with the exception of the mean julian days of the minimum and maximum flows can be estimated from the LF2000 software system.

Project Extension 1 – Practical methodology for assessment GES for impoundments – Dec 2007 2
Table 1 Relationship between IHA parameters and LF2000 statistics
Group IHA full list
IHA short list LF2000 list
1 December flow (m3s
-1)
1 January flow(m3s
-1)
1 February flow (m3s
-1)
mean January flow (m3s
-1)
mean January flow (m
3s
-1)
1 March flow (m3s
-1)
1 April flow (m3s
-1)
1 May flow (m3s
-1)
mean April flow (m3
s-1
)
mean April flow (m3
s-1
)
1 June flow (m3s
-1)
1 July flow (m3s
-1)
1 August flow (m3s
-1)
mean July flow (m3
s-1
)
mean July flow (m3
s-1
)
1 September flow (m3s
-1)
1 October flow (m3s
-1)
1 November flow (m3s
-1)
mean October flow (m3
s-1
)
mean October flow (m
3s
-1)
2 1 day minimum flow
2 3 day minimum flow
2 7 day minimum flow
2 30 day minimum flow
2 90 day minimum flow
mean of annual minimum 7 day flow (m
3s
-1)
Q95 (m3s
-1)
2 1 day maximum flow
2 3 day maximum flow
2 7 day maximum flow
2 30 day maximum flow
2 90 day maximum flow
mean of annual maximum 7 day flow (m3
s-1
) Q5 (m
3s
-1)
3 mean julian day of minimum flow
3 mean julian day of maximum flow
4 number of times flow rate rises above 25th flow percentile
mean number of times per year flow exceeds Q25
4 number of times flow rate drops below 75th flow percentile
mean number of times per year flow is less than Q75
BFI
4 mean duration of high pulses
4 mean duration of low pulses
5 number of flow rises
5 number of flow falls
Mean number of flow rises
5 mean rise rate
5 mean fall rate
mean fall rate - mean different between falling flows (m
3s
-1d
-1)
BFI
Given that LF2000 statistics can be generated for all sites in the UK, regardless of available flow data, the WFD82 report proposed that these should be used as the base set on which to compare pre- and post-impoundment flow regimes in ungauged catchments, but that where flow time series are available, they should be used to calculate the statistics. Using the LF2000 derived statistics the WFD82 initial thresholds for departures of the post impoundment flow statistics from the natural flow statistics are summarised within

Project Extension 1 – Practical methodology for assessment GES for impoundments – Dec 2007 3
Table 2. If the difference between any statistics for the pre- and post-impounded flow regimes is outside of the threshold, the impounded flow regime falls into the stated category.

Project Extension 1 – Practical methodology for assessment GES for impoundments – Dec 2007 4
Table 2 Thresholds of hydrological alteration to meet GES Low Flows 2000 statistics mean January flow (m
3s
-1)
mean April flow (m3s
-1)
mean July flow (m3s
-1)
mean October flow (m3s
-1)
Q95 (m3s
-1)
Q5 (m3s
-1)
BFI
Low risk of failing GES if alteration less than 40% in all statistics
Medium risk of failing GES if alteration greater than 40 but less than 80% in any statistic
High risk of failing GES if alteration greater than 80% in any statistic
1.2 Objectives of the study This report presents the outcomes of an extension to the original WFD82 project to develop a practical, screening level methodology for evaluating whether a water body is likely to fail to meet good status because of changes to the flow regime downstream of an impounding reservoir and the downstream extent of the failure, which will be ameliorated downstream as a consequence of incoming, non regulated tributaries. With pre- and post-scheme flow data the assessment of the modification of the flow regime at the site of the dam is straight forward. As is more commonly the case, there are no measured data pre-scheme (the majority of reservoirs were constructed prior to the expansion of the gauging station network in the 1960s) and for the majority there are few measured data post scheme. The exceptions to this rule are relatively small number of regulating reservoirs and hydropower reservoirs. For these reservoirs operating measurement records will generally exist. However, for the majority of reservoirs the only information that exists is information regarding the statutory compensation flow (and to a lesser extent freshets). There are usually no data to estimate the spill regime of the reservoir. This current lack of appropriate data for representing the release profile will prevent the implementation of the WFD82 guidelines for the majority of reservoirs. The methodology presented within this report is based on the use of the LF2000 software and the thresholds identified within

Project Extension 1 – Practical methodology for assessment GES for impoundments – Dec 2007 5
Table 2. LF2000 is operational within SEPA and the Environment Agency (EA). Once a release profile has been derived, the SEPA and EA versions of the software contain the same reservoir algorithms. Both systems can be used to simulate the impact at the dam face and how that impact propagates downstream compared with the natural flow accretion regime. To support the application of the methodology, a meta database of readily available information describing reservoirs by type and gross capacity has been compiled. This is presented in Appendix 1. The development of the assessment methodology based on Low Flows 2000 and the RESSIM reservoir simulation model is presented in Appendix 2. This model was applied to a set of 25 reservoirs and the potential for developing a generalised, GIS based screening methodology was investigated. This is summarised within Section 4.2, which concludes that such a screening level methodology is not a tractable proposition. In lieu of a simple GIS screening methodology, a tiered risk based approach for applying the LF2000 based assessment methodology was developed and demonstrated through application to a case study reservoir system (Section 6). The report concludes by summarising the outcomes of the study and making recommendations for further developments.
2 Summary of the Low Flows 2000 software The Low Flows 2000 (LF2000) software is in operational use with both SEPA and the Environment Agency and is described in detail by Young et al. (2002). The natural flow statistics that may be estimated for an ungauged catchment include the long term mean flow and flow duration curve, monthly mean flows and flow duration curves. These hydrological models are described in detail by Holmes et al. (2002a,b &c). The LF2000 software system is a PC based package written in MS Visual Basic that uses MS Access for databasing and ESRI MapObjects for mapping and the geographical analysis. Within LF2000, a digital river network is used in conjunction with a digital terrain model (DTM) to define a catchment boundary. This boundary is then used to extract catchment values from digital grids of the catchment characteristics required as inputs to the hydrological models. The catchment boundary is also used to identify artificial influences (groundwater and surface water abstractions, discharges and impounding reservoirs) within the catchment from geo-referenced digital data sets of these influences. The models for estimating both natural flow statistics within an ungauged catchment and the impact of artificial influences are hence managed within LF2000 by a process of catchment definition, analysis, and evaluation of natural and influenced flow regimes. Catchment Definition The first stage is to define and describe the catchment that drains through the site of interest. The catchment outlet is defined by selecting a river reach either by entering a grid reference or interactively using the mouse. Two methods of defining the catchment above the chosen point are provided: an 'analogue' climb, based on river network drainage-density, and a 'digital' climb, based on a grid derived from a digital elevation-model. The digital climb is the most commonly used option and was the option used within this study. Both climb methods may be used to define the same catchment and hence enable the comparison of resultant boundaries. Contextual information, such as Ordnance Survey data sets, can be displayed to assist in the selection of the most appropriate boundary.

Project Extension 1 – Practical methodology for assessment GES for impoundments – Dec 2007 6
Catchment Analysis The derived catchment boundary is overlaid on one kilometre resolution spatial digital grids to derive the catchment characteristics used within the hydrological models. The long term natural flow duration curve standardised by the long term mean flow is estimated for the ungauged catchment by selecting a group of ten similar catchments from a reference source pool of gauged catchments and taking a weighted average of the observed flow statistics for the selected catchments. The weight for a reference gauged catchment is based on the hydrogeological similarity of the gauged catchment to the ungauged site and the similarity of the scale of the catchment runoff to the ungauged catchment. Runoff is estimated using a regional model described by Holmes et al (2002a). An estimate of the long term natural mean flow for an ungauged catchment is obtained by re-scaling the estimated value of runoff by the catchment area calculated from the boundary generated by the catchment climb process. Similar models are used within the software for deriving natural estimates of monthly mean flow and flow duration statistics.
Figure 1 Catchment boundary definition using the Digital Terrain Model
Evaluation of natural and influenced flow regimes To incorporate the impact of artificial influences on the natural flow regime, the catchment boundary is used to query a geo-referenced database of influence features within the software. These features currently include surface and groundwater abstractions, impounding reservoirs and discharges. Artificial influence sites are quantified in terms of a typical monthly volume for each calendar month within the year; this is termed a monthly profile. In the case of abstraction licences and discharge consents the monthly volumes relate to water that is either abstracted or discharged. The software will use actual recorded data, if loaded, to represent the monthly profile for a site, or if no actual data is available the software will estimate a profile based on authorised volumes and patterns observed in historical data. For reservoirs, however, the monthly profiles represent a combination of

Project Extension 1 – Practical methodology for assessment GES for impoundments – Dec 2007 7
estimates of spill volumes and compensation/regulation releases for each month. Due to these complexities the user is required to supply a bespoke profile for reservoirs. The provision of this profile was a main focus of this current study. When estimating the flow regime at a site the software uses the catchment boundary and river network to identify all upstream influence feature sites, discounting those that lie above impounding reservoirs. The individual monthly profiles for each upstream influence are then accumulated into a total monthly influence profile for each influence feature type. Initially considering just abstractions and discharges, the total monthly profile for discharge sites is then added to the estimated natural long term monthly mean flows and the total monthly influence profile for abstractions is subtracted from the natural monthly mean flows to derive influenced monthly mean flow estimates. These influenced estimates are then used to scale the appropriate monthly flow duration curves, which are subsequently combined to yield an influenced long term flow duration curve. The most complex step within this process relates to the exclusion of the reservoired catchment above impoundments. The software identifies the location of all impounding reservoirs immediately upstream of the ungauged site. The system then estimates, and discounts the reservoired sub-catchment(s) and any influences (including further impounding reservoirs) that might lie within the reservoired catchments. The influenced flow statistics for the ungauged residual catchment are estimated by recalculating the set of natural flow duration statistics for the residual catchment alone and incorporating the influences located within the residual catchment, including the addition of release profiles for the reservoirs, as described above. The balance between the estimated natural and artificial components of a flow regime along a length of river, represented by a set of stretches, can also be investigated in the LF2000 residual flow diagram option by repeating the steps described above for consecutive points along a river. The variations of the natural and artificially-influenced versions of a chosen key flow statistic are plotted against an axis of distance along the river, allowing a visual comparison to be made between the two (see Figure 2). By evaluating the difference between them, the net influence for the given flow-condition may also be visualised along the course of the river. This functionality has been used as the basis of the practical methodology for implementing the WFD82 guidelines.

Project Extension 1 – Practical methodology for assessment GES for impoundments – Dec 2007 8
Figure 2 The Low Flows 2000 Residual Flow Diagram
3 Compilation of meta-data on reservoirs The extent to which the influence of a reservoir may propagate downstream will be heavily influenced by the primary function of the reservoir. In broadest terms, reservoirs may be classed as: 1. Hydro-electric with compensation releases 2. Hydro-electric without compensation releases 3. Compensation only 4. Supply and compensation 5. Supply only 6. Pumped storage 7. Regulating (both release for downstream abstraction and storage manipulation to
mitigate downstream flooding). Class 6 can, in the main, be treated as abstraction. Some pumped storage schemes within Class 6 have no natural catchment area (e.g. the West London reservoirs whilst others do have a small natural catchment area (e.g. Rutland Water), those without natural catchment areas are hydrologically disconnected and hence can be ignored, whilst those with a natural catchment normally have a compensation regime. The impacts of Class 7 by definition may extend significantly downstream. These impacts are

Project Extension 1 – Practical methodology for assessment GES for impoundments – Dec 2007 9
either associated with releases for downstream abstraction or manipulation of storage for attenuation of flood flows from the catchment above the reservoir. The level and downstream extent of impacts will be very contingent upon the operating rules for the reservoir. However, there are relatively few significant regulating reservoirs and the local operators have the required information at the point of release and the point of take/control. Class 1 reservoirs are a significant issue for Scotland, but are on the whole not an issue within England and Wales. In essence, large volumes of water may be released through the turbines at times linked to the value of the electricity generated. These schemes may have significant impacts extending a long way downstream and due to the bespoke operating regime are not amenable to generalised rules. Class 2 reservoirs occur very infrequently and hence can be handled on a site by site basis outside the screening process.. The majority of reservoirs within the UK fall into Classes 3, 4 and 5. Class 3 normally lie at the bottom of a nested set of conjunctive reservoirs, whilst Class 5 reservoirs are commonly small. In the main, these three classes can be regarded as reservoirs in which the active storage is managed to provide a yield and a compensation release. Reservoirs are generally drawn down during the summer months and filled during the winter months and are commonly full during the spring. When the reservoir is full, and spilling, the regime is essentially natural, although some marginal attenuation of high flows and maintenance of base flow has to be accounted for. This can be significant for flood routing, but is much less significant when considering flows at a daily time step, and in the context of flow duration statistics this is rarely a significant issue. The maintenance of base flow and attenuation of high flows is strongly related to the ratio of the reservoir volume to the contributing catchment area of the dam. A review of information available to describe the size and operation of reservoirs within the UK is presented within Appendix 1. Institute of Hydrology Report 99 (R99) is the only base data set that consistently recorded quantitative information about reservoirs in the UK, including compensation flow requirements, compensation regimes, and reservoir type. A total of 552 reservoirs are listed on this archive (excluding Northern Ireland reservoirs), hence it covers only a fraction of the total number of reservoirs in Great Britain (GB). By comparison, approximately 2500 reservoirs/lakes/lochs are listed on the Building Research Establishment’s Dams Register (BREDR) data set which includes both essentially natural lakes and constructed storages of greater than 25Ml capacity (those that come under the 1975 Reservoirs Act). Many of these storages will be small and not significant at the WFD water body scale. Extensive manual verification and cross referencing with other data sources has been undertaken for the reservoirs listed in R99. The location of all reservoirs in England and Wales (363 in total) have been verified. The location of all Scottish reservoirs have not yet been verified in detail, due to time constraints of this project. Data for the 16 significant (>500Ml) reservoirs in Northern Ireland, operated by the Water Services Dept of DOE-NI, have not been verified yet, due to a lack of data sources and time constraints of this project These reservoirs are classified according to TYPE (as defined by R99) as summarised within Table 3. As reported in Appendix 1, a set 33 reservoirs suitable for use within this study were identified to have the following features: relatively simple catchwaters, no nesting or simple nesting arrangements, abstraction data, relatively simple abstraction licence structures, compensation flow data, and impounded catchment areas that could be defined.

Project Extension 1 – Practical methodology for assessment GES for impoundments – Dec 2007 10
Table 3 Distribution of reservoir TYPE across data set (including Northern Ireland reservoirs)
Region TYPE Count
E & W Compensation only 30
E & W Pumped Storage 23
E & W Regulating 31
E & W Supply only 74
E & W Supply and compensation 173
E & W UNKNOWN 32
Scotland Compensation only 10
Scotland Hydropower and compensation 38
Scotland Hydropower only 10
Scotland Pumped Storage 2
Scotland Regulating 4
Scotland Supply only 16
Scotland Supply and compensation 65
Scotland UNKNOWN 44
Northern Ireland Supply only 9
Northern Ireland Supply and compensation 7
4 Development of an impact propagation model over a representative reservoir dataset
4.1 Overview Reservoirs impact on downstream flows as they modify the flow regime at the point they are located within the catchment. The storage volume of the reservoir is utilised to enable abstractions to take place during times when sufficient resource would not be available in the natural river. Compensation releases are typically made during summer months to sustain downstream flows. Where the releases (spills plus compensation flows) from a reservoir are gauged, these data represent the best possible information for modelling the influence of a reservoir within LF2000. Such gauged records retain information on the variability and temporal sequencing of flows downstream of the reservoir, which effectively replace the natural flow regime at this point. The CLASS 1, 2 and 4 gauging station records identified in Appendix 1 are suitable for this type of modelling application. However, in many cases gauged flow data for reservoir releases do not exist. For this case the RESSIM, was used to assess the impact of a reservoir. The model, developed by Wallingford HydroSolutions Ltd., uses inputs of abstraction and compensation regimes together with estimates of inflows derived from LF2000, to estimate a release profile of 12

Project Extension 1 – Practical methodology for assessment GES for impoundments – Dec 2007 11
average monthly release volumes from the reservoir. Appendix 2 describes the RESSIM model and presents examples of application of the model, together with LF2000, to estimate the propagation of the WFD82 flow indices downstream of reservoirs. The impact of the reservoir on the trigger flow statistic ‘X’ is defined as: IMPACTQx = (QxNAT – QxINF) / QxNAT
Where QxNAT is the natural flow statistic and QxINF is the influenced flow statistic considering only the impact of the reservoir (and any associated catchwaters). Note that Base Flow Index was also included as a trigger statistic in the WFD guideline standards as it correlated will with some of the Richter statistics, however BFI is the outcome statistics from a base flow separation algorithm and is meant to represent the fraction of the river flow regime that is generated from slow flow paths within the catchment. As such, the impact of a reservoir on BFI cannot be predicted by LF2000 and the merit of such a statistic is doubtful.
Implications of using release profiles
The representation of reservoirs in LF2000 by a release profile (average monthly flow values) rather than a full release flow duration curve (FDC) series is a simplification that is appropriate for the WFD82 project, where the controlling ‘trigger’ statistics are predominantly mean monthly flows, see

Project Extension 1 – Practical methodology for assessment GES for impoundments – Dec 2007 12
Table 2. Furthermore, LF2000, at the date of publication of this report, currently employs the use of profiles rather than release FDCs. It is the intention of Wallingford HydroSolutions Ltd. to modify the reservoir algorithm within LF2000 to use release FDC in the future. Implications for using a release profile rather than a release FDC are discussed for the two annual flow percentile triggers (Q5 and Q95) below.

Project Extension 1 – Practical methodology for assessment GES for impoundments – Dec 2007 13
• In the case of the annual Q95 statistic: o If the reservoir does not spill (i.e. only a compensation release occurs) during
the month in which the annual Q95 occurs, then the use of a release profile is acceptable.
o If the reservoir does spill during the month of the annual Q95 flow, using a release profile will introduce uncertainty into the estimate of the downstream impact on the annual Q95 flow (and the reservoir may be better treated as a run of river abstraction). The RESSIM model provides a method for screening if a reservoir is likely to spill during the month of the annual Q95 flow.
• In the case of the annual Q5 statistic: o If a reservoir is spilling during the month in which the annual Q5 occurs then
the impact can be represented using a reservoir flood attenuation algorithm (RFAA) (WHS, 2006). This method relates the impact of a water body on flow statistics to the relative size of the water body and catchment area to the catchment area at the point of interest and is described in Appendix 3.
o If the reservoir is not spilling during the month in which the annual Q5 occurs then downstream flows will be significantly impacted which will also be reflected in other trigger statistics (e.g. Mean January flow).
4.2 Modelling methodology Two modelling approaches were developed;
• METHOD A - For reservoirs without gauged release profiles - RESSIM was used to estimate a release profile, the release profile was entered into a LF2000 model and the software used to predict downstream impacts for each WFD82 threshold of alteration. Impacts at Q5 are predicted using the approach outlined previously, using output from LF2000.
• METHOD B - For reservoirs with gauged release profiles – the gauged releases from the reservoir were reduced to mean monthly flows which were then entered into a LF2000 model as a release profile. The LF2000 model was used to predict downstream impacts for each WFD82 threshold of alteration. Impacts at Q5 are predicted using the approach outlined previously, using output from LF2000.
The application of these methods to 25 reservoirs is presented within Appendix 4. Method B was applied to 11 of the reservoirs, whilst Method A was applied to 12 reservoirs. A release profile was provided by the Environment Agency for Clatworthy reservoir in the Northwest, whilst Ullswater (also in the North Wests) was treated as an abstraction within LF2000, rather than reservoir, as it spills all year round.
4.3 Discussion of results The application of the methodology to 25 catchments has illustrated a number of key points related to successful modelling of reservoir impacts:
• Each reservoir is individual lending a bespoke nature to the modelling exercise for a reservoir. Common issues that occurred included:
o Cross checking of data between multiple sources was required to confirm issues including; location, catchwater arrangement, capacity and operation.
o Licence level abstraction information, covering several sources had to be reduced to the site level, requiring judgement in the absence of verifiable data.
o Operation of multiple reservoirs had to be confirmed by spatial analysis of sites and licence information.

Project Extension 1 – Practical methodology for assessment GES for impoundments – Dec 2007 14
o Potential for interaction of reservoirs (e.g. nested systems) had to be assessed spatially.
o Assessment of the downstream propagation of impacts requires judgement and hydrological interpretation. For example, intervention of whether a threshold lies upstream or downstream of the confluence of a impacted stream with a significant tributary.
• The importance of correctly identifying the abstraction regime at the reservoir was highlighted, as without these data the release regime from the reservoir cannot be correctly represented. For example, the abstraction data for Weirwood reservoir appears to be in error by a factor of five (when comparisons are made to historical observed flow data downstream). This discrepancy could also be due to the abstraction regime changing over time, hence requiring more recent flow records to be used for comparison. Additionally, where reservoir abstraction licences consist of multiple sites (potentially from a combination of sources within the impounded area, outside the impounded area and from other reservoirs) information regarding the actual split between sites is required to correctly apportion actual take from the reservoir storage. In most instances this information is not available.
• The operation of reservoirs does change over time. For example, the historic release regimes of Eyebrook reservoir vary considerably with time. Such changes reflect modifications to abstraction and/or compensation policy, operational constraints, changes to the reservoir structure, commissioning of new schemes etc. The simulation of the impact of reservoirs using gauged data (and the comparison of impact models against gauged records) needs to take such changes into account.
• Transfers to or from reservoirs need to be correctly represented and links clearly established to the receiving waters/abstraction points. The representation of linked abstractions needs to be resolved; for example, abstractions from Grassholme are linked to abstractions from the Balderhead, Hury and Blackton reservoirs. The uptake of this project at the national level would benefit greatly from a general revision of the requisite data sets and the conceptual understanding of how reservoir abstraction/transfer schemes current operate.
• The compensation regimes (volume and frequency) need to be identified correctly. Comparison with observed downstream flow data suggests that compensation rules may have changed from those recorded by the Institute of Hydrology Report 99, for example Grimwith reservoir (which is used as a flow augmentation reservoir). Verification of compensation/release behaviour from reservoirs would be of benefit to this project. Within England and Wales it is hoped that this will be an outcome of the National Low Flows 2000 Population Project.
• The identification of catchwaters is critical to the correct representation of resource availability at a reservoir and the indirect effects of reservoir catchwaters on downstream flows. As discussed in Appendix 1, the Institute of Hydrology Report 99 was the only available source of consistent information regarding catchwaters (in terms of contributing areas). However it was not possible to verify these with OS maps in all cases. Access to local knowledge regarding the extent and operation of catchwaters would be beneficial to the wider uptake of the outcomes of this project.
• Complex systems of multiple reservoirs can have release/compensation requirements that are governed by maintained flow points and/or reservoir level controls, for example the Widdop and Walshaw reservoirs. Such systems could be modelled if sufficient data was available. Generally this was not the case for this project, and effort was focused on

Project Extension 1 – Practical methodology for assessment GES for impoundments – Dec 2007 15
relatively simple reservoir systems. The impacts of multiple reservoir systems need to be considered as a whole, as release and compensation policies are typically developed for the system as a whole. Other instances exist where reservoirs may not be operated as a system, but impact on a common main river reach, for example the Cant Clough / Swinden / Hurstwood reservoirs on the River Burn (tributary of the River Don).
• There is a need to be able to model the complete impact of reservoirs. For example, catchwaters remove resource from watercourses that lie within other headwaters of the catchment downstream of a reservoir, for example Thirlmere reservoir. The impacts of these indirect catchments on the regime downstream of such reservoirs will be an additional impact to that of the reservoir itself. If transfers to or from the reservoir exist, the impact of these on adjacent rivers or other reservoirs needs to be modelled in a holistic way as they are all components of the “reservoir impact”. The LF2000 framework enables the impact of all such features on river flows to be modelled.
• Preliminary investigations have confirmed the benefits of representing reservoirs by release FDC series rather than release profiles. Use of a release FDC retains the within month variability of flows which translates to better estimates of downstream impacts. Work beyond the scope of this project could include the upgrade of LF2000 to represent reservoirs by FDC series, which would enable the impact of reservoirs on Q95 and Q5 to be more accurately determined. Furthermore, such a modification to LF2000 would enable the downstream impacts of regulating reservoirs and hydropower reservoirs (with gauged releases) to be modelled more effectively.
• If gauged flow data are to be used to derive a release profile for a reservoir, then it is important for the period of record used to reflect current reservoir operational conditions. Flows records gauged below reservoirs, such as Eyebrook, show that release management practices that have varied considerably over the last 30 years, see Figure 4.1.
0
0.1
0.2
0.3
0.4
0.5
0.6
0.7
0.8
Jan
Feb
Mar
Apr
May
Jun
Jul
Aug
Sep
Oct
Nov
Dec
OB
S M
ean M
onth
ly F
low
(m
3/s
)
1970-1980 MMF 1980-1990 MMF 1990-1999 MMF
Figure 4.1 Observed monthly mean flows (MMF) downstream of Eyebrook reservoir
Project Extension 1 – Practical methodology for assessment GES for impoundments – Dec 2007 16
5 Evaluation of the potential for developing an impact propagation method for GIS implementation
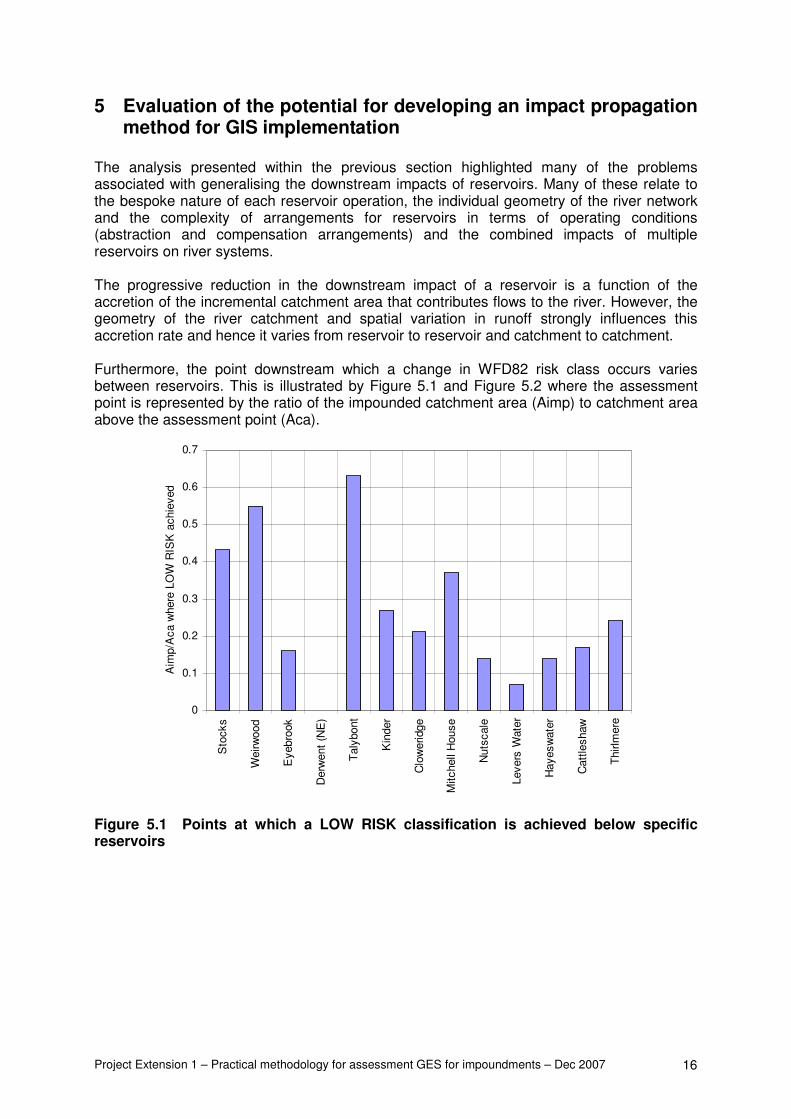
The analysis presented within the previous section highlighted many of the problems associated with generalising the downstream impacts of reservoirs. Many of these relate to the bespoke nature of each reservoir operation, the individual geometry of the river network and the complexity of arrangements for reservoirs in terms of operating conditions (abstraction and compensation arrangements) and the combined impacts of multiple reservoirs on river systems. The progressive reduction in the downstream impact of a reservoir is a function of the accretion of the incremental catchment area that contributes flows to the river. However, the geometry of the river catchment and spatial variation in runoff strongly influences this accretion rate and hence it varies from reservoir to reservoir and catchment to catchment. Furthermore, the point downstream which a change in WFD82 risk class occurs varies between reservoirs. This is illustrated by Figure 5.1 and Figure 5.2 where the assessment point is represented by the ratio of the impounded catchment area (Aimp) to catchment area above the assessment point (Aca).
0
0.1
0.2
0.3
0.4
0.5
0.6
0.7
Sto
cks
Weirw
ood
Eyebro
ok
Derw
ent
(NE
)
Taly
bont
Kin
der
Clo
weridge
Mitchell
House
Nuts
cale
Levers
Wate
r
Hayesw
ate
r
Catt
leshaw
Thirlm
ere
Aim
p/A
ca w
here
LO
W R
ISK
achie
ved
Figure 5.1 Points at which a LOW RISK classification is achieved below specific reservoirs

Project Extension 1 – Practical methodology for assessment GES for impoundments – Dec 2007 17
0
0.2
0.4
0.6
0.8
1
1.2
Sto
cks
Weirw
ood
Eyebro
ok
Derw
ent
(NE
)
Taly
bont
Kin
der
Clo
weridge
Mitchell
House
Nuts
cale
Levers
Wate
r
Hayesw
ate
r
Catt
leshaw
Thirlm
ere
Aim
p/A
ca w
here
ME
DIU
M R
ISK
achie
ved
Figure 5.2 Points at which a MEDIUM RISK classification is achieved below specific reservoirs
The relationship between the water balance components of the reservoir and the point of downstream impact is shown within Figure 5.3. This figure presents the release volume (the sum of spill and compensation release volumes), expressed as a fraction of the total average annual inflow to the reservoir plotted against the location downstream at which low risk is achieved (as represented by Aimp/Aca).
0
0.1
0.2
0.3
0.4
0.5
0.6
0.7
0.8
0.9
0 0.2 0.4 0.6 0.8 1
Aimp/Aca where LOW RISK achieved
RE
L /
IN
FLO
W (
Annual)
Figure 5.3 Relationship between annual RELEASE volume (as a fraction of INFLOW) from reservoirs and the how far downstream a LOW RISK category is achieved
Project Extension 1 – Practical methodology for assessment GES for impoundments – Dec 2007 18
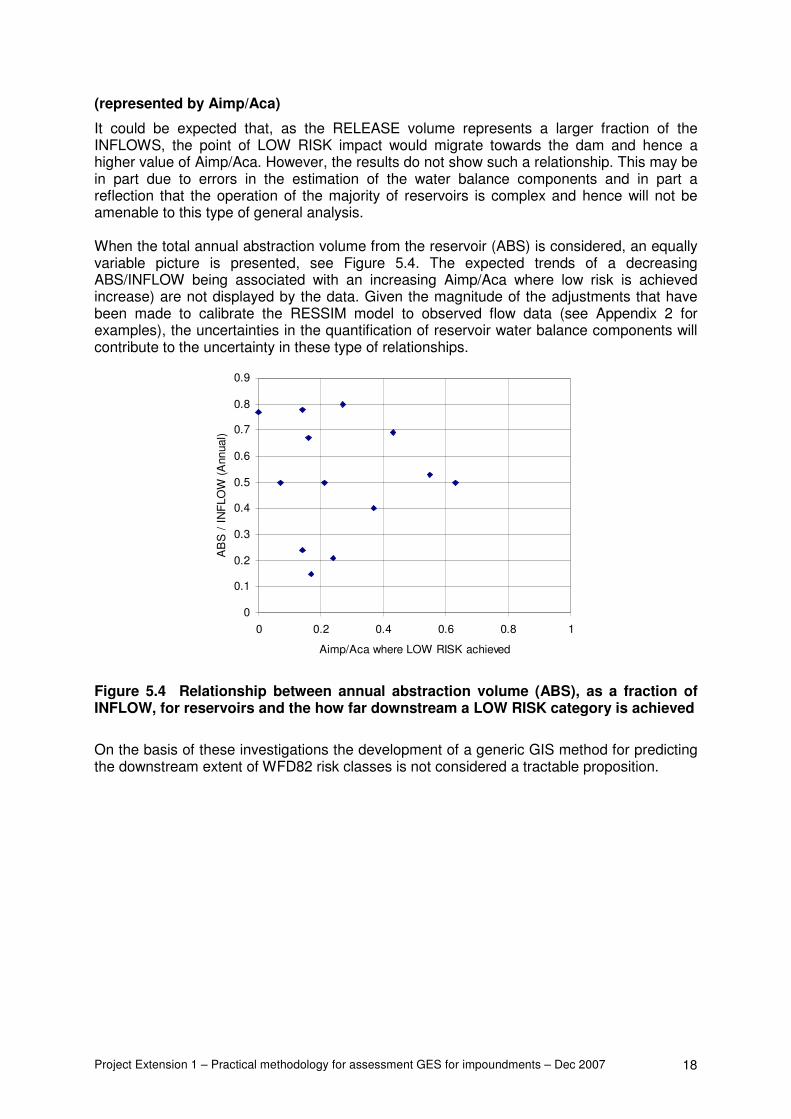
(represented by Aimp/Aca)
It could be expected that, as the RELEASE volume represents a larger fraction of the INFLOWS, the point of LOW RISK impact would migrate towards the dam and hence a higher value of Aimp/Aca. However, the results do not show such a relationship. This may be in part due to errors in the estimation of the water balance components and in part a reflection that the operation of the majority of reservoirs is complex and hence will not be amenable to this type of general analysis. When the total annual abstraction volume from the reservoir (ABS) is considered, an equally variable picture is presented, see Figure 5.4. The expected trends of a decreasing ABS/INFLOW being associated with an increasing Aimp/Aca where low risk is achieved increase) are not displayed by the data. Given the magnitude of the adjustments that have been made to calibrate the RESSIM model to observed flow data (see Appendix 2 for examples), the uncertainties in the quantification of reservoir water balance components will contribute to the uncertainty in these type of relationships.
0
0.1
0.2
0.3
0.4
0.5
0.6
0.7
0.8
0.9
0 0.2 0.4 0.6 0.8 1
Aimp/Aca where LOW RISK achieved
AB
S /
IN
FLO
W (
Annual)
Figure 5.4 Relationship between annual abstraction volume (ABS), as a fraction of INFLOW, for reservoirs and the how far downstream a LOW RISK category is achieved
On the basis of these investigations the development of a generic GIS method for predicting the downstream extent of WFD82 risk classes is not considered a tractable proposition.

Project Extension 1 – Practical methodology for assessment GES for impoundments – Dec 2007 19
6 Practical implementation of the WFD82 Guidelines: a risk based approach
6.1 The risk-based approach
The analysis completed using the RESSIM generalised monthly reservoir model has demonstrated that if the input data are reliable the model can simulate the downstream propagation of the derogation of the LF2000 WFD82 indices. However, the performance of RESSIM is limited by the availability of required input data (information on compensation releases, abstractions from the reservoir and extent of indirect catchments) and that many sources are used conjunctively. Due to the above issues and the complexity of actual operation, the initial regional analysis demonstrated no relationship between the downstream extent of flow derogation and the size and resource utilisation of the reservoir. In response to these issues a risk-based approach to assessing the extent of the downstream derogation of the LF2000 WFD82 indices is proposed. For the Q5 index, the analysis of the degree of derogation will be based solely on the surface water body attenuation algorithm presented within Appendix 3. This assumes that the reservoir will be spilling at Q5 and hence the impact at Q5 will be the storage attenuation. RESSIM can be used in this context to test whether this assumption is valid, that is, if spilling is predicted to occur during the winter season. For the other flow indices three scenarios will be considered;
• WORST CASE scenario, it is assumed that the derogation at the reservoir location will be 100% (zero release) and that as one moves downstream the derogation will be mitigated only by the inflows from the incremental catchment area. This worst case scenario will identify the maximum downstream extent of derogation of the LF2000 WFD82 indices. If the extent of derogation is unacceptable, and a more sophisticated assessment is required, the reservoir operator will be required to provide the data to improve the assessment. The type of data provided will define the two other scenarios;
• MEDIUM CASE scenario, assumes that accurate data relating to the water balance components of the RESSIM model will be provided including; actual abstractive regimes located by site, compensation flow regimes and catchwater contributions. RESSIM can then be used to estimate release profiles using Method A described previously.
• BEST CASE scenario, assumes that a gauged flow record for outflows from the dam (all spills and compensation flows) can be provided. Release profiles can be derived from the observed flow series as described previously in Method B.
The WFD82 guidelines only consider reductions in the flow statistics indices. The impacts on some indices could be positive (for example, compensation flows greater than the Q95 flow), depending on the reservoir operating policy. For this screening level methodology it will be assumed that increases in flows below reservoirs will not be regarded as an impact (although it is recognised more widely that flow greater than natural may cause failure of GES).

Project Extension 1 – Practical methodology for assessment GES for impoundments – Dec 2007 20
6.2 The Derwent Reservoir: A case study application of the Risk based approach
The Derwent Reservoir, located in the North East of England, was built in 1966. The natural area impounded by the reservoir is 87km2, and catchwaters from indirect catchments increase this area to approximately 110km2 (Insitute of Hydrology; 1987). The NRFA gauge “Derwent at Eddys Bridge” (23002) is located just downstream of the reservoir with a catchment area of 118km2. The locations of the reservoir, the gauge and the assessment points considered within this case study are presented within Figure 6.1.
#G
G
G
G
Impounded catchment (Point 1)
Point 2
Point 3
Point 4
Point 5
Gauging Station 23002
2 32 3
2 42 4
Figure 6.1 Derwent reservoir and assessment points.
Flows have been gauged at Eddys Bridge since 1955 and hence both a pre-impoundment and post-impoundment gauged flow record exists. The attenuation of the flow regime by the operation of the reservoir is clearly demonstrated by the changes in the pre and post impoundment flow regimes are illustrated within Figure 6.2 and Figure 6.3. The Derwent reservoir has been selected to illustrate the risk-based approach to reservoir impact assessment using three data availability scenarios:
• WORST CASE – the release profile is assumed to be zero, i.e. simulating a reservoir that releases no water.
• MEDIUM CASE – the release profile is estimated by the RESSIM model, which considers a monthly-resolution water balance of natural inflows, abstractions and compensation flows.
• BEST CASE – the release profile is derived from flows gauged at the reservoir outlet.

Project Extension 1 – Practical methodology for assessment GES for impoundments – Dec 2007 21
Figure 6.2 Eddy’s Bridge (23002) – pre impoundment flow regime
Figure 6.3 Eddy’s Bridge (23002) – Post impoundment regime.

Project Extension 1 – Practical methodology for assessment GES for impoundments – Dec 2007 22
The impact on flows at the four points downstream (Point 2 to Point 5) has been assessed. The impact of the minor reservoirs (Hishope and Smiddy Shaw) on the adjacent tributary was assessed and is minor compared to the impact of the Derwent, hence, these two reservoirs have been excluded from the analysis. The release profiles scenarios consider were as follows:
• WORST CASE - defined by assuming zero release. A release profile of twelve zeros defined the representation of the reservoir for this scenario.
• MEDIUM CASE - defined by RESSIM model release profile. Report 99 details the compensation requirements for this reservoir to be seasonally varying with 25.0 Ml/d released April to September and 22.73Ml/d released from October to March. The licence governing abstractions from this reservoir (1/23/04/001) includes the provision to abstract water from three sites, two of which are outside the impounded catchment. However, calculations suggest that the majority of the actual annual abstraction volume of 45,000,000 m3/yr is made from the reservoir. For the purposes of this modelling it has been assumed that the entire 45,000,000 m3 has been abstracted from the reservoir. RESSIM predicts that this reservoir releases only compensation flows during summer and predicts a maximum drawdown in the order of 1.3m. The RESSIM model predicts a release profile as shown on Figure 6.4.
• BEST CASE - release profile defined by gauged average monthly flows. The flows recorded at Eddy’s Bridge (23002) for the period 1995 to 2005 were used to define the monthly release profile for the reservoir. The release profile predicted from the observed flows is shown on Figure 6.4.
Comparison with the RESSIM release profile suggests that the true compensation flows from the reservoir during 1995-2005 have been higher than the 25Ml/d recorded as the compensation flow in Report 99.
0
1000000
2000000
3000000
4000000
5000000
6000000
7000000
8000000
9000000
10000000
January
Febru
ary
Marc
h
April
May
June
July
August
Septe
mber
Octo
ber
Novem
ber
Decem
ber
Month
ly R
ele
ase V
ol (m
3)
Release Profile from gauged flows Release Profile from RESSIM
Figure 6.4 Release profiles from gauged flows and as predicted by RESSIM

Project Extension 1 – Practical methodology for assessment GES for impoundments – Dec 2007 23
The impact of the reservoir on a trigger flow statistic ‘Qx’ is defined as: IMPACTQx = (QxNAT – QxINF) / QxNAT
Where QxNAT is the natural flow statistic and QxINF is the influenced flow statistic considering only the impact of the reservoir (and any associated catchwaters). The IMPACTQx values are used to assess the likelihood that Good Ecological Status (GES) will NOT be met by the water bodies downstream of the reservoir. A negative IMPACTQx value will be obtained where the reservoir operation effectively increases the flows above what would naturally occur. Negative impacts were ignored in this analysis. Figure 6.5 to Figure 6.7 illustrate the IMPACTQx at each of the assessment points, described by the ratio of impounded catchment area to the assessment point catchment area (reflecting the distance downstream from the reservoir), for each of the data scenarios.
0
0.1
0.2
0.3
0.4
0.5
0.6
0.7
0.8
0.9
1
0.000.501.00
Aimp/Atot
IMP
AC
TQ
x
IMPACT_ Jan IMPACT_ Apr
IMPACT_ Jul IMPACT_ Oct
-1
-0.8
-0.6
-0.4
-0.2
0
0.2
0.4
0.6
0.8
1
0.000.501.00
Aimp/Atot
IMP
AC
TQ
x
IMPACT_Q95
-1
-0.8
-0.6
-0.4
-0.2
0
0.2
0.4
0.6
0.8
1
0.000.501.00
Aimp/Atot
IMP
AC
TQ
x
IMPACT_Q5
Figure 6.5 IMPACTQx results for Worst Case data scenario
0
0.1
0.2
0.3
0.4
0.5
0.6
0.7
0.8
0.9
1
0.000.501.00
Aimp/Atot
IMP
AC
TQ
x
IMPACT_ Jan IMPACT_ Apr
IMPACT_ Jul IMPACT_ Oct
-1
-0.8
-0.6
-0.4
-0.2
0
0.2
0.4
0.6
0.8
1
0.000.501.00
Aimp/Atot
IMP
AC
TQ
x
IMPACT_Q95
-1
-0.8
-0.6
-0.4
-0.2
0
0.2
0.4
0.6
0.8
1
0.000.501.00
Aimp/Atot
IMP
AC
TQ
x
IMPACT_Q5
Figure 6.6 IMPACTQx results for Medium case data scenario

Project Extension 1 – Practical methodology for assessment GES for impoundments – Dec 2007 24
0
0.1
0.2
0.3
0.4
0.5
0.6
0.7
0.8
0.9
1
0.000.501.00
Aimp/Atot
IMP
AC
TQ
xIMPACT_ Jan IMPACT_ Apr
IMPACT_ Jul IMPACT_ Oct
-1
-0.8
-0.6
-0.4
-0.2
0
0.2
0.4
0.6
0.8
1
0.000.501.00
Aimp/Atot
IMP
AC
TQ
x
IMPACT_Q95
-1
-0.8
-0.6
-0.4
-0.2
0
0.2
0.4
0.6
0.8
1
0.000.501.00
Aimp/Atot
IMP
AC
TQ
x
IMPACT_Q5
Figure 6.7 IMPACTQx results for Best case data scenario
The results show that the impact at high flows (IMPACT_Q5) is low and hence the likelihood of GES not being met due to impacts on high flows is low. This is because the ratio of reservoir surface area to the impounded catchment is relatively small and hence the attenuation capacity of the system is low. The impact at low flows (IMPACT_Q95) is high for the WORSE CASE (where zero releases are assumed). However, in reality this result is misleading as the compensation regime from the Derwent elevates summer flows to levels above those which would naturally occur, and hence removes the risk of failing GES due to impacts on low flows. The impact on the monthly mean flow indices governs the overall likelihood that water bodies downstream of the Derwent reservoir will fail GES. This is confirmed by examination of the pre and post impoundment monthly mean flows just downstream of the reservoir, see Figure 6.8, which shows significant modification to the flow regime.
0
0.5
1
1.5
2
2.5
3
3.5
4
January
Febru
ary
Marc
h
April
May
June
July
August
Septe
mber
Octo
ber
Novem
ber
Decem
ber
Flo
w (
cum
ecs)
Post impoundment MMFs Pre impoundment MMFs
Figure 6.8 Pre and post impoundment monthly mean flows (MMFs) gauged at Eddy’s Bridge (23002) just downstream of the reservoir.

Project Extension 1 – Practical methodology for assessment GES for impoundments – Dec 2007 25
Considering the situation modelled at Point 5 downstream of the reservoir;
• If the WORST CASE scenario representation of the reservoir (no information, assumed zero outflow) was modelled then there would be a moderate risk of failing GES at this point.
• If the BEST CASE scenario representation of the reservoir (best available flow data) was modelled then there would be a low risk of failing GES at this point.
This illustrates that the method by which the reservoir is represented, and hence the data requirements for the modelling exercise, will directly impact on the assessment of risk of failing GES downstream of a reservoir. The results shown for the Derwent reservoir would be typical of supply and compensation reservoirs in that if zero release from the reservoir is assumed then it is likely that this will result in an overestimation of the downstream impacts, as compensation flows are set specifically to address the issues of downstream impacts on low flows. The ability to predict whether a reservoir spills during summer is important to the consideration of impacts on downstream GES. The RESSIM model enables this to be estimated, using data sources that are available on a case by case basis. The consequences of uncertainty in the estimation of the abstraction regime for the reservoir in the RESSIM model impact most on the spring and autumn monthly mean flows indices as the onset and alleviation of significant draw down will be sensitive to the representation of the abstraction regime.

Project Extension 1 – Practical methodology for assessment GES for impoundments – Dec 2007 26
7 Conclusions The review of data available to describe the size and operating regimes for reservoirs has demonstrated that good data sets are only available for a small fraction of reservoirs across Great Britain. Furthermore, the majority have no readily available measurements of river flows immediately downstream of the dam structure thus necessitating a modelling approach to estimate release profiles for a reservoir. There are a large number of small impoundments that have no data associated with them and hence the impact cannot be quantified. The majority of the impounded areas for these small impoundments are small compared with the area of the catchment upstream of the containing WFD water body scale and hence will not need to be assessed. Hence, when applying the screening level methodology to a reservoir a first step should be to compare the impounded catchment area to the total catchment area upstream of the outlet of the surface water body containing the reservoir dam to test whether the impounded area is significant (Aimp/Aca < 0.2 is suggested be an appropriate threshold) . The analysis presented using the RESSIM generalised monthly reservoir model has demonstrated that if the input data are reliable the model can simulate the downstream propagation of the derogation of the GES flow standards. Furthermore, with the exception of the Q5 index, the indices are not sensitive to the monthly resolution of the reservoir modelling. Wallingford HydroSolutions Ltd. are currently developing the RESSIM model further for modelling impacts using reservoir release duration curves instead of monthly profiles. This model may be formally incorporated within the LF2000 software in the future. The performance of RESSIM is limited by the availability of required input data (information on compensation releases, abstractions from the reservoir and extent of indirect catchments) and the fact that many reservoirs are used conjunctively. Due to these issues and the complexity of actual operation, the initial regional analysis demonstrated no relationship between extent of derogation and the size and resource utilisation of the reservoir. To address this, a risk based approach was defined for assessing the extent of the downstream derogation of the WFD82 flow indices. In this approach a worst case scenario is assumed. If a more sophisticated assessment is required the assessment can be improved by provision of appropriate data by the reservoir operator. This will range from a gauged flow record downstream of the spillway (negating the need for RESSIM modelling) to improved input data components for the RESSIM model. LF2000 can then be used to model the propagation of the impact downstream of the reservoir. The WFD methodology assumes a single reservoir whilst in practice the impact at a point within a river system can commonly result from the cumulative impact of a number of upstream reservoirs. In applying the methodology the impact at a water body scale should consider the cumulative impact from all upstream reservoirs. The diversion of water from indirect catchments can have a significant impact on downstream flow regimes yet these are rarely quantified and hence these impacts have not been considered further in the analysis.

Project Extension 1 – Practical methodology for assessment GES for impoundments – Dec 2007 27

Project Extension 1 – Practical methodology for assessment GES for impoundments – Dec 2007 28
8 References Gustard, A., Cole, G., Marshall, D. and Bayliss, A. 1987 A study of compensation flows in the
UK. Institute of Hydrology, Report No 99. Institute of Hydrology Wallingford, UK. Holmes M.G.R. & Young A.R. (2002). Estimating seasonal low flow statistics in ungauged
catchments. Proceedings of the BHS Eighth National Hydrology Symposium, University of Birmingham, 8-11 September 2002. 97-102.
Holmes, M.G.R., Young, A.R., Gustard, A.G. And Grew, R. (2002). A region of influence
approach to predicting flow duration curves in ungauged catchments. Hydrology and Earth System Sciences. 6(4), pp 721-731.
Holmes, M.G.R., Young, A.R., GUSTARD, A.G. And Grew, R. (2002). A new approach to
estimating mean flow in the UK. Hydrology and Earth System Sciences. 6(4), pp 709-720.
Poff, N.L., Allan, J.D., Bain, M.B., Karr, J.R., Prestegaard, K.L., Richter, B.D., Sparks, R.E.,
Stromberg, J.C. 1997 The natural flow regime. Bioscience 47, 769-784. Richter, B.D., Baumgartner, J.V., Wigington, R., Braun, D.P. 1997. How much water does a
river need? Freshwater Biology 37(1) 231-249. Young A.R., Grew R. & Holmes M.G.R. (2003) Low Flows 2000: a national water resources
assessment and decision support tool. Water Science & Technology Vol 48 No 10 pp 119-126

Project Extension 1 – Practical methodology for assessment GES for impoundments – Dec 2007 29
9 Appendix 1: Compilation of meta-data on reservoirs Institute of Hydrology Report 99 (R99) is the only base data set which consistently recorded quantitative information about reservoirs in the UK including compensation flow requirements, compensation regimes, and reservoir type. A total of 552 reservoirs are listed on this archive (excluding Northern Ireland reservoirs), hence it covers only a fraction of the total number of reservoirs in the Great Britain (GB). By comparison, approximately 2500 reservoirs/lakes/lochs are listed on the Building Research Establishment’s Dams Register (BREDR) data set which includes both essentially natural lakes and constructed storages of greater than 25Ml capacity. Building on previous work, extensive manual verification and cross referencing with other data sources has been undertaken for the reservoirs listed in R99. The location of all reservoirs in England and Wales (363 in total) have been verified, see Figure 9.1. The locations of all Scottish reservoirs have not yet been verified in detail. Data for the 16 significant (>500Ml) reservoirs in Northern Ireland, operated by the Water Services Dept of DOE-NI, have not been verified yet, due to a lack of data sources and time constraints of this project These reservoirs are classified according to TYPE (as defined by R99) as summarised within Table 9.1.
Table 9.1 Distribution of reservoir TYPE across data set (including Northern Ireland reservoirs)
Region TYPE Count
E & W Compensation only 30
E & W Pumped Storage 23
E & W Regulating 31
E & W Supply only 74
E & W Supply and compensation 173
E & W UNKNOWN 32
Scotland Compensation only 10
Scotland Hydropower and compensation 38
Scotland Hydropower only 10
Scotland Pumped Storage 2
Scotland Regulating 4
Scotland Supply only 16
Scotland Supply and compensation 65
Scotland UNKNOWN 44
Northern Ireland Supply only 9
Northern Ireland Supply and compensation 7

Project Extension 1 – Practical methodology for assessment GES for impoundments – Dec 2007 30
Figure 9.1 Location of 552 reservoirs from the Institute of Hydrology Report 99 data set

Project Extension 1 – Practical methodology for assessment GES for impoundments – Dec 2007 31
For the purposes of this study a subset of reservoirs from TYPE Compensation (C), Supply and Compensation (S&C), and Supply (S) were identified. The impact propagation modelling methodology developed for this study requires that, in lieu of gauged release flow data, the abstraction regimes and compensation requirements for a reservoir must be quantified. Hence, available data regarding abstractions from reservoirs and compensation releases from reservoirs was reviewed. In the case of Scottish reservoirs abstraction data were not available and hence only Scottish reservoirs with gauged downstream flow records have been considered. In the case of Northern Ireland reservoirs, a lack of verification data and a lack of data relating to abstraction regimes resulting in no analyses being attempted. Approximately 14 gauging stations in Northern Ireland are noted by the NRFA to contain storage reservoirs of some description. It should be noted that compensation flows in Northern Ireland have traditionally been set very low, with zero compensation flows common. Hence, reservoirs in Northern Ireland could be expected to have a significant impact on downstream water bodies. The final data set of 33 reservoirs suitable for inclusion in the project data set were identified to have the following features: relatively simple catchwaters, no nesting or simple nesting arrangements, abstraction data, relatively simple abstraction licence structures, compensation flow data, and impounded catchment areas that could be defined. In other work, (Holmes (2007)) examined National River Flow Archive (NRFA) records for more than 1300 gauging stations to identify gauged records which are significantly impacted by reservoirs. A significant impact was defined by either the gauging station being located at the outlet of the reservoir, or the area upstream of the reservoir representing more than 50% of the gauging station catchment area. This process identified 69 gauging stations for further examination. The data set of 69 was examined in relation to: the TYPE of reservoir impacting the flow record, the number and arrangement of reservoirs impacting and the location of the reservoirs within the gauged catchment. The final assessment results are summarised on Table 9.2. CLASS 1, 2 and 4 gauging station observed flow records could be used to predict the downstream propagation of reservoir impact directly as discussed in Section 4.2 For information, gauged records impacted by reservoirs for which pre and post impoundment flows exist (or can be synthesised) were collated and are shown below on Table 9.3. The final data set for use within this study is illustrated within Figure 9.2 and consisted of:
• CLASS A - 27 simple reservoirs with no gauged data available but abstraction and compensation data available
• CLASS B - 3 simple single reservoirs with abstraction and compensation data available and gauged records downstream of the reservoir
• CLASS C - 14 gauged release records from single, simple reservoirs
• CLASS D - 12 gauged release records from complex reservoirs and reservoir systems

Project Extension 1 – Practical methodology for assessment GES for impoundments – Dec 2007 32
Table 9.2 Assessment of gauging catchments significantly influenced by reservoirs
CLASS Description Potential Use Number
1 Contains simple single reservoir, TYPE C, S or C&S, located immediately upstream of GSTN
Use GSTN record to predict impact downstream and to check modelling results.
10
2 Contains simple single reservoir, TYPE C, S or C&S, located immediately upstream of GSTN
Use GSTN record to predict impact downstream (no ABS data)
2
3 Contains simple single reservoir, TYPE C, S or C&S, located upstream of GSTN
Use GSTN record to check modelling results.
3
4
Contains multiple reservoirs in series in GSTN catchment, a reservoir TYPE C, S or C&S is located immediately upstream of GSTN
Use GSTN record to predict impact downstream.
14
5
Contains single or multiple reservoirs in GSTN catchment, GSTN is downstream of lowest reservoir/s which are TYPE C, S or C&S.
Use GSTN record to check modelling of downstream impacts.
18
6
Contains single or multiple reservoirs in GSTN catchment, with lowest reservoir located at GSTN, however lowest reservoir is NOT TYPE C, S or C&S.
Use GSTN record to predict impact downstream for non TYPE C, S or C&S reservoir (outside scope of this project).
15
7
Contains single or multiple reservoirs in GSTN catchment, with lowest reservoir/s located upstream of GSTN, however lowest reservoir/s are NOT TYPE C, S or C&S.
Use GSTN record to confirm further modelling results for multiple reservoir impacts.
7
Table 9.3 Gauged records impacted by reservoirs with pre and post impoundment flow data
GSTN Name Notes and reservoir TYPE
21030 Megget Water at Henderland Pre and post impoundment flows available. SUPPLY &
COMPENSATION RESERVOIR.
23002 Derwent at Eddys Bridge Pre and post impoundment flows available. SUPPLY &
COMPENSATION RESERVOIR.
41024 Shell Brook at Shell Brook Pre and post impoundment flows available. PUMPED STORAGE
85001 Leven at Linnbrane Pre and post impoundment flows available. UNK
(HYDROPOWER Loch Lomond)
28001 Derwent at Yorkshire Bridge Naturalised flows available. REGULATING RESERVOIR
74005 Ehen at Braystones Naturalised flows available. SUPPLY & COMPENSATION
RESERVOIR.
67015 Dee at Manley Hall Naturalised flows available. Multiple reservoirs.
23022 North Tyne at Uglydub Pre-scheme use analogue catchment 23011. REGULATING
RESERVOIR.
4001 Conon at Moy Bridge Pre-scheme use analogue catchment 4005. Multiple reservoirs.
67003 Brenig at Llyn Brenig outflow Pre and post impoundment flows available. REGULATING
RESERVOIR.
28002 Blithe at Hamstall Ridware Pre and post impoundment flows available. SUPPLY &
COMPENSATION RESERVOIR.

Project Extension 1 – Practical methodology for assessment GES for impoundments – Dec 2007 33
Figure 9.2 Location of final data set for reservoir impact study

Project Extension 1 – Practical methodology for assessment GES for impoundments – Dec 2007 34
10 Appendix 2: RESSIM and use within the WFD82 project In the absence of measured release information, the purpose of the reservoir simulation model RESSIM is to predict the release profiles for reservoirs with a compensation, compensation and supply or supply function. The model undertakes a mass balance over the 12 months of the year starting from the month after the one identified as the month in which the reservoir is assumed to be full. The basic calculation is conducted on monthly time step:
tttttCOMPABSMFSS −−+=
−1
If 0>t
S thentt
SSPILL = and 01 =+t
S
If 0≤t
S then 0=t
SPILL and tt
SS =+1
where
MFt is the inflow (mean flow) for month t ABSt is the abstraction volume in month t COMPt is the compensation volume for month t. St-1 is the storage deficit of the reservoir at the beginning of month t SPILLt is the spill volume for month t
The release volume for month t (RELt) is then the sum of the COMPFLOWt and SPILLt and the 12 monthly values of RELt define the release profile for the reservoir. The inputs to the model are:
1 Inflows – estimated by LF2000 for the impounded catchment area upstream of the reservoir. Generally a natural inflow sequence is required, however if there is considerable water use and return in the impounded catchment LF2000 has the ability to predict influenced inflows where required (eg. Blithfield reservoir).
2 Inflow area adjustment factor (IAAF) - this can be used to scale the natural inflows to account for indirect catchments.
3 Abstraction profile from the reservoir – as average monthly values 4 Compensation releases – as average monthly values 5 Month in which the reservoir is assumed to be full 6 Reservoir surface area - the model uses this in conjunction with the max storage
deficit to estimate the active draw-down. The operation of the model is shown diagrammatically in Figure 10.1

Project Extension 1 – Practical methodology for assessment GES for impoundments – Dec 2007 35
Figure 10.1 Schematic of the RESSIM model
10.1 Application of RESSIM to predict downstream propagation of impact The use of RESSIM release profile to predict downstream impacts, with respect to the WFD82 trigger statistics (Method A), was assessed by comparison with the use of gauged release flow data (Method B) ie. creating a profile from observed mean monthly flow values. Both methods employed the LF2000 model for simulating the impact of a reservoir on downstream flows. Stocks reservoir is used to illustrate the application the WFD82 methodology using RESSIM and LF2000. Outflows from Stocks reservoir, in the upper reaches of the River Hodder, are gauged at gauging station (71002), see Figure 10.2. The reservoir was built in 1939.
Storage Model using LF2000 monthly flows.
Monthly FDC.[MF(t)]
Abstraction [Abs(t)]
Compensation [Comp(t)]
)t(Comp)t(Abs)t(MF)1t(S)t(S −−+−=
Spill(t)
Area of Reservoir
Month (t). Start when Full, where t = 0.
Indirect Catchment
Direct Catchment
0)t(Spill
)t(S)1t(S
0)t(S
if
)t(S)t(Spill
0)t(S
If
=
=+
=
=
>
Generation of Monthly Flow Volume for Impoundment.
Simple Water Balance Model
Checks made on final
spill calculation:
Validity of
Initial conditions
Calculation of
max drawdown
depth

Project Extension 1 – Practical methodology for assessment GES for impoundments – Dec 2007 36
Figure 10.2 Location of Stocks Reservoir
Release profiles estimated using RESSIM (Method A)
Inputs for the RESSIM model were as follows:
• The Abstraction profile for the reservoir was obtained from the licence for the public water supply abstraction from the reservoir. This data indicated that 60Ml/d was taken each month.
• The Compensation flow was obtained from R99 which indicated 18Ml/d in summer and 13Ml/d in winter was released.
• The Inflows to the reservoir were taken to be the natural flows entering the upper reaches of the reservoir determined using the Low Flows software, which estimated the average annual mean inflow to be 1.48m3/s .
The RESSIM model predicts that the reservoir will spill during winter and release only compensation flows during the summer months, see Figure 10.3. This figure shows that the estimated release profile is similar to that used by the Environment Agency to represent Stock reservoir within their operational version of LF2000. The drawdown of the reservoir is reasonable (1.8m) and the maximum storage used is only 17% of the available net capacity.
Stocks

Project Extension 1 – Practical methodology for assessment GES for impoundments – Dec 2007 37
0
1000000
2000000
3000000
4000000
5000000
6000000
7000000
Jan
Feb
Mar
Apr
May
Jun
Jul
Aug
Sep
Oct
Nov
Dec
Volu
me m
3/m
onth
ABS (m3/mth) INFLOWS (m3/mth)
RELEASE (m3/mth) Release profile from EA_NW
Figure 10.3 RESSIM components for Stocks reservoir
Release profiles derived from gauged data (Method B)
The flows gauged at GSTN 71002 over the period 1964 to 1999 were used to construct a release profile for the reservoir. This profile is compared to that estimated by the RESSIM model on Figure 10.4. This shows that the spill predicted by RESSIM are too high in winter months and too much water is being released during summer months. The influenced annual mean flow below the reservoir is over-estimated in LF2000 by 74%, compared with the gauged statistic which is greatly in excess of the standard error of the natural mean flow model within LF2000 and hence is likely to be due to errors in the estimation of the abstraction and/or compensation regimes. The estimated adjustments to the abstraction and compensation regimes at Stocks reservoir, such that the RESSIM profile matches the observed flow regime are shown on Figure 10.5.

Project Extension 1 – Practical methodology for assessment GES for impoundments – Dec 2007 38
0.000
0.200
0.400
0.600
0.800
1.000
1.200
1.400
1.600
1.800
2.000
Jan Feb Mar Apr May Jun Jul Aug Sep Oct Nov Dec
Flo
w (
m3/s
)
GSTN REL PROFILE RESSIM REL PROFILE
Figure 10.4 Comparison on RESSIM release profile and release profile from GSTN data

Project Extension 1 – Practical methodology for assessment GES for impoundments – Dec 2007 39
0
500000
1000000
1500000
2000000
2500000
3000000
3500000
4000000
Jan
Feb
Mar
Apr
May
Jun
Jul
Aug
Sep
Oct
Nov
Dec
Volu
me m
3/m
onth
ABS (m3/mth) Adjusted ABS
0
200000
400000
600000
800000
1000000
1200000
1400000
Jan
Feb
Mar
Apr
May
Jun
Jul
Aug
Sep
Oct
Nov
Dec
Volu
me m
3/m
onth
COMPFLOW (m3/mth) Adj COMPFLOW
Figure 10.5 Estimated adjustments required to the abstraction and compensation regimes at Stocks reservoir – based on gauged outflow records
LF2000 WFD82 Risk assessment downstream
The RESSIM release profile (unadjusted – ie. using the available abstraction and compensation flow data) and the gauged release profile were then entered into a LF2000 model and the impact, with respect to the WFD82 standard statistics, was calculated for downstream reaches to identify the points at which HIGH, MED and LOW RISK were reached.

Project Extension 1 – Practical methodology for assessment GES for impoundments – Dec 2007 40
The results on Table 10.1 and illustrated on Figure 10.6 and Figure 10.7 show that the Risk classification downstream from the reservoir changes only slightly (15% in terms of catchment area identified) depending on which profile is used. In this example the RESSIM profile could be considered conservative, as the impact of the reservoir is predicted to extend further downstream than if the profile derived from gauged flows was used.
Table 10.1 Identification of downstream RISK using different release profiles
Point at which RISK category reached defined by Aimp / Aca
RISK category Using release profile from RESSIM
(METHOD A)
Using release profile from gauged flow record
(METHOD B)
HIGH 1 1
MEDIUM 0.81 0.95
LOW 0.37 0.43
Summary
The analysis suggests that the uncertainty in profiles derived using the RESSIM model is most likely to be due to uncertainty in the abstraction and compensation data (and potentially catchwater issues where they exist), as the simple water balance nature of the model is robust. For simple reservoir arrangements where downstream flow data exists for calibration, the RESSIM model can be utilised in an investigative manner to identify possible adjustments required to the abstractions, compensation and catchwater arrangements. These modifications could be passed to local area staff for confirmation, to ultimately result in the reservoirs, and associated abstraction regimes, being better represented. The benefits for the WFD82 project would include more accurate information regarding the impact of reservoirs, additional information relating to abstractions from reservoirs and reservoir operation. In terms of the objectives of the current study, the analysis shows that the LF2000 software provides a tool which can implement either observed data (gauged outflows) or predicted data (RESSIM profiles) to estimate the downstream impact of reservoirs. While gauged data should be used where available, the difference in the WFD82 flow indices (in terms of the location of the points downstream of the reservoir where the Risk category changes) obtained using gauged or RESSIM profiles was not considered significant when the other sources of uncertainty in the modelling process were considered.

Project Extension 1 – Practical methodology for assessment GES for impoundments – Dec 2007 41
HIGH
MEDIUM
LOW
Figure 10.6 Locations defining HIGH, MEDIUM and LOW RISK of failing GES – using release profile estimated from GSTN record

Project Extension 1 – Practical methodology for assessment GES for impoundments – Dec 2007 42
HIGH
MEDIUM
LOW
Figure 10.7 Locations defining HIGH, MEDIUM and LOW RISK of failing GES – using release profile estimated by RESSIM

Project Extension 1 – Practical methodology for assessment GES for impoundments – Dec 2007 43
Appendix 3: Reservoir Attenuation Impacts at the Q5 flow As part of the implementation of LF2000 in Scotland, a series of algorithms were developed to enable natural flow statistics to be adjusted to account for the presence of natural lakes within the catchment, (WHS, 2006). These algorithms are suitable for use in the WFD82 project to simulate the impact of a reservoir that is spilling at the higher flow percentiles and hence the WFD Q5 trigger statistic. The method for estimating the impact at the Q5 statistic involves two stages once the number and extent of surface water bodies within a target catchment is identified:
1. The calculation of the influence adjustment at Q95 flow 2. Calculation of the influence adjustment at the Q5 flow
For all stages the influence adjustment is weighted by the position of the surface water body within the ungauged catchment of interest. In Stage 1 the influence at Q95 (%MF) is estimated using the variance attenuation potential of each surface water body as represented by the ratio of the lake catchment area (LCarea) to the surface water body surface area (LSarea). If LCarea/LSarea is less than 2 then the influence at Q95 (IMPACTQ95) is equal to 50, that is, the Q95 would increased by a factor of 1.5. If LCarea/LSarea is greater than 100 then the influence at Q95 is taken to be zero as if the catchment area is much larger than the surface water body surface area the attenuation potential of the surface water body will be low (the surface area is used as a surrogate for loch volume which is not readily available). For any other case the influence at the Q95 flow is estimated as:
IMPACTLQ95 = (56.03 * Exp(-0.0863 * LCarea/LSarea).
In practice the lakes lie upstream of ungauged point of estimation and thus the influence of incremental catchment are between a lake outlet and the point of estimation needs to be accounted for. This is accounted for using the following reduction factor:
IMPACTQ95= IMPACTLQ95 * LCArea / UGArea,
where UGArea is the catchment area above the point of estimation. This process is repeated for all (n) lakes and the total adjustment is derived by taking the sum of the n individual adjustment factors. Stage 2 involves the estimation of the relationship between the influence of the surface water bodies at Q5 and at Q95 using:
056.1195
951201.01
5
5+
+
×−=+
NQ
IMPACTQ
NQ
IMPACTQ.
Based on this the influence on Q5 can be calculated using the influence at Q95 and the base estimates of Q5 and Q95 for the catchment.

44
11 Appendix 4: Summary of propagation of downstream impact modelling
Reservoir Status of WFD82 RISK assessment
Source of release profile
Number of reservoirs impacting
Spill regime
Aim
p/A
ca
D
efi
nin
g H
IGH
ri
sk
A
imp
/Ac
a
De
fin
ing
ME
DIU
M
ris
k
Aim
p/A
ca
D
efi
nin
g L
OW
ri
sk
NOTES on WFD82 RISK
NOTES on RESSIM model
ABS/ INFLOWS
CLOUGH BOTTOM Not assessed - Suspect ABS data RESSIM All year
SCOUT MOOR Not assessed - Suspect ABS data RESSIM
HURST Not assessed - need to confirm zero ABS RESSIM
EARNSDALE Model error suggests problem with ABS data RESSIM No spill
PENNINGTON Not assessed - need to confirm zero ABS RESSIM
COLDWELL SYS Not assessed - Suspect ABS data RESSIM
COWPE SYS
Model error suggests problem with catchwaters and/or ABS regime - further investigation required. RESSIM Winter only
LEVERS WATER RISK assessed RESSIM All year
1 0.32 0.07 LOW after joining Coniston Water 21%
HAYESWATER RISK assessed RESSIM All year
1 0.35 0.14 Within Ullswater catchment 24%
DEAN CLOUGH SYS Not to be assessed - too small RESSIM All year
PICKUP BANK SYS
Not to be assessed - complicated by Hoddleson reservoir RESSIM All year
LEA GREEN(SWINDEN) RISK assessed - as Cant Clough system RESSIM Two extra Winter only NA 1 NA
Impacted by other reservoirs - see detailed analysis 40%

45
Reservoir Status of WFD82 RISK assessment
Source of release profile
Number of reservoirs impacting
Spill regime
Aim
p/A
ca
D
efi
nin
g H
IGH
ri
sk
A
imp
/Ac
a
De
fin
ing
ME
DIU
M
ris
k
Aim
p/A
ca
D
efi
nin
g L
OW
ri
sk
NOTES on WFD82 RISK
NOTES on RESSIM model
ABS/ INFLOWS
CANT CLOUGH RISK assessed - as Cant Clough system RESSIM Two extra Winter only 1 NA NA
Impacted by other reservoirs - see detailed analysis 40%
MITCHELLS SYS RISK assessed RESSIM Two extra Winter only 1 0.71 0.37 40%
HURSTWOOD RISK assessed - as Cant Clough system RESSIM Winter only 1 NA NA
Impacted by other reservoirs - see detailed analysis 40%
OGDEN SYS(U+L)
Not to be assessed - complicated by Blackmoss reservoir RESSIM All year
CASTLESHAW SYS RISK assessed RESSIM Winter only
1 0.57 0.17 Parallel reservoir NOT considered 50%
KINDER RISK assessed RESSIM Winter only 1 0.52 0.27 80%
CLOWERIDGE RISK assessed RESSIM Winter only 1 0.39 0.21 50%
DELPH
Not to be assessed - complicated by downstream reservoirs RESSIM Winter only 64%
TITTESWORTH RISK assessed - Rudyard and Stanley modelled RESSIM Two extra Winter only 1 0.45 0.22
Impacted by Rudyard and Stanley reservoirs 49%
ALWEN To be completed RESSIM Winter only
CEFNI To be completed RESSIM All year
ALAW To be completed RESSIM Winter only
SUTTON BINGHAM To be completed RESSIM Winter only
DURLBIGH
Model error suggests problem with ABS regime - further investigation required. RESSIM
POWDERMILL
Model error suggests problem with ABS regime - further investigation RESSIM

46
Reservoir Status of WFD82 RISK assessment
Source of release profile
Number of reservoirs impacting
Spill regime
Aim
p/A
ca
D
efi
nin
g H
IGH
ri
sk
A
imp
/Ac
a
De
fin
ing
ME
DIU
M
ris
k
Aim
p/A
ca
D
efi
nin
g L
OW
ri
sk
NOTES on WFD82 RISK
NOTES on RESSIM model
ABS/ INFLOWS
required.
BLITHFIELD To be completed RESSIM
(compare GSTN) Winter only
THIRLMERE RISK assessed RESSIM
(compare GSTN) Winter only
1 0.62 0.24 Impact of catchwaters d/s of reservoir included 78%
NUTSCALE RISK assessed RESSIM
(compare GSTN) All year
1 0.46 0.14
15%
CRUMMOCK WATER RISK assessed
GSTN Individual
All year 1 < 0.44 > 0.12
RISK HIGH -> LOW below major confluence when releases from Thirlmere also impact
ABS very small fraction of inflow. 6%
ENNERDALE RISK assessed
GSTN Individual
All year 1 < 0.28 NA LOW RISK not reached
Original ABS data from EA Adjustment XLS. Appears very low? 23%
STOCKS RISK assessed GSTN Individual Winter only
1 0.95 0.43 GSTN 71008 further d/s 69%
HAWESWATER RISK assessed
GSTN With Ullswater and others
Winter only NA 1 0.08
RISK MED -> LOW below major confluence when Ullswater impacts. Note NW data used for southern reservoirs and dummy reservoirs.
Catchwater and/or ABS may be variable 87%

47
Reservoir Status of WFD82 RISK assessment
Source of release profile
Number of reservoirs impacting
Spill regime
Aim
p/A
ca
D
efi
nin
g H
IGH
ri
sk
A
imp
/Ac
a
De
fin
ing
ME
DIU
M
ris
k
Aim
p/A
ca
D
efi
nin
g L
OW
ri
sk
NOTES on WFD82 RISK
NOTES on RESSIM model
ABS/ INFLOWS
TALYPONT RISK assessed
GSTN Individual Winter only
NA 1 0.63 Approx. LOW prior to joining main river
Catchwaters not validated 51%
CLATWORTHY RISK assessed
EA PROFILE Individual
Winter only NA 1 0.59 Significant reduction in ABS required 43%
WEIR WOOD RISK assessed GSTN Individual Winter only - 1 0.55 53%
EYE BROOK RISK assessed
GSTN Individual Winter only
- 1 0.16
LOW after joining main river. Parallel reservoir NOT considered
Difficulty comparing with GSTN data that suggests operational rules have changed historically - Use 1990-1999 for PROFILE 67%
GRIMWITH RISK assessed
GSTN Individual
Winter only 1 0.09 0.06 MED RISK after joining main river
GSTN data post 1984 when reservoir upgraded is applicable. ABS profile needs to be confirmed. Could compare model results at d/s 27043 or 27027 gstn. 17%
DERWENT RISK assessed
GSTN Individual Winter only
1 0.71 0.03
LOW after joining Tyne estuary. Parallel reservoir NOT considered
Catchwaters could not be verified but section of strange rivers located. Complicated ABS licn multisite. 77%
LLWYN-ON RISK assessed
GSTN With Taf-Fechan
Winter only 1 < 0.73 NA
MED RISK stretches would be affected by Taf Fechan also
Old gauged data. Utilisation of storage is very high? INFLOWS will be impacted by nested reservoirs - RESSIM results uncertain 36%

48
Reservoir Status of WFD82 RISK assessment
Source of release profile
Number of reservoirs impacting
Spill regime
Aim
p/A
ca
D
efi
nin
g H
IGH
ri
sk
A
imp
/Ac
a
De
fin
ing
ME
DIU
M
ris
k
Aim
p/A
ca
D
efi
nin
g L
OW
ri
sk
NOTES on WFD82 RISK
NOTES on RESSIM model
ABS/ INFLOWS
TAF FECHAN RISK assessed
GSTN With Llwyn-on
Winter only 1 0.71 > 0.69
LOW RISK stretches would be affected by Llwyn-on also
Old gauged data. INFLOWS will be impacted by nested reservoirs - RESSIM results uncertain 48%
ULLSWATER RISK assessed
As ABS Haweswater and others All year NA 1 0.78 5%