Embed Size (px)
Citation preview
Project Execution, Monitoring, and Control
spm - ©2014 adolfo villafiorita - introduction to software project management
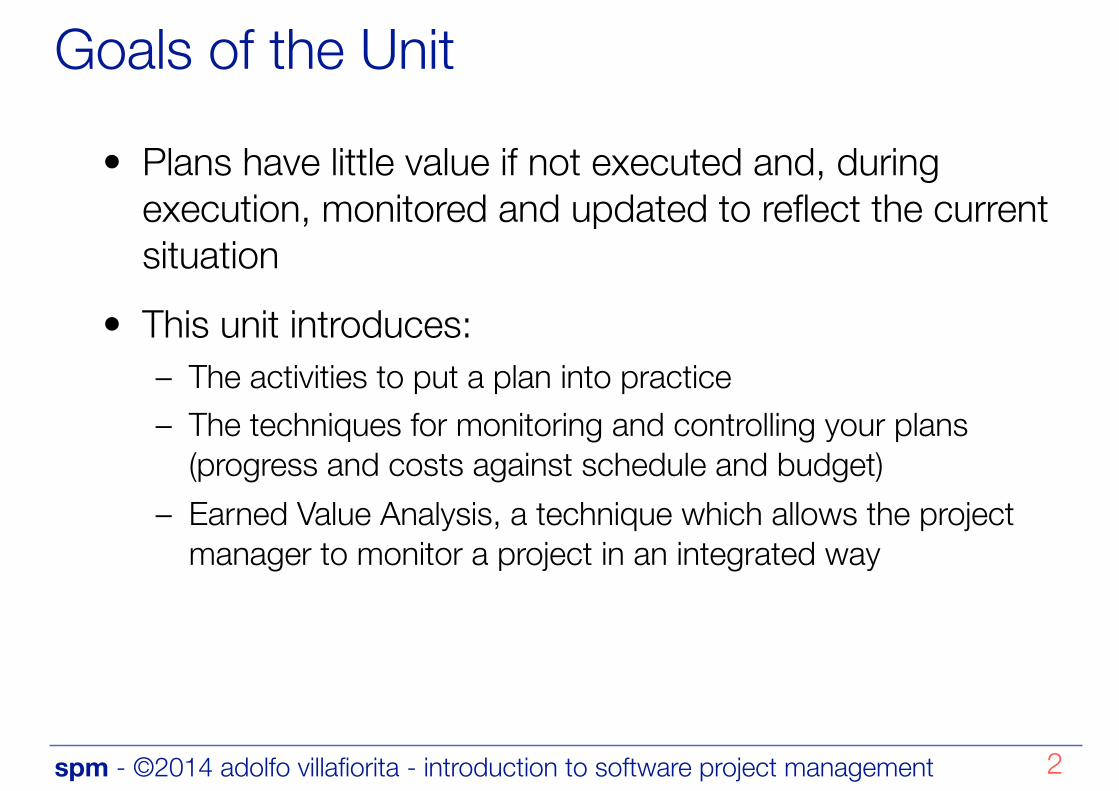
Goals of the Unit
• Plans have little value if not executed and, during execution, monitored and updated to reflect the current situation
• This unit introduces: – The activities to put a plan into practice – The techniques for monitoring and controlling your plans
(progress and costs against schedule and budget) – Earned Value Analysis, a technique which allows the project
manager to monitor a project in an integrated way
2
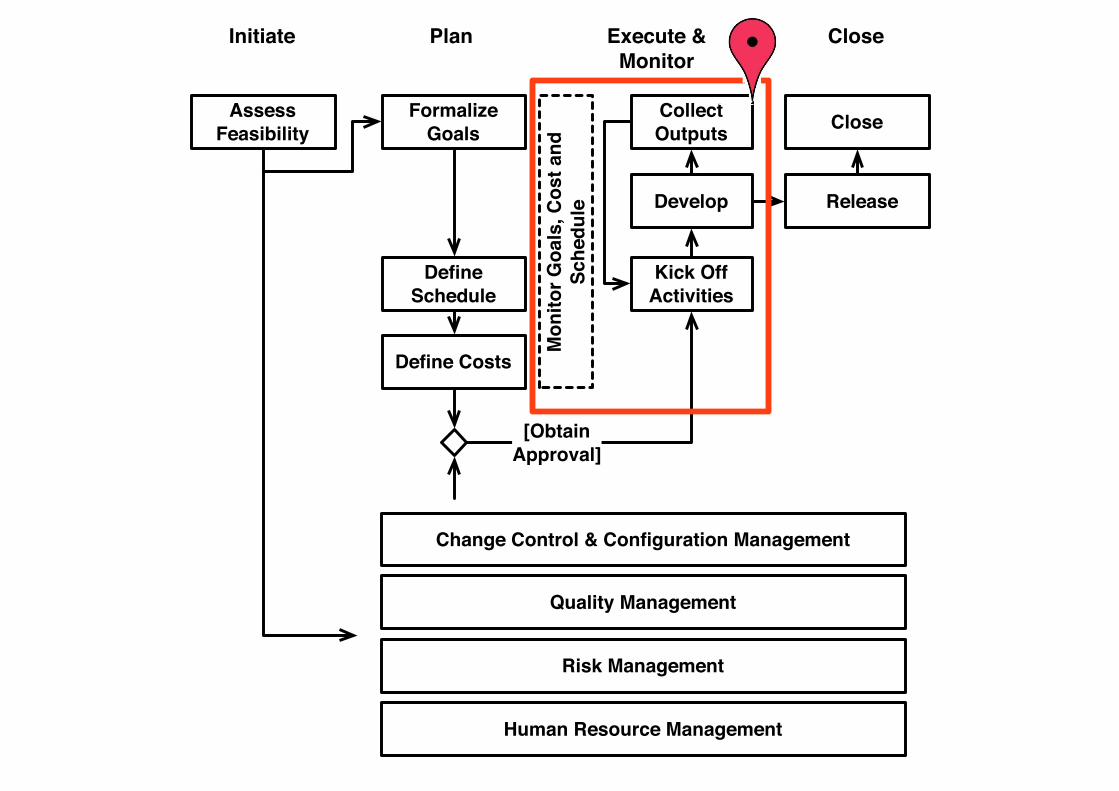
Initiate Plan Execute &Monitor
Close
Develop
Mon
itor G
oals
, Cos
t and
Sc
hedu
le Release
Change Control & Configuration Management
Quality Management
Human Resource Management
Kick OffActivities
Formalize Goals
Define Schedule
Define Costs
Assess Feasibility CloseCollect
Outputs
[ObtainApproval]
Risk Management

Project Execution
spm - ©2014 adolfo villafiorita - introduction to software project management
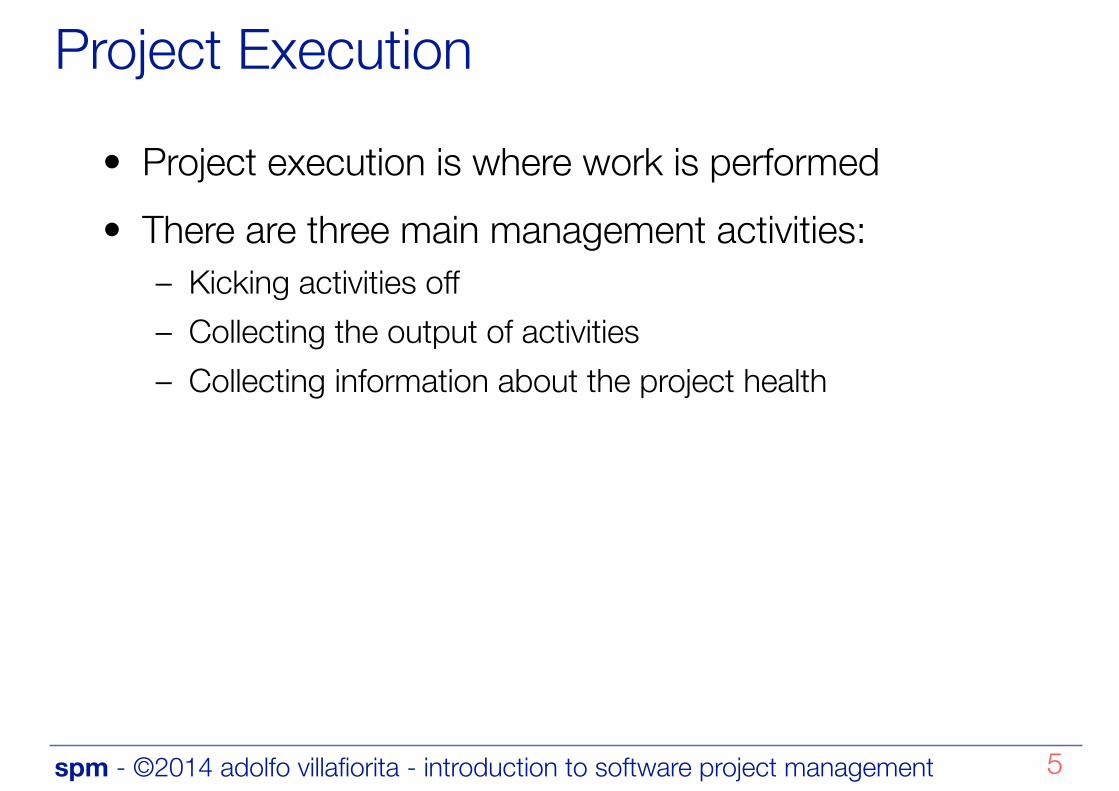
Project Execution
• Project execution is where work is performed • There are three main management activities:
– Kicking activities off – Collecting the output of activities – Collecting information about the project health
5
spm - ©2014 adolfo villafiorita - introduction to software project management
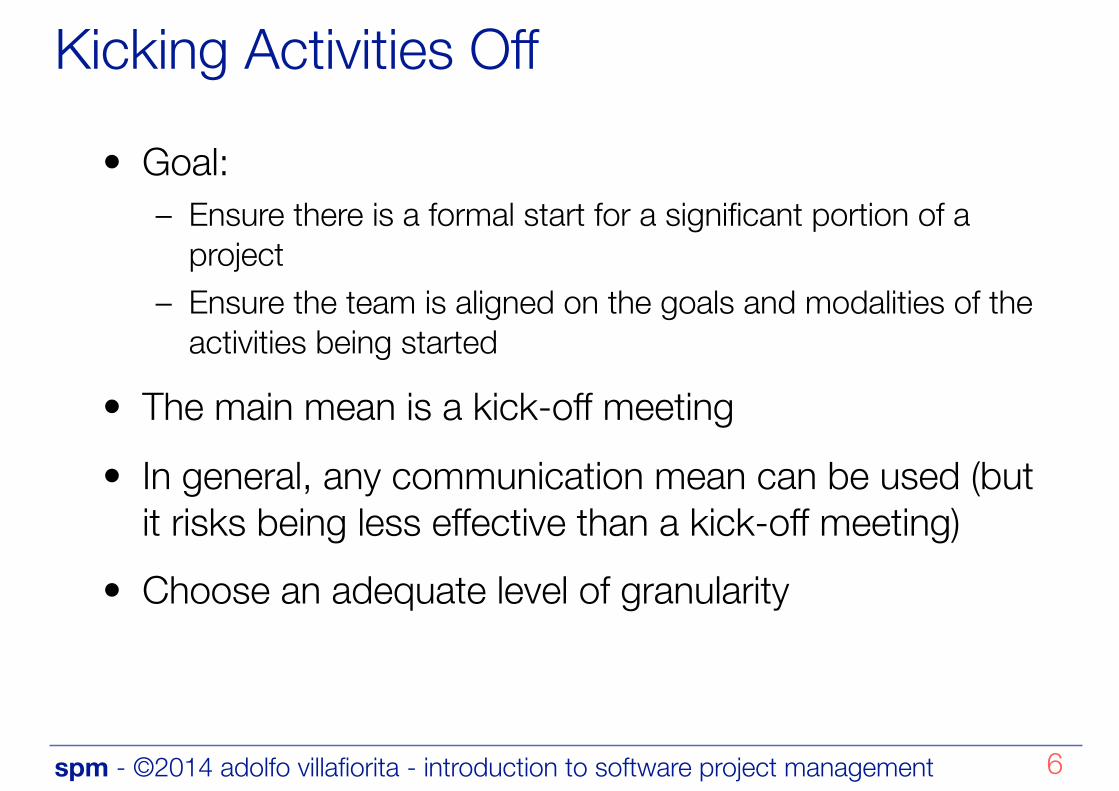
Kicking Activities Off
• Goal: – Ensure there is a formal start for a significant portion of a
project – Ensure the team is aligned on the goals and modalities of the
activities being started
• The main mean is a kick-off meeting • In general, any communication mean can be used (but
it risks being less effective than a kick-off meeting) • Choose an adequate level of granularity
6
spm - ©2014 adolfo villafiorita - introduction to software project management
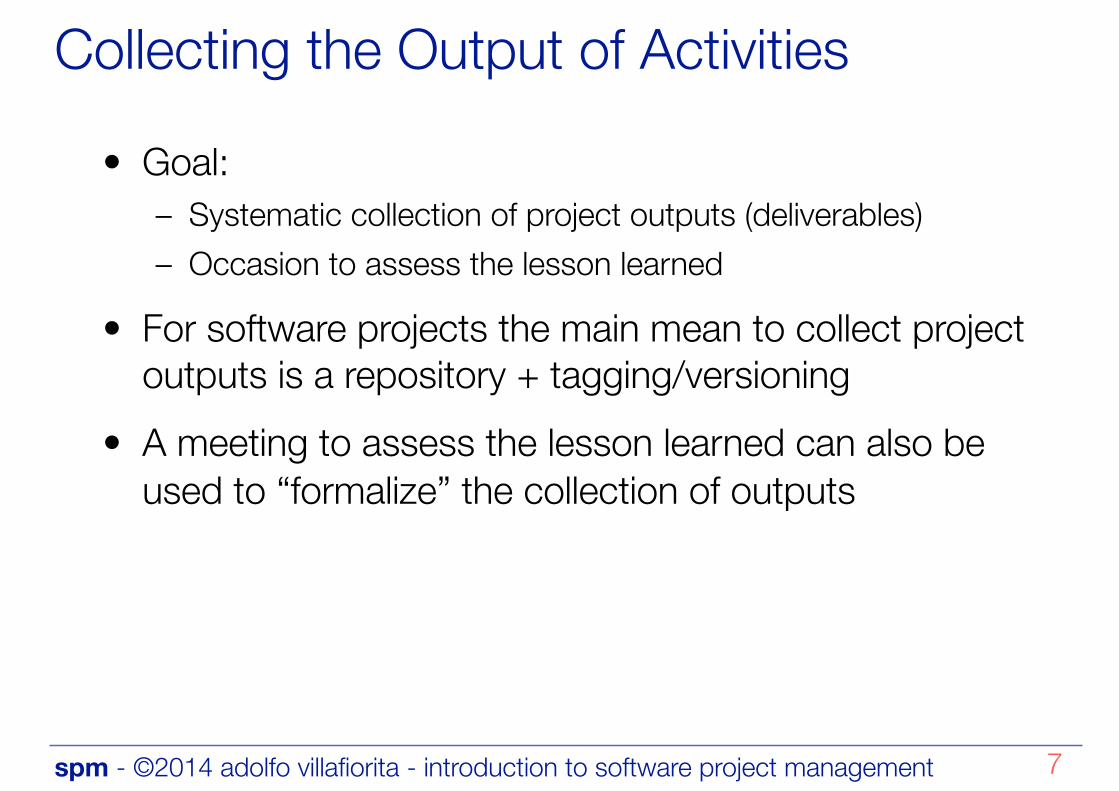
Collecting the Output of Activities
• Goal: – Systematic collection of project outputs (deliverables) – Occasion to assess the lesson learned
• For software projects the main mean to collect project outputs is a repository + tagging/versioning
• A meeting to assess the lesson learned can also be used to “formalize” the collection of outputs
7
spm - ©2014 adolfo villafiorita - introduction to software project management
Collecting Information about the Project Status
• Goal: – Systematic collection of data to assess the project status
• It can be performed on a regular basis (in which case the frequency has to be chosen according tot he project size)
• It can be performed on a need basis (for exceptional events, e.g., risks)
• Quantitative data can be collected based on the monitoring means
• Qualitative data (e.g., team morale, “feeling” about the status or difficulty of a given task) must also be collected
8
Project Monitoring and Control
spm - ©2014 adolfo villafiorita - introduction to software project management
Introduction
• Goals: – For the project: assessing project status (scope, time, cost,
quality, ...), analyzing deviations, and taking corrective actions, if necessary
– For the organization: collecting data helps building a better and more accurate plans for future projects
• Process (on a regular basis): – Collect. Get the data about the current status of your project. – Measure and Compare. Compare with baseline plan, highlight
any deviation, make a projection based on current data. – Assess and Re-plan. Decide whether corrective actions are
necessary. If so, plan, document, and take the corrective actions.
10
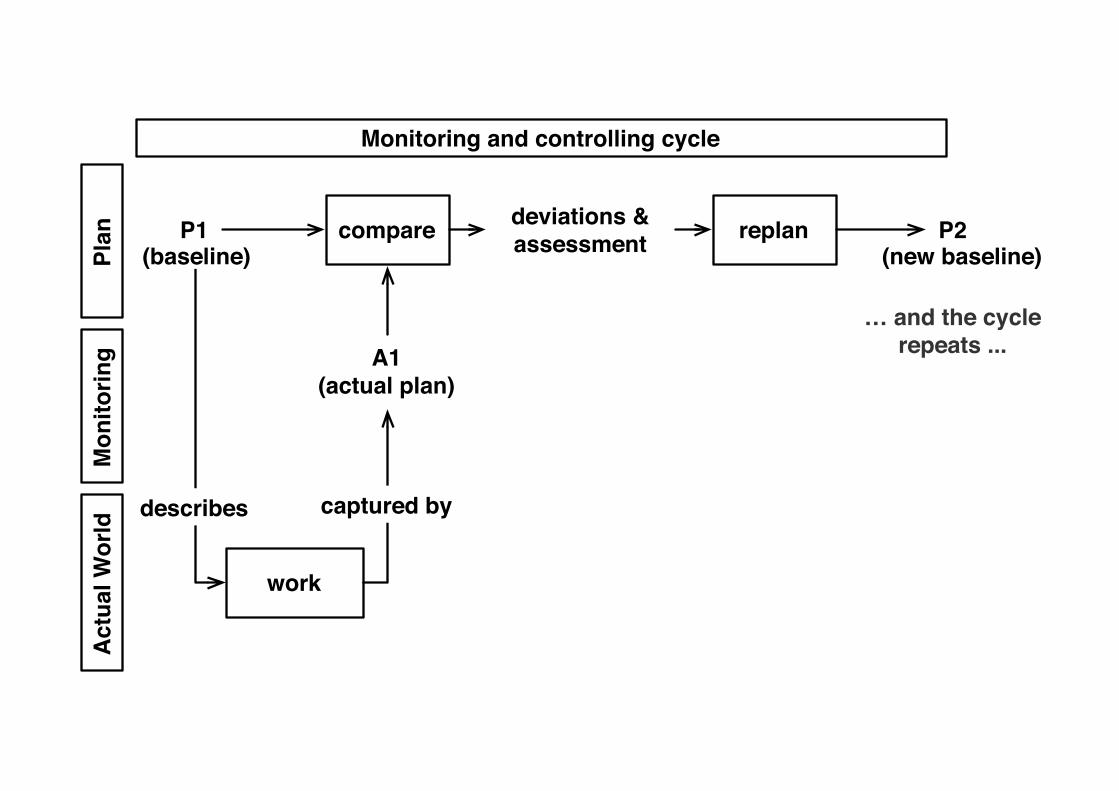
Plan P1
Mon
itorin
gA
ctua
l Wor
ld
work
describes
A1(actual plan)
captured by
compare deviations & assessment replan
(baseline)P2
(new baseline)
Monitoring and controlling cycle
… and the cyclerepeats ...
spm - ©2014 adolfo villafiorita - introduction to software project management
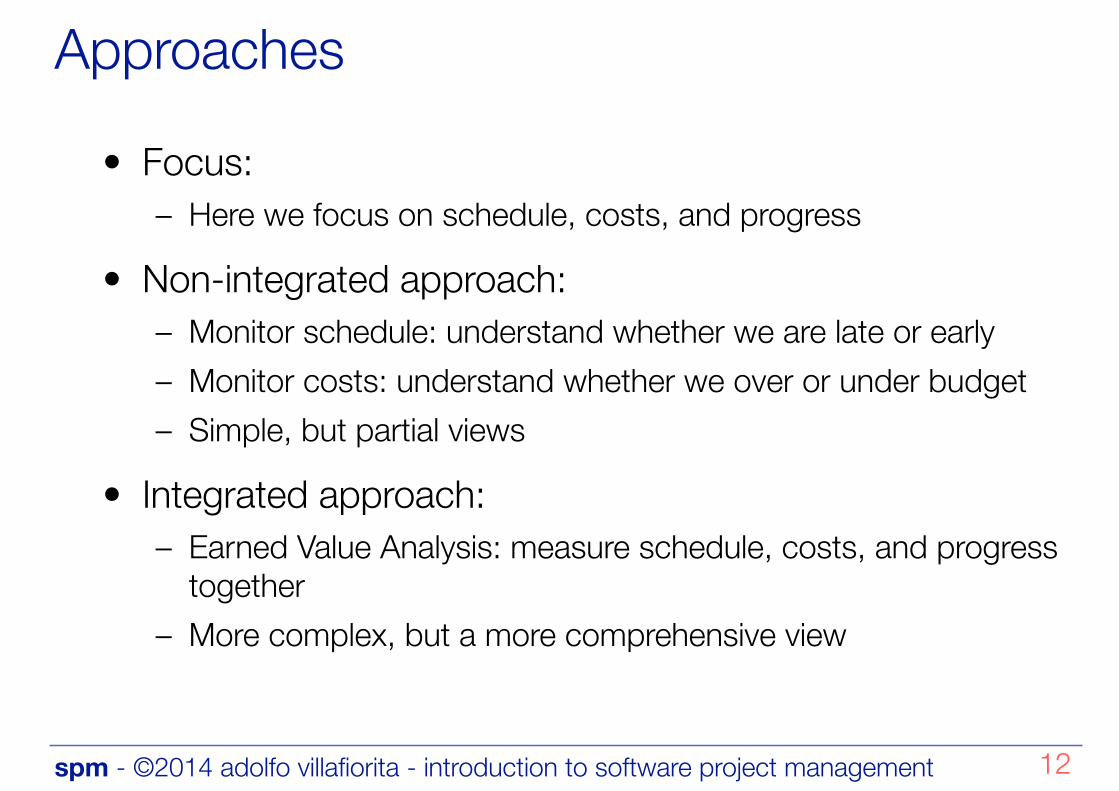
Approaches
• Focus: – Here we focus on schedule, costs, and progress
• Non-integrated approach: – Monitor schedule: understand whether we are late or early – Monitor costs: understand whether we over or under budget – Simple, but partial views
• Integrated approach: – Earned Value Analysis: measure schedule, costs, and progress
together – More complex, but a more comprehensive view
12

Monitoring Schedule
spm - ©2014 adolfo villafiorita - introduction to software project management
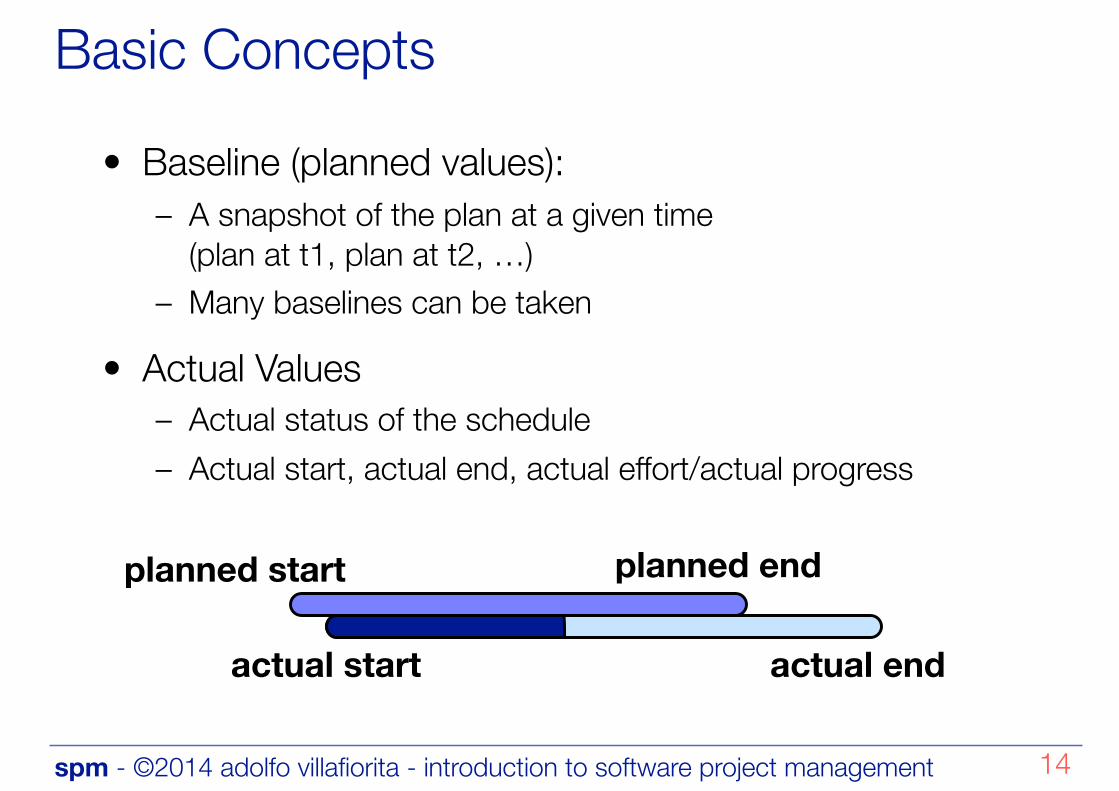
Basic Concepts
• Baseline (planned values): – A snapshot of the plan at a given time
(plan at t1, plan at t2, …) – Many baselines can be taken
• Actual Values – Actual status of the schedule – Actual start, actual end, actual effort/actual progress
14
planned start planned end
actual start actual end
spm - ©2014 adolfo villafiorita - introduction to software project management
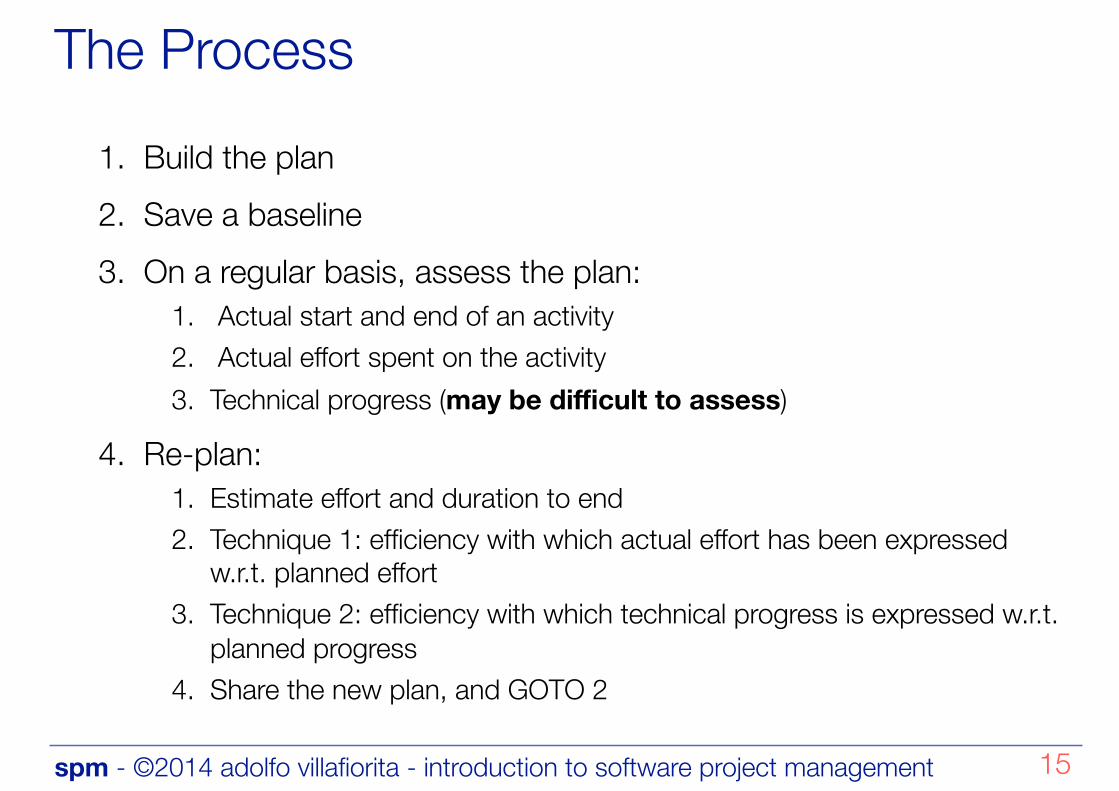
The Process1. Build the plan 2. Save a baseline 3. On a regular basis, assess the plan:
1. Actual start and end of an activity 2. Actual effort spent on the activity 3. Technical progress (may be difficult to assess)
4. Re-plan: 1. Estimate effort and duration to end 2. Technique 1: efficiency with which actual effort has been expressed
w.r.t. planned effort 3. Technique 2: efficiency with which technical progress is expressed w.r.t.
planned progress 4. Share the new plan, and GOTO 2
15
spm - ©2014 adolfo villafiorita - introduction to software project management
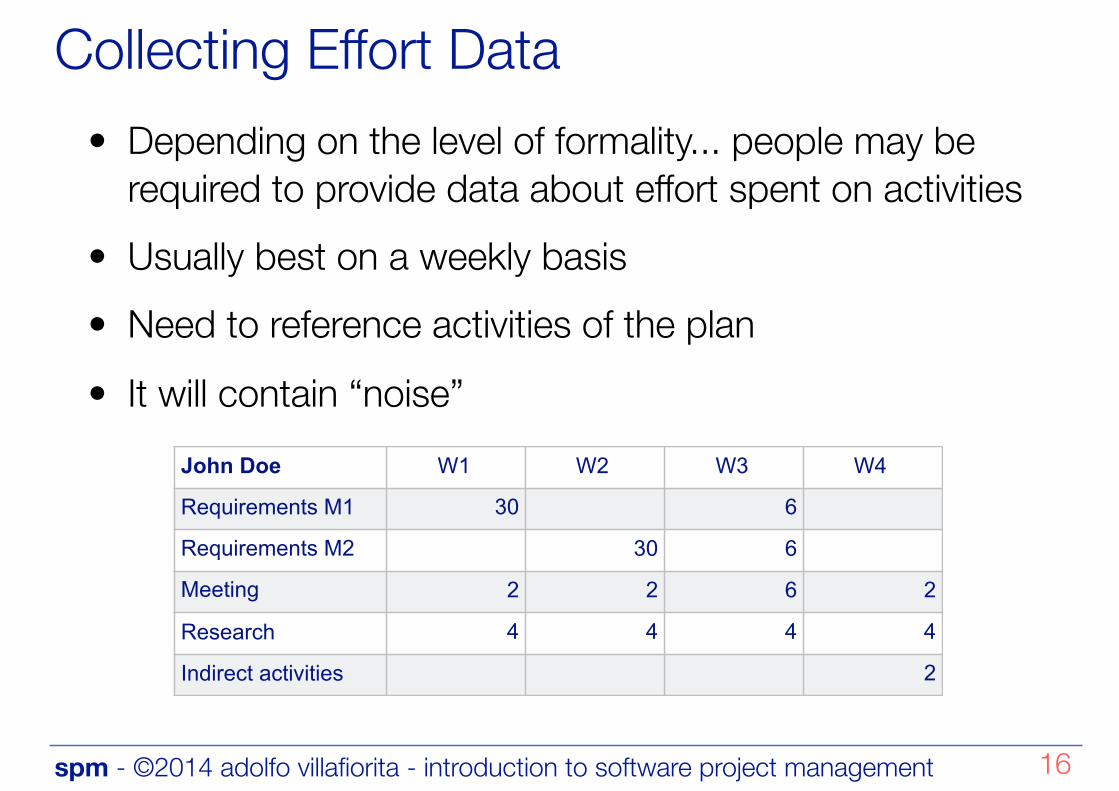
Collecting Effort Data• Depending on the level of formality... people may be
required to provide data about effort spent on activities • Usually best on a weekly basis • Need to reference activities of the plan • It will contain “noise”
16
John Doe W1 W2 W3 W4
Requirements M1 30 6
Requirements M2 30 6
Meeting 2 2 6 2
Research 4 4 4 4
Indirect activities 2
Monitoring Costs
spm - ©2014 adolfo villafiorita - introduction to software project management
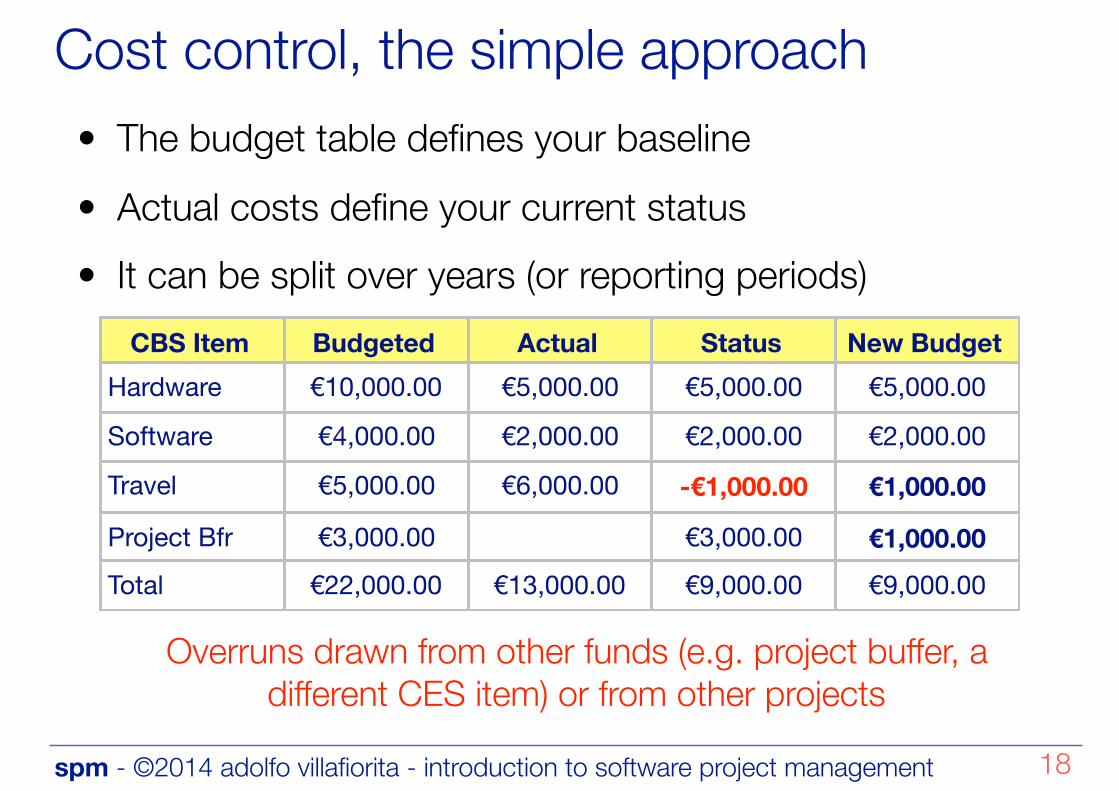
Cost control, the simple approach• The budget table defines your baseline • Actual costs define your current status • It can be split over years (or reporting periods)
18
CBS Item Budgeted Actual Status New BudgetHardware €10,000.00 €5,000.00 €5,000.00 €5,000.00
Software €4,000.00 €2,000.00 €2,000.00 €2,000.00
Travel €5,000.00 €6,000.00 -€1,000.00 €1,000.00
Project Bfr €3,000.00 €3,000.00 €1,000.00Total €22,000.00 €13,000.00 €9,000.00 €9,000.00
Overruns drawn from other funds (e.g. project buffer, a different CES item) or from other projects
spm - ©2014 adolfo villafiorita - introduction to software project management
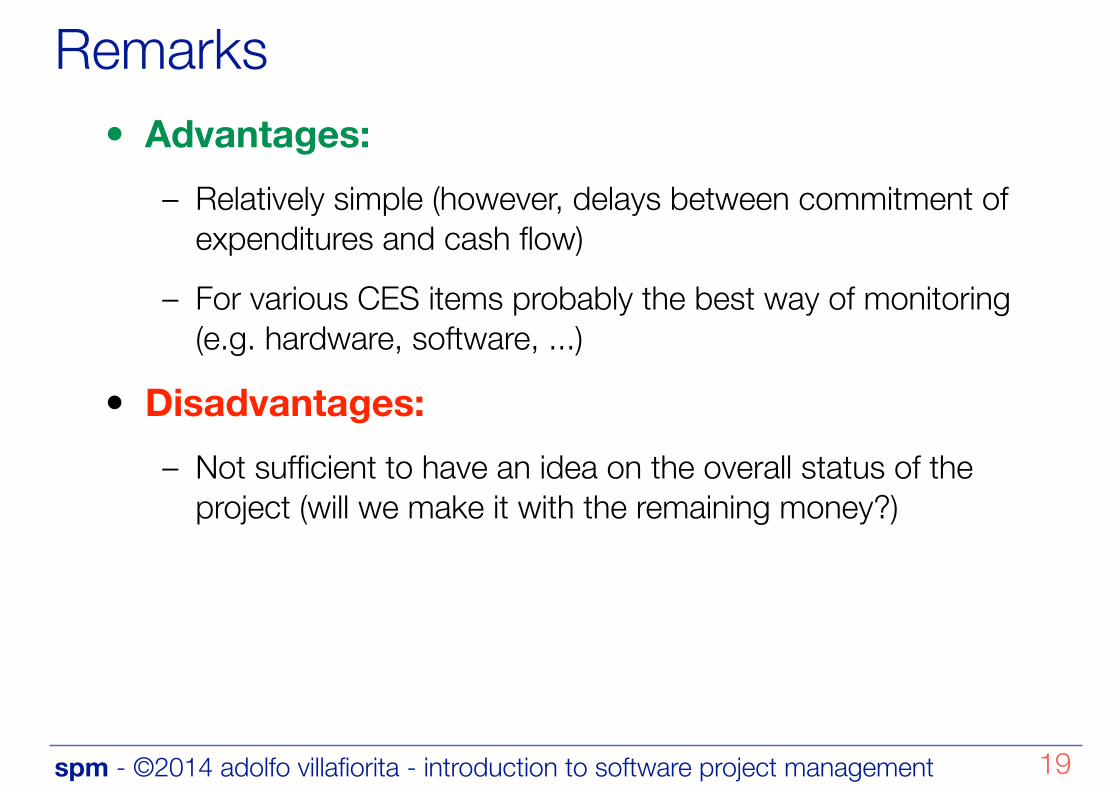
Remarks• Advantages:
– Relatively simple (however, delays between commitment of expenditures and cash flow)
– For various CES items probably the best way of monitoring (e.g. hardware, software, ...)
• Disadvantages: – Not sufficient to have an idea on the overall status of the
project (will we make it with the remaining money?)
19

Earned Value Analysis
spm - ©2014 adolfo villafiorita - introduction to software project management
Earned Value Analysis
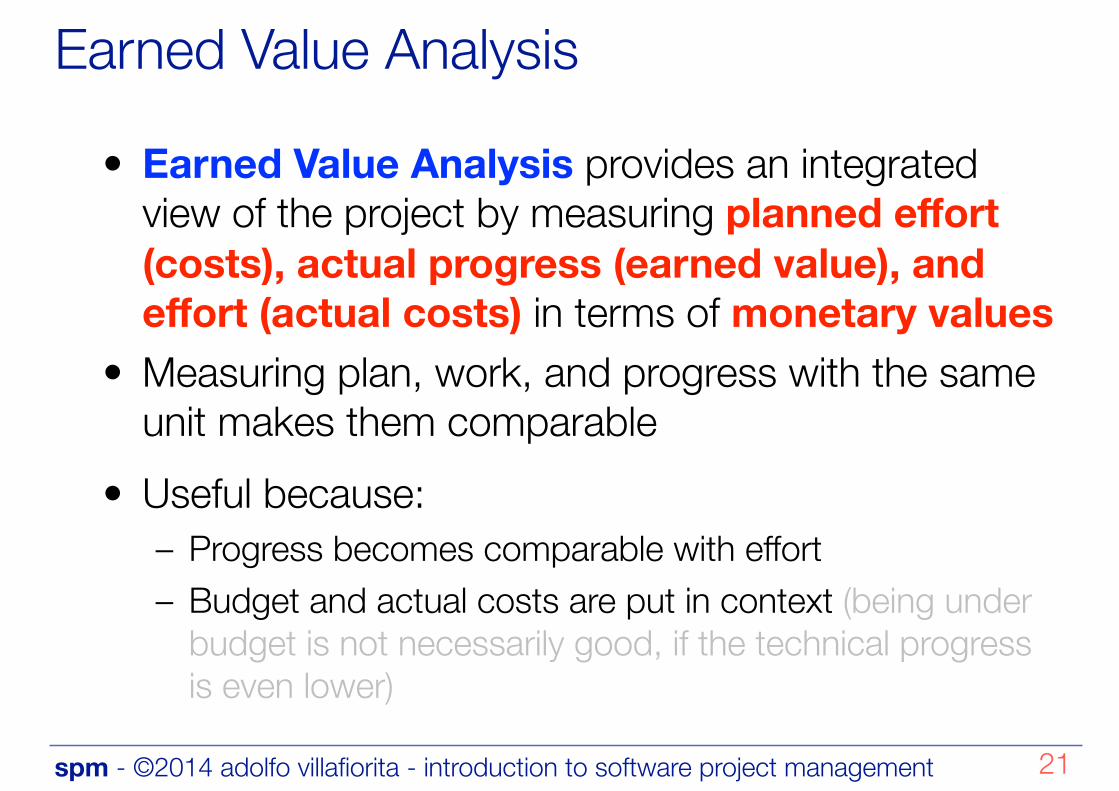
• Earned Value Analysis provides an integrated view of the project by measuring planned effort (costs), actual progress (earned value), and effort (actual costs) in terms of monetary values
• Measuring plan, work, and progress with the same unit makes them comparable
• Useful because: – Progress becomes comparable with effort – Budget and actual costs are put in context (being under
budget is not necessarily good, if the technical progress is even lower)
21
spm - ©2014 adolfo villafiorita - introduction to software project management
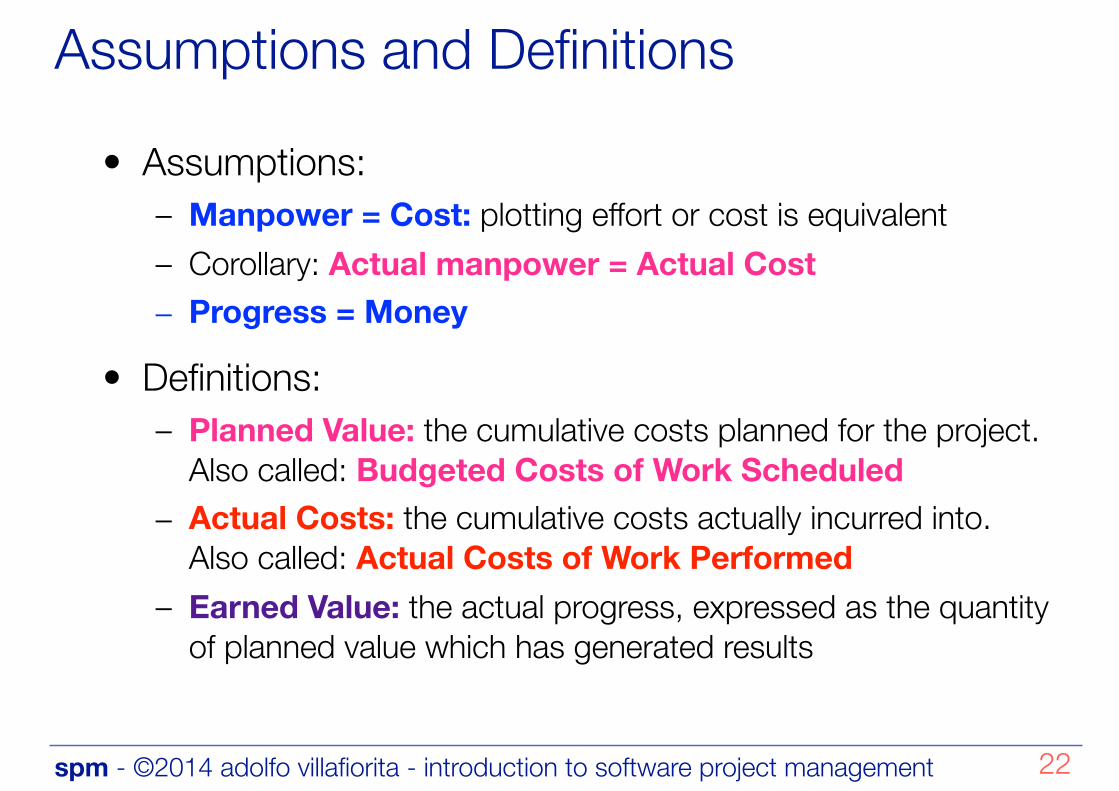
Assumptions and Definitions
• Assumptions: – Manpower = Cost: plotting effort or cost is equivalent – Corollary: Actual manpower = Actual Cost – Progress = Money
• Definitions: – Planned Value: the cumulative costs planned for the project.
Also called: Budgeted Costs of Work Scheduled – Actual Costs: the cumulative costs actually incurred into.
Also called: Actual Costs of Work Performed – Earned Value: the actual progress, expressed as the quantity
of planned value which has generated results
22
spm - ©2014 adolfo villafiorita - introduction to software project management
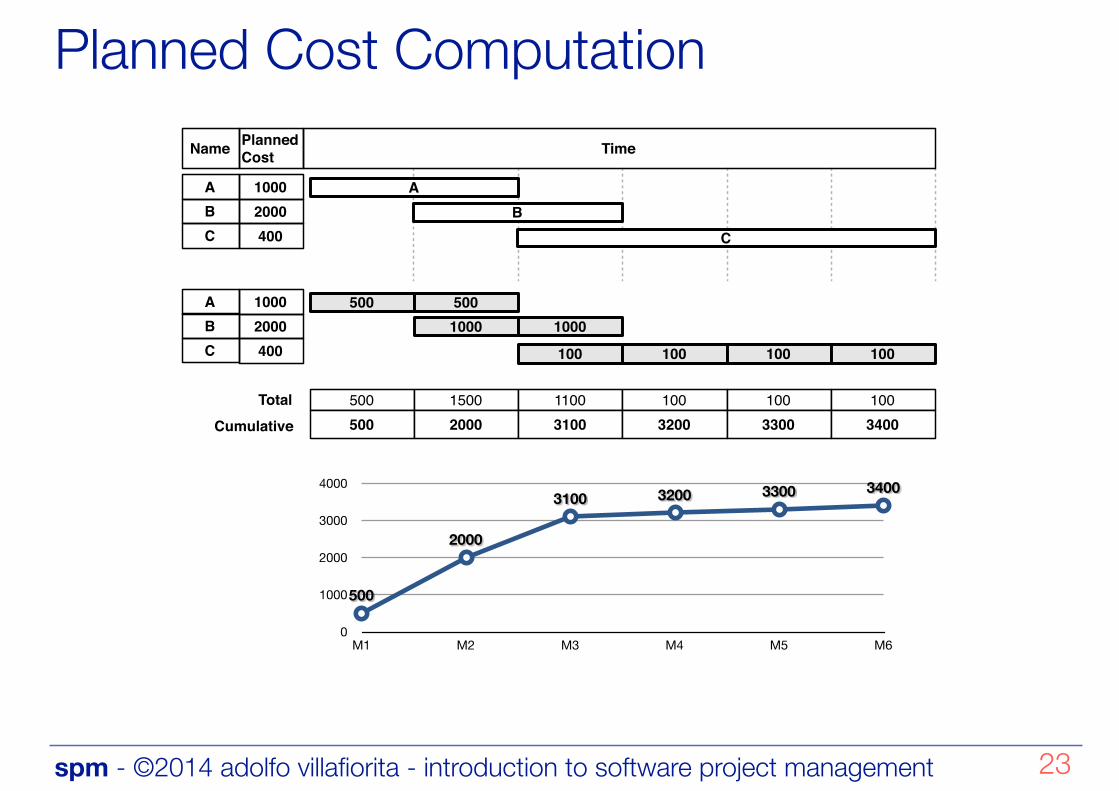
Planned Cost Computation
23
ABC
10002000400
500 5001000 1000
100 100 100 100
500 1500 1100 100 100 100Total500 2000 3100 3200 3300 3400Cumulative
0
1000
2000
3000
4000
M1 M2 M3 M4 M5 M6
500
2000
3100 3200 3300 3400
PlannedCostName Time
AB
C
ABC
10002000400
spm - ©2014 adolfo villafiorita - introduction to software project management
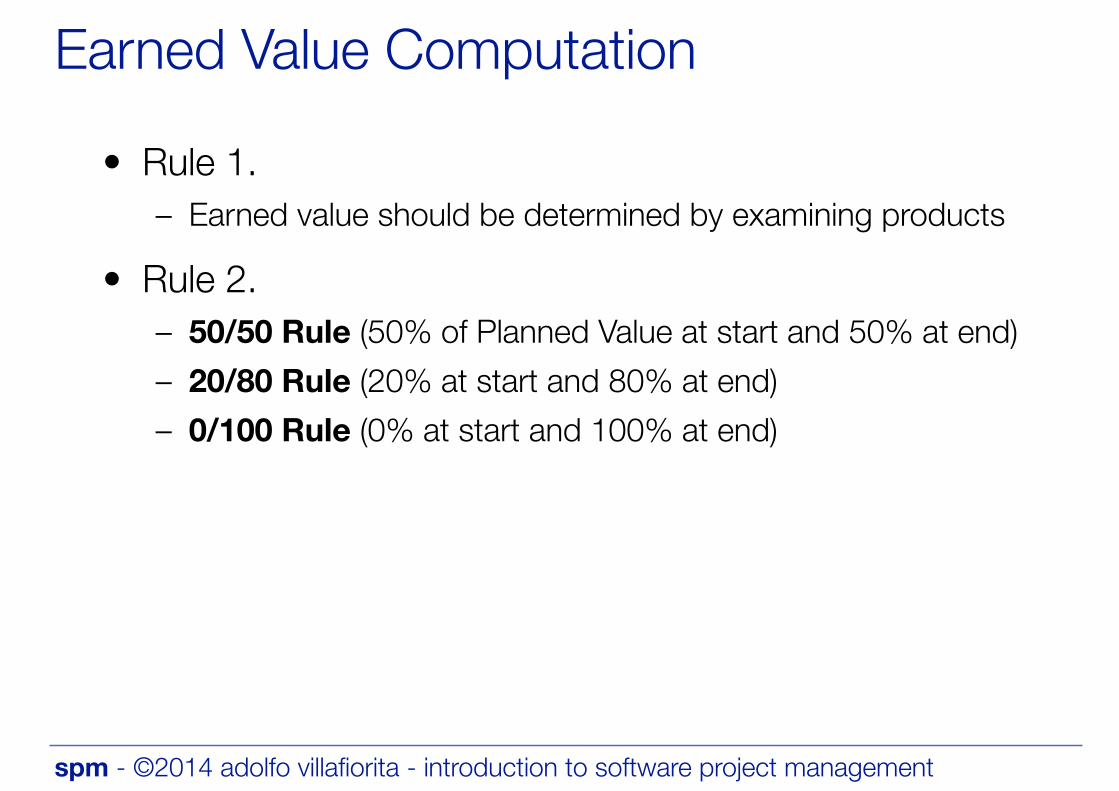
Earned Value Computation
• Rule 1. – Earned value should be determined by examining products
• Rule 2. – 50/50 Rule (50% of Planned Value at start and 50% at end) – 20/80 Rule (20% at start and 80% at end) – 0/100 Rule (0% at start and 100% at end)
spm - ©2014 adolfo villafiorita - introduction to software project management
Earned Value Analysis
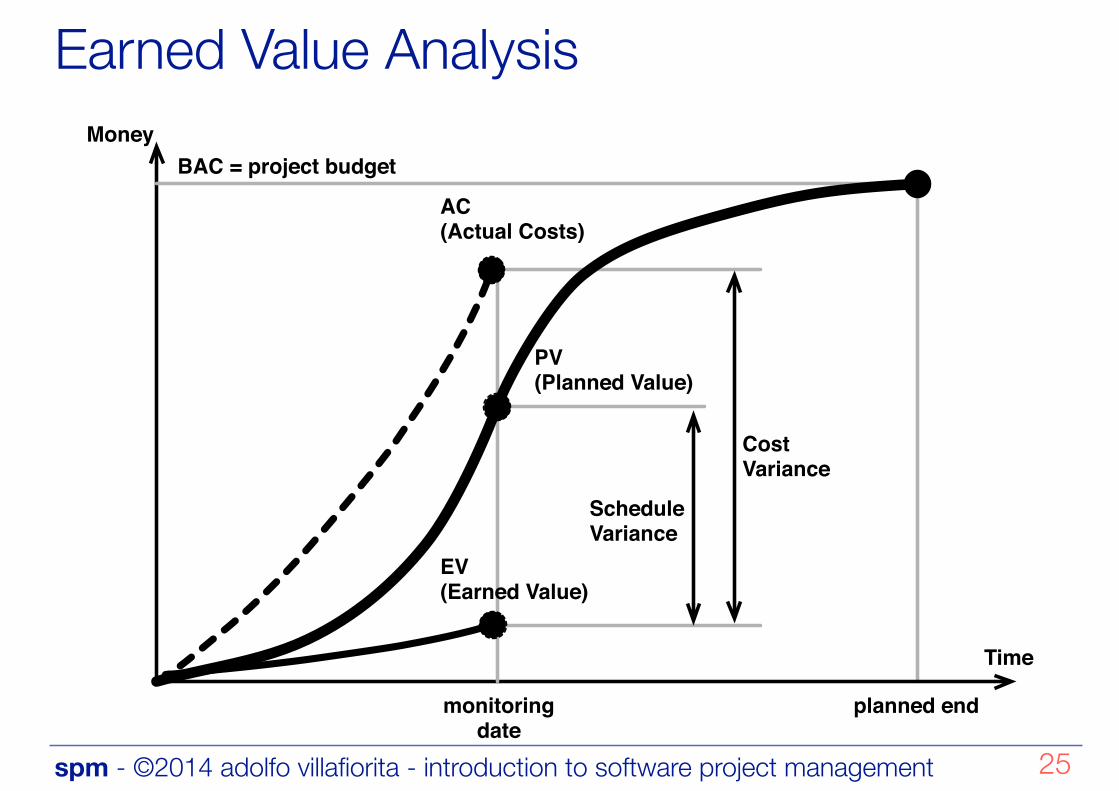
25
BAC = project budget
planned endmonitoring date
PV(Planned Value)
AC(Actual Costs)
EV(Earned Value)
ScheduleVariance
CostVariance
Money
Time
spm - ©2014 adolfo villafiorita - introduction to software project management 26
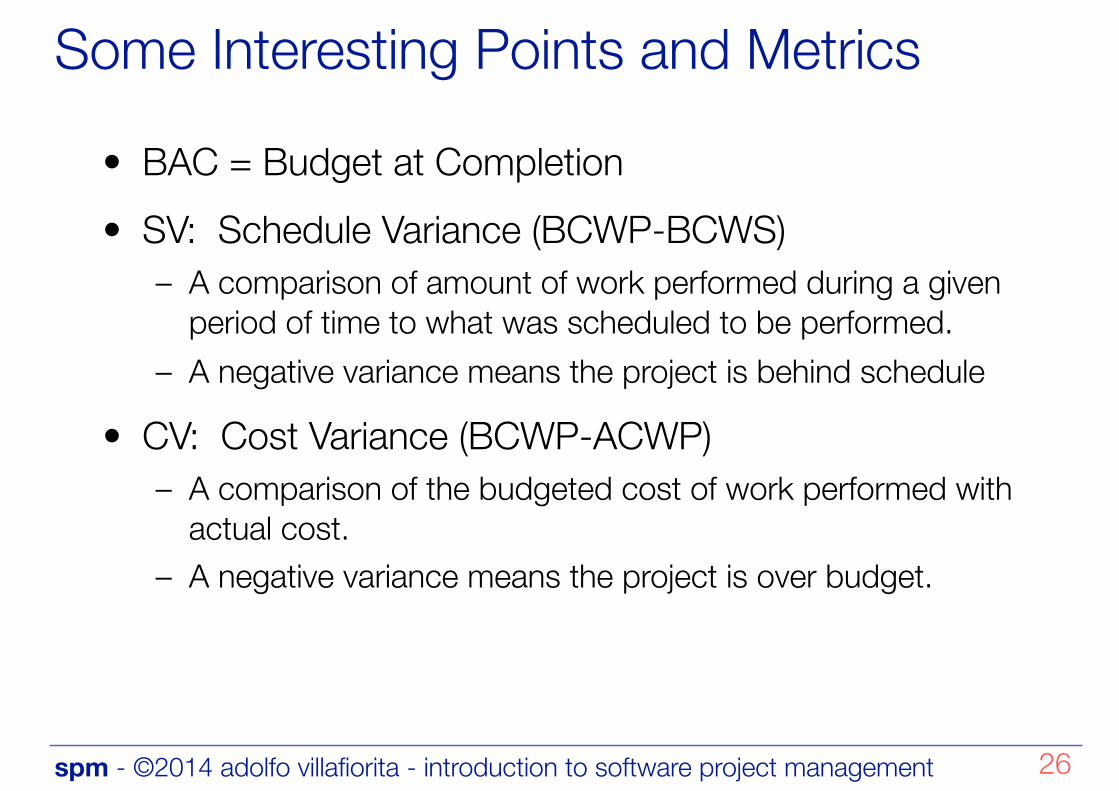
Some Interesting Points and Metrics
• BAC = Budget at Completion • SV: Schedule Variance (BCWP-BCWS)
– A comparison of amount of work performed during a given period of time to what was scheduled to be performed.
– A negative variance means the project is behind schedule
• CV: Cost Variance (BCWP-ACWP) – A comparison of the budgeted cost of work performed with
actual cost. – A negative variance means the project is over budget.
spm - ©2014 adolfo villafiorita - introduction to software project management
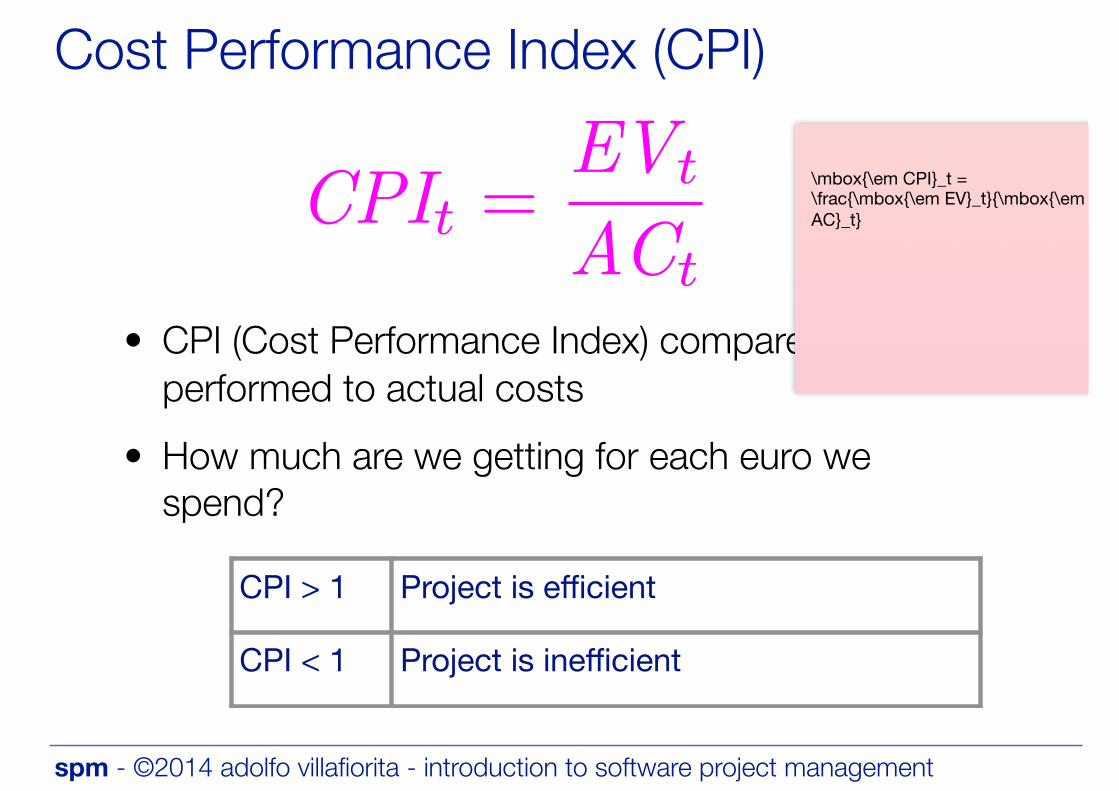
CPIt =EVt
ACt
Cost Performance Index (CPI)
• CPI (Cost Performance Index) compares work performed to actual costs
• How much are we getting for each euro we spend?
CPI > 1 Project is efficient
CPI < 1 Project is inefficient
\mbox{\em CPI}_t = \frac{\mbox{\em EV}_t}{\mbox{\em AC}_t}
spm - ©2014 adolfo villafiorita - introduction to software project management
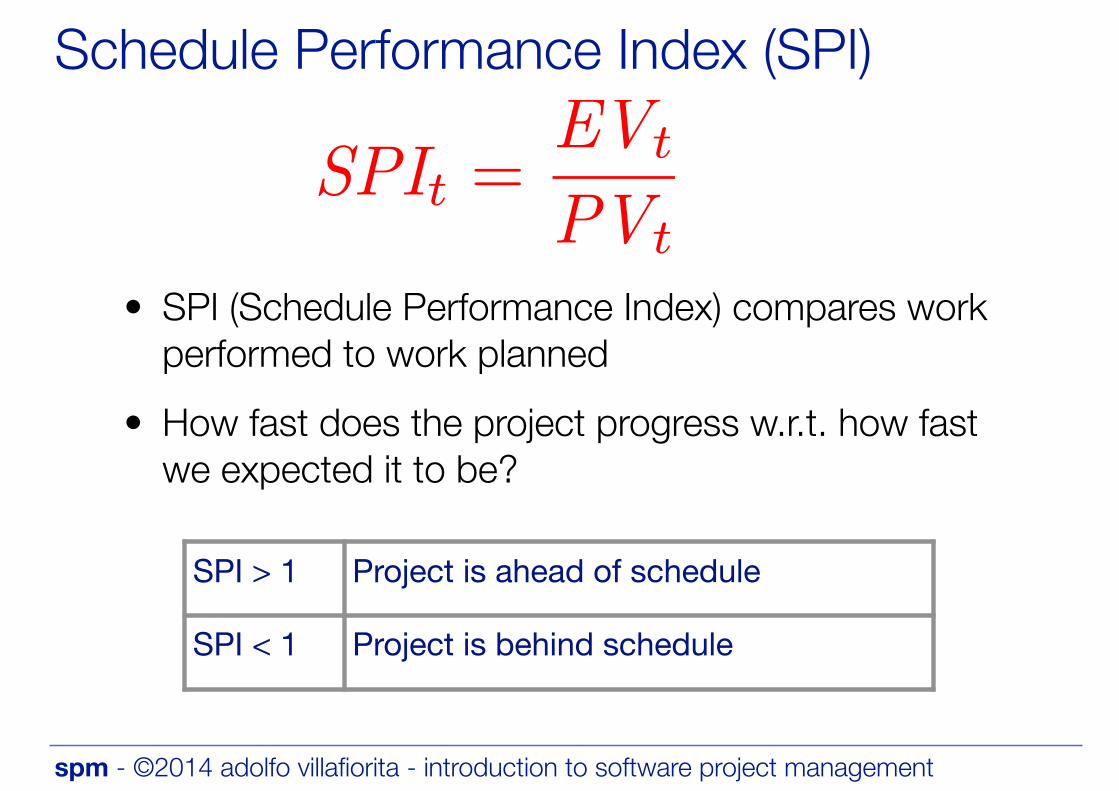
Schedule Performance Index (SPI)
• SPI (Schedule Performance Index) compares work performed to work planned
• How fast does the project progress w.r.t. how fast we expected it to be?
SPIt =EVt
PVt
SPI > 1 Project is ahead of schedule
SPI < 1 Project is behind schedule
spm - ©2014 adolfo villafiorita - introduction to software project management
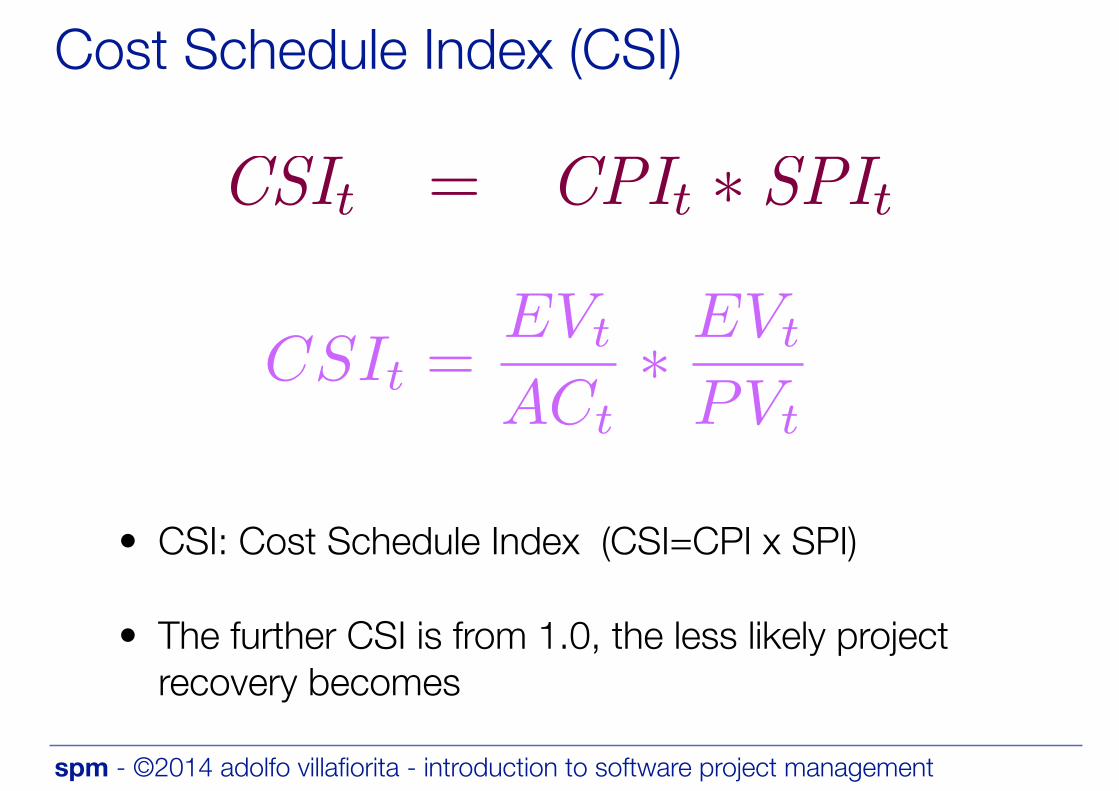
CSIt = CPIt � SPIt
CSIt =EVt
ACt⇤ EVt
PVt
Cost Schedule Index (CSI)
• CSI: Cost Schedule Index (CSI=CPI x SPI)
• The further CSI is from 1.0, the less likely project recovery becomes
spm - ©2014 adolfo villafiorita - introduction to software project management
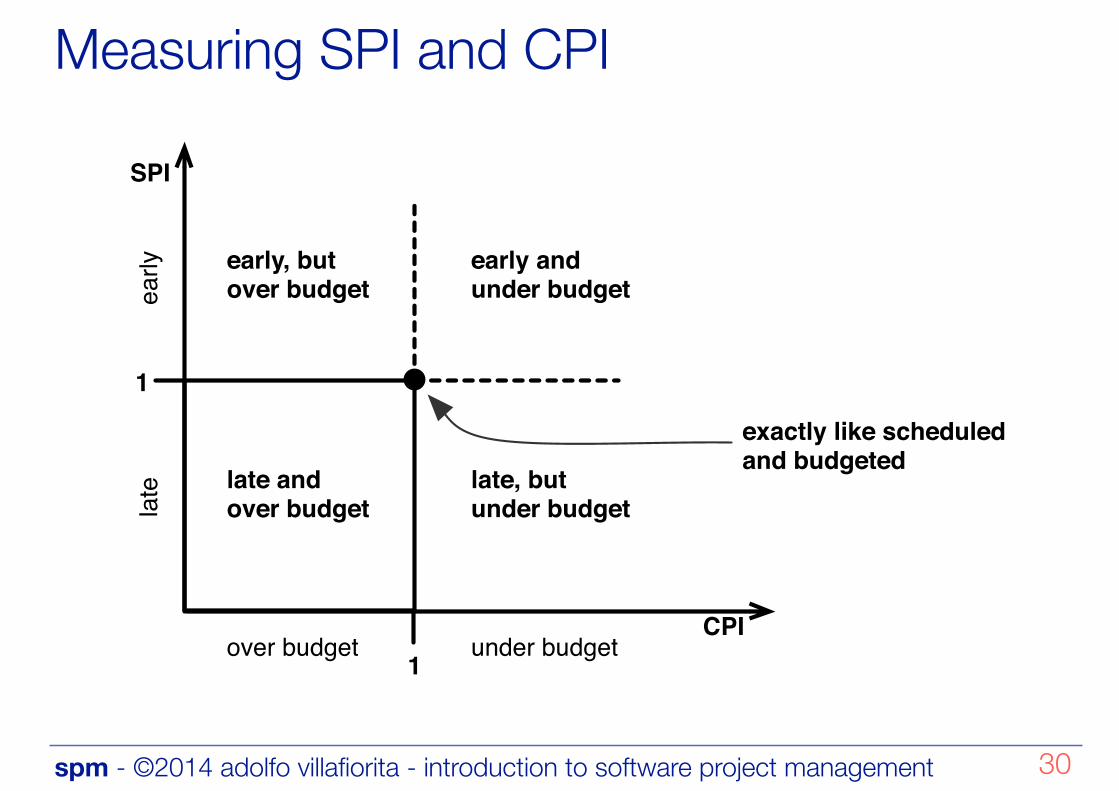
Measuring SPI and CPI
30
CPI
SPI
1
1
late andover budget
early, butover budget
late, but under budget
early andunder budget
exactly like scheduledand budgeted
early
late
over budget under budget

Earned Value Analysis: Example
spm - ©2014 adolfo villafiorita - introduction to software project management
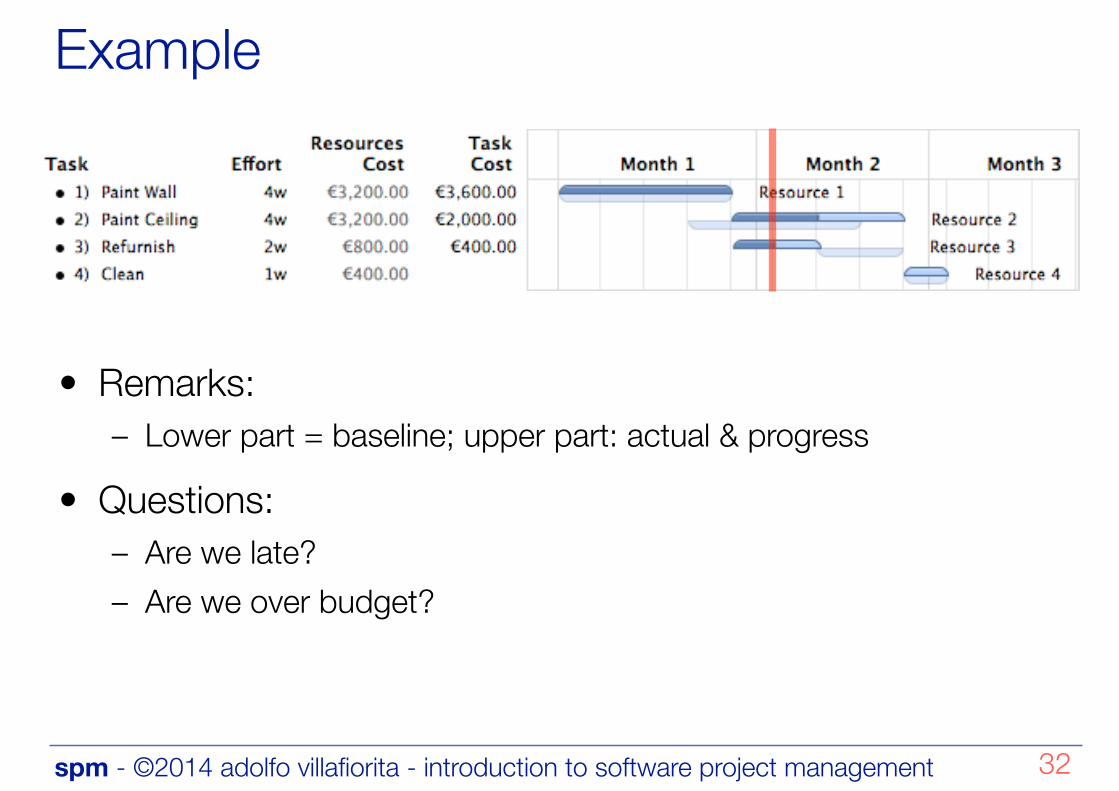
Example
• Remarks: – Lower part = baseline; upper part: actual & progress
• Questions: – Are we late? – Are we over budget?
32
spm - ©2014 adolfo villafiorita - introduction to software project management
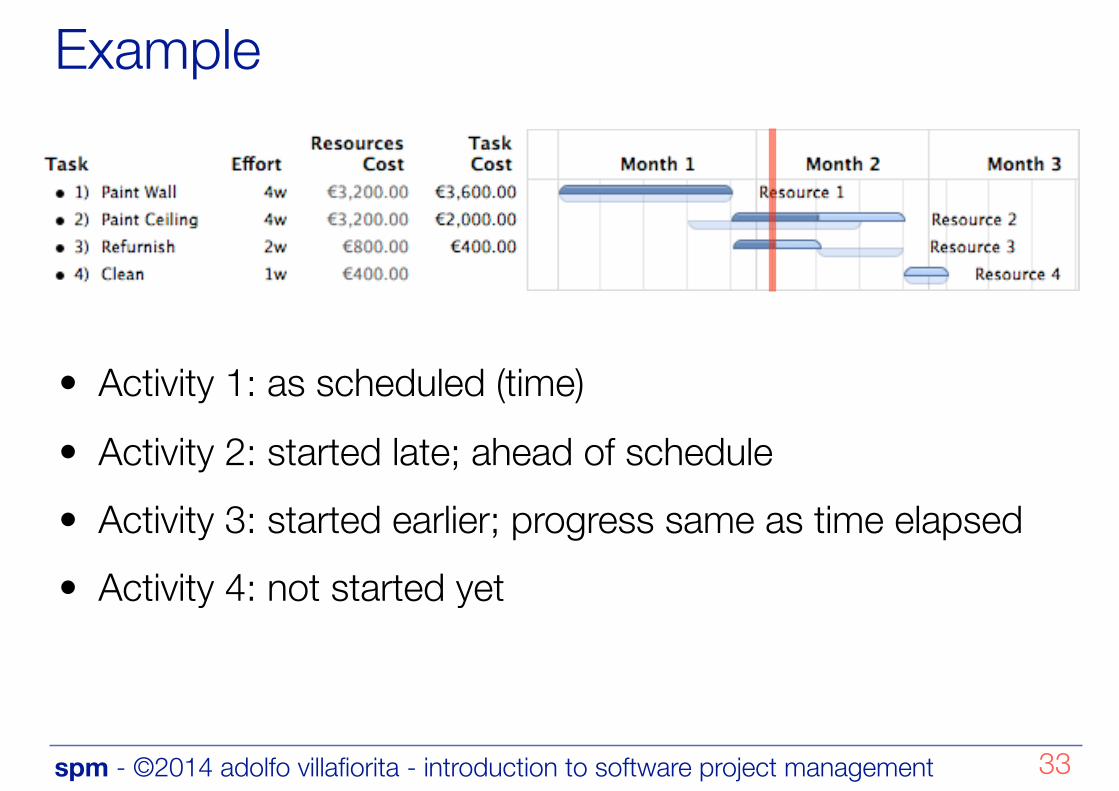
Example
• Activity 1: as scheduled (time) • Activity 2: started late; ahead of schedule • Activity 3: started earlier; progress same as time elapsed • Activity 4: not started yet
33
spm - ©2014 adolfo villafiorita - introduction to software project management
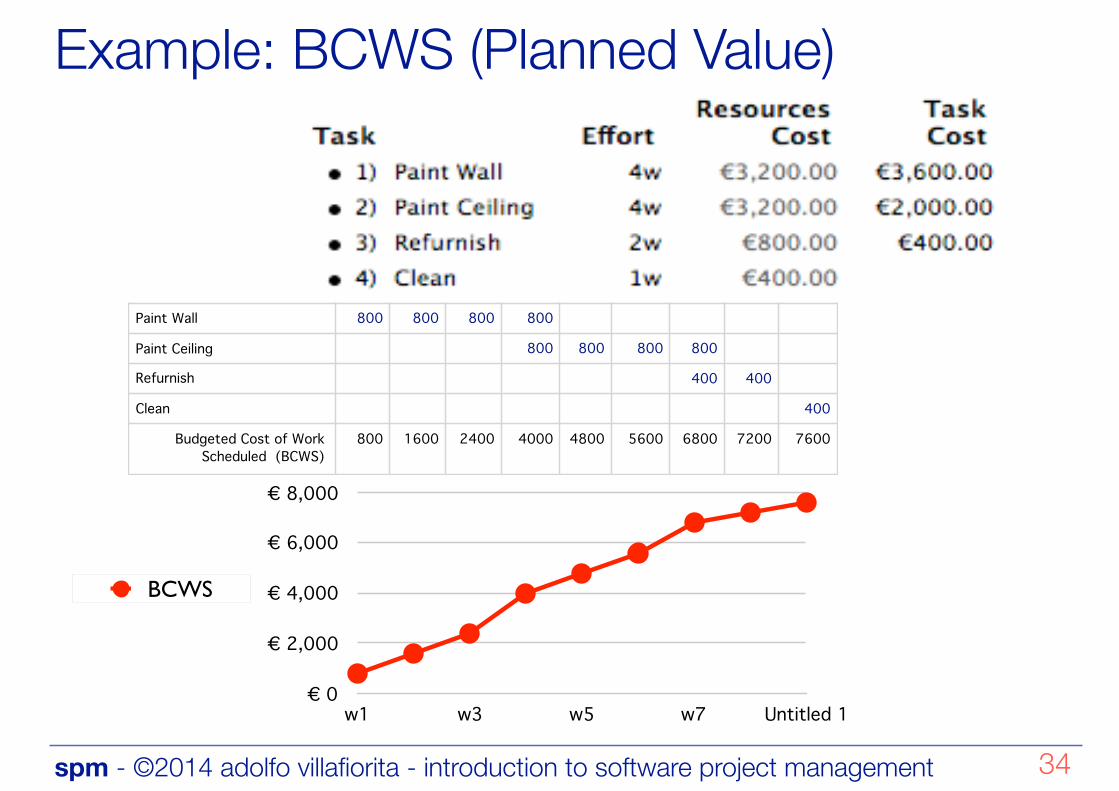
Example: BCWS (Planned Value)
34
Paint Wall 800 800 800 800
Paint Ceiling 800 800 800 800
Refurnish 400 400
Clean 400
Budgeted Cost of Work Scheduled (BCWS)
800 1600 2400 4000 4800 5600 6800 7200 7600
€ 0
€ 2,000
€ 4,000
€ 6,000
€ 8,000
w1 w3 w5 w7 Untitled 1
BCWS
spm - ©2014 adolfo villafiorita - introduction to software project management
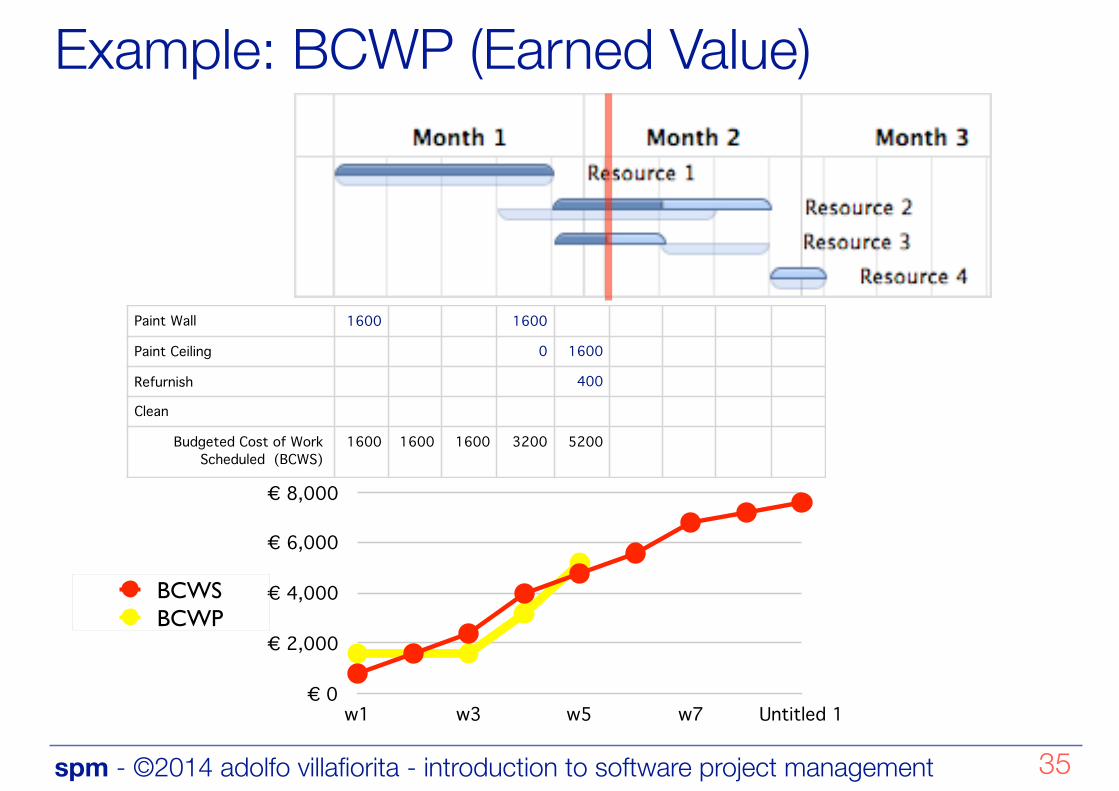
Example: BCWP (Earned Value)
35
Paint Wall 1600 1600
Paint Ceiling 0 1600
Refurnish 400
Clean
Budgeted Cost of Work Scheduled (BCWS)
1600 1600 1600 3200 5200
€ 0
€ 2,000
€ 4,000
€ 6,000
€ 8,000
w1 w3 w5 w7 Untitled 1
BCWSBCWP
spm - ©2014 adolfo villafiorita - introduction to software project management
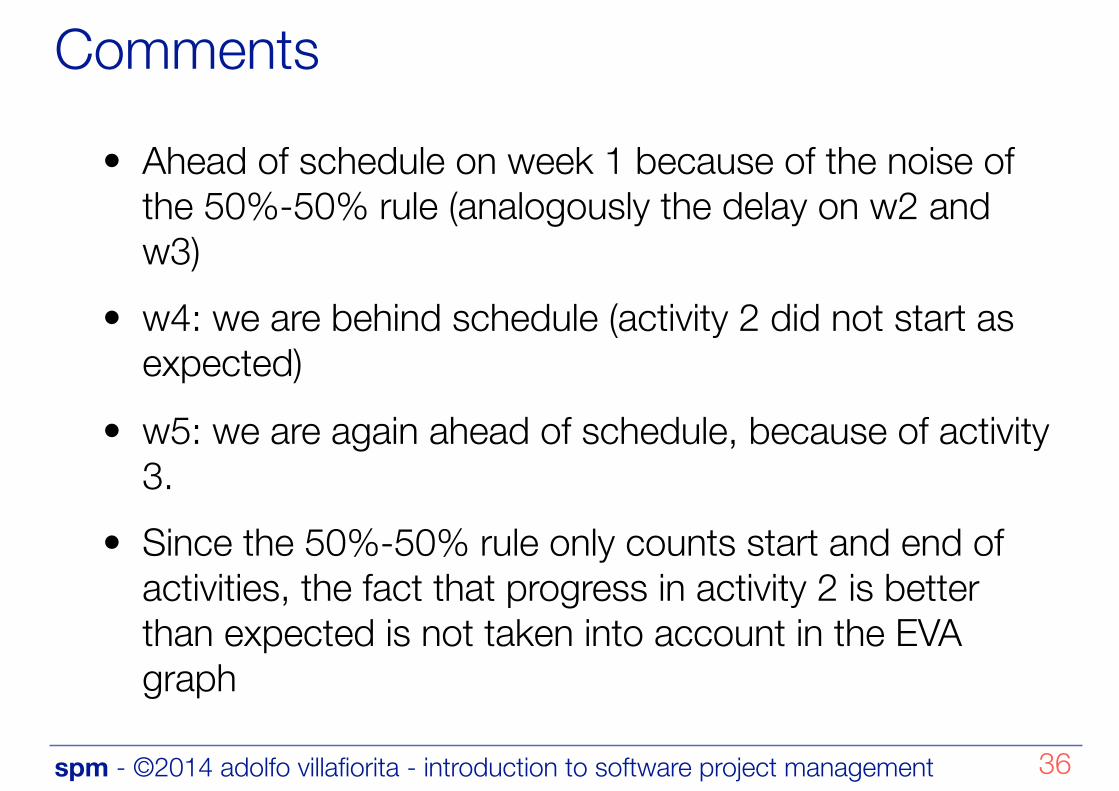
Comments
• Ahead of schedule on week 1 because of the noise of the 50%-50% rule (analogously the delay on w2 and w3)
• w4: we are behind schedule (activity 2 did not start as expected)
• w5: we are again ahead of schedule, because of activity 3.
• Since the 50%-50% rule only counts start and end of activities, the fact that progress in activity 2 is better than expected is not taken into account in the EVA graph
36
spm - ©2014 adolfo villafiorita - introduction to software project management
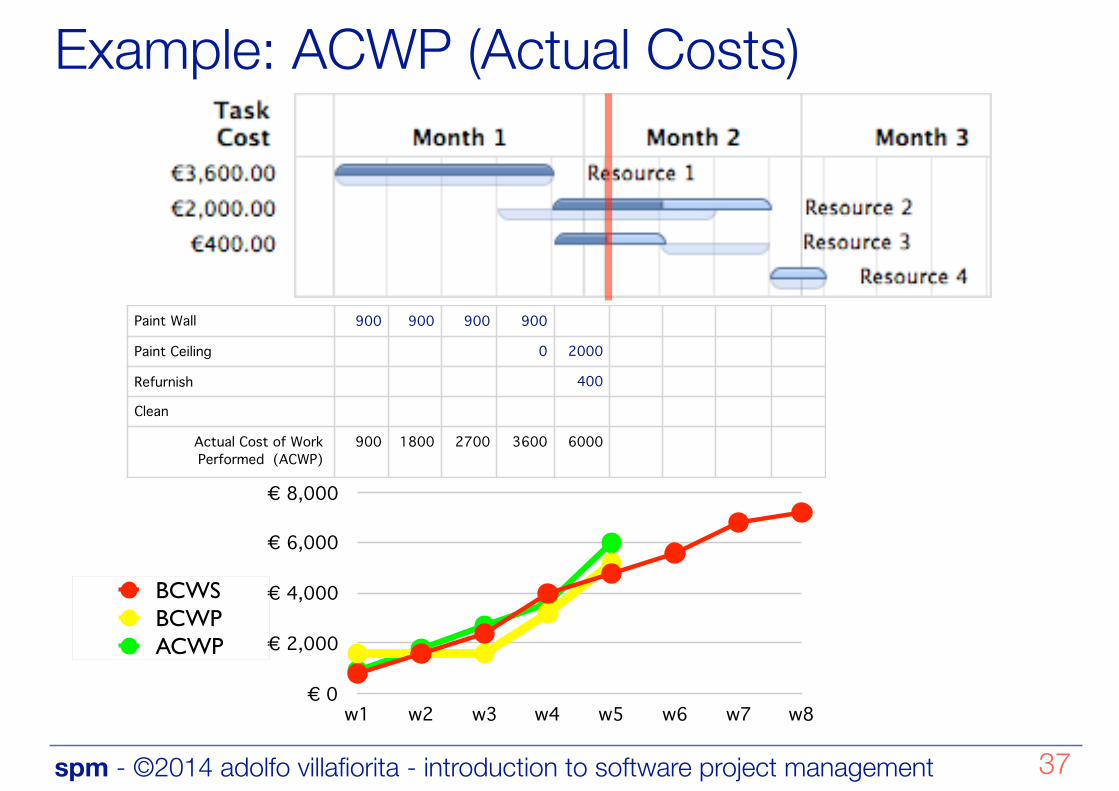
Example: ACWP (Actual Costs)
37
Paint Wall 900 900 900 900
Paint Ceiling 0 2000
Refurnish 400
Clean
Actual Cost of Work Performed (ACWP)
900 1800 2700 3600 6000
€ 0
€ 2,000
€ 4,000
€ 6,000
€ 8,000
w1 w2 w3 w4 w5 w6 w7 w8
BCWSBCWPACWP
spm - ©2014 adolfo villafiorita - introduction to software project management
Recap
38
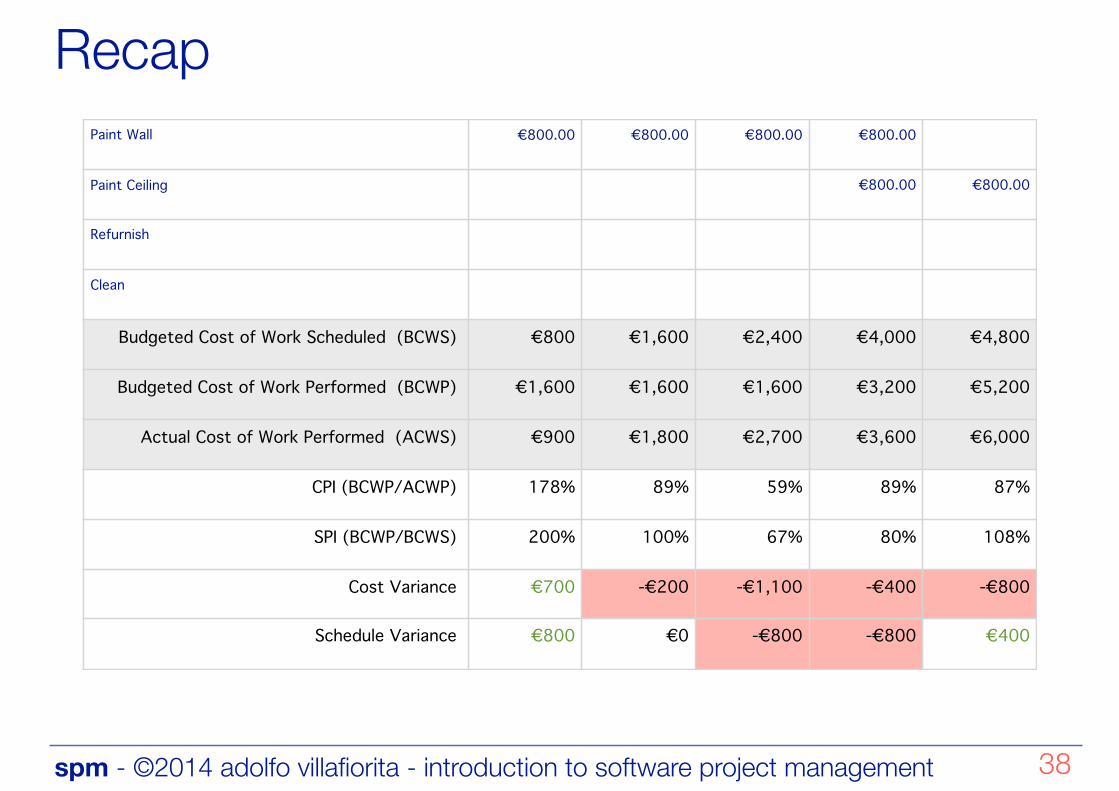
Paint Wall €800.00 €800.00 €800.00 €800.00
Paint Ceiling €800.00 €800.00
Refurnish
Clean
Budgeted Cost of Work Scheduled (BCWS) €800 €1,600 €2,400 €4,000 €4,800
Budgeted Cost of Work Performed (BCWP) €1,600 €1,600 €1,600 €3,200 €5,200
Actual Cost of Work Performed (ACWS) €900 €1,800 €2,700 €3,600 €6,000
CPI (BCWP/ACWP) 178% 89% 59% 89% 87%
SPI (BCWP/BCWS) 200% 100% 67% 80% 108%
Cost Variance €700 -€200 -€1,100 -€400 -€800
Schedule Variance €800 €0 -€800 -€800 €400
spm - ©2014 adolfo villafiorita - introduction to software project management
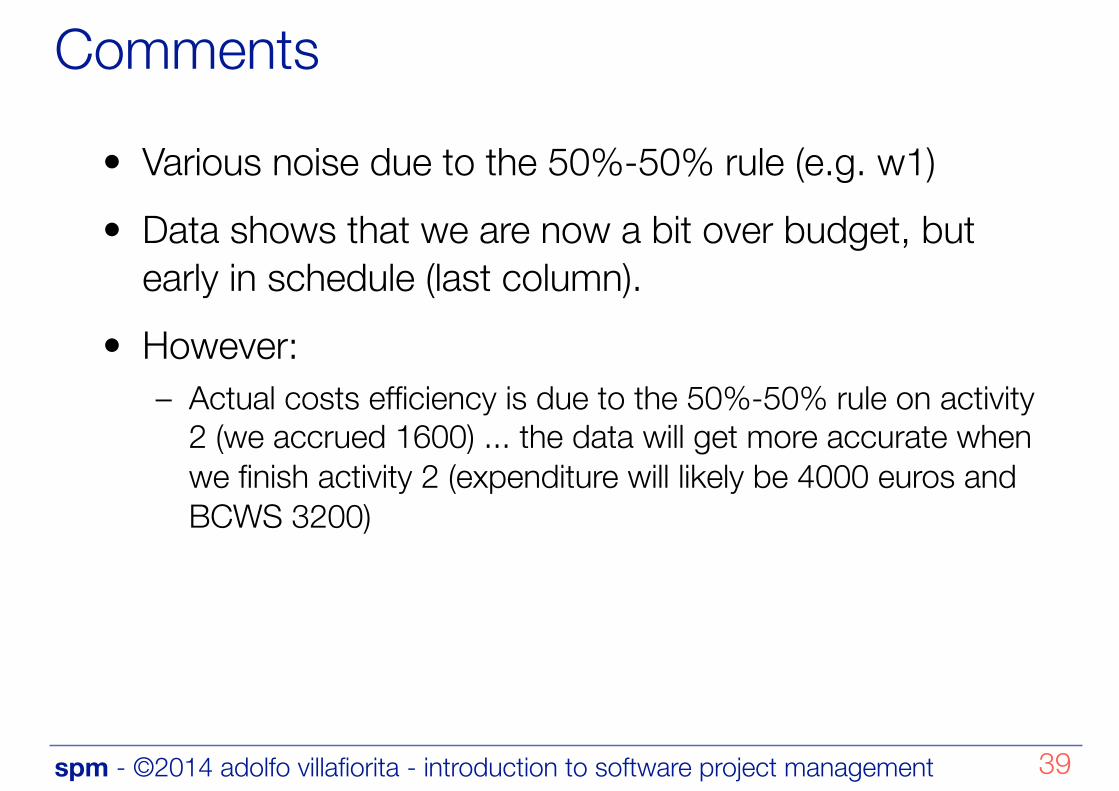
Comments
• Various noise due to the 50%-50% rule (e.g. w1) • Data shows that we are now a bit over budget, but
early in schedule (last column). • However:
– Actual costs efficiency is due to the 50%-50% rule on activity 2 (we accrued 1600) ... the data will get more accurate when we finish activity 2 (expenditure will likely be 4000 euros and BCWS 3200)
39