Embed Size (px)
Citation preview
UNFCCC/CCNUCC
CDM – Executive Board Page 1
PROJECT DESIGN DOCUMENT FORM
FOR CDM PROJECT ACTIVITIES (F-CDM-PDD)
Version 04.1
PROJECT DESIGN DOCUMENT (PDD)
Title of the project activity LaGeo, S.A. de C.V., Berlin Geothermal
Project, Phase Two (for simplicity hereafter
referred to simply as the “Project Activity”)
Version number of the PDD 21
Completion date of the PDD 28/01/2014
Project participant(s) LaGeo, S. A. de C. V.
Host Party(ies) El Salvador
Sectoral scope and selected methodology(ies) Sectoral Scope: 1. Energy industries
(renewable - / non renewable sources).
Category: Renewable electricity generation for
a grid (energy generation, supply, transmission
and distribution).
Methodology: ACM0002, version 14.0.0
Consolidated methodology for grid-connected
electricity generation from renewable sources
Estimated amount of annual average GHG
emission reductions
150,171 tCO2 e
UNFCCC/CCNUCC
CDM – Executive Board Page 2
SECTION A. Description of project activity
A.1. Purpose and general description of project activity
The primary objective of the Project Activity is to supply El Salvador’s rising demand for energy due to
economic growth and to improve the supply of electricity, while contributing to the environmental, social
and economic sustainability by increasing renewable energy’s share of total the Salvadoran electricity
consumption. One fundamental goal of the project is the efficient use of resources, particularly
indigenous resources, while minimizing impact on the environment.
The Project Activity will increase the power generation capacity at the existing Berlin Geothermal Power
Plant through the drilling of additional geothermal wells and the installation of a new 44 MW
condensation power unit that started commercial operations in February 2, 2007. The resource of the
Berlin Geothermal Field is characterized by a depth between 1,000 and 1,500 m asl (above sea level) in
the range of 280-300°C, 115 bar pressure, and good rock permeability. Hence, reservoir dimensions and
characteristics are enough to sustain a 44 MW power plant for the entire life of the Project Activity, with
an expected field depletion of about 1% per year.
Commercial exploration of the Berlin Geothermal field started in 1992 with 10 MW installed power and a
generation technology based on backpressure turbines; then these turbines were substituted by two
condensing units of 31.4899 MW1 each one, which started operation in late 1999. This means that in the
situation existing prior to the implementation of the Project Activity, the existing facility consists of a
geothermal plant with a total installed capacity of 62.985 MW that would continue to supply electricity to
the grid at historical levels, therefore the baseline scenario is the continuation of operation of the existing
power plant.
Contribution to Sustainable Development
The use of an indigenous and cleaner source of electricity will also contribute to environmental
sustainability by avoiding electricity generation from imported fossil fuel sources – and reducing the
emissions of greenhouse gases (GHG) – which would be generated in the absence of the project. The
estimate of total annual average GHG emission reductions for the second crediting period is 150,171
tCO2e.
A better income distribution in the region where the Project Activity is carried out will come from less
expenditure and more income in local municipalities. The additional regional income may be used for
providing the population with better services, which would improve the coverage of basic needs. The
project is in line with the national sustainable energy strategies and climate change mitigation principles
(from MARN, 1999, “sustainable exploration of geothermal and hydro resources”). This is the one of the
reasons why the project has received all needed government support and endorsement regarding the
participation in the CDM since the phase of feasibility study.
Economical and/or strategic benefits include the decrease in dependence on fossil fuels, an exogenous and
environmentally unsustainable source of energy. The Project Activity includes a biodiversity inventory
research project to be done by the National University of El Salvador and a conservation and reforestation
program in areas surrounding the plant.
The Berlin Geothermal Power Plant has a community engagement program aimed to create a balanced
and constructive environment with neighbouring municipalities of Berlin. The fundamental elements of
the program, used to maximize benefits to the community, are the generation of local employment
opportunities, social investment activities, development of sustainable small businesses, and protection of
the local environment. An indirect benefit is the construction and maintenance of road infrastructure that
ensures communication and commercial activities in the surroundings of the project site.
1 Calculated as per data of generator nameplate: capacity of 37.047 MVA and nominal power factor of 85%.

UNFCCC/CCNUCC
CDM – Executive Board Page 3
A.2. Location of project activity
A.2.1. Host Party(ies)
El Salvador.
A.2.2. Region/State/Province etc.
Departamento de Usulatán.
A.2.3. City/Town/Community etc.
Berlín and Alegría.
A.2.4. Physical/Geographical location
Berlín Geothermal Field is located 100 km to the east of San Salvador, in Central America (Figure 1). It
lays on the North Slope of the Berlín-Tecapa volcanic system. The size of the field is roughly 4 km (W-E)
and 6 km (N-S).
The geographical coordinates of the city of the facilities of the Project Activity are: latitude 13.524801,
longitude -88.509223.
Figure 1. Location of the Project Activity site
A.3. Technologies and/or measures
The Project Activity is an extension of the Berlin Geothermal Power Plant through the drilling of
additional geothermal wells. The Project exploits the resource of the Berlin Geothermal Field
characterized by a depth between 1,000 and 1,500 m asl, temperature in the range of 280 to 300 °C, 115
bar pressure, and good rock permeability. Reservoir dimensions and characteristics are enough to sustain
a 44 MW power plant for the entire life of the project, with an expected field depletion of about 1% per
year.
Project
Activity
site
UNFCCC/CCNUCC
CDM – Executive Board Page 4
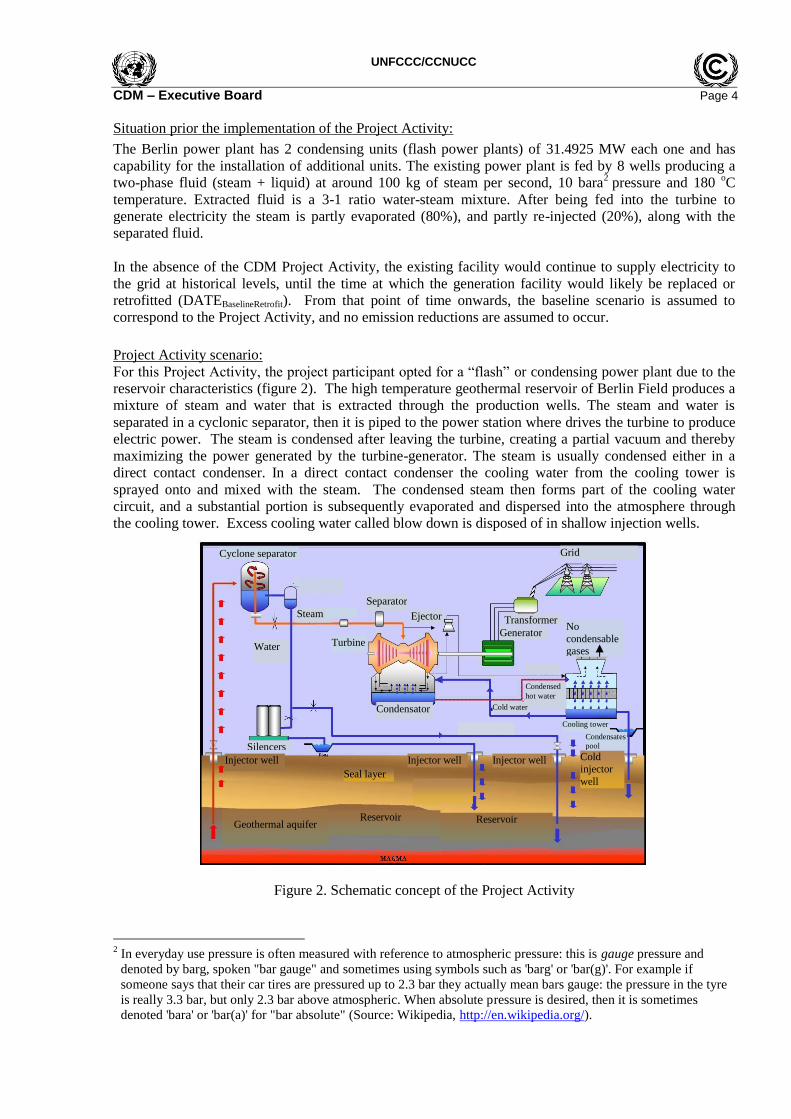
Situation prior the implementation of the Project Activity:
The Berlin power plant has 2 condensing units (flash power plants) of 31.4925 MW each one and has
capability for the installation of additional units. The existing power plant is fed by 8 wells producing a
two-phase fluid (steam + liquid) at around 100 kg of steam per second, 10 bara2 pressure and 180
oC
temperature. Extracted fluid is a 3-1 ratio water-steam mixture. After being fed into the turbine to
generate electricity the steam is partly evaporated (80%), and partly re-injected (20%), along with the
separated fluid.
In the absence of the CDM Project Activity, the existing facility would continue to supply electricity to
the grid at historical levels, until the time at which the generation facility would likely be replaced or
retrofitted (DATEBaselineRetrofit). From that point of time onwards, the baseline scenario is assumed to
correspond to the Project Activity, and no emission reductions are assumed to occur.
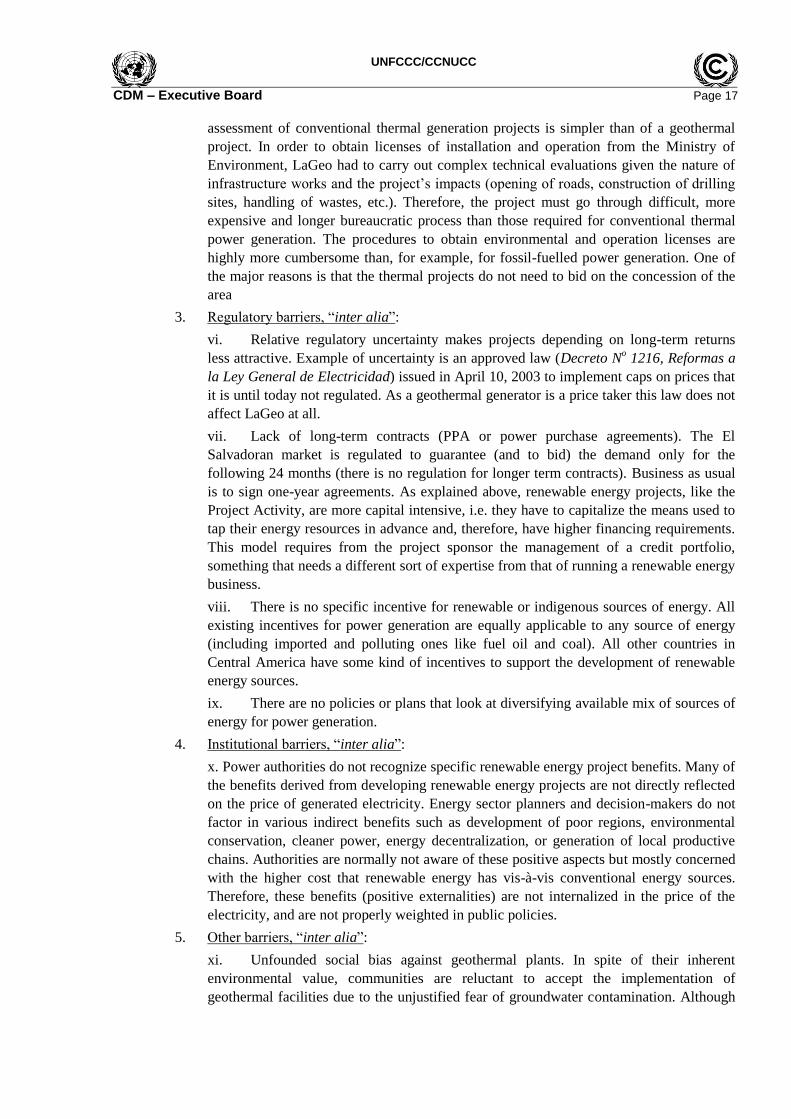
Project Activity scenario:
For this Project Activity, the project participant opted for a “flash” or condensing power plant due to the
reservoir characteristics (figure 2). The high temperature geothermal reservoir of Berlin Field produces a
mixture of steam and water that is extracted through the production wells. The steam and water is
separated in a cyclonic separator, then it is piped to the power station where drives the turbine to produce
electric power. The steam is condensed after leaving the turbine, creating a partial vacuum and thereby
maximizing the power generated by the turbine-generator. The steam is usually condensed either in a
direct contact condenser. In a direct contact condenser the cooling water from the cooling tower is
sprayed onto and mixed with the steam. The condensed steam then forms part of the cooling water
circuit, and a substantial portion is subsequently evaporated and dispersed into the atmosphere through
the cooling tower. Excess cooling water called blow down is disposed of in shallow injection wells.
Figure 2. Schematic concept of the Project Activity
2 In everyday use pressure is often measured with reference to atmospheric pressure: this is gauge pressure and
denoted by barg, spoken "bar gauge" and sometimes using symbols such as 'barg' or 'bar(g)'. For example if
someone says that their car tires are pressured up to 2.3 bar they actually mean bars gauge: the pressure in the tyre
is really 3.3 bar, but only 2.3 bar above atmospheric. When absolute pressure is desired, then it is sometimes
denoted 'bara' or 'bar(a)' for "bar absolute" (Source: Wikipedia, http://en.wikipedia.org/).
Injector well Injector well Injector well Cold
injector
well Seal layer
Reservoir
Water Turbine Generator
Transformer
Condensator
Separator
Grid
Condensed
hot water
Ejector Steam
Reservoir
Geothermal aquifer
Cold water
No
condensable gases
Cyclone separator
Cooling tower
Condensates
pool Silencers
UNFCCC/CCNUCC
CDM – Executive Board Page 5
The Project Activity includes the installation of a third condensing unit with maximum gross output to the
generator of 44 MW, and maximum net output to the grid of 42 MW (net accounting the ancillaries
consumption).
The third condensation unit was purchased by means of a turnkey EPC contract3 that includes basic and
detailed engineering, procurement, supply, onsite delivery, construction, installation, testing,
commissioning, and start-up of the turbine generator, as well as all ancillary equipment, mechanical and
electrical, and common facilities.
The new generating unit demanded the drilling of up to six additional production wells and four re-
injection wells. The wells were being drilled to depths ranging from 1,085 to 3,455 m and up to 12.25
inches in diameter4.
The geothermal fluid transportation system includes a two phase flow pipeline connecting production
wells to steam separators, the steam pipelines from separators to the plant area and the geothermal water
pipelines from plant area (cooling tower) to the re-injection wells.
The electricity produced by the synchronous generator is transformed from 13.8 kV to 115 kV at Berlin
electric substation before to be sent to the grid. The voltage and current transformers of the electricity
metering system are located at the 115 kV bus of the step-up substation that is the delivery point. The
instrument transformers send the voltage and current signals to the main and secondary electricity meters
located in the control room of the power plant.
Due to the fact that not all the mass extracted from the reservoir is re-injected in the underground, the
reservoir pressure and temperature will slightly decrease along with the exploitation of the geo-resource.
The expected plant lifetime of the project activity is estimated on 30 years based on geothermal industry
references5. Lifetime and recoverable reserves of a conventional geothermal field are governed by three
resource factors: rock temperature, presence of a strong geothermal aquifer, and sufficient permeability to
allow viable natural steam production. The energy stored in the hot rock bed is extracted by the
geothermal aquifer, which acts as the natural heat exchange medium.
Geothermal power technologies employed by the Project Activity have been established in relatively few
countries. Most geothermal development (more than 90% of worldwide installed capacity) is in the US,
the Philippines, Mexico, Italy, Japan, Indonesia and New Zealand (IEA, 2003). More recent, Asia and
Central and South America have shown particularly strong growth in relative terms since technologies
used for the projects are becoming more financially secure and safer. Technology also gets
environmentally safer as long as countries spend resources in technical issues such as: exploration
techniques, resource assessment, field development, reservoir development techniques, and power
generation technology (IEA, 2003). El Salvador and its private sector, such as the project participant, has
been researching and developing geothermal technologies for many years through local studies and/or
transferring knowledge from other countries. Geothermal wells, whether exploration or production, are
3 Turnkey: a form of delivery of a total process design, supply, construction, commissioning and start-up of a project
to specific performance requirements. EPC contract: a contract for the engineering, procurement and construction
of a facility - the implementation contractor provides all engineering, supply and construction works. 4 The number of constructed wells varies with regard to the number of the estimated wells during the design stage.
The original project required 10 wells to produce 44 MW according to the average production of the power plant-
phase I. Finally, 6 production wells were constructed to achieve the goals of the project because the TR-18A well
resulted higher productive than the initial estimation. On the other hand, the number of reinjection wells varied
from 3 to 4, and the depth of the wells in relation to design, happened to be more considerable due to the fact that
the impermeable substrates were found a long way below and therefore increased the complexity of the
construction. 5 Geothermal Energy Association, Geothermal Basics, section 8.6, http://geo-
energy.org/geo_basics_plant_cost.aspx#gas_coal.
UNFCCC/CCNUCC
CDM – Executive Board Page 6
drilled using rotary drilling technologies adopted largely from the oil industry, and to a lesser extent from
water and mineral exploration (World Bank, 2005). These have been modified to cater for the
significantly higher temperatures and rock formation characteristics encountered. The drilling fluid used
is water-based in order to avoid groundwater contamination. Wells are drilled in a series of stages, with
each stage being of smaller diameter than the previous stage, and each being secured by steel casings,
which are cemented in place prior to drilling the subsequent stage. The final production sections of the
well are secured by a cemented, perforated liner. The design of a typical geothermal well, may be vertical
(straight) or deviated (directional).
A.4. Parties and project participants
Detailed contact information on party (ies) and private/public entities involved in the Project Activity is
listed in Annex 1.
Party involved
(host) indicates a host Party
Private and/or public
entity(ies) project participants
(as applicable)
Indicate if the Party involved
wishes to be considered as
project participant (Yes/No)
El Salvador
LaGeo, S. A de C.V. No
A.5. Public funding of project activity
No public funding was and will be used in the Project Activity.

UNFCCC/CCNUCC
CDM – Executive Board Page 7
SECTION B. Application of selected approved baseline and monitoring methodology
B.1. Reference of methodology
The Project Activity uses the approved methodology: Consolidated baseline methodology for grid-
connected electricity generation from renewable sources (ACM0002, version 14.0.0).
As well as the following methodological tools referred by the ACM0002 (version 14.0.0):
Tool to calculate the emission factor for an electricity system (version 04.0).
And the following standard, guidance and guidelines drew upon by the version of the tools used:
Clean Development Mechanism Project Standard, version 05.0
Guidance on IPCC default values, EB 25, paragraph 59.
Guidelines for the reporting and validation of plant load factors (version 01).
Guidance related to monitoring requirements, EB 23, paragraph 24.
B.2. Applicability of methodology
The chosen methodology is applicable to grid-connected renewable power generation projects, under the
condition of electricity capacity additions from geothermal sources, as is the case of the Project Activity.
Table 1. Analysis of ACM0002 (version 14.0.0) applicability
Applicability conditions according to
ACM0002 (version 14.0.0) and referred
tools
Are the
criteria
met?
Justification
The Project Activity is the installation,
capacity addition, retrofit or replacement of a
power plant/unit of one of the following types:
hydro power plant/unit (either with a run-of-
river reservoir or an accumulation reservoir),
wind power plant/unit, geothermal power
plant/unit, solar power plant/unit, wave power
plant/unit or tidal power plant/unit;
Yes The Project Activity is the capacity
addition of a new power unit (the new
power unit includes geothermal wells,
steam conveyance system, generation
units, electrical substation and the
electricity metering system) beside to
an existent power plant.
In the case of capacity additions, retrofits or
replacements (except for capacity addition
projects for which the electricity generation of
the existing power plant(s) or unit(s) is not
affected): the existing plant started
commercial operation prior to the start of a
minimum historical reference period of five
years, used for the calculation of baseline
emissions and defined in the baseline emission
section, and no capacity addition or retrofit of
the plant has been undertaken between the start
of this minimum historical reference period
and the implementation of the Project Activity;
Yes The existent power plant started
operations in 1992, which was
retrofitted in 1999. These events
occurred prior to the start of a
minimum historical reference of five
years and not capacity additions have
been undertaken between the start of
this minimum historical reference
period and the implementation of the
Project Activity.

UNFCCC/CCNUCC
CDM – Executive Board Page 8
In case of hydro power plants, one of the
following conditions must apply:
o The Project Activity is implemented in
an existing single or multiple reservoirs,
with no change in the volume of any of
reservoirs; or
o The Project Activity is implemented in
an existing single or multiple reservoirs,
where the volume of any of reservoirs is
increased and the power density of each
reservoir, as per the definitions given in
the Project Emissions section, is greater
than 4 W/m2; or
o The Project Activity results in new
single or multiple reservoirs and the
power density of each reservoir, as per
the definitions given in the Project
Emissions section, is greater than
4 W/m2.
Not
applicable
The Project Activity does not comprise
a hydro power plant.
The methodology is not applicable to the
following:
o Project activities that involve switching
from fossil fuels to renewable energy
sources at the site of the Project
Activity, since in this case the baseline
may be the continued use of fossil fuels
at the site;
o Biomass fired power plants;
o Hydro power plants that result in new
reservoirs or in the increase in existing
reservoirs where the power density of
the power plant is less than 4 W/m2.
Not
applicable
o The Project Activity does not
involve switching from fossil fuels
to renewable energy sources at the
site of the Project Activity.
o The Project Activity is not a
biomass fired power plants.
o The Project Activity does not result
in a new reservoir or in the increase
in existing reservoirs.
In the case of retrofits, replacements, or
capacity additions, this methodology is only
applicable if the most plausible baseline
scenario, as a result of the identification of
baseline scenario, is “the continuation of the
current situation, that is to use the power
generation equipment that was already in use
prior to the implementation of the project
activity and undertaking business as usual
maintenance”.
Yes The baseline scenario of the project
Activity is the continuation of use of
the current equipment (units 1 and 2 of
the Berlin Geothermal Plant) without
any investment and undertaking
business as usual maintenance.
In addition, the applicability conditions
included in the tools referred in the ACM0002
(version 14.0.0) apply.
Yes
Tool to calculate the emission factor

UNFCCC/CCNUCC
CDM – Executive Board Page 9
Tool to calculate the emission factor for an
electricity system (version 04.0)
o This tool may be applied to estimate the
OM, BM and/or CM when calculating
baseline emissions for a Project Activity
that substitutes grid electricity, i.e.
where a Project Activity supplies
electricity to a grid or a Project Activity
that results in savings of electricity that
would have been provided by the grid
(e.g. demand-side energy efficiency
projects).
o Under this tool, the emission factor for
the project electricity system can be
calculated either for grid power plants
only or, as an option, can include off-
grid power plants. In the latter case, the
conditions specified in “Appendix 2:
Procedures related to off-grid power
generation” should be met. Namely, the
total capacity of off-grid power plants
(in MW) should be at least 10 per cent
of the total capacity of grid power plants
in the electricity system; or the total
electricity generation by off-grid power
plants (in MWh) should be at least 10
per cent of the total electricity
generation by grid power plants in the
electricity system; and that factors which
negatively affect the reliability and
stability of the grid are primarily due to
constraints in generation and not to other
aspects such as transmission capacity.
o In Case of CDM projects the tool is not
applicable if the project electricity
system is located partially or totally in
an Annex-I country.
for an electricity system (version
04.0)
o The Project Activity supplies
electricity to a grid substituting
grid electricity.
o The emission factor for the
project electricity system is
calculated for grid power plants.
o The project electricity system is
not located in an Annex-I
country.
The applicability conditions included in the
Tool to calculate project or leakage CO2
emissions from fossil fuel combustion (version
02), referred in the ACM0002 (version 14.0.0),
does not apply.
o It can be used in cases where CO2
emissions from fossil fuel combustion
are calculated based on the quantity of
fuel combusted and its properties.
Not
applicable The Project Activity does not use fuels
for electricity production.
UNFCCC/CCNUCC
CDM – Executive Board Page 10
B.3. Project boundary
The project boundaries are defined by the emissions targeted or directly affected by the project activities,
construction and operation. It encompasses the physical, geographical site of the geothermal wells
(extraction and re-injection) and power generation. The produced electricity will be fed into the grid and
therefore the boundary includes the Salvadorian national grid.
Monitoring parameters
wsteam,CO2
wsteam,CH4
Msteam,y
EGFacility
Figure 3. Boundaries of the Project Activity
Geothermal is a renewable clean energy source that directly generates no emissions. Nevertheless, there
are fugitive emissions of carbon dioxide and methane due to release of non-condensable gases from
produced steam. The Project Activity does not generate greenhouse gases from combustion of fossil
fuels for electricity production.
Indirect on-site emissions are those from changes in the production of energy in other facilities. The
presence of the geothermal plant will change the operating pattern of plants dispatching to the local grid.
However, this is beyond the control of the project developer. Indirect off-site emissions, like shifts in
demand of electricity or import/export will not be taken into account in the quantification of emissions, as
these are very difficult to measure and are not within the control of the project developer.
Gri
d
PTs & CTs
for
electricity
metering
Turbine Gen
Reinjection
wells
Humidity
separator
(demyster)
Auxiliary services
Electric substation
Reinjection
well
Cyclonic
separator
Production
wells
Bi-phase fluid
Steam
Water
Electricity
EGFacility
wsteam,CO2
wsteam,CH4
M
steam,y
UNFCCC/CCNUCC
CDM – Executive Board Page 11
Source GHGs Included? Justification/Explanation B
ase
lin
e sc
enari
o Source 1
CO2 emissions from
electricity
generation in fossil
fuel fired power
plants that are
displaced due to the
Project Activity
CO2 Yes According to ACM0002 is a main emissions
source. GHG in the baseline are due to fossil
fuel fired plants connected to the grid.
CH4 No According to ACM0002 is a minor emissions
source.
N2O No According to ACM0002 is a minor emissions
source.
Pro
ject
sce
nari
o
Source 1
Fugitive emissions
of CH4 and CO2
from non-
condensable gases
contained in the
geothermal steam.
CO2 Yes According to ACM0002 is a main emissions
source.
CH4 Yes According to ACM0002 is a main emissions
source
N2O No According to ACM0002 is a minor emissions
source.
Source 2
CO2 emissions from
combustion of fossil
fuels for electricity
generation in solar
thermal power
plants and
geothermal power
plants
CO2 No
It is not included because the Project Activity
does not use fossil fuel for electricity
generation.
CH4 No
It is not included because the Project Activity
does not use fossil fuel for electricity
generation.
N2O No
It is not included because the Project Activity
does not use fossil fuel for electricity
generation.
B.4. Establishment and description of baseline scenario
The baseline at the time of PDD registration was stated as:
“The Project Activity, a greenhouse gas (GHG) free power generation project, will result in GHG
emissions reductions as the result of the displacement of electricity generation from fossil-fuel thermal
plants that would have otherwise dispatched to the grid.
The baseline emission factor for the Project Activity is calculated as a combined margin of the operating
and build margin emission factors. For the purpose of determining the build and the operating margin
emission factors, the project electricity system is defined by the spatial extent of the power plants that can
be dispatched without significant transmission constraints. Similarly, the connected electricity system is
defined as an electricity system that is connected by transmission lines to the project electricity system
and in which power plants can be dispatched without significant transmission constraints (Salvadoran
interconnected grid)”.
The version 0.3.0.0 of the methodological tool “Assessment of the validity of the original/current baseline
and update of the baseline at the renewal of the crediting period” is used to assess the continued validity
of the baseline and to update the baseline at the renewal of a crediting period.
Step 1: Assessment of the validity of the current baseline for the next crediting period
UNFCCC/CCNUCC
CDM – Executive Board Page 12
Step 1.1: Assessment compliance of the current baseline with relevant mandatory national and/or
sectoral policies
Relevant mandatory national and sectoral policies which have come into effect after the submission of the
project activity for validation, and that affect the Project Activity, are reviewed below:
The National Energy Policy for the 2010-2024 term6 seeks to promote the energy renewable
sources in order to diversify the energy matrix in El Salvador
The Fiscal incentives Law is intended to promote the use of renewable resources for the
electricity generation. It entered into force in December 28, 2007 for new investment projects,
which occurred after the starting date of the first crediting period of the Project Activity.
Because geothermal projects are not mandatory and the investment in fuel based technologies is not limited, in the absence of the CDM project activity, the existing facility would continue to supply electricity to the grid at historical levels, until the time at which the generation facility would likely be replaced or retrofitted (DATEBaselineRetrofit). From that point of time onwards, the baseline scenario is assumed to correspond to the project activity, and no emission reductions are assumed to occur. This is a likely scenario in compliance with the relevant mandatory national and/or sectoral policies.
Step 1.2: Assessment of the impact of circumstances
Because the Project Activity consists of the capacity addition of an existing grid-connected renewable
power plant, the baseline scenario has to be reassessed based on the ACM0002 methodology, version
14.0.0 as follow:
“In the absence of the CDM Project Activity, the existing facility would continue to supply electricity to
the grid at historical levels, until the time at which the generation facility would likely be replaced or
retrofitted (DATEBaselineRetrofit). From that point of time onwards, the baseline scenario is assumed to
correspond to the Project Activity, and no emission reductions are assumed to occur”.
Step 1.3: Assessment of the continuation of use of current baseline equipment(s) or an investment is the
most likely scenario for the crediting period for which renewal is requested.
The updated baseline scenario of the Project Activity is the continuation of use of the current equipment
(units 1 and 2 of Berlín Geothermal Plant) without any investment. Units 1 and 2 of Berlín Geothermal
Plant, that started commercial operations in 1999, have and typical lifetime of approximately 30 year as is
recognized in the geothermal industry7. Hence the technical life of the existent equipment exceeds the
crediting period for which renewal is requested.
Step 1.4: Assessment of the validity of the data and parameters
The emission factor of the grid is updated because has to be recalculated using the most recent
information of the national grid and the most recent IPCCC default values.
In addition, the parameters based in historical data for baseline emissions calculation are calculated due to
the baseline scenario is reassessed.
Step 2: Update the current baseline and the data and parameters
The baseline emissions for the second crediting period are recalculated taking in consideration the
reassessment of the scenario baseline.
6 Consejo Nacional de Energía (Energy National Council), Política Nacional de Energía (Energy National Policy),
page 24. 7 Geothermal Energy Association, Geothermal Basics, section 8.6.
UNFCCC/CCNUCC
CDM – Executive Board Page 13
Step 2.2: Update the data and parameters
The data and parameters are updated taking in consideration the reassessment of the scenario baseline and
the ACM0002 (version 14.0.0).
B.5. Demonstration of additionality
The project fulfils all the “additionality” prerequisites (see application of the “tool for the demonstration
and assessment of additionality8”, hereafter referred to simply as “additionality tool,” in item B.3)
demonstrating that it would not occur in the absence of the CDM.
The Project Activity will result in the reduction of greenhouse gases that would not occur if the project
was not executed. The Project Activity faces numerous barriers and risks associated with the
implementation, which is clearly elaborated below. These conditions demonstrate that the proposed
Project Activity is not the baseline as usual scenario.
The “additionality tool” has been applied in conjunction with ACM0002 to describe how the
anthropogenic emissions of GHG are reduced below those that would have occurred in the absence of the
Project Activity. The additionality tool provides a general step-wise framework for demonstrating and
assessing additionality. These steps, numbered from 0 to 5, include:
0. Preliminary screening
1. Identification of alternatives to the Project Activity
2. Investment analysis AND/OR
3. Barrier analysis
4. Common practice analysis
5. Impact of CDM registration
The application of the additionality tool to the Project Activity follows.
Step 0. Preliminary screening based on the project start date.
A previous development of the existing Berlin Geothermal Field, the “El Salvador Geothermal Energy
Project,” was submitted in 2001 by GESAL9 to the Dutch Government CERUPT
10 tender. The project
objective was to generate electricity (5 MW installed capacity) using hot fractured rock technology. The
project was selected in a preliminary phase of the tender but it was finally not implemented. Later on the
idea of using the geothermal potential of the Berlin Geothermal Field was further developed resulting in
the Project Activity.
As it can be seen in the first version of the Project Activity schedule, the feasibility study for the Project
Activity started in May 2000. Nevertheless the final revision of the feasibility study and decision to
proceed or not with the Project would be carried out throughout the year of 2002.
The incentive of the CDM was seriously considered since the beginning of the Project Activity’s
feasibility study. During the year of 2002 an extensive exchange of information occurred between the
project sponsors, PCF11
and MARN12
about the Project Activity. Documents produced in the period
include draft Project Idea Notes and a Baseline Study of the project submitted to CERUPT. The following
8 Tool for the demonstration and assessment of additionality. UNFCCC, CDM Executive Board 16th Meeting
Report, 22 October 2004, Annex 1. 9 From the Spanish GEotérmica SALvadoreña, today’s LaGeo.
10 Certified Emission Reduction Procurement Tender closed on January 31, 2002 and organized by the Dutch
governmental agency Senter. 11
World Bank’s Prototype Carbon Fund, for simplicity referred hereafter simply as PCF. 12
El Salvador’s Ministry of Environment and Natural Resources (MARN from the Spanish Ministerio del Medio
Ambiente y Recursos Naturales) the Designated National Authority for the CDM.
UNFCCC/CCNUCC
CDM – Executive Board Page 14
two correspondences demonstrate that the incentive of the CDM was considered before the decision to
proceed with the project:
In August 15, 2001, Mr. Mauricio Ayala, from MARN, initiated the contact with Mr.
Ruben Loy (from GESAL, today’s LaGeo) regarding the submission of potential renewable
energy projects from GESAL in El Salvador under the Clean Development Mechanism. One
of the project ideas was the development of the Berlin Geothermal Field, then with an
estimated 56 MW capacity addition. At that time, a portfolio of potential CDM projects were
under development by the Central American Commission on Environment and Development
to be presented at the Nordic Council of Ministers Meeting, to be held from August 20 to 25 in
Finland.
In January 24, 2002, Mr. Eduardo Dopazo (PCF associate) sent an e-mail message to his
colleagues (Mr. Ken Newcombe, Mr. Jari Vayrynen, Ms. Odil Tunali Payton and Mr. Charles
Cormier), to Mr. Mauricio Ayala, and to Mr. Ruben Loy, reporting the meeting with Mr. Loy
during a visiting mission to El Salvador. In the report three likely eligible geothermal project
developments under the CDM are mentioned. The Project Activity was one of them.
Copies of the various documents and e-mail messages exchanged, including the two above mentioned, are
available upon request.
The project participants consider that the above information alone provides sufficient evidence that the
CDM was seriously considered in the decision to proceed with the Project Activity.
Step 1. Identification of alternatives to the project activity consistent with current laws and Regulation.
Sub-step 1a. Define alternatives to the project activity.
The identified realistic alternative to the project activity are:
Continuation of the present scenario (use of grid electricity to supply El Salvadoran energy
requirements, actually, the alternative is the baseline scenario) or,
The implementation of the project without incentives from the CDM.
Sub-step 1b. Enforcement of applicable laws and regulations.
2. The alternatives are in compliance with all applicable legal and regulatory requirements.
3. Non-applicable (the alternatives are in compliance with all applicable legal and regulatory
requirements).
4. The Project Activity and the alternative scenarios are in compliance with the legal and regulatory
requirements.
Step 2. Investment Analysis
Not applicable.
Step 3. Barrier Analysis.
To substantiate the barrier analysis, a brief overview of the El Salvadoran electricity market in the recent
past is presented first.
Regulatory Framework
The electricity sector in El Salvador is regulated by the 1996 General Law of Electricity Power13
and the
creation of the Electricity and Telecommunications Agency14
(SIGET, from the Spanish Superintendencia
General de Electricidad y Telecomunicaciones). SIGET is responsible for ensuring compliance with all
13
Ley General de Electricidad, Decreto Legislativo No 843 del 10 de Octubre de 1996.
14 Ley General de Creación de la SIGET, Decreto Legislativo N
o 808 del 12 de Septiembre de 1996.
UNFCCC/CCNUCC
CDM – Executive Board Page 15
applicable laws and regulations. It is an autonomous organization headed by a presidential-appointed
“General Superintendent” (serving a seven-year term), and two directors, of which one is appointed by
the Supreme Court and the other by the private sector. The restructuring of the electric industry in El
Salvador has as key objective the creation of an open and competitive electric market. The Electricity
Law regulates generation, transmission, distribution, and trading of electricity. Competition is fostered
through fully competitive markets in generation and trading. Under the Electricity Law, the state owned
CEL15
was obliged to restructure its generation and transmission assets. In particular, by November 1999
maintenance of the transmission lines and operational control of the network had to be conducted by
separate entities and a structural change of ownership of the generating assets had to be accomplished. In
October of 1998 CEL established Empresa Transmisora de El Salvador, S.A. de C.V. (ETESAL),
responsible for maintenance of the national grid, operating independently since the end of 1999. The law
does not restrict vertical or horizontal ownership within the electric industry except that no company
involved in the generation, distribution or trading of electricity may own shares in ETESAL.
In 2001, the Dirección de Energía Eléctrica, (Department of Electric Energy) was created. The
department is part of the Ministry of Economy. The Department’s function is to look after the efficient
operation of the activities of generation, transmission, distribution and commercialization of electric
power, by means of setting National Policies.
Power Pricing
The Electricity Law provides for a Wholesale Electric Market (WEM) administered by the Unidad de
Transacciones (UT, Transactions Unit). The WEM consists of a bilateral Contract Market based on
predetermined contracts between operators for the supply of electricity and the Mercado Regulador del
Sistema (MRS, Spot Market Regulation System) operated by UT.
The function of the MRS is to resolve congestion and to maintain system balance based on bids from
market participants specifying prices at which they will buy or sell additional energy. UT is responsible
for operating the transmission system and maintaining system security, and has primary responsibility for
operating the WEM and coordinating the dispatch of energy from generating plants. UT cannot buy or
sell energy for its own account.
The UT was established as a corporate entity in April 1998 and is in operation since September 1998.
According to the electricity law, shareholders are drawn from transmission companies, generators,
distributors and large users who are connected directly to the transmission network with a total nominal
capacity demand in excess of 5MW. Payments are calculated at the MRS-price according to variances
between each participant’s supply or consumption of energy and the scheduled dispatch. The calculated
MRS-price is set as follows:
Distributors or Large Users whose consumption differs from scheduled consumption are
paid or charged for the difference at the MRS price of energy;
Generators that produce more than scheduled are reimbursed for the difference at the
MRS price;
Generators that produce less than scheduled are charged for the difference at the price of
the energy purchased to replace the energy that was not supplied; and
Where a plant generates less than scheduled as a result of a transmission failure, the
transmission company is charged by the Transactions Unit for the difference between the
cost of the replacement energy and the value of the energy supplied to the MRS by the plant
concerned.
The UT calculates the balance of each participant and manages settlements.
Prices during the dry season tend to be higher (fossil-fuelled generation dominated) than in the wet season
(hydro generation dominated). In contrast to other Latin American countries, the wholesale electricity
15
Hydroelectric Company of the Lempa River (CEL from the Spanish Hidroeléctrica del Río Lempa), which controlled
generation, transmission and distribution of electrical energy in El Salvador before privatization.
UNFCCC/CCNUCC
CDM – Executive Board Page 16
market does not provide for any explicit or regulated capacity payment nor does it establish a merit order
for dispatch. Contracts are dispatched irrespective of the underlying electricity costs. Investment returns
for new entrants (and existing generators) are a function of pricing trends in the MRS market as
established by the bidding system and bilateral contract negotiation. All market participants defray the
operating costs of the Transaction Unit in proportion to the energy supplied or received.
Sub-step 3a. Identify barriers that would prevent a wide spread implementation of the proposed project
activity.
There is a set of identified barriers to the development of renewable sources of energy in El Salvador. The
ones specifically applicable to geothermal projects under competitive markets (with wholesale markets of
electricity), as it is the El Salvadoran case, are presented below.
1. Technical barriers, “inter alia”:
i. Insufficient information on the resources of renewable energies. The lack of reliable
data is a problem. The project sponsor has to make considerable investments to evaluate
the possible resource, for example, in geothermal studies and exploratory well
perforation, of course, without guarantee of success. The barrier increases the uncertainty
on the availability and quality of the resource, increases its financial risk and, therefore,
has a considerable impact in the evaluation of the project and in the guarantees demanded
by the financial institutions.
ii. Geothermal plants are not recognized as elements of regulation of voltage and reducing
of losses. Although geothermal projects, as well as hydroelectric ones, usually are located
at one of the ends of the interconnected electricity grid contributing to regulate
transmission voltage and reducing transmission losses, these benefits are simply not
considered, especially in the cases of countries, such as El Salvador, with liberalized and
competitive markets, I other words, essentially price based merit.
2. Investment barriers, “inter alia”:
iii. As the economics of geothermal energy extraction are highly variable and wide
ranging…high upfront risks to initial investigation to prove reserves. Diesel powered
generation plant capital costs, for example, are typically less than 50% of the cost of
geothermal plant (World Bank, 2005).
iv. Free market and tariffs depend only on marginal price of power. Electricity price
volatility in El Salvador is high. Price is determined by the marginal generation, which
during the summer is mostly occupied by thermal fossil fuel plants (highest price season
supplied by private generators); and during winter by hydropower generation (lowest
price season supplied by state-owned generation). Geothermal generation is practically
never at the margin. Due to this, prices of the spot market can hardly sustain/guarantee
new investments. In addition, due to the lack of long-term contract offers, medium-
capacity projects have no alternative other than the spot market as reference. This
situation makes renewable projects cash flow very uncertain and limits the projects’
financing possibilities. In addition, although expected to function as free market, there
have been signals that may anticipate government intervention towards changing market
rules and tariff mechanism, situation that increases investment risk
v. Higher transaction costs for renewable energy projects. Geothermal energy projects
face relatively greater costs of development than the conventional thermal projects using
fossil fuels. The reasons are explained mainly because though many of the projects of
renewable energies are small, they must fulfill the same set of proceedings of larger
conventional projects. Despite the good will of the government, environmental impact
UNFCCC/CCNUCC
CDM – Executive Board Page 17
assessment of conventional thermal generation projects is simpler than of a geothermal
project. In order to obtain licenses of installation and operation from the Ministry of
Environment, LaGeo had to carry out complex technical evaluations given the nature of
infrastructure works and the project’s impacts (opening of roads, construction of drilling
sites, handling of wastes, etc.). Therefore, the project must go through difficult, more
expensive and longer bureaucratic process than those required for conventional thermal
power generation. The procedures to obtain environmental and operation licenses are
highly more cumbersome than, for example, for fossil-fuelled power generation. One of
the major reasons is that the thermal projects do not need to bid on the concession of the
area
3. Regulatory barriers, “inter alia”:
vi. Relative regulatory uncertainty makes projects depending on long-term returns
less attractive. Example of uncertainty is an approved law (Decreto No 1216, Reformas a
la Ley General de Electricidad) issued in April 10, 2003 to implement caps on prices that
it is until today not regulated. As a geothermal generator is a price taker this law does not
affect LaGeo at all.
vii. Lack of long-term contracts (PPA or power purchase agreements). The El
Salvadoran market is regulated to guarantee (and to bid) the demand only for the
following 24 months (there is no regulation for longer term contracts). Business as usual
is to sign one-year agreements. As explained above, renewable energy projects, like the
Project Activity, are more capital intensive, i.e. they have to capitalize the means used to
tap their energy resources in advance and, therefore, have higher financing requirements.
This model requires from the project sponsor the management of a credit portfolio,
something that needs a different sort of expertise from that of running a renewable energy
business.
viii. There is no specific incentive for renewable or indigenous sources of energy. All
existing incentives for power generation are equally applicable to any source of energy
(including imported and polluting ones like fuel oil and coal). All other countries in
Central America have some kind of incentives to support the development of renewable
energy sources.
ix. There are no policies or plans that look at diversifying available mix of sources of
energy for power generation.
4. Institutional barriers, “inter alia”:
x. Power authorities do not recognize specific renewable energy project benefits. Many of
the benefits derived from developing renewable energy projects are not directly reflected
on the price of generated electricity. Energy sector planners and decision-makers do not
factor in various indirect benefits such as development of poor regions, environmental
conservation, cleaner power, energy decentralization, or generation of local productive
chains. Authorities are normally not aware of these positive aspects but mostly concerned
with the higher cost that renewable energy has vis-à-vis conventional energy sources.
Therefore, these benefits (positive externalities) are not internalized in the price of the
electricity, and are not properly weighted in public policies.
5. Other barriers, “inter alia”:
xi. Unfounded social bias against geothermal plants. In spite of their inherent
environmental value, communities are reluctant to accept the implementation of
geothermal facilities due to the unjustified fear of groundwater contamination. Although
UNFCCC/CCNUCC
CDM – Executive Board Page 18
extracted from an aquifer, groundwater never comes in contact with pollutant
components, and thus, there is no actual risk of contamination. Groundwater is either
returned to the aquifer or is discharged at ground surface. From an environmental
perspective it is desirable to re-inject the groundwater so that reductions in the water table
do not occur. Local communities usually express concerns regarding superficial water
(contamination and warming), gas releases, and local climate change.
xii. Lack of actual market competition. In reality there are only four major companies
involved in electricity generation in El Salvador: These are: El Paso (thermal fossil-
fuelled generation), Duke (fossil-fuelled), CEL (hydro), LaGeo (geothermal).
Distribution, on the other hand, is controlled by AES (a large US power company).
Regulation and operation are determined by UT that has considerable authority for the
system that coordinates, which is vulnerable to influences exerted by the main generators
(main shareholders). Decisions at UT are defined according to the generation share of
participation, which was defined according to the installed capacity at the time of UT’s
establishment. No change in the participation was forecasted (not even due to grow or
changes in the installed capacity). Government is considering changing the participation
share to one vote per company. This will provide a more level plain field in terms
opportunities for non-fossil fuels energy sources.
Sub-step 3 b. Show that the identified barriers would not prevent the implementation of at least one
of the alternatives.
As described above, the main alternative to the Project Activity is continuing the current situation without
the expansion. The project sponsor could invest its resources in various different investments, mainly in
the financial market, with much lower uncertainty and risks. So the barriers above would not affect the
investment in any of the alternatives.
Step 4. Common practice analysis
Sub-step 4a. Analyze other activities similar to the proposed project:
The installed capacity in El Salvador in 2004 was 1,087 MW (45.9% of which are thermal power plants
using fossil fuels, 39.5% hydropower projects and the remaining 14.5% are geothermal. Regarding
electricity generation in 200416
, 39.2% of net electricity was supplied by fossil fuel fired power plants,
29.4% by hydroelectric, 20.7% by geothermal power generation, with the remaining 10.7% supplied by
imports, mostly fossil fuelled power generation from Honduras and Guatemala. From January 1999 to
September 2004 energy demand in El Salvador grew an average of 2.51% per year.
All hydropower plants are owned and operated by state-owned CEL. In the last 18 years only 33.9 MW of
installed capacity from hydro sources were added to the systems through repowering of existing power
plants.
There are two geothermal fields in El Salvador under operation, Ahuachapán (operation start of the last
unit in 1980) and Berlín (operation start of the last unit in 1999). Both plants were state-financed and
have a combined installed capacity of 165 MW.
The first step in privatizing the electricity generation sector (previously mostly owned and operated by
state owned Comisión Ejecutiva Hidroeléctrica del Río Lempa, CEL) took place in 1995 with the sale of
145 MW of fuel oil fired generating capacity. In 1999 the remaining fossil fuelled capacity
(approximately 400 MW) was sold to Duke Energy International. These plants have been retrofitted and
extended between 1998 and 2004.
16
Up to and including September, totalizing 3,425 GWh.
UNFCCC/CCNUCC
CDM – Executive Board Page 19
Since 2003 there is also a biomass power plant (CASSA, 20 MW installed capacity) with an availability
to export excess electricity to the grid. The plant operates only during the sugarcane season. Since start-up
the plant delivered a very small amount of energy to the grid - 10.3 GWh in 2003 (less than 0.3% of a
total of 4,460 GWh load) and 22.4 GWh in 2004 up to September (less than 0.7% of a total of 3,226 GWh
load).
Sub-step 4b. Discuss any similar options that are occurring
The most recent installed capacity addition using geothermal resources occurred in 1999.
Since 2000 fossil fuel fired power generation has dominated the El Salvadorian electricity market in terms
of installed capacity growth17
and in terms of market share. The growth owed to opportunities arising
from the privatization of the generation sector, and favorable market conditions such as lower capital
costs, easy start-up, shorter lead times for thermal projects using fossil fuels and internal combustion
engines in comparison with those of hydro- and geothermal power generation.
Also, in August 2004 the addition of 85 MW using fossil fuels was announced (Trujillo, 2004). The
capacity addition will be implemented in two different locations, Lourdes with 11.9 MW in the first
quarter of 2005 and, Acajutla with 73.6 MW and start at the end of 2005.
Step 5 – Impact of CDM Registration
The evolution of the installed capacity in the recent past clearly indicated that the investment in internal
combustion engines using fossil fuels is a more interesting option for the private sector. Reciprocating
engines, also called internal combustion engines, are a widespread and well-known technology.
Reciprocating engines range in size from a few kW to several MW. Advantages of reciprocating engines
include low capital costs, easy start-up, proven reliability, good load-following characteristics, and good
heat recovery. With compact modular engines the plants can be quickly expanded or even moved.
Applications in power generation include prime power generation, peak-shaving, back-up power,
premium power, remote power, and standby power.
As mentioned in step 0, the first attempt towards a more intensive use of the Berlin geothermal field was
developed in 2001 to be submitted to the CERUPT tender. It was already recognized then that the risks
involved in an investment in geothermal power generation required extraordinary incentives. Possible
financial benefits obtained from a long-term “emission reductions purchase agreement” (ERPA) attracted
the attention of investors to the planned expansion of 5 MW. In the beginning of 2002 the project was
selected under the CERUPT program. While developing the expansion the project investors realized that
the benefits from an ERPA could effectively help to overcome most of the barriers to implementing the
new geothermal Project Activity. Yet, although during COP-7 in 2001 it was agreed on a prompt start for
the CDM, with projects starting from 1 January 2000 being eligible for earning CDM credits (UNFCCC,
2001), the entry-into-force of the Kyoto Protocol was doubtful. At the time the emission reductions
“market” was precarious, and the activity was finally not developed. Nevertheless the experience
rendered further consideration of incentives derived from the CDM. However, it was only after the
approach of the Latin-American Carbon Program18
in 2002 offering to lower the risk through the CDM
investment component that the project participants decided to seriously consider a larger
entrepreneurship.
The Project Activity is the first geothermal project to be implemented by private initiative in El Salvador.
The benefit from the sale of CERs will provide a crucial economic benefit that allowed project
17
86.6% using fuel oil (CESSA, 30 MW in 2000, retrofitted to 33.3 in 2004; Acajutla, 144 MW, in 2001, retrofitted
to 151 in 2004; and Nejapa Power, 151.2 MW in 1998); 4.6% using diesel oil (Soyapango, 17.9 MW in 2003); and
8.8% using hydro resources (5 de Septiembre, 15 MW repotentiation in 2001-2002; and Cerron Grande, 18.9 MW
repotentiation in 2003). There was also an addition of a sugar mill power plant using biomass (CASSA, 20 MW in
2003) operating intermittently during the sugarcane season. 18
PLAC from the Spanish Programa Latino-Americano de Carbono, created by Corporación Andina de Fomento
(CAF) in 1999 with the objective of fostering participation and entry, of Latin American and Caribbean countries
in the evolving GHG emission reduction markets.

UNFCCC/CCNUCC
CDM – Executive Board Page 20
proponents to further evaluate the geothermal field potential. The approval and registration of the CDM
activity means that a solid and worldwide scrutinized project is able to secure a long term financial flow
through an ERPA. With a signed ERPA the project owners will be capable of sustaining the new
investment by overcoming higher transaction costs (higher upfront investments and consequently taxes)
and the absence of long-term power purchase agreements.
But the benefits cannot and will not be restricted to economic return but will also help to assure
sustainable development, for example, helping a renewable energy project to overcome barriers such the
failure to recognize the environmental benefits and social rejection. In the operation of the Project
Activity the extracted groundwater will be re-injected so that reductions in the water table do not occur.
The Project Activity also foresees a considerable investment in socio-economic benefits directed to the
local communities, such as capacity building courses, creation of jobs, construction and maintenance of
infra-structure, etc.
From the above the most likely conclusion is that the Project Activity (the Project Activity scenario)
would not be implemented without the incentive from the CDM and ultimately the registration of the
project. Also the most likely baseline scenario is the continuation of the present scenario, i.e., the use of
grid electricity to supply El Salvadoran energy requirements.
UNFCCC/CCNUCC
CDM – Executive Board Page 21
B.6. Emission reductions
B.6.1. Explanation of methodological choices
a. Calculation of the emission factor
According to the selected approved methodology (ACM0002, version 14.0.0, hereafter referred to as
ACM0002, V14), the emission factor (EFy) is calculated as a combined margin (CM), consisting of the
combination of operating margin (OM) and build margin (BM) factors, which is calculated following the
procedures established in the approved “Tool to calculate the emission factor for an electricity system”,
version 4.0. (Hereafter referred to as the Tool).
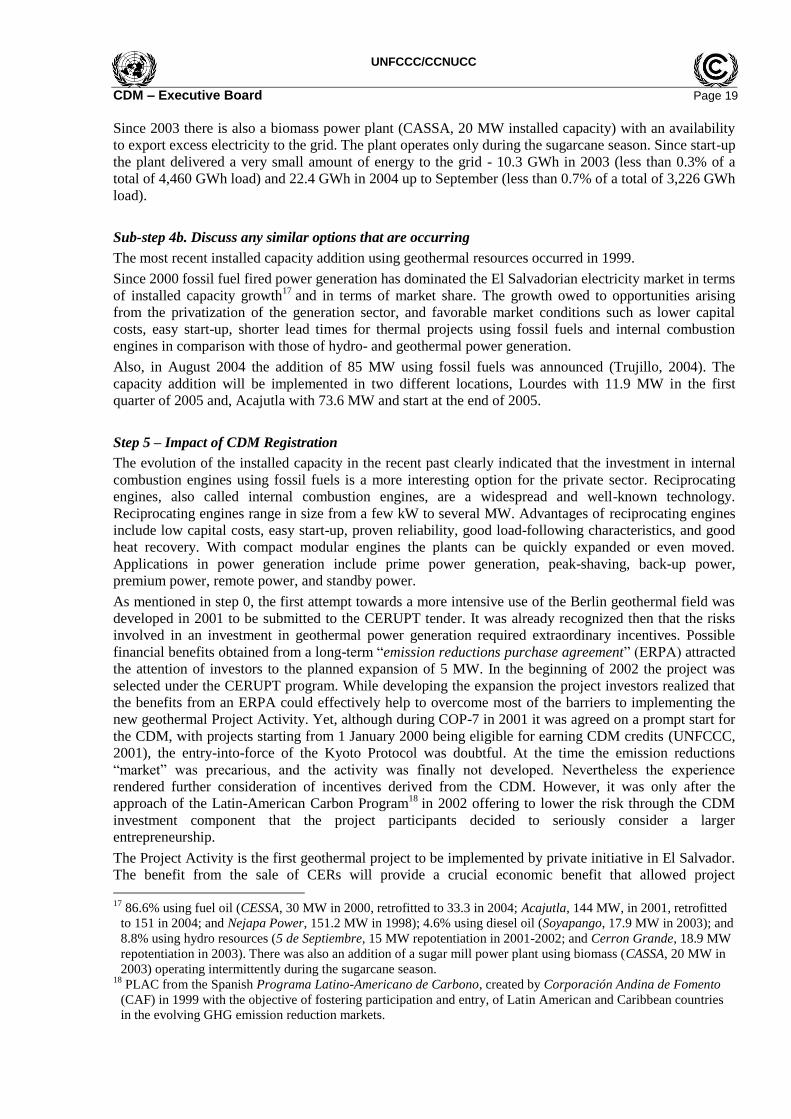
Step 1. Identification of the relevant electricity systems
El Salvador´s DNA has not published a delineation of the project electricity system; hence the national
grid is identified as the project electricity system.
The identified project electricity system is correct according to the Tool that defines it as the spatial extent
of the power plants that are physically connected through transmission and distribution lines to the Project
Activity and that can be dispatched without significant transmission constraints. Next graph shows a
schematic diagram of national grid of El Salvador that includes the transmission system and the grid-
power plants. Because the transmission system is extended along of the country, the geographical extent
of the project electricity system is the entire territory of El Salvador.
Figure 4. Generation and transmission system of El Salvador. Source: Unidad de Transacciones (Transactions Unit), One line diagram, http://www.ut.com.sv/web/guest/15
230 kV Substation
115 kV Substation
Geothermal power plant
Thermal power plant
Hydro power plant
Biomass power plant
Load
230 kV transmission line
115 kV transmission line
Electrical substations
Interconnection line with Nicaragua´s
electricity system
Interconnection line with Guatemala´s
electricity system
Interconnection to the grid of the
Project Activity
UNFCCC/CCNUCC
CDM – Executive Board Page 22
It is concluded that the grid-power plants connected to the project electricity system do not face
transmission constraints during normal operation conditions. All grid-power plants that participate in the
electricity market and present market offers are economically dispatched by the Transactions Unit
(Unidad de Transacciones, UT)19
as per the Regulations of the Transmission System and Electricity
Market. The evidences regarding to the reliability level of the transmission system show that the number
of transmission outages could be considered normal and not a limitation in the transmission system
operation. According to SIGET, the number of unplanned outages in the transmission system in 2011
was of 7120
.
On the other hand, the Tool defines the connected electricity system as the electricity system that is
connected by transmission lines to the project electricity system. In the case of El Salvador, the project
electricity system is interconnected to the national grids of the countries of Central America through the
Interconnection System for Central America and Mexico (Sistema de Interconexión Eléctrica para
Centroamérica, SIEPAC), therefore, the connected electricity system is formed by the electrical grids of
Guatemala, Honduras, Nicaragua, Costa Rica and Panama. Power plants within the grids of the connected
electricity system can be dispatched without significant transmission constraints because the systems of
each country are coordinated independently, while energy exports and imports are coordinated by the
Central America Market Operator (Ente Operador Regional, EOR)21
.
There are not legal restrictions for international electricity exchanges because there is a framework
agreement between the countries of Central America that set out a regional electricity market operated by
the EOR22
.
Step 2. Inclusion off-grid power plants in the project electricity system
Off-grid power plants are not included in the project electricity system; option 1 is chosen.
Step 3. Selection of a method to determine the operating margin
The method selected is the Simple adjusted OM method because low-cost/must run resources, including
CDM projects, constitute more than 50% of total grid generation on average for the five most recent
years. The low-cost/must run resources include hydro, geothermal and biomass (sugar cane bagasse)
power plants and the average electricity generation for the five most recent years is 3,376,200 MWh (61%
of the total historical generation).
Table 2. Composition of total grid generation (MWh)23
2008 2009 2010 2011 2012
Fuel based 2,011,700 2,362,500 1,970,300 2,134,400 2,367,100
Hydro 2,034,200 1,500,400 2,079,200 2,006,400 1,338,600
Biomass 105,200 161,000 179,900 157,900 204,700
Geothermal 1,421,000 1,420,800 1421200 1,430,000 1,420,500
Total 5,574,108 5,446,709 5,650,600 5,728,700 5,330,900
Renewables 3,560,400 3,082,200 3,680,300 3,594,300 2,963,800
% Renewables 64% 57% 65% 63% 56%
19
The Transactions Unit (Unidad de Transacciones, UT) is in charge of the transmission grid operation, the dispatch
of the power plants connected to the grid and the transactions in the whosale electricity market of El Salvador.
Transactions Unit´s web page, www.ut.com.sv : UT´s mission. 20
SIGET, Boletín de Estadísticas Electricas 2011 (Statistics Report 2011), page 110, table 47. 21
Transactions Unit´s web page, http://www.ut.com.sv/web/guest/14 : Sector information, hierarchical structure. 22 Ente Operador Regional (EOR), http://www.enteoperador.org/index.html# : MER regulations. 23
Unidad de Transacciones, UT (Transactions Unit) Statistical reports from 2008 to 2012, table 2.
UNFCCC/CCNUCC
CDM – Executive Board Page 23
It is selected the ex-ante option for data vintages. Because only grid-power plants are selected, 3-year
generation-weighted average is used for the calculation of the OM emission factor, based on the most
recent data available at the time of submission of the PDD to the DOE for validation.
The power plants registered as CDM project activities are included in the sample group that is used to
calculate the operating margin.
Step 4. Calculation of the Operating Margin emission factor according to the selected method
The simple adjusted OM method is calculated on the basis of the CO2 emission factor and net electricity
generation of each power unit connected to the grid; therefore option A of the simple OM calculation is
selected.
Assumptions:
Net electricity imports are considered low-cost/must-run units k.
For Operating Margin emission factor calculation, the emission factor of the imports is
considered equal to 0 tCO2 per MWh because the electricity imports come from connected
electricity systems in other countries of Central America.
For the ex-ante calculation of the OM emission factor, 2010, 2011 and 2012 data is used, based
on the most recent statistics available at the time of requesting the renewal of the crediting period. The set of power plants k, low-cost plants, are the hydroelectric, geothermal and cogenerating
power plants connected to the grid.
The set of power plants m comprises the remaining units.
The Operating Margin emission factor is calculated using equation 8 of the tool as the generation-
weighted average emissions per electricity units serving the system.
Where:
EFgrid,OM-adj,y = Simple adjusted operating margin CO2 emission factor in year y (t CO2/MWh).
λy = Factor expressing the percentage of time when low-cost/must-run power units are
on the margin in year y.
EFEL.m,y = CO2 emission factor of power unit m in year y and given in tCO2/MWh. It is
determined using Equation 3 of the Tool.
EFEL,k,y = CO2 emission factor of power unit k in year y and given in tCO2/MWh. It is
determined using Equation 3 of the Tool.
EGm,y
= Net quantity of electricity generated and delivered to the grid by power unit m in
year y (MWh). These data are obtained directly from the Statistical Reports
published on UT´s website.
EGk,y
= Net quantity of electricity generated and delivered to the grid by power unit k in the
year y (MWh). These data are obtained directly from the Statistical Reports
published on UT´s website.
k
yk
k
ykELyk
y
m
ym
m
ymELym
yyadjOMgridEG
EFEG
EG
EFEG
EF,
,,,
,
,,,
,, 1 Eq. 8 from the Tool
UNFCCC/CCNUCC
CDM – Executive Board Page 24
m = All grid power units serving the grid in year y except low-cost/must-run power
units. See appendix 4.
k = All low-cost/must run grid power units serving the grid in year y. See appendix 4.
y
= 2010, 2011 and 2012
The emission factor for the subset of power plants m and k, connected to transmission system (the grid), is
calculated as per option A2 of the simple OM method, stated in the Tool (paragraph 44), because it is not
known the amount of fuels consumed, only the amount of electricity production and fuel types. The
average CO2 emission factor of fuel type i is used for each generating unit and the default efficiencies, as
the following equation describes:
Where:
EFEL,m,y = Emission factor of power units m in year y, given in tCO2/MWh
EFCO2,m,i,y = Average CO2 emission factor of fuel type i, used in power unit m in year y, given in
tCO2/TJ.
3.6 = Energy conversion factor, given in TJ/MWh according to the International System Units.
ym, = Average net energy conversion efficiency of power unit m in year y (ratio).
m = All power units serving the grid in year y except low-cost/must-run power units.
y = 2010, 2011 and 2012
Default CO2 emissions factor for combustion at a low level of uncertainty are obtained from Table 1.4,
chapter 1, 2006 IPCC Guidelines for National Greenhouse Gas Inventories, where oxidation factor is
equal 1. The type of fuel for each power unit is obtained from the Unidad de Transacciones, UT
(Transactions Unit).
Table 3. Effective CO2 emission factors for fuel types used in El Salvador
tCO2/TJ
Diesel or fuel oil No. 5 72.6
Bunker or fuel oil No. 6 75.5
Bituminous coal 89.5
The efficiency factors for power units are considered confidential information in El Salvador, therefore
the default values from Annex I of the Version 04.0. of the Tool to calculate the emission factor for an
electricity system are used, which are indicated in next table. The efficiency factor is selected according
the operations starting year and technology of each generating unit from SIGET, Boletín de Estadísticas
Eléctricas 2011 (Electricity Statistics Report - 2011), Table 7.
EFEL m,,y = ym
yimcoEF
,
,,,2 6.3
Eq. 3 from the Tool
UNFCCC/CCNUCC
CDM – Executive Board Page 25
Table 4. Default efficiency factors for power plants
Generation technology Old units (before and
in 2000)
New units (after 2000)
Coal - -
Subcritical 37% 39%
Supercritical - 45%
Ultra-supercritical - 50%
IGCC - 50%
FBS 35.5% -
CFBS 36.5% 40%
PFBS - 41.5%
Oil - -
Steam turbine 37.5% 39%
Open cycle 30% 39.5%
Combined cycle 46% 46%
Natural gas - -
Steam turbine 37.5% 37.5%
Open cycle 30% 39.5%
Combined cycle 46% 60%
The denominators of the terms of the Operating Margin equation are:
m
ymEG ,
= The summation of electricity generation from each relevant power source m
(MWh), during the year y, expressed in MWh.
k
ykEG ,
= The summation of electricity generation from each relevant power source k
(MWh), during the year y, expressed in MWh.
Lambda is calculated as follow:
( ) Number of low cost/must-run sources are on the margin in year y hours per year
Eq. 9 from the Tool
Step (i) A load duration curve is plotted with the chronological generation data (load data +
transmission losses) (in MW) for each hour of the year y. The curve is plotted in descending
order, hours in axis x and MW in axis y. The information is obtained directly from UT; Step (ii) The total annual generation (in MWh) from low-cost/must-run grid-connected power plants is
calculated; Step (iii) The load duration curve is filled. A horizontal line across the load duration curve is plotted,
such that the area under horizontal line and the curve right from the intersection point (MW
times hours) equals the total generation (in MWh) from low-cost/must-run power plants/units;

UNFCCC/CCNUCC
CDM – Executive Board Page 26
Step (iv) The “Number of hours for which low-cost/must-run sources are on the margin in year y are
determined. First, the intersection of the horizontal line plotted in Step (iii) and the load
duration curve plotted in Step (i) is located. The number of hours (out of the total of 8760
hours) to the right of the intersection is the number of hours for which low-cost/must-run
sources are on the margin. If the lines do not intersect, then one may conclude that low-
cost/must-run sources do not appear on the margin and λ y is equal to zero.
Step 5. Calculation of Build Margin emission factor
The Build Margin emission factor represents the tendency of the mix of power generation and is
calculated similarly to the Operating Margin emission factor, considering the group of power units whose
generation is at least 20% of total generation.
Option 1 is selected respect to data vintages for the second and third crediting period. The build margin
emission factor is calculated ex-ante, including those units built up to the latest year for which
information is available. For the ex-ante calculation of the BM emission factor, 2012 data is used, based
on the most recent statistics available at the time of PDD submission.
Capacity additions from retrofits are not included.
The set of power plants selected for the build margin are selected according to the following premises: i. The set of five power units, excluding CDM project activities, which started to supply electricity
to the grid most recently, is identified. See tables of appendix 4. The power units registered as CDM project activities are excluded from the cohort of power
plants24
, these power plants are: Berlin Binary Cycle power plant
El Angel Cogeneration Project
Central Izalco Cogeneration Project
ii. The total annual generation of the project electricity system (AEGtotal), excluding CDM project
activities, is calculated.
iii. The build margin is calculated with the sample group of power plants/units used that consists of
the set of power plants in the electricity system that comprise 20% of the generation system and
have been built most recently. See appendix 4.
iv. The set of power plants that comprise 20% of the generation system is selected because have a
larger electricity generation than the group of the five power plants that started to supply
electricity to the grid most recently.
v. From the chosen group, power plants older than ten years are excluded and CDM projects are
included.
The build margin is calculated using the following equation:
Where:
24
UNFCCC, http://cdm.unfccc.int/Projects/projsearch.html
m
ym
m
ymELym
yBMgridEG
EFEG
EF,
,,,
,, Eq. 13 from the Tool
UNFCCC/CCNUCC
CDM – Executive Board Page 27
EFgrid,BM,,y = Building Margin CO2 emission factor in year y (t CO2/MWh)
EFEL,m,y = CO2 emission factor of power unit m in year y (tCO2/MWh). It is determined using
equation 3 according to option A2 of the Tool.
EGm,y = Net quantity of electricity generated and delivered to the grid by power unit m,
during the year 2012, given in MWh.
m = Power units included in the build margin
y = 2012
Step 6. Calculation of the combined margin emission factor
The emission factor of the electrical system is based on the weighted average CM method, as following
equation:
Where:
EFOM y = Operating Margin emission factor (t CO2/MWh)
EFBM y = Building Margin emission factor (t CO2/MWh)
wOM = Weighting of operating margin emissions factor (%)
wBM = Weighting of build margin emissions factor (%)
For the second and third crediting period, the default values are chosen for the weighting factors, wOM =
0.25 and wBM = 0.75.
The emission factor of the grid shall allow the calculation of the baseline emissions and the calculations
of the emissions reduced by the Project Activity.
b. Estimation of project emissions
As per version 14.0.0 of the ACM0002, project participants shall account the emissions described in the
following equation.
yGPyFFy PEPEPE ,, Eq. 1 from the ACM0002, V.14
Where:
yPE = Project emissions in year y (tCO2e/yr)
yFFPE , = Project emissions from fossil fuel consumption in year y (tCO2/yr)
yGPPE , = Project emissions from the operation of geothermal power plants due to the release of
non-condensable gases in year y (tCO2e/yr)
The procedure to calculate the components of the equation 1 of the methodology is:
a) Carbon dioxide emissions resulting from combustion of fossil fuels related to the operation of the
geothermal power plant
EF grid, CM, y (t CO2/MWh) = EF grid, OM, y wOM + EF grid, BM ,y wBM Eq. 14 from the Tool

UNFCCC/CCNUCC
CDM – Executive Board Page 28
There is no forecasted combustion of fossil fuels related to the operation of the project for electricity
production because the power unit is not equipped with an emergency diesel plant. Essential electrical
loads are supplied by batteries in case of an emergency, then:
0, yFFPE
b) Fugitive emissions of carbon dioxide and methane due to release of non-condensable gases from
produce steam
ysteamCHCHsteamCOsteamyGP MGWPywywPE ,44,2,, ),,( Eq. 2 from the ACM0002, V14
Where:
yGPE , are the project emissions due to release of carbon dioxide and methane from the produced
steam during the year y (in tCO2e)
yCHsteamyCOsteam ww ,4,,2, , are the average mass fractions of carbon dioxide and methane in the
produced (in tCO2/t steam and tCH4/t steam, respectively)
4CHGWP is the global warming potential of methane (default value = 25) valid for the second
commitment period (tCO2e/tCH4)
ySM , is the quantity of steam produced during year y (in t steam/year)
c. Estimation of leakages
According to the version 14.0.0 of the ACM0002, no leakage emissions are considered.
d. Calculation of baseline emissions
In accordance to the version 14.0.0 of the ACM0002, the baseline emissions are calculated as follows:
Eq. 6 from the ACM0002, V.14
Where:
yBE = Baseline emissions in year y (tCO2/yr)
yPJEG , = Quantity of net electricity generation that is produced and fed into the grid as a result
of the implementation of the CDM Project Activity in year y (MWh/yr)
yCMgridEF ,, = Combined margin CO2 emission factor for grid connected power generation in year y
calculated using the version 4.0 of the “Tool to calculate the emission factor for an
electricity system” (tCO2/MWh)
Because the Project Activity consists of a new geothermal power unit installed next to an existing
geothermal energy based power plant (units 1 and 2 of Berlin Geothermal Plant), EGPJ,y is calculated
using the option 1 of the ACM0002 methodology as follows:
)σ(EGEGEG historicalhistoricalyfacility,yPJ, ; until DATEBaselineRetrofit Eq. 8 from the ACM0002, V14
and
0EG yPJ, ; on/after DATEBaselineRetrofit
yCM,grid,yPJ,y EFEG BE
UNFCCC/CCNUCC
CDM – Executive Board Page 29
Where:
EGPJ,y = Quantity of net electricity generation that is produced and fed into the grid as a
result of the implementation of the CDM Project Activity in year y (MWh) EGfacility,y = Quantity of net electricity generation supplied by the project plant to the grid in
year y (MWh) EGhistorical = Annual average historical net electricity generation delivered to the grid by the
existing renewable energy plant that was operated at the project site prior to the
implementation of the Project Activity (MWh) σhistorical = Standard deviation of the annual average historical net electricity generation
delivered to the grid by the existing renewable energy plant that was operated at
the project site prior to the implementation of the Project Activity (MWh) DATEBaselineRetrofit = Point in time when the existing equipment would need to be replaced in the
absence of the Project Activity (date)
For EGhistorical determination, the option of five last calendar years prior to the implementation of the
Project Activity is selected as the analysis period.
e. Calculation of emission reductions
Emission reductions are calculated according to the version 14.0.0 of the ACM0002 methodology as
follow:
yyy PEBEER Eq.11 from the ACM0002, V14
Where:
yER
= Emission reductions in year y (t CO2/y)
yBE
= Baseline Emissions in year y (t CO2/y)
yPE
= Project emissions in year y (t CO2/y)
B.6.2. Data and parameters fixed ex ante
Data / Parameter EF
Unit tCO2/MWh
Description Emission factor of the grid
Source of data Spreadsheet “EF calculation-Berlin Geothermal Project Phase II-V2”
Value(s) applied 0.569
Choice of data
or
Measurement methods
and procedures
Calculated as per the “Tool to calculate the emission factor for an
electricity system”, version 4.0.
Purpose of data This factor is used for baseline emissions calculation.
Additional comment
UNFCCC/CCNUCC
CDM – Executive Board Page 30
Data / Parameter GWPCH4
Unit tCO2e/tCH4
Description Global warming potential of methane valid for the second commitment
period.
Source of data Table 2.14 of the errata to the contribution of Working Group I to the
Fourth Assessment Report of the Intergovernmental Panel on Climate
Change as per Decision 4/CMP.7.
Value(s) applied 25 tCO2e/tCH4
Choice of data
or
Measurement methods
and procedures
N/A
Purpose of data Project emissions calculation
Additional comment -
Data / Parameter EGhistorical
Unit MWh
Description Annual average historical net electricity generation delivered to the grid
by the existing renewable energy plant that was operated at the project site
prior to the implementation of the project activity.
Source of data Electricity meters at project activity site prior the implementation of the
project activity. Data provided by the Transacctions Unit (UT).
Value(s) applied 440,843
Choice of data
or
Measurement methods
and procedures
The project participant chooses the five last calendar years prior to the
implementation of the project activity as the time span of historical data to
determine EGhistorical.
Purpose of data Baseline emissions calculation
Additional comment -
Data / Parameter σhistorical
Unit MWh
Description Standard deviation of the annual average historical net electricity
generation delivered to the grid by the existing renewable energy plant
that was operated at the project site prior to the implementation of the
Project Activity
Source of data Calculated from data used to establish EGhistorical. Information provided by
the Transactions Unit (UT).
Value(s) applied 12,904
Choice of data
or
Measurement methods
and procedures
Parameter calculated as the standard deviation of the annual generation
data used to calculate EGhistorical.
Purpose of data Baseline emissions calculation
Additional comment -
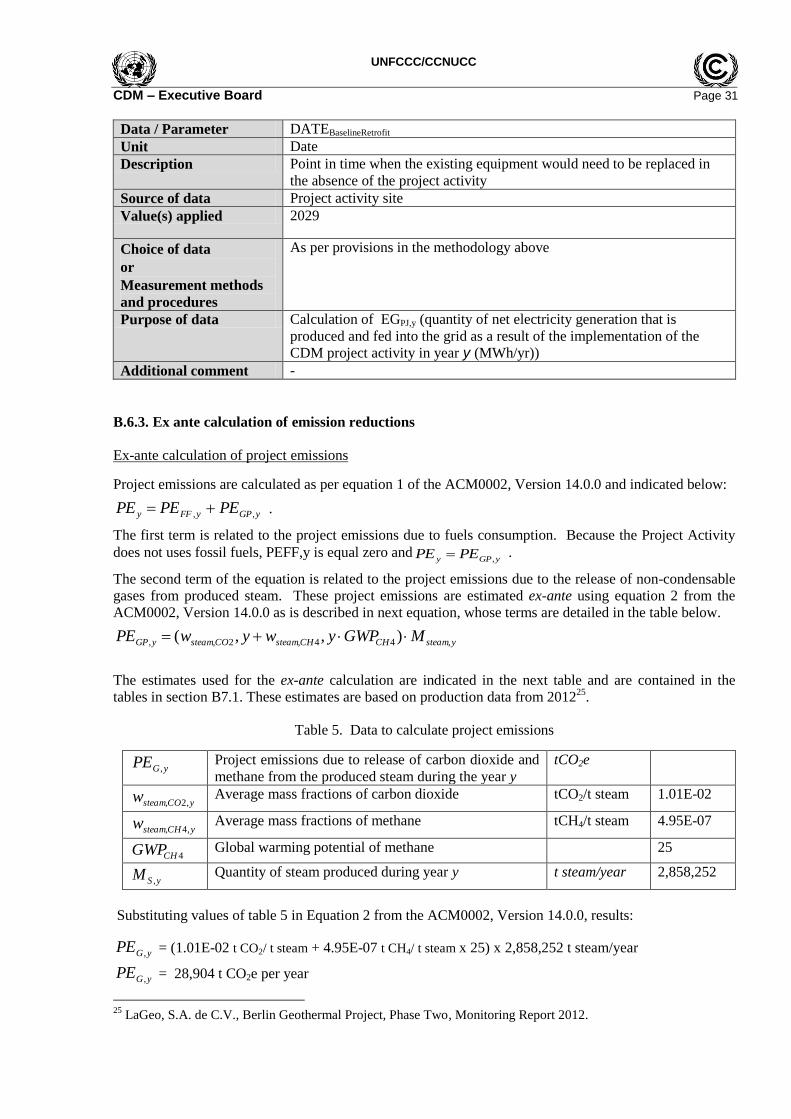
UNFCCC/CCNUCC
CDM – Executive Board Page 31
Data / Parameter DATEBaselineRetrofit
Unit Date
Description Point in time when the existing equipment would need to be replaced in
the absence of the project activity
Source of data Project activity site
Value(s) applied 2029
Choice of data
or
Measurement methods
and procedures
As per provisions in the methodology above
Purpose of data Calculation of EGPJ,y (quantity of net electricity generation that is
produced and fed into the grid as a result of the implementation of the
CDM project activity in year y (MWh/yr))
Additional comment -
B.6.3. Ex ante calculation of emission reductions
Ex-ante calculation of project emissions
Project emissions are calculated as per equation 1 of the ACM0002, Version 14.0.0 and indicated below:
yGPyFFy PEPEPE ,, .
The first term is related to the project emissions due to fuels consumption. Because the Project Activity
does not uses fossil fuels, PEFF,y is equal zero andyGPy PEPE , .
The second term of the equation is related to the project emissions due to the release of non-condensable
gases from produced steam. These project emissions are estimated ex-ante using equation 2 from the
ACM0002, Version 14.0.0 as is described in next equation, whose terms are detailed in the table below.
ysteamCHCHsteamCOsteamyGP MGWPywywPE ,44,2,, ),,(
The estimates used for the ex-ante calculation are indicated in the next table and are contained in the
tables in section B7.1. These estimates are based on production data from 201225
.
Table 5. Data to calculate project emissions
yGPE , Project emissions due to release of carbon dioxide and
methane from the produced steam during the year y
tCO2e
yCOsteamw ,2, Average mass fractions of carbon dioxide tCO2/t steam 1.01E-02
yCHsteamw ,4, Average mass fractions of methane tCH4/t steam 4.95E-07
4CHGWP Global warming potential of methane 25
ySM , Quantity of steam produced during year y t steam/year 2,858,252
Substituting values of table 5 in Equation 2 from the ACM0002, Version 14.0.0, results:
yGPE , = (1.01E-02 t CO2/ t steam + 4.95E-07 t CH4/ t steam x 25) x 2,858,252 t steam/year
yGPE , = 28,904 t CO2e per year
25
LaGeo, S.A. de C.V., Berlin Geothermal Project, Phase Two, Monitoring Report 2012.
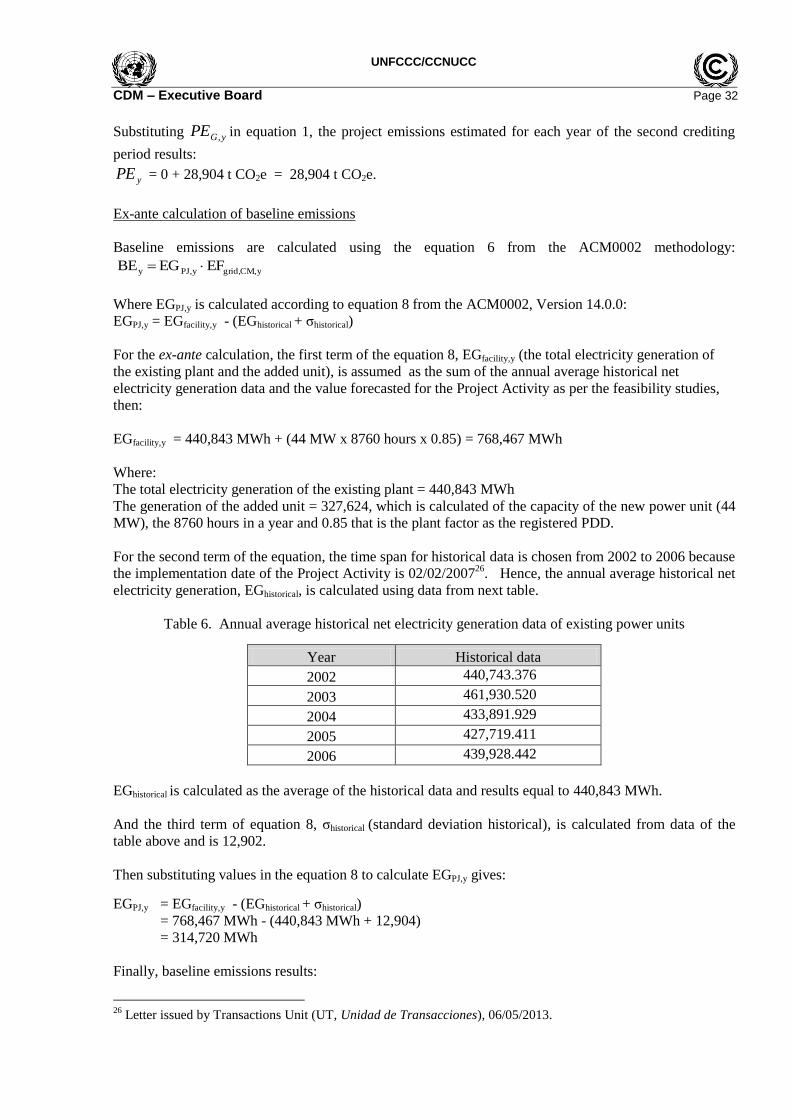
UNFCCC/CCNUCC
CDM – Executive Board Page 32
Substituting yGPE , in equation 1, the project emissions estimated for each year of the second crediting
period results:
yPE = 0 + 28,904 t CO2e = 28,904 t CO2e.
Ex-ante calculation of baseline emissions
Baseline emissions are calculated using the equation 6 from the ACM0002 methodology:
Where EGPJ,y is calculated according to equation 8 from the ACM0002, Version 14.0.0:
EGPJ,y = EGfacility,y - (EGhistorical + σhistorical)
For the ex-ante calculation, the first term of the equation 8, EGfacility,y (the total electricity generation of
the existing plant and the added unit), is assumed as the sum of the annual average historical net
electricity generation data and the value forecasted for the Project Activity as per the feasibility studies,
then:
EGfacility,y = 440,843 MWh + (44 MW x 8760 hours x 0.85) = 768,467 MWh
Where:
The total electricity generation of the existing plant = 440,843 MWh
The generation of the added unit = 327,624, which is calculated of the capacity of the new power unit (44
MW), the 8760 hours in a year and 0.85 that is the plant factor as the registered PDD.
For the second term of the equation, the time span for historical data is chosen from 2002 to 2006 because
the implementation date of the Project Activity is 02/02/200726
. Hence, the annual average historical net
electricity generation, EGhistorical, is calculated using data from next table.
Table 6. Annual average historical net electricity generation data of existing power units
Year Historical data
2002 440,743.376
2003 461,930.520
2004 433,891.929
2005 427,719.411
2006 439,928.442
EGhistorical is calculated as the average of the historical data and results equal to 440,843 MWh.
And the third term of equation 8, σhistorical (standard deviation historical), is calculated from data of the
table above and is 12,902.
Then substituting values in the equation 8 to calculate EGPJ,y gives:
EGPJ,y = EGfacility,y - (EGhistorical + σhistorical)
= 768,467 MWh - (440,843 MWh + 12,904)
= 314,720 MWh
Finally, baseline emissions results:
26
Letter issued by Transactions Unit (UT, Unidad de Transacciones), 06/05/2013.
yCM,grid,yPJ,y EFEG BE
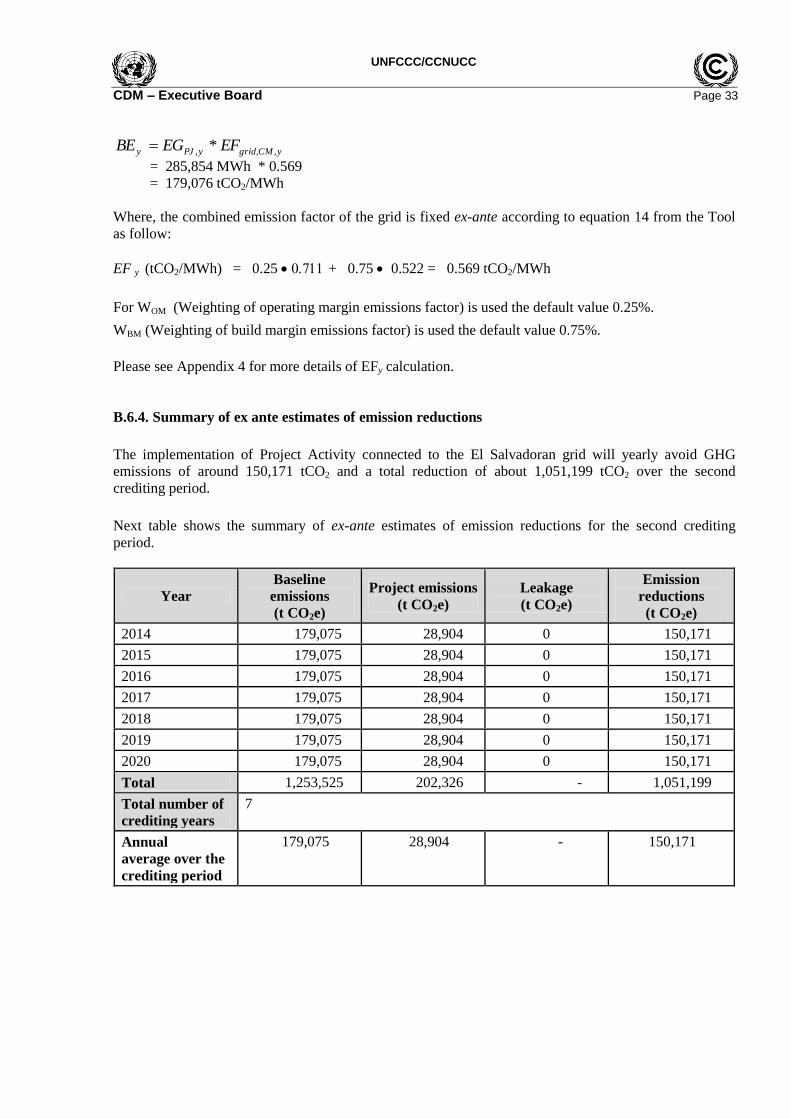
UNFCCC/CCNUCC
CDM – Executive Board Page 33
yCMgridyPJy EFEGBE ,,, *
= 285,854 MWh * 0.569
= 179,076 tCO2/MWh
Where, the combined emission factor of the grid is fixed ex-ante according to equation 14 from the Tool
as follow:
EF y (tCO2/MWh) = 0.25 + 0.75 0.522 = 0.569 tCO2/MWh
For WOM (Weighting of operating margin emissions factor) is used the default value 0.25%.
WBM (Weighting of build margin emissions factor) is used the default value 0.75%.
Please see Appendix 4 for more details of EFy calculation.
B.6.4. Summary of ex ante estimates of emission reductions
The implementation of Project Activity connected to the El Salvadoran grid will yearly avoid GHG
emissions of around 150,171 tCO2 and a total reduction of about 1,051,199 tCO2 over the second
crediting period.
Next table shows the summary of ex-ante estimates of emission reductions for the second crediting
period.
Year
Baseline
emissions
(t CO2e)
Project emissions
(t CO2e)
Leakage
(t CO2e)
Emission
reductions
(t CO2e)
2014 179,075 28,904 0 150,171
2015 179,075 28,904 0 150,171
2016 179,075 28,904 0 150,171
2017 179,075 28,904 0 150,171
2018 179,075 28,904 0 150,171
2019 179,075 28,904 0 150,171
2020 179,075 28,904 0 150,171
Total 1,253,525 202,326 - 1,051,199
Total number of
crediting years
7
Annual
average over the
crediting period
179,075 28,904 - 150,171
UNFCCC/CCNUCC
CDM – Executive Board Page 34
B.7. Monitoring plan
The name and reference of the approved baseline monitoring methodology applied to the monitoring plan
of the Project Activity is: ACM0002 “Consolidated baseline methodology for grid-connected electricity
generation from renewable sources” (version 14.0.0).
The Monitoring Plan foresees the storage of sufficient data to allow the calculation of GHG emissions
generated and avoided by the Project Activity in a straightforward manner.
B.7.1. Data and parameters to be monitored
Data and parameters to be monitored are described in the following tables. Data will be collected and
archived for two years following the end of the crediting period.
Data / Parameter wsteam,CO2
Unit tCO2/t steam
Description Average mass fraction of CO2 in the produced steam in year y.
Source of data Project Activity site
Value(s) applied 1.01E-02
Measurement methods
and procedures Non-condensable gases sampling should be carried out in production wells
and at the steam field-power plant interface using ASTM Standard Practice
E1675 for Sampling 2-Phase Geothermal Fluid for Purposes of Chemical
Analysis and the ASTM Standard Practice E947 for Sampling Single-Phase
Geothermal Liquid or Steam for Purposes of Chemical Analysis.
The CO2 and CH4 sampling and analysis procedure consists of collecting
non-condensable gases samples from the main steam line with glass flasks,
filled with sodium hydroxide solution and additional chemicals to prevent
oxidation. Hydrogen sulphide (H2S) and carbon dioxide (CO2) dissolve in
the solvent while the residual compounds remain in their gaseous phase.
The gas portion is then analyzed using gas chromatography to determine
the content of the residuals including CH4. All alkanes concentrations are
reported in terms of methane.
The average mass fraction of steam of CO2 will be analyzed by a titration
method.
Monitoring frequency At least every three months and more frequently, if necessary.
QA/QC procedures Internal procedures will be followed to systematize activities and minimize
error.
The laboratory equipment will be calibrated at least once a year.
The Geo-chemical Laboratory of LaGeo is accredited by ISO/IEC 17025.
Purpose of data Activity emissions calculation.
Additional comment Data is archived in electronic and paper
UNFCCC/CCNUCC
CDM – Executive Board Page 35
Data / Parameter Wsteam,CH 4
Unit tCH4/t steam
Description Average mass fraction of CH4 in the produced steam
Source of data Project Activity site
Value(s) applied 4.95E-07
Measurement methods
and procedures Non-condensable gases sampling should be carried out in production wells
and at the steam field-power plant interface using ASTM Standard Practice
E1675 for Sampling 2-Phase Geothermal Fluid for Purposes of Chemical
Analysis and the ASTM Standard Practice E947 for Sampling Single-Phase
Geothermal Liquid or Steam for Purposes of Chemical Analysis.
The CO2 and CH4 sampling and analysis procedure consists of collecting
non-condensable gases samples from the main steam line with glass flasks,
filled with sodium hydroxide solution and additional chemicals to prevent
oxidation. Hydrogen sulphide (H2S) and carbon dioxide (CO2) dissolve in
the solvent while the residual compounds remain in their gaseous phase.
The gas portion is then analyzed using gas chromatography to determine
the content of the residuals including CH4. All alkanes concentrations are
reported in terms of methane.
Monitoring frequency Quarterly At least every three months and more frequently, if necessary.
QA/QC procedures Internal procedures will be followed to systematize activities and minimize
error.
The laboratory equipment will be calibrated at least once a year.
The Geo-chemical Laboratory of LaGeo is accredited by ISO/IEC 17025.
Purpose of data Activity emissions calculation.
Additional comment Data is archived in electronic and paper.
UNFCCC/CCNUCC
CDM – Executive Board Page 36
Data / Parameter M steam , y
Unit t steam/yr
Description Quantity of steam produced in year y
Source of data Project Activity site
Value(s) applied 2,858,252
Measurement methods
and procedures
Annubar flow meters will be used for the determination of steam quantities
discharged from geothermal wells, which should be conducted on a
continuous basis.
Measurement of temperature and pressure upstream of the flow meter is
required to define the steam properties. The calculation of steam quantities
should be conducted on a continuous basis and should be based on
international standards.
The measurement results should be summarized transparently in regular
production reports
Monitoring frequency Daily
QA/QC procedures Internal procedures will be followed to systematize activities and minimize
error.
Annubar flow meters will be calibrated twice a year.
Purpose of data Activity emissions calculation.
Additional comment Data will be archived in electronic and paper
UNFCCC/CCNUCC
CDM – Executive Board Page 37
Data / Parameter EGfacility,y
Unit MWh
Description Quantity of net electricity generation supplied by the project plant to the
grid in year y
Source of data Electricity meters at project site.
Value(s) applied 768,467
Measurement methods
and procedures
The net electricity generation supplied to the grid is monitored by the
Project Participant as well as by the Transactions Unit (Unidad de
Transacciones, UT). Because UT is the grid operator, the data monitored
by UT constitutes the official data used for commercial purposes and
emissions reductions calculation.
1. Measurement:
Measurements are undertaken using two bidirectional electricity meters
per power unit with an accuracy class of at least 0.2. One meter is
used as the main and the other as the secondary.
Both meters measure the electricity delivery to the grid at the delivery
point. The net electricity supplied to a grid is the difference between
the measured quantities of the grid electricity export and the import.
2. Data Reading:
Data reading will be carried out periodically by the project participant
an UT, downloading data directly from the electricity meters or
remotely.
3. Data Registration:
Data download from the electricity meters is saved monthly by the
project participant in an electronic format.
4. Data Storage:
All data collected as part of monitoring should be archived
electronically and be kept at least for 2 years after the end of the last
crediting period.
Monitoring frequency Continuous measurement and at least monthly recording.
QA/QC procedures 1. Verification of the meters accuracy:
Equipments used to measure the electricity delivered to the grid are
audited at least each two years by private companies accredited by the
national dispatch center (UT). Audits are realized in the presence of
members from the power producer and the audit-company
commissioned by UT.
Meter accuracy of the electricity meters have to meet the UT´s Annex
of the Operation Norms of the Transmission System and Wholesale
Market. In case of the meter accuracy is out of range or one of the
meters is damaged, the meter is calibrated or substituted.

UNFCCC/CCNUCC
CDM – Executive Board Page 38
QA/QC procedures
(continuation)
2. Cross checking:
The project participant checks that the electricity generation data read
by personnel of the power plant coincides with data stated in the
monthly invoices.
3. Emergency procedures for the monitoring system:
The electricity registered by the main meter constitutes the official
metering. If this meter fails, the data of the back-up meter is used. The
main and the back-up meter have been authorized by the Transactions
Unit (Unidad de Transacciones, UT) of the electricity market.
According to Wholesales Electricity Market and Transmission System
Operation Regulation, if UT cannot to access the meters remotely, then
downloads the metering data on site. When both meters fail, UT use
the data registered by its SCADA system or the historical data or the
data registered by LaGeo, in the mentioned order.
Purpose of data These data will be used to calculate the baseline emissions.
Additional comment Because electricity metering is by power unit at Berlin Power Plant, EGfacility,y is calculated as the sum of the electricity measured by the
electricity meters of units 1, 2 and 3 of Berlin Geothermal power plant.
B.7.2. Sampling plan
Not applicable.
B.7.3. Other elements of monitoring plan
The operational and management structures necessary to monitor emission reductions and emissions of
the Project Activity are described in the following chart.
The person in charge of the internal quality control is assigned by the CDM coordinator.
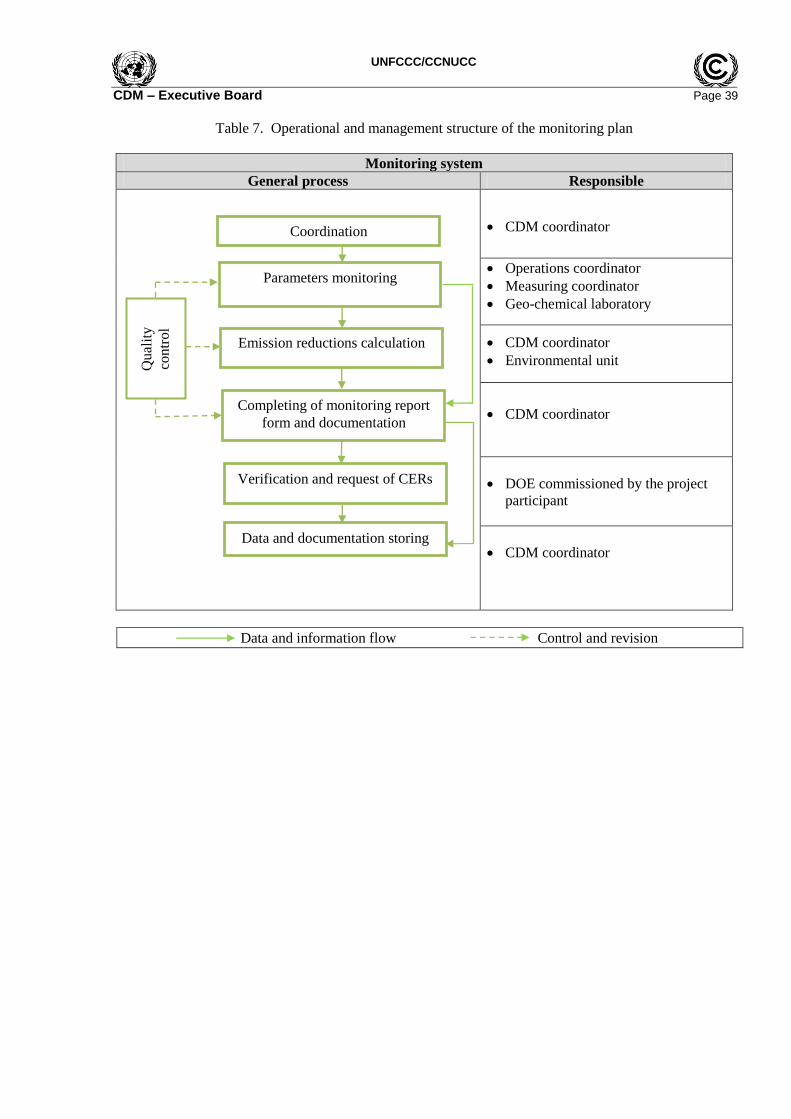
UNFCCC/CCNUCC
CDM – Executive Board Page 39
Table 7. Operational and management structure of the monitoring plan
Monitoring system
General process Responsible
CDM coordinator
Operations coordinator
Measuring coordinator
Geo-chemical laboratory
CDM coordinator
Environmental unit
CDM coordinator
DOE commissioned by the project
participant
CDM coordinator
Data and information flow Control and revision
Parameters monitoring
Emission reductions calculation
Completing of monitoring report
form and documentation
Verification and request of CERs
Coordination
Data and documentation storing
Qu
alit
y
con
tro
l

UNFCCC/CCNUCC
CDM – Executive Board Page 40
SECTION C. Duration and crediting period
C.1. Duration of project activity
C.1.1. Start date of project activity
02/02/200727
C.1.2. Expected operational lifetime of project activity
30y-0m.
C.2. Crediting period of project activity
C.2.1. Type of crediting period
Renewable (second crediting period)
C.2.2. Start date of crediting period
01/01/2014 (second crediting period)
C.2.3. Length of crediting period
7y-0m
27
Letter issued by Transactions Unit (UT, Unidad de Transacciones), 06/05/2013.

UNFCCC/CCNUCC
CDM – Executive Board Page 41
SECTION D. Environmental impacts
D.1. Analysis of environmental impacts
The first environmental impact study regarding the exploration of the potential of the Berlin geothermal
field to generate power was carried out in 1994 by Geotérmica Salvadoreña S.A de C.V (GESAL, today’s
LaGeo). The study was one of the requirements to obtain the environmental license for a geothermal
condensation power plant. The objectives of the environmental impact study were:
Identifying environmental (land, air and water) and socioeconomic impacts caused by all
different activities related to the development of the project;
Planning the mitigation of identified significant environmental and socioeconomic impacts;
and
Developing a control plan to assure that emissions are in compliance with applicable
regulations and laws.
In May 1998, the El Salvadorian government approved a new environmental law. In the law, article #107
demanded that projects, which were already in place, should submit an environmental diagnosis in two
years period. The environmental diagnosis for the Berlin Geothermal Power Plant was finished in the first
semester of 2000 and subsequently submitted to MARN.
In February 2001, MARN act in response to the environmental diagnosis requesting from the project
proponents clarifications on the following issues:
Earmarked budget for environmental impacts mitigation;
System for the canalization and re-injection of condensate;
Inclusion of the activities listed in management plans, including monitoring program, in the
compliance environmental program;
Updating financial data on environmental plan.
In June 2001 MARN issued the resolution MARN-086-2001 providing the final environmental permit for
the operation the Berlin Geothermal Power Plant. The permit foresees the generation of electricity by
means of accessing a deep reservoir through a superficial structure that channels geothermal fluids from
the reservoir to the surface by 24 wells in an area of 4 km2. The decision was based on the evaluation and
acceptance of the environmental diagnosis and the corresponding environmental adaptation and
management plans. The proponent of the project also provided MARN a financial commitment to the
environmental impact mitigation measures. All the documentation and licenses issued for the first phase
of the Berlin Geothermal Power Plant were used as basis for the proposed Project Activity.
The proposed Project Activity is the expansion of the power generation capacity at the existing Berlin
Geothermal Power Plant by 44 MW through the drilling of additional geothermal wells and the
installation of a new condensation power unit. Specifically for the proposed Project Activity the following
documents were issued by the El Salvadoran environmental agency:
In October 21, 2002, MARN issued two documents MARN-DGA-NPA-337/2002, and
338/2002 freeing LaGeo from the environmental license for drilling of the re-injection
wells and in March 10, 2003, MARN issued the document MARN-DGA-NPA-063/2003
freeing LaGeo from the environmental license for drilling of the production wells, both
related to the Project Activity. The decision of releasing the project from these phases of
the environmental permit was based on the low potential environmental impacts that these
additional activities would generate, as confirmed by the analysis of the environmental
diagnosis reports and site visits.
Following, MARN received from LaGeo in March 11, 2003, an environmental
management plan containing precautionary measures for environmental, social, safety and
occupational health issues, for the construction phase of the project.
UNFCCC/CCNUCC
CDM – Executive Board Page 42
Together with the plan, in March 11, 2003, MARN also received the authorization and
acceptance of the project by the municipal government, represented by the major of Los
Cañales, and the list of attendants to the public hearing, affirming the acceptance of the
project by the local community.
In July 2004, the project participants published in a national newspapers28
three times a call
for 10-day period stakeholders’ comments after the third publication. The public notice
informed that LaGeo S.A. had submitted an environmental impact study for carrying out
the Project Activity. There was also an explanation on how any citizen or company could
express his/her/its opinion about the project.
In December 2, 2004, MARN issued Resolution-5133-796-2004, which granted LaGeo the
needed license to operate. The license was issued since the ministry had received from the
Project Activity the following documents: environmental impact study, management plan,
two commentaries (“without any technical relevancy” according to MARN) during the
stakeholder comment period, and a financial warranty as a guarantee for the environmental
mitigation measures. MARN also stated that the Project Activity attended all
environmental laws.
Finally, in February 16th, 2005, MARN issued Resolution MARN-6259-123-2005,
releasing LaGeo from preparation of additional environmental impact assessments for the
activity based on the analysis of the environmental report made by LaGeo.
All mentioned resolutions, documents, studies and reports are available upon request.
D.2. Environmental impact assessment
In order to assess the potential environmental impacts of the project, LaGeo carried out all the studies and
verifications required by the environmental agency. The objective was to mitigate potential adverse
impacts on the natural and social environment surrounding the plant. The following series of studies were
performed by LaGeo and thoroughly analyzed and approved by the authorities:
Environmental impact information – December, 1994
Environmental diagnosis – May, 2000
Environmental characterization study – February, 2001
Environmental impact study for the drilling of wells – June 2003, December 2003
Environmental characterization of San Simon river – May 2003
Environmental study for thermal fluid pipelines – May 2004
Environmental analysis for complementary drilling – April 2004
Environmental analysis of geothermal fluid transportation pipelines connection – August 2004
Environmental analysis of power plant expansion – December 2004
According to the documents mentioned in the previous section and listed below, Project Activity
environmental impacts were considered significant neither by the project participants nor by the host
Party.
MARN-086-2001
MARN-DGA-NPA-337/2002
MARN-DGA-NPA-338/2002
28
El Diario de Hoy, San Salvador, El Salvador, July 7, 2004, page 56; July 8, 2004, page 52; July 7, 2004, page 66.

UNFCCC/CCNUCC
CDM – Executive Board Page 43
MARN-DGA-NPA-063/2003
MARN 5133-796-2004
MARN-6259-123-2005
All mentioned resolutions, documents, studies and reports are available upon request.
UNFCCC/CCNUCC
CDM – Executive Board Page 44
SECTION E. Local stakeholder consultation
E.1. Solicitation of comments from local stakeholders
Local stakeholders’ comments have been invited in the process of environmental licensing. Three public
hearings were performed29
in an open and transparent manner, facilitating comments to be received from
local stakeholders and allowing for a reasonable time for comments to be submitted. As result of the
hearings the Mayor of the City of Berlin sent on February 10, 2003, a letter to the Ministry of
Environment expressing the agreement of the administration and its communities to the execution of the
project. The mayor also stated believes of the communities on the beneficial role of the project to the
region and the country.
Afterwards the project participants published in a national newspaper three times a call for 10-day period
stakeholders’ comments after the third publication30
. The call in the paper informed that LaGeo S.A. had
submitted an environmental impact study for carrying out the Project Activity. There was also an
explanation on how any person or company could express his/her/its opinion about the project.
In order to obtain operation licenses, sponsors also developed education and communication programs for
local communities regarding environmental aspects and projects impacts and benefits.
Work and engagement with stakeholders is managed through the Community Engagement Program
(PACO from the Spanish “Programa de Atención Comunitaria”) aimed at creating a harmonious,
balanced and constructive environment with neighboring municipalities of Berlín, Mercedes Umaña and
Alegría. The fundamental elements of PACO that maximize benefits to the community are the generation
of local employment opportunities, social investment activities, development of sustainable small
businesses and protection of the local environment.
E.2. Summary of comments received
The concerns expressed made by the stakeholders in the local public hearings are summarized below:
Noise attenuation in the construction site
Control of water drainage
Protection and stabilization of slopes
Improvement of roads and access to the site and surroundings
Reforestation at the places damaged
Adequate management of wastes and residues
Actions directed to the protection of the wild life
Generate local job positions during construction phase
Two comments were received after the three-day publication of call for comments in a national
newspaper. The two comments were not taken into account since MARN did not consider them relevant.
29 Hearings performed: First on August 23, 2002 (19 participants); second on October 25, 2002 (34 participants);
third on November 12, 2002 (117 participants). Lists of participants as of sessions available upon request.
30
El Diário de Hoy, San Salvador, El Salvador, July 7, 2004, page 56; El Diário de Hoy, July 8, 2004, page 52; El
Diário de Hoy, July 7, 2004, page 66.

UNFCCC/CCNUCC
CDM – Executive Board Page 45
E.3. Report on consideration of comments received
LaGeo never received any complain from stakeholders (NGO, MARN or any public entity) regarding the
Project Activity. All relevant31
comments received, in the context of public hearings carried out within the
environmental licensing and operation permitting process, were incorporated into the implementation of
the project. Some of these concrete actions, aimed at managing public concerns and improving the
wellbeing of the neighboring community, include:
Underground Water Management Publication: LaGeo published and communicated (via talks and
seminars) an educational document providing detailed information on site underground conditions and
best management practices. The document explains how are aquifers protected during the drilling and
reservoir production process. The publication educates and allows the public to understand how is the
company safeguarding the water supplies.
Water Monitoring: LaGeo conducts a permanent groundwater monitoring plan that surveys areas near
operations through periodic sampling and analyses (this survey includes wells, aquifers, and point sources
of water supply).
Public Affairs Office: in order to be available to the community and respond to any concern or issue, a
Public Affairs office operates at the site. This office receives stakeholders and provides up-to-date
information on environmental and social aspects related to the Project Activity. Some of the tools
available to the stakeholder are: direct telephone hot line, newsletters, and public service announcements.
Environmental Education Program: a program has been implemented to enhance peoples understanding
of geothermal resources and its importance in providing clean sustainable energy while protecting the
environment. The program includes activities such as: school cleaning and maintenance practices;
reforestation; etc.
31
According to MARN.
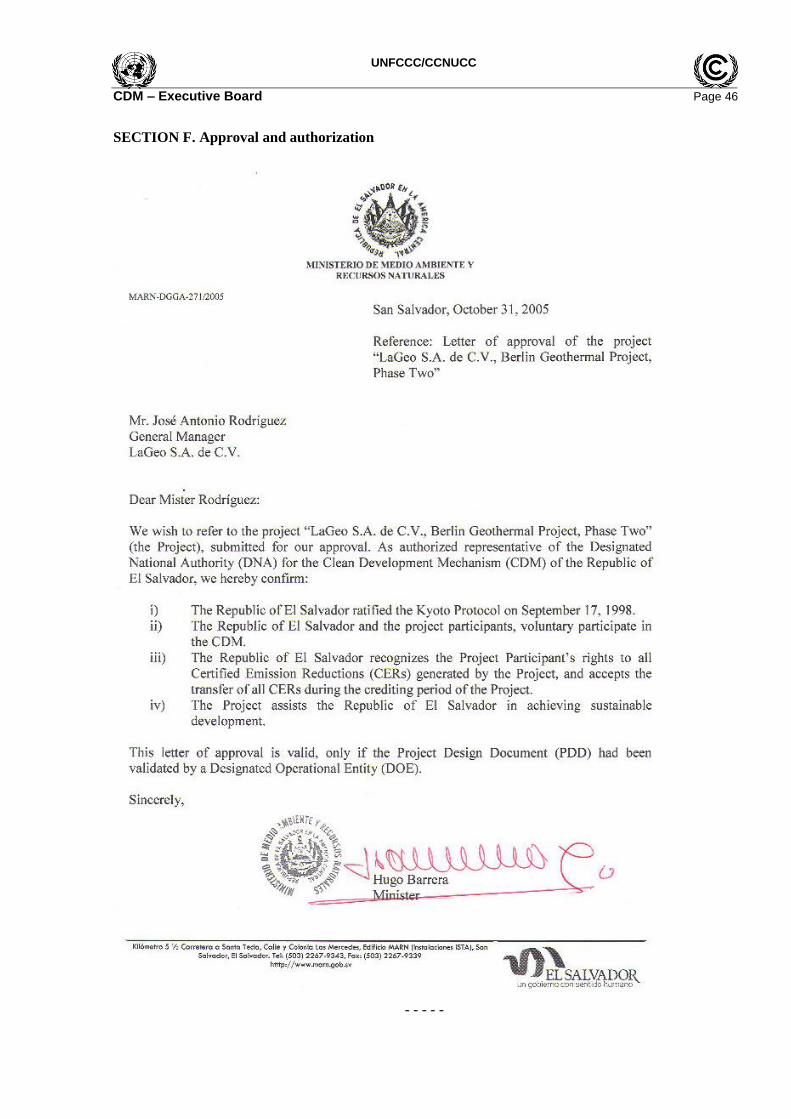
UNFCCC/CCNUCC
CDM – Executive Board Page 46
SECTION F. Approval and authorization
- - - - -
UNFCCC/CCNUCC
CDM – Executive Board Page 47
Appendix 1: Contact information of project participants
Organization name LaGeo, S. A. de C. V.
Street/P.O. Box 15 Avenida Sur, Colonia Utila
Building LaGeo
City Santa Tecla
State/Region La Libertad
Postcode N/A
Country El Salvador
Telephone + (503) 2211-6700
Fax + (503) 2211-6746
E-mail [email protected]
Website http://www.lageo.com.sv/
Contact person
Title CDM Coordinator
Salutation Ingeniero
Last name Loy
Middle name
First name Rubén Antonio
Department
Mobile +503 7843-9588
Direct fax N/A
Direct tel. +503 2211-6757
Personal e-mail [email protected]

UNFCCC/CCNUCC
CDM – Executive Board Page 48
Appendix 2: Affirmation regarding public funding
No public funding was and will be used in the present project.
Appendix 3: Applicability of selected methodology
See sections B.1 and B.2
UNFCCC/CCNUCC
CDM – Executive Board Page 49
Appendix 4: Further background information on ex ante calculation of emission reductions
Calculation of the Operating Margin 2010
Group of plants m
Group of plants k
EFgrid,OM-adj, 2010 0.705 tCO2/MWh
EGm,2010 i EF CO 2,m,i,y ηm EF EL,m,y
Energy
produced 2010 Fuel Type
Average
emission factor
Conversion
factor
Default
efficiency
Emission
factor of unit
CO2 emissions
(tCO2)
UT SIGET SIGET UT
Inventory
Workbook
(IPCC, 2006)
Conversion
factor from the
International
System of Units
Meth tool,
appendix 1Calculated Calculated
Acajutla
Diesel engines and internal
combustion motors 1995-2007 533,100 Diesel 72.60 3.6 39.5% 0.662 352,736.75
Soyapango Internal combustion motors 1972 24,400 Bunker 75.50 3.6 30% 0.906 22,106.40
Nejapa Power Internal combustion motors 1995 406,600 Bunker/diesel 72.60 3.6 30% 0.871 354,229.92
Clesa 1/ Distributed generation N/A 100 N/A - - - - -
Cessa Internal combustion motors 2001 55,400 Bunker 75.50 3.6 39.5% 0.688 38,120.81
Textufil Internal combustion motors 2006 200,800 Bunker 75.50 3.6 39.5% 0.688 138,170.73
Ine Internal combustion motors 2006 600,200 Bunker 75.50 3.6 39.5% 0.688 412,998.38
Borealis Internal combustion motors 2007 54,800 Bunker 75.50 3.6 39.5% 0.688 37,707.95
Gecsa Internal combustion motors 2007 56,800 Bunker 75.50 3.6 39.5% 0.688 39,084.15
Inm. Apopa Internal combustion motors 2012 38,100 Bunker 75.50 3.6 39.5% 0.688 26,216.66
Total 1,970,300 1,421,371.75
Power unit Technology type
Operation
starting
date
Fuel based power plants* (see below)
EGk,2010 i EF CO 2,m,i,y ηm EF EL,m,y
Energy
produced 2010
(MWh) Fuel Type
Average
emission factor
of fuel type i
(tCO2/TJ)
Conversion
factor
(TJ/MWh)
Default
efficiency
factors (%)
Emission
factor of unit
m
(tCO2/MWh)
CO2 emissions
(tCO2)
UT UT
Inventory
Workbook
(IPCC, 2006)
Conversion
factor from the
International
System of Units
Meth tool,
appendix 1Calculated Calculated
Guajoyo Hydroelectric plant 1963-1964 84,800 Water - - - - -
Cerrón Grande Hydroelectric plant 1977-1979 723,700 Water - - - - -
5 de Noviembre Hydroelectric plant 1954-1956 529,300 Water - - - - -
15 de Septiembre Hydroelectric plant 1983 741,400 Water - - - - -
Ahuachapán Geothermal plant 1975 643,500
Geothermal
steam - - - -
Berlín Geothermal plant 1992 777,700
Geothermal
steam - - - - -
Cassa Internal combustion motors 2003 109,100 Biomass - - - - -
Ing. El Angel Internal combustion motors 2008 43,000 Biomass - - - - -
Ing. La Cabaña Internal combustion motors 2008 27,800 Biomass - - - - -
Imports 174,200 - - - - -
Total 3,854,500 0
Hydro** (see below)
Geothermal
Cogenerators
Imports
Power unit Technology type
Operation
starting
date
UNFCCC/CCNUCC
CDM – Executive Board Page 50
Calculation of the Operating Margin 2011
Group of plants m
Group of plants k
EFgrid,OM-adj, 20121 0.706 tCO2/MWh
EGm,2011 i EF CO 2,m,i,y ηm EF EL,m,y
Energy
produced
2011 (MWh) Fuel Type
Average
emission
factor of fuel
type i
(tCO2/TJ)
Conversion
factor
(TJ/MWh)
Default
efficiency
factors (%)
Emission
factor of unit
m
(tCO2/MWh)
CO2 emissions
(tCO2)
UT SIGET SIGET UT
Inventory
Workbook
(IPCC, 2006)
Conversion
factor from the
International
System of Units
Meth tool,
appendix 1Calculated Calculated
Acajutla
Diesel engines and internal
combustion motors 1995-2007 723,400 Diesel 72.60 3.6 39.5% 0.662 478,652.72
Soyapango Internal combustion motors 1972 30,100 Bunker 75.50 3.6 30% 0.906 27,270.60
Nejapa Power Internal combustion motors 1995 435,200 Bunker/diesel 72.60 3.6 30% 0.871 379,146.24
AES Clesa 1/ Distributed generation N/A 200 N/A - - - - -
Cessa Internal combustion motors 2001 37,900 Bunker 75.50 3.6 39.5% 0.688 26,079.04
Textufil Internal combustion motors 2006 192,000 Bunker 75.50 3.6 39.5% 0.688 132,115.44
Ine Internal combustion motors 2006 592,200 Bunker 75.50 3.6 39.5% 0.688 407,493.57
Borealis Internal combustion motors 2007 39,100 Bunker 75.50 3.6 39.5% 0.688 26,904.76
Gecsa Internal combustion motors 2007 45,200 Bunker 75.50 3.6 39.5% 0.688 31,102.18
Inm. Apopa Internal combustion motors 2012 27,100 Bunker 75.50 3.6 39.5% 0.688 18,647.54
Cassa-Com Internal combustion motors 2003 11,700
DELSUR 1/ Distributed generation N/A 300 N/A 0.00 0 0.0% - -
Edesal 1/ Distributed generation N/A - N/A - - - - -
Total 2,134,400 1,527,412.09
Power unit Technology type
Operation
starting
date
Fuel based power plants * (see below)
EGk,2011 i EF CO 2,m,i,y ηm EF EL,m,y
Energy
produced
2011 (MWh) Fuel Type
Average
emission
factor of fuel
type i
(tCO2/TJ)
Conversion
factor
(TJ/MWh)
Default
efficiency
factors (%)
Emission
factor of unit
m
(tCO2/MWh)
CO2 emissions
(tCO2)
UT UT
Inventory
Workbook
(IPCC, 2006)
Conversion
factor from the
International
System of Units
Meth tool,
appendix 1Calculated Calculated
Guajoyo Hydroelectric plant 1963-1964 102,000 Water - - - - -
Cerrón Grande Hydroelectric plant 1977-1979 643,600 Water - - - - -
5 de Noviembre Hydroelectric plant 1954-1956 551,800 Water - - - - -
15 de Septiembre Hydroelectric plant 1983 709,000 Water - - - - -
Ahuachapán Geothermal plant 1975 645,800
Geothermal
steam - - - - -
Berlín Geothermal plant 1992 784,200
Geothermal
steam - - - - -
Cassa Internal combustion motors 2003 99,700 Biomass - - - - -
Ing. El Angel Internal combustion motors 2008 40,200 Biomass - - - - -
Ing. La Cabaña Internal combustion motors 2008 18,000 Biomass - - - - -
Imports 215,800 - - - - -
Total 3,710,400 -
Hydro* (see below)
Geothermal
Cogenerators
Imports
Power unit Technology type
Operation
starting
date
UNFCCC/CCNUCC
CDM – Executive Board Page 51
Calculation of the Operating Margin 2012
Group of plants m
Group of plants k
EFgrid,OM-adj, 2012 0.725 tCO2/MWh
EGm,2012 i EF CO 2,m,i,y ηm EF EL,m,y
Energy
produced 2012
(MWh) Fuel Type
Average
emission factor
of fuel type i
(tCO2/TJ)
Conversion
factor
(TJ/MWh)
Default
efficiency
factors (%)
Emission
factor of unit
m
(tCO2/MWh)
CO2 emissions
(tCO2)
UT SIGET SIGET UT
Inventory
Workbook
(IPCC, 2006)
Conversion
factor from the
International
System of Units
Meth tool,
appendix 1Calculated Calculated
Acajutla
Diesel engines and internal
combustion motors 1995-2007 841,000 Diesel 72.60 3.6 39.5% 0.662 556,465.22
Soyapango Internal combustion motors 1972 35,000 Bunker 75.50 3.6 30% 0.906 31,710.00
Nejapa Power Internal combustion motors 1995 560,900 Bunker/diesel 72.60 3.6 30% 0.871 488,656.08
AES Clesa 1/ Distributed generation N/A 100 N/A - - - - -
Holcim Internal combustion motors 2001 12,300 Bunker 75.50 3.6 39.5% 0.688 8,463.65
Textufil Internal combustion motors 2006 224,400 Bunker 75.50 3.6 39.5% 0.688 154,409.92
Ine Internal combustion motors 2006 661,700 Bunker 75.50 3.6 39.5% 0.688 455,316.61
Borealis Internal combustion motors 2007 8,300 Bunker 75.50 3.6 39.5% 0.688 5,711.24
Gecsa Internal combustion motors 2007 9,200 Bunker 75.50 3.6 39.5% 0.688 6,330.53
Inm. Apopa Internal combustion motors 2012 14,200 Bunker 75.50 3.6 39.5% 0.688 9,771.04
Edesal 1/ Distributed generation N/A - N/A - - - - -
Total 2,367,100 1,716,834.28
Power unit Technology type
Operation
starting
date
Fuel based power plants* (see below)
EGk,2012 i EF CO 2,m,i,y ηm EF EL,m,y
Energy
produced 2012
(MWh) Fuel Type
Average
emission factor
of fuel type i
(tCO2/TJ)
Conversion
factor
(TJ/MWh)
Default
efficiency
factors (%)
Emission
factor of unit
m
(tCO2/MWh)
CO2 emissions
(tCO2)
UT UT
Inventory
Workbook
(IPCC, 2006)
Conversion
factor from the
International
System of Units
Meth tool,
appendix 1Calculated Calculated
Guajoyo Hydroelectric plant 1963-1964 75,500 Water - - - - -
Cerrón Grande Hydroelectric plant 1977-1979 49,400 Water - - - - -
5 de Noviembre Hydroelectric plant 1954-1956 553,800 Water - - - - -
15 de Septiembre Hydroelectric plant 1983 659,900 Water - - - - -
Ahuachapán Geothermal plant 1975 639,500
Geothermal
steam - - - -
Berlín Geothermal plant 1992 781,000
Geothermal
steam - - - - -
Cassa Internal combustion motors 2003 132,100 Biomass - - - - -
Ing. El Angel Internal combustion motors 2008 55,000 Biomass - - - - -
Ing. La Cabaña Internal combustion motors 2008 17,600 Biomass - - - - -
Imports 163,400 - - - - -
Total 3,127,200 0
Hydro* (see below)
Geothermal
Imports
Cogenerators
Power unit Technology type
Operation
starting
date

UNFCCC/CCNUCC
CDM – Executive Board Page 52
Calculation of Operating Margin according to the simple adjusted method
2010 2011 2012 Total
EFgrid,OMsimple, y 0.705 0.706 0.725
EGy 5,824,800 5,844,800 5,494,300 17,163,900
Weight 0.339 0.341 0.320
EFOMsimple, y
weigthened 0.239 0.240 0.232
EFgrid,OM,2009-2011 0.711 (t CO2/MWh)
UNFCCC/CCNUCC
CDM – Executive Board Page 53
Lambda 2010
LAMBDA CALCULATION 2010
Annual energy produced by group of plants k MWh 3,854,500
Intersection point with the horizontal line MW 441
No. hours that plants k are on the margin hours 200
λ % 0.0228
1 - λ % 0.9772
-
100
200
300
400
500
600
700
800
900
1,000
MW
Hours
Horizontal line Load duration curve
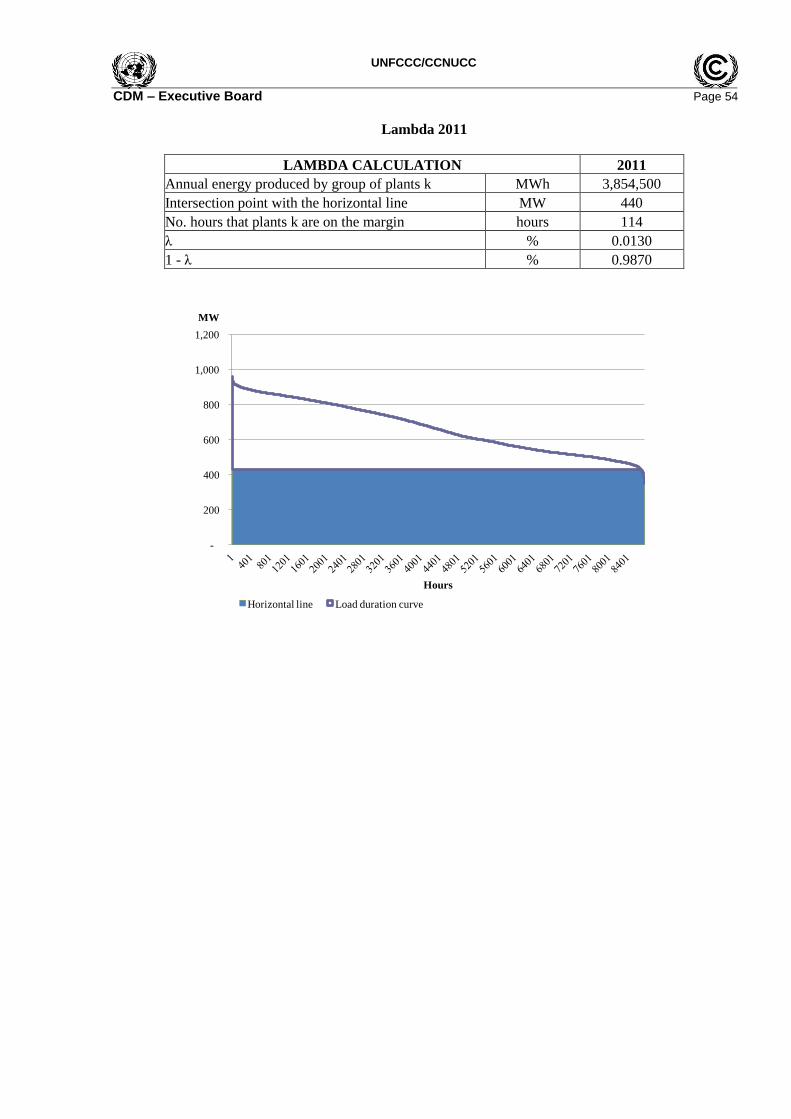
UNFCCC/CCNUCC
CDM – Executive Board Page 54
Lambda 2011
LAMBDA CALCULATION 2011
Annual energy produced by group of plants k MWh 3,854,500
Intersection point with the horizontal line MW 440
No. hours that plants k are on the margin hours 114
λ % 0.0130
1 - λ % 0.9870
-
200
400
600
800
1,000
1,200
MW
Hours
Horizontal line Load duration curve
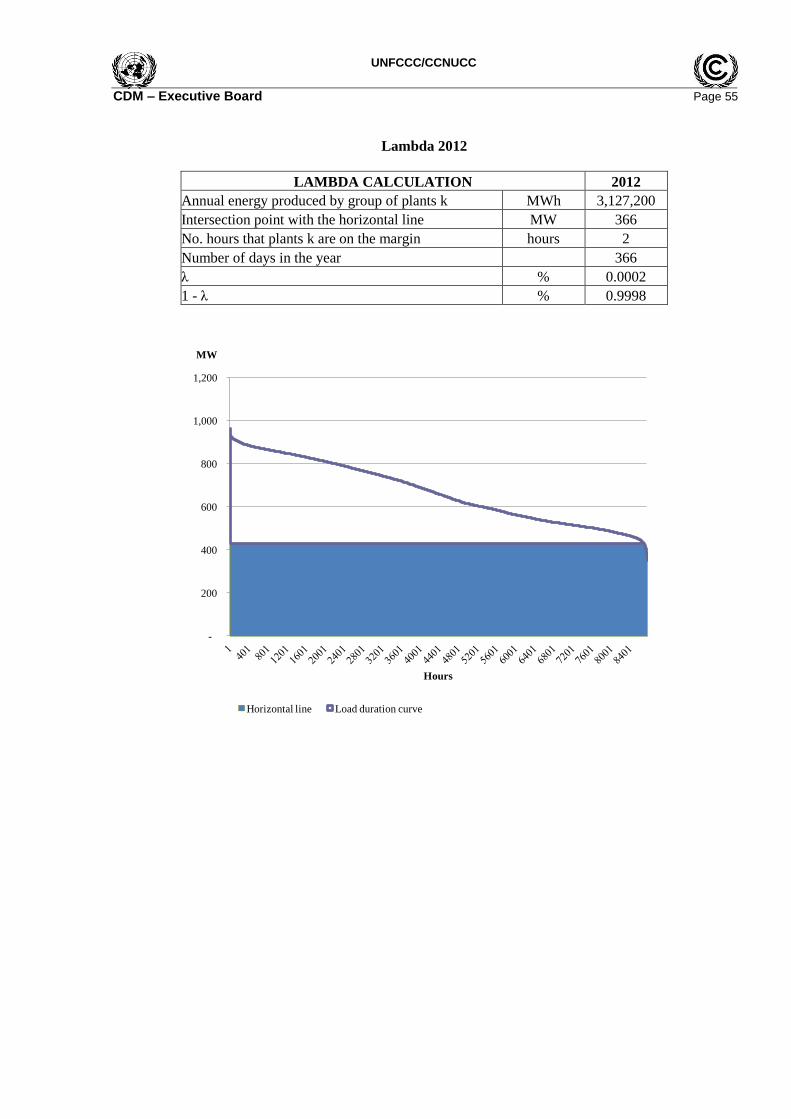
UNFCCC/CCNUCC
CDM – Executive Board Page 55
Lambda 2012
LAMBDA CALCULATION 2012
Annual energy produced by group of plants k MWh 3,127,200
Intersection point with the horizontal line MW 366
No. hours that plants k are on the margin hours 2
Number of days in the year 366
λ % 0.0002
1 - λ % 0.9998
-
200
400
600
800
1,000
1,200
MW
Hours
Horizontal line Load duration curve
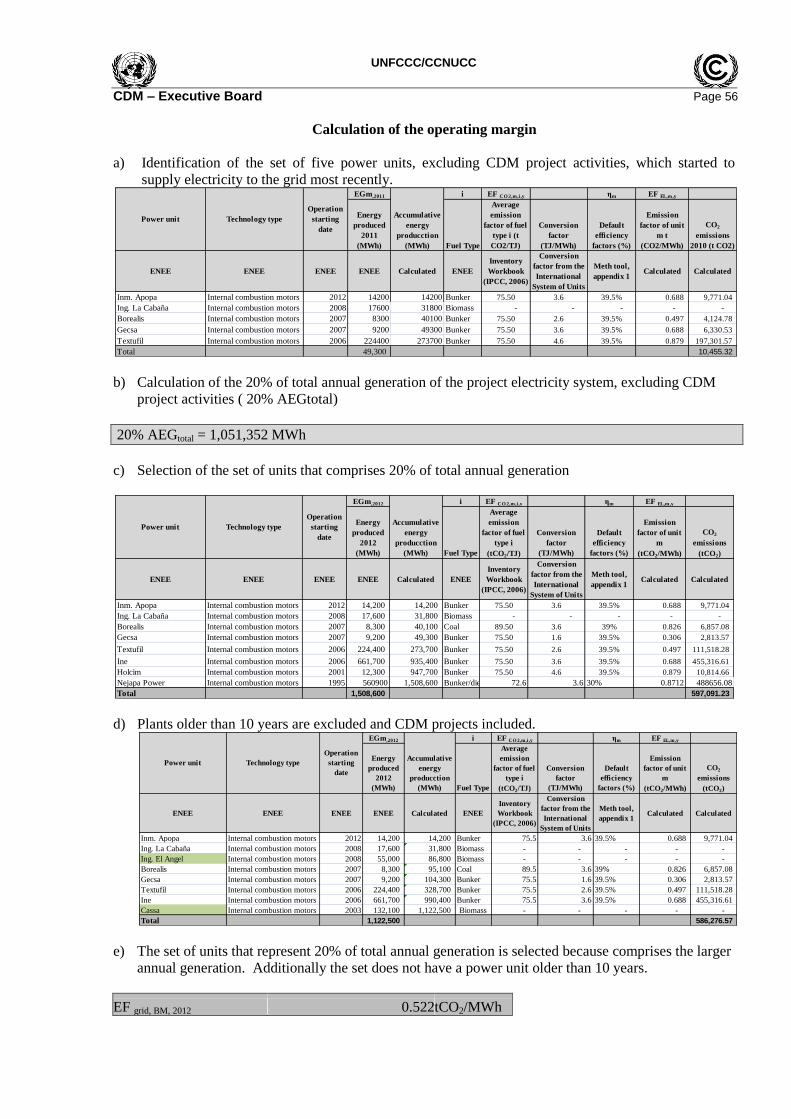
UNFCCC/CCNUCC
CDM – Executive Board Page 56
Calculation of the operating margin
a) Identification of the set of five power units, excluding CDM project activities, which started to
supply electricity to the grid most recently.
b) Calculation of the 20% of total annual generation of the project electricity system, excluding CDM
project activities ( 20% AEGtotal)
20% AEGtotal = 1,051,352 MWh
c) Selection of the set of units that comprises 20% of total annual generation
d) Plants older than 10 years are excluded and CDM projects included.
e) The set of units that represent 20% of total annual generation is selected because comprises the larger
annual generation. Additionally the set does not have a power unit older than 10 years.
EF grid, BM, 2012 0.522 tCO2/MWh
EGm,2011 i EF CO 2,m,i,y ηm EF EL,m,y
Energy
produced
2011
(MWh)
Accumulative
energy
producction
(MWh) Fuel Type
Average
emission
factor of fuel
type i (t
CO2/TJ)
Conversion
factor
(TJ/MWh)
Default
efficiency
factors (%)
Emission
factor of unit
m t
(CO2/MWh)
CO2
emissions
2010 (t CO2)
ENEE ENEE ENEE ENEE Calculated ENEE
Inventory
Workbook
(IPCC, 2006)
Conversion
factor from the
International
System of Units
Meth tool,
appendix 1Calculated Calculated
Inm. Apopa Internal combustion motors 2012 14200 14200 Bunker 75.50 3.6 39.5% 0.688 9,771.04
Ing. La Cabaña Internal combustion motors 2008 17600 31800 Biomass - - - - -
Borealis Internal combustion motors 2007 8300 40100 Bunker 75.50 2.6 39.5% 0.497 4,124.78
Gecsa Internal combustion motors 2007 9200 49300 Bunker 75.50 3.6 39.5% 0.688 6,330.53
Textufil Internal combustion motors 2006 224400 273700 Bunker 75.50 4.6 39.5% 0.879 197,301.57
Total 49,300 10,455.32
Power unit Technology type
Operation
starting
date
EGm,2012 i EF CO 2,m,i,y ηm EF EL,m,y
Energy
produced
2012
(MWh)
Accumulative
energy
producction
(MWh) Fuel Type
Average
emission
factor of fuel
type i
(tCO2/TJ)
Conversion
factor
(TJ/MWh)
Default
efficiency
factors (%)
Emission
factor of unit
m
(tCO2/MWh)
CO2
emissions
(tCO2)
ENEE ENEE ENEE ENEE Calculated ENEE
Inventory
Workbook
(IPCC, 2006)
Conversion
factor from the
International
System of Units
Meth tool,
appendix 1Calculated Calculated
Inm. Apopa Internal combustion motors 2012 14,200 14,200 Bunker 75.50 3.6 39.5% 0.688 9,771.04
Ing. La Cabaña Internal combustion motors 2008 17,600 31,800 Biomass - - - - -
Borealis Internal combustion motors 2007 8,300 40,100 Coal 89.50 3.6 39% 0.826 6,857.08
Gecsa Internal combustion motors 2007 9,200 49,300 Bunker 75.50 1.6 39.5% 0.306 2,813.57
Textufil Internal combustion motors 2006 224,400 273,700 Bunker 75.50 2.6 39.5% 0.497 111,518.28
Ine Internal combustion motors 2006 661,700 935,400 Bunker 75.50 3.6 39.5% 0.688 455,316.61
Holcim Internal combustion motors 2001 12,300 947,700 Bunker 75.50 4.6 39.5% 0.879 10,814.66
Nejapa Power Internal combustion motors 1995 560900 1,508,600 Bunker/diesel 72.6 3.6 30% 0.8712 488656.08
Total 1,508,600 597,091.23
Power unit Technology type
Operation
starting
date
EGm,2012 i EF CO 2,m,i,y ηm EF EL,m,y
Energy
produced
2012
(MWh)
Accumulative
energy
producction
(MWh) Fuel Type
Average
emission
factor of fuel
type i
(tCO2/TJ)
Conversion
factor
(TJ/MWh)
Default
efficiency
factors (%)
Emission
factor of unit
m
(tCO2/MWh)
CO2
emissions
(tCO2)
ENEE ENEE ENEE ENEE Calculated ENEE
Inventory
Workbook
(IPCC, 2006)
Conversion
factor from the
International
System of Units
Meth tool,
appendix 1Calculated Calculated
Inm. Apopa Internal combustion motors 2012 14,200 14,200 Bunker 75.5 3.6 39.5% 0.688 9,771.04
Ing. La Cabaña Internal combustion motors 2008 17,600 31,800 Biomass - - - - -
Ing. El Angel Internal combustion motors 2008 55,000 86,800 Biomass - - - - -
Borealis Internal combustion motors 2007 8,300 95,100 Coal 89.5 3.6 39% 0.826 6,857.08
Gecsa Internal combustion motors 2007 9,200 104,300 Bunker 75.5 1.6 39.5% 0.306 2,813.57
Textufil Internal combustion motors 2006 224,400 328,700 Bunker 75.5 2.6 39.5% 0.497 111,518.28
Ine Internal combustion motors 2006 661,700 990,400 Bunker 75.5 3.6 39.5% 0.688 455,316.61
Cassa Internal combustion motors 2003 132,100 1,122,500 Biomass - - - - -
Total 1,122,500 586,276.57
Power unit Technology type
Operation
starting
date
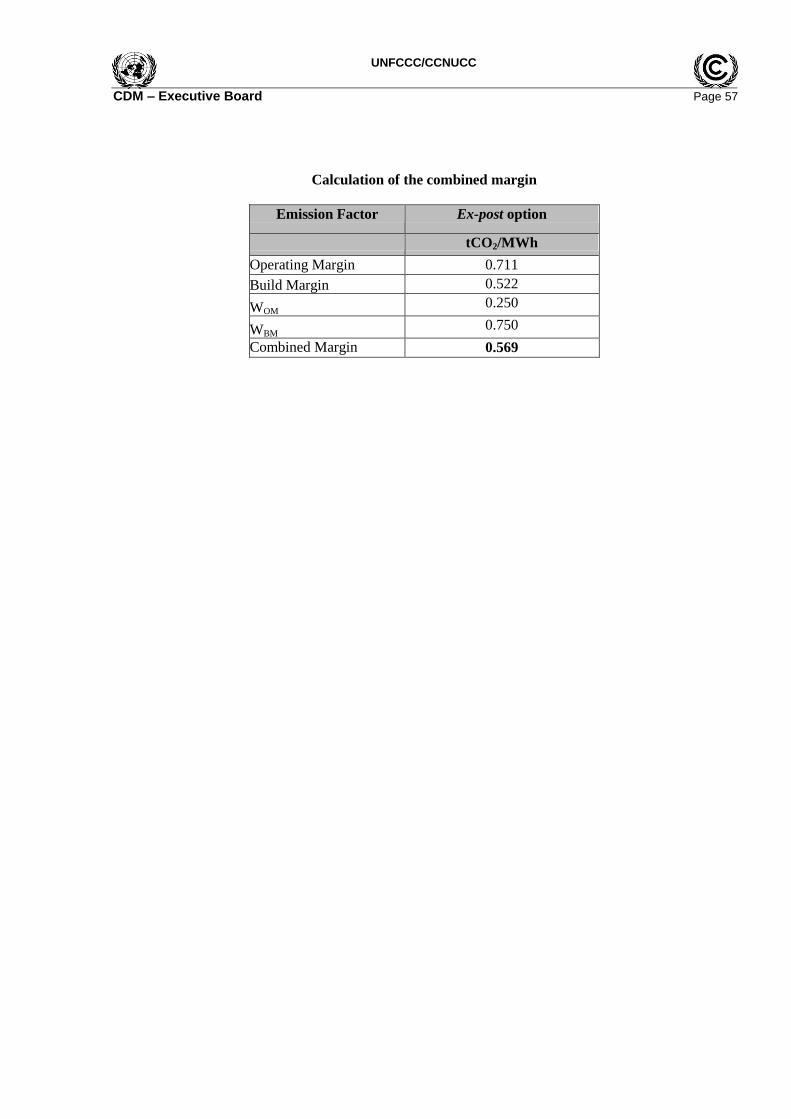
UNFCCC/CCNUCC
CDM – Executive Board Page 57
Calculation of the combined margin
Emission Factor Ex-post option
tCO2/MWh
Operating Margin 0.711
Build Margin 0.522
WOM 0.250
WBM 0.750
Combined Margin 0.569
UNFCCC/CCNUCC
CDM – Executive Board Page 58
Appendix 5: Further background information on monitoring plan
This section is intentionally left empty (see section D for monitoring plan).
Appendix 6: Summary of post registration changes
Permanent changes from registered monitoring plan or applied methodology
1. The monitoring plan has been revised to consider the parameter Mt,y (quantity of steam generated
during well testing) as negligible. The revision was approved on June 10, 2009.
2. The monitoring plan was revised in 2011 in order to be more realistic and according to
ACM0002. The revision was approved on May 3, 2011.
Changes to start date of crediting period
1. The starting date on the registered PDD changed from June 1st, 2006 to January 1st, 2007.

UNFCCC/CCNUCC
CDM – Executive Board Page 59
- - - - -
History of the document
Version Date Nature of revision
04.1 11 April 2012 Editorial revision to change version 02 line in history box from Annex 06 to Annex 06b.
04.0 EB 66 13 March 2012
Revision required to ensure consistency with the “Guidelines for completing the project design document form for CDM project activities” (EB 66, Annex 8).
03 EB 25, Annex 15 26 July 2006
02 EB 14, Annex 06b 14 June 2004
01 EB 05, Paragraph 12 03 August 2002
Initial adoption.
Decision Class: Regulatory Document Type: Form Business Function: Registration