Embed Size (px)
Citation preview

PROJECT DESIGN DOCUMENT FORM (CDM PDD) - Version 03.1.
CDM Executive Board
CLEAN DEVELOPMENT MECHANISM
PROJECT DESIGN DOCUMENT FORM (CDM-PDD)
Version 03 - in effect as of: 28 July 2006
CONTENTS
A. General description of project activity
B. Application of a baseline and monitoring methodology
C. Duration of the project activity / crediting period
D. Environmental impacts
E. Stakeholders‟ comments
Annexes
Annex 1: Contact information on participants in the project activity
Annex 2: Information regarding public funding
Annex 3: Baseline information
Annex 4: Monitoring plan

PROJECT DESIGN DOCUMENT FORM (CDM PDD) - Version 03.1.
CDM Executive Board
SECTION A. General description of project activity
A.1 Title of the project activity:
Project Title: “Pelita Agung Agrindustri Biomass Cogeneration Plant”
PDD Version: Version 1.1.0
Completion Date: 18/03/2008
A.2. Description of the project activity:
Pelita Agung Agrindustri (PAA) commenced construction of an integrated palm oil processing complex in early 2005. When
completed, the complex will consist of a palm oil mill, four lines of kernel crushing plants, one crude palm oil refinery unit, two
lines of transesterification (biodiesel), glycerine distillation, as well as a number of storage tanks (tank farms). By the time of
validation, only the mill and (one) kernel crushing plant are in operation with limited load pending to the completion of its
downstream facilities expected to be in mid 2008. At its full operation, the complex will have the capacity to process palm fresh
fruit bunches into various products including cooking oil, stearine, purified fatty acid distillate, bio-diesel, glycerine. The new
complex is located in the Province of Riau, on the Island of Sumatra, Indonesia.
In order to meet the high demand of steam and electricity, PAA implemented renewable energy initiatives covering construction
of (a) co-generation plant powered using biomass generated by its upstream milling activities and (b) biogas extraction project to
treat the complex‟ effluent, diverting from traditional method of relying on fossil fuel. Both projects are implemented with
assistance of CDM although applications are made on under separate PDD. This PDD covers only for the biomass co-generation
project (“the Project”).
The Project consists of three identical parallel trains of combined heat and power (CHP) units each consisting of a boiler and a
turbine. In total, the system will have the capacity to deliver up to 9.2Mwe (gross) of electricity, and 95MWth of steam meeting
almost1 all of PAA‟s complex energy requirements: 75tonnes per hour of low pressure steam, 15 tonnes per hour of medium
pressure steam, and up to 8.5MW to power the complex including its supporting facilities.
In addition to a drastic reduction of solid waste volume from its upstream processing unit (the palm oil mill), the Project provides
renewable steam and electricity for PAA energy-hungry downstream processing facilities which in other situation would have
been generated using fossil fuel. It is projected that at full operation more than half of the energy requirement would have been
self-generated, with the rest are powered using residues from other palm oil producer. Upon the Project completion, PAA facilities
including its offices and staff residents, would be powered by the Project and with no imports from national grid, enabling PAA
be produce fossil-free end-products.
Contribution to Sustainable Development
The Project supports sustainable development in the following ways:
∷ Elimination of oil-based captive power/steam generation typically employed by downstream processing facilities. By
utilizing biomass exclusively, the Project eliminates the need for PAA to generate fossil-based electricity/steam that would
consequently contribute to green-house-gas emission;
∷ Highly efficient operation. The integration of palm oil mill and its downstream processing facilities complemented with
renewable energy technologies increase the overall efficiency of energy consumption and green-house-gas emission per unit
of end-products.
The integration allows energy consumption to be drastically reduced by elimination of transportation of intermediate products
between facilities, such as: transportation of biomass residues from mill to power/heat generation plants, transmission loss,
transportation of CPO from mill to refinery & biodiesel plants.
1 Very high pressure steam for refining is met using methane extracted from the waste-water

PROJECT DESIGN DOCUMENT FORM (CDM PDD) - Version 03.1.
CDM Executive Board
∷ Utilization of unused biomass. The Project consumes entirely all residue generated by the palm oil mill including its empty
fruit bunches, preventing it from emitting methane during its decomposition.
Without the Project, PAA can-not sufficiently meet its large energy demand using its available biomass, and thus must meet its
remaining demand using prevailing fuels.
A.3. Project participants:
Table 1 – Party(ies) Involved
Name of Party Involved Private and/or Public Entity(ies) Project Participants Kindly Indicate if the Party involved wishes to be
considered as Project Participant
Indonesia (host) PT Pelita Agung Agrindustri, Private Entities No
Japan Mitsubishi UFJ Securities Co., Ltd., Private Entities No
PT Pelita Agung Agrindustri (PAA) is wholly owned by PT Permata Hijau Group based in Medan, North Sumatra, Indonesia.
The group operates palm plantations, palm oil mills, refineries, bulk storage terminal, and recently entering bio-fuel industry with
inception of PAA.
Mitsubishi UFJ Securities Co., Ltd. is the CDM consultant of this Project.
A.4. Technical description of the project activity:
A.4.1. Location of the project activity:
A.4.1.1. Host Party(ies):
Indonesia
A.4.1.2. Region/State/Province etc.:
The Province of Riau
A.4.1.3. City/Town/Community etc:
Sebangar Hamlet, Mandau District, Town of Bengkalis
A.4.1.4. Detail of physical location, including information allowing the unique identification of
this project activity (maximum one page):
The Project is located within PAA palm processing complex. The Project geographical location is shown in the following figure.
PROJECT DESIGN DOCUMENT FORM (CDM PDD) - Version 03.1.
CDM Executive Board
PAA is located on KM No. 26 (Simpang Bangko) of the main road connecting the City of Duri and the City of Dumai (Lintas
Duri Dumai) at 1° 25‟ 41.75”N and 101° 11‟ 21.29“ E.
A.4.2. Category(ies) of project activity:
The Project falls under:
Sectoral Scope I, Energy Industry; and
Sectoral Scope II, Waste Handling & Disposal
A.4.3. Technology to be employed by the project activity:
Project Equipment The Project involves the installation of three (3) identical parallel trains of combined heat and power (CHP)
units. The simplified process flow diagram of the units is illustrated in Figure 2 overleaf. Each train consists of a biomass boiler
connected sequentially to a steam turbine and a generator. The installed capacities and annual outputs of each boiler and turbine
are provided in the following Table 2.
Table 2 – Boiler and Turbine Installed Capacity and Output
Train Installed Capacity
Boiler Turbine/Generator
I 35MWth (40TPH) 3.2MWe
II 35MWth(40TPH) 3.2MWe
III 35MWth(40TPH) 2.8MWe
The boilers are manufactured by Vickers-Hoskins (M). Sdn. Bhd. with license from Babcock Energy Ltd. in United Kingdom.
The steam turbines and generators are manufactured by United States based Dresser-Rand and Newage AVK respectively.
The CHP system is equipped with (a) biomass treatment system to pre-treat the biomass and (b) reverse osmosis water treatment
plant to meet the system water demand.
Process Description The biomass boiler obtained energy from the combustion of biomass mixture consisting of palm kernel shell
(shell), mesocarp fibre (fibre) and treated empty fruit bunches (EFB) which has been pre-treated to ensure efficient combustion.
PROJECT
SITE
Figure 1 – Project Location in Riau Province, City of Bengkalis

PROJECT DESIGN DOCUMENT FORM (CDM PDD) - Version 03.1.
CDM Executive Board Each boiler is capable to deliver 40tonnes per hour (TPH) of superheated steam at 32barg or 3,300kPaa and will be operated at
3,000kPa(a) with maximum outlet temperature of 320degC. About 10% of this steam are withdrawn as medium pressure steam for
heat exchange applications in the biodiesel and glycerine plant after pressure adjustment in a pressure reducing valve.
The remaining steam from biomass boiler are fed to the steam turbines, each is connected to a power generator. The steam turbine
expands the steam pressure from 3,000kPa to 300kPa driving the attached power generator to produce up to 9.2 MW of electricity.
The generated electricity is sufficient to meet all PAA production needs as well as office use, staff dormitory and lighting within
PAA complex, and thus eliminates the need to purchase electricity from the grid for domestic usages.
Low-pressure steam from the back pressure vessel is distributed to various areas including to pressure-cook the fresh fruit bunches
in the mill, direct usage in the kernel crushing, and glycerine distillation, and general heat exchange processes in all areas. Un-
used low pressure steam are recirculated. Only small portion of the water used for low pressure application can be recovered as
condensate, the rest must be treated in the anaerobic digesters in the waste-water treatment plants.
The biomass fuel feeding system includes pressing and shredding machines to treat EFB and automated using mechanical
conveyor belt system, requiring minimum operator intervention. Prior to feeding, the pressed/shredded EFB are in contact with
hot air from boiler‟s exhaust to adjust its moisture to acceptable level.
There is a future plan to add a new burner parallel to these boilers to recover heat from unused biogas obtained from the bio-
digester and thus reduces flaring. However, implementation of this plan is pending to confirmation that there is sizable excess
biomass2.
2 The biodigester has completed construction but not yet running at the time of PDD writing, pending to the completion of the refinery construction.

PROJECT DESIGN DOCUMENT FORM (CDM PDD) - Version 03.1.
CDM Executive Board
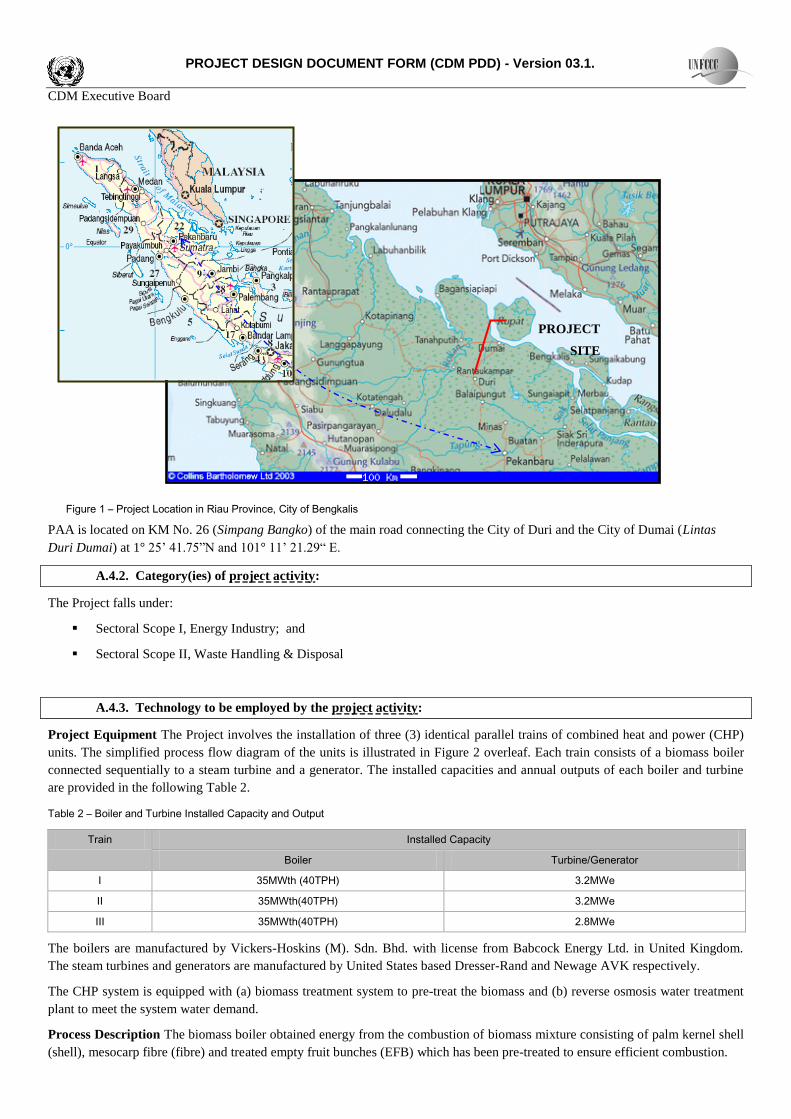
Figure 2 - Simplified Process Flow Diagram of the Cogeneration System
Medium pressure
Steam users
Low pressure
Steam users
Pressur e Reducing
Valve
Back Pressure
Vessel
High Pressure
Steam Header
Feed Water
Tank
circulating water
Turbine
Generator
Turbine
Generator
Turbine
Generator
Biomass
boilers
Biomass
boilers
Biomass
boilers
Make-up water from
Reverse Osmosis
Biomass
Fuel mix
e lectricity

PROJECT DESIGN DOCUMENT FORM (CDM PDD) - Version 03.1.
CDM Executive Board
Page 7
The proposed power/heat generations represents a considerably more complex set of system than those typically practised by
Indonesian palm oil industry. Typically, palm oil mill and kernel crushing plant (referred hereafter as „upstream facilities‟) is
located in-land closer to palm plantation, whereas the refinery and other more complex chemical productions (referred hereafter as
„downstream facilities‟) are located closer to a maritime access.
With this Project, PAA attempts to take a more holistic approach in its production by combining the residue generating upstream
activity (palm oil mill) and the energy-intensive downstream processing. The Project therefore represents a link of delicate
balance between these two aspects of operations. Interruption in the palm oil mill, for example, influences the production of
biomass fuel and high pressure steam supply to refinery which relies on the biogas extracted from the mill‟s waste water. In order
to ensure success, PAA took caution in implementing this Project by providing buffer of biomass fuel and intermediate-products
to minimize impact.
The combustion of EFB is widely applied in Malaysia with the advent of CDM. However, Indonesia is slow in catching up and
PAA was the first EFB consuming project in Indonesia to apply for CDM assistance but application was delayed due to
unavailability of a suitable methodology.
A.4.4 Estimated amount of emission reductions over the chosen crediting period:
Table 3 – Estimated annual emission reduction over the chosen crediting period
Year Annual Estimation of Emission Reduction
in t-CO2/yr
1 149,686
2 157,229
3 164,512
4 171,545
5 178,336
6 184,893
7 191,225
8 197,339
9 203,242
10 208,943
Total estimated emission reduction (t-CO2/yr) 1,806,950
Total number of crediting years 10
Annual average over the crediting period of estimated reductions (t-CO2/yr) 180,695
A.4.5. Public funding of the project activity:
This Project does not receive any public funding in its financing.

PROJECT DESIGN DOCUMENT FORM (CDM PDD) - Version 03.1.
CDM Executive Board
Page 8
SECTION B. Application of a baseline and monitoring methodology
B.1. Title and reference of the approved baseline and monitoring methodology applied to the project activity:
The approved methodology applicable to this Project is ACM0006 Version 06 (EB33). The title of the methodology is:
“Consolidated Methodology Electricity Generation from Biomass Residue”
Other methodological tools used are:
“Tool to calculate project or leakage CO2 emissions from fossil fuel combustion” Version 01 (EB32)
“Combined tool to identify the baseline scenario and demonstrate additionality” Version 02.1 (EB28)
“Tool to determine methane emissions avoided from dumping waste at a solid waste disposal site” (EB35)
This PDD is completed in accordance with Guideline in Completing CDM-PDD and CDM-NM Version 06.2.
B.2 Justification of the choice of the methodology and why it is applicable to the project activity:
The Project is a cogeneration plant fuelled using biomass residue and is implemented as the utility facility of a new integrated
palm oil processing complex. The Project involves the installation of a new biomass residue power and heat generation plant
where previously no power and heat generation occurs (green-field project), thus meeting the general description of Project under
ACM0006.
The following assessment demonstrates that the Project is applicable to apply ACM0006:
The biomass residue used by the Project (palm kernel shell, mesocarp fibres, and empty fruit bunches) are the by-product,
residue or waste stream from agriculture related industries (palm oil mill) and does not include municipal wastes or other
wastes that contain fossilized or non-biodegradable material. Thus, the biomass residue used by the Project meets the
definition of biomass residue characterized in ACM0006;
The Project was designed to supply PAA complex, which itself is also a new facility with pre-defined capacity and demands.
Its implementation deemed not to increase the processing capacity of the raw input material of the palm oil mill other than the
pre-designated capacity.
The biomass residues used by the Project will not be stored for more than one year. Under normal circumstances, untreated
EFB is expected not to be stored and storage capacity for buffer shell is no more than a few months.
The dry biomasses: shell and fibre do not need additional energy for treatment as it is also used in the baseline. The wet
biomass (EFB) requires pressing, drying and mechanical shredding to reduce its moisture content and ensure smooth feeding
to the boiler. Drying is performed by subjecting the wet biomass to the exhaust of the boiler combustion chamber on a
moving conveyour belt, resulting in no significant increase of energy utilization. However, pressing and mechanical
shredding requires a sizable amount of electricity which is made possible by the co-generation system.
It is pertinent to note that the bio-diesel plant in PAA complex exclusively processes refinery products via esterification.
However, the product of esterification process will not be used as fuel to the Project plants.
It can then be deduced that apart from transportation and mechanical treatment, no significant energy quantity is required to
prepare the biomass residues (EFB, fibre, or shell) for fuel combustion.
It is demonstrated under Section B4, that the baseline Scenario of the Project meets the situation described in Scenario 20 of
Table 2 of ACM0006.
B.3. Description of the sources and gases included in the project boundary
Sources and gases included in the project boundary are summarized in Table 4.
The following sources are excluded:
1. Emissions from storage of biomass This emission source is excluded in the chosen methodology and deemed appropriate as
the storage period of biomass fuel is short.

PROJECT DESIGN DOCUMENT FORM (CDM PDD) - Version 03.1.
CDM Executive Board
Page 9
2. Pre-treatment of biomass As elaborated under applicability conditions (Section B2), EFB requires pre-treatment to reduce
its moisture content to ensure efficient boiler feeding. The process results in the generation of EFB liquor which is then
processed in a closed bio-digestion system where all methane are captured and used to replace fuel for one of the boiler in the
refinery. The drying is done through evaporation by subjecting shredded biomass on conveyor belt to hot air from boiler
immediately before feeding. Thus, it can be concluded that no additional emissions results from this pre-treatment system.
3. Electricity usages The entire PAA facility, including office & staff dormitory is not connected to external electricity grid.
Any electricity needed will be drawn from the project output – which is entirely generated from renewable energy. For plant
start-up or electricity consumption during project down-time, electricity will be drawn from back-up diesel gen-set, which
emissions are accounted as „on-site fossil fuel usage‟. Thus, electricity usage is not accounted as an isolated emission source
but rather as emission from combustion of on-site fossil fuel.
Table 4 – Sources and gases included in the project boundary
BASELINE SCENARIO ACTIVITY
Source Gas Details
Electricity generation CO2 CO2 emissions from the consumption of diesel oil to generate electricity in the power generator.
Heat generation CO2 CO2 emissions from the combustion of residue oil in the baseline fossil fuel boiler to supplement
energy unable to be met by biomass utilization alone
Decay of biomass CH4 CH4 emissions from the decay of landfilled EFB
PROJECT ACTIVITY
Source Gas Details
Onsite fossil fuel usage CO2 CO2 emissions from on-site utilization of fossil fuel including for electricity generation attributable to the
Project, ie. to start-up project equipments (as defined in Section A.4.3). This does not cover fuel
consumption by the stand-by gensets to generate electricity for the offices, process users, during
project down-time. Co-firing is unforeseen, but included as parameter to be monitored.
Offsite transportation of
biomass residue
CO2 CO2 emission from the transportation of biomass imported to PAA complex.
The remaining biomass is self-generated on-site and movement is done using conveyor belt system
consuming electricity from the project.
Combustion of biomass
residue for Project activity
CH4 CH4 emission in the stack gas of the biomass boiler combustion chambers
Spatial project boundary The spatial extent of the project boundary encompasses the cogeneration plants at the project site, the
means of biomass transportation, the site where preparation and storage of biomass occurs and the site where the biomass would
have been left to decay. With consideration that PAA does not have electrical connection for import or export of electricity, the
project boundary does not include power plants in the public grid.

PROJECT DESIGN DOCUMENT FORM (CDM PDD) - Version 03.1.
CDM Executive Board
Page 10
B.4. Description of how the baseline scenario is identified and description of the identified baseline scenario:
The following section determines the most likely alternative to the Project and embodied Step 1 (identification of alternative) of
the „Combined tool to determine baseline scenario and demonstrate additionality‟. Subsequent steps of the tool (demonstration of
additionality) are described in Section B.5.
STEP 1 – Identification of alternative Scenarios
Step 1(a) – Define alternative scenarios to the proposed CDM project activity
As prescribed in Section II of the applied methodology, baseline identification process should assess how power and heat
would have been generated, and how the biomass would have been handled in the absence of the Project.
Determination of baseline scenarios for biomass handling
As required by the methodology, the application of Step 1 must take into account the following alternatives into
consideration during baseline determination:
Table 5 – Biomass Baseline Scenarios to be considered as per ACM0006
Scenario Description
B1 The biomass residues are dumped or left to decay under mainly aerobic condition. This applies, for example, to
dumping and decay of biomass residues on fields.
B2 The biomass residues are dumped or left to decay under clearly anaerobic conditions. This applies, for example, to
deep landfills with more than 5m.
B3 The biomass residues are burnt in an uncontrolled manner without utilizing it for energy purposes.
B4 The biomass residues are used for heat and/or electricity generation at the project site.
B5 The biomass residues are used for power generation, including cogeneration, in other existing or new grid-connected
power plants.
B6 The biomass residues are used for heat generation in other existing or new boilers at other sites.
B7 The biomass residues are used for other energy purposes, such as the generation of biofuels
B8 The biomass residues are used for non-energy purposes, e.g. fertilizer or as feedstock in the processes.
As required by the baseline methodology, the baseline analysis of the biomass residues is identified for each type of
biomass. Biomass residue from different sources is considered as different type of biomass residue. The classification
and utilization of biomass in this Project and results of its assessment is summarized in the following table. The
assessment process is described in the next few paragraphs.
Table 6 - Biomass Classification, Projected Utilization, and Baseline Scenarios Considered
Biomass
Type
Description and Note Projected annual consumption Baseline Scenario Evaluation
Tonnes/yr TJ/yr Considered Concluded
K1 Onsite generated, meso-carp fibre 46,230 428 B4, B5, B6 B4
K2 Onsite generated, palm kernel shell 31,050 488 B4,B5,B6 B4
K3 Imported, palm kernel shell used in
both the baseline and project situation
3,126 49 B4,B5,B6 B4

PROJECT DESIGN DOCUMENT FORM (CDM PDD) - Version 03.1.
CDM Executive Board
Page 11
K4 Imported, palm kernel shell used only
in the project situation
77,229 1,214 B4,B5,B6 B4
K5 Onsite generated, empty fruit bunches
from PAA mills
93,150(untreated) or
64,860 (treated)
549 B1, B2, B3, B8 B2
Note: The term ‘on-site’ referred to biomass generated by PAA palm oil mill, as oppose to biomass ‘imported’ from other mills outside
PAA.
Biomass K1 : mesocarp fibre from PAA
Mesocarp fibre represents the most widely used biomass energy source in the palm oil industry, consequently:
(a) Scenarios involving biomass being dumped (B1, B2) or burnt in uncontrolled manner (B3) are excluded;
(b) Scenarios involving the use of this biomass for other energy purpose such as bio-fuels(B7) or non-energy purposes
such as fertilizer (B8) are non-existent, and thus excluded.
(c) Scenarios involving utilization of fibre as energy source in the baseline [B4, B5, and B6] are credible alternative and
considered for further evaluation.
However, with consideration of PAA large energy demand, it is unlikely that PAA would sell this biomass to other
parties for power/heat generation as described in Scenario B5 and B6. It is likely that this biomass is used by PAA itself
as energy source – as with any other palm oil mill, and thus baseline Scenario B4 is the most credible baseline scenario
for Biomass K1.
Biomass K2 ,K3,and K4 : palm kernel shell
The utilization of kernel shell for palm oil players differs from operator to operator. Traditional palm oil mill which
needs little electricity can meet its energy demand by combustion of fibre, and small amount of shell using low-
efficiency simple co-generation technology. The remaining shells are used for non energy purpose such as plantation-
road reinforcement to reduce slip during wet season, and therefore left to decay aerobically.
Less commonly, minority players operate a kernel crushing facility (like PAA) which requires more electricity than a
mill3. For this type of operator, the kernel shell plays an important energy source to generate steam and electricity which
is typically done by increasing the capacity of the low pressure co-generation system. As such, for palm kernel shell:
(a) Scenarios involving biomass being dumped (B1, B2) or burnt in uncontrolled manner (B3) are excluded;
(b) Scenarios involving the use of this biomass for other energy purpose such as bio-fuels(B7) or non-energy purposes
such as fertilizer (B8) are non-existent, and thus excluded.
(c) Scenarios involving utilization as energy source in the baseline [B4, B5, and B6] are credible alternative and
considered for further evaluation.
Biomass K2, ,on-site palm kernel shell. With consideration that PAA energy demands is higher than typical industry
practice due to its large downstream processing activities; it is unlikely that biomass K2 is sold to other parties for energy
purpose (B5 and B6). Thus, scenario B4 is the only credible alternative for this type of biomass.
Biomass K3, and K4 , shell from other mills. PAA purchased shell from traditional millers who utilized fibre for its
operation and shell partially, and left excess shell unused and decay aerobically (B1). Such millers however is expected
to be aware of shell economic value in future and sold this biomass to industries in need of large energy source like PAA
(B5 and B6). Thus, in all likelihood, biomass K3 and K4 will be used as energy source whether at PAA site (B4), or other
industrial sites (B5 and B6).
At the time of decision making, the utilization of shell for energy purpose outside the upstream palm oil mill & kernel
crushing was not a common practise but becoming more common with the advent of CDM. In terms of calculation of
baseline emission, the use of biomass at any sites (PAA or other industrial site), for whichever purposes (heat or
3 The ratio of kernel crushing facility is about 1:11, 1 kernel crushing plant with typical size of 600TPD services about 10mills with average capacity of 45TPH. However, even for such players, there are still considerable amount of excess shell available.

PROJECT DESIGN DOCUMENT FORM (CDM PDD) - Version 03.1.
CDM Executive Board
Page 12
electricity) has little influence in determining the baseline emission. As such, for all intent and purposes, this biomass is
considered to have baseline B4.
Biomass K5, empty fruit bunches from PAA mills. The utilization of EFB as energy source was not a common practise
before the advent of CDM. When the project proponent decided to explore this project in 2004, there was no palm oil
mill in Indonesia to implement large scale EFB boilers with or without CDM. Until today, only two EFB power plants in
Indonesia are applying for CDM. Both are not yet registered at the time of PDD writing and are non-cogeneration type.
Others, prefer to use EFB as material for composting with assistance of CDM.
EFB is not commonly used in palm mill power plants for a number of reasons: (a) the pre-treatment process is energy
and capital intensive and (b) a typical non-integrated stand-alone mill hardly needs electricity, and the necessary steam
can be supplied from fibre combustion alone.
For the Project, PAA installed four EFB treatment process with total electrical consumption of 536kWh or nearly 40% of
the electricity needed by the mill itself. Thus, it is clear that without any sufficient and economical electrical output,
utilization of EFB as fuel is not an attractive option. In addition to this, the cost of these treatment plant itself is not
insignificant thus further hindering its utilization as energy source.
As indicated in Table 6, EFB contributes to only 20% of the total fuel mix on energy basis despite the additional capital
requires for treatment plants and considerably large electrical requirement for pre-treating the material. These factors
deem that usage of EFB as fuel is prohibitive whenever system with lower efficiency is employed. Consequently,
alternatives involving the utilization of EFB as energy source (Scenario B4, B5,and B6) are excluded from further
consideration in the baseline.
A number of technical papers cited the potential use of EFB as: (1) potential feedstock for refused derived fuel (Scenario
B7); (2) potential feedstock for pulp and paper industry (Scenario B8); and (3) feedstock for composting (Scenario B8).
Currently, the first two situations are still in research and development and non-existent in Indonesia, and thus both are
excluded from further consideration. However, Scenario 3 is a credible option and will be further assessed.
With the exclusion of some scenarios above, the remaining credible scenarios are scenarios involving the disposal of
EFB (Scenario B1, B2, B3), and scenario involving the use of EFB for composting (B8) and discuss in the following
paragraphs:
A. Scenario B1, biomass disposal in mainly aerobic condition. The disposal of empty fruit bunches in mainly aerobic
condition is associated with the use of the material for mulching. For PAA, this does not provide a long-term
solution to its requirement to manage empty fruit bunch for the following reasons:
(1) Costs incurred for material movement PAA is not bordered by its own plantation, and which means the
use of untreated empty fruit bunch as mulch will incur significant costs for material movement (labour and
transportation). It is unlikely that independent farmers who operate the plantation surrounding PAA facility
compensate for delivery of untreated EFB.
(2) Short-term application The application of mulch is intended to reduce water evaporation due to harsh
tropical climate for new plant or during re-planting. After the tree matures, the tree canopy and its dry leaves can
sufficiently fulfil this function. With a life-cycle of 20 years, the demand for mulch is not continuous and no
longer required as soon as the tree reaches its productive stage and evaporation is sufficiently prevented by its
own canopy.
B. Scenario B8, EFB is used for composting (non-energy purpose). Using EFB as composting has been cited as one of
the most potential eco-friendly way of handling EFB. However, its application remains unimplemented in the region
as it requires not insignificant investment. As such, the use of EFB as composting is only feasible with assistance of
CDM as has been evidence with the numerous CDM applications of composting activities in the region. As PAA
operates a relatively large industrial complex, production of compost is not in-line with its core activity and thus less
likely to be considered as an option.
C. Scenario B3, the biomass residue is burnt for non energy purpose. With no other potential usages, PAA facility and
others surrounding the region are equipped with incinerator to destroy the EFB when unconsumed. This incinerator
is simple incinerator with high stack, but no combustion control.The existing incineration in PAA was set up as

PROJECT DESIGN DOCUMENT FORM (CDM PDD) - Version 03.1.
CDM Executive Board
Page 13
temporary measure to destroy EFB generated by the mill before the cogeneration plant is fully operational, and will
be decomissioned after the Project is fully operational.
Under the current environmental regulations, the application of incineration is not prevented as long as it meets the
required ambient air quality governed under the ministrial decree for stationary combustion. The applied standard for
combustion of biomass requires the control of the following emissions: particulate matters, sulfur dioxide, nitrogen
oxides, hydrogen chloride, chlorine, ammonia, hydrogen fluoride, and opacity. It does not control the methane
emission from combustion.
However, many environmental agencies voiced concerns over the use of incineration for the handling of waste due
to fear of the formation of dioxin and furan. As consequence, the continuation of such practise may no longer be
compliance with law in not-too-distant future, as with the case with other countries in the region which banned
incineration by law. Consequently, the only long-term solution within law for PAA is to construct a landfill to
contain its 93,000t per year of EFB.
D. Scenario B4, the biomass residue is managed in a sanitary landfill. If the use of existing incineration is prohibited by
law then the only viable option of managing EFB is the construction of a landfill within vicinity of PAA to avoid
transportation/labour costs. This solution is a feasible option as land is available and economical in the area where
PAA is located and away from residential area. In order to avoid complain from surrounding neighbour, the
constructed landfill must be implemented with sanitary standard, where waste must be compacted, covered, with the
collected leachate treated in PAA waste water treatment facility. However, with consideration of the unstable
emission profile and the size of this private landfill, it is unlikely that methane collection facility is implemented
without CDM.
Based on this long-term view, the most plausible baseline scenario for handling EFB is the construction of a managed
landfill (B2). The baseline emission is calculated using multiphase model as described in the „Tool to determine methane
emissions avoided from dumping waste at a solid waste disposal site‟. The choice of parameters and justifications are
explained in Table 10 and Table 11 of this document in Section B6 (p. 26).
Determination of baseline scenario for power and heat
As stipulated in the methodology, baseline scenarios must be determined for both power and heat by considering
scenarios described in the following table.
Description Description
P1 The proposed project activity not undertaken as a CDM
project activity
H1 The proposed project activity not undertaken as a CDM
project activity
P2 The continuation of power generation in an existing biomass
residue fired powered plat at the project site, in the same
configuration, without retrofitting and fired the same type of
biomass residues as co-fired in the project activity
H2 The proposed project activity (installation of a cogeneration
power plant), fired with the same type of biomass residues
byt with a different efficiency of heat generation.
P3 The generation of power in an existing captive power plant
using only fossil fuel.
H3 The generation of heat in an existing captive cogeneration
plant, using only fossil fuel.
P4 The generation of power in the grid H4 The generation of heat in boilers using the same type of
biomass residues
P5 The installation of a new biomass residue fired power plant,
fired with the same type and with the same annual amount of
biomass residues as the project activity, but with a lower
efficiency of electricity generation than the project plant and
H5 The continuation of heat generation in an existing biomass
residue fired cogeneration plant at the project site, in the
same configuration, without retrofitting and fired with the
same type of biomass residues as in the project activity.
PROJECT DESIGN DOCUMENT FORM (CDM PDD) - Version 03.1.
CDM Executive Board
Page 14
therefore with a lower output than the project case.
P6 The installation of a new biomass residue fired power plant
that is fired with the same type, but higher annual amount of
biomass residues as the project activity and that has a lower
efficiency of electricity generation than the project activity.
Therefore, the power output is the same as the project case.
H6 The generation of heat in boilers using fossil fuel
P7 The retrofitting of an existing biomass residue fired power
plant, that is fired using the same amount of biomass
residues as the project activity, but with a lower efficiency of
electricity generation than the project plant, and therefore
with a lower output than the project case
H7 The use of heat from external sources, such as district heat.
P8 The retrofitting of an existing biomass residue fired power
plant, that is fired using the same type, but higher annual
amount of biomass residues as the project activity, and that
has a lower efficiency of electrical generation than the
project plant.
H8 Other heat generation technologies (eg. Heat pumps or
solar energy).
P9 The installation of new fossil fuel fired captive power plant at
the project site
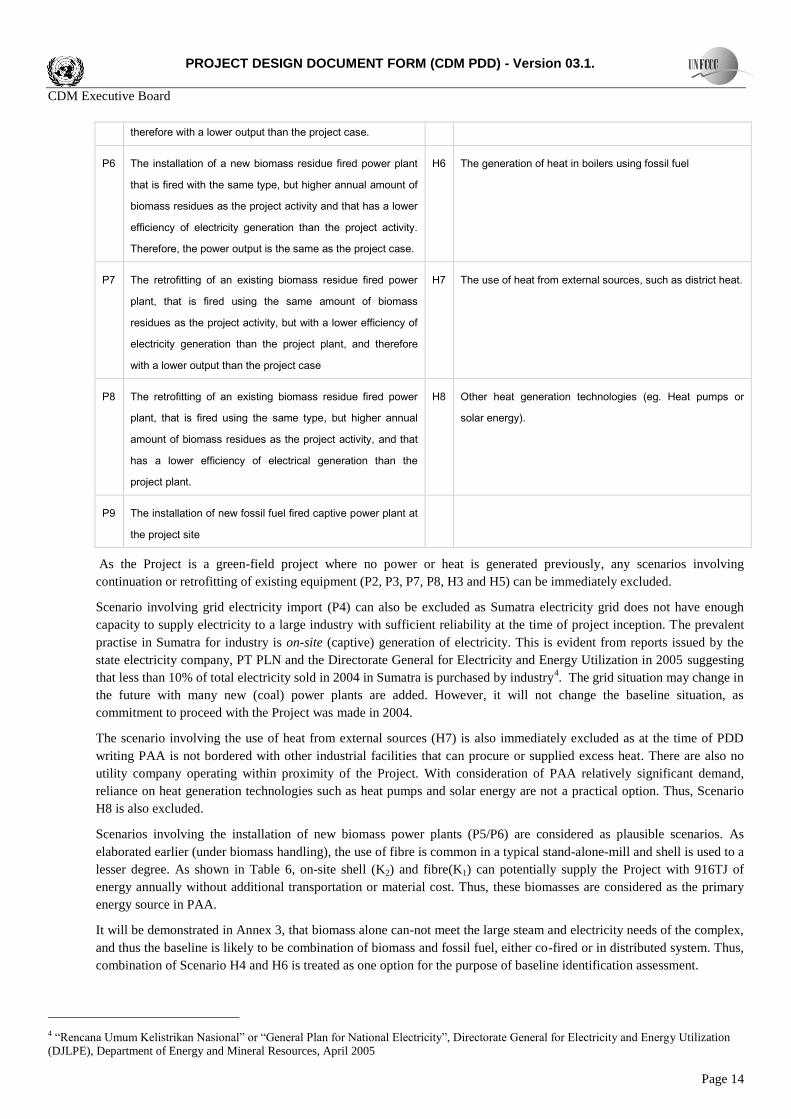
As the Project is a green-field project where no power or heat is generated previously, any scenarios involving
continuation or retrofitting of existing equipment (P2, P3, P7, P8, H3 and H5) can be immediately excluded.
Scenario involving grid electricity import (P4) can also be excluded as Sumatra electricity grid does not have enough
capacity to supply electricity to a large industry with sufficient reliability at the time of project inception. The prevalent
practise in Sumatra for industry is on-site (captive) generation of electricity. This is evident from reports issued by the
state electricity company, PT PLN and the Directorate General for Electricity and Energy Utilization in 2005 suggesting
that less than 10% of total electricity sold in 2004 in Sumatra is purchased by industry4. The grid situation may change in
the future with many new (coal) power plants are added. However, it will not change the baseline situation, as
commitment to proceed with the Project was made in 2004.
The scenario involving the use of heat from external sources (H7) is also immediately excluded as at the time of PDD
writing PAA is not bordered with other industrial facilities that can procure or supplied excess heat. There are also no
utility company operating within proximity of the Project. With consideration of PAA relatively significant demand,
reliance on heat generation technologies such as heat pumps and solar energy are not a practical option. Thus, Scenario
H8 is also excluded.
Scenarios involving the installation of new biomass power plants (P5/P6) are considered as plausible scenarios. As
elaborated earlier (under biomass handling), the use of fibre is common in a typical stand-alone-mill and shell is used to a
lesser degree. As shown in Table 6, on-site shell (K2) and fibre(K1) can potentially supply the Project with 916TJ of
energy annually without additional transportation or material cost. Thus, these biomasses are considered as the primary
energy source in PAA.
It will be demonstrated in Annex 3, that biomass alone can-not meet the large steam and electricity needs of the complex,
and thus the baseline is likely to be combination of biomass and fossil fuel, either co-fired or in distributed system. Thus,
combination of Scenario H4 and H6 is treated as one option for the purpose of baseline identification assessment.
4 “Rencana Umum Kelistrikan Nasional” or “General Plan for National Electricity”, Directorate General for Electricity and Energy Utilization (DJLPE), Department of Energy and Mineral Resources, April 2005

PROJECT DESIGN DOCUMENT FORM (CDM PDD) - Version 03.1.
CDM Executive Board
Page 15
From the above eliminations, the remaining credible scenarios are: P1, P5, P6, P9 for power and H1, H2, H4, H6 for
heat.
Outcome of Step 1a
With non-relevant baseline scenarios are eliminated in the above assessment, the remaining possible combination of
baseline scenarios is summarized in the following table and described in paragraphs underneath as outcome to Step 1a.
Table 7 – Remaining combinations of credible baseline scenarios
Heat H1
Project without CDM
H2
Cogeneration
H4/H6
(Heat generation using biomass and fossil fuel) Power
P1 (Project without CDM) Scenario A × ×
P5 (Cogeneration) × Scenario B ×
P6 (Cogeneration) × Scenario C ×
P9 (Captive power generation) × × Scenario D
Scenario A - Installation of a cogeneration plant with same efficiency as the Project
The Project is carried out without CDM
Scenario B - Installation of a cogeneration plant with lower efficiency using the same amount of biomass as the Project
In this Scenario, power and heat are generated simultaneously using co-generation system which is prevalent in
palm oil industry, low pressure and low efficiency using the same amount of biomass as the Project. The lower
efficiency, however, creates a shortfall of output in comparison to the Project and thus must be compensated
with the adoption of fossil fuel technology to meet the remaining demand.
As the use of EFB in lower efficiency system is prohibitive, only biomass K1, K2, K3, and K4 is used.
Scenario C - Installation of a cogeneration plant with lower efficiency using more biomass as the Project
In this Scenario, power and heat are generated simultaneously using co-generation system which is prevalent in
palm oil industry, lower pressure and lower efficiency. In order to compensate the lower efficiency, the boiler is
designed to combust more biomass to recover more energy.
As the use of EFB in lower efficiency system is prohibitive, the plant is fuelled with biomass K1, K2, K3, and
higher amount of K4.
Scenario D – Separate generation of electricity and heat
Steam Demand for Upstream Processes (Mill and Kernel Crushing Plant). The steam demands for upstream
operations are supplied exclusively using biomass (K1, K2, K3).
Unlike an integrated industry, an independent palm oil mill consumes 100% of its fibre and 2% of its shell for
its thermal and electricity requirement. Greater amount of electricity is needed by minority player who owns and
run kernel crushing facility5.
PAA plans to operate greater than normal kernel crushing facility (almost double the typical capacity).
Combined with the mill, the thermal demand of these facilities is 42TPH of low pressure steam, and if generated
5 In the case of PAA (which operates one of the largest mill size), the mill itself can supply only 69t per day of kernel, which is very small compared to PAA designated 4x275tpd or 1100t per day of installed kernel processing capacity

PROJECT DESIGN DOCUMENT FORM (CDM PDD) - Version 03.1.
CDM Executive Board
Page 16
using biomass boiler with 70% efficiency6, consumes the entire self generated fibre (K1) and shell (K2) with
additional 3,126t/yr of more shell needed to be imported to PAA (K3).
Steam Demand for Downstream Processes (Refinery, Biodiesel, Glycerine Distillation, and Tank Farms)
The combined steam demand of these areas are 32.7TPH of low pressure steam (3bar(g)), and 15TPH of
medium pressure steam (15bar(g)). As stated at earlier section, the common practice is to have these
downstream processes near to a maritime port for ease of distribution away from the upstream processes. In
such case, these processes typically consumes non-biomass fuel.
With highest pressure demand of only 15 bar, the use of cogeneration will not be able to provide sufficient
electricity needed which is in the order of 7.9MW. A simple calculation shows that such system can only
provide less than 6% of the total electricity needed7 and thus is ruled out as possible alternative. Consequently, it
is more likely that the steam requires by the downstream processing facility is generated as per its original
design of the process, supplied by boilers distributed in the individual demand. With consideration of lack of
natural gas pipeline, such boilers is likely to be operated using either residue oil or coal which are considered
more economical than diesel oil. However, the use of coal in distributed boilers system are unlikely due to
impractical fuel feeding system. Based on observation of other operations, it is likely that these boilers would
have been fuelled using residue oil which are more expensive but practical.
Electricity Demand for the Entire Facility With all of its self-generated biomass is concentrated for the use of
steam production in its upstream facility, and the possibility of cogeneration for the downstream steam usage is
ruled out, PAA has only one remaining option: to install a captive power plant to supply its electricity.
The most economical course of option is to install coal power plant due to its economic advantage and access to
fuel8. This is evident by moves initiated by the Indonesian government to reduce consumption of diesel oil as
Indonesia is heading toward a net-oil importing country due to lack of investment in oil exploration. However,
for sake of conservativeness, the baseline is assumed to be diesel oil power plant9.
In all of the above scenarios, biomass K5 (EFB) are not included as energy source and hence landfilled.
Substep 1b Consistency with mandatory applicable laws and regulation
All of the above Scenario A to D are in compliance with applicable legal and regulatory requirement in the host-nation,
including national policy.
Outcome of Step 1b.
Scenario A to D remains as credible alternatives to the Project.
STEP 2 – Barrier Analysis
Substep 2a – Identify barriers that would prevent the implementation of alternative Scenario
This section identify the list of barrier that prevents the implementation of Scenario A-D as described in Step 1
Barrier1 – Relative complexity & practicality of implementation. The alternative is less likely to be executed
than the Project if it represents a less practical option in terms of operation, control and reliability.
6 Maximum efficiency of biomass boiler as cited in Council of Industrial Boiler white paper: “Energy Efficiency & Industrial Boiler Efficiency:
an Industry Perspective” which cited New Biomass Boiler efficiency is in the range of 60% to 70%.
7 The incremental specific enthalpy between medium pressure (2,821 MJ/t) and low pressure steam (2,750 MJ/t) is only 71MJ/t. Thus for
turbine with 97% energy recovery efficiency and the low-pressure steam flowrate of 32.7TPH, the recoverable electricity is 451.4kW or only 5.3% of total electricity demand.
8 Sumatra is the largest coal producing region in Indonesia, and one of the leading coal supplier in Asia Pacific.
9 It is pertinent to note that this decision have several consequences in the barrier analysis, namely that a diesel power plant is more hefty in
operating costs but lower in capital costs compared to a coal power plant. However, the cost-effectiveness of a coal power plant is evident by the apparent proliferation of such technologies in Indonesia.

PROJECT DESIGN DOCUMENT FORM (CDM PDD) - Version 03.1.
CDM Executive Board
Page 17
Barrier 2 – Less financially attractive than the Project. The alternative is less likely to be executed than the
Project if it represents a less financially feasible option than the Project.
Sub-step 2b – Eliminate alternative Scenarios which are prevented by the identified barriers
Scenario A. This scenario represents the same technological advances as the Project and thus is not prevented by the
barriers identified in Sub-step 2a. Consequently, it remains as credible alternative to the Project.
Scenario B. This scenario represents a biomass co-generation technology with similar arrangement as the project
(boiler+steam turbine+generator) using lower efficiency, consuming the same amount of biomass as the Project (K1 to
K4). It is likely that such low-efficiency system is a result of combination of lower operating pressure, less efficient
boiler/furnace and low intake pressure, less efficient steam turbine than the Project.
The lower overall efficiency means that the boiler generates lower quality of steam in a quantity less than those
that can be supplied by the Project boiler, and subsequently reduces the quantity of recoverable electricity in the
steam turbine. In order to meet end-users demands, installation of such biomass co-generation plant requires
additional investment for the provision of remaining of electricity and steam. The option of adding more burning
more biomass is considered in Scenario C and thus not considered here. As electricity becomes less scarce the
utilization of EFB becomes less likely, and the fuel requirement must be met with import of fossil fuel.
At best, it is likely that this lower efficiency cogeneration and the additional capital investment to meet the
remaining steam/elecricity results in a similar investment cost as the Project. On the other hand, its operating
costs is significantly higher as more fossil fuel are needed to meet the shortfall.
An alternative of similar investment compared to the Project with higher running costs to procure fossil fuel,
represents a less sophisticated and financially less attractive alternative than the Project (Barrier 2). Thus, less
likely to be implemented than the Project.
Scenario C. This scenario represents a biomass co-generation technology with similar arrangement as the project
(boiler+steam-turbine+generator) using lower efficiency. In order to compensate the lower efficiency, more biomass is
burnt in this boiler than the Project situation.
In this scenario, more biomass is burnt to par the electricity/steam output as the Project. The additional biomass
needed to compensate the lower efficiency does not only translate to additional operating costs, but also a bigger
furnace chamber to accomodate combustion of more biomass, and bigger heat exchange surface area to transfer
the same quantity of thermal energy. Subsequently, the turbine must be able to handle lower pressure and more
volume of steam, with the constraint of low recovery efficiency.
The overall lower efficiency system will result in oversize system design that is harder to control with demands
and does not represent good engineering practice (Barrier 1). In order to compensate lack of operability, the
system must be splitted into many smaller systems (more than the Project) and thus elevates capital costs
without additional benefit. Taking into account the additional biomass that must be procured, this is a less
economically attractive option than the Project (Barrier 2).
Note for Scenario B and C: Lower efficiency cogeneration would be a more suitable option to PAA, if the mill
has been implemented independently (a few years before) the rest of the processing facility. In such case, the
mill is served by a typical lower efficiency cogeneration plant, and new utility are added with the
implementation of the downstream processing facility.
In the case of PAA, the mill and the rest of downstream operations are implemented as greenfield project based
on a long-term planning to create an integrated industry. As such, the planning of energy provision takes into
account the total electricity and heat demand of all downstream facilities.

PROJECT DESIGN DOCUMENT FORM (CDM PDD) - Version 03.1.
CDM Executive Board
Page 18
Scenario D. In this scenario, each individual process units (upstream and downstream facilities) are served by individual
smaller utility system that responds to individual demands.
This option represents an alternative which is easy to control to changing demand and economical as each utility
is designed to meet individual needs or a smaller group of processing plant. In addition to this, exact
quality/quantity of steam can be generated within vicinity of the demand, eliminating the need to compensate
heat loss due to pipeline condensation compared to cogeneration situation including the Project.
In the original design, individual processes of the downstream facilities would have individual utility system
supplying medium pressure and low pressure steam directly to the needing areas. The biodiesel plant for
example, would have installed four small residue oil boilers at different pressure level supplying steam for
glycerine distillation, bleaching, transesterification as well as general heat exchange processes. Similarly the
tank farms, the refineries, and the kernel crushing facility would have had its own, low pressure boilers, whereas
the mill can be powered using its own fibre and shell. Thus, this option is not prevented from implementation by
Barrier 1.
However, without the centralized steam generation system employed by the Project, it is not possible to generate
electricity in-house as by-product of steam generation. Consequently electricity must be provided by way of
captive diesel oil power generators, which is the prevalent practice10
.
It will be demonstrated in Section B.5 that this Scenario is not prevented for implementation by Barrier 2, and is
a more financially attractive option than the Project without CDM (Scenario A).
Outcome of Sub-step 2b
The above evaluation shows that Scenario A and D are the only scenarios that are not prevented for implementation by
both Barrier 1 and 2.
Conclusion to Assessment of Alternatives (Step 1 and 2)
It is demonstrated above that from point of view of large heat demands and electricity required by PAA, the remaining credible
alternative to the Projects are:
Scenario A – the Project is carried out without CDM; and
Scenario D – where (a) electricity is generated using diesel oil generator(s), (b) low pressure steam for upstream facilites
are generated exclusively using biomass, (c) steam for the downstream facilities are generated using residue oil. (c) with
exception of EFB, biomass K1 (on-site fibre), K2 (on-site shell) and K3 (imported shell used in the baseline) are used in
this facility. EFB will continue to be unused for non-energy purpose and landfilled.
Step 2b stipulates that „if there are several alternative scenarios remaining, including the proposed project activity undertaken
without CDM, proceed to Step 3 (Investment analysis)‟. It will be demonstrated using investment analysis in Section B.5, that
Scenario A is less financially attractive than Scenario D concluding that Scenario D is the only credible baseline for the Project.
This scenario falls under the description of Scenario 20 of ACM0006 where;
‘the project activity involves the installation of a new biomass residue fired cogeneration plant at a site where no power
was generated prior to the implementation of the project activity. The project plant is a captive cogeneration plant that
provides electricity and heat to captive users at the project site. In the absence of project activity, a new fossil fuel fired
captive power plant would be installed at the project site instead of the project plant.
The biomass residue would in the absence of project activity be (a) partly be used for heat generation in project site and
(b) partly be dumped or left to decay or burnt in uncontrolled manner without utilizing them for energy purposes.
The heat generated by the project plant would in the absence of project activity be generated using on-site boilers using
(a) the same biomass residues as fired in the project plant, and where applicable (b) partly using fossil fuels’
10 The diesel oil power generators is selected for conservativeness basis for purpose of emission reduction calculation. In practise, coal power plant would have been the most plausible baseline plant

PROJECT DESIGN DOCUMENT FORM (CDM PDD) - Version 03.1.
CDM Executive Board
Page 19
B.5. Description of how the anthropogenic emissions of GHG by sources are reduced below those that would have
occurred in the absence of the registered CDM project activity (assessment and demonstration of additionality):
As prescribed in the methodology, the demonstration of Project‟s additionality is done in compliance with the „Combined tool to
identify baseline scenario and demonstrate additionality‟ Version 02.1 (EB28). Step 1 and Step 2 analysis has been carried out
under Section B.4, and concludes that two scenarios, Scenario A and Scenario D remain credible options. The tool prescribed that
in the case where there are more than one credible scenarios, the baseline is to be determined by which of the two option is the
most economically attractive and thus the most likely to be implemented. Thus, a comparative financial analysis is performed on
the two options to determine its relative financial performance.
Step 3 – Investment Analysis
General Approach of this Investment Analysis The Project capital investment value (Scenario A) is significantly more
expensive than its alternative (Scenario D), which is a simpler but equally reliable processes. From investment point of view, the
incremental capital to carry out Scenario A is justified if it provides investment return in the form of operational saving that meets
an acceptable benchmark. For purpose of demonstrating additionality, the investment comparison analysis is performed by
analyzing the net present value (NPV) of this committed incremental costs , using the following general approach:
Step A. To establish the basic parameters for the investment analysis.
Step B. To analyze the incremental capital investment of the two options;
Step C. To analyze the resulting operational savings gained from making the additional investment;
Step D. To establish the cash-flow of the additional investment, the resulting operational savings, and the additional tax
that must be paid (C) and analyze the net-present-value.
Benchmark selection The selected financial parameter that is deemed suitable is Net Present Value (NPV). The discounting
factor is constructed based on the applicable working capital loan interest rate applicable in first three semester of 2004 which is
13.86%11
, with additional 3% premium deem suitable to cover for risk of implementation due to project relative complexity and
longer than normal construction time.
Interpretation of financial parameter The calculated NPV from this incremental analysis (Step E) represents the NPV of the
Project relative to the NPV of its alternative. A positive NPV thus suggest that the Project Investment is more attractive than the
alternative. A negative NPV does not necessarily means that the Project is not profitable, but a less financially attractive option
compared to its alternative.
Step A Basic Parameters for the Investment Analysis. The basic assumptions used in the investment analysis as well as its
justification are summarized in the following table. For consistencies, all prices used excludes value added tax. With exception of
currency exchange, all of these assumptions have strong impact to the operational savings and thus included as parameter in the
sensitivity analysis.
Table 8 – Basic Parameters Adopted for Investment Analysis
Assumptions Value Assumed Rationale
Currency Exchange IDR 9,159 per USD The value is based on the average mid-rate currency exchange
between USD and Rupiah rate as published by the Bank of Indonesia
for period of 6 months leading to September 2004.
Cost of imported shell,
applicable to both
Scenario A and Scenario
D.
IDR 198,375 per tonnes of shell.
Projected shell imports amounts to 80,355t
per year.
On-site shell usage is not included in this
A study performed in February 2004 indicates costs of shell of
IDR150,000 per tonnes when imported within 200km radius. More
than 50% of this is contributed to cost of material movement.
The project developer projected that the price of shell will increase at
11 Based on information published by Bank of Indonesia for working capital loan for average of 6 months leading to September 2004

PROJECT DESIGN DOCUMENT FORM (CDM PDD) - Version 03.1.
CDM Executive Board
Page 20
analysis as it will be consumed on both
situations and thus has no impact to
operational saving.
a rate of at least 15% per annum as (a) PAA own consumptions and
demand from other industries will create a market for shell (b) as it is
a labour/transport intensive activities, the price will be influenced by
the country inflation. As such it is appropriate that by the time the
project is at its full operation, the price of biomass has increased
significantly.
Costs of water treatment
system, applicable in both
Scenario A and D
IDR5,953 per tonnes of water
Expected water consumption is 120TPH for
the Project and 97TPH for Scenario A.
PAA used reverse osmosis process to treat its water so that it is
suitable for use for the boiler. The costs of water treatment as
calculated by the supplier including cost of chemical and maintenance
is USD0.65 or IDR5,953 at the assumed exchange rate.
Costs of residue oil for
steam production,
applicable only to
Scenario D.
IDR1,455 per L with density of 0.988kg per
Liter. Calculated consumption is 19,177t/yr
Cost of residue oil is based on PERTAMINA 12 published rate
for’minyak bakar’ for industrial used for 200413. Density of residue oil
is based on information from PERTAMINA.
The expected consumption of residue oil is calculated based on 100%
recovery efficiency of a residue boiler as required for baseline
calculation.
Costs of diesel oil for
electricity production,
applicable only in
Scenario D.
IDR1,864 per L, with electrical fuel
consumption rate of 0.202L per kWh
Expected electrical output is
54,951,600MWh per year. This electrical
output is calculated on net basis based on
the demand of individual processes and net
of electricity to run the project plant).
Cost of residue oil is based on PERTAMINA published rate for’minyak
bakar’ for industrial used for 2004. Density of residue oil is based on
information from PERTAMINA.
The consumption rate of the diesel gen-set is based on fuel
specification of a suitable gen-set provided by a manufacturer to be
0.1865kg/L.
Applicable tax rate 30% of profit (after excluding asset
depreciation)
Based on documents issued by the tax office. Tax rate is progressive,
but due to size, it is reasonable to assume the rate to be flat.
Step B. Incremental Capital Investment Analysis The total project investment values as identified in its feasibility analysis is
IDR168,573million which is significantly higher than its alternative. The breakdown of capital investment is provided in the
enclosed spreadsheet published with this PDD. The summary is provided in the following table.
Table 9 – Comparison of the Investment Values between Scenario A (Project) and its alternative (Scenario D)
Aspect Values in Rupiah
Scenario A Scenario D Increment (Δ)
Equipment Costs IDR 165,077,781,000 IDR 37,433,094,947 IDR 127,644,686,053
Working Capital & Other Costs (2 months) IDR 3,492,317,799 IDR 9,109,783,204 IDR -5,617,465,405
Total Capital Investment Value IDR 168,570,095,799 IDR 46,542,878,151 IDR 122,027,217,648
It is shown above that the commitment to proceed with the project requires an additional capital investment of
IDR122,027million. On the equipment value basis, the incremental investment on asset is identified to be IDR127,027million per
year. From this information, the annual incremental depreciation can be calculated to calculate the impact of the incremental
investment to tax on profit.
12 PERTAMINA: State oil and gas company, the only fuel supplier in Indonesia in 2004
13 Fuel in Indonesia was partially subsidised

PROJECT DESIGN DOCUMENT FORM (CDM PDD) - Version 03.1.
CDM Executive Board
Page 21
Step C. Incremental Operating costs
Based on the parameters established in Step A, the projected operating costs for both scenarios are calculated below:
Project Installation Project Alternative
Operation Cost to purchase shell (K3): 3,126t IDR 620,121,671 IDR 620,121,671
Cost to purchase shell (K4): 77,229t IDR 15,320,337,979 IDR -
Cost to process water (6,900hr) IDR 4,929,194,400 IDR 3,984,432,140
Costs of fuel
Residue oil IDR - IDR 28,232,037,997
Diesel oil IDR - IDR 21,753,334,510
Maintenance
14
Biomass Boilers IDR 68,772,906 IDR 68,772,906
Turbine IDR 15,461,838 IDR -
Residue Boiler IDR - IDR -
Total Operational & Maintenance (O&M) Costs IDR 20,974,910,495 IDR 54,658,699,224
Incremental O& M (Operational Savings from Project Investment) IDR 33,704,810,430
Step D. Analysis of Cash Flow
With an incremental capital commitment of IDR122,027million, and an operational saving of IDR33,705million, the net present
value of the resulting cash flow is calculated to be –IDR52,165million. As explained earlier, this calculated NPV represents the
NPV of the Project (Scenario A) relative to its alternative (Scenario D), and thus concludes that the Project is less financially
attractive than Scenario D.
In order to asses the robustness of this analyis, a series of sensitivity analysis is performed on all of the critical parameters. The
results are listed in the following table.
Critical
Parameter
Sensitivity Magnitude Result of Sensitivity
Analysis (‘000,000)
Justification of sensitivity magnitude
Equipment
costs
Reduced by 20% IDR (31,708) The project equipment cost is based on quotation from a supplier on a turn-
key basis. However, the Project Participant decided to manage the project
itself, and thus made a considerable savings. The 20% reduction is deemed
appropriate.
Tax on Profit 25% instead of 30% IDR (11,393) The applicable tax rate is applied on progressive basis with maximum tax
rate of 30%. However the maximum tax rate is applied for profit above
IDR100million and thus the magnitude of sensitivity is appropriate.
Imported shell
price
Maintained at 2004
price
IDR (43,168) The shell price in 2004 is Rp150,000 per tonnes, as it is unlikely that the
price of shell will be lower.
The price of shell in 2007 is Rp290,000 per tones, well above the assumed
value in the financial analysis.
Fuel price Increased by 20% IDR (28,090) With hindsight of the current oil price, it is difficult to analyze the appropriate
magnitude for sensitivity analysis for this parameter at the time of decision
making.
14 Maintenance costs for the reverse osmosis plant has been accounted in the water treatment costs. Maintenance cost on the residue boiler is assumed to be insignificant in both cases.

PROJECT DESIGN DOCUMENT FORM (CDM PDD) - Version 03.1.
CDM Executive Board
Page 22
Although it was generally accepted that the government needs to shave its
oil subsidy at some point in time, increase is historically controlled and
announced overnight to avoid conflict.
The sensitivity magnitude of 20% is based on the evaluation of historical
price increase between January 2003 to January 2004 which is 25% for
diesel oil, but only 2.6% for diesel oil. The price remains constant for the
entire 2004.
Conclusion to the investment analysis The result of the sensitivity analysis shows that the financial analysis is robust to
variations of these critical parameters. The financial analysis concludes that the Project investment without CDM revenue is less
financially attractive than its alternative, and hence are unlikely to be implemented without CDM incentives. This sets Scenario D
as the most financially attractive from the two options, and more likely to be implemented than Scenario A.
Step 4 Common Practice Analysis
This step provides an analysis to which extent „similar activities‟ to the Project have been previously implemented or are currently
underway. „Similar activities‟ is defined as activities that are of similar scale, take place in a comparable environment, inter alia,
with respect to regulatory framework and are undertaken in the relevant geographical area, as defined in sub-step 1a above.
As explained earlier, the prevailing practise in Indonesia is to have palm oil mill located in-land within a palm oil plantation. The
majority of the crude palm oil generated from such mills are exported, a smaller proportion is processed domestically in refineries
to make cooking oil, and even smaller proportion is further processed into higher-value products (oleochemicals or biodiesel).
Typically, the refining and other processing are located in a maritime port closer to the storage terminal prior to being shipped to
its industrial consumers.
By implementing process integration at concept level, PAA deviates from the common practise in the industry. Process integration
is not a new concept in the more sophisticated petrochemical business, but new to the agricultural industries15
.The energy
provision strategy for such an integrated activity can not be compared to non-integrated operation. Along with its benefit, the
integrated utility also exposes PAA operations with additional risk requiring greater expertise. It is clear from this explanation that
PAA situation and subsequently the Project, is not a common practice in palm oil industry in general, and thus further demonstrate
that the Project is additional.
The significance of costs compared to alternative deemed the company to seriously pursue CDM status for this Project. The
company was already in serious discussion with representative from a leading buyer by October 2005. However, the deal stopped
short due to unexpected sensitive political situation beyond the control of the project developer deeming the company to restart
seeking option prior to engagement with Mitsubishi UFJ Securities Co.,Ltd.
B.6. Emission reductions:
B.6.1 Explanation of methodological choices
Baseline Scenario Applicable for the Project
As has been demonstrated in Section B4 and B4, the alternative to the Project falls under the description of Scenario 20, and thus
followed the methods prescribed for this Scenario.
Emission Reduction General Calculation Method
The total emission reduction resulting from the Project activity will be calculated as follow:
15 In April 2006, a research paper by a leading research institution in Indonesia describes the concept as „still needing research from scientist, courage from investors, and incentives from government‟

PROJECT DESIGN DOCUMENT FORM (CDM PDD) - Version 03.1.
CDM Executive Board
Page 23
𝐸𝑅𝑦 = 𝐸𝑅ℎ𝑒𝑎𝑡 ,𝑦 + 𝐸𝑅𝑒𝑙𝑒𝑐𝑡𝑟𝑖𝑐𝑖𝑡𝑦 ,𝑦 + 𝐵𝐸𝑏𝑖𝑜𝑚𝑎𝑠𝑠 ,𝑦 − 𝑃𝐸𝑦 − 𝐿𝑦
Equation 1
𝐸𝑅𝑦 = Emissions reductions of the Project activity during the year y (tCO2/yr)
𝐸𝑅ℎ𝑒𝑎𝑡 ,𝑦 = Emission reduction due to displacement of fossil-based heat during the year y (tCO2/yr)
𝐸𝑅𝑒𝑙𝑒𝑐𝑡𝑟𝑖𝑐𝑖𝑡𝑦 ,𝑦 = Emission reduction due to displacement of fossil-based electricity during the year y (tCO2/yr)
𝐵𝐸𝑏𝑖𝑜𝑚𝑎𝑠𝑠 ,𝑦 = Baseline emission due to natural decay of biomass residues (biomass K5) during the year y (tCO2e/yr)
𝑃𝐸𝑦 = Project emissions during the year y (tCO2/yr)
𝐿𝑦 = Leakage emissions during the year y (tCO2/yr)
A. Project Emissions, 𝑃𝐸𝑦
As has been elaborated under Section B.3, emission from additional waste-water from biomass treatment (𝑃𝐸𝑊𝑊 ,𝐶𝐻4,𝑦 ) is
excluded and emission from electricity usage from stand-by diesel generators (𝑃𝐸𝐸𝐶 ,𝑦) is accounted as emission from on-site fuel
consumption (𝑃𝐸𝐹𝐹𝑦). Thus, to calculate project emission, Equation 2 of ACM0006 is adapted as follow:
𝑃𝐸𝑦 = 𝑃𝐸𝑇𝑦 + 𝑃𝐸𝐹𝐹𝑦 + 𝐺𝑊𝑃𝐶𝐻4 ∙ 𝑃𝐸𝑏𝑖𝑜𝑚𝑎𝑠𝑠 ,𝐶𝐻4,𝑦
Equation 2
𝑃𝐸𝑇𝑦 = CO2 emissions during the year y due to transport biomass residues to PAA site (tCO2/yr)
𝑃𝐸𝐹𝐹𝑦 = CO2 emissions during the year y due to fossil fuel co-firing and other fossil fuel consumptions attributable to the project
activity (tCO2/yr)
𝐺𝑊𝑃𝐶𝐻4 = Global Warming Potential for methane valid for the relevant commitment period
𝑃𝐸𝑏𝑖𝑜𝑚𝑎𝑠𝑠 ,𝐶𝐻4,𝑦 = CH4 emissions from the combustion of biomass residues during the year y (tCH4/yr)
A1. CO2 Emissions from Biomass Transportation, 𝑃𝐸𝑇𝑦
With consideration of established biomass payment & logging system in all PHG operation, Option 1 is selected to calculate the
CO2 emission from off-site biomass transportation. The emission is applied to the portion of biomass that is transported to the
project site, and calculated using the following equation:
𝑃𝐸𝑇𝑦 = 𝐵𝐹𝑇,𝑘 ,𝑦
𝑘
∙1
𝑇𝐿𝑦
∙ 𝐴𝑉𝐷𝑦 ∙ 𝐸𝐹𝑘𝑚 ,𝐶𝑂2,𝑦
Equation 3
𝑃𝐸𝑇𝑦 = CO2 emissions during the year y due to transport of the biomass residues to the project plant (tCO2/yr)
𝐵𝐹𝑇 ,𝑘 ,𝑦
𝑘
= Quantity of biomass residue type k that has been transported to project site during year y (t-biomass/yr)
𝑇𝐿𝑦 = Average truck load of delivery (t/delivery)

PROJECT DESIGN DOCUMENT FORM (CDM PDD) - Version 03.1.
CDM Executive Board
Page 24
𝐴𝑉𝐷𝑦 = Average round trip distance (from and to) between the location of supplier and the site of the project plant during the
year y (km)
𝐸𝐹𝑘𝑚 ,𝐶𝑂2,𝑦 = Average CO2 emission factor for the delivery truck(s) measured during the year y (tCO2/km). This is calculated based
on the fuel economy of the delivery truck from supplier s.
k = Types of biomass residues used in the project plant and that have been transported to the project plant in year y. For
conservativeness, this includes biomass type K3 and K4.
A2. CO2 Emissions from Onsite Fossil Fuel Usage, 𝑃𝐸𝐹𝐹𝑦
Fossil fuel is used as auxiliary fuel to the boiler during project plant start-up and shut-down; and as fuel to power the back-up
generator set during project inactivity. No co-firing of fossil fuel in project plant is foreseen. Onsite transportation of biomass
within PAA is via conveyor belt system operated using electricity generated by the Project. Thus, fossil fuel utilization due to on-
site biomass movement is unforeseen.
As specified in the methodology, the CO2 emission from consumption of fossil fuel must be calculated in accordance with Version
01 of „Tool to calculate project or leakage CO2 emission from fossil fuel combustion‟. The tool prescribed that CO2 emission is
calculated based on quantity of fuel used times the CO2 emission coefficient of fuel used.
𝑃𝐸𝐹𝐹𝑦 = 𝐹𝐹𝑝𝑟𝑜𝑗𝑒𝑐𝑡𝑝𝑙𝑎𝑛𝑡 ,𝑖 ,𝑦 + 𝐹𝐹𝑝𝑟𝑜𝑗𝑒𝑐𝑡𝑠𝑖𝑡𝑒 ,𝑖 ,𝑦 ∙ 𝐶𝑂𝐸𝐹𝑖
𝑖
Equation 4
𝑃𝐸𝐹𝐹𝑦 = CO2 emissions from onsite fossil fuel usages in year y (t-CO2/yr)
𝐹𝐹𝑝𝑟𝑜𝑗𝑒𝑐𝑡𝑝𝑙𝑎𝑛𝑡 ,𝑖,𝑦 = Quantity of fossil fuel type i co-fired in the project boiler during year y (t-fuel/yr).
𝐹𝐹𝑝𝑟𝑜𝑗𝑒𝑐𝑡𝑠𝑖𝑡𝑒 ,𝑖,𝑦 = Quantity of fossil fuel type i used at the project site for other purposes that are attributable to the project activity
during the year y.
𝐶𝑂𝐸𝐹𝑖 CO2 emission factor for fossil fuel type i (tCO2/t-fuel)
The Tool prescribed the calculation of CO2 emission factor based on chemical composition of fossil fuel (Option A) or based on
net calorific value of fuel (Option B). With consideration that the most likely fuel to be used in the project situation are fuel oils
with complex assay (residue oil), Option B is the only practical method available to calculate CO2 emission factor.
𝐶𝑂𝐸𝐹𝑖 = 𝑁𝐶𝑉𝑖 ∙ 𝐸𝐹𝐶𝑂2,𝑖
Equation 5
𝐶𝑂𝐸𝐹𝑖 = CO2 emission factor for fossil fuel type i (tCO2/t-fuel)
𝑁𝐶𝑉𝑖 = Net calorific value of fuel type i (TJ/t-fuel)
𝐸𝐹𝐶𝑂2,𝑖 = CO2 emission factor of fuel type i (tCO2/TJ)
A3. CH4 Emissions from Combustion of Biomass Residue, 𝑃𝐸𝐵𝑖𝑜𝑚𝑎𝑠𝑠 ,𝐶𝐻4,𝑦
The combustion of biomass in the project plant releases methane via the stack-gas. As methane is a main emission source in the
baseline, the methodology mandates that this emission source is also included as project emission.

PROJECT DESIGN DOCUMENT FORM (CDM PDD) - Version 03.1.
CDM Executive Board
Page 25
𝑃𝐸𝑏𝑖𝑜𝑚𝑎𝑠𝑠 ,𝐶𝐻4,𝑦 = ∞ ∙ 𝐸𝐹𝐶𝐻4,𝐵𝐹 ∙ 𝐵𝐹𝑘 ,𝑦 ∙ 𝑁𝐶𝑉𝑘
𝑘
Equation 6
𝑃𝐸𝑏𝑖𝑜𝑚𝑎𝑠𝑠 ,𝐶𝐻4,𝑦 = Project emission from biomass combustion (t-CH4/yr)
∞ = Uncertainty factor (unitless) for uncertainty band of more than 100%.
𝐵𝐹𝑘,𝑦 = Quantity of biomass residue type k combusted in the project plant during the year y (t-yr)
𝑁𝐶𝑉𝑘 = Net calorific value of the biomass residue type k (TJ/tonnes)
𝐸𝐹𝐶𝐻4,𝐵𝐹 = CH4 emission factor for the combustion of biomass residues in the project plant (tCH4/TJ)
B. Emission Reduction Due to Displacement of Fossil Based Electricity, 𝐸𝑅𝑒𝑙𝑒𝑐𝑡𝑟𝑖𝑐𝑖𝑡𝑦 ,𝑦
The Project displaces diesel generator for electricity generation in the baseline. Consistent with the methodology the emission
reduction from this source is calculated by multiplying net quantity of increased electricity generated using biomass residues as a
result of project activity with CO2 baseline emission factor.
𝐸𝑅𝑒𝑙𝑒𝑐𝑡𝑟𝑖𝑐𝑖𝑡𝑦 ,𝑦 = 𝐸𝐺𝑦 ∙ 𝐸𝐹𝑒𝑙𝑒𝑐𝑡𝑟𝑖𝑐𝑖𝑡𝑦 ,𝑦
Equation 7
𝐸𝑅𝑒𝑙𝑒𝑐𝑡𝑟𝑖𝑐𝑖𝑡𝑦 ,𝑦 = Emission reductions due to displacement of electricity during the year y (tCO2/yr)
𝐸𝐺𝑦 = Net quantity of increased electricity generation as a result of the Project activity (incremental to baseline generation)
during the year y (MWh). This is equivalent to the amount of electricity supplied to the users in PAA or net electricity
generation from the Project plant.
𝐸𝐹𝑒𝑙𝑒𝑐𝑡𝑟𝑖𝑐𝑖𝑡𝑦 ,𝑦 = CO2 emission factor for the electricity displaced due to the Project activity during the year y (tCO2/MWh).
Determination of emission factor of the electricity, 𝐸𝐹𝑒𝑙𝑒𝑐𝑡𝑟𝑖𝑐𝑖𝑡𝑦 ,𝑦
For project with Scenario 20 in the baseline, the CO2 emission factor of electricity displaced is calculated in accordance with
Equation 12 of ACM0006.
𝐸𝐹𝑒𝑙𝑒𝑐𝑡𝑟𝑖𝑐𝑖𝑡𝑦 ,𝑦 =𝐸𝐹𝐶𝑂2,𝐹𝐹 ,𝐷𝑂
𝜀𝑒𝑙 ,𝑟𝑒𝑓𝑒𝑟𝑒𝑛𝑐𝑒 𝑝𝑙𝑎𝑛𝑡
∙ 3.6 × 10⁻³
Equation 8
𝐸𝐹𝐶𝑂2,𝐹𝐹,𝐷𝑂 = CO2 Emission factor of the diesel oil used in the baseline situation (t-CO2/TJ)
εel ,reference plant = Average net energy efficiency of the diesel generator that would be constructed in the baseline situation
3.6 × 10−3 = Conversion factor in TJ/MWh or 1 MWh = 3.610-3TJ
𝐸𝐹𝑒𝑙𝑒𝑐𝑡𝑟𝑖𝑐𝑖𝑡𝑦 ,𝑦 = Equivalent CO2 emission factor for the electricity displaced due to the project activity (t-CO2/MWh)
C. Emission Reduction Due to Displacement of Fossil Based Heat, 𝐸𝑅ℎ𝑒𝑎𝑡 ,𝑦

PROJECT DESIGN DOCUMENT FORM (CDM PDD) - Version 03.1.
CDM Executive Board
Page 26
For project with Scenario 20 as baseline, the emission reduction due to displacement of fossil-based heat is calculated in
accordance with Equation 30 of ACM0006.
𝐸𝑅ℎ𝑒𝑎𝑡 ,𝑦 = 𝑄𝑝𝑟𝑜𝑗𝑒𝑐𝑡𝑝𝑙𝑎𝑛𝑡 ,𝑦
𝜀𝐵𝐿 ,𝐵𝑜𝑖𝑙𝑒𝑟
− 𝐵𝐹𝑘 ,𝑦 ∙ 𝑁𝐶𝑉𝑘
𝑘
∙ 𝐸𝐹𝐶𝑂2,𝐵𝐿 ,ℎ𝑒𝑎𝑡
Equation 9
𝐸𝑅ℎ𝑒𝑎𝑡 ,𝑦 = Emission reduction due to the displacement of fossil-based heat during year y (t-CO2/yr)
𝑄𝑝𝑟𝑜𝑗𝑒𝑐𝑡𝑝𝑙𝑎𝑛𝑡 ,𝑦 = Net quantity of heat generated by the project plant from firing biomass residue in year y (TJ/yr)
𝜀𝐵𝐿 ,𝐵𝑜𝑖𝑙𝑒𝑟 = Efficiency of baseline boilers (TJ/TJ).
K = Biomass residue type k, which are used in the project plant, which would (in the absence of project activity)
be used in a boiler for heat generation (B4).
Biomass type k refers to biomass type K1 (on-site generated fibre), K2 (on-site generated shell), K3 (imported
shell in the baseline that are also used in the Project). (see Table 6, p.10).
𝐵𝐹𝑘,𝑦 = Quantity of biomass residue type k used in the project situation in year y (t-biomass/yr)
𝑁𝐶𝑉𝑘 = Net calorific value of biomass residue type k (TJ/t-biomass)
𝐸𝐹𝐶𝑂2,𝐵𝐿,ℎ𝑒𝑎𝑡 = The emission factor of fossil fuel (residue oil) used for heat generation in the baseline (tCO2/TJ).
D. Baseline Emission due to uncontrolled burning of biomass, 𝐵𝐸𝑏𝑖𝑜𝑚𝑎𝑠𝑠 ,𝑦
As indicated in Table 6 (p.10), biomass type K5 (EFB) is not utilized as energy source in the baseline and in the baseline the
material will be handled in sanitary landfill. The methane generated such landfill is calculated using multiphase model specified in
the “Tool to determine methane emissions avoided from dumping waste at solid waste disposal site” outlined below.
𝐵𝐸𝑏𝑖𝑜𝑚𝑎𝑠𝑠 ,𝑦 = 𝛼 ∙ 𝐵𝐹𝑃𝐽 ,𝐾5,𝑦 ∙ 𝐷𝑂𝐶𝐾5 ∙ 𝑒−𝑘𝐾5(𝑦−𝑥) ∙ (1 − 𝑒−𝑘𝐾5 )
𝑦
𝑥=1
Equation 10
𝛼 = 𝜑 ∙ 1 − 𝑓 ∙ 𝐺𝑊𝑃𝐶𝐻4 ∙ (1 − 𝑂𝑋) ∙16
12∙ 𝐹 ∙ 𝐷𝑂𝐶𝐹 ∙ 𝑀𝐶𝐹
Equation 11
The parameter alpha (∝) is expected to remain constant throughout the duration of one credit period but must be reviewed
according to latest IPCC guideline at its renewal.
Table 10 – Parameters and Justification of constant used to determine Alpha, Equation 11
𝛼 (ALPHA)
Variable Description Value used
𝜑 = Model correction factor to account for model uncertainty. Methodology default value is used. 0.9
𝑓 = Fraction of methane captured at the dumpsite that is flared, combusted or used for other manner. It is
unlikely that the landfill has methane captured facility without CDM, and thus 0 is deemed
appropriate.
0

PROJECT DESIGN DOCUMENT FORM (CDM PDD) - Version 03.1.
CDM Executive Board
Page 27
𝐺𝑊𝑃𝐶𝐻4 = Global Warming Potential of methane. Methodology default value is used. 21
𝑂𝑋 = Oxidation factor of the covering material. The sanitary landfill would have either soil or plastic
covering. For conservativeness, oxidation factor of 0.1 is applied.
0.1
𝐹 = Fraction of methane in the biogas. Methodology default value is used. 0.5
𝐷𝑂𝐶𝐹 = Fraction of degradable organic carbon of organic material that can decompose. Methodology default
value is used.
0.5
𝑀𝐶𝐹 = Methane correction factor representing managed solid waste disposal. 1
Table 11 – Parameters used to determine methane emissions from biomass decay
Variable Description Value used
𝐵𝐹𝑃𝐽 ,𝐾5,𝑦 = The amount of biomass K5 generated by PAA mill (on wet basis) that would have been dispose in the
absence of the Project.
Calculated
𝐷𝑂𝐶𝐾5 = Fraction of degradable organic carbon of Biomass K5 per wet weight that can decompose.
Methodology specified for EFB.
43%
𝑘𝐾5 = Decay rate of biomass K5. Methodology specified for EFB for Tropical region with MAP>1,000mm 0.035
𝑥 = Year during crediting period N/A
𝑦 = Year of which the methane emission is calculated N/A
E. Leakage Emissions, 𝐿𝐸𝑦
The methodology prescribed that biomass with energy generation as the most likely baseline scenario does not need to be
evaluated for leakage as their effect have been accounted for in the baseline reductions. Consequently, leakage emission is
considered only for biomass type K5.
The methodology provides three possible approaches to evaluate leakage effect, and with consideration that biomass K5 is
biomass (EFB) supplied by PAA‟s own mill and will not be sold to market, assessment method L1 is the most appropriate.
The assessment method requires the demonstration that at the site where the project is located (PAA complex), EFB have not been
collected or utilized (for example as fuel, fertilizer, or feedstock) but have been dumped and left to decay prior to implementation
of project activity. This aspect has been sufficiently demonstrated in detail under Section B4 during assessment of baseline
scenario applicable to EFB.
However to provide a perspective of the availability of the biomass, it is perceived necessary to demonstrate that EFB is available
in large excess in the region. This can be demonstrated by evaluating the amount of fresh-fruit-bunches processed in the relevant
region.
Information provided by Agricultural ministry in 1998 suggests that Riau Province alone has 44 installed palm oil mill with total
processing capacity of 2,017t of fresh fruit bunches per hour. With consideration that yield of EFB is approximately 22.5% of
fresh fruit bunch processed this capacity translates to daily generation of 10,440tonnes of empty fruit bunches per day in 1998.
By 2005, news archive published in Riau Province official website suggests that the number of mills has grown to 116, and 34
more are needed to absorb yield from maturing plantations. With average capacity of 45t/hr, the 2005 yield of EFB is
approximated to be 27,014tonnes of material per day, compared to PAA‟s 310t per day. This magnitude of generation is more
than quadruple the amount waste generated by Jakarta municipality in 2004 which is circa 6,000t per day. The picture is even

PROJECT DESIGN DOCUMENT FORM (CDM PDD) - Version 03.1.
CDM Executive Board
Page 28
bigger if output from other province in Sumatra is considered. Thus, it is clear that a more sophisticated solution (than mulching,
burning or dumping) is needed to resolve the disposal of this material. Similar to municipal SWDS in Indonesia, dumping/burning
remains the most-attractive and within-the-law solution and with such excess, it is unlikely that EFB will become a traded
commodity within the crediting period.
EFB limited utilization coupled with large availability in the region means that EFB utilization as energy source in PAA will not
divert other users to use fossil fuel and thus the resulting leakage emission of project activity is negligible.
B.6.2. Data and parameters that are available at validation:
Data/Parameter 𝑁𝐶𝑉𝑖
Data unit: TJ/t-fuel
Description: Weighted average of net calorific value of fossil fuel type i used on-site in year y
Source of data used: Upper limit of NCV reported in Table 1.2, 2006 IPCC Report
Value applied For diesel fuel, 0.0433TJ/t-fuel
For residual fuel oil, 0.0417TJ/t-fuel
Justification of the choice of data or description
of measurement methods and procedures
actually applied:
Fuel supplier invoice (Option (a) of Tool to calculate project or leakage CO2 emissions from
fossil fuel combustion’) does not provide net calorific value data, and the most recent national
communication (Option (c)) does not cover emission from fossil fuel.
Any comments: 1. Future revision of IPCC guideline must be taken into account
2. This parameter is to calculate project emission from on-site fossil fuel combustion
Data/Parameter 𝐸𝐹𝐶𝑂2,𝑖
Data unit: t-CO2/TJ
Description: Weighted average of emission factor of fossil fuel type i used on-site in year y
Source of data used: Upper limit of effective CO2 emission factor with 95% confidence interval reported in Table 1.4,
2006 IPCC Report
Value applied For diesel fuel, 74.8tCO2/TJ
For residual fuel oil, 78.8tCO2/TJ
Justification of the choice of data or description
of measurement methods and procedures
actually applied:
Fuel supplier invoice (Option (a) of Tool to calculate project or leakage CO2 emissions from
fossil fuel combustion’) does not provide emission factor data, and the most recent national
communication (Option (c)) does not cover emission from fossil fuel.
Any comments: 1. Future revision of IPCC guideline must be taken into account
2. This parameter is used to calculate project emission from on-site fossil fuel combustion
Data/Parameter ∞
Data unit: Dimensionless
Description: Uncertainty factor of methane emission factor used to calculate methane emission from

PROJECT DESIGN DOCUMENT FORM (CDM PDD) - Version 03.1.
CDM Executive Board
Page 29
combustion of biomass
Source of data used: Table 4 of ACM0006 Version 06
Value applied 1.37
Justification of the choice of data or description
of measurement methods and procedures
actually applied:
The value is selected for ‘wood waste’ or ‘other solid biomass residue’, with assumed
uncertainty of 300%
Any comments: This parameter is used to calculate project methane emission from combustion of biomass
residue
Data/Parameter 𝐸𝐹𝐶𝐻4,𝐵𝐹
Data unit: t-CH4/TJ
Description: Methane emission factor for combustion of biomass residue in project plant
Source of data used: Default value provided in ACM0006 version 06
Value applied 0.030t-CH4/TJ
Justification of the choice of data or description
of measurement methods and procedures
actually applied:
The methodology allows this factor to be derived from (a) measurement or (b) the use of
default value with uncertainty factor applied. With consideration practicality and size of
emision, the project proponent chose to use the latter option.
Any comments: This parameter is used to calculate methane emission from combustion of biomass residue
Data/Parameter 𝐺𝑊𝑃𝐶𝐻4
Data unit: 21
Description: Global warming potential of methane
Source of data used: IPCC default value
Value applied 21 for the first commitment period
Justification of the choice of data or description
of measurement methods and procedures
actually applied:
In compliance with values prescribed in the chosen methodology
Any comments: This value shall be updated in accordance to future COP/MOP decisions or update of latest
IPCC Report.
Data/Parameter 𝐸𝐹𝐶𝑂2,𝐹𝐹,𝐷𝑂
Data unit: t-CO2/TJ
Description: CO2 emission factor of diesel oil used in the baseline power generator set
Source of data used: Lower limit of effective CO2 emission factor with 95% confidence interval reported in Table 1.4,
2006 IPCC Report
Value applied 72.6tCO2/TJ

PROJECT DESIGN DOCUMENT FORM (CDM PDD) - Version 03.1.
CDM Executive Board
Page 30
Justification of the choice of data or description
of measurement methods and procedures
actually applied:
In compliance with method prescribed in the chosen methodology
Any comments: The value shall be updated upon adoption of later IPCC Report.
Data/Parameter 𝜀𝑒𝑙 ,𝑟𝑒𝑓𝑒𝑟𝑒𝑛𝑐𝑒 𝑝𝑙𝑎𝑛𝑡
Data unit: Dimensionless
Description: Electrical generation efficiency of power generation plant in the baseline scenario
Source of data used: Technical specification of equivalent technology that would have been used in the baseline
Value applied 45%
Justification of the choice of data or description
of measurement methods and procedures
actually applied:
The Project will displace a series of new state-of-the-art fuel economic diesel power generators
with fuel consumption rate of 7,962kJ/kWh or equivalent efficiency of 0.45kJ/kJ according to
manufacturer specification.
Any comments: This parameter is used to calculate emission reduction from diesel oil used for electricity
generation in the baseline.
Data/Parameter 𝐸𝐹𝐶𝑂2,𝐵𝐿,𝐻𝐸𝐴𝑇
Data unit: t-CO2/TJ
Description: CO2 emission factor of residual oil used in the baseline boiler
Source of data used: Lower limit of effective CO2 emission factor with 95% confidence interval reported in Table 1.4,
2006 IPCC Report
Value applied 75.5tCO2/TJ
Justification of the choice of data or description
of measurement methods and procedures
actually applied:
In compliance with method prescribed in the chosen methodology
Any comments: This parameter is used to calculate emission reduction from residual fuel oil used for steam
generation in the baseline.
Data/Parameter 𝜀𝐵𝐿 ,𝐵𝑜𝑖𝑙𝑒𝑟
Data unit: Dimensionless
Description: Average heat generation efficiency of boilers that would have been used in the baseline
Source of data used: Average values of 2 types of boiler used in the baseline
(a) Biomass boiler with efficiency of 70% to generate 46.6% of steam required
(b) Residual oil boiler with efficiency of 100% to generate 53.3% of steam required
Value applied 86%
Justification of the choice of data or description 1. The maximum efficiency of biomass boiler as cited by Council of Industrial Boiler

PROJECT DESIGN DOCUMENT FORM (CDM PDD) - Version 03.1.
CDM Executive Board
Page 31
of measurement methods and procedures
actually applied:
whitepaper as 70%;
2. The efficiency of medium pressure residue boiler is assumed to be 100%
Any comments: N/A
Data/Parameter 𝜑
Data unit: Dimensionless
Description: Model correction factor to account for model uncertainties
Source of data used: Tool to determine methane emissions avoided from dumping waste at a solid waste disposal
site
Value applied 0.9
Justification of the choice of data or description
of measurement methods and procedures
actually applied:
As prescribed in the methodological tool
Any comments: The adopted parameter must be reviewed upon renewal of credit period against latest IPCC
Guideline.
Data/Parameter 𝑂𝑋
Data unit: Dimensionless
Description: Oxidation factor reflecting the amount of methane from SWDS that is oxidised in the soil or
other material covering waste.
Source of data used: Tool to determine methane emissions avoided from dumping waste at a solid waste disposal
site
Value applied 0.1
Justification of the choice of data or description
of measurement methods and procedures
actually applied:
It is expected that the EFB will managed in a sanitary landfill with some type of material
covering.
Any comments: The adopted parameter must be reviewed upon renewal of credit period against latest IPCC
Guideline.
Data/Parameter 𝑓
Data unit: Dimensionless
Description: Fraction of methane captured that is flared.
Source of data used: Tool to determine methane emissions avoided from dumping waste at a solid waste disposal
site
Value applied 0.5
Justification of the choice of data or description
of measurement methods and procedures
As prescribed in the methodological tool

PROJECT DESIGN DOCUMENT FORM (CDM PDD) - Version 03.1.
CDM Executive Board
Page 32
actually applied:
Any comments: The adopted parameter must be reviewed upon renewal of credit period against latest IPCC
Guideline.
Data/Parameter 𝐹
Data unit: Dimensionless
Description: Fraction of methane in the biogas (volume fraction)
Source of data used: Tool to determine methane emissions avoided from dumping waste at a solid waste disposal
site
Value applied 0.5
Justification of the choice of data or description
of measurement methods and procedures
actually applied:
As prescribed in the methodological tool
Any comments: The adopted parameter must be reviewed upon renewal of credit period against latest IPCC
Guideline.
Data/Parameter 𝑀𝐶𝐹
Data unit: Dimensionless
Description: Methane correction factor
Source of data used: Tool to determine methane emissions avoided from dumping waste at a solid waste disposal
site
Value applied 1.0
Justification of the choice of data or description
of measurement methods and procedures
actually applied:
In the absence of the Project, biomass K5 will be treated in a sanitary landfill to avoid
resistance from surrounding community. Such facilty would be considered as managed
anaerobic solid waste disposal site. Thus, MCF of 1 is deemed appropriate
Any comments: The adopted parameter must be reviewed upon renewal of credit period against latest IPCC
Guideline.
Data/Parameter 𝐷𝑂𝐶𝐹
Data unit: Dimensionless
Description: Fraction of degradable organic carbon (by weight) that can decompose
Source of data used: Tool to determine methane emissions avoided from dumping waste at a solid waste disposal
site
Value applied 0.5
Justification of the choice of data or description
of measurement methods and procedures
actually applied:
As prescribed by the methodological tool

PROJECT DESIGN DOCUMENT FORM (CDM PDD) - Version 03.1.
CDM Executive Board
Page 33
Any comments: The adopted parameter must be reviewed upon renewal of credit period against latest IPCC
Guideline.
Data/Parameter 𝐷𝑂𝐶𝐾5
Data unit: Dimensionless
Description: Fraction of degradable organic carbon (by weight) for material
Source of data used: Tool to determine methane emissions avoided from dumping waste at a solid waste disposal
site
Value applied 43% based on wet-waste
Justification of the choice of data or description
of measurement methods and procedures
actually applied:
The carbon content of Biomass K5 (EFB) is similar to wood or wood products
Any comments: The adopted parameter must be reviewed upon renewal of credit period against latest IPCC
Guideline.
Data/Parameter 𝑘𝐾5
Data unit: Dimensionless
Description: Decay rate of biomass K5
Source of data used: Tool to determine methane emissions avoided from dumping waste at a solid waste disposal
site
Value applied 0.035 for slowly degrading material at wet tropical climate
Justification of the choice of data or description
of measurement methods and procedures
actually applied:
The carbon content of Biomass K5 (EFB) is similar to wood or wood products as prescribed by
the methodology. The mean annual precipitation (MAP) and mean annual temperature (MAT)
at Riau Province is greater than 1,000mm and 20degC respectively.
Any comments: The adopted parameter must be reviewed upon renewal of credit period against latest IPCC
Guideline.
B.6.3 Ex-ante calculation of emission reductions:
A. Project Emission
A1. CO2 Emissions from Biomass Transportation, 𝑃𝐸𝑇𝑦
As calculated in Annex 3, approximately 80,356t of shell will be transported to the Project site using 28tonnes truck,
equivalent to 2,870 delivery trips. The shell is procured from surrounding mills with various distances. For purpose of ex-
ante calculation, it is assumed that the average return distance is 400km from the Project site.
Based on emission factor for heavy-duty vehicle without emission control of 0.001097t-CO2/km, the resulting emission
from transportation of biomass K3 and K4 is estimated as follow:
𝑃𝐸𝑇𝑦 = 2,870𝑡𝑟𝑖𝑝𝑠
𝑦𝑟∙ 40
𝑘𝑚
𝑡𝑟𝑖𝑝∙ 0.001097
𝑡𝐶𝑂2
𝑘𝑚~1,259
𝑡𝐶𝑂2
𝑦𝑟 3

PROJECT DESIGN DOCUMENT FORM (CDM PDD) - Version 03.1.
CDM Executive Board
Page 34
A2. CO2 Emissions from Onsite Fossil Fuel Usage, 𝑃𝐸𝐹𝐹𝑦
Based on diesel oil net calorific value of 0.0433TJ/t and emission coefficient of 74.8tCO2/TJ obtained from the upper
limit for diesel oil contained in Table 1.2 and Table 1.4 2006 IPCC report, the emission factor from diesel fuel
consumption is calculated to be 3.24 tCO2 per tonnes of diesel fuel.
𝐶𝑂𝐸𝐹𝑑𝑖𝑒𝑠𝑒𝑙 = 0.0433𝑇𝐽
𝑡𝑑𝑖𝑒𝑠𝑒𝑙∙ 74.8
𝑡𝐶𝑂2
𝑇𝐽= 3.24
𝑇𝐽
𝑡𝑑𝑖𝑒𝑠𝑒𝑙
The amount of diesel oil consumption is not yet known at this stage and depends on the number of down-time of the
Project. However, for purpose of ex-ante estimation, it is assume that 105tonnes of diesel oil per year will be consumed.
This data is estimated based on 12 shut-down per year (for all 3 lines of equipment) and diesel consumption required per
shut-down which is 8.75t for start-up and back-up electrical generation. Material movement within PAA is using
conveyor belt which draw electricity from the Project.
Based on diesel fuel emission factor calculated above, the associated emission from this source is approximated as
follow:
𝑃𝐸𝐹𝐹𝑦 = 0𝑡𝑑𝑖𝑒𝑠𝑒𝑙
𝑦𝑟+ 105
𝑡𝑑𝑖𝑒𝑠𝑒𝑙
𝑦𝑟 ∙ 3.24
𝑇𝐽
𝑡𝑑𝑖𝑒𝑠𝑒𝑙~340
𝑡𝐶𝑂2
𝑇𝐽
A3. CH4 Emissions from Combustion of Biomass Residue, 𝑃𝐸𝑏𝑖𝑜𝑚𝑎𝑠𝑠 ,𝐶𝐻4,𝑦
Based on information provided in Table 17 in Annex 3-2, It is estimated that the Project will consumes over
200,000tonnes of biomass per year yielding 2,728TJ/yr of energy.
Using default methane emission factor of 30kgCH4/TJ provided by the methodology and applying uncertainty factor of
1.37, the resulting methane emission from biomass combustion is estimated as follow:
𝑃𝐸𝑏𝑖𝑜𝑚𝑎𝑠𝑠 ,𝐶𝐻4,𝑦 = 1.37 ∙ 0.030𝑡𝐶𝐻4
𝑇𝐽∙ 2,728
𝑇𝐽
𝑦𝑟~112
𝑡𝐶𝐻4
𝑦𝑟
Total Project Emission, 𝑃𝐸𝑦
Based on the calculated project emissions from transportation, on-site fossil fuel usage, and methane released from combustion
calculated above, the project emissions are totalled to 3,951tCO2 per year.
𝑃𝐸𝑦 = 1,259𝑡𝐶𝑂2
𝑦𝑟+ 340
𝑡𝐶𝑂2
𝑦𝑟+ 21 ∙ 112
𝑡𝐶𝐻4
𝑦𝑟~3,951
𝑡𝐶𝑂2
𝑦𝑟
B. Emission Reduction from the Displacement of Fossil Based Electricity
Emission Factor of Baseline Electricity The Project will displace a series of new state-of-the-art fuel economic diesel power
generators with fuel consumption rate of 7,962kJ/kWh at continuous full load, using diesel oil with LHV of 42,700kJ/kg. Based
on this data, the electrical generation efficiency is calculated to be 45%.
𝜀𝑒𝑙 ,𝑟𝑒𝑓 =𝑘𝑊ℎ
7,962𝑘𝐽=
3,600𝑘𝐽
7,962𝑘𝐽= 0.45
Using lower limit CO2 emission factor for diesel oil in Table 1.4 2006 IPCC Guideline of 72.6tCO2/yr, the emission factor of
baseline electricity is calculated to be 0.5808tCO2/MWh.
𝐸𝐹𝑒𝑙𝑒𝑐𝑡𝑟𝑖𝑐𝑖𝑡𝑦 ,𝑦 =72.6
𝑡𝐶𝑂2𝑦𝑟
45%∙ 3.6 ×
10−3𝑇𝐽
𝑀𝑊ℎ= 0.5808
𝑡𝐶𝑂2
𝑀𝑊ℎ

PROJECT DESIGN DOCUMENT FORM (CDM PDD) - Version 03.1.
CDM Executive Board
Page 35
Net electricity supplied to PAA The net electricity required in PAA is approximated to be 54,952MWh per year based on
7,964kW demands from downstream facility and 6,900 operating hours per year.
𝐸𝐺𝑦 = 7,964𝑘𝑊 ∙ 6,900ℎ𝑟
𝑦𝑟~54,952
𝑀𝑊ℎ
𝑦𝑟
Emission reduction from fossil based electricity displacement
Based on the calculated emission factor of 0.5808tCO2/MWh, and displaced electricity of 54,952 MWh, the emission reduction
resulting from displacement of fossil based electricity generation is 31,915tCO2/yr
𝐸𝑅𝑒𝑙𝑒𝑐𝑡𝑟𝑖𝑐𝑖𝑡𝑦 ,𝑦 = 0.5808𝑡𝐶𝑂2
𝑀𝑊ℎ∙ 58,945
𝑀𝑊ℎ
𝑦𝑟~31,915
𝑡𝐶𝑂2
𝑦𝑟
C. Emission reduction due to displacement of fossil based heat
Average efficiency of displaced boiler In the baseline situation, steam is provided by operating three types of boilers:
(a) Low pressure biomass boiler to meet the low pressure steam demand from upstream facilities (797TJ/yr). This boiler
would have an efficiency of 70%;
(b) Low pressure boiler residue boiler to meet the demand of low pressure steam from downstream facilities (621TJ/yr).
This boiler would have efficiency of nearly 100%.
(c) Medium pressure boiler residue boiler to meet the demand of medium pressure steam from downstream facilities
(292TJ/yr). This boiler would have efficiency of nearly 100%.
The average efficiency of the above three boilers (𝜀𝐵𝐿,𝐵𝑂𝐼𝐿𝐸𝑅 ) is calculated to be 86%
𝜀𝐵𝐿,𝐵𝑂𝐼𝐿𝐸𝑅 = 0.7 ∙797
1710+ 1 ∙
621
1710+ 1 ∙
292
1710= 0.326 + 0.363 + 0.17 = 86%
Emission reduction from fossil-based heat displacement
It is estimated in Annex 3-2, that combustion of biomass in the project plant (𝑄𝑝𝑟𝑜𝑗𝑒𝑐𝑡𝑝𝑙𝑎𝑛𝑡 ) yields 2,128TJ/yr of heat and requires
2,728TJ/yr of biomass fuel. Out of these, 965TJ/yr is already used in the baseline situation from combustion of biomass K1, K2, K3
(Table 18, Annex 3-5).
Based on the lower limit of residual fuel oil of 75.5tCO2/TJ obtained from Table 1.4 IPCC Guideline, the emission reduction from
fossil-based heat displacement is calculated as follow:
𝐸𝑅ℎ𝑒𝑎𝑡 ,𝑦 = 2,128
𝑇𝐽
𝑦𝑟
86%− 965
𝑇𝐽
𝑦𝑟 ∙ 75.5
𝑡𝐶𝑂2
𝑇𝐽~113,961
𝑡𝐶𝑂2
𝑦𝑟
D. Baseline Emission due to Natural Decay of Biomass
As identified in Annex 3, PAA mills generate 93,150t of wet EFB on annual basis. Using methodological “Tool to determine
methane emissions from solid waste disposal site”, the amount of methane released from accumulation of this biomass (type K5) if
left to decompose can be determined.
The constant parameter alpha is pre-determined to be 5.67 using parameters contained in Table 10 (p. 26). Based on degradable
organic carbon for material with similar carbon content as wood of 0.43 (on wet basis) and decay constant for slowly degrading
material in tropical climate, the projected emission profile from biomass decomposition is averaged to be 38,820tCO2/yr (for 10
years). The emission profile can be seen in the following Section B.6.4.
E. Leakage Emission

PROJECT DESIGN DOCUMENT FORM (CDM PDD) - Version 03.1.
CDM Executive Board
Page 36
As elaborated under Section B.6.1 (Explanation of methodological choices), the Project activity is not expected to result in
increase of fossil fuel usage outside the Project boundary. Consequently, leakage emission is zero.
F. Effective emission reduction, 𝐸𝑅𝑦
Based on the calculated (a) project emissions of 3,951tCO2/yr, (b) emission reduction from fossil-based electricity generation of
31,915tCO2/yr, (c) emission reduction from heat-based steam of 113,911tCO2/yr and (d) baseline emission from methane avoided
averaged at 38,820tCO2 per year, the total emission reduction from project activity is estimated to be 180,695tCO2 per annum.
B.6.4 Summary of the ex-ante estimation of emission reductions:
Table 12- Estimated Project Emission
Year
Estimated project emission
from transportation of biomass
(tonnes of CO2)
Estimated project emission
from on-site fossil fuel usages
(tonnes of CO2)
Estimated project emission
from methane released during
biomass combustion
(tonnes of CO2)
Total estimated project
emission (tonnes of CO2)
1 1,259 340 2,352 3,951
2 1,259 340 2,352 3,951
3 1,259 340 2,352 3,951
4 1,259 340 2,352 3,951
5 1,259 340 2,352 3,951
6 1,259 340 2,352 3,951
7 1,259 340 2,352 3,951
8 1,259 340 2,352 3,951
9 1,259 340 2,352 3,951
10 1,259 340 2,352 3,951
Total 12,590 3,400 23,520 39,510
Table 13 – Estimated Baseline Emission
Year
Estimated emission reduction
from displacement of fossil-
based electricity (tonnes of
CO2)
Estimated emission reduction
of fossil-based heat (tonnes of
CO2)
Estimated emission reduction
from avoidance of methane
released from biomass
decomposition (tonnes of
CO2)
Total estimated baseline
emission
(tonnes of CO2)
1 31,915 113,911 7,811 153,637
2 31,915 113,911 15,354 161,180
3 31,915 113,911 22,637 168,463
4 31,915 113,911 29,670 175,496
5 31,915 113,911 36,461 182,287
6 31,915 113,911 43,018 188,844
7 31,915 113,911 49,350 195,176
8 31,915 113,911 55,464 201,290
9 31,915 113,911 61,367 207,193
10 31,915 113,911 67,068 212,894
Total 319,150 1,139,109 388,200 1,846,459

PROJECT DESIGN DOCUMENT FORM (CDM PDD) - Version 03.1.
CDM Executive Board
Page 37
Table 14 – Estimated Emission Reduction
Year Estimation of project activity
emission (tonnes of CO2)
Estimation of baseline
emissions (tonnes of CO2)
Estimation of leakage
emissions (tonnes of CO2)
Estimation of overall emission
reduction (tonnes of CO2)
1 3,951 153,637 0 149,686
2 3,951 161,180 0 157,229
3 3,951 168,463 0 164,512
4 3,951 175,496 0 171,545
5 3,951 182,287 0 178,336
6 3,951 188,844 0 184,893
7 3,951 195,176 0 191,225
8 3,951 201,290 0 197,339
9 3,951 207,193 0 203,242
10 3,951 212,894 0 208,943
Total 39,510 1,846,459 0 1,806,949
B.7 Application of the monitoring methodology and description of the monitoring plan:
B.7.1 Data and parameters monitored:
Data / Parameter: 𝐵𝐹𝑇,𝑘 ,𝑦
Data unit: Trips/yr
Description: Quantity of biomass type K3 and K4 transported to Project site
Source of data to be used: Recorded weighing slip at receiving station
Value of data applied for the purpose of
calculating expected emission reductions in
section B.5
Projected to be 80,356t-shell/yr
Description of measurement methods and
procedures to be applied:
All delivery of biomass is recorded and weigh on weighing bridge supplier payment purposes
at biomass receiving station. A weighing slip is issued to supplier for billing purpose.
QA/QC procedures to be applied: Weighing bridge is subjected to regular government calibration with tolerance of less than 1%
Any comment: N/A
Data / Parameter: 𝑇𝐿𝑦
Data unit: t/delivery
Description: Average tonnage of delivery
Source of data to be used: Recorded weighing slip at receiving station
Value of data applied for the purpose of
calculating expected emission reductions in
section B.5
Average delivery is approximately 28t based on truck loading capacity.
Description of measurement methods and
procedures to be applied:
All delivery of biomass is recorded and weigh on weighing bridge supplier payment purposes
at biomass receiving station. A weighing slip is issued to supplier for billing purpose.
QA/QC procedures to be applied: Weighing bridge is subjected to regular government calibration with tolerance of less than 1%
Any comment: N/A
Data / Parameter: 𝐴𝑉𝐷𝑦

PROJECT DESIGN DOCUMENT FORM (CDM PDD) - Version 03.1.
CDM Executive Board
Page 38
Data unit: Km/trip
Description: Average roundtrip distance performed by biomass supplier
Source of data to be used: Information obtained from official sources
Value of data applied for the purpose of
calculating expected emission reductions in
section B.5
400km/trip (approximation)
Description of measurement methods and
procedures to be applied:
The name of the supplier is identified at the receiving station and delivery source from
individual supplier is identified by the supplier address
QA/QC procedures to be applied: The distance of delivery should be verified using official-issued road map.
Any comment: N/A
Data / Parameter: 𝐸𝐹𝑘𝑚 ,𝐶𝑂2,𝑦
Data unit: t-CO2/km
Description: Average CO2 emission factor for the trucks during the year y
Source of data to be used: Literature
Value of data applied for the purpose of
calculating expected emission reductions in
section B.5
0.001097 t-CO2/km representing the emission factor of a heavy-duty truck without emission
control measure from 1996 IPCC Revised Guideline
Description of measurement methods and
procedures to be applied:
1. Conduct sample measurements of fuel type, fuel consumption and distance travelled by a
representative truck types to identify its specific fuel consumption per distance travelled
(volume of fuel/km) from 2 suppliers.
2. Determine CO2 emission factor is using the collected data (1) and the following fuel specific
information.
(a) Net calorific value (LHV) of fuel used (based on local supplier data, or if not
available upper limit provided in Table 1.2 2006 IPCC Guideline) in MJ/tfuel.
(b) Density of fuel (based on local supplier data, or if not available use 0.9kg/L
(c) CO2 emission factor of fuel used based on upper limit provided in Table 1.4 2006
IPCC Guideline)
QA/QC procedures to be applied: Compared the calculated data with the ex-ante value. The applicable CO2 emission factor is
the higher between the two values.
Any comment: N/A
Data / Parameter: 𝐹𝐹𝑝𝑟𝑜𝑗𝑒𝑐𝑡𝑝𝑙𝑎𝑛𝑡 ,𝑖,𝑦
Data unit: t-fuel/yr
Description: Quantity of fossil fuel type i used for project boiler co-firing during year y (t-fuel/yr)
Source of data to be used: Measurement of fossil fuel fed to the boiler
Value of data applied for the purpose of
calculating expected emission reductions in
section B.5
N/A
Description of measurement methods and
procedures to be applied:
All fossil fuel co-fired in the biomass boiler must be recorded either using weighing bridge (if
solid fuel), or meters (if gas or liquid is used).
QA/QC procedures to be applied: Measuring device(s) must be calibrated at least once per year with maximum error level of
4%.

PROJECT DESIGN DOCUMENT FORM (CDM PDD) - Version 03.1.
CDM Executive Board
Page 39
Any comment: Co-firing with fossil fuel is not foreseen.
Data / Parameter: 𝐹𝐹𝑝𝑟𝑜𝑗𝑒𝑐𝑡𝑠𝑖𝑡𝑒 ,𝑖,𝑦
Data unit: t-fuel/yr
Description: Quantity of fossil fuel type i used for activity attributed to Project during year y (t-fuel/yr)
Activity attributed to Project that consumes fossil fuel is the operation of diesel power
generator set to provide electricity to cold-start power plants or emergency situation where the
biomass plants are not able to supply electricity.
Source of data to be used: Fuel metering device to the stand-by power generator set.
Value of data applied for the purpose of
calculating expected emission reductions in
section B.5
105 t of diesel oil per year
Description of measurement methods and
procedures to be applied:
On-line metering device is logged on at least once per month
QA/QC procedures to be applied: Measuring device is calibrated by standard laboratory at least once per year with maximum
error level of 4%.
Any comment: N/A
Data / Parameter: 𝑁𝐶𝑉𝑘
Data unit: MJ/t
Description: Net calorific value of all biomasses relevant to the project (shell, fibre, EFB)
Source of data to be used: Sampling and laboratory analysis
Value of data applied for the purpose of
calculating expected emission reductions in
section B.5
Biomass Type Calorific Value in MJ/t
Fibre (K1) 𝑁𝐶𝑉𝐾1 9,257
Shell (K2,K3,K4) 𝑁𝐶𝑉𝐾2,𝑁𝐶𝑉𝐾3 , 𝑎𝑛𝑑 𝑁𝐶𝑉𝐾4 15,715
EFB (K5) 𝑁𝐶𝑉𝐾5 8,468
Description of measurement methods and
procedures to be applied:
Sample is taken once per year and send to internationaly accredited laboratory for testing of
low heating value.
QA/QC procedures to be applied: N/A
Any comment: N/A
Data / Parameter: 𝐵𝐹𝐾1,𝑦
Data unit: Tonnes/yr
Description: Quantity of biomass residue K1 (onsite-generated fibre) feed to the project plant
Source of data to be used: Direct measurement of fibre generated by PAA mill using screw conveyour system
Value of data applied for the purpose of
calculating expected emission reductions in
section B.5
46,230t-fibre per year
Description of measurement methods and
procedures to be applied:
Fibre generated by the mill is loaded into screw conveyour system destined to the boiler. The
screw conveyour system has constant loading capacity (kg of fibre per minute). By monitoring
the operation time of the screw conveyour belt the amount of fibre fed to the boiler can be
accurately measured.
QA/QC procedures to be applied: The loading capacity of the screw convenyour must be tested once per year during verification
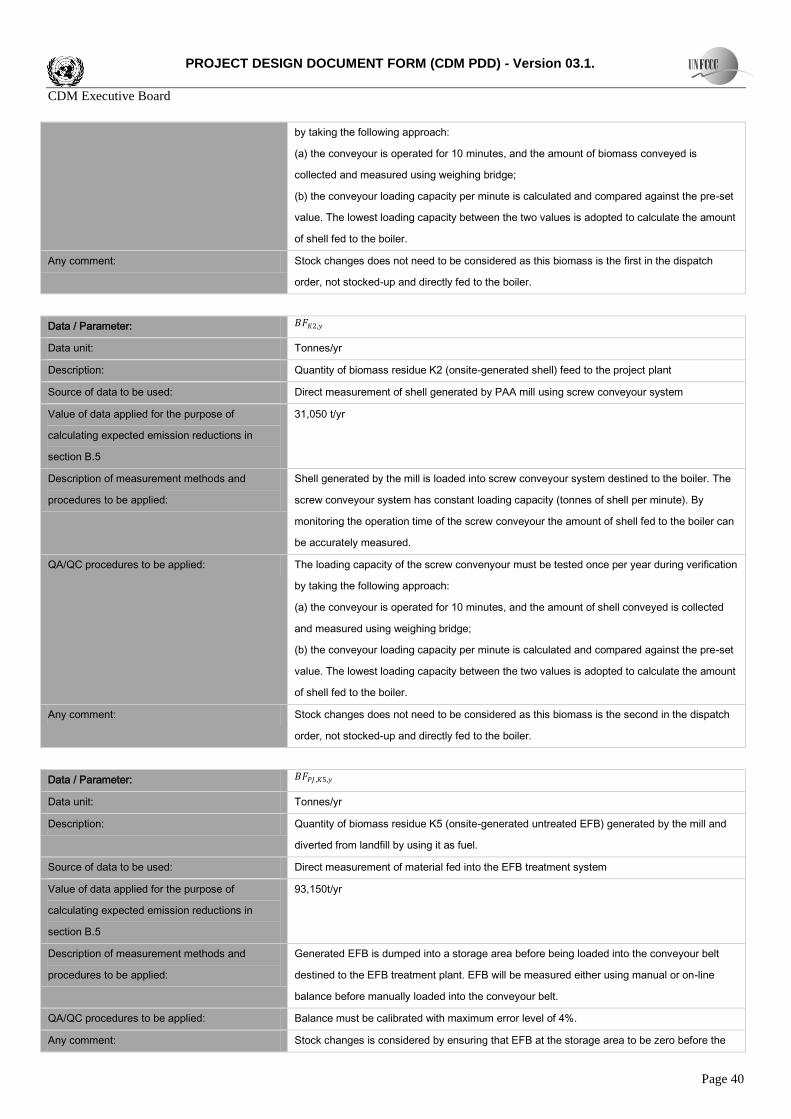
PROJECT DESIGN DOCUMENT FORM (CDM PDD) - Version 03.1.
CDM Executive Board
Page 40
by taking the following approach:
(a) the conveyour is operated for 10 minutes, and the amount of biomass conveyed is
collected and measured using weighing bridge;
(b) the conveyour loading capacity per minute is calculated and compared against the pre-set
value. The lowest loading capacity between the two values is adopted to calculate the amount
of shell fed to the boiler.
Any comment: Stock changes does not need to be considered as this biomass is the first in the dispatch
order, not stocked-up and directly fed to the boiler.
Data / Parameter: 𝐵𝐹𝐾2,𝑦
Data unit: Tonnes/yr
Description: Quantity of biomass residue K2 (onsite-generated shell) feed to the project plant
Source of data to be used: Direct measurement of shell generated by PAA mill using screw conveyour system
Value of data applied for the purpose of
calculating expected emission reductions in
section B.5
31,050 t/yr
Description of measurement methods and
procedures to be applied:
Shell generated by the mill is loaded into screw conveyour system destined to the boiler. The
screw conveyour system has constant loading capacity (tonnes of shell per minute). By
monitoring the operation time of the screw conveyour the amount of shell fed to the boiler can
be accurately measured.
QA/QC procedures to be applied: The loading capacity of the screw convenyour must be tested once per year during verification
by taking the following approach:
(a) the conveyour is operated for 10 minutes, and the amount of shell conveyed is collected
and measured using weighing bridge;
(b) the conveyour loading capacity per minute is calculated and compared against the pre-set
value. The lowest loading capacity between the two values is adopted to calculate the amount
of shell fed to the boiler.
Any comment: Stock changes does not need to be considered as this biomass is the second in the dispatch
order, not stocked-up and directly fed to the boiler.
Data / Parameter: 𝐵𝐹𝑃𝐽 ,𝐾5,𝑦
Data unit: Tonnes/yr
Description: Quantity of biomass residue K5 (onsite-generated untreated EFB) generated by the mill and
diverted from landfill by using it as fuel.
Source of data to be used: Direct measurement of material fed into the EFB treatment system
Value of data applied for the purpose of
calculating expected emission reductions in
section B.5
93,150t/yr
Description of measurement methods and
procedures to be applied:
Generated EFB is dumped into a storage area before being loaded into the conveyour belt
destined to the EFB treatment plant. EFB will be measured either using manual or on-line
balance before manually loaded into the conveyour belt.
QA/QC procedures to be applied: Balance must be calibrated with maximum error level of 4%.
Any comment: Stock changes is considered by ensuring that EFB at the storage area to be zero before the

PROJECT DESIGN DOCUMENT FORM (CDM PDD) - Version 03.1.
CDM Executive Board
Page 41
monitoring period start and zero (fully consumed) at the end of the monitoring period.
Data / Parameter: 𝑚𝐾5
Data unit: %
Description: Percentage of moisture removal by EFB treatment system or moisture removed per raw EFB
Source of data to be used: Moisture test of raw EFB and treated EFB
Value of data applied for the purpose of
calculating expected emission reductions in
section B.5
30.4%
Description of measurement methods and
procedures to be applied:
The following procedure are followed twice per year at the beginning of monitoring period and
at the mid-terms of the monitoring period:
(a) sample of fresh EFB is taken, and tested for its % water content (𝑚𝐴) in PAA laboratory
(b) sample of treated EFB (taken before boiler feeding) is tested for its water content (𝑚𝐵) in
PAA laboratory;
(c) the percentage of moisture (𝑚𝐾5) removed is calculated using the following formula:
𝑚𝐾5 =𝑚𝐴 − 𝑚𝐵
1 − 𝑚𝐵
QA/QC procedures to be applied: The testing of moisture content must follow internationally accepted standard.
Any comment: This parameter is measured to calculate the amount of (treated) EFB combusted into the
boiler.
Data / Parameter: 𝐵𝐹𝐾5,𝑦
Data unit: Tonnes/yr
Description: Quantity of biomass residue K5 (onsite-generated treated EFB) generated by the mill and fed
into the boiler
Source of data to be used: Combination of direct measurement and moisture adjustment
Value of data applied for the purpose of
calculating expected emission reductions in
section B.5
64,860t/yr
Description of measurement methods and
procedures to be applied:
Calculated from measured 𝐵𝐹𝑃𝐽 ,𝐾5,𝑦 and 𝑚𝐾5 using the following relationship:
𝐵𝐹𝐾5,𝑦 = 𝐵𝐹𝑃𝐽 ,𝐾5,𝑦 ∙ (1 − 𝑚𝐾5)
QA/QC procedures to be applied: N/A
Any comment:
Data / Parameter: 𝐵𝐹𝐾3,𝑦 and 𝐵𝐹𝐾4,𝑦
Data unit: Tonnes/yr
Description: 𝐵𝐹𝐾3,𝑦 is the amount of shell imported in the baseline situation and used in the project plant;
𝐵𝐹𝐾4,𝑦 is the amount of ‘additional shell’ imported in the project situation in addition to 𝐵𝐹𝐾3,𝑦
Source of data to be used: Combination of direct measurement (𝑀𝐿𝑃), steam-table and heat and material balance
calculation;
Value of data applied for the purpose of
calculating expected emission reductions in
64,860

PROJECT DESIGN DOCUMENT FORM (CDM PDD) - Version 03.1.
CDM Executive Board
Page 42
section B.5
Description of measurement methods and
procedures to be applied:
1. Measurement of low pressure steam is elaborated in the relevant table;
2. Calculate the amount of 𝐵𝐹𝐾3,𝑦 using the following relationship:
𝐵𝐹𝐾3,𝑦 =1
𝑁𝐶𝑉𝐾3
∙ 𝑀𝐿𝑃 ∙ (𝐻𝐿𝑃 − 𝐻𝐻2𝑂)
𝜀𝐵𝐿 ,𝐵𝑜𝑖𝑙𝑒𝑟
− 𝐵𝐹𝑘 ,𝑦 ∙ 𝑁𝐶𝑉𝑘
𝐾2
𝐾1
3. Calculate 𝐵𝐹𝐾4,𝑦 using the following relationship:
𝐵𝐹𝐾4,𝑦 = 𝐵𝐹𝑇,𝐾,𝑦 − 𝐵𝐹𝐾3,𝑦
QA/QC procedures to be applied: See QA/QC for 𝑁𝐶𝑉𝑘 , 𝑀𝐿𝑃, and 𝐵𝐹𝑇,𝑘 ,𝑦
Any comment: N/A
Data / Parameter: 𝑀𝐻𝑃
Data unit: t/yr
Description: (Mass) Quantity of high pressure steam generated by the boiler equivalent to the amount of
water fed to the boiler
Source of data to be used: Direct flowrate measurement of water fed to individual boiler or single measurement of steam
entering High Pressure steam header
Value of data applied for the purpose of
calculating expected emission reductions in
section B.5
120t/hr
Description of measurement methods and
procedures to be applied:
Continuous on-line flow-meter
QA/QC procedures to be applied: Flowmeter is subject to annual calibration with maximum error of up to 4%
Any comment: N/A
Data / Parameter: 𝑀𝐿𝑃
Data unit: t/yr
Description: (Mass) Quantity of low pressure steam delivered to the users
Source of data to be used: Flowmeter
Value of data applied for the purpose of
calculating expected emission reductions in
section B.5
75t/hr
Description of measurement methods and
procedures to be applied:
1. Direct measurement of steam recirculated to the boiler (𝑄𝐶) from back pressure vessel
(BPV).
2. The low pressure steam delivered to the user is calculated as 𝑄𝐿𝑃 = 𝑄𝐻𝑃 − 𝑄𝐶
QA/QC procedures to be applied: Flowmeter is subject to annual calibration with maximum error of up to 4%
Any comment:
Data / Parameter: 𝑄𝑝𝑟𝑜𝑗𝑒𝑐𝑡 𝑝𝑙𝑎𝑛𝑡
Data unit: TJ/yr
Description: Net (heat) quantity of steam generated by the project plant by firing biomass residue
Source of data to be used: Combination of direct measurement (flowmeter, temperature and pressure) and calculation
Value of data applied for the purpose of
calculating expected emission reductions in
2,128TJ/yr

PROJECT DESIGN DOCUMENT FORM (CDM PDD) - Version 03.1.
CDM Executive Board
Page 43
section B.5
Description of measurement methods and
procedures to be applied:
1. Hourly measurement of temperature and pressure at the boiler outlet to determine specific
enthalpy of steam generated by the biomass boiler 𝐻𝐻𝑃 in MJ/t
2. Calculate heat generated by the project plant using the following relationship:
𝑄𝑝𝑟𝑜𝑗𝑒𝑐𝑡 𝑝𝑙𝑎𝑛𝑡 = 𝑀𝐻𝑃 ∙ (𝐻𝐻𝑃 − 419) ∙ 10−6
QA/QC procedures to be applied: All quantity measuring device (flowmeter, temperature, and pressure) must be calibrated with
maximum error of up to 4%.
Any comment: N/A
Data / Parameter: 𝐸𝐺𝑦
Data unit: MWh
Description: Net electricity supplied by the Project to PAA
Source of data to be used: Electricity meters of the following:
(a) Electricity meters measuring electricity generated by all turbines;
(b) Electricity meters measuring electricity consumed by biomass power plant including
reverse osmosis plant
Value of data applied for the purpose of
calculating expected emission reductions in
section B.5
57,960MWh
Description of measurement methods and
procedures to be applied:
Individual meters are logged on daily basis.
Net electricity supplied is the difference between generation (a) and consumption (b)
QA/QC procedures to be applied: Individual electricity meters is calibrated annually with maximum error of 4%
Any comment: N/A
B.7.2 Description of the monitoring plan:
Management Structure of CDM in PAA
In order to meet the CDM monitoring and reporting requirements as outlined above, PAA will appoint its Plant Manager as the
CDM Coordinator reporting directly to a member of the Board of Director at the Nagamas‟ parent company Permata Hijau Group
(PHG).
The CDM Coordinator will supervise the following activities:
Data collection and instrument calibration by the PAA‟s technical department;
Consolidation of results from various departments; and
Issuance of emission reduction and monitoring reports for the purpose of verification.
The CDM Coordinator will also be responsible to ensure that data has been collected as per the requirements of this PDD and
contain no errors.
Monitoring equipment & Calibration Procedure
All monitoring equipment is installed by experts using standard methods. All concerning equipments will be calibrated to the
highest standards prior to start of credit period and regularly maintained by the project operator. Any irregularities or problems
with the equipment will be reported to the management and rectified as soon as possible. A thorough instrument calibration will
be conducted at the start of the crediting period.
A calibration report status is maintained for CDM purpose. The report identifies all instrumentations mandatory for calibration, its
historical maintenance and calibration report. Calibration is performed minimum annually and timed during Plant maintenance

PROJECT DESIGN DOCUMENT FORM (CDM PDD) - Version 03.1.
CDM Executive Board
Page 44
shut-down or if any irregularities are identified. The calibration status report will be checked for validity and compliance during
audits prior to the release of six-monthly Emission Reduction Delivery Report (ERDP).
PHG will train the power plant personnel to operate the equipment and to record all the data necessary for monitoring the Project
activity as specified in the monitoring plan. This data will be directly used for calculation of project emissions.
Archiving, Reporting, and Auditing Structure
All data required to be logged on regular basis will be recorded in the Operator Journal system. At the end of the day, the operator
log sheet will be transferred to a CDM Report covering all CDM-related instrumentation record.
This report will cover day-to-day data of:
a. Number of biomass delivery and distance covered by supplier;
b. Amount of fossil fuel consumed for power generation;
c. Amount of biomass generated and combusted;
d. Amount of net electricity delivered to PAA processing facilities;
e. Amount of heat output from the biomass boiler;
f. Amount of low pressure/medium pressure steam delivered to users
On six-monthly basis, the Technical Department at PHG will issue an Emission Reduction Delivery Report (ERDP) containing a
consolidated CDM Daily Report, estimated (delivered) emission reduction, calibration status report and an audit report verifying
the accuracy of the CDM Daily Report. The ERDP is signed and approved by PHG‟s Technical Director and will make part of the
monitoring report for annual verification. Annually monitored parameters such as the biomass net calorific values and obligation
to measure fuel consumption of delivery truck will be performed and the results are reported in the ERDP.
The hard copy of the daily report will be stored locally at Nagamas‟ site and an electronic copy is sent to PHG‟s headquarter in
Medan on daily basis to prevent data loss. Both electronic and hard copy will be archived for at least 2 years after the end of the
last crediting period.
B.8 Date of completion of the application of the baseline study and monitoring methodology and the name of the
responsible person(s)/entity(ies)
Clean Energy Finance Committee, Mitsubishi UFJ Securities Co. Ltd.
Mitsubishi Building, 2-5-2 Marunouchi, Chiyoda-ku,
Tokyo 100-0005, Japan
Ph. +81 (3) 6213 6860
Fax. +81 (3) 6213 6175
Email: [email protected]
Mitsubishi UFJ Securities is the CDM advisor to the Project, and is also a participant in this Project
Date of completion of baseline and monitoring assessment is 18/03/2008

PROJECT DESIGN DOCUMENT FORM (CDM PDD) - Version 03.1.
CDM Executive Board
Page 45
SECTION C. Duration of the project activity / crediting period
C.1 Duration of the project activity:
C.1.1. Starting date of the project activity:
14/09/2004, representing date when the Project enters agreements with equipment suppliers.
C.1.2. Expected operational lifetime of the project activity:
30 years
C.2 Choice of the crediting period and related information:
C.2.1. Renewable crediting period
C.2.1.1. Starting date of the first crediting period:
N/A
C.2.1.2. Length of the first crediting period:
N/A
C.2.2. Fixed crediting period:
C.2.2.1. Starting date:
01/05/2008 or immediately after registration
C.2.2.2. Length:
10 years and 00 months
SECTION D. Environmental impacts
D.1. Documentation on the analysis of the environmental impacts, including transboundary impacts:
In accordance with regulation issued by the Minister of Environment of the host-nation, (No. 11/2006), PAA facilities does fall
into category of facility that needs an Environmental Impact Statement, but mandated to provide “Efforts for Environmental
Management and Monitoring”, which contains approved monitoring plan and actions that must be carried out.
D.2. If environmental impacts are considered significant by the project participants or the host Party, please provide
conclusions and all references to support documentation of an environmental impact assessment undertaken in accordance
with the procedures as required by the host Party:
The project activity does not pose any significant environmental impact. Nevertheless, it is required to comply with the national
regulation in air quality from biomass combustion in stationary sources. The regulation requires PAA to maintain air emission
quality to be below standard applied in the Ministerial Decree No. 7/2007 which requires control of particulate emissions, and
other gases.

PROJECT DESIGN DOCUMENT FORM (CDM PDD) - Version 03.1.
CDM Executive Board
Page 46
SECTION E. Stakeholders’ comments
E.1. Brief description how comments by local stakeholders have been invited and compiled:
The first stakeholder consultation meeting was conducted at PAA on 09 January 2006. This meeting was attended by 26 members
of communities living in Sebangar, Simpang Bangko and Bumbung. This meeting combined information of both PAA Biomass
and Biogas Projects in a single information & consultation session. During the
meeting, a member of community suggests invitation be extended to wider audience
than the three villages already invited.
Based on this concern, a second consultation session was held in 18 June 2007, at
PAA office in Simpang Bangko. Formal invitations were extended to members of
communities of Sebangar, Simpang Bangko, Kesumbo Ampai, Suka Jadi, Suka
Tamba, and Sidomulyo villages, which are located adjacent to PAA via the individual
village heads (Kepala Desa). 21 community representatives and PAA member of
staff attended the meeting.
Comments and concerns during both meetings are summarized in Section E.2.
E.2. Summary of the comments received:
First session, 09 January 2006
Mr. Naksir Sakban the Village Chief of Sebangar inquires the extent of efforts placed by PAA to contain its waste. Mr. Sakban
also recommended that villagers be involved in managing PAA‟s waste. PAA explained that palm oil mill, including PAA,
generates a lot of waste. However, PAA is taking measure to converts its waste by using them as main energy source, replacing
fuel oils typically used for similar facility.
PAA also plans to treat its effluent such that it will no longer liberate the unpleasant smells currently observed. PAA explained
that the company has obtained permit from environmental regulators to carry out such efforts, and the Project will be carried out
in accordance with guidelines sets under the environmental documents.
Mr. Mulyono from Sebangar Village concerns about impact of global warming to farmers. PAA clarifies that the global warming
change global climate and results in extreme season variations. For farmers this means it is harder to predict period of rainy or dry
seasons, affecting planting and harvest time. On extreme case, it may reduce harvest, frequent flash flood and other environmental
problems.
Mr. Mulyono is further inquiring the hazards posed by the residue generated from the Project. PAA explains that any residue
would be handled in accordance to guideline sets by the environmental agency (BAPPEDAL). PAA is working together with local
authorities and consultants to report its industrial activities and its remaining waste to the related authorities.
Mr. Amrizal, the village Secretary of Kesumbo Ampai expressed appreciation for PAA‟s efforts to socialize the Project to
concerning parties, and express hope that consultation are conducted with larger audience, PAA appreciates the input from Mr.
Amrizal and will discuss with management if this suggestion can be implemented.
Mr. Yudelwan, a community leader of Simpang Bangko hopes that PAA will provide consultation sessions for member of
community to learn planting, maintaining, and harvesting palm oil trees. It is noted that there are 30,000ha of land can potentially
be used for plantation. PAA explained to Mr. Yudelwan that such input is appreciated and the local Plantation and General Affair
will in future design such session for benefit of community.
Second Session, 18 June 2007
Mr. Mariono stated that the use of shell and empty fruit bunches as source of energy generates exhaust during combustion. He
inquired if this is any different from the combustion of diesel and residue which also generates exhaust. PAA explained that the
use of mineral fuel (diesel and residue) contains pollutants such as sulphur which are not found in biomass combustion. This
means that exhaust from biomass combustion is cleaner than exhaust from fossil fuel combustion and thus less hazardous.
Mr. Syarifuddin asks if the residue from the boiler can be used by the community. PAA explains that the solid waste generated by
the boiler is small and contains very little nutrient. Residue from combustion can sometimes be used as building material,
however, qualities of such material is unknown.

PROJECT DESIGN DOCUMENT FORM (CDM PDD) - Version 03.1.
CDM Executive Board
Page 47
Mr. Naksir Saban noted that at the start of mill operation there was an increased of fly population in his area, however, he
acknowledged that these flies are no longer around. Mr. Naksir asked if the decline of the fly population has anything to do with
the Project. PAA explained that before the Project started, the empty fruit bunches accumulates as the incinerator is not allowed to
be operated. Bacteria proliferate on this material and releases strong odour, which then attracts flies and other pests. Now that the
Project is implemented, all of these empty fruit bunches are combusted and thus population of flies are noticeably low.
Mr. Syahrial inquires of the potential impact that may be experienced by surrounding community if PAA does not implement the
Project. PAA explained that in addition to the reduction of pest population as noted by Mr. Saban, the Project avoided the use of
large amount of fossil fuel that is needed to continue PAA‟s activity. Without the Project, community will experience reduction of
air quality.
It is further explained that the Project contributes to global action to mitigate global warming. Without the Project,
industrial/economic activities continue to release green house gases which are harmful to our existence and future generation.
E.3. Report on how due account was taken of any comments received:
No due account was due from the stakeholder meetings.

PROJECT DESIGN DOCUMENT FORM (CDM PDD) - Version 03.1.
CDM Executive Board
Page 48
Annex 1
CONTACT INFORMATION ON PARTICIPANTS IN THE PROJECT ACTIVITY
Organization: PT Pelita Agung Agrindustri
Street/P.O.Box: Jl. Iskandar Muda No. 107
Building:
City: Medan
State/Region: Sumatra Utara
Postfix/ZIP: 20154
Country: Indonesia
Telephone: +62 (61) 457 7777
FAX: +62 (61) 456 9755
E-Mail: [email protected]
URL: www.permatagroup.com
Represented by:
Title: Asst. Managing Director
Salutation: Mr.
Last Name: Virgo
Middle Name:
First Name: Jhonny
Department:
Mobile:
Direct FAX:
Direct tel:
Personal E-Mail:
Organization: Mitsubishi UFJ Securities Co., Ltd.
Street/P.O.Box: 2-5-2 Marunouchi
Building: Mitsubishi Building
City: Chiyoda-ku
State/Region: Tokyo
Postfix/ZIP: 100-0005
Country: Japan
Telephone: +81 (3) 6213 6860
FAX: +81 (3) 6213 6175
E-Mail: [email protected]
URL: www.sc.mufg.jp
Represented by:
Title: Chairman
Salutation: Mr.
Last Name: Hatano
Middle Name:
First Name: Junji
Department: Clean Energy Finance Committee
Mobile:

PROJECT DESIGN DOCUMENT FORM (CDM PDD) - Version 03.1.
CDM Executive Board
Page 49
Annex 2
INFORMATION REGARDING PUBLIC FUNDING
The Project does not involve any public funding

PROJECT DESIGN DOCUMENT FORM (CDM PDD) - Version 03.1.
CDM Executive Board
Page 50
Annex 3
BASELINE INFORMATION
The followings provide an elaborated explanations of the heat and material balance calculation provided in the spreadsheet.
ANNEX 3-1, Total energy demand by the captive user(s)
1. 74.7TPH of Low Pressure Steam (3bar, 143degC). The steam specific enthalpy at this condition is 2,750MJ/tonnes. The
energy equivalent is calculated as follow:
74.7𝑡
ℎ𝑟∗ 6,900
ℎ𝑟
𝑦𝑟∗ 2,750
𝑀𝐽
𝑡∗
𝑇𝐽
106𝑀𝐽~1,418
𝑇𝐽
𝑦𝑟
2. 15TPH of Medium Pressure Steam withdrawn directly from boiler output with condition of 15bar, 210degC. The specific
enthalpy at this condition is 2,821MJ/tonnes.
15𝑡
ℎ𝑟∗ 6,900
ℎ𝑟
𝑦𝑟∗ 2,821
𝑀𝐽
𝑡∗
𝑇𝐽
106𝑀𝐽~292
𝑇𝐽
𝑦𝑟
3. 7,964kW of electricity
7,964𝑘𝐽
𝑠∗ 3,600
𝑠
ℎ𝑟∗ 6,900
ℎ𝑟
𝑦𝑟∗
𝑇𝐽
109𝑘𝐽~198
𝑇𝐽
𝑦𝑟
Total steam requirement (demand) by captive user:
1,418𝑇𝐽
𝑦𝑟+ 292
𝑇𝐽
𝑦𝑟= 1,710
𝑇𝐽
𝑦𝑟
ANNEX 3-2 – Project Energy Supply Requirement
In the project situation, energy is consumed at the boiler for heating feedwater from 100degC to300degC at 3,000kPa.In order to
obtain the theoretical amount of fuel required, mass and energy balance is performed around the boiler.
For conservative approximation, it is assumed that feedwater enters the project plant already at elevated temperature of 100degC.
In practice, significant amount of water is unrecovered during usage and thus make-up water must be added. The make-up water
temperature must be raised from ambient temperature to 100degC.
Feed water enthalpy For conservative approximation, it is assumed that feedwater enters the project plant already at
elevated temperature of 100degC and elevated pressure of 3,100kPa(g), slightly higher than the boiler operating pressure.
In practice, significant amount of water is unrecovered during usage and thus make-up water must be added. For suitable
boiler feeding, the make-up water temperature must be raised from ambient temperature to 100degC. The specific
enthalpy of water at 100degC and 3,100kPa(g) is 421MJ/t. For 3 boilers and operating hours of 6,900hrs per year, the
annual enthalpy of feedwater is:
= 120𝑡
ℎ𝑟∗ 421
𝑀𝐽
𝑡∗ 6,900
ℎ𝑟
𝑦𝑟∗
𝑇𝐽
106𝑀𝐽~348.9
𝑇𝐽
𝑦𝑟
Steam outlet enthalpy The biomass boiler process 120t/hr of water into superheated steam at 3,000kPa(g) or 31bar(a) at
300degC. The specific enthalpy of water at this condition is 2,991MJ/t. The total enthalpy of the product is thus:
= 120𝑡
ℎ𝑟∗ 6,900
ℎ𝑟
𝑦𝑟∗ 2,991
𝑀𝐽
𝑡∗
𝑇𝐽
106𝑀𝐽~2,477
𝑇𝐽
𝑦𝑟
Boiler fuel requirement The boilers heats feedwater with total enthalpy of 348.9TJ/yr to 2,477TJ/yr, thus the amount of energy
transferred to the water is equivalent to the quantity of heat generated from firing biomass fuel (𝑄𝑝𝑟𝑜𝑗𝑒𝑐𝑡 𝑝𝑙𝑎𝑛𝑡 ,𝑦) and calculated as
the difference betwen these enthalpy values or 2,128TJ/yr.
According to its manufacturer specification, the boiler can achieved maximum efficiency of 78% with its efficiency descreases
with the use of EFB. For conservativeness, this efficiency is adopted as project boiler efficiency, and the required energy is
calculated as follow:

PROJECT DESIGN DOCUMENT FORM (CDM PDD) - Version 03.1.
CDM Executive Board
Page 51
= 2,477𝑇𝐽
𝑦𝑟− 348.9
𝑇𝐽
𝑦𝑟 ÷ 78%~2,728 𝑇𝐽/𝑦𝑟
ANNEX 3-3 – PAA On-site Biomass Production
The palm oil mill at PAA has the capacity to process 60TPH of fruit fresh bunch (FFB). Based on material balance established by
PHG, the residual output from palm oil mill is linearly proportional to the FFB processed (x). The hourly annual output of
biomass fuel in terms of mass is shown in Table 15 and its net calorific value and energy equivalent in shown in Table 16.
Table 15 - Annual Biomass Production at PAA
Biomass Material Balance Correlation Hourly Production in TPH Annual production based on mill operation
hour of 6,900 tonnes per year
Fibre (K1) 0.1223x + 0.0083 6.7 46,230
Shell (K2) 0.102x -1.53 4.5 31,050
EFB (K5) Untreated 0.225x+0.0017 13.5 93,150
Treated** 0.1573x+0.01 9.4 64,860
Total annual untreated biomass production (t-biomass/yr) 170,430
Total annual treated biomass (t-biomass/yr) 142,140
**equivalent to 33% moisture adjustment
Table 16 - Energy from on-site generated biomass
Biomass Calorific Value Annual Amount Energy Contribution
(kcal/kg) (MJ/t) (t/yr) (TJ/yr)
Fibre (K1) 2,213 9,257 46,260 428
Shell (K2) 3,756 15,715 31,050 488
Treated EFB (K5) 2,024 8,468 64,860 549
Total energy from dry biomass (Fibre & Shell) 916
Total energy derived from on-site generated biomass 1,465
Annex 3-4 – PAA Projected Biomass Consumption
As elaborated in Annex 3-6, in addition to the on-site fibre and shell, the project alternative imports 49TJ/yr of shell to meet its
steam demand or equivalent to 3,126t of shell. As shown in Table 16, the on-site biomasses (shell, fibre, and EFB) contributes
1,465TJ/yr of energy.
However, the Project requires 2,728TJ/yr of energy (see Annex 3-2). Thus, there is a shortfall of 1,214TJ/yr of energy, which
must be met by importing more shell. With calorific value of 15,715MJ/t, this equivalent to additional 77,229t per year of shell
import.
The amount of biomass fuel used in the Project boiler is summarized in the following table.
Table 17 – Biomass Consumption for the Project
Biomass Type Energy Equivalent Mass Equivalent Fuel Mix
According to dispatch order TJ/yr TPY (% Energy) (% Mass)
Onsite
Generation
Fibre, K1 428 46,230 16% 24%
EFB, K5 549 64,860 20% 34%
Shell, K2, Produced on-site 488 31,050
64% 50% Estimated
Shell Imports
Shell, K3, Imported in Baseline (see Annex 3-6) 49 3,126
Shell, K4, Additional Import 1,214 77,229
Total Fuel Requirement = Total Fuel to Project Boiler (TJ/yr) 2,728 222,496

PROJECT DESIGN DOCUMENT FORM (CDM PDD) - Version 03.1.
CDM Executive Board
Page 52
Annex 3-5 – Energy derived from dry biomass in the Project & Baseline situation
The amount of dry biomass that are used in the Project and baseline situation is shown in Table 18 below.
Table 18 - Dry Biomass Used in the Project
Biomass Annual amount (t/yr) Calorific Value (MJ/t) Energy (TJ/yr)
Fibre, K1 46,230 9,257 427.9
Shell, K2 31,050 15,715 487.9
Imported Shell, K3 3,126 15,715 49
Total energy derived from combustion of dry biomass in the Project 965
Annex 3-6 – Estimated amount of shell imported in the baseline situation
As steam is the biggest form of energy required in PAA (1,715TJ/yr), its provision is of prominent importance compared to
electricity (209TJ/yr). In the baseline situation, PAA can meet its 1,715TJ/yr of steam requirement by installing two types of
boiler:
(a) A biomass boiler to generate the low pressure steam requirement of the upstream facility (42TPH);
(b) Residue-oil fired boilers to generate the remaining low pressure (32.7TPH) and medium pressure steam (15TPH) for the
downstream processing facilities;
Low pressure biomass boiler generates 42TPH of low pressure steam required from burning fibre (K1), shell generated the on-
site mill (K2) and imported shell (K3). The amount of imported biomass K3 is calculated using the following balances.
Without electricity generation, this biomass boiler heats up 75t/hr of feedwater with specific enthalpy of 419MJ/t
(100degC,450bar(a)) to 2,750MJ/t(143degC,350bar(a)). With assumption that the baseline boiler has efficiency of 70%, the
amount of energy required for this purpose is calculated as follow:
= 42𝑡
ℎ𝑟× 6,900
ℎ𝑟
𝑦𝑟× 2,750
𝑀𝐽
𝑡− 419
𝑀𝐽
𝑡 ×
𝑇𝐽
106𝑀𝐽÷ 70% ~ 965
𝑇𝐽
𝑦𝑟
As shown in Annex 3-3, fibre and shell generated by PAA contributes 428TJ/yr and 488TJ/yr respectively or totalled to 915.9
TJ/yr. Thus, the remaining shortfall of 49TJ/yr must be met by importing shell (K3). With calorific factor of 15,715MJ/t, the
amount of shell that must be imported is calculated as follow:
= (965 − 915.9)𝑇𝐽
𝑦𝑟 ×
106𝑀𝐽
𝑇𝐽÷ 15,715
𝑀𝐽
𝑡~ 49
𝑡
𝑦𝑟
Annex 4
MONITORING INFORMATION
Please refer to Section B.7.1
- - - - -