Embed Size (px)
Citation preview

SOCIAL MARKETING DIMENSIONS AND CUSTOMER PATRONAGE OF BEER BRANDS IN ENUGU NORTH LOCAL GOVERNMENT AREA
BY
OKOLI CHIOMA JENNIFER
U14/MSS/MKT/007
DEPARTMENT OF BUSINESS MANAGEMENT
(MARKETING PROGRAMME)
FACULTY OF MANAGEMENT AND SOCIAL SCIENCES
GODFREY OKOYE UNIVERSITY, UGWUOMU NIKE ENUGU STATE, NIGERIA
JULY, 2018

TITLE PAGE
SOCIAL MARKETING DIMENSIONS AND CUSTOMER PATRONAGE
OF BEER BRANDS IN
ENUGU NORTH LOCAL GOVERNMENT
BY
OKOLI CHIOMA JENNIFER
U14/MSS/MKT/007
A PROJECT REPORT SUMBITTED TO THE
DEPARTMENT OF BUSINESS MANAGEMENT
FACULTY OF MANAGEMENT AND SOCIAL SCIENCES
GODFREY OKOYE UNIVERSITY, UGWUOMU-NIKE, ENUGU
PROJECT SUBMITTED IN PARTIAL FULFILMENT FOR THE AWARD OF BACHELOR OF SCIENCE (B.SC.) DEGREE IN MARKETING
SUPERVISOR: ASSOC. PROF. CHINEDU OGBUJI
JULY, 2018
i

CERTIFICATION
I, Okoli Chioma Jennifer, an undergraduate student of Department of Business Management,
(Marketing programme) of the Faculty of Management and Social Sciences, Godfrey Okoye
University, Enugu, with the registration number U14/MSS/MKT/007 do hereby certify that the
work embodied in this project is original and has not been submitted in part or in full for any
other diploma or degree of this or any other university.
-----------------------------------
Okoli Chioma Jennifer
U14/MSS/MKT/007
ii

APPROVAL PAGE
This is to certify that this research was approved by the Department of Business Management, Godfrey Okoye University, Ugwuomu-Nike, Enugu.
----------------------------------------- ------------------
Assoc. Prof. Chinedu Ogbuji
(Project Supervisor) Date
----------------------------------------- ------------------
Assoc. Prof. Nick N. Igwe
(Head of Department) Date
----------------------------------------- -----------------
Prof. Onyema Ocheoha Date
(Dean, FMSS)
----------------------------------------- -----------------
External Examiner Date
iii

DEDICATION
I dedicate this study to Almighty God.
iv

ACKNOWLEDGEMENTS
I express my profound gratitude to those who helped in successful completion of this study.
First and foremost, my appreciation goes to God Almighty, who in His infinite mercies sustained me throughout the duration of this study.
A very big thank you goes to my Head of Department, Assoc. prof. Nick N. Igwe who handled all matters concerning me with proper care.
I appreciate the tireless effort of my supervisor, Assoc. prof. Chinedu Ogbuji for his continuous support, guidance and thorough inspection that brought this work to its completion.
I also wish to thank all the lecturers in the Department of Business Management, Dr. Idoko Edwin, Dr. C. C Mbah, Prof. F. C. Eze, Dr. Ifeanyi Okoli, Barrister Nick Obodo and Mr. Miracle Okechukwu. Thank you all for teaching me well and support.
To Rev. Fr. Benjamin Eze, may God continue to strengthen and protect you. To Mrs. Chioma Ozokonwko, Mrs. Oluchukwu Nna and Uche Nna; All your assistance really helped me a lot. Thank you.
To my beloved father, Late Mr. Juluis Okoli, your prayers helped me a lot. To my amiable mother, Mrs. Mariatha Okoli, and my uncle Mr. Ifeanyi Okoli. May God reward you for your tireless support; To my lovely husband, Mr. Onyeka Henry, thank you for all your words of encouragement.
I cannot forget the efforts of Mrs Ijeoma Ani, Chijioke, Chisom, Chibueze and Chima. You offered prayers, love and support when I need them. I love you all. To my nephews, Ugochukwu and Kenechukwu, you are wonderful. To my nieces Kamsiyochukwu and Mmasinachi, you girls are the best.
I also appreciate the care and support of my amazing colleagues and friends Gloria, Ifeoma, Ijeoma, Chinaza ,Chinasa and Cynthia. I thank my roommates for supporting me.
v

TABLE OF CONTENT
Title Page i
Certification ii
Approval page iii
Dedication iv
Acknowledgement v
Table of contents vi
Abstract ix
CHAPTER ONE: INTRODUCTION
1.1 Background of the Study 1 1.2 Statement of the problem 3 1.3 Objectives of the Study 3 1.4 Research Questions 4 1.5 Research Hypotheses 4 1.6 Significance of the Study 5 1.7 Scope of the Study 6 1.8 Limitations of the Study 6 1.9 Definition of Terms 6
CHAPTER TWO: REVIEW OF LITERATURE
2.0 Introduction 8
2.1 Conceptual Literature 8
2.1.1 Customer Patronage 8
2.1.2 Environmental Friendliness 9
2.1.3 Ethical Disposition 9
2.1.4 Green Disposition 9
2.1.5 Relationship Marketing 10
2.2 The concept of Social Marketing 10 2.2.1 Issues Specific to Social Marketing 14
vi

2.2.2 Process of Social Marketing 16
2.3 Theoretical Literature 19
2.3.1 Theory of Reasoned Action (ATR) 19
2.3.2 Social Cognitive Theory (SCT) 20
2.4 Empirical Literature 20
2.4.1 Gap in Literature 20
CHAPTER THREE: RESEARCH DESIGN AND METHODOLOGY
3.0 Introduction 25
3.1 Research Design 25
3.2 Sources of Data 25
3.2.1 Primary Source of Data 25
3.3 Population of the Study 25
3.4 Sample Size Determination 26
3.5 Sampling Technique 27
3.6 Administration of Research Instrument 27
3.7 Validity of the Research Instrument 27
3.8 Reliability of the Study 27
3.9 Method of Data Analysis 28
CHAPTER FOUR: PRESENTATION AND ANALYSIS OF DATA
4.0 Introduction 29
4.1 Presentation of Data 29
4.2 Analysis of Data 29
4.3 Discussion of Findings 49
vii

CHAPTER FIVE: SUMMARY OF FINDINGS, CONCLUSION AND RECOMMENDATIONS
5.1 Introduction 50
5.2 Summary of Findings 50
5.3 Suggested Areas for further research 51
References 52
Appendix 58
viii

ABSTRACT
This research work aims was on Social Marketing Dimensions and Customer patronage of beer brands in Enugu North Local Government Area L.G.A. Four research questions and four hypotheses were formulated. The research adopted two theories that guided the study, the Theory of Reasoned Action and Social Cognitive Theory. The research adopted a survey method which made use of questionnaire. The population of the study comprised of beer drinkers aged 18 years and above in Enugu North local government area of Enugu state which is made up of 326,900 people. To derive the sample size, the Taro Yamane formula was used to determine the sample size of 400. However, during the course of questionnaire distribution and collection, 400 questionnaires were administered and 340 were returned. The test of hypotheses was conducted using multiple linear regression with the aid of SPSS Software Version 20. Findings from the analysis showed that there was a positive, significant relationship between social marketing dimensions and customer patronage of beer brands in Enugu North L.G.A. It was therefore the recommendation of this study that social marketing should explore customer’s behaviour, attitudes in order to identify and develop suitable campaigns to change their behaviour to desired levels.
ix

CHAPTER ONE
INTRODUCTION
1.1 Background of the Study
The concept of social marketing has gained widespread recognition in the field of marketing.
Social marketing can be seen as the design, implementation and control of programs calculated
to influence the acceptability of social ideas and involving considerations of product planning,
pricing, communications, distribution and marketing research (Kotler & Zaltman, (1971).
Social marketing began as a discipline in the 1970s, when Kotler & Zaltman (1970) argued that
the same marketing strategies that have been so successful in selling products and services to
consumers could also be used to promote socially beneficial ideas, attitudes, and behaviors.
Hence, social marketing is the adaptation of commercial marketing technologies to programs
designed to influence the voluntary behavior of target audiences to improve their personal
welfare and that of the society of which they are part of (Brenkert, 2002). The use of such
marketing techniques has been expanding in our society. For example, most persons are familiar
with campaigns to “market” political candidates and their platforms, energy conversation and
abstain from smoking. Many of these efforts encompassing various aspects of marketing go
beyond simple advertising. For instance, some “stop smoking” organizations sponsor
informational seminars, distribute special products designed to alleviate the desire to smoke in
those who want to quit smoking, and initiate publicity aimed at the general public regarding the
disadvantages of smoking. There is substantial pressure within the discipline of marketing and
among the general public to expand the application of modern marketing’s tools and theories in
the dissemination of social ideas (Lazer & Kelly, 1973). However like any new social
development, this trend may have positive and negative societal effects.
1

On the positive dimension, there are sufficient literature which illustrate how marketing thinking
has improved the sale ability of useful social programs (Kotler, 1975). However, on the negative
side, it is quite possible that the widespread involvement of marketing professionals in the
marketing of social ideas may raise severe ethical problems and further turn public opinion
against marketers and the marketing field (Smith, 2001).
In the private sector, marketers seek to influence voluntary consumer spending and choice.
Marketers attempt to influence behaviour through behavioural shaping or reinforcement
strategies although consumers may decide not to buy. Thus, a marketer's basic talents lie in
influencing voluntary behavior, and the talents are incorporated in social marketing (Gene,
1999).
Social marketing is becoming increasingly relevant to the developing world. Success of social
programmes has significantly contributed to the process of development in the countries of the
third World. The success has been attributed to the adoption of marketing approach to the
social/development programmes. For promoting any social idea or issue it is not enough to
prepare the communication programme. Social marketing involves the marketing mix and
dimensions, not simply advertising (Hastings and Angus, 2011). Like commercial marketing,
social marketing involves its own marketing dimensions or mix:
According to Peattie et al (2009), social marketing dimensions include: social proposition,
accessibility, social costs of involvement and social communication. Based on the foregoing, the
primary essence and aim of this study is to carry out an empirical analysis of social marketing
dimensions and customer patronage of beer brands in Enugu North, L.G.A.
2

1.2 Statement of the Problem
Social marketing applications have become a method often used to positively influence social
issues all over the world. The moral dimension of social marketing, being parallel to this, has
gained importance. The goal of social marketing is to direct the behaviors that have been
identified of individuals and groups to “the better” in terms of society. Social marketing is an
endeavour that can be engaged in by profit making organization (e.g a liquor company program
encouraging responsible drinking), as well as by nonprofit and public organizations. It is used to
influence an audience to change their behaviour for the sake of improving health or themselves,
preventing injuries, protecting the environment or contributing to the community.
The lack of social marketing programmes that will address the issue of environmental unfriendly
activities by organizations is a serious threat to healthy environment. Organizations engage
themselves in things like air or water pollution, waste dumping and unsafe beer bottles. Also,
people who tend to drink without ethical dispositions that they have to be responsible for their
actions after drinking would be advised against the dangers of irresponsible drinking and driving.
More also, a lot of people do not know that they can build and maintain relationships with beer
brand organizations and win amazing gifts as loyal customers of such organizations beer brand.
On the basis of the foregoing, this study is basically motivated to carry out an empirical analysis
of social marketing dimensions and customer patronage of beer brands in Enugu North, L.G.A.
1.3 Objectives of the Study
The general objective of this study is to carry out an empirical analysis of social marketing
dimensions and customer patronage of beer brands in Enugu North, L.G.A. In line with this, the
specific objectives of the study are:
3

1. To ascertain the effect of green disposition on customer patronage of beer brands in Enugu
North, L.G.A.
2. To ascertain the effect of relationship marketing on customer patronage of beer brands in
Enugu North, L.G.A.
3. To examine the effect of environmental friendliness on customer patronage of beer brands in
Enugu North, L.G.A.
4. To ascertain the effect of ethical disposition on customer patronage of beer brands in Enugu
North, L.G.A.
1.4 Research Questions
In the course of this study, the following research questions were addressed.
1. What is the relationship between green disposition and customer patronage of beer brands in
Enugu North, L.G.A?
2. What is the relationship between relationship marketing and customer patronage of beer
brands in Enugu North, L.G.A?
3. What is the relationship between environmental friendliness and customer patronage of beer
brands in Enugu North, L.G.A?
4. What is the relationship between ethical disposition and customer patronage of beer brands in
Enugu North, L.G.A?
1.5 Hypotheses of the Study
The hypotheses that guided this study are specified as follows:
Ho: Green disposition does not significantly affect the level of customer patronage of beer
brands in Enugu North, L.G.A.
4

Ho: Relationship marketing does not significantly affect the level of customer patronage of beer
brands in Enugu North, L.G.A.
Ho: Environmental friendliness does not significantly affect the level of customer patronage of
beer brands in Enugu North, L.G.A
Ho: Ethical disposition does not significantly affect the level of customer patronage of beer
brands in Enugu North, L.G.A.
1.6 Significance of the Study
The primary essence of this research is to carry out an empirical analysis of social marketing
dimensions and customer patronage of beer brands in Enugu North L.G.A. This study will be of
great importance to the students of marketing and other related departments given that it will
expand their experience on the concept of social marketing dimensions and related issues.
Furthermore, this research will be of great significance to the various marketing firms, private
establishments and agencies. In addition, this study will serve as a great source of enlightenment
to the general public on the concept of social marketing dimensions. The brewery industry will
find this study of so much importance and significance given that the study is focused on of
social marketing dimensions and customer patronage of beer brands. Subsequent researchers will
also find this study of great importance because the content of the research will serve as a guide
to their study. Finally, this study will be an addition to the existing body of knowledge. (or
existing literature)
5

1.7 Scope of the Study
The subject scope of this study is to carry out an empirical analysis of social marketing
dimensions and customer patronage of beer brands. This study will be carried out in Nigeria with
a particular focus in Enugu North, L.G.A.
1.8 Limitations of the study
1. Time constraint: The time given for the research work was not really enough since I had to
combine the project work with lectures and other school activities.
2. It was a challenging task to administer questionnaire to people who might be drunk.
1.9Operational Definition of Terms
In this section of the study, some of the technical terms will be defined specifically.
Beer: This is an alcoholic drink made from yeast- fermented malt flavoured hops.
Customer Patronage: This is the assistance rendered by customers with respect to a specific
brand by buying the company’s product often.
Environmental Friendliness: This is be referred to as the conscious effort that consumers put
on in ensuring that the environment is free from any harm.
Ethical Disposition: This is a framework dwelling upon morality of what is right or wrong.
Green Disposition: This is a process whereby the ecological environment is highly protected in
the course of marketing activities to keep the environment healthy and safe.
Relationship Marketing: This has to do with the long term relationship that marketers have
with their customers. It engenders customer loyalty to the brand in question.
6

Social Marketing: This is design, implementation and control of programs calculated to
influence the acceptability of social ideas and involving considerations of product planning,
pricing, communication, distribution and marketing research.
7

CHAPTER TWO
REVIEW OF RELATED LITERATURE
2.0Introduction
This chapter focused on the literature review of different collections of works that will assist in
achieving the aims of the study. It contains the conceptual literature review, Customer patronage,
Environmental friendliness, Ethical disposition, Green disposition and Relationship marketing.
The concept of social marketing, issues specific to social marketing, process of social marketing.
The theoretical literature reviewed two theories that guided the study and some of the related
studies carried out on the concept under study were reviewed in this section.
2.1 Conceptual Literature
2.1.1 Customer Patronage
According to the concise Oxford English Dictionary (2008), the word customer patronage means
a person or a thing that eats or uses something or a person who buys goods and services for
personal consumption or use. Accordingly, and in line with previous studies, Goddard et al.
views customer patronage as the means of a respondent’s rating for his or her firm’s sales
volume, volume of transactions, profit margin and customer retention level. Also, Levis (2000)
suggested that sales volume, customer retention and profit margin can be enhanced when
organizations deliberately improve their ambience to meet the needs of the target market
segments.
8

2.1.2 Environmental Friendliness
According to Zimmer, M.R, Stafford ,T.F & Stafford (1994) defines environmental friendliness
as environmental concerns, attitude, personal norms and injunctive norms that significantly
affect Environmentally Friendly Behavior (EFB). Rokka & Uusitalo (2008) concluded that
consumers who care about the environment are no longer just highly educated and possess a high
disposable income as previously thought.
2.1.3 Ethical Disposition
‘’Ethics deals, amongst other things with right and wrong, ought and ought not, good and evil’’
(Mahony, 2009). Buzzelli & Johnston (2001), stressed that ethical disposition constitutes the set
of a person’s beliefs and understandings which are evaluative in nature.
2.1.4 Green Disposition
A green consumer can be identified as one who avoids any product which may harm any living
organism (Eriksson, 2002). American marketing Association explained that green marketing is
the product marketing that is presumed to be environmentally friendly (Yazdanifard & Mercy,
2011).
John Burnett (2011) explained green products as follows:
1. Those products that are recyclable, environmental friendly and refillable.
2. Those products covering or recovered non toxic biochemical and safe for consumption.
3. Those products which do not damage or contaminate the environment.
4. Products that have economically friendly packaging. For example refillable and reusable
container.
9

5. Products that will not be first time experimentally tasted on animal.
In the context of this study, green disposition is referred to the process whereby the ecological
environment is protected to be healthy and safe.
2.1.5 Relationship Marketing
Zeithaml (2000) explained that relationship marketing increases customer satisfaction which
results in customer loyalty and boosts profitability. In retail market concept, relationship
marketing is creating, developing and maintaining relationship with customer (Payne et al, 1995)
Berry &Gresham (1980) asserted that in retail market context, the degree of personal interaction,
customer service is necessary to maintain relationship and also more sales necessary to enhance
relationship with customer.
2.2 The Concept of Social Marketing
Social marketing is defined as practices aimed at solving social issues by using marketing
techniques. Social marketing has experienced significant growth over the last 3 decades and it’s
application has spread into various areas of social and public life (Alves, 2010).
Social marketing is “a process that applies marketing principles and techniques to create,
communicate, and deliver value in order to influence behaviours that benefit society as well as
the target audience” (Kotler, Lee & Rothschild, 2006). “Social marketing is the systematic
application of marketing alongside other concepts and techniques to achieve specific behavioural
goals, for social or public good”, (National Social Marketing Centre, 2006).
10

Social marketing is the use of marketing principles and techniques to influence a target audience
to voluntarily accept, reject, modify, or abandon a behavior for the benefit of individuals, groups,
or society as a whole”, (Kotler, et al., 2002)
Social marketing is a consumer-centered, research driven approach to promote voluntary
behavior change in a priority population (Grier & Bryant, 2005).
Brennan, L., Voros, J.& Brady, E. (2011), asserted that social marketing is an interdisciplinary
practice which is not a theory in itself but rather draws from many bodies of knowledge to
understand how to impact on people’s behavior. Kotler & Lee (2008) consider social marketing,
as a model for behavior change, which applies traditional marketing principles to target audience
behaviors in order to benefit both society and the individual.
Also Corner & Randall (2011) maintained that social marketing is not a behaviour change
programme in and of itself, but a framework by which designing the behavior change programs
is possible. Social marketing is the design, implementation and control of programmes calculated
to influence the acceptability of social ideas and involving considerations of product planning,
pricing, communication, distribution, and marketing research. The societal marketing concept
holds that the organization’s task is to determine the needs, wants, and interests of a target
market and to deliver the desired satisfactions more effectively and efficiently than competitors
in a way that preserves or enhances the consumer’s and the society’s well-being (Kotler, 2000).
Therefore, marketers must endeavour to satisfy the needs and wants of their target markets in
ways that preserve and enhance the well-being of consumers and society as a whole.
Recognizing profit as a major business motive, the societal marketing concept advocates fairness
11

to consumers while maintaining good practices in terms of consequences for society. The
societal marketing concept introduces corporate social responsibility into marketing practices
(Piacentini, MacFadyen & Eadie 2000).
Social marketing is understood as the marketing strategies applied to ideas, causes and social
programmes (Kotler & Lee, 2008). The concept of exchange in Social Marketing from the public
health perspective is more complex than Commercial Marketing, because it involves intangible
products such as well-being and health, and the benefits are not immediate. Actually, the
complexity lies on social change, specifically the behaviour and value, because they are more
difficult to achieve. The cognitive changes and action are not difficult to be achieved. The
concept of exchange is not an easy task, but it is feasible, if the social marketers seek to know
through the social market, the yearnings of the target audience (Lefebvre, 2011). Social
marketers take time to learn what the target audience knows, believes and does. Every decision is
made related to audience's perspective. The programme is designed to fulfil the audience's needs
and desires.
Social Marketing uses Commercial Marketing strategies, with the purpose of influencing
voluntary behaviour change and also promotes an end goal of improving personal/ societal well-
being. Social Marketing orientation establishes practices for public managers to lead and keep a
healthier and sustainable relationship with their target audience (Roberto, 2009). The customer-
orientation provides a set of tools useful to the public sector arena, in order to: (i) assist
professionals in managing the public health resources to reach greatest results; (ii) undertake a
new platform of concept of exchange in the public arena; (iii) provide an innovative tool to get
performance in the relationship with citizen-consumers; and (iv) join the New Public
Management (NPM) perspective and Public Marketing, because they introduce the consumer-
12

oriented perspective to achieve convincing outcomes, developing governance mechanisms
(Tigañas et al, 2011).
In social marketing price is intangible that comes in form of making change in behavior. The
product is the benefit that comes in form of improved health or reduction in disease. The loci of
benefit of social marketing are individuals who need to change their behavior for the wellbeing
and welfare of self and the society (Storey, et al. 2008)
According to Glouberman & Zimmerman (2002), our social marketing programmes must be
targeted. To them, managing a complex adaptive socio-economic system is like raising a child.
Raising a child is in our hand, his/her success in life is out of our control. Every child is unique:
In the same way, every community is unique. In all situations, uncertainty of outcome remains.
Therefore, it is essential to understand the individual, group, or the community and their identity
to know the social problems and suggest a solution using social marketing approach.
Social marketing in public health include programmes such as increase in physical activity,
increase in fruit and vegetable consumption, smoking cessation, and sexually transmitted disease
prevention etc. For success of social marketing, several commercial marketing strategies may be
applied. These may be social exchange theory, audience segmentation, the four Ps (price, place,
product, and promotion), consumer orientation, and evaluation of the marketing campaign (Grier
& Bryant, 2005)
McDermott et al, (2003) stressed that communicators should define the target audience so as to
suggest appropriate channels for communication. World Health Organization (2002) has
observed that specific needs of a target audience are met by selecting specific media preferred by
that audience. Acceptance of message by an individual depends upon the source of information.
13

Hence, audience should be reached through trusted channels of communication (freimuth et al.,
2000).
2.1.2 Issues Specific to Social Marketing
Defining a social issue: What is a social issue and what can be handled as a social issue are
topics of debate. Many different theories exist within the discipline of sociology that attempt to
define social issues. Functionalist theory, conflict theory, and structuralist theory are just a few
of them. How social marketers define social problems in this sense is important not only in terms
of what they see as a social problem but also in determining how social problems should be
solved.
What is good for society: The goal of social marketing is to enhance behaviours that are good
for individuals, groups, and the society at large. to “the better” in terms of society. On this point,
what is good for society comes across as an important question. Can marketers who show great
success in the commercial arena be the most appropriate for designating what is good and be best
suited to directing the target mass to this? For example, Donovan & Henley (2003), argued that
social marketers with a strong commercial background usually have a teleological approach in
terms of morals, advocate that individuals from the health sector will have a more deontological
approach.
The implementer’s identity: Social marketing processes should have program that comprises a
technology solution interwoven with relevant business processes, to manage the identity of users
and their access to systems and application in the organization. Aspects such as biometrics, add
to implementation challenges.
Intervention and control: One of the issues social marketing is criticized for is that it can be
used as a means of intervention or control against society by the state or other institutions.
14
People are then being controlled in the course of trying to solve the issues related to social
marketing for the good of the society.
Identifying the target group: Social marketers have difficulty identifying the target audience.
For example, In social issues that are perceived and responded negatively by society, by
unconsciously or consciously the individual can deny of being part of the problem and can
perceive being judged this way as a violation of rights. The criteria that selected target groups are
determined according to desired behavior which also opens the way to debate. For example, by
taking the limited resources into account, health-centered social marketing practices can choose
individuals or groups who are easy to reach as the target, but the masses who live in hard-to-
reach areas may have greater need of this practice and its services (French et al, 2010).
Unintentionally affected groups: Social marketing applications target people and groups
associated with the social issue in the direction of how the social issue is handled. However,
many of the advertisements presented in written and visual media in the process of social
marketing are seen and analyzed by every segment of society. As a result, some individuals or
groups who are not in the potential target audience, who are not addressed by the organized
program, can interpret the social message in different ways and produce undesired results.
Segmentation: The issue of social marketing has sensitive topics: It includes certain individuals
or groups in specific compartments. The segmentations that are made involve stimatizing certain
groups and/or dragging them into a disadvantaged and socially excluded position relative to
other groups.
Unintended results: In terms of social marketing results, one point that needs paying attention
to is the emergence of undesired results. The behavioral change desired in a social marketing
practice, together with the result of negative effects from the methods used while affecting this
15

change or in the application process, may result in some undesired consequences. Nicotine, one
of the most harmful substances contained in cigarettes, is known to be an appetite suppressant.
Therefore, people who quit smoking can experience health issues related to excessive weight
gain through excessive and irregular eating (French, C., Stevenes, C.B., Mcvey,D & Merrit,R.
2010).
2.1.3 Process of Social Marketing
The planning of social marketing programme involves six major steps. These are: (a) problem
definition, (b) goal setting, (c) target market segmentation, (d) consumer analysis, (e) marketing
strategy and tactics, and (f) implementation and evaluation.
(a) Problem Definition: The very first step in developing any social marketing programme is to
define the problem. We are aware that the use of drugs is dangerous. Perhaps, drug addicts want
to give it up but they cannot. In this case, one can define the problem as “how to help drug
addicts stop taking drugs” rather than convincing them that drug addiction is bad for their health.
Social marketing, therefore, must address the right problem in order to be effective and
successful.
(b) Goal Setting: The second step in developing a social marketing programme is to set goals.
These goals will help in developing plans of action within the available budgets and also in
evaluating success of the programme.
(c) Market Segmentation: For better performance and results it is desirable that the
heterogeneous market may be divided into homogeneous market segments keeping in view
various demographical, psychographical and geographical factors. First, the segmentation would
help in selecting specific segments as the focus to channel the marketing efforts. It would also
help in studying the behaviour of each segment in order to develop suitable marketing strategies.
16

(d) Customer Analysis: There is a much greater need in social marketing to explore customers’
behaviour and attitudes in order to identify and develop suitable campaigns. Therefore, it
becomes essential to carry out consumer research about wants, needs, perceptions, attitudes,
habits etc., to develop effective marketing strategies. The major problems, as compared to
commercial marketing, which a social marketer encounters as summarised by (Bloom &Novelli,
1981)” are: (i) they do not have good secondary data available about their consumers; (ii) they
have more difficulty in obtaining valid, reliable measures of salient variables in doing primary
data collection; (iii) they have more difficulty in sorting out the relative influence of identified
determinants of consumer behaviour; and (iv) they have more difficulty in getting consumer
research studies funded, approved, and completed in a timely fashion.
(e) Developing Marketing Strategies: A product is something having the ability to satisfy
customers’ needs and wants. The test for whether a thing is a product or not lies in its
exchangeability. This broader meaning of product permits inclusion of concepts that have been
referred to by various other appellations. Public goods are involved in those transactions where
the governmental agencies are the marketer and the public at larger are direct consumers because
they are affected by ‘consumption’ of these goods, which include flood control, energy
conservation programmes, etc. They are purchased in exchange for the price of taxation.
17

Figure I: Operational Framework Diagram Source:
Social
marketing
Dimensions
Source: Researchers conceptualization (2018)
18
Green Disposition
Relationship Marketing
Customer Patronage
Ethical Disposition
Environmental Friendliness

In the context of this study, customer patronage allocated as the dependent variable is determined
by selected independent variables of social marketing dimensions proxied by green disposition,
relationship marketing, environmental friendliness and ethical disposition.
2.2 Theoretical Framework
In this section of the study, some of the theories upon which this study is anchored on were
explored and reviewed.
2.2.1 Theory of Reasoned Action (TRA)
Theory of Reasoned Action (TRA) was prounded by Martin Fishein and Icek Ajen in 1967. It
organizes itself around the constructs of behavioral and normative beliefs, attitudes, intentions
and behavior. An extension of TRA, the Theory of Planned Behavior (TPB) adds the additional
construct of self-efficacy – one’s perceived control over performance of the behavior. In TRA,
the most important predictor of subsequent behavior is one’s intention to act. This behavioral
intention is influenced by one’s attitude towards engaging in the behavior and the subjective
norm one has about the behavior. Attitude, in turn, is determined by one’s beliefs about both the
outcomes and attributes associated with the behavior. Subjective norms are based on one’s
normative beliefs that reflect how significant referent people appraise the behavior – positively
or negatively. Referents may range from one’s family, to one’s physician, peers or models. The
TPB adds the additional construct of perceived behavioral control that is determined by one’s
“control beliefs” (the presence or absence of resources and impediments to engage in the
behavior) and “perceived power” – the weighting of each resource and barrier. Social marketers
often employ TRA and TPB, although it is most often implicit and incomplete. Subjective norms
and referents, for example, are often the focus of social marketing programs (such as teen
19

alcoholic use prevention) even though the theoretical model may not be familiar to the planners
(Ajzen & Fishbein, 1980).
2.2.2 Social Cognitive Theory
Social Cognitive Theory (SCT) was prounded by Edwin B. Holt in 1986. It explains behavior in
terms of triadic reciprocality (“reciprocal determinism”) in which behavior, cognitive and other
interpersonal factors, and environmental events all operate as interacting determinants of each
other. In contrast to the previous theoretical models, SCT explicitly recognizes that behavior is
not determined by just intrinsic factors, or that an individual is a product of their environment,
but that he/she has an influence on what they do, their personal characteristics, how they respond
to their environment, and indeed, what their environment is. Changes in any of these three
factors are hypothesized to render changes in the others. One of the key concepts in SCT is an
environmental variable: observational learning. In contrast to earlier behavioral theories, SCT
views the environment as not just one that reinforces or punishes behaviors, but it also provides a
milieu where one can watch the actions of others and learn the consequences of those behaviors
(Edwin B. Holt 1986).
2.3 Empirical Literature
Some of the related studies carried out on the concept under study were reviewed under
the empirical literature.
Ravi (2001) carried out a research on the effect of social marketing on sustainable development.
The paper is based on various aspects of social marketing. The community programmes in India
are eminent in terms of awareness but not in terms of action. The programmes run in India are
for the benefit of the society. These include programmes on family planning, immunization,
20

pollution-control and other civic issues. The community or social programmes will prove
themselves better in terms of performance if marketing is associated with it. Hence, the social
programmes will guarantee more benefits to the society if they are marketed and not simply run.
The three cases spotlighted in this paper illustrate the phenomenon of marketing for social causes
and hence makes marketing obligatory for benefiting the society, which is the sole objective of
these social marketing programmes.
Hossein et al (2013) carried out a research on the Impact Analysis of Social Marketing Mix on
the Intention of Replacing Single-Occupant Vehicles with Urban Public Transport with a case
study of Staff Working at State Universities of Isfahan. In this study, the principles of social
marketing and Theory of Planned Behavior (TPB) a conceptual model has been presented to
evaluate the impact analysis of social marketing mix on the intention of staff working at the State
Universities of Isfahan City in order to replace SOVs with UPT. Data were collected using a
closed ended questionnaire and the model was evaluated using Amos Graphic Software. The
results show that social marketing mix has a significant positive effect on behavioral beliefs and
normative beliefs, but a negative effect on the control beliefs of the staff. The effects of
behavioral beliefs on attitude, normative beliefs on subjective norms, and control beliefs on
perceived behavioral control are significant positive. Also, the effects of three variables: attitude,
subjective norm, and perceived behavioral control on the intention of the staff are significant
positive. Finally, a significant positive effect of social marketing mix on the intention of staff
was approved.
Edson & Jose (2015) carried out a research on social marketing for women's health campaigns.
This research aimed to identify the Social Marketing principles (and practices) in women’s
health programme in the ABC Region, located in the Greater São Paulo, Brazil. In
21
methodological terms, this research is exploratory through a single case study, the ABC region;
seven interviews were carried out with health managers of women's health programmes in the
three cities of the region. The qualitative methods were used to report the results. Thus, their
contributions are: Social Marketing theory is still unknown; health managers have few skills and
expertise in management; culture of social marketing requires implementation; social marketing
is a tool useful to public health; and social marketing works in health perspective.
Ibrahim & Omer (2016) empirically evaluated attitudes toward the different dimensions of social
marketing practices mainly over the moral dimension. It intends to detect whether or not these
attitudes differ according to certain variables. According to their research findings, participants
find social marketing useful for the community but are worried that moral issues could arise. For
this reason, they want social marketing to be more tightly controlled by the state. At the same
time, participants who found social marketing problematic from the moral perspective were seen
to have more negative attitudes toward the effectiveness of social marketing.
Nick (2015) carried out a research on the impact of social marketing on consumers in Kenya. A
multidisciplinary model, building on the technology acceptance model and relevant literature on
trust and social media, was devised. The model has been validated by SEM-PLS, demonstrating
the role of social media in the development of e-commerce into social commerce. The data
emerging from a survey show how social media facilitate the social interaction of consumers,
leading to increased trust and intention to buy. The results also show that trust has a significant
direct effect on intention to buy. The perceived usefulness (PU) of a site is also identified as a
contributory factor.
Henry (2011) used a critical social marketing framework to assess the cumulative impact of
alcohol marketing on youth drinking, with findings intended to help upstream social marketing
22

efforts, inform policy and regulation and targeted behaviour change interventions. The project
examined the impact of alcohol marketing across a comprehensive range of communications
channels including less well researched areas such as new media and sponsorship. The project
involved three discrete stages of research. First, a brand website and press audit of contemporary
alcohol marketing communications in the UK was conducted, supplemented by interviews with
key informants from the marketing profession and regulatory bodies. Second, qualitative focus
group research was conducted with young people to explore the role and meaning of alcohol in
their lives and their attitudes towards alcohol marketing. Third, a two wave cohort study design
featuring a questionnaire survey was conducted to assess the impact of alcohol marketing on
youth drinking. The survey consisted of a two part interviewer administered and self-completion
questionnaire in home with 920 second year school pupils at baseline, and follow up of a cohort
of 552 in fourth year. The audit revealed that alcohol marketing is ubiquitous in the UK with
most brands having a dedicated website featuring sophisticated content that appeals to youth
including music, sport and video games.
Sukru et al (2012) carried out an empirical study on ethical perceptions of social marketing
campaign on Turkish consumers. The study was to determine how consumers perceive social
marketing campaigns ethically and their perceptual differences by demographic features. The
study found that consumers mostly emphasize that social marketing campaigns are the intensive
advertisement areas for the companies which focus on increasing the sales and far from
marketing social thoughts. In addition, the consumers’ ethical perceptions show significant
differences in terms of education, income and gender. In the study, in order to increase the
effectiveness and strengthen the ethical constructions of the future campaigns, it is suggested that
target group’s/society’s demographic features and social expectations should be determined and
campaigns should be designed and implemented accordingly.
23

Ernest (2013) evaluated the impact of broadcast media campaigns/programmes on behavioural
change in the Ebonyi State of Nigeria. The study was based mainly on primary data collected
through structured interview and a scientifically developed questionnaire administered to a
randomly generated sample of 50 respondents. Exploratory factor analysis in the form of
principal component analysis, Cronbach alpha and correlation were respectively employed to
assess scale simplification and summarization, scale internal consistency and relationship among
variables. Result indicates that even as broadcast media campaigns and information is likely to
influence behavioural change of Ebonyians, this impact is not traceable to the broadcast media
campaigns/programmes of the EBOSACA. The results of this study show that with proper
message timing and frequency, broadcast media campaigns/programmes is likely to influence
people’s social life just as appropriate information can equally alter people’s behaviour or
attitude and managers and directors of social/behavioural change courses should be rethinking
their tactics in this regard.
2.4 Gap in Literature
The reviewed empirical studies reveals that relative avalanche of studies have been carried out
on the concept of social marketing. However, it was observed that most of the studies carried out
were impact analysis and no dimensional coverage. However, to widen the circumference of the
concept under study, this study embarked on a dimensional analysis of social marketing. This is
seen to be comprehensive compared to the existing and thus the gap in the study.
24

CHAPTER THREE
RESEARCH METHODOLOGY
3.0 Introduction
The focus of this chapter is to elucidate the total constructional plan of research and the process
of data collection that will assist in achieving the desired aims of the study. It contains research
design, study area, data sources, study population, determination of sample size, research
instruments description and validity of the research instruments, reliability of the research
instrument and method of data analysis.
3.1 Research Design
This research adopted the survey method. Survey method is a type of research design that
involves the researcher moving into the field and obtaining the needed information directly from
the respondents.
3.2 Sources of Data
The data required for this analysis was extracted from the primary source.
3.2.1 Primary Source of Data
The primary source of data consists of the original firsthand information which has not been used
in any previous study. The data was obtained through questionnaire. A questionnaire is a set of
questions designed for the purpose of gathering information from respondents.
3.3 Population of the Study
The population of this study comprises of beer drinkers aged18years and above in Enugu North
local government area of Enugu state. Based on the documented 2016 population projection
statistics, the population of Enugu North is made up of three hundred and twenty six thousand,
nine hundred (326,900).
25

3.4 Sample Size Determination
To derive the optimal sample size, Taro-Yammane (1967) formula was used. The formula is
specified as:
n= N1+N ( e )2
Where:
n = Sample Size
N = Population Size
1 = Fixed Numerical factor
e = margin of error usually 5%
To derive the optimal sample size, we have:
n=326 , 9001+326 , 900 (0. 05 )2
=326 ,9001+326 ,900(0 . 0025)
326,9001+ 817.25
326,900818.25
=399.5
26
=
=

Based on the above calculation, it is determined that 400 persons is the sample size of the study.
Enugu North is made up of seven areas: Iva Valley 22, Ogbete 65, Asata 54, Ogui 102,
Independent Layout 61, New Haven 47 and GRA 49 copies of questionnaire was shared.
3.5 Sampling Technique
The sampling technique adopted in this study is the purposive sampling technique. The
purposive sampling is a non-probability sample that entails that a researcher purposively selects
individuals as elements of a sample based on presumed relevance to the study as judged by the
researcher and the objective of the study. It was used because the researcher chose her
respondents based on her judgment about them meeting her purpose of study.
3.6 Administration of Research Instrument: The major instrument used by the researcher in
gathering data for this study is structured questionnaire. The questionnaire is grouped into have
two section. Section A involves some general and demographic information of the respondents;
Section B is designed to address the research questions. The instrument is designed in a 5-point
likert scale of strongly Agree (SA), Agree (A), Disagree (D), strongly Disagree (SD) and
Undecided.
3.7 Validity of the Research Instrument
To make sure that the research instruments in this study are valid, the researcher ensured that the
instrument measured the concepts it was supposed to measure. For convenience, respondents
were requested to tick their preferred choice from the options provided.
3.8 Reliability of the Study
A reliability test was conducted on the instrument to determine how consistent the responses are
The Cronbach Alpha reliability test was utilized to conduct the reliability test. A cronbach alpha
coefficient of 0.70 and above will be considered acceptable.
27

3.9 Method of Data Analysis
To test hypotheses of the study, the multiple linear regression will be employed and the
researcher made use of Statistical Package for Social Sciences (SPSS) version 20, software to
run the regression analysis. A multiple linear regression model attempts to explain the
relationship between two or more variables. Customer patronage will be the dependent variable
while the selected determinants will serve as the independent variables. The model specification
for this study is given as:
CP=β0+ β1 GD+β2 RM+β3 EF+ β4 ED+U
Where:
CP = Customer Patronage
GD = Green Disposition
RM = Relationship Marketing
EF = Environmental Friendliness
ED = Ethical Disposition
U = Stochastic Error Term
B’s = Parameters to be Estimated
Decision Rule
If the Probability Value is less than 0.05, we reject the Ho and accept the H1, but if the
Probability is greater than 0.05, we accept the Ho and reject the H1.
28

CHAPTER FOUR
PRESENTATION AND ANALYSIS OF DATA
4.0 Introduction
The researcher intended to present, analyzed and interpreted data gathered for this research in
this chapter.
4.1 Presentation of data
This section deals with the analysis of the responses of some beer drinkers aged 18years and
above of Enugu North local government area of Enugu state. Different people ranging from
workers from different sectors to students that made up our sample size. The researcher
administered 400 copies of the questionnaire of which 40 were not returned and 20 were badly
filled, which means that only 340 copies were found useful. Data collected were presented in the
tables which showed the comparison of various results.
4.2 Analysis of Data
The researcher made use of descriptive statistics to summarize the demographic information and
the research questions in this study while the hypotheses were tested using multiple regression
analysis.
Table 4.2.1
Gender Of the RespondentFrequency Percent Valid Percent Cumulative
Percent
Valid
Male 240 70.6 70.6 70.6
Female 100 29.4 29.4 100.0
Total 340 100.0 100.0
Source: Field survey 2018 [SPSS COMPUTATION]
29
Table 4.2 1. Showed the gender distribution of the respondents. From the result, it could be
ascertained that 240(70.6%) of the respondents were male, while 100 (29.4%) of the respondents
were female. Hence we concluded that majority of the respondents were male.
Table 4.2.2
Age Of the Respondent
Frequency Percent Valid Percent Cumulative
Percent
Valid
18-27years 60 17.6 17.6 17.6
28-37years 100 29.4 29.4 47.1
38-47years 81 23.8 23.8 70.9
48-57years 69 20.3 20.3 91.2
50years above 30 8.8 8.8 100.0
Total 340 100.0 100.0
Source: Field survey 2018 [SPSS COMPUTATION]
The table descriptive values showed that out of the age bracket, 60 (17.6%) of the respondents
are18 - 27years, 100 (29.4%) of the respondents are 28 – 37 years, 81 (23.8%) of the respondents
are 38 – 47 years, whereas 69 (20.3%) of the respondents are 48 – 57, 30 (8.8%) of the
respondents are 58 years above. It could be firmly ascertained that majority of the respondents
are 28 – 37 years.
30

Table 4.2.3
Marital Status Of the Respondent
Frequency Percent Valid Percent Cumulative Percent
Valid
Single 109 32.1 32.1 32.1Married 91 26.8 26.8 58.8Divorced 19 5.6 5.6 64.4Separated 24 7.1 7.1 71.5Widow 37 10.9 10.9 82.4Widower 60 17.6 17.6 100.0
Total 340 100.0 100.0
Source: Field survey 2018 [SPSS COMPUTATION]
The table which is descriptive table of values showed the Marital Status of the respondents, from
the result, it can be ascertained that single respondents were 109(32.1%), Married respondents
were 91(26.8%), divorced respondents were19(5.6%), separated respondents were 24(7.1%)
while widow respondent were 37(10.9%) and Widower respondents were 60(17.6%). Hence we
concluded that majority of the respondents were Single.
Table 4.2.4
Academic Qualification Of the Respondent
Frequency Percent Valid Percent Cumulative
Percent
Valid
SSCE 64 18.8 18.8 18.8
ND/NCE 106 31.2 31.2 50.0
HND/B.Sc./B.Ed./BA 130 38.2 38.2 88.2
M.Sc./MBA/MA 25 7.4 7.4 95.6
Ph.D. 15 4.4 4.4 100.0
Total 340 100.0 100.0
Source: Field survey 2018 [SPSS COMPUTATION]
31

The table above showed that 64(18.8%) respondents are SSCE holder 106(31.2%) respondents
are OND/NCE holder, 130(38.2%) respondents are HND/B.Sc. /BA/B.Ed. holder, and 25(7.4%)
respondents are M.Sc./MA/MBA holder while 25 (4.4%) respondents are Ph.D. holders. From
the result, majority of respondents are HND/B.Sc. /BA/B.Ed. holders.
Table 4.2.5
Choice Brand
Frequency Percent Valid Percent Cumulative
Percent
Valid
Heineken 22 6.5 6.5 6.5
Life 75 22.1 22.1 28.5
Hero 100 29.4 29.4 57.9
Gulder 43 12.6 12.6 70.6
Star 21 6.2 6.2 76.8
33 20 5.9 5.9 82.6
Harp 19 5.6 5.6 88.2
Star Raddler 26 7.6 7.6 95.9
Others 14 4.1 4.1 100.0
Total 340 100.0 100.0
Source: Field survey 2018 [SPSS COMPUTATION]
The table above described the responses of the respondents on the choice of brand. 22(6.5%)
went for Heineken, 75(22.1%) went for Life, 100(29.4%) went for Hero, 43(12.6%) went for
Gulder, 21(6.2%) went for Star, 20(5.9%) went for 33, 19(5.6%) went for Harp and 26(7.6%)
went for Star-Raddler while 14(4.1%) went for other brands. From the result of the table, we
concluded that majority went for Hero making it their choice of brand.
32

Table 4.2.6
Income Level
Frequency Percent Valid Percent Cumulative
Percent
Valid
N500 - N15000 47 13.8 13.8 13.8
N18000 - N27000 73 21.5 21.5 35.3
N36000 - N44000 69 20.3 20.3 55.6
N52000 - N60,000 81 23.8 23.8 79.4
N69000 - N77000 and above 70 20.6 20.6 100.0
Total 340 100.0 100.0
Source: Field survey 2018 [SPSS COMPUTATION]
This table was used to show the responses of the respondents on their income level. Respondents
earning N5000 - N 15,000 are 47(13.8%), respondents earning N 18,000 - N 27,000 are
73(21.5%), respondents earning N 36, 000 - N 44,000 are 69(20.3%) and respondents earning
N 52, 000 - N 60,000 are 81(23.8%) while respondents earning N 69, 000 - N 77, 000 and Above
are 70(20.6%). From the result, the majority of the respondents are earning N 52, 000 - N 60,000
Table 4.2.7
I buy beer alwaysFrequency Percent Valid Percent Cumulative
Percent
Valid
Strongly Disagree 70 20.6 20.6 20.6Disagree 90 26.5 26.5 47.1Undecided 60 17.6 17.6 64.7Agree 60 17.6 17.6 82.4Strongly Agree 60 17.6 17.6 100.0
Total 340 100.0 100.0
33
Source: Field survey 2018 [SPSS COMPUTATION]
The table above showed the result of the respondents 70 (20.6%) respondents strongly Disagree,
90(26.6%) of the respondents disagree, 60 (17.6%) of the respondents undecided while
60(17.6%) of the respondents agree, whereas 60 (17.6%) of the respondents strongly agree. From
the result, majority of the respondents disagree. Therefore, there is a strong indication that people
don’t buy beer always.
Table 4.2.8
I encourage friends to buy beer for me when i have no money
Frequency Percent Valid Percent Cumulative
Percent
Valid
Strongly Disagree 50 14.7 14.7 14.7
Disagree 61 17.9 17.9 32.6
Undecided 86 25.3 25.3 57.9
Agree 69 20.3 20.3 78.2
Strongly Agree 74 21.8 21.8 100.0
Total 340 100.0 100.0
Source: Field survey 2018 [SPSS COMPUTATION]
Table 4.2.8 which is descriptive table of values showed the responses of the respondents. It could
be ascertained that 50 (14.7%) affirmed strongly disagree, 61 (17.9%) of the respondents
affirmed disagree, 86 (25.3%) affirmed undecided 69(20.3%) of the respondents affirmed agree,
whereas 74 (21.8%) of the respondents affirmed strongly agree. From the result, majority of the
respondents affirmed undecided; hence we concluded that most people encouraged friends to buy
beer for them when they had no money.
34
Table 4.2.9
I buy beer more than other drink
Frequency Percent Valid Percent Cumulative Percent
Valid
Strongly Disagree 50 14.7 14.7 14.7Disagree 60 17.6 17.6 32.4Undecided 76 22.4 22.4 54.7Agree 84 24.7 24.7 79.4Strongly Agree 70 20.6 20.6 100.0
Total 340 100.0 100.0
Source: Field survey 2018 [SPSS COMPUTATION]
From the result of the table above, it could be ascertained that 50 (14.7%) respondents strongly
Disagree, 60(17.6%) of the respondents disagree, 76 (22.4%) of the respondents undecided while
84(24.7%)of the respondents agree, whereas 70 (20.6%) of the respondents strongly agree. From
the result, majority of the respondents agree. Hence we concluded that respondents buy beer
more than any other drink.
Table 4.2.10
I buy beer because of the company' s image is widely known
Frequency Percent Valid Percent Cumulative
Percent
Valid
Strongly Disagree 65 19.1 19.1 19.1
Disagree 73 21.5 21.5 40.6
Undecided 58 17.1 17.1 57.6
Agree 83 24.4 24.4 82.1
Strongly Agree 61 17.9 17.9 100.0
Total 340 100.0 100.0
35

Source: Field survey 2018 [SPSS COMPUTATION]
Table 4.2.10 which is descriptive table of values showed the responses of the respondents. It
could be ascertained that 65 (19.1%) affirmed strongly disagree, 73 (21.5%) of the respondents
affirmed disagree, 58 (17.1%) affirmed undecided 83(24.4%) of the respondents affirmed agree,
whereas 61 (17.9%) of the respondents affirmed strongly agree. From the result, majority of the
respondents affirmed agree; hence we concluded that people bought beer because of the
company’s image and is widely known.
Table 4.2.11
Beer drink should be natural
Frequency Percent Valid Percent Cumulative
Percent
Valid
Strongly Disagree 40 11.8 11.8 11.8
Disagree 51 15.0 15.0 26.8
Undecided 59 17.4 17.4 44.1
Agree 100 29.4 29.4 73.5
Strongly Agree 90 26.5 26.5 100.0
Total 340 100.0 100.0
Source: Field survey 2018 [SPSS COMPUTATION]
From the result of the table above, it can be ascertained that 40 (11.8%) respondents strongly
Disagree, 51(15.0%) of the respondents disagree, 59 (17.4%)of the respondents undecided while
100(29.4%)of the respondent agree, whereas 90 (25.5%) of the respondents strongly agree. From
the result, majority of the respondents agree. Hence we concluded that beer drink should be
natural.
36

Table 4.2.12
Beer drink packaging should not be harmful
Frequency Percent Valid Percent Cumulative
Percent
Valid
Strongly Disagree 60 17.6 17.6 17.6
Disagree 65 19.1 19.1 36.8
Undecided 55 16.2 16.2 52.9
Agree 87 25.6 25.6 78.5
Strongly Agree 73 21.5 21.5 100.0
Total 340 100.0 100.0
Source: Field survey 2018 [SPSS COMPUTATION]
Table 4.2.12 which is descriptive table of values showed the responses of the respondents. It can
be ascertained that 60 (17.6%) affirmed strongly disagree, 65 (19.1%) of the respondents
affirmed disagree, 55 (16.2%) affirmed undecided 87(25.6%) of the respondents affirmed agree,
whereas 73(21.5%) of the respondents affirmed strongly agree. From the result, majority of the
respondents affirmed agree; hence we concluded that beer packaging should not be harmful.
Table 4.2.13
37

Source: Field survey 2018 [SPSS COMPUTATION]
From the result of the table above, it can be ascertained that 40 (11.8%) respondents strongly
Disagree, 51(15.0%) of the respondents disagree, 59 (17.4%) of the respondents undecided while
89(26.2%) of the respondent agree, whereas 101 (29.7%) of the respondents strongly agree.
From the result, majority of the respondents strongly agree. Hence we concluded that beer
production should not affect the environment.
Table 4.2.14
Beer bars should be coolFrequency Percent Valid Percent Cumulative
Percent
Valid Strongly Disagree 70 20.6 20.6 20.6
Disagree 80 23.5 23.5 44.1
Undecided 24 7.1 7.1 51.2
Agree 90 26.5 26.5 77.6
Strongly Agree 76 22.4 22.4 100.0
38
Beer production should not affect the environment
Frequency Percent Valid Percent CumulativePercent
Valid
Strongly Disagree 40 11.8 11.8 11.8
Disagree 51 15.0 15.0 26.8
Undecided 59 17.4 17.4 44.1
Agree 89 26.2 26.2 70.3
Strongly Agree 101 29.7 29.7 100.0
Total 340 100.0 100.0

Total 340 100.0 100.0
Source: Field survey 2018 [SPSS COMPUTATION]
Table 4.2.14 which is descriptive table of values showed the responses of the respondents. It can
be ascertained that 70 (20.6%) affirmed strongly disagree, 80 (23.5%) of the respondents
affirmed disagree, 24 (7.1%) affirmed undecided 90(26.5%) of the respondents affirmed agree,
whereas 76(22.4%) of the respondents affirmed strongly agree. From the result, majority of the
respondents affirmed agree; hence we concluded that beer bars should be cool.
Table 4.2.15
I strongly believe that beer drink is the best
Frequency Percent Valid Percent Cumulative Percent
Valid
Strongly Disagree 60 17.6 17.6 17.6Disagree 64 18.8 18.8 36.5Undecided 96 28.2 28.2 64.7Agree 57 16.8 16.8 81.5Strongly Agree 63 18.5 18.5 100.0
Total 340 100.0 100.0
Source: Field survey 2018 [SPSS COMPUTATION]
The table above showed the result of the respondents 60 (17.6%) respondents strongly Disagree,
64(18.8%) of the respondents disagree, 96 (28.2%) of the respondents undecided while
57(16.8%) of the respondent agree, whereas 63 (18, 5%) of the respondents strongly agree. From
the result, majority of the respondents chose undecided. Therefore, there was a strong indication
that the statement above is undecided.
39

Table 4.2.16
I cannot stop buying beer drinks
Frequency Percent Valid Percent Cumulative
Percent
Valid
Strongly Disagree 70 20.6 20.6 20.6
Disagree 90 26.5 26.5 47.1
Undecided 50 14.7 14.7 61.8
Agree 67 19.7 19.7 81.5
Strongly Agree 63 18.5 18.5 100.0
Total 340 100.0 100.0
Source: Field survey 2018 [SPSS COMPUTATION]
From the result of the table above, it can be ascertained that 70 (20.6%) respondents strongly
Disagree, 90(26.5%) of the respondents disagree, 50 (14.7%) of the respondents undecided while
67(14.7%) of the respondent agree, whereas 63 (18.5%) of the respondents strongly agree. From
the result, majority of the respondents disagree. Hence we concluded that people cannot stop
buying beer drinks.
Table 4.2.17
I have strong attachment to beer drink
Frequency Percent Valid Percent Cumulative
Percent
Valid Strongly Disagree 36 10.6 10.6 10.6
Disagree 44 12.9 12.9 23.5
Undecided 67 19.7 19.7 43.2
Agree 102 30.0 30.0 73.2
40
Strongly Agree 91 26.8 26.8 100.0
Total 340 100.0 100.0
Source: Field survey 2018 [SPSS COMPUTATION]
Table 4.2.17 which is descriptive table of values showed the responses of the respondents. It can
be ascertained that 36 (10.6%) affirmed strongly disagree, 44 (12.9%) of the respondents
affirmed disagree, 67 (19.7%) affirmed undecided 102 (30.0%) of the respondents affirmed
agree, whereas 91 (26.8%) of the respondents affirmed strongly agree. From the result, majority
of the respondents affirmed agree; hence we concluded that there is strong attachment to beer
drink.
Table 4.2.18
Beer firms fulfill their promises
Frequency Percent Valid Percent Cumulative Percent
Valid
Strongly Disagree 50 14.7 14.7 14.7Disagree 60 17.6 17.6 32.4Undecided 76 22.4 22.4 54.7Agree 94 27.6 27.6 82.4Strongly Agree 60 17.6 17.6 100.0
Total 340 100.0 100.0
Source: Field survey 2018 [SPSS COMPUTATION]
Table 4.2.18 which is descriptive table of values showed the responses of the respondents. It can
be ascertained that 50 (14.7%) affirmed strongly disagree, 60 (17.6%) of the respondents
affirmed disagree, 76(22.4%) affirmed undecided 94 (27.6%) of the respondents affirmed agree,
41

whereas 60(17.6%) of the respondents affirmed strongly agree. From the result, majority of the
respondents affirmed agree; hence we concluded that beer firms fulfill their promise.
Table 4.2.19
I read labels of the beer i take
Frequency Percent Valid Percent Cumulative Percent
Valid
Strongly Disagree 30 8.8 8.8 8.8Disagree 40 11.8 11.8 20.6Undecided 50 14.7 14.7 35.3Agree 120 35.3 35.3 70.6Strongly Agree 100 29.4 29.4 100.0
Total 340 100.0 100.0
Source: Field survey 2018 [SPSS COMPUTATION]The table above showed the result of the respondents 30 (8.8%) respondents strongly Disagree,
40(11.8%) of the respondents disagree, 50 (14.7%) of the respondents undecided while
120(35.3%) of the respondent agree, whereas 100 (29.4%) of the respondents strongly agree.
From the result, majority of the respondents agree. Therefore, there is a strong indication that
people read labels of the beer they take.
Table 4.2.20
I buy canned beers to save the environment from broken bottle
Frequency Percent Valid Percent Cumulative
Percent
Valid Strongly Disagree 40 11.8 11.8 11.8
Disagree 50 14.7 14.7 26.5
Undecided 50 14.7 14.7 41.2
Agree 116 34.1 34.1 75.3
Strongly Agree 84 24.7 24.7 100.0
42

Total 340 100.0 100.0
Source: Field survey 2018 [SPSS COMPUTATION]
Table 4.2.20 which is descriptive table of values showed the responses of the respondents. It can
be ascertained that 40 (11.8%) affirmed strongly disagree, 50 (14.7%) of the respondents
affirmed disagree, 50 (14.7%) affirmed undecided 116(34.1%) of the respondents affirmed
agree, whereas 84(24. 7%) of the respondents affirmed strongly agree. From the result, majority
of the respondents affirmed agree; hence we concluded that they buy canned beer to save the
environment from broken bottle.
Table 4.2.21
I dispose off my beer Container after my drink
Frequency Percent Valid Percent Cumulative
Percent
Valid
Strongly Disagree 37 10.9 10.9 10.9
Disagree 42 12.4 12.4 23.2
Undecided 54 15.9 15.9 39.1
Agree 108 31.8 31.8 70.9
Strongly Agree 99 29.1 29.1 100.0
Total 340 100.0 100.0
43

Source: Field survey 2018 [SPSS COMPUTATION]
The table above showed the result of the respondents 37 (10.9%) respondents strongly Disagree,
42(12.4%) of the respondents disagree, 54(15.9%) of the respondents undecided while
108(31.8%) of the respondent agree, whereas 99 (29.1%) of the respondents strongly agree.
From the result, majority of the respondents agree. Therefore, there is a strong indication that
people disposed off beer container after drinking.
Table 4.2.22
I advise others to drink responsibly
Frequency Percent Valid Percent Cumulative
Percent
Valid
Strongly Disagree 35 10.3 10.3 10.3
Disagree 55 16.2 16.2 26.5
Undecided 44 12.9 12.9 39.4
Agree 100 29.4 29.4 68.8
Strongly Agree 106 31.2 31.2 100.0
Total 340 100.0 100.0
Source: Field survey 2018 [SPSS COMPUTATION]
44
Table 4.2.22 which is descriptive table of values showed the responses of the respondents. It can
be ascertained that 35 (10.3%) affirmed strongly disagree, 55 (16.2%) of the respondents
affirmed disagree, 44 (13.9%) affirmed undecided 100(29.4%) of the respondents affirmed
agree, whereas 106(31.2%) of the respondents affirmed strongly agree. From the result, majority
of the respondents affirmed strongly agree; hence we strongly agree with the statement above.
Table 4.2.23
I do not cause trouble after taking beer drinks
Frequency Percent Valid Percent Cumulative Percent
Valid
Strongly Disagree 35 10.3 10.3 ss10.3Disagree 45 13.2 13.2 23.5Undecided 44 12.9 12.9 36.5Agree 99 29.1 29.1 65.6Strongly Agree 117 34.4 34.4 100.0
Total 340 100.0 100.0
Source: Field survey 2018 [SPSS COMPUTATION]
Table 4.2.23 which is descriptive table of values showed the response of the respondents. It can
be ascertain that 35 (10.3%) affirmed strongly disagree, 45 (13.2%) of the respondents affirmed
disagree, 44 (12.9%) affirmed undecided 99(29.1%) of the respondents affirmed agree, whereas
117 (34.4%) of the respondents affirmed strongly agree. From the result, majority of the
respondents affirmed strongly agree; hence we strongly agreed with the statement above.
Table 4.2.24
I take full responsibility of my actions after taking beer drinks
Frequency Percent Valid Percent Cumulative Percent
Valid
Strongly Disagree 57 16.8 16.8 16.8Disagree 74 21.8 21.8 38.5Undecided 62 18.2 18.2 56.8Agree 81 23.8 23.8 80.6Strongly Agree 66 19.4 19.4 100.0
Total 340 100.0 100.0
45

Source: Field survey 2018 [SPSS COMPUTATION]
Table 4.2.24 which is descriptive table of values showed the responses of the respondents. it can
be ascertain that 57 (16.8%) affirmed strongly disagree, 74 (21.8%) of the respondents affirmed
disagree, 62 (18.2%) affirmed undecided 81(23.8%) of the respondents affirmed agree, whereas
66(19.4%) of the respondents affirmed strongly agree. From the result, majority of the
respondents affirmed agree; hence we concluded that they take full responsibility of my actions
after taking beer drinks.
Table 4.2.25
Drinking of beer does not stop me from doing my work
Frequency Percent Valid Percent Cumulative Percent
Valid
Strongly Disagree 49 14.4 14.4 14.4Disagree 51 15.0 15.0 29.4Undecided 100 29.4 29.4 58.8Agree 71 20.9 20.9 79.7Strongly Agree 69 20.3 20.3 100.0
Total 340 100.0 100.0
Source: Field survey 2018 [SPSS COMPUTATION]
The table above showed the result of the respondents 49 (14.4%) respondents strongly Disagree,
51(15.0%) of the respondents disagree, 100 (29.4%) of the respondents undecided while
71(20.9%) of the respondent agree, whereas 69 (20.9%) of the respondents strongly agree. From
the result, majority of the respondents undecided. Therefore, there is a strong indication that the
statement above is undecided.
Table 4.2.26
I treat others with respect and honour even when i had taken beer drinkFrequency Percent Valid Percent Cumulative
Percent
Valid Strongly Disagree 45 13.2 13.2 13.2
Disagree 45 13.2 13.2 26.5
46

Undecided 43 12.6 12.6 39.1
Agree 107 31.5 31.5 70.6
Strongly Agree 100 29.4 29.4 100.0
Total 340 100.0 100.0
Source: Field survey 2018 [SPSS COMPUTATION]
The table above showed the result of the respondents 45 (13.2%) respondents strongly Disagree,
45(13.2%) of the respondents disagree, 43 (12.6%) of the respondents undecided while
107(31.5%) of the respondent agree, whereas 100 (29.4%) of the respondents strongly agree.
From the result, majority of the respondents disagree. Therefore, there is a strong indication that
people treat others with respect and honour even when they have taken beer drink.
HYPOTHESES TEST
Hypotheses of the study were tested using multiple regression analysis. The condition of
accepting Ho is justified when the probability value of the regression output is greater than 0.05
level of significance, if not H1 will be accepted.
REGRESSION RESULT
Coefficientsa
Model Unstandardized Coefficients Standardized
Coefficients
t Prob. 95.0% Confidence Interval for
B
B Std. Error Beta Lower Bound Upper Bound
1
(Constant)
-
1982336955.0
64
38592367253.
889-.051 .960
-
86923564573.
681
82958890663.
553
Green disposition 49.273 3955.025 .021 .012 .013 -8655.678 8754.224
47

Relationship marketing 751.112 26439.584 .048 .028 .008 -58944.244 57442.020
Environmental
friendliness.998 1.229 .281 .812 .434 -1.708 3.703
Ethical disposition 1220.990 10175.446 .085 .120 .017 -21175.017 23616.996
a. Dependent Variable: Customer patronage
HYPOTHESES ONE
Ho: Green disposition as a dimension of social marketing does not significantly affect the level
of customer patronage of beer brands in Enugu North, L.G.A.
From the regression result above, the unstandardized coefficient for green disposition is positive
(49.273), indicating increase in consumer’s patronage as a result of increase in green disposition,
also the probability value is (0.013) which is less than the 0.05% level of significance; hence we
accept H1 and conclude that green disposition as a dimension of social marketing significantly
affects the level of customer patronage of beer brands in Enugu North, L.G.A.
HYPOTHESES TWO
HO: Relationship marketing as a dimension of social marketing does not significantly affect
the level of customer patronage of beer brands in Enugu North, L.G.A.
Also, from the regression result above, the unstandardized coefficient for relationship marketing
is positive (751.112), indicating increase in consumer’s patronage as a result of increase in
relationship marketing, also the probability value is (0.008) which is less than the 0.05% level of
significance; hence we accept H1 and conclude that relationship marketing as a dimension of
48

social marketing significantly affects the level of customer patronage of beer brands in Enugu
North, L.G.A.
HYPOTHESES THREE
Ho: Environmental friendliness as a dimension of social marketing does not significantly
affect the level of customer patronage of beer brands in Enugu North, L.G.A.
More so, from the regression result above, the unstandardized coefficient for environmental
friendliness is positive (0.998), indicating increase in consumer’s patronage as a result of
increase in environmental friendliness, also the probability value is (0.434) which is greater than
the 0.05% level of significance; hence we accept Ho and conclude that Environmental
friendliness as a dimension of social marketing does not significantly affect the level of customer
patronage of beer brands in Enugu North, L.G.A.
HYPOTHESES FOUR
Ho: Ethical disposition as a dimension of social marketing does not significantly affect the
level of customer patronage of beer brands in Enugu North, L.G.A.
More so, from the regression result above, the unstandardized coefficient for environmental
friendliness is positive (1220.990), indicating increase in consumer’s patronage as a result of
increase in ethical disposition, also the probability value is (0.017) which is less than the 0.05%
level of significance; hence we accept H1 and conclude that ethical disposition as a dimension of
social marketing significantly affects the level of customer patronage of beer brands in Enugu
North, L.G.A.
4.3 DISCUSSION OF FINDINGS
From the analysis of data presented, a number of findings were made and are as follows:
49

Firstly, it was ascertained that there is a relationship between green disposition and customer
patronage of beer brands in Enugu North, L.G.A .The customers who were the respondents are
very much aware and acquainted with green disposition.
Secondly, it was ascertained that there is a relationship between relationship marketing and
customer patronage of beer brands in Enugu North, L.G.A. Here, most of the respondents are
good with the relationship marketing terms and conditions of beer brands.
Thirdly, it was established that there is a relationship between environmental friendliness and
customer patronage of beer brands in Enugu North, L.G.A. Here, the customers believe in
environmental friendliness so they try as much as possible to keep the environment healthy and
clean.
Finally it was found out that there is a relationship between ethical disposition and customer
patronage of beer brands in Enugu North, L.G.A. Most of the respondents have good moral
ethical disposition when it comes to beer brand.
CHAPTER FIVE
SUMMARY OF FINDINGS, CONCLUSION AND RECOMMENDATIONS
5.1 Introduction
This chapter is aimed at summing up the findings of this study as well as to draw the conclusion
from the research work.
5.2 Summary of Findings
50

From the study, one could summarize more evidently that to an extent there is a
relationship between green disposition and customer patronage of beer in Enugu North,
L.G.A.
It was found that there is a relationship between relationship marketing and customer
patronage of beer brands in Enugu North, L.G.A.
It was discovered that there is a relationship between environmental friendliness and
customer patronage of beer brands in Enugu North, L.G.A.
Finally, the study established a significant relationship between ethical disposition and
customer patronage of beer brands in Enugu North, L.G.A.
Conclusion
In the light of the findings of this study, the following conclusions are drawn: It was found out
that there is a significant relationship between the social marketing dimensions and customer
patronage. Therefore, this study achieved the objectives that it sought to establish the
relationship between social marketing dimensions and customer patronage of beer brand in
Enugu North L.G.A.
Recommendations
The Researcher having conducted this research and analyzed the field data, the researcher
recommended the following points.
1. Social marketing, should address the right problem in order to be effective and successful
especially in marketing beer drinks.
2. Social marketing should explore customers’ behaviour and attitudes in order to identify
and develop suitable campaigns to change their behaviour and attitudes to desired levels.
3. Beer drinks should be more natural in order to retain their customer patronage.
51

4. The social marketing should identify the target groups/society’s demographic features
and social expectations and campaigns should be designed and implemented accordingly.
5. Beer drink firm should always make use of the social marketing dimensions to increase
their fame, brand and attract more customers.
5.3 SUGGESTED AREAS FOR FURTHER RESEARCH
Research could be carried out on the following
1. Impact Analysis of Social Marketing Mix on beverages.
2. A research on social marketing for drug abuse campaigns.
3. A research on the impact of social marketing on consumers in Nigeria.
REFERENCES
Abe, J. A. (2004), “Shame, Guilt, and personality Judgment”, Journal of Research in Personality,
Vol. 38, pp. 85-104.
52

Akdogan M.S, Coban S. and Ozturk, R (2012). ‘’Consumer Evaluation towards Social
Marketing Campaigns in the Media: An Application In Konya’’. European Scientific
Journal, 21 (1), 3-13 .
Andreasen, A. R. (2002), “Marketing Social Marketing in the Social Change Market”, Journal of
Public Policy & Marketing, 21, pp.(1) 3-13
Andreasen, A. R. (2005), Social marketing in the 21st century, London: Sage Publications.
Brenkert, G. G. (2002). Ethical challenges of social marketing. Journal of Public Policy &
Marketing, 21(1), 14–25.
Brenna, L.,Voros, J. and Brady, E. (2011), Paradigms at play and Implications for Validity in
Social Marketing Research, Journal of Social Marketing, Vol.1 No.2,pp.100-119
CGIAR. (2009), Revisiting the global food crisis.hhtp://www.cgair.org/monthly/may2009.ttml
(Accessed 8th August 2015)
Conroy, D. M. and Lee, K. C. C. (2006), “Imposed Change and Social Sustainability”
International Journal of Environmental, Cultural, Economic, and Social Sustainability,
Vol. 2 (4), pp. 64-70.
Cotte, J., Coulter, R. A., Moore, M. L. (2005), “Enhancing or disrupting guilt: The role of ad
credibility and perceived manipulative intent”, Journal of Business Research, Vol. 58. pp.
361-368.
Covello, V. (2003), “Best practices in public health risk and crisis communication” Journal of
Health Communication, Vol. 8, pp. 5-8.
53

Dann, S. (2010), “Redefining social marketing with contemporary commercial marketing
definitions”, Journal of Business Research, Vol. 63, pp. 147-153.
DeMeyrick, J. (2010), “Tobacco smoking’s changing trajectory in Australia”, Journal of
Business Research, Vol. 63, pp. 161-165.
Fikre K. Elemeen (2015), ‘’The Green Marketing Orientation & Environment Friendly Products
Green plastic Bag in Sudan’’, Journal of Social Science, Vol.4, pp.50-51.
Franciscus Van de Voorde (2017), the effect of sustainable practices on customer based equity;
Journal of the Academy of Marketing Science, Vol.23, pp.236-245.
Freimuth, V., Linnman, H. W., and Potter, P. (2000), “Communicating the threat of emerging
infections to the public”, Emerging Infectious Diseases, Vol. 6, pp. 337-347.
French, C., Stevenes, C. B., Mcvey, D., and Merrit, R. (2010). Social marketing and public
health, theory and practice. New York, NY: Oxford University Press.
Gene, M. (2001). Ethical considerations in the use of marketing for the management of public
health and social issues. In A. R. Andreasen (Ed.), Ethics in social marketing (pp. 17–39).
Washington, DC: Georgetown University Press.
George, G. R., Lusch, R. F., and Murphy, P. E. (2009). Social marketing: Its ethical dimension.
The Journal of Marketing, 43(2), 29–36.
Glouberman, S. and Zimmerman, B. (2002), “Complicated and Complex Systems: What would
successful reform of Medicare look like?” Commission on the Future Health Care in
Canada, Ottawa, and Discussion paper No. 8.
54

Grier, S., Bryant, C. (2005), “Social marketing in public health”, Annual Review Public Health,
Vol. 26, pp. 319-339.
Hastings, G. (2007), Social marketing: why should the devil have all the best tunes? Oxford:
Butterworth- Heinemann.
Hastings, G. and Angus, K. (2011), When is Social Marketing not Social Marketing, Journal of
Social Marketing, Vol.1 No. 1, pp. 45-53.
Hastings, G., Donovan, R. J. (2002), “International initiatives: Introduction and overview”,
Social Marketing Quarterly, Vol. 8, pp. 2-4.
Http: // search C.R.M. Tech target.com
Jardine, C. G. (2003), Development of publication participation and communication protocol for
establishing fish consumption advisories. Risk Analysis, Vol. 23, pp. 461-471.
Kotler, P. and Lee, N. (2008), Social Marketing: Influencing Behaviors for Good 3rd Edition,
Thousand Oaks, CA: Sage.
Kotler, P., and Zaltman, G. (1971). Social marketing: An approach to planned social change. Journal of Marketing, 35, 3–12.
Kotler, P., Roberto, N. and Lee, N. (2002), Social marketing: Improving the Quality of Life 2nd
Edition, Thousand Oaks, CA: Sage.
Lazer, P. E., and Kelly, P. N. (1973). Ethical issues in social marketing. In S. H. Fine (Ed.),
Marketing the Public Sector (pp. 68–78). New Brunswick, NJ: Transaction Publishers.
Lordley, D. (2007), “Once upon a time… storytelling to enhance teaching and learning”,
Canadian Journal of Dietetic Practice and Research, Vol. 65, pp. 30-35.
55
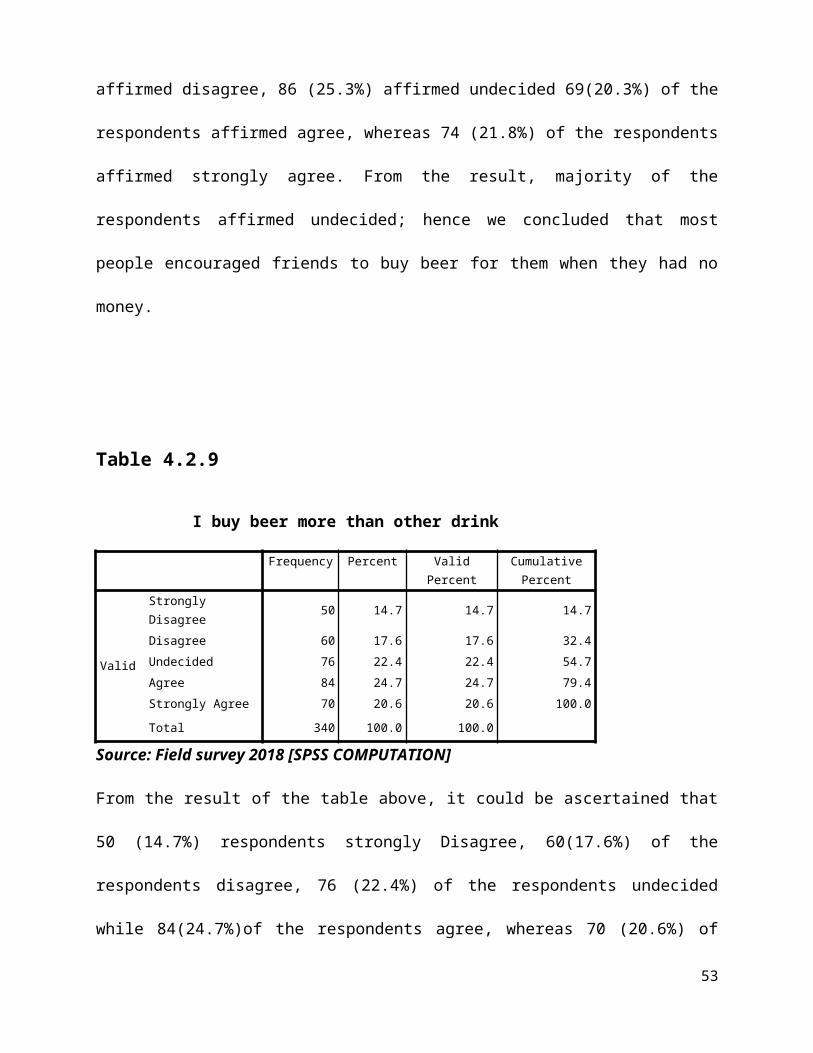
Lundgren, R. (1994), Risk Communication: A handbook for communication of environmental
safety and health risks. Columbus: Battelle Press.
McDermott, M. H., Chess, C., Perez-Lugo, M., Pflugh, K. K., Bochenek, E., and Burger, J.
(2003), “Communicating a complex message to the population most at risk: An outreach
strategy for fish consumption advisories. Applied Environmental Education and
Communication, Vol. 2, pp. 39-48.
McGregor, S. L. T. (2001), portraying the Canadian population as consumer. Canadian Home
Economic Journal, Vol. 51, pp. 39-43.
Morgan, S. E., Cole, H. P., Struttmann, T., and Piercy, L. (2002), “Stories or statistics? Farmers’
attitudes toward messages in an agricultural safety campaign”, Journal of Agricultural
Safety and Health, Vol. 8, pp. 225-239.
Nunnally JC (1978). Psychometric Theory, 2ndNewYork:McGraw-Hill
Peattie, K., Peattie, S. and Ponting, C. (2009), Climate Change: A Social and Commercial
Marketing Communications Challenge, Euro Med Journal of Business, Vol.4 No.3, pp.
270-286.
PhilipKolter (2015) Green Marketing: Environmental concern and customer satisfaction;
European Journal of Business and Management Vol.7, No.1
Pilloton, E. (2009), Design Revolution: 100 Products that Empower People, Metropolis Books,
New York.
56

Ralston, K. L., Brent, C. P., Starke, Y., Riggins, T., and Lin, C. T. J. (2002), “Consumer food
safety behavior: A case study in hamburger cooking and ordering”, Agricultural
Economic Report No. (AER 804), pp. 33.
Redmond, E. C., Griffith, C. J. (2003), “Consumer food handling in the home: A review of food
safety studies”, Journal of Food Protection, Vol. 66, pp. 130-161.
Resincow, K., and Page, S. C. (2008), “Embracing Chaos and Complexity: A quantum change
for public health” American Journal of Public Health, Vol.3, pp. 273-283
Robert, V. Bullough Jr. (2010), Ethical and moral matters in teaching and teaching education,
Elsevier Ltd.
Rose, C. and Dade, P. (2007) “Using values modes”. www.campignstrategy.org assessed on 27th
August, 2015.
Russel-Bennett, Rebakah, Wood, Matthew, J. M., and Previte, J. (2013), “Fresh ideas: services
thinking for social marketing”, Journal of Social Marketing, Vol. 3, pp. 223-238.
Shaw, A. (2004), “Discourse of risk in lay accounts of microbiological safety and BSE: A
qualitative study”, Health, Risk, and Society, Vol.6, pp. 151-171.
Smith, W. A. (2001). Ethics and the social marketer: A framework for practitioners. In A. R.
Andreasen (Ed.), Ethics in social marketing (pp. 1–16). Washington, DC: Georgetown
University Press.
Storey, D., Saffitz, C, and Rimon, J. (2008), Social marketing, Health behavior and health
education: Theory, research and practice. San Francisco, CA: Jossey-Bass Publishing.
57

Tapp, A. and Hughes, T. (2008), “Why soft science is the key to regaining leadership in
marketing knowledge”, European Journal of Marketing, Vol. 42, No. ¾, pp. 265-278
Terblanche-Smit, M, and Terblanche, N.S. (2010), “Race and attitude formation in HIV/Aids
fear advertising”, Journal of Business Research, Vol. 63, pp. 121-125.
Tigan`asa A, Ticlau T, Morac, Bacali L (2011). Use of Public Sector Marketing and Leadership
in Romania’s Local Public Administration. Revista de cercetaresi interventie Social, Vol.
34, pp.212-233.
Wansink, B. (2006), “Mindless eating: Why we eat more than we think. New York: Bantam.
Watson, L.N and White, K. M. (2007), “The Role of Fear appeals in improving Driver Safety: A
Review of the Effectiveness of Fear-arousing (threat) Appeals in Road Safety
Advertising”, International Journal of Behavioral Consultation and Therapy, Vol. 3, pp.
203-222.
Zimmer, M.R., Stafford, T.F. and Stafford, M.R. (1994), ‘Green Issues: dimensions of
environmental concern’, Journal of Business Research, Vol.30 No.1,pp.63-74
58

APPENDIX I
Marketing ProgrammeDepartment of Business Management
Faculty of Management And Social Sciences
Godfrey Okoye University Ugwuomu-Nike
Thinker’s Corner Enugu.
Dear Respondent,
I am writing to request your participation in the research on ‘‘Social Marketing Dimensions and
Customer Patronage of Beer Brands in Enugu North Local Government Area (LGA)’’.
Your honest view is required in this research. I assure you that the information given in the
survey will be treated confidentially.
Thank you for your participation.
Yours faithfully,
Okoli Chioma Jennifer.08105534990
59
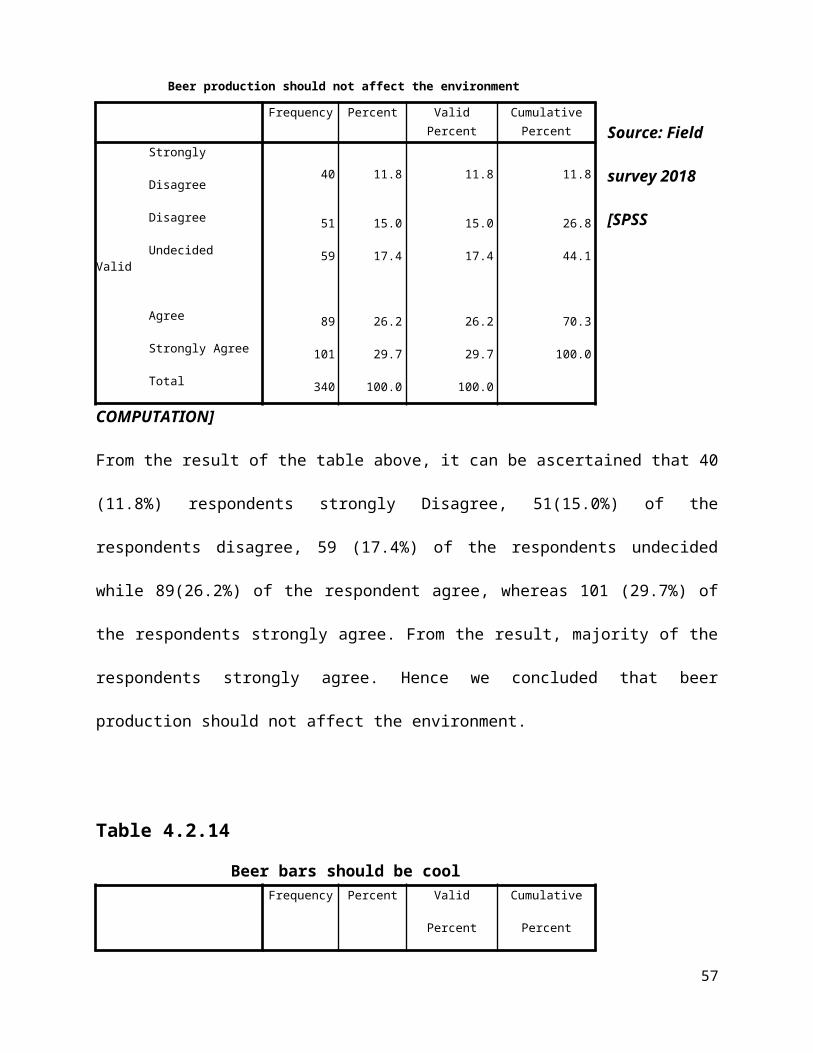
APPENDIX II
Section A: please endeavor to complete the questionnaire by ticking the correct answer(s)
from the option.
1. What is your Gender? Male [ ] Female [ ]
2. What is your Age? 18-27 [ ] 28-37 [ ] 38-47 [ ] 48- 57 [ ] 58 and above [ ]
3. What is your Marital status? Single [ ] Married [ ] Divorced [ ] Separated [ ]
Widow [ ] Widower [ ]
4. What is your Educational Qualification? SSCE [ ] OND/NCE [ ]
HND/B.Sc/BA/B.Ed [ ] M.Sc/MBA/M.A [ ] Ph.D [ ]
5. What is your brand choice? Heineken [ ] Life [ ] Hero [ ] Gulder [ ] Star [ ]
33 [ ] Harp [ ] Star Raddler [ ] other [ ] Specify----------------
6. What is your Income Level? N5,000 – N15,000 [ ] N18,000 - N27,000 [ ] N36,000 -
N44,000 [ ] N52,OOO - N60,000 [ ] N69,000 - N77,000 and above [ ]
Section B
Please tick the number that corresponds to your answer in each of the question .
Strongly Disagree (SD) = 1, Disagree (DA) = 2, Undecided (UD) = 3, Agree (A) = 4 and
Strongly Agree (SA) = 5
Customer Patronage
S/N Questionnaire items SD DA UD A SA1 I buy beer drink always 1 2 3 4 5
2 I encourage friends to buy beer for me when I have no money
1 2 3 4 5
3 I buy beer more than any other drink 1 2 3 4 5
4 I buy beer because of the company’s image and is widely known
1 2 3 4 5
60

Green Disposition
S/N Questionnaire items SD DA UD A SA5 Beer drinks should be natural 1 2 3 4 5
6 Beer drinks packaging should not be harmful 1 2 3 4 5
7 Beer production should not affect the environment 1 2 3 4 5
8 Beer bars should be cool 1 2 3 4 5
Relationship Marketing
S/N Questionnaire Items SD DA UD A SA9 I strongly believe that beer drink is the best 1 2 3 4 5
10 I cannot stop buying beer drinks 1 2 3 4 5
11 I have strong attachment to beer drink 1 2 3 4 5
12 Beer firms fulfill their promises 1 2 3 4 5
Environmental Friendliness
S/N Questionnaire items SD DA UD A SA13 I read labels of the beer I take 1 2 3 4 5
14 I buy canned beers to save the environment from broken bottle
1 2 3 4 5
15 I dispose off my beer container after taking my drink 1 2 3 4 5
16 I advise others to drink responsibly 1 2 3 4 5
Ethical Disposition
S/N Questionnaire items SD DA UD A SA17 I do not cause trouble after taking beer drinks 1 2 3 4 5
18 I take full responsibility of my actions after taking beer drinks
1 2 3 4 5
19 Drinking of beer does not stop me from doing my work 1 2 3 4 5
20 I treat others with respect and honour even when I had taken beer drink
1 2 3 4 5
61

APPENDIX III
QUESTIONNAIRE APPORTIONMENT
Enugu North is made up of seven areas:
1. Iva Valley 18,076 x 400 = 22_______326,900
2. Ogbete 52,817 x 400 = 65 ______326,900
3. Asata 44,356 x 400 = 54 _______326,900
4. Ogui 83,794 x 400 = 102 _______326,900
5. Independence Layout 49,716 x 400 = 61 _______326,900
6. New Haven 38,214 x 400 = 47 ______326,900
7. G.R.A 39,927 x 400 = 49 _______326, 900
TOTAL = 400
62