Embed Size (px)
Citation preview
Population and evolutionary dynamics of Pseudomonas aeruginosa during anti-adhesion therapy
And
The purification and crystallisation of five Bdellovibrio proteins used during attack phase
By David Hardy
963241
A thesis submitted to the University of Birmingham for the degree of: Molecular and Cellular Biology - Master by Research (MRes)
Biosciences University of Birmingham January 2015
University of Birmingham Research Archive
e-theses repository This unpublished thesis/dissertation is copyright of the author and/or third parties. The intellectual property rights of the author or third parties in respect of this work are as defined by The Copyright Designs and Patents Act 1988 or as modified by any successor legislation. Any use made of information contained in this thesis/dissertation must be in accordance with that legislation and must be properly acknowledged. Further distribution or reproduction in any format is prohibited without the permission of the copyright holder.
Summary
This Masters by Research thesis comprises of two different projects each
conducted at the University of Birmingham between 2013 and 2014. The first project
was about using an anti-adhesion FimH antagonist on P. aeruginosa to evaluate their
population and evolutionary dynamics. This data was then used to help mathematical
models on the effects of anti-adhesion molecules during and bacterial infection. Six
clinical isolates were for their antibiotic resistance to meropenem and imipenem.
Once a resistant and susceptible isolate was found their growth rates, killing rates,
attachment amounts and phagocyte killing capacity was measured. The second
project involved protein purification and crystallisation of five Bdellovibrio proteins
during attack phase. During attack phase Bdellovibrio up regulates certain proteins
and finding the structure of these proteins will help understand how the function.
This could be used as way to control Bdellovibrio and use it as at living antibiotic.
Bdellovibrio is a predatory bacterium capable of invading and replicating within Gram
negative bacteria. The overall goal of this project was to purify five Bdellovibrio
proteins to a high enough purity and concentration to create protein crystals. The
crystals would then be diffracted through x-ray crystallography to deduce the
molecular structure.

Acknowledgments
I would like to take the time and thank certain people who helped me
throughout this masters project. For the first project I would like to thank my
supervisor Dr. Anne-Marie Krachler for her expertise and guidance. I would also like
to thank all the people in the May lab at the University of Birmingham who made it a
fun and enjoyable experience. For the second project I would like to thank my
supervisor Dr. Andy Lovering for all his help and for making it an amazing project. I
would like to thank Dr. Ian Cadby for his management and assistance throughout the
project. I would also like to thank all the friends I have made over this project for
making it an absolutely wonderful experience.

Table of Contents
MRes Project 1- Population and evolutionary dynamics of Pseudomonas aeruginosa
during anti-adhesion therapy
Abstract 1
Introduction 2- 15
Materials and Methods 16 - 20
Results 21 - 44
Discussion 45 - 52
Conclusion 53 - 54
References 55 - 61
MRes Project 2- The purification and crystallization of five Bdellovibrio proteins
used during attack phase
Abstract 63
Introduction 64 - 76
Materials and Methods 77 - 85
Results 86 - 116
Discussion 117 - 131
Conclusion 132 - 135
References 136 - 139

Molecular and Cellular Biology MRes Project 1
Population and evolutionary dynamics of Pseudomonas aeruginosa
during anti-adhesion therapy

1
Abstract
Pseudomonas aeruginosa is an opportunistic nosocomial Gram negative
pathogen mainly causing infections in immunocompromised patients. Through a
variety of mechanisms P. aeruginosa can become resistant to many antibiotics
including carbapenems. Anti-adhesion therapy is one method of reducing the
emergence of antibiotic resistant as it puts minimal selective pressure on the
bacteria. To understand how the dynamics of a bacterial infection works
mathematical models have been developed. Six clinical isolates of P. aeruginosa
where used to gain data on some parameters that these mathematical models were
based on. All six P. aeruginosa isolates were resistance to imipenem (>8 µg/mL), one
was also resistant to meropenem (>8 µg/mL) and the other five were sensitive to
meropenem with an MIC of 2 µg/mL. The growth rates between meropenem
sensitive and resistant isolates showed no difference. Only the meropenem resistant
strain was able to maintain almost stable levels of growth over 20 hours in levels up
to 20 µg/mL of meropenem. All susceptible strains showed a decrease growth at ≥ 2
µg/mL of meropenem. Twice the amount of the meropenem resistant isolate was
able to attach to J774 macrophages compared to any of the sensitive strains. LDH
release assays were used to measure the percent of macrophage lysis which showed
no difference between meropenem sensitive and resistant isolates. Interestingly the
meropenem resistant isolate had a small, round morphology compare to the large,
flat colonies of the sensitive isolates. Due to the natural fluorescence properties of P.
aeruginosa the levels of a FimH anti-adhesion molecule could not be examined.
2
Introduction
Aims and Objectives
With antibiotic resistance increasing it calls for a new method of treatment to
overcome this growing problem. This increase in antibiotic resistance is true for many
bacterial species including Pseudomonas aeruginosa. Imipenem and meropenem are
classed as last resort treatment options when confronted with a P. aeruginosa
infection and yet this bacterial species has evolved to able to survive in the presence
of these two antibiotics even at high concentrations. One such method to deal with
the problem of antibiotic resistance is anti-adhesion therapy as it put little to no
selective pressure on the bacteria. Anti-adhesion works by inhibiting the initial
interactions between the host and pathogen. This would make the pathogen more
susceptible to the host’s immune system and antibiotics.
In order to test this theory mathematical models have been produced to
simulate the population and evolutionary dynamics of bacteria during anti-adhesion
therapy. To produce a better working mathematical model experimental data must
be obtained. Certain parameters such as growth and killing rates, phagocyte
interactions and the effect that antibiotics and anti-adhesion molecules have on
bacteria were investigated. This was to gain experimental data to not only to improve
the mathematical models but to assess the dynamics of bacterial during anti-
adhesion therapy. Six P. aeruginosa isolates were obtained from the Queen Elizabeth
hospital and used to carry out this study. They were chosen because they should a
variety resistance to imipenem and meropenem. This allows a better understanding

3
into the workings of resistant and susceptible populations of when treated with
either antibiotics or anti-adhesion molecules or a combination of both.
Pseudomonas aeruginosa
Pseudomonas aeruginosa is a Gram negative, coccobacillus bacterium that has
unipolar motility. This opportunistic pathogen is mostly associated with the
nosocomial environment and causes infections in open wounds and burn injuries,
especially in those who are immunocompromised. It also causes infections in the
urinary tract and pulmonary tract through invasive instruments such as catheters and
respiratory tubes (Morita, 2014). But the amount of data of health-care associated
infections by P. aeruginosa is limited with the best indicator of severe infection being
bacteraemia. In the UK P. aeruginosa only accounts for ~4% of bacteraemia
cases with an incidence of 7.3 per 100,000 population making it the seventh most
common cause of bacteraemia (Loveday et al., 2014). As there are more outbreaks in
intensive care units (ICU), patients with chronic obstructive pulmonary disease
(COPD) and cystic fibrosis (CF) are more susceptible to P. aeruginosa infections
because they are in a nosocomial environment with invasive instruments being used
on them and are immunocompromised (Lovewell, 2014). As there is a growing elderly
population due to longer life expectancy leading to more immunocompromised
patients, the risk of Pseudomonas infections is increasing. This coupled with P.
aeruginosa ability to thrive in a wide variety of environments armed with its arsenal
4
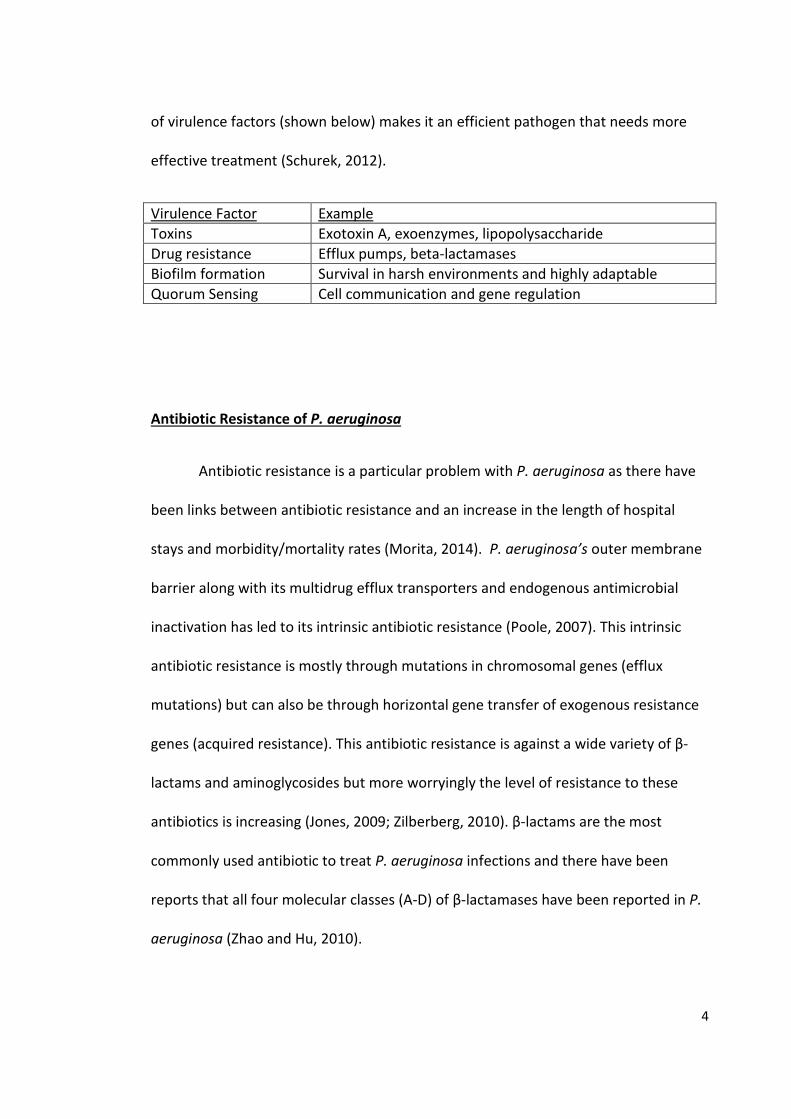
of virulence factors (shown below) makes it an efficient pathogen that needs more
effective treatment (Schurek, 2012).
Virulence Factor Example Toxins Exotoxin A, exoenzymes, lipopolysaccharide Drug resistance Efflux pumps, beta-lactamases Biofilm formation Survival in harsh environments and highly adaptable Quorum Sensing Cell communication and gene regulation
Antibiotic Resistance of P. aeruginosa
Antibiotic resistance is a particular problem with P. aeruginosa as there have
been links between antibiotic resistance and an increase in the length of hospital
stays and morbidity/mortality rates (Morita, 2014). P. aeruginosa’s outer membrane
barrier along with its multidrug efflux transporters and endogenous antimicrobial
inactivation has led to its intrinsic antibiotic resistance (Poole, 2007). This intrinsic
antibiotic resistance is mostly through mutations in chromosomal genes (efflux
mutations) but can also be through horizontal gene transfer of exogenous resistance
genes (acquired resistance). This antibiotic resistance is against a wide variety of β-
lactams and aminoglycosides but more worryingly the level of resistance to these
antibiotics is increasing (Jones, 2009; Zilberberg, 2010). β-lactams are the most
commonly used antibiotic to treat P. aeruginosa infections and there have been
reports that all four molecular classes (A-D) of β-lactamases have been reported in P.
aeruginosa (Zhao and Hu, 2010).

5
The endogenous β-lactamases found in P. aeruginosa are normally encoded
by two β-lactamase genes; one class C cephalosporinase (AmpC) and one class D
oxacillinase (PoxB). This common gene AmpC is found in many Gram negative
bacteria but in P. aeruginosa it has been link to the natural antibiotic resistant to β-
lactam in clinical isolates (Poole, K). In P. aeruginosa the most common mechanism of
resistance to β-lactams, including expanded-spectrum cephalosporins and penicillin’s,
are ones that contain a mutation of AmpC (Poole, 2011). Acquired resistance in P.
aeruginosa usually come through the acquisition of extended-spectrum β-lactamase
(ESBL classes A and D) and carbapenemases (classes A, B and D) which are able to
hydrolyse most β-lactams including carbapenems. The genes that encoded these
enzymes are usually plasmid- or transposon-bone genes which are often on integrons
that can capture and mobilize resistant genes (Cambray et al., 2010).
Carbapenems (imipenem and meropenem) are used to treat P. aeruginosa
infections as they are highly stably compared to other β-lactams and have been
useful in the treatment of ESBL enzymes and AmpC producers (El Gamal and Oh,
2010). Although carbapenems are more stable against β-lactamases compared to
other β-lactams P. aeruginosa is finding ways to combat these antibiotic leading to
antibiotic resistant and multi-drug resistant P. aeruginosa strains. Carbapenems will
induce AmpC but is also effective against AmpC due to its bactericidal activity and
stability. In P. aeruginosa AmpC along with other mechanisms of resistance contribute
to the resistance of carbapenems (Jones, 1998). The enzymes responsible for the
carbapenem resistance are β-lactamases which are capable of hydrolyzing
carbapenems. In P. aeruginosa these are class A and D carbapenemases and a class B

6
metallo- β-lactamases (MBL) (Queenan and Bush 2007; Walsh, 2010). There are five
class A β-lactamases that have activity against carbapenems but only two of these
(Guiana extended-spectrum (GES) and Klebsiella pneumonia carbapenemase (KPC)
enzymes) have been reported in P. aeruginosa (Zhao and Hu, 2010). The number of
reports that found KPC enzymes in P. aeruginosa is increasing and so far two types of
KPC enzyme (KPC-2 and KPC-5) have been found in P. aeruginosa (Villegas et al., 2007;
Wolter et al., 2009). What’s more worrying is that isolates that have the KPC enzyme
and are resistant to carbapenem are also found to be lacking the OprD outer
membrane porin (Villegas et al., 2007; Wolter et al., 2009) which is used as one of the
primary entry routes of β-lactams (Trias and Nikaido, 1990). This allows these bacteria
to not only be able to break down β-lactamases but can also stop their entry into the
cell. The two GES enzymes (GES 2 and 5) that have been reported in P. aeruginosa
and shown to have activity against carbapenems are ESBLs (Poole, 2011). The class B
metallo beta-lactamases (MBLs) are the main reason for β-lactamase mediated
resistance to carbapenems with Verona integron-encoded metallo-β-lactamase (VIM)
and imipenem (IMP) enzymes being the most common MBLs found in carbapenem-
resistant bacteria (Walsh et al., 2005). VIM and IMP have been found in carbapenem-
resistant P. aeruginosa (Gupta, 2008) with VIM predominating in Europe and IMP
predominating in Asia. VIM-2 can now be found in five continents (Gupta, 2008;
Walsh, 2010; Zhao and Hu, 2010) and SPM-1 which was found only previously in Brazil
is now being reported in Europe (Salabi et al., 2010). These enzymes that are
contributing to antibiotic resistance have now been found all over the world are not
7
the only way in which P. aeruginosa can become resistance to highly effective
compounds such as carbapenems.
Other mechanisms of resistance include efflux pumps, outer cell membranes,
quorum sensing genes and biofilm formation. The outer cell membrane is one of the
largest contributors to antibiotic resistance in P. aeruginosa. In particular the
alteration or loss of the outer membrane porin protein OrpD which is the major entry
route of carbapenems leads to carbapenem resistance (Trias and Nikaido, 1990). This
mechanism only provides high levels of resistance in non-MBL-produces and requires
the presences of AmpC (Livermore, 1992; Poole, 2011). As mentioned before the loss
or alteration of OrpD is usually accompanied by the KPC enzyme which increases their
resistance to beta-lactams including carbapenems especially when KPC-2 is present.
Efflux pumps are able to expel antimicrobials for the bacteria and are a
common mechanism of resistance in many bacterial species including P. aeruginosa.
The members of the Resistance Nodulation Division (RND) of which there are 12
provide significant contributions to antimicrobial resistance in P. aeruginosa (Poole,
2004, 2007). Three of these 12 RND (MexAB-OprM, MexCD-OprJ, and MexXY-OprM)
have been shown to supply resistance to β-lactams with MexAB-OprM having the
most frequent and broadest range of resistance to β-lactams in clinical isolates (Drissi
et al., 2008; Tomas et al., 2010). All three of these efflux systems have been shown to
accommodate carbapenems, but not imipenem (Okamoto et al., 2002) resistance
with MexAB-OprM having the greatest increase in resistance in clinical isolates (Pai et
al., 2001). MexXY-OprM has also been found in clinical isolates of P. aeruginosa that
8
are resistant to β-lactams but as with all of these efflux pumps are usually found in
conjunction with other mechanisms to provide high levels of resistance (Vettoretti et
al., 2009)
Carbapenems
Carbapenems which include meropenem and imipenem are a class of broad
spectrum beta-lactam antibiotics. Thienamycin is a naturally occurring antibiotic
which is a product of Streptomyces cattleya and was the first carbapenem which lead
to the invention of all subsequent carbapenems (Birnbaum, 1985; Papp-Wallace et
al., 2011). Imipenem and meropenem were the first two FDA approved carbapenems
gaining approval in 1985 and 1996 respectively. Carbapenems were used in response
to beta-lactamases which first emerged in the 1960’s. What makes carbapenems
different from conventional penicillin’s is the hydroxyethyl side chain along with them
having a 4:5 fused lactam ring. Carbapenems also have a double bond between C-2
and C-3 and a substitution at the C-1 position swapping carbon for sulphur (Papp-
Wallace et al., 2011).
Imipenem works by inhibiting cell wall synthesis but has to be co-
administrated with cilastatin which provides prolonged blockade of imipenem
metabolism (Birnbaum, 1985) . Dehydropeptidase-1 (DHP-1) is the enzyme that
degrades imipenem reducing its effects so the DHP-1 inhibitor cilastatin is
administrated with imipenem. Meropenem mode of action is also against bacterial
cell wall synthesis and is a bactericidal antibiotic when used against P. aeruginosa but
9
has to be administrated intravenously. Meropenem has increased stability to DHP-1
so a DHP-1 inhibitor is not needed when administrating meropenem. By inhibiting cell
wall synthesis the bacterium is unable to repair any damages in the cell wall and
cannot divide as cell wall synthesis is need for complete division and replication.
Carbapenems work by binding to the penicillin-binding-protein (PBP) which is a group
of enzymes that are essential for cell wall synthesis. By binding to PBP carbapenem
prevents the linkage of peptidoglycan strands which will prevent cell wall synthesis.
The bactericidal activity of carbapenem is at its highest when binding to PBPs 1a, 1b
and 2 with meropenem having the highest affinity to PBP2. Meropenem also has an
affinity for PBP3 which is species specific for P. aeruginosa.
Anti-Adhesion Therapy
There is an increasing amount of antibiotic resistance not only in P.
aeruginosa but in many species of bacteria. This is a worrying prospect globally as the
transmission of these drug resistance and multi-drug resistance bacteria or superbugs
can be from one country to another in a matter of hours. For bacteria like P.
aeruginosa which can survive in a variety of environments this transmission is more
likely to occur as the bacteria is more likely to survive over longer periods of time in
harsh environments. Antibiotic resistance is driven through the improper use of
antibiotics when the incorrect antibiotic is used, the wrong dose is administered or
patients do not follow administrative instructions properly. One way of combating

10
the problem of antibiotic resistance is to produce new antibiotics that are more
powerful and would prevent pathogenic bacteria becoming resistance.
A different method to reduce antibiotic resistance but still cure infections is
through the use of anti-adhesion therapy. The idea behind anti-adhesion therapy is
stopping pathogenic bacteria adhering to host cells, which is the first step of
infections. If bacteria are able to adhere to host cells they are more likely to avoid the
host immune system and can start to release their arsenal of virulence factors. If
bacteria are stopped adhering to host cells they should be more likely to be cleared
by the host’s immune system and not produce their virulence factors. Bactericidal
antibiotics like carbapenems kill the bacteria but by not killing the bacteria using anti-
adhesion therapy it puts less selective pressure on the bacteria causing less
resistance. This is because the anti-adhesion therapy is only stopping the interaction
between host and bacteria and is not disrupting the integrity of the bacteria. The host
immune system should be able to more effectively clear the infection as the bacteria
cannot adhere to the host cell, start to colonise and release virulence factors.
Selective pressure is what produces drug resistance in bacteria as only the portion of
the bacterial population that are able to survive the antibiotic or drug will be viable
after treatment. Mutations in certain proteins and enzymes allow bacteria to become
resistant to antibiotics under selective pressure, without this selective pressure the
mutations may not occur especially if they have a negative cost on fitness. It is more
than possible for bacteria to produce mutations in the cell surface proteins that
would counteract anti-adhesion molecules but these would affect the binding of the
bacterial pathogen to host cells. This means that it would be more detrimental to the

11
bacteria to become resistant to anti-adhesion molecules as it would then also not
able to bind to host cells.
The initial step in the adhesion process of bacteria to host cells is a weak non-
specific binding using charge and hydrophobicity between the host and bacteria cell
surface (Yuehuei, 2000). Specific interaction follow allowing the bacteria to sample
the host cell environment in a gliding or rolling motion (Anderson, 2007) before
making high-affinity strong specific interactions with either sugars, proteins or lipids.
Each part of this binding process can be targeted through anti-adhesion therapy by
interfering with either the host or bacterial cell surfaces. There are several ways in
which this can be achieved: inhibiting the biogenesis of cell surface receptors in the
host or bacterium, attaching anti-adhesion molecules to specific sugars, proteins or
lipids to prevent host-pathogen interactions or by actively or passively immunising
the host using antibodies that can recognise bacterial surface epitopes.
By inhibiting the biogenesis of cell surface receptors of bacteria, the bacteria
are unable to produce the correct cell surface receptors such as fimbrial adhesions,
pili and outer membrane proteins that are used in the host-pathogen interaction. This
inhibition can be achieved by either prematurely halting the biogenesis of proteins
which produces incomplete or incorrectly folded proteins or by stopping the
translocation of these proteins to the cell surface. The former has been shown to be
accomplished by sub inhibitory concentration of fluoroquinolone ciprofloxacine and
the aminoglycoside amikacin (Krachler, 2013). Chaperone-usher (C/U) pili can
translocate pilin subunits via the Sec pathway to the outer membrane usher complex

12
which can secrete them and also act as assembly platforms. Pilus assembly can be
therefore be interrupted by disrupting this chaperon-pilin complex with small
molecules known as pilicides which subsequently inhibit bacterial adhesion
(Svensson, 2001; Pinkner, 2006). These C/U pili are found in P. aeruginosa and are
conserved among many species of bacteria making pilicides an effective molecule
against many species of bacteria (Krachler, 2013). Host cells can also be manipulated
to decrease bacterial adhesion by interfering with host glycosphingolipids (GSLs)
(Svensson, 2003). This inhibition works by blocking the ceramide-specific
glycosyltransferase which is able to catalyze the formation the precursor of GSLs. By
inhibiting the GSLs pathway it has been proven that this will reduce bacterial
colonisation of the urinary tract of murine models (Svensson, 2001).
Another strategy to inhibit the host-pathogen interaction is by competitively
binding molecules to either the bacteria or host cells. Carbohydrates cover the
surface of bacteria and host cells; lipopolysaccharides and glycoproteins for bacteria
and glycoproteins and glycosphingolipids for host cells. These carbohydrates offer
potential for anti-adhesion therapies like glycomimetics and synthetic glycosides
which can competitively bind to the cell surface of bacteria and host cells stopping
the attachment of bacteria to host cells. Two lectins produced by P. aeruginosa, LecA
and LecB, could be potential target for anti-adhesion therapy as they are known to
contribute to the adhesion process of P. aeruginosa (Chemani, 2009). One good
example of this is the use of FimH antagonists which target the FimH adhesive
subunit on type 1 pili. This subunit is used in the host-pathogen interaction between
fimbriated uropathogenic E. coli (UPEC) and bladder cells during a urinary tract

13
infection (UTI). The first experiments based on mannoside-based host receptor
analogs, of which a FimH antagonist is, where in murine models of UTI infections in
the 1970s. Since then many alteration and advances has been made to this
compound using structural studies. Multivalent scaffolds were added to make this
FimH inhibitor a multivalent inhibitor that works by using a synthetic polymer, sugar
core or peptide backbone to cross link bacteria (Almant, 2011). An aglucan moiety
was also added which can improve the affinity, solubility and metabolic stability and
now the most recent FimH antagonist are biphenyl mannoside. Compared to D-
mannose based antagonist these most recent FimH are approximately 200,000-fold
more potent and orally available (Han, 2012). These FimH antagonists have low
cytotoxicity, are not cross reactive with human mannose receptors (Scharenberg,
2012; Hartmann, 2012) and have been able to decrease bacterial colonisation in
murine models as much as when ciprofloxacine was administrated (Klein, 2010; Jiang,
2012)
Host-pathogen interactions
The immune system in humans and animals is what defends the host against
pathogenic organisms such as P. aeruginosa. Phagocytic immune cells such as
neutrophils and macrophages are some of the first immune cells to respond to an
infection. These cells are capable of phagocytosing and destroying pathogenic
bacteria very quickly in a non-specific manner. As macrophages and neutrophils are
the first to respond to a bacterial infection they help to reduce the colonisation of the
14
bacteria and are therefore reduce the rate at which the infection can spread.
Phagocytes are part of the innate immune system and without them the host is prone
to infections from organisms like P. aeruginosa which are opportunistic pathogens. It
has been shown that people suffering from immune compromising diseases such as
chronic obstructive pulmonary disease (COPD) and cystic fibrosis (CF) have recurrent
or chronic lung infections. In fact >80% of adults suffering from CF have either an
acute or chronic P. aeruginosa infection and others with genetically compromised
immune systems such as leukocyte adhesion deficiency (LAD) have a pre-disposition
to P. aeruginosa infections. The evidence to support the role of phagocytes in the
clearance of P. aeruginosa is from animal models which have impaired immune
systems are more susceptible to P. aeruginosa infections.
A controversial topic is the difference between bacterial invasion and cellular
uptake or phagocytises. This is particularly controversial in the cases of phagocytic
cells such as macrophages as these cells are capable of phagocytosing bacteria as well
as being invaded by certain species of bacteria. P. aeruginosa has been found to be
able to invade corneal, epithelial, embryonic kidney (HEK) and HeLa cells but is
engulfed by phagocytic cells. This claim is supported by the fact that clearance of P.
aeruginosa is mediated by immune cells such as macrophages and has been shown
that people lacking completely function immune systems succumb to P. aeruginosa
infections more easily. Another idea to support the claim of macrophages engulfing P.
aeruginosa through phagocytosis rather than P. aeruginosa invading the macrophage
is that P. aeruginosa is not generally considered an intracellular pathogen and it has
no specific adaptations built for intracellular survival. There is no really benefit for P.

15
aeruginosa to invaded macrophages as it is able to survive and thrive extracellularly
through its array of virulence factors. The one advantage P. aeruginosa may gain from
invading macrophages is to evade the immune system and replicate but this can be
achieved through the invasion of non-phagocytic cells and are therefore less likely to
be destroyed by phagosomes.
Studies have shown that whether it be invasion or the phagocytosis of P.
aeruginosa relies on phosphoinositide 3-kinase (PI3K). PI3K is able to convert
phosphatidylinositol (4, 5) bisphosphate (PIP2) into phosphatidylinositol (3, 4, 5)
triphosphate (PIP3) located at the host cell membrane. PI3K is responsible for the
recruitment of Akt in the host cytoplasm and this phosphorylation is needed for both
phagocyctic engulfment and invasion of P. aeruginosa. Mice that have suffered the
loss of the phosphatase that regulates the conversion of PIP3 to PIP2, murine PTEN
(phosphatase and tensin homolog), have increased in vivo clearance of P. aeruginosa
from the lung through phagocytosis (Hubbard LL). Toxins produced from P.
aeruginosa are able to block the activity of Rac1 and CDC42 which are GTPases
necessary for macrophage phagocytosis but not engulfment by epithelial cells. But P.
aeruginosa is able to active other upstream GTPase in epithelial cells which promote
engulfment and vascular permeability allowing P. aeruginosa to block phagocytosis by
macrophages and also promote invasion into epithelial cells (Lovewell, 2014).
16
Materials and Methods
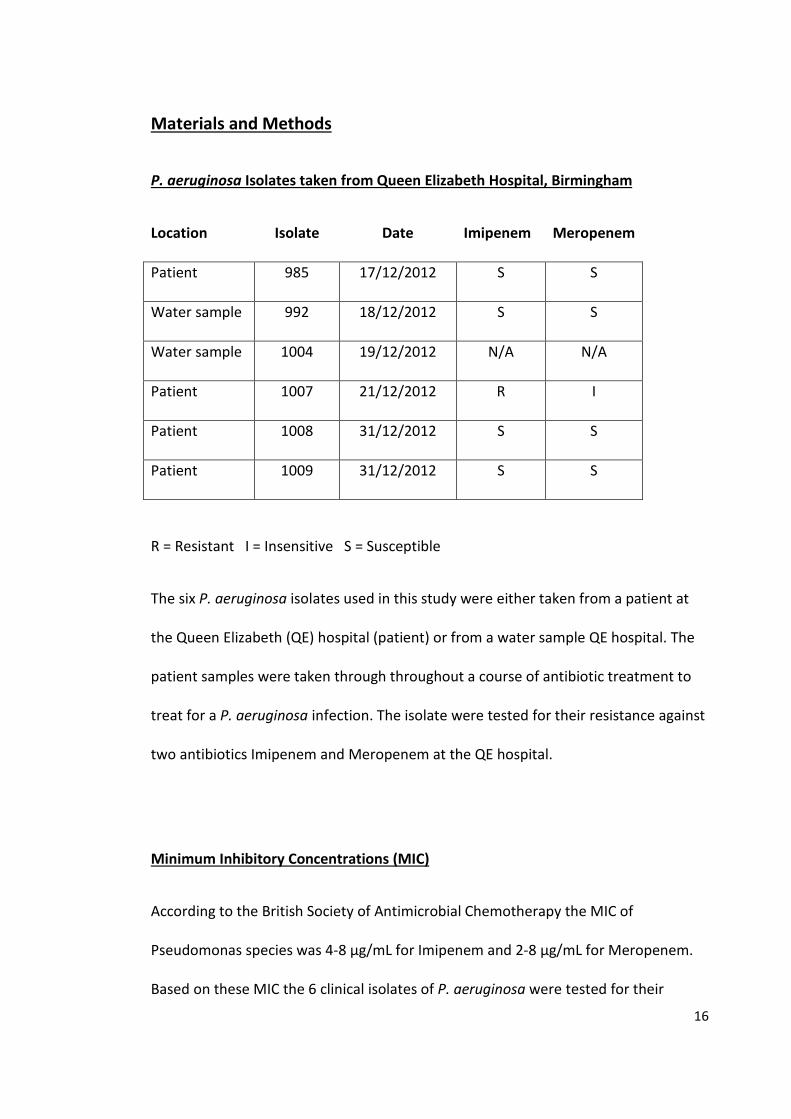
P. aeruginosa Isolates taken from Queen Elizabeth Hospital, Birmingham
R = Resistant I = Insensitive S = Susceptible
The six P. aeruginosa isolates used in this study were either taken from a patient at
the Queen Elizabeth (QE) hospital (patient) or from a water sample QE hospital. The
patient samples were taken through throughout a course of antibiotic treatment to
treat for a P. aeruginosa infection. The isolate were tested for their resistance against
two antibiotics Imipenem and Meropenem at the QE hospital.
Minimum Inhibitory Concentrations (MIC)
According to the British Society of Antimicrobial Chemotherapy the MIC of
Pseudomonas species was 4-8 µg/mL for Imipenem and 2-8 µg/mL for Meropenem.
Based on these MIC the 6 clinical isolates of P. aeruginosa were tested for their
Location Isolate Date Imipenem Meropenem
Patient 985 17/12/2012 S S
Water sample 992 18/12/2012 S S
Water sample 1004 19/12/2012 N/A N/A
Patient 1007 21/12/2012 R I
Patient 1008 31/12/2012 S S
Patient 1009 31/12/2012 S S
17
susceptibility to Imipenem and Meropenem. 5 mL of LB was inoculate with each
Pseudomonas strain and grown overnight at 37oC whilst shaking. These were diluted
down in LB to an OD of 0.2 at 600nm. 50 µL of each sample was then plated on a 96
well plate 50 µL of either Imipenem or Meropenem was added to a final
concentration of 0-16 µg/mL at OD of 0.08-0.13 or 0.5 McFarland units. After 24
hours at 37oC the plate was visually inspected and the concentration at which no
visible growth was taken as the MIC.
Growth Curves
5mL of Lysogeny Broth (LB) was inoculated with each P. aeruginosa strain and grown
overnight at 37oC whilst shaking at 200 rpm. Optical density (OD) readings of the
overnight culture were taken at 600 nm on an Eppendorf BioPhotometer plus
spectrophotometer. When OD readings where over 1, the overnight culture was
diluted down to an OD of <1. To gain the same amount of bacteria cells in each
sample, the sample with the highest OD was taken and then divided by the other
samples. All samples were then diluted 1:100 with LB and to a total volume of 1mL.
250µL was plated into a 96 well plate in and placed in a BMG Labtech FLUstar Omega
microplate reader, shaking at 37oC for 24 hours. OD measurements at 600nm were
taken every 10 minutes.
18
Killing Curves
Optical density (OD) readings of the overnight culture where taken at 600 nm on an
Eppendorf BioPhotometer plus spectrophotometer. When OD readings where over 1,
the overnight culture was diluted down to an OD of <1. To gain the same amount of
bacteria cells in each sample, the sample with the highest OD was taken and then
divided by the other samples. 100µL was plated into a 96 well plate and a 100µL of LB
with a concentration of 0.5, 1, 2.5, 5, 10x MIC of Meropenem or Imipenem was added
to each well. The 96 well plate was placed in a BMG Labtech FLUstar Omega
microplate reader, shaking at 37oC for 24 hours. OD measurements at 600nm were
taken every 10 minutes.
Optical Density (OD) to Colony Forming Units (CFU) conversion
5mL of LB was inoculated with each P. aeruginosa strain and grown overnight at 37oC
whilst shaking. 10mL of LB was inoculated with 100uL of overnight culture and
allowed to grow at 37oC whilst shaking. OD (600nm) readings were taken every 30
minutes and serial diluted down to 10-8 to original concentrations. 100 µL of 10-4-10-8
dilutions were plated out on LB agar plates at each time point. After 24 hours at 37oC
the amount of CFU were counted.

19
LDH assays
1mL of J774 macrophages were seeded at a concentration of 100,000 cells/mL into a
24 well plate 24 hours prior to infection with P. aeruginosa. 5mL of LB was inoculated
with each P. aeruginosa strain and grown overnight at 37oC whilst shaking. Overnight
cultures of P. aeruginosa were diluted 1:1 with LB and OD (600nm) measurements
were taken. These were diluted with colourless DMEM to give an multiplicity of
infection (MOI) of 10 by using the equation 3/OD to give the amount of µL of P.
aeruginosa per mL of colourless DMEM (3/OD=µL/mL). Old DMEM was removed and
J774 macrophages were washed with 1 mL PBS.1 mL of P. aeruginosa diluted in
colourless DMEM was added to each well of J774 macrophages. Plate was spun at
1000 rpm at room temperature for 5 minutes. At 0, 1, 2, 3 hours after infection with
P. aeruginosa 200 µL was taken from each well and transferred to a 96-well plate
which was spun at 100rpm for 5 minutes at room temperature. 100 µL from each well
was transferred to a fresh 96-well plate and stored at 4oC until measuring LDH
release. LDH release assay was carried out using a Takara LDH cytotoxicity detection
kit from Clontech. 11.25 mL of reagent A was mixed with 250 µL of reagent B by
inversion. 100µL of the mixture was place in each well. Absorbance was read at
600nm on a BMG Labtech FLUstar Omega microplate reader at 10, 20 and 30
minutes.

20
Attachment assays
1mL of J774 macrophages were seeded at a concentration of 100,000 cells/mL into a
24 well plate 24 hours prior to infection with P. aeruginosa. 5mL of LB was inoculated
with each P. aeruginosa strain and grown overnight at 37oC whilst shaking. Overnight
cultures of P. aeruginosa were diluted 1:1 with LB and OD (600nm) measurements
were taken. These were diluted with DMEM to give an multiplicity of infection (MOI)
of 10 by using the equation 3/OD to give the amount of µL of P. aeruginosa per mL of
DMEM (3/OD=µL/mL). Old DMEM was removed and J774 macrophages were washed
with 1 mL PBS. 1 mL of P. aeruginosa diluted in DMEM was added to each well of J774
macrophages. Plate was spun at 1000 rpm at room temperature for 5 minutes. Host
J774 macrophages were left for one hour after P. aeruginosa was added then washed
three time with PBS and lysed with 1mL of PBS+0.5% TX100. Each well was then
plated out at a dilution factor of 104 and incubated overnight at 37oC and the colonies
counted the next day.

21
Results
Minimum Inhibitory Concentration (MIC)
Table 1: MIC value according to BSAC
Table 2: MIC of Imipenem for the six P. aeruginosa isolates
1 µg/mL 2 µg/mL 4 µg/mL 8 µg/mL 16 µg/mL 985 992 1004 1007 1008 1009 Grey indicates visible growth
Table 3: MIC of Meropenem for the six P. aeruginosa isolates
1 µg/mL 2 µg/mL 4 µg/mL 8 µg/mL 16 µg/mL 985 992 1004 1007 1008 1009 Grey indicates visible growth
MIC Imipenem
(µg/ml) Meropenem (µg/ml)
Resistant (R) 8 8 Insensitive (I) 8 4 to 8 Sensitive (S) 4 2
22
Minimum Inhibitory Concentrations (MIC) show at what concentration of
antibiotic, in this case Meropenem and Imipenem, which inhibits the growth of
bacteria. To determine the MIC of the six clinical isolates of P. aeruginosa were grown
overnight in five different concentrations of each antibiotic. The five different
concentrations of antibiotic ranged for resistance (R) to susceptible (S) levels. The
MIC for P. aeruginosa according to the British Society of Antimicrobial Chemotherapy
(BSAC) for Imipenem and Meropenem are stated in table 1. For P. aeruginosa to be
resistant to either of these antibiotics they have to be able to show visible growth at 8
µg/mL. According to the testing done at the QE hospital all isolates except 1007 were
sensitive to both imipenem and meropenem and no MIC for isolate 1004 was
determined.
Table 2 and 3 show the MIC of all six P. aeruginosa isolates that were
determined at the beginning of this study. Table 2 shows that all six isolates, not only
1007, were in fact resistant to imipenem as they all showed visible growth at both 8
and 16 µg/mL. The MIC of meropenem is shown in table 3 and shows that all isolates
except 1004 were sensitive, not able to grow at 2 µg/mL. According to previous
testing at the QE hospital isolate 1007 should have been insensitive to Meropenem
but it was actually sensitive. Isolate 1004 illustrated high levels of resistance being
able to grown in 16 µg/mL of Meropenem. From this the MIC for all isolates except
1004 was 2 µg/mL of meropenem and for imipenem the MIC for all isolate was >16
µg/mL.
23
Growth Curves
OD
60
0n
m
OD
60
0n
m
Figure 2: Graphs showing the growth of the six P. aeruginosa isolates over a 24
period. All six isolates were grown in the same Lysis Broth (LB) and Dulbecco's
Modified Eagle's Medium (DMEM). Optical Density (OD) readings were taken at
600nm on a BMG Labtech FLUstar Omega microplate reader at 37oC. n=3 and the
error bars are standard deviations.
24
The six P. aeruginosa isolates were grown in LB broth for 24 hours with optical
density (600nm) reading taken every 10 minutes. All P. aeruginosa isolates had an
initial lag phase of 2 hours where the OD did not increase. After 2 hours the OD was
around 0.2 but then increased dramatically to its highest reading after 12 hours. At
12 hours the OD was 0.7 which was an increase of 0.5 OD units from the end of the
lag phase at 2 hours. After 12 hours there is no significant increase in the OD with the
readings staying between 0.55 and 0.7. The growth pattern for all six P. aeruginosa
isolates were alike with the lag phase from 0-2 hours followed by an exponential
growth phase for the next 10 hours and then reaching stationary phase after 12
hours.
Over the 24 hours that P. aeruginosa was grown in DMEM, which is the media
used in cell culture, the highest OD reading was 0.5 at around 18 hours. There was a
decrease with in the first two hours when the bacteria where in lag phase before they
started to proliferate. The largest increase is OD was within in the first 12 hours with
an increase from 0.2 OD to 0.45. After 12 hours the there was no significant increase
in OD readings showing that P. aeruginosa had reached stationary phase. Although it
appears there is a difference in growth between some isolates in DMEM this is only a
minimal difference of 0.1 OD units. Compared to the growth in LB the six isolates did
not proliferate as much in DMEM as the highest OD reached in DMEM was 0.45
compared to 0.7 in LB.

25
Sodium Benzoate Growth Curves
Figure 3: Sodium Benzoate Growth Curves. All six P. aeruginosa isolates were grown
for 23 hours in M9 Minimal Media with 0.1, 0.2 and 0.5% Sodium Benzoate as the
only carbon source. M9 Minimal Media with Glucose was used as a control, all OD
reading were taken at 600nm on a BMG Labtech FLUstar Omega microplate reader at
37oC. n=3 and the error bars are standard deviations.
The six P. aeruginosa isolates were grown in sodium benzoate as it is a
common ingredient in wound dressing that is applied to burns. All six P. aeruginosa
isolates were able to grow but not maintain that growth at 0.1, 0.2 and 0.5% sodium
benzoate when compared to the glucose control. At all different concentrations of
0 5 10 15 20 250.0
0.5
1.0
1.5
Glucose Control Growth Curve
Hours
OD
600
nm
985
992
1004
1007
1008
1009
0 5 10 15 20 250.0
0.2
0.4
0.6
0.8
0.2% Sodium Benzoate Growth Curve
Hours
OD
600
nm
985
992
1004
1007
1008
1009
0 5 10 15 20 250.0
0.2
0.4
0.6
0.8
0.1% Sodium Benzoate Growth Curve
Hours
OD
600
nm
985
992
1004
1007
1008
1009
0 5 10 15 20 250.0
0.2
0.4
0.6
0.80.5% Sodium Benzoate Growth Curve
Hours
OD
600
nm
9859921004100710081009

26
sodium benzoate all six P. aeruginosa isolates had an initial lag phase of around an
hour before the exponential growth phase between 1 and 3-4 hours. After around 3-4
hours there was a general decrease averaging a drop of 0.5 OD units at 0.1 and 0.2%
sodium benzoate in all samples expect in 1004. The isolate 1004 was able to increase
it OD units by 0.5 from the exponential growth phase to 23 hours. Interestingly at
0.5% sodium benzoate after the growth phase all six samples managed to maintain
their OD reading at a steady level up to 23 hours. Once again the exception was the
1004 isolate which increased it OD by 0.1.

27
Imipenem Killing Curves
Figure 4: Imipenem killing curves. All six P. aeruginosa isolates were incubated with
Imipenem at 0-20 times the MIC of meropenem (2 µg/mL). The isolates were
incubated at 37oC for at least 19 hours and OD readings were taken at 600nm. n=3
and the error bars are standard deviations.
0 5 10 15 20 250.0
0.5
1.0
1.5Imipenem Killing Curve Isolate 992
Hours
OD
600
nm
0
0.5
1
2.5
5
10
20
MIC
0 5 10 15 20 250.0
0.5
1.0
1.5
Imipenem Killing Curve Isolate 985
Hours
OD
600
nm
0
0.5
1
2.5
5
10
20
MIC
0 5 10 15 20 250.0
0.5
1.0
1.5
2.0Imipenem Killing Curve Isolate 1004
Hours
OD
600
nm
0
0.5
1
2.5
5
10
20
MIC
0 5 10 15 200.0
0.5
1.0
1.5
Imipenem Killing Curve Isolate 1007
Hours
OD
600
nm
00.512.551020
MIC
0 5 10 15 200.0
0.5
1.0
1.5Imipenem Killing Curve Isolate 1009
Hours
OD
600
nm
00.512.5510
20
MIC
0 5 10 15 200.0
0.5
1.0
1.5
2.0Imipenem Killing Curve Isolate 1008
Hours
OD
600
nm
0
0.5
1
2.5
5
10
20
MIC

28
The six P. aeruginosa isolates were grown in LB containing 1, 2, 5, 10, 20, 40
µg/mL of imipenem which is an antibiotic used to treat P. aeruginosa infections. All
six isolates with the exception of 1004 were able to proliferate and maintain that
proliferation for at least 19 hours at all concentration of imipenem. The growth
pattern for all six isolates was virtually identical with the exception of 1004. Within
the first two hours there was a dramatic increase in OD readings increasing from
around 0.6 to between 0.9 and 0.95. Isolates 985 and 992 then took 6 more hours to
reach their peak where as 1007, 1008 and 1009 all took 8 more hours to reach their
highest reading. After the 8 or 10 hour period for 985 and 992 or 1007, 1008 and
1009 respectively they had stable OD reading for the remaining time with no
significant increase or decrease except for 1008. Isolate 1008 had stable OD reading
between 10 and 13 hours but after 13 hours there was a slight decrease in OD
reading from 1.2 to 1.1. P. aeruginosa isolate 1004 had the same initial dramatic
increase in growth in the first two hours but then reached its peak after 6 hours. It
was able to grow between 6 and 11 hours then there was a decrease in OD indicating
a reduction in cell count. In all of the isolates at every concentration of imipenem
with the exception of 1004 and 1008 grew at the same rate regardless of the
concentration of imipenem. Isolate 1004 at 5µg/mL continued to increase it OD
reading until 9 hours reaching an OD of 1.3. Isolate 1008 at 10µg/mL showed a similar
pattern reaching its peak of 1.3 also after 9 hours. After around 9 hours there was a
steady decease in OD back down to the same level as all the other concentration in
the respective isolate.
29
Meropenem Killing Curves
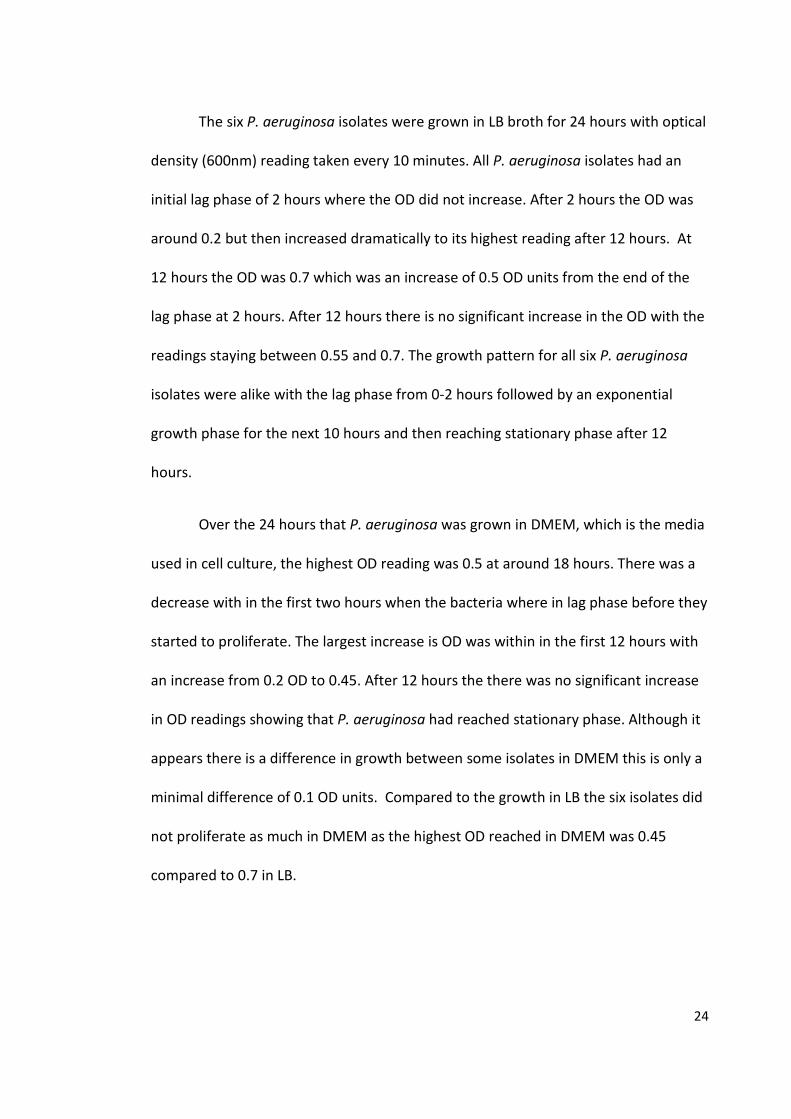
Figure 5: Meropenem killing curves. All six P. aeruginosa isolates were incubated
with meropenem at 0-10 times the MIC of Meropenem (2 µg/mL). The isolates were
incubated at 37oC for 20 hours and OD readings were taken at 600nm. n=3 and the
error bars are standard deviations.
0 5 10 15 200.0
0.5
1.0
1.5
Meropenem Killing Curve Isolate 992
Hours
OD
600
nm
0
0.5
1
2.5
5
10
MIC
0 5 10 15 200.0
0.5
1.0
1.5
Meropenem Killing Curve Isolate 985
Hours
OD
600
nm
0
0.5
1
2.5
5
10
MIC
0 5 10 15 200.0
0.5
1.0
1.5
Meropenem Killing Curve Isolate 1007
Hours
OD
600
nm
0
0.5
1
2.5
5
10
MIC
0 5 10 15 200.0
0.5
1.0
1.5
2.0Meropenem Killing Curve Isolate 1004
Hours
OD
600
nm
0
0.5
1
2.5
5
10
MIC
0 5 10 15 200.0
0.5
1.0
1.5
Meropenem Killing Curve Isolate 1009
Hours
OD
600n
m
0
0.5
1
2.5
5
10
MIC
0 5 10 15 200.0
0.5
1.0
1.5
Meropenem Killing Curve Isolate 1008
Hours
OD
600
nm
0
0.5
1
2.5
5
10
MIC

30
All six P. aeruginosa isolates were grown in LB containing 0, 1, 2, 5, 10, 20
µg/mL of meropenem for 20 hours. The 5 isolates that were classed as susceptible to
meropenem (985, 992, 1007, 1008 and 1009) showed very similar killing curve
profiles. All of these 5 isolates started out between OD of 0.5 and 0.6 and after 3-4
hours there was a slight increase in OD at 1 µg/mL. At all other concentrations of
meropenem there was no increase within the first 3-4 hours for 985, 992 and 1008
with the two other susceptible isolate 1007, 1009 only showing a minimal increase of
around 0.1 OD units. After 4 hours there was a slow and steady decrease in OD units
for all susceptible isolates at all concentrations of meropenem. At 1 µg/mL all isolates
managed to maintain a higher OD measurement throughout the time course ending
on average 0.13 OD units higher the 2 µg/mL. At the MIC of the susceptible isolates
(2µg/mL) there was no increase in OD units over the time course expect for 1008
where it was able to maintain OD readings slightly higher than 5-20 µg/mL but
significantly lower than at 1µg/mL. Between 5 and 20 µg/mL only 1007 and 1009
showed a minimal increase in OD readings within the first 4 hours but after that there
was a slow but steady decrease in OD units. The average loss between the start and
finish of all the susceptible isolates at 5, 10 and 20 µg/mL meropenem was 0.22 OD
units with 992 having the greatest loss of 0.29 OD units.
The resistant isolate 1004 showed a much different killing curve profile to the
susceptible isolates. At 1 µg/mL there was an increase in OD at the rate of 0 µg/mL
for the first 90 minutes. After that at 0 µg/mL 1004 continued increasing whereas at 1
µg/mL it plateau off before starting to decrease at 10 hours ending up at the same
level as 10 µg/mL. At 2 µg/mL 1004 began to increase for the first 5 hours followed by

31
a slight decline over the next 5 hours to the initial level but then dramatic increase to
1.4 at 20 hours. Between 5 and 20 µg/mL of Meropenem showed the same pattern
with a steady level up to 8 hours after which there was a small increase in OD units
over the next three hour. At 11 hours 1004 with 20 µg/mL meropenem starts to level
off whereas at 5 and 10 µg/mL there was a steady increase until the end of the time
course.
32
Killing Curve at Different Time Points with Meropenem
0 2 4 6 8 10 12 14 16 18 20 22 240.0
0.2
0.4
0.6
0.8
1.0
Isolate 1004 at MOI of 10
Hours
OD
600
nm
0 Hours
2 Hours
3 Hours
4 Hours
0 2 4 6 8 10 12 14 16 18 20 22 240.0
0.2
0.4
0.6
0.8
1.0Isolate 1004 at MOI of 1
Hours
OD
600n
m
0 Hours
2 Hours
3 Hours
4 Hours
MIC of 10 with Isolate 1004
MIC of 1 with Isolate 1004

33
0 2 4 6 8 10 12 14 16 18 20 22 240.0
0.2
0.4
0.6
0.8
1.0
Isolate 1008 at MOI of 10
Hours
OD
600
nm
0 Hours
2 Hours
3 Hours
4 Hours
0 2 4 6 8 10 12 14 16 18 20 22 240.0
0.2
0.4
0.6
0.8
1.0
Isolate 1008 at MOI of 1
Hours
OD
600
nm
0 Hours
2 Hours
3 Hours
4 Hours
MIC of 1 with Isolate 1008
MIC of 10 with Isolate 1008
34
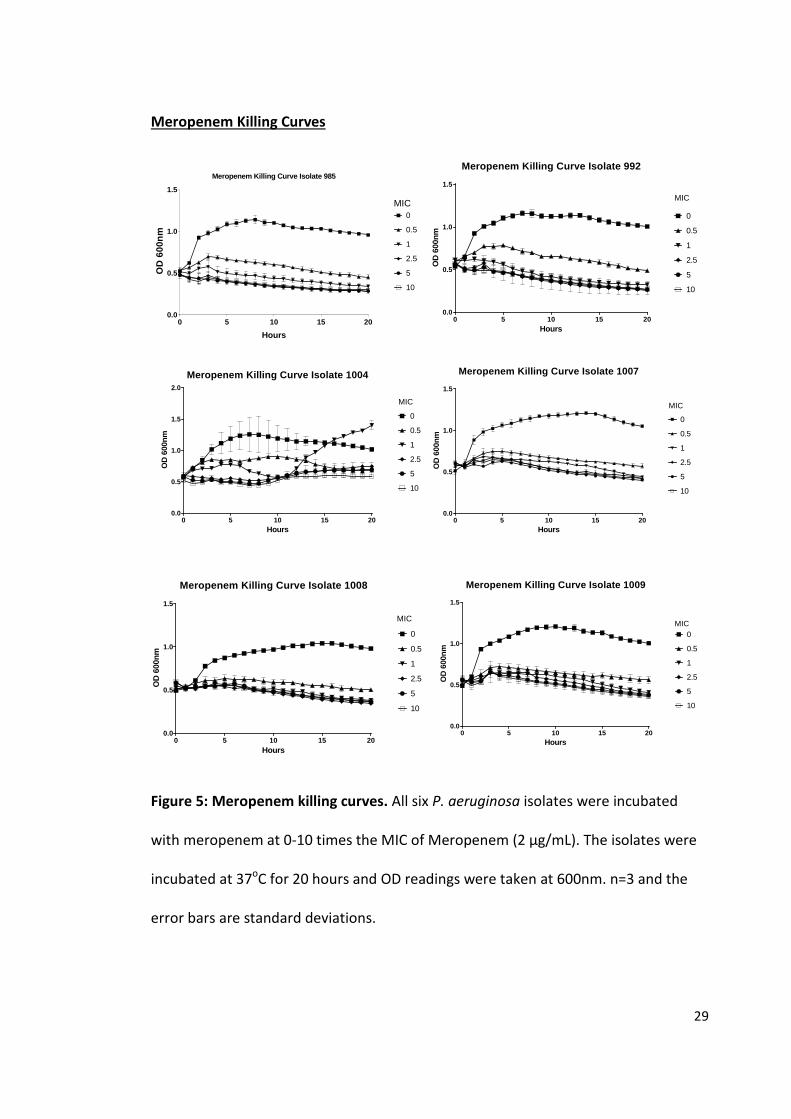
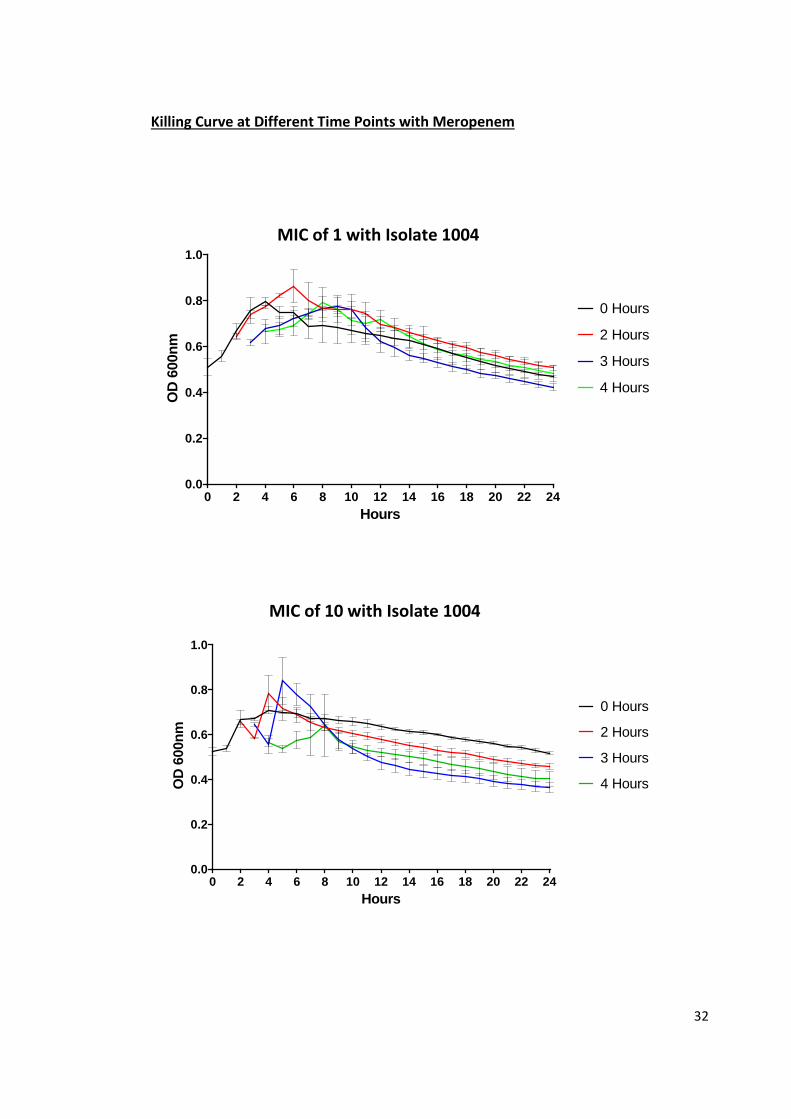
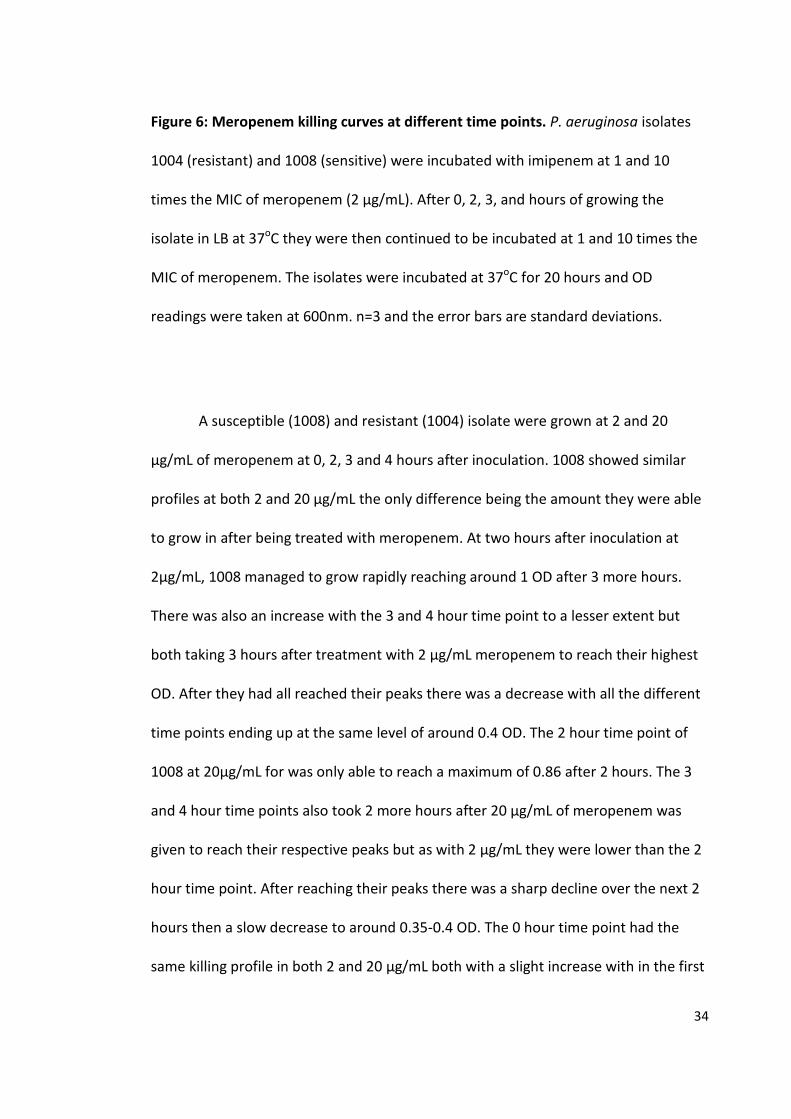
Figure 6: Meropenem killing curves at different time points. P. aeruginosa isolates
1004 (resistant) and 1008 (sensitive) were incubated with imipenem at 1 and 10
times the MIC of meropenem (2 µg/mL). After 0, 2, 3, and hours of growing the
isolate in LB at 37oC they were then continued to be incubated at 1 and 10 times the
MIC of meropenem. The isolates were incubated at 37oC for 20 hours and OD
readings were taken at 600nm. n=3 and the error bars are standard deviations.
A susceptible (1008) and resistant (1004) isolate were grown at 2 and 20
µg/mL of meropenem at 0, 2, 3 and 4 hours after inoculation. 1008 showed similar
profiles at both 2 and 20 µg/mL the only difference being the amount they were able
to grow in after being treated with meropenem. At two hours after inoculation at
2µg/mL, 1008 managed to grow rapidly reaching around 1 OD after 3 more hours.
There was also an increase with the 3 and 4 hour time point to a lesser extent but
both taking 3 hours after treatment with 2 µg/mL meropenem to reach their highest
OD. After they had all reached their peaks there was a decrease with all the different
time points ending up at the same level of around 0.4 OD. The 2 hour time point of
1008 at 20µg/mL for was only able to reach a maximum of 0.86 after 2 hours. The 3
and 4 hour time points also took 2 more hours after 20 µg/mL of meropenem was
given to reach their respective peaks but as with 2 µg/mL they were lower than the 2
hour time point. After reaching their peaks there was a sharp decline over the next 2
hours then a slow decrease to around 0.35-0.4 OD. The 0 hour time point had the
same killing profile in both 2 and 20 µg/mL both with a slight increase with in the first

35
4 hours followed by a slow decrease at the same rate as all other time points at their
respective meropenem concentrations.
1004 showed a similar pattern to 1008 with most of the different time points
having an initial increase followed by a slow decrease at both 2 and 20 µg/mL. At 2
µg/mL the 0, 2, 3 and 4 hour time point all reached their peak 4 hours after their
respective starting points. They all reached a similar level of between 0.8 and 0.85 OD
units before slowly declining to between 0.4 and 0.5. At 20 µg/mL the 0, 2 and 3 hour
time point all had an initial increase once incubation had begun. It took the 2 and 3
hour time points 2 hours to reach their peak but it took the 0 hour time point 4 hours.
After 0, 2 and 4 hour time points had reached their peak there was a slight decline
over the next two hours followed by steady loss in OD unit until the end of the time
course. The 4 hour time point showed an initial drop in OD units in the first 2 hours
then a small increase followed by the slow decline just like the other time points. All
time points at both concentrations 1004 ended up between 0.34 and 0.47 OD units.
36
FimH and P. aeruginosa Fluorescence
1 0mM
1mM
10 0 mM
10mM
1 mM
10 0 n M1 0 n M
1n M
Flu
ore
sc
en
ce
In
ten
sit
y
Flu
ore
sce
nce
Inte
nsi
ty
Figure 7: Fluorescence intensity of P. aeruginosa and the anti-adhesion molecule
FimH. All fluorescence readings were taken with an excitation wavelength of 355nm
and an emissions wavelength of 460nm. FimH was diluted from 10mM down to 1nM
in a 10 fold dilution. P. aeruginosa at 100% was an OD of 0.32 and was diluted down
to 0% with an OD of 0.23. n=3 and the error bars are standard deviations
37
The fluorescence intensity of the FimH anti adhesion molecule was tested on a
BMG FLOstar microplate reader. FimH was diluted to a concentration range of 10mM
to 1nM in PBS and the fluorescence intensity read by exciting at 355nm and emitting
at 460nm. Natural fluorescence produced by P. aeruginosa was also read at these
wave lengths as well to determine the level of back ground noise. Starting at an OD of
0.31 where P. aeruginosa was at 100% it was diluted down to 0% with an OD of 0.23.
The general trend of the FimH molecule is stable emission of 6000-7000 fluorescent
units (FU) from 1nm to 1mM. After 1mM there was a sharp increase up to 105
fluorescent units. P. aeruginosa shows a slow incline in FU from 4.8x 10³ to 6.2x 10³
between 0% (OD 0.23) and 80% (OD 0.29) where it then had a steep increase to 9.7x
103.

38
Attachment Assay
9 8 59 9 2
1 0 0 41 0 0 7
1 0 0 81 0 0 9
CF
U/m
L
Figure 8: Attachment assay of all six P. aeruginosa isolates. All isolates were
incubated with J774 macrophages at an MOI of 10 for 1 hour at 37oC. After washing
with PBS the amount that remained were plated out on LB agar and counted after
incubating for 24 hours at 37oC. n=3 and the error bars are standard deviations.
The six P. aeruginosa isolates were incubated with J774 macrophages for 1
hour. The average amount that remained after washing were measured and shown in
figure 8. The meropenem resistant isolate 1004 was able to attach significantly more
(p=0.00012), with almost double than any other isolate with 2.3 x10⁵ CFU/mL. There
was no difference between any of the 5 susceptible isolates with 992 and 1009 having
the second highest CFU count with 1.2 x10⁵ CFU/mL. The next was 1008 with 1 x10⁵
CFU/mL followed by 1007 at 0.8 x10⁵ CFU/mL and 985 having 0.4 x10⁵ CFU/mL.

39
LDH Release Assay
-100.00
-50.00
0.00
50.00
100.00
0.00 1.00 2.00 3.00% L
ysis
Hours
Lysis % at an MOI of 10
985
992
1004
1007
1008
1009
-30
-20
-10
0
10
20
30
0 1 2 3% L
ysis
Hours
Lysis % at an MOI of 10
985
992
1004
1007
1008
1009
-25.00
0.00
25.00
50.00
75.00
100.00
0 1 2 3
% L
ysis
Hours
Lysis % at an MOI of 1
985
992
1004
1007
1008
1009
A
B
C
40
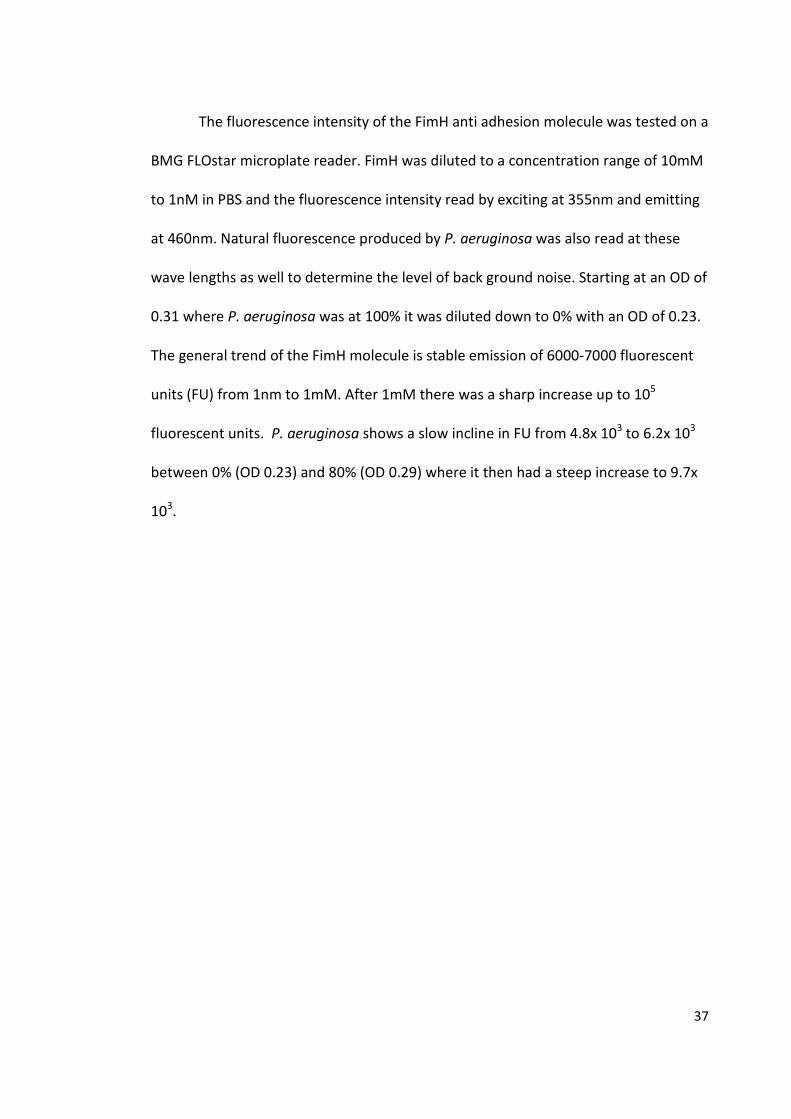
Figure 9: The percent of macrophage lysis over 3 hours at an MOI of 1 and 10. The
six P. aeruginosa isolates were incubated with J774 macrophages for 3 hours. Every
hour 200 µL of the supernatant was take, spun down and 100 µL taken and added to
100 µL of reagents from a Clontech LDH Cytotoxicity Test. The percent of lysis
compare to 100% lysis of macrophages with 1% TX-100 in DMEM was plotted. Graph
A and B are at an MOI of 10 and graph C at an MOI of 1. N=1
At an MOI of 10 over three hours for every isolate is hugely variable and show
no conclusive results. Graph A shows that 1007, 1008 and 1009 all have mostly
positive % lysis and 985, 992 and 1004 all have negative lysis percentages. The
general trend in graph A for all positive results is an increase over the first hour
followed by a decrease at 2 hours and then a slight increase at 3 hours. The negative
lysis all show an increase of lysis percent over 2 hours followed by a decrease at 3
hours. Graph B shows 1009, 1008 and 1007 having positive lysis and 985, 992 and
1004 varying between positive and negative lysis. 985, 992 and 1004 show an
increase with in the first hour followed by a decline in lysis at two hours and then an
increase at 3 hours. Isolate 1008 showed the opposite trend to 985, 992 and 1004
with a decrease at 1 hour then increasing at 2 hours followed by a decrease at 3 hour.
1007 showed an increase within the first hour then a slow decrease over the next two
hours. 1009 shows a similar trend to 1004 but has the same lysis percent from 2 to 3
hours. At an MOI of 1 (2 µg/mL) there is generally no change over the 3 hours for all
of the isolate except 1009. All isolates have a positive lysis percent between 0 and
90% at the initial time point and only 985 and 992 ending up after 3 hours having a
negative lysis percent. 1009 shows a significant different between it and all other
41
isolates lysising 90% of the macrophages at the initial time point followed by a decline
to 42% over the next hour. Between 1 and 2 hours 1009 plateaus and then declines to
25% after three hours which is close to the percent of lysis by isolate 1007.
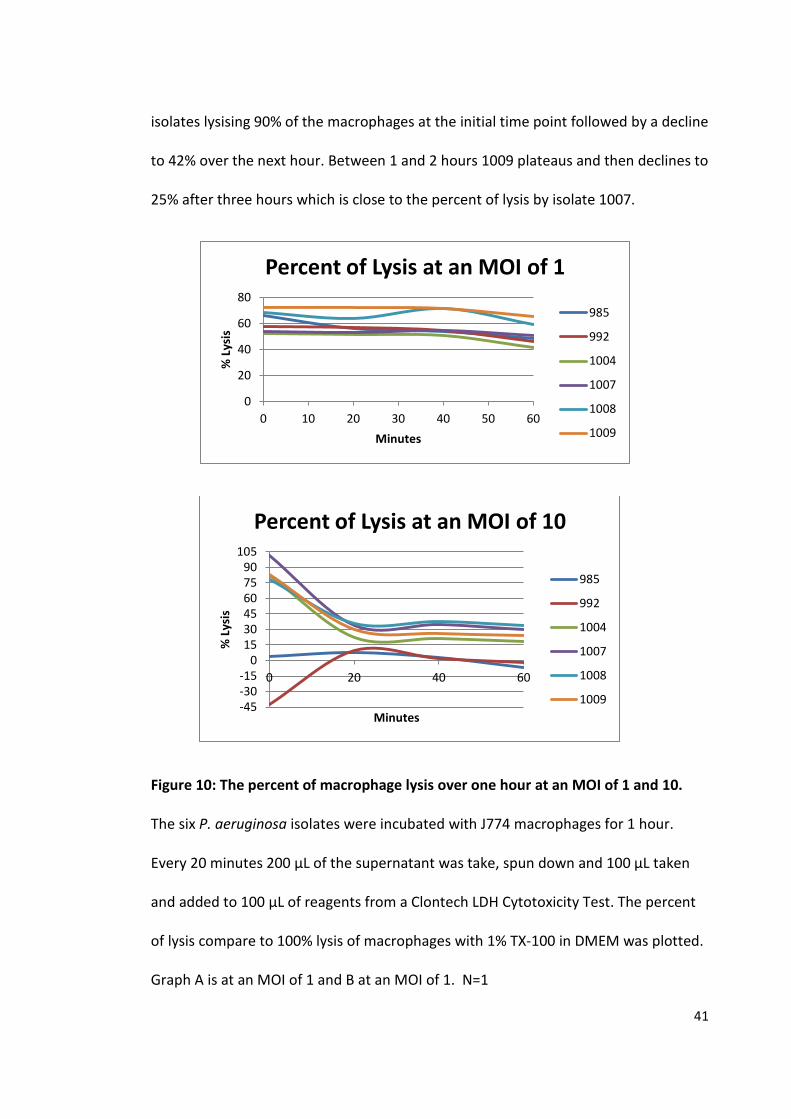
Figure 10: The percent of macrophage lysis over one hour at an MOI of 1 and 10.
The six P. aeruginosa isolates were incubated with J774 macrophages for 1 hour.
Every 20 minutes 200 µL of the supernatant was take, spun down and 100 µL taken
and added to 100 µL of reagents from a Clontech LDH Cytotoxicity Test. The percent
of lysis compare to 100% lysis of macrophages with 1% TX-100 in DMEM was plotted.
Graph A is at an MOI of 1 and B at an MOI of 1. N=1
0
20
40
60
80
0 10 20 30 40 50 60
% L
ysis
Minutes
Percent of Lysis at an MOI of 1
985
992
1004
1007
1008
1009
-45-30-15
0153045607590
105
0 20 40 60
% L
ysis
Minutes
Percent of Lysis at an MOI of 10
985
992
1004
1007
1008
1009

42
Over the period of an hour at an MOI of 1 there is no significant change in the
lysis percent. All isolates start between 52 and 73% and finish between 41 and 65%
with an average drop of only 10%. The largest percent drop for all isolates is between
40 and 60 minutes with the exception of 985 which had its largest drop between 0
and 20 minutes. At an MOI of 10 there is a dramatic change to all isolates over an
hour. Isolates 1004, 1007, 1008 and 1009 all have positive percent of macrophage
lysis where as 985 and 992 vary between positive and negative lysis percentages. All
the positive lysis percentages show the same pattern with a massive drop within the
first 20 minutes followed a levelling off over the next 40 minutes. On average there is
a 55% decrease in all isolates with a positive lysis percent. The four positive percent
isolates start between 77 and 101% and all finish between 17 and 33%. The trend for
992 has an increase of 52% within the 20 minutes followed a minimal decline over the
next 40 minutes. Isolate 985 only varies 10% over the course of an hour.
43
Morphology
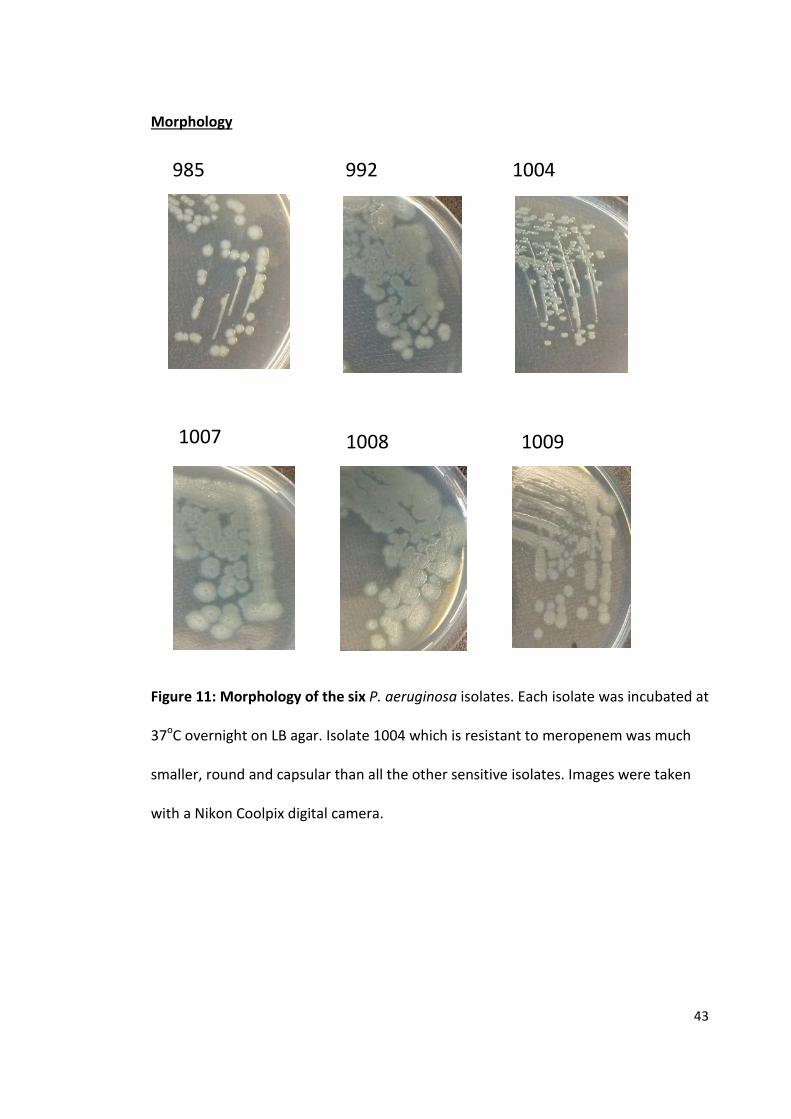
Figure 11: Morphology of the six P. aeruginosa isolates. Each isolate was incubated at
37oC overnight on LB agar. Isolate 1004 which is resistant to meropenem was much
smaller, round and capsular than all the other sensitive isolates. Images were taken
with a Nikon Coolpix digital camera.
1004 992 985
1007 1009 1008
44
All of the meropenem sensitive isolates except 985 have identical
morphologies. They are large, flat and appear to spread rapidly indicated by central
darker area with a pale ring surrounding it. Isolate 985 has an intermediate
morphology between the resistant isolate 1004 and the sensitive isolates. Each
colony is smaller and less spread out then the sensitive isolates but not a small and
round as the resistant isolate. The resistant isolate 1004 has small, capsular colonies
that do not swarm out from the centre and have a more viscous texture. All isolates
produce a bluish green colour once allowed to grow for around 24 hours.

45
Discussion
MIC
Six clinical P. aeruginosa isolates were obtained from the Queen Elizabeth
hospital in Birmingham. These isolates were taken from water and from one patient
undergoing antibiotic treatment. Isolates 992 and 1004 were taken from water and
985, 1007, 1008 and 1009 were taken at different times throughout a two week
antibiotic treatment. The reason P. aeruginosa was tested against imipenem and
meropenem for their MIC was that they showed variability in their MIC when tested
at the Queen Elizabeth hospital. To test if there was any difference in population
dynamics a resistant and susceptible isolate has to be found. Unfortunately all six
isolates were determined to be resistant to imipenem so differences between
resistance and susceptible isolates could not be compared. Meropenem showed that
1004 was resistant (> 8 µg/mL) whereas all other isolates were susceptible (2 µg/mL)
so throughout this study 1004 was used as the resistant isolate. It was interesting to
see that all the isolates tested sensitive to imipenem at the (QE) but were resistant
when test at the beginning of this study. Isolate 1007 was shown to be resistant to
imipenem and insensitive to meropenem at the QE but was sensitive to meropenem
when tested during this study. One reason that could account for this difference in
sensitivity is that at the QE the P. aeruginosa isolates were tested using the disc
diffusion method whereas during this study the MIC was determined by liquid broth
method.

46
Growth Curves
To understand the rate at which the six different isolates grow, growth curves
were produced using Lysogeny Broth (LB) and Dulbecco's Modified Eagle's Medium
(DMEM). Optical density (OD) readings at 600nm can show the rate at which P.
aeruginosa is proliferating as the number as the number of bacteria increase so will
the OD readings. There was no difference between the growth rates of the six isolates
of P. aeruginosa. This shows that even with meropenem resistance (1004) P.
aeruginosa was not able to proliferate faster than any of the other isolates. Having
antibiotic resistance does not benefit the bacterium in terms of growth rate
compared to the other isolates which were susceptible to meropenem. If a bacterium
was able to proliferate quicker whilst infecting its host it would be far more likely to
survive and spread. The proliferation rate has to be controlled as if it was too quick
then the bacterium may destroy the host before spreading. It is controlled depending
on how much nutrients are available in the environment.
Compared to LB the growth rate of P. aeruginosa in DMEM was much slower
and did not result in a dramatic increase in OD. P. aeruginosa was grown in DMEM to
show the extent of proliferation as this media was used in LDH release assay and
attachment assay over a time period. For that reason it was useful to know how P.
aeruginosa responded to growth in DMEM. The largest increase in both of the types
of media was between 2 and 12 hours showing that the amount of time it takes P.
aeruginosa to proliferate is the same but the amount of bacteria is vastly different.

47
Sodium benzoate was used as the only carbon source that was added to
minimal M9 media to measure the growth of P. aeruginosa. This was to replicate the
condition the bacteria may have to grow under when in contact with many wound
dressings. It is clear the all six P. aeruginosa isolates were able to utilise the glucose in
the control far more effectively as after the initial exponential growth there was a
continuous increase in OD readings. One interesting finding was that at 0.5% sodium
benzoate after the exponential growth phase there was no significant decrease in OD
reading and therefore the amount of bacteria stayed constant. Both 0.1 and 0.2%
showed a decrease in OD reading after the growth phase and 0.5% was expected to
show a decrease as well.
Killing Curves
Killing curves were used to show the effect each of the antibiotics, imipenem
and meropenem, had on the six P. aeruginosa isolates. All of the isolates were classed
as resistant to imipenem but only one (1004) was resistant to meropenem. All other
isolates were classed as sensitive to meropenem as the MIC was 2 µg/mL. This was
then taken as the MIC for both meropenem and imipenem when testing the
antibiotics on P. aeruginosa. The imipenem killing curves show that every isolate was
able proliferate equally well as when no imipenem was present. This shows that all
isolates have high levels of resistance to imipenem as even at 20 times the MIC (40
µg/mL) the rate of proliferation did not change. As all isolate were classed as resistant
to imipenem this result is not surprising and support the claim that the isolates are
48
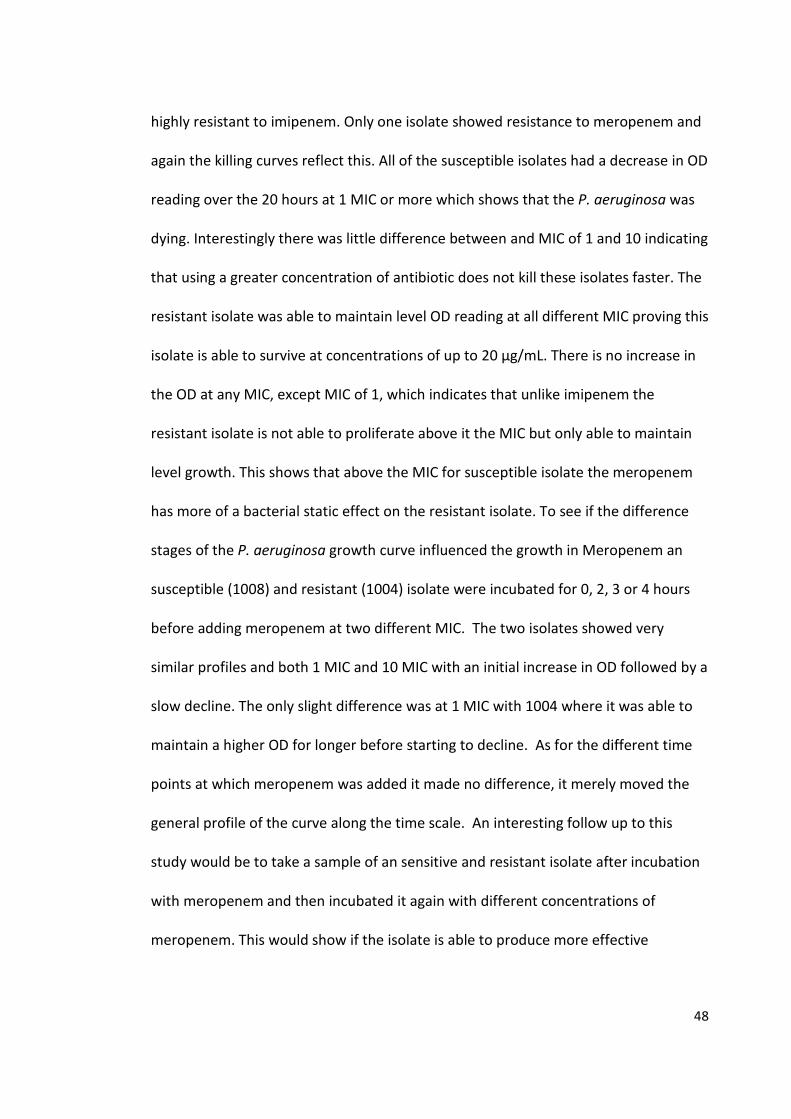
highly resistant to imipenem. Only one isolate showed resistance to meropenem and
again the killing curves reflect this. All of the susceptible isolates had a decrease in OD
reading over the 20 hours at 1 MIC or more which shows that the P. aeruginosa was
dying. Interestingly there was little difference between and MIC of 1 and 10 indicating
that using a greater concentration of antibiotic does not kill these isolates faster. The
resistant isolate was able to maintain level OD reading at all different MIC proving this
isolate is able to survive at concentrations of up to 20 µg/mL. There is no increase in
the OD at any MIC, except MIC of 1, which indicates that unlike imipenem the
resistant isolate is not able to proliferate above it the MIC but only able to maintain
level growth. This shows that above the MIC for susceptible isolate the meropenem
has more of a bacterial static effect on the resistant isolate. To see if the difference
stages of the P. aeruginosa growth curve influenced the growth in Meropenem an
susceptible (1008) and resistant (1004) isolate were incubated for 0, 2, 3 or 4 hours
before adding meropenem at two different MIC. The two isolates showed very
similar profiles and both 1 MIC and 10 MIC with an initial increase in OD followed by a
slow decline. The only slight difference was at 1 MIC with 1004 where it was able to
maintain a higher OD for longer before starting to decline. As for the different time
points at which meropenem was added it made no difference, it merely moved the
general profile of the curve along the time scale. An interesting follow up to this
study would be to take a sample of an sensitive and resistant isolate after incubation
with meropenem and then incubated it again with different concentrations of
meropenem. This would show if the isolate is able to produce more effective

49
antibiotic resistance than is already has or if there is a maximum level of resistance it
can obtain.
FimH and P. aeruginosa Fluorescence
The FimH anti-adhesion molecule that was tested during this study was 4-
methylambelliferyl-α-D-monopyranoside. This molecule has fluorescence properties
which were used to see if the molecule was visible at different concentrations.
Unfortunately because P. aeruginosa has such a high fluorescent intensity at an OD of
0.3 there would be overlap between P. aeruginosa and the FimH molecule if the OD
of P. aeruginosa was increased. From 1nM to 1mM of FimH there is no significant
difference between the fluorescent intensity. This means that at an excitation of 355
nm and emission at 460 nm the difference between 1 nM and 1 mM cannot be
distinguished. The emission wavelength that was used in the study is much higher
than the optimal wave length (375 nm) of this FimH compound. When read at 374nm
there was significant difference between 1 mM to 1µM but anything lower shows no
significant difference. At all concentrations of FimH read at 374nm the fluorescent
intensities were significantly lower than at 460nm. P. aeruginosa was not measured
at 374nm but all concentrations of FimH at 374 nm had lower intensity than at P.
aeruginosa at 460nm. The measurements taken at 374 nm where done on a different
more advanced microplate reader which could account for these differences in
fluorescence intensities.
50
Attachment
These results show that the meropenem resistant isolate was able to attach
significantly more to macrophages compared to all the other sensitive isolates.
Although this assay was to measure the attachment of P. aeruginosa to macrophages
it cannot be determined that P. aeruginosa was being phagocytosised rather than P.
aeruginosa invading the macrophages. The mechanisms that are used in bacterial
invasion compared to attachment of P. aeruginosa are very similar and would need
further investigation to understand the exact mechanisms. To see if the FimH
functions as an anti-adhesion molecule, without using fluorescence to detect it, an
attachment assay in the presences of the FimH molecule could be used. Although
using the current microplate reader used in this study the difference between
concentrations could not be determined using an attachment assay in the presence of
FimH but by plating out all unbound P. aeruginosa would circumvent this problem. It
would also be interesting to see the level of attachment using epithelia cells. During a
P. aeruginosa infection the bacterium would come into contact and attach to
epithelia cells as part of the initial stages of infection. The main idea behind anti-
adhesion therapy is to stop this initial attachment and therefore help prevent the
spread of the bacteria. By stopping the attachment of the bacteria to epithelia cells
the bacteria would not be able to gain as much nutrients from the host cells as direct
contact between P. aeruginosa and the host is need to extract optimal nutrient levels.
This would mean P. aeruginosa could not proliferate as much and the rate at which
the infection spreads would be slowed down. This would allow for the body’s immune
system to have a higher chance of clearing the infection.

51
LDH
Lactate dehydrogenase (LDH) is an enzyme that is released when
macrophages are lysed. To understand if during a P. aeruginosa infection the bacteria
are able to overcome the hosts natural defence, the immune system, LDH release
assay were performed. The test works by reducing NAD+ to NADH/H+ through the
LDH catalyzed conversion of lactate to pyruvate. Diaphorase is a catalyst in the LDH
Cytotoxicity Detection Kit which transfers the H/H+ from NADH/H+ to the tertazolium
salt INT, reducing it to a formazan dye which is red in colour. The optimal wavelength
for measuring this colourmetic assay is at 500 nm but when initial absorbance reading
were taken at this wavelength the values rapidly reached 2 at which point there is no
direct correlation between LDH release and the level of absorbance. For this reason
all readings were taken at 600 nm as there is minimal interference of the tertazolium
salt INT and the formazan dye is still visible.
Two separate experiments were performed at an MOI of 10 over three hours.
During both experiment four out of the six isolate produce negative lysis percentages
although isolate 1007 had a very minimal negative lysis percentage. This indicates
that compare to a negative control significantly less macrophage underwent lysis
when infected with isolates 985, 992 and 1004. Graph A in figure 9 shows that this
negative lysis was continuous where as graph B shows variation over the three hours.
Interestingly between the start and finish of the three hours there is only a maximum
of and 18% difference showing that although there was massive variation during one
experiment there was little change in the lysis percentage. At an MOI of 1 over three

52
hours there was also minimal difference in lysis percentage with all isolates except
1009 having <25% difference. One interesting difference between and MOI of 10 and
1 is that there are less negative values at an MOI of 1. This could indicate that at a low
MOI the P. aeruginosa has less of an effect on macrophages releasing less LDH than
macrophages in the negative control.
The level of LDH release was also measure over an hour time period to see
how quickly the P. aeruginosa have an effect on macrophages. At an MOI of 1 there is
a little difference over the one hour period with all isolates having <18% difference in
lysis. With an MOI of 10 the macrophage experienced a massive drop within the first
20 minutes of lysis percent for isolates 1004, 1007, 1008, 1009. After 20 minutes
there is no variation over the next 40 minutes indicating that as soon as the P.
aeruginosa is introduced there is a high percent of lysis. This initial high lysis
percentage was also seen at an MOI of 1 but it was maintained throughout the hour
where as at an MOI of 10 there was a significant drop within the first 20 minutes. The
difference between the initial lysis percentages in the long (3 hours) and short (1
hour) infection period shows that optimisation of the protocol is necessary in order to
obtain reproducible results. To get a clearer picture of what happens to macrophages
a longer time course would be needed.

53
Conclusion
Anti-adhesion therapy is a potentially a new method of treating infections
caused by pathogenic bacteria. Antibiotic treatment can lead to bacteria evolving
resistance to such molecules much faster than new ones are discovered. Anti-
adhesion therapy has the potential to reduce the evolution of resistance by putting
the bacterial pathogen under little or no selective pressure allowing the host’s
immune system to combat the infection. To assess the population and evolutionary
dynamics of bacteria during anti-adhesion therapy six clinical isolates of
Pseudomonas aeruginosa were obtained from the QE hospital in Birmingham.
The isolates showed varying levels of resistance to imipenem and meropenem
when tested at the QE with isolate 1007 being resistant to imipenem and insensitive
to meropenem. When tested during this study, all isolates were found to be resistant
to imipenem and all except isolate 1004 were sensitive to meropenem. When grown
in LB all isolates proliferated at the same rate regardless of their antibiotic
susceptibility. As all isolates were resistant to imipenem it was no surprise that they
were all able to grow at the same rate when incubated with varying level of
imipenem. When the isolates were incubated with different concentrations of
meropenem only the resistant isolate (1004) was able to maintain level OD readings
over the 20 hour period. All susceptible isolates showed a decrease in OD indicating
they were being killed by the antibiotic.
To understand how Pseudomonas aeruginosa interacts with the immune
system which is a vital part in the elimination of infections the six isolates where

54
incubated with J774 macrophages. The level of attachment and lysis was measured
using an attachment assay and LDH release assay. The attachment measured the
amount of bacteria that are able to become attached to the macrophages but does
not shows if the bacteria are binding to the macrophages or the macrophages are
phagocytosing the bacteria. The assay showed that double the amount of
meropenem resistant isolate attached compare to all other isolates. The LDH release
assay measured the level of macrophage lysis over a 3 hour and 1 hour period. The
level of lysis fluctuated over the three hours but there was only a maximum
difference of 25% in the level of lysis. This showed that at both an MOI of 1 and 10
there is no change in the amount of lysis and further times should be investigated to
gain a more detailed analysis.
Unfortunately the fluorescence FimH anti-adhesion molecule was not able to
be measure on the micro plate reader used in this study. The emissions wavelength
incorporated into the micro plate reader was at 460 nm instead of 375 nm which is
the optimal wavelength of the FimH molecule. This meant that any concentrations
below 1mM were not able to be distinguished from each other. The fluorescent
intensity of P. aeruginosa was too intense at this emission wavelength and even at a
low OD of 0.3 the fluorescent intensity was around the same level as the FimH
molecule at high concentrations. This meant that the anti-adhesion parameter could
not be assessed but experimental data for the other parameters such as growth and
killing rate and phagocyte interactions can be to improve mathematical models.

55
References
Almant M, Moreau V, Kovensky J, Bouckaert J, Gouin SG, (2011) Clustering of
Escherichia coli type-1 fimbrial adhesins by using multimeric heptyl α-Dmannoside
probes with a carbohydrate core. Chemistry; 17:10029-38.
Anderson BN, Ding AM, Nilsson LM, Kusuma K, Tchesnokova V, Vogel V, (2007). Weak
rolling adhesion enhances bacterial surface colonization. J Bacteriol; 189:1794-802.
Birnbaum J, Kahan FM, Kropp H, MacDonald JS, (1985). Carapenems, new class of
beta-lactam antibiotics. Discovery and development of imipenem/cilastatin. Am J
Med; 78(6A):3-21.
Boeser KD, (2008) Are all carbapenems the same? PharmD Infectious Disease News.
Cambray G, Guerout AM, and Mazel D. (2010). Integrons. Annu. Rev. Genet; 44: 141–
166.
Chemani C, Imberty A, de Bentzmann S, Pierre M, Wimmerová M, Guery BP, Faure K.
(2009). Role of LecA and LecB lectins in Pseudomonas aeruginosa-induced lung injury
and effect of carbohydrate ligands. Infect Immun; 77:2065-75.
Drissi M, Ahmed Z B, Dehecq B, Bakour R, Plesiat P and Hocquet D. (2008). Antibiotic
susceptibility and mechanisms of -lactam resistance among clinical strains of
Pseudomonas aeruginosa: first report in Algeria. Med. Mal. Infect; 38: 187–191.

56
El Gamal M I, and Oh CH. (2010). Current Status of carbapenem anti-biotics. Curr.
Top. Med. Chem; 10: 1882–1897.
Gupta V. (2008). Metallo β-lactamases in Pseudomonas aeruginosa and Acinetobacter
species. Expert Opin. Investig. Drugs; 17: 131–143.
Han Z, Pinkner JS, Ford B, Chorell E, Crowley JM, Cusumano CK, (2012). Lead
optimization studies on FimH antagonists: discovery of potent and orally bioavailable
ortho-substituted biphenyl mannosides. J Med Chem; 55: 3945-59.
Hartmann M, Papavlassopoulos H, Chandrasekaran V, Grabosch C, Beiroth F,
Lindhorst TK, (2012). Inhibition of bacterial adhesion to live human cells: activity and
cytotoxicity of synthetic mannosides. FEBS Lett; 586:1459-65.
Hubbard LL, Wilke CA, White ES, Moore BB. (2011). PTEN limits alveolar macrophage
function against Pseudomonas aeruginosa after bone marrow transplantation. Am J
Respir Cell Mol Biol; 45:1050-8
Jiang X, Abgottspon D, Kleeb S, Rabbani S, Scharenberg M, Wittwer M, (2012).
Antiadhesion therapy for urinary tract infections--a balanced PK/PD profile proved to
be key for success. J Med Chem; 55:4700-13.

57
Jones RN. (1998). Important and emerging β-lactamase-mediated resistances in
hospital-based pathogens: the Amp C enzymes. Diagn. Microbiol. Infect. Dis; 31: 461–
466.
Jones RN, Stilwell M G, Rhomberg PR, and Sader HS. (2009). Antipseudomonal activity
of pipera-cillin/tazobactam: more than a dec-ade of experience from the SENTRY
Antimicrobial Surveillance Program (1997–2007). Diagn. Microbiol. Infect. Dis; 65:
331–334.
Krachler AM, Orth K. (2013).Targeting the bacteria-host interface Strategies in anti-
adhesion therapy. Virulence; 4: 284–294
Klein T, Abgottspon D, Wittwer M, Rabbani S, Herold J, Jiang X, (2010). FimH
antagonists for the oral treatment of urinary tract infections: from design and
synthesis to in vitro and in vivo evaluation. J Med Chem; 53:8627-41.
Livermore DM. (1992). Interplay of impermeability and chromosomal -lactamase
activity in imipenem- resistant Pseudomonas aeruginosa. Antimicrob. Agents
Chemother; 36: 2046–2048.
Loveday H.P. et al. (2014). Association between healthcare water systems and
Pseudomonas aeruginosa infections: a rapid systematic review. The Journal of
hospital infection; 86:7–15.
58
Lovewell RR, Patankar YR and Berwin BL. (2014). Mechanisms of Phagocytosis and
Host Clearance of Pseudomonas aeruginosa. American journal of physiology. Lung
cellular and molecular physiology.
Morita Y, Tomida J and Kawamura Y. (2014). Responses of Pseudomonas aeruginosa
to antimicrobials. Frontiers in microbiology; 4: 4422.
Okamoto, K., Gotoh, N., and Nishino, T. (2002). Alterations of susceptibility of
Pseudomonas aeruginosa by over-production of multidrug efflux sys-tems, MexAB-
OprM, MexCD-OprJ, and MexXY/OprM to carbapenems: substrate specificities of the
efflux sys-tems. J. Infect. Chemother; 8: 371–373.
Pai H, Kim J, Kim J, Lee JH, Choe KW and Gotoh N. (2001). Carbapenem resistance
mechanisms in Pseudomonas aeruginosa clinical isolates. Antimicrob. Agents
Chemother; 45: 480–484.
Papp-Wallace KM, Endimiani A, Taracila MA, Bonomo RA. (2011). Carbapenems: Past,
Present, and Future. Antimicrob Agents Chemother; 55 :4943-60
Pinkner JS, Remaut H, Buelens F, Miller E, Aberg V, Pemberton N, (2006). Rationally
designed small compounds inhibit pilus biogenesis in uropathogenic bacteria. Proc
Natl Acad Sci USA; 103:17897-902
Poole, K. (2004). “Efflux pumps,” in Pseudomonas, Vol. 1. Genomics, life style and
molecular architecture; 635–674.
59
Poole, K. (2007). Efflux pumps as antimi-crobial resistance mechanisms. Ann. Med;
39: 162–176.
Poole, K. (2011). Pseudomonas aeruginosa: resistance to the max. Frontiers in
microbiology; 2:65.
Queenan AM and Bush K. (2007). Carbapenemases: the versatile -lactamases. Clin.
Microbiol. Rev; 20: 440–458.
Radin NS, (2006). Preventing the binding of pathogens to the host by controlling
sphingolipid metabolism. Microbes Infect; 8:938-45;
Salabi AE, Toleman MA, Weeks J, Bruderer T, Frei R and Walsh TR. (2010). First report
of the metallo- β-lactamase SPM-1 in Europe. Antimicrob. Agents Chemother; 54:582.
Scharenberg M, Schwardt O, Rabbani S, Ernst B, (2012). Target Selectivity of FimH
Antagonists. J Med Chem; 55:9810-6;
Schurek KN,Breidenstein EBM andHancock REW.(2012).Pseudomonas aeruginosa: a
persistent pathogen in cystic fibrosis and hospital-associated infections in Antibiotic
Discovery and Development; 1 :679–715.
Svensson A, Larsson A, Emtenäs H, Hedenström M, Fex T, Hultgren SJ, (2001). Design
and evaluation of pilicides: potential novel antibacterial agents directed against
uropathogenic Escherichia coli. Chembiochem; 2:915-8;

60
Svensson M, Frendeus B, Butters T, Platt F, Dwek R, Svanborg C. (2003) Glycolipid
depletion in antimicrobial therapy. Mol Microbiol; 47:453-61
Tomas M, Doumith M, Warner M, Turton JF, Beceiro A, Bou G, Livermore DM, and
Woodford N. (2010). Efflux pumps, OprD porin, AmpC -lactamase, and multiresist-
ance in Pseudomonas aeruginosa isolates from cystic fibrosis patients. Antimicrob.
Agents Chemother; 54:2219–2224.
Trias J, and Nikaido H. (1990). Outer membrane protein D2 catalyzes facilitated
diffusion of carbapenems and penems through the outer membrane of Pseudomonas
aeruginosa. Antimicrob. Agents Chemother; 34: 52–57.
Vettoretti L, Floret N, Hocquet D, Dehecq B, Plesiat P, Talon D and Bertrand X. (2009).
Emergence of extensive-drug-resistant Pseudomonas aeruginosa in a French
university hos-pital. Eur. J. Clin. Microbiol. Infect. Dis; 28: 1217–1222.
Villegas MV, Lolans K, Correa A, Kattan JN, Lopez JA and Quinn JP. (2007). First
identification of Pseudomonas aeruginosa isolates producing a KPC-type carbapenem-
hydrolyzing β-lactamase. Antimicrob. Agents Chemother; 51: 1553–1555.
Walsh TR. (2010). Emerging carbapenemases: a global perspective. Int. J. Antimicrob.
Agents; 36: 8–14.
Walsh TR, Toleman MA, Poirel L and Nordmann P. (2005). Metallo-β-lactamases: the
quiet before the storm? Clin. Microbiol. Rev; 18: 306–325.

61
Wolter DJ, Kurpiel PM, Woodford N, Palepou MF, Goering RV and Hanson ND (2009).
Phenotypic and enzymatic comparative analysis of the novel KPC variant KPC-5 and its
evolutionary variants, KPC-2 and KPC-4. Antimicrob. Agents Chemother; 53: 557–562.
Yuehuei H, Dickinson RB, Doyle RJ. (2000). Molecular Basis of Bacterial Adhesion. In:
Yuehuei H. An, Friedman RJ, eds. Handbook of Bacterial Adhesion Principles, Methods,
and Applications: Springer; 29-41.
Zhao WH, and Hu ZQ. (2010). Β-lactamases identified in clinical isolates of
Pseudomonas aeruginosa. Crit. Rev. Microbiol; 36: 245–258.
Zilberberg MD, Chen J, Mody SH, Ramsey AM and Shorr AF. (2010). Imipenem
resistance of Pseudomonas in pneumonia: a systematic literature review. BMC Pulm.
Med; 10: 45

62
Molecular and Cellular MRes Project 2
The purification and crystallization of five Bdellovibrio proteins used
during attack phase

63
Abstract
Bdellovibrio bacteriovorus are small highly motile predatory bacteria capable
of invading Gram negative bacteria. Once inside the host Bdellovibrio use the nucleic
acids, proteins and other macromolecules to grow and then divides depending how
much nutrients are available. It then exits the host and returns to hunting down its
next prey. During this attack phase when Bdellovibrio comes into contact with its prey
certain proteins are up regulated. Some of these proteins are located at the invading
nose of Bdellovibrio and five of these proteins; Bd 2093, 1482, 3099, 3100 and RomR
are examined in this study. The aim of this project was to purify and concentrate
these five proteins in order produced crystals for x-ray diffraction. Bd 1482, 3099,
3100 and RomR were produced in this study but only RomR was soluble. All the other
were insoluble proteins but Bd 3099 was able to be refolded in both Tris and CHES
buffer and purified to 20 and 40 mg/mL respectively. Bd 3099 was also purified to
around 7 mg/mL using an off column purification protocol. Bd 1482 and 3100 were
refold in a sodium acetate (NaAc) but was not purified. RomR was purified using
affinity chromatography to around 20 mg/mL to create a crystal of a high enough
standard for x-ray diffraction which diffracted at around 9 angstroms.

64
Introduction
Aims and Objectives
The overall aim of this study was to crystallise Bdellovibrio proteins that are
used during predation and gain structural knowledge through x-ray crystallography. In
order to create protein crystals, the protein has to be at a high concentration, at least
10mg/ml and at least 99% pure. This means cloning the correct gene, transforming it
into an E. coli expression strain and then expressing the protein. The protein then has
to be purified, concentrated and crystallised. This study examines five different
Bdellovibrio proteins: Bd 1482, 2093, 3099, 3100 and RomR and how well they are
able to be purified and crystallised. Each of these proteins are thought to be involved
in the predatory actions of Bdellovibrio, either sensing prey or attaching to them, so
gaining structural information could prove to be very valuable. Bdellovibrio has the
potential to be a “living antibiotic”, but only if we can control it and the structures of
these proteins may be able to shed light on this problem. These proteins may also
have homologous proteins in other pathogenic organisms and understanding the way
these proteins function may help the fight against these organisms and even reduce
antibiotic resistance.
65
Bdellovibrio Lifecycle
Bdellovibrio bacteriovorus are small highly motile δ-proteobacteria capable of
killing other Gram negative bacteria. They accomplish this by preying on Gram
negative bacteria, invading them and replicating within their periplasm. Since its
discovery in 1962, Bdellovibrio has gone through physiological and biochemical
studies in the 1960 and 70’s, then recombinant DNA studies in the 1990’s which has
directed the work towards molecular studies in the 21st century (Sockett, 2009). The
recombinant DNA and protein studies will help us understand the precise
mechanisms which control the different parts of the complex predatory lifecycle of
Bdellovibrio. The way in which Bdellovibrio has a unique ability to invaded and
destroy Gram negative bacteria can be used to mankind’s advantage once these
mechanisms are fully explored. It is well known that antibiotic resistance is on the rise
and new ways of treating resistant bacteria are needed. Bdellovibrio could be used a
new form of antibiotic termed “living antibiotic” as it is able to kill pathogenic Gram
negative bacteria such as Pseudomonas, E. coli and Salmonella (Dwidar, 2012). Water
treatment and crop protection are two other areas in which Bdellovibrio may one day
be utilised to replace current strategies.
The typical life cycle of Bdellovibrio is though a host-dependent (HD) manner
(figure 1). However there is a small percentage of around 1 in 107 that are able to
survive in a host-independent (HI) fashion. Bdellovibrio are polar rod shaped bacteria
around 0.2-0.5 µm wide and 0.5-2.5 µm in length and are capable of swimming up to
160 µm sec-1 (Hobely, 2012; Lambert, 2006). The propulsion system on these highly

66
motile bacteria is a single sheathed flagellum at the tail end which used to move
liquid medium. Movement on solid surfaces is through the use of gliding motility
machinery such as adventurous gliding proteins (Lambert, 2011). Investigations into
the exact proteins involved are still ongoing but it is thought that cyclic-di-GMP is
involved in the regulations of gliding motility. It has been suggested Bdellovibrio can
sense prey though chemotaxis in prey rich areas, potentially even biofilms. What is
known is that Bdellovibrio will only prey on Gram negative bacteria and are able to
distinguish them from inert objects and Gram positive bacteria. The vast majority of
Bdellovibrio grow within the periplasm which is only found in Gram negative bacteria.
This first stage is known as the attack phase where the Bdellovibrio are highly motile
ready to find their next target.
Figure 1: The host dependent (HD) and host independent (HI) life cycles of
Bdellovibrio (Sockett, 2009).
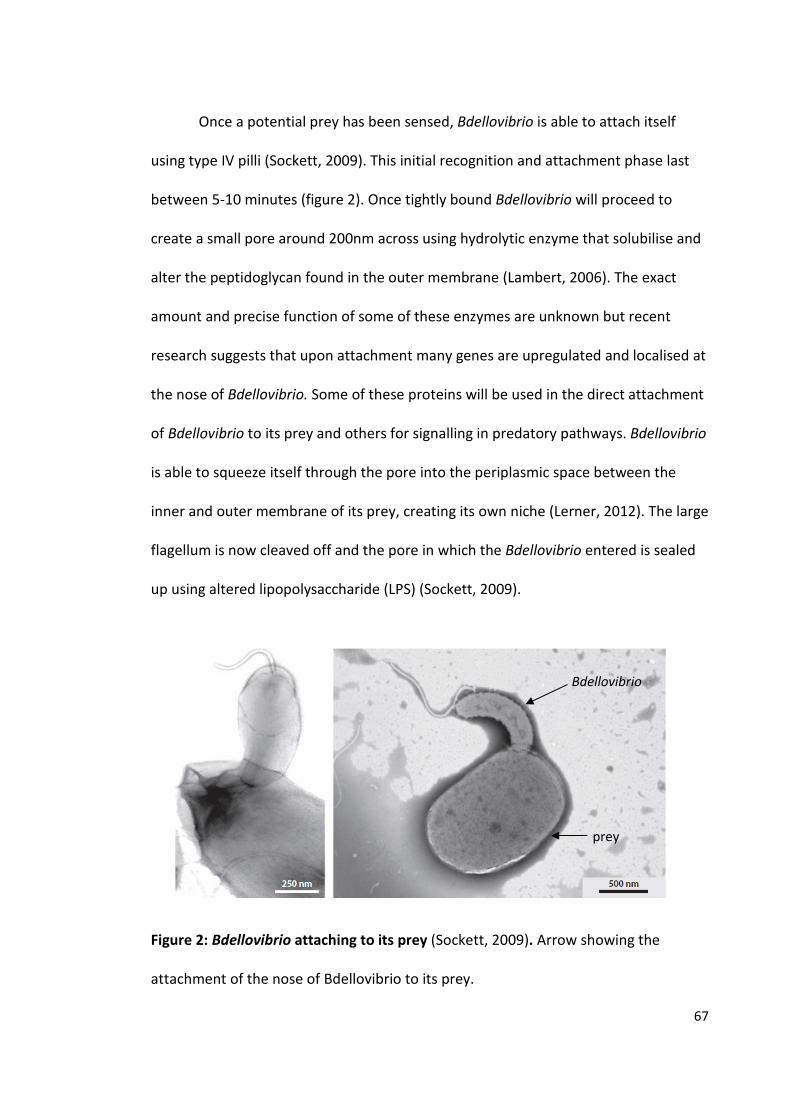
67
Once a potential prey has been sensed, Bdellovibrio is able to attach itself
using type IV pilli (Sockett, 2009). This initial recognition and attachment phase last
between 5-10 minutes (figure 2). Once tightly bound Bdellovibrio will proceed to
create a small pore around 200nm across using hydrolytic enzyme that solubilise and
alter the peptidoglycan found in the outer membrane (Lambert, 2006). The exact
amount and precise function of some of these enzymes are unknown but recent
research suggests that upon attachment many genes are upregulated and localised at
the nose of Bdellovibrio. Some of these proteins will be used in the direct attachment
of Bdellovibrio to its prey and others for signalling in predatory pathways. Bdellovibrio
is able to squeeze itself through the pore into the periplasmic space between the
inner and outer membrane of its prey, creating its own niche (Lerner, 2012). The large
flagellum is now cleaved off and the pore in which the Bdellovibrio entered is sealed
up using altered lipopolysaccharide (LPS) (Sockett, 2009).
Figure 2: Bdellovibrio attaching to its prey (Sockett, 2009). Arrow showing the
attachment of the nose of Bdellovibrio to its prey.
Bdellovibrio
prey

68
After about 25 minutes a bdelloplast is formed by rounding of the host cell
membrane using proteins to create a pseudo-exoskeleton and by altering the host’s
peptidoglycan. This makes sure all the nutrients and macromolecules stay within the
host and the host does not burst before full replication has occurred. Another
advantage of this bdelloplast is the protection it gives Bdellovibrio, as other predators
will not invade the host once the bdelloplast is formed. The Bdellovibrio can now start
to enzymatically digest the hosts DNA, proteins and other macromolecules using
them as nutrients to grow. Bdellovibrio first grows as a long filamentous progeny
replicating its DNA as many times as possible before the nutrients within the host are
exhausted (Sockett, 2009; Lambert, 2006). The single large filamentous progeny will
then separate into smaller progeny according to how many times the DNA has been
replicated which can be either and odd or even amount (Shilo, 1969). This growth and
development stage takes around an hour and is capped off by synthesising new
flagellar for the new progeny.
Figure 3: The
progeny of a
Bdellovibrio that
has replicated
with its host
(Sockett, 2009).
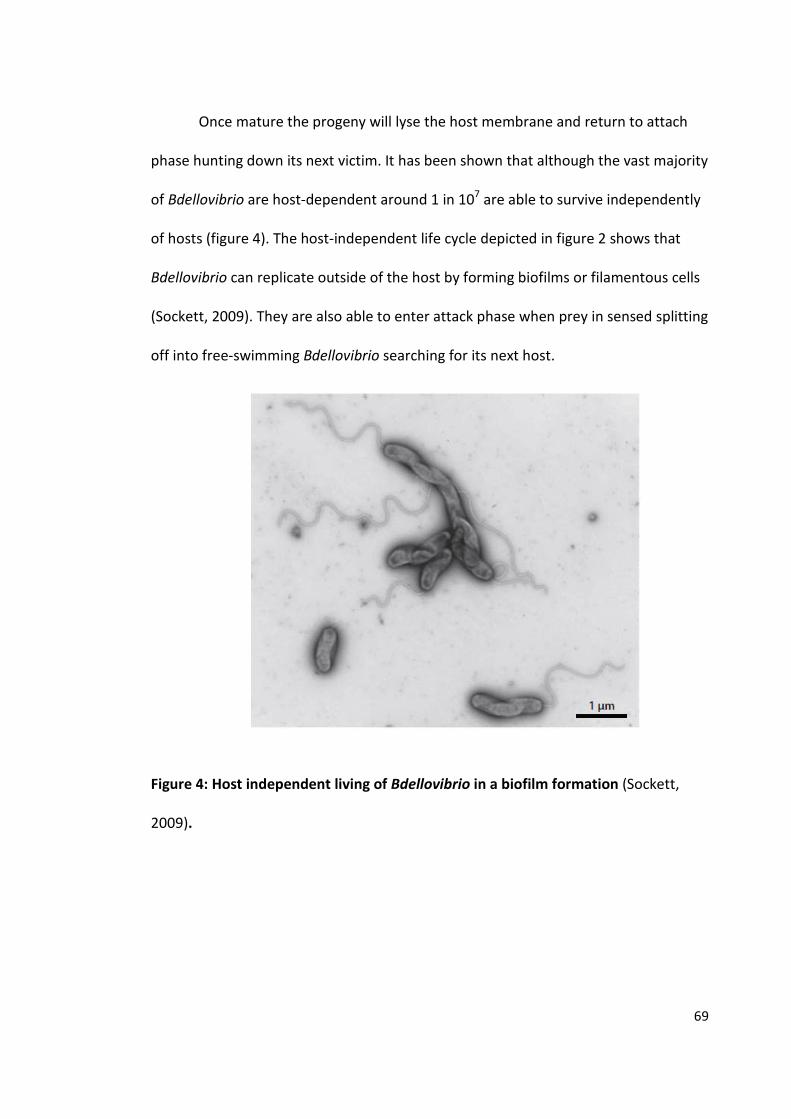
69
Once mature the progeny will lyse the host membrane and return to attach
phase hunting down its next victim. It has been shown that although the vast majority
of Bdellovibrio are host-dependent around 1 in 107 are able to survive independently
of hosts (figure 4). The host-independent life cycle depicted in figure 2 shows that
Bdellovibrio can replicate outside of the host by forming biofilms or filamentous cells
(Sockett, 2009). They are also able to enter attack phase when prey in sensed splitting
off into free-swimming Bdellovibrio searching for its next host.
Figure 4: Host independent living of Bdellovibrio in a biofilm formation (Sockett,
2009).
70
Bdellovibrio Proteins
During predation Bdellovibrio upregulate certain proteins towards its polar
nose and it is thought that because of the timing and location of these proteins they
are involved in the invasion process either directly or by acting as signalling proteins.
This study looks at some of these proteins in more detail with the ultimate goal of
producing crystal structures. Five proteins were examined during this study of which
little is known about their structure or function. The most well characterised protein
is RomR (Bd 2176). Two proteins (Bd 1482 and Bd 3100) contain PilZ domains and are
involved in cyclic-di-GMP (c-di-GMP) signalling. Bd 3099 which is homologous to Bd
1483 is a MIDAS protein and is believed to be involved in metal binding. The least well
characterised is Bd 2093 is assumed to be implicated in the adhesion process.
Both Bd 1482 and 3100 contain GYF and PilZ domains with Bd 1482 only
having one GYF and Bd 3100 possessing two GYF domains. PilZ domain proteins acts
as effector proteins that can bind c-di-GMP, a secondary messenger involved in
bacterial life style choices such as biofilm formation, motility and virulence. Studies
have shown that by knocking out proteins that are involved in synthesing c-di-GMP
Bdellovibrio phenotype completely changes. As PilZ domain proteins are effector
proteins for c-di-GMP it indicates that PilZ domains are implicated in the virulence of
Bdellovibrio most likely through the action of c-di-GMP and therefore good
candidates for structural studies. GYF domains are known to bind proline rich
sequences but not much is known about their function in Bdellovibrio (Kofler, 2005).
71
C-di-GMP in Bdellovibrio
Cyclic-di-GMP is a secondary messenger known to have an effect on bacterial
lifestyle choices. In proteobacteria which Bdellovibrio are included in c-di-GMP
controls the switch between single motile cell and biofilm formation (Ryan). In
Bdellovibrio this could translate to be the difference between host-dependent and
host-independent stains. The synthesis of c-di-GMP is through diguanylyl cyclases
contain GGDEF domains which in Bdellovibrio have been implicated in phenotypical
changes. A study conducted by Hobley et al. (2012) deleted various GGDEF contain
genes to find a variety of different phenotypical outcomes. Two opposite phenotypes
were produce when deleting Dgc B (Bd 0742) and Dgc C (Bd 1434), which made an
obligatory axenic mutant and an obligatory predatory mutant respectively. The
deletion of Dgc A (Bd 0367) created a strange intermediate version, where gliding
motility was eliminated, could still invade prey but not escape from within them. It is
unclear if the deletion of Dgc A effected flagellar synthesis but what Hobley et al
noted is that “at the 5’ end of one of 4 operons of gliding motility genes of B.
bacteriovorus, there is a gene, Bd1482, encoding a PilZ domain protein, which may be
a candidate for receiving signals from DgcA to effect gliding…”
This gives evidence that altering the c-di-GMP synthesis in Bdellovibrio the
lifestyle of this bacterium is distorted. This could of course also happen if the
expression or structure of phosphodiester (PDE) enzymes which are responsible for
the degradation of c-di-GMP are modified. PDE enzymes contain EAL or HD-GYP
domains and the HD100 Bdellovibrio strain incorporates 1 EAL and 6 HD-GYP
domains. Within the HD100 strain of Bdellovibrio there are 5 enzymes containing

72
GGDEF domain of which three are stated above. These two enzymes, diguanylyl
cyclises and phosphodiesters are capable of synthesising and degrading c-di-GMP
respectively, but it is the PilZ domain that is capable of binding c-di-GMP using it to
convey a message. This message in Bdellovibrio can travel down either a predatory or
axenic route with PilZ acting as an effector protein (Hobley, 2012; Amikam, 2006).
PilZ domain
It was thought that other than cellulose synthase there was no known
proteins that binds c-di-GMP. The PilZ domain was first discovered in 1989 by
Amikam and Benziman when labelled c-di-GMP was found to be mostly bound to the
β-subunit of cellulose synthase BcsB in Gluconacetobacter xylinus. This data
suggested that BcsB was the c-di-GMP bind protein but subsequent studies showed
that the actual protein was a 200 kD membrane-bound protein complex. It was
suggested by Saxena and Brown that this could be the dimer of the α-subunit or a
second form of cellulose synthase. The PilZ domain is now known to be the c-di-GMP
binding region of cellulose synthase. Since then the PilZ domain has been identified in
a variety of bacterial species including Bdellovibrio (Amikam, 2006).
In many bacterial species of bacteria c-di-GMP is known to be involved in
virulence pathways so it is no surprise that the PilZ domain is also found within these
bacteria. In P.aeruginosa PilZ is encoded by the PA2960 gene which when mutated
can produce normal amounts of pilin, but is unable to construct functional pili. In
Geobacter sulfurreducens GSU3262 was found to have a PilZ domain with a REC
domain accompany it which may imply a regulatory role. More than 600 sequences

73
were found when a PSI-BLAST search was done on the C-terminal fragment of
GSU3262 over a variety of bacteria (Amikam, 2006). Interestinly the eukaryotic
cellulose synthase found in slime mould Dictyostelium discoideum and marine
urochordate Ciona savignyi contained no PilZ domain or GGGDEF domains and
probably do not produce c-di-GMP. In Bdellovibrio the gliding and flagellar motility
are affected by c-di-GMP signalling pathways and as it is known PilZ can bind c-di-
GMP which would indicate that Bd 1482 and 3100 are implicated in motility.
RomR
RomR is a protein that has been found in two types of δ-proteobacteria,
Bdellovibrio bacteriovorus and Myxococcus xanthus but has a different function in
each of them. RomR in M. xanthus (RomRMX) is known to be involved in gliding
motility whereas in B. bacteriovorus (RomRBD) it has been linked to predatory invasion
(Milner, 2014). The work that was done on M. xanthus has helped further the
understanding of B. bacteriovorus and its complex predatory and invasive lifestyle.
There are many similarities between these two species but with minor differences
and it is these minor differences that has enabled the characterisation of specific
proteins and pathways. M. xanthus has two types of motility known as social (S-
motility) and adventurous or gliding motility (A-motility). Just like B. bacteriovorus, M.
xanthus uses type IV pili and can only be regulated at the polar end but the difference
is that M. xanthus can switch which polar end that is (Kaiser, 2012; Milner, 2014). The
type IV pili found in M. xanthus are used in the motility of the bacterium where as in

74
B. bacteriovorus they are used in the attachment to prey. It is the control of this polar
switch in M. xanthus that has led to a clearer understanding of what RomR does in B.
bacteriovorus.
B. bacteriovorus and M. xanthus are both bidirectional when using gliding
motility which is very useful as this type of motility is much slower than using a
fagellar system with B. bacteriovorus moving at 16 µm hr-1 and M. Xanthus travelling
at 24-36 µm hr-1. The system that controls the polarisation and reversal of direction in
M. Xanthus is known to be controlled by a Ras-like GTPase, MglA (Keilberg, 2012;
Milner, 2014). MlgA is need for the activation of both A and S motility and is
controlled by a GTPase activating protein (GAP) MglB. When MglA is removed from
M. Xanthus it is both A and S non-motile and has been shown, along with its
interacting partner RomR, to control pole switching and therefore the bidirectional
movement. A Frz chemosensory system sends signals to RomR which can then
interact and regulate MglA in M. Xanthus but although RomR is conserved in B.
bacteriovorus the Frz chemosensory is not (Keilberg). B. bacteriovorus does contain
MglA in the HD100 genome but there is no MglB homologue, so what is the function
of MglA and RomR in B. bacteriovorus is the gliding motility of B. bacteriovorus is
controlled by cyclic-di-GMP.
It was shown by Milner et al (2014) that even though B. bacteriovorus does
not contain a MglB homologue, MglABD does still play a role in the gliding behaviour
but is not necessarily essential for gliding motility. MglABD was also proven to be
necessary for invading prey and RomRBD plays a key role in the growth of B.
bacteriovorus. These two proteins were also found to interact with a previously
75
unknown binding partner known as a tetratricopeptide repeat protein (TRP) which
has been linked to be required for predation. TRP and RomR were able to interact in
a bacterial two hybrid experiment done by Milner et al (2014) and were also found to
be expressed at the nose of B. bacteriovorus where it interacts with prey. Another
protein that is localised at the invading pole was Bd 3125 which is degenerate GGDEF
(GVNEF) known as CdgA. As mentioned before it is this GGDEF domain that is linked
to a production of c-di-GMP a known secondary messenger in B. bacteriovorus. CdgA
can interact with both RomRBD and TRPBD through a bacteria two-hybrid assay. As all
of the proteins (CdgA, RomR and TRP) are all located at the invasive pole of
Bdellovibrio and are shown to interact with each other, they could play a part in the
invasion process. This is backed up by the fact when romRBD was deleted for both
host dependent and host independent strains of B. bacteriovorus it was not able to
grow showing that RomR is needed for both types of growth.
How are these proteins involved with each other?
As mentioned before not much is known about BD 3099 other than it is
thought to be a MIDAS protein capable of binding metal and Bd 2093 is assumed to
be involved in the adhesion process of Bdellovibrio and has a predicted secondary
structure of a β-barrel. This study intends to shed some light on the structure of
these proteins and therefore their function. A little more is known about the three
other proteins in this study Bd 1482, 3100 and RomR. Both Bd 1482 and 3100 have
PilZ domains which can interact with c-di-GMP which is produced by BD 3125 (CdgA)
at the invading nose of Bdellovibrio. RomR has been shown to interact with CdgA so

76
RomR could be a potential moderator of c-di-GMP production by CdgA and therefore
influence the actions of Bd 1482 and 3100 through the PilZ domain. As all these
proteins are thought to be located at the invading nose of Bdellovibrio it is believed
that they are all involved in the invasion process either directly (Bd 2093) or indirectly
through c-di-GMP signalling.
77
Materials and Methods
Plasmid preparation and PCR
In order to produce purified protein for crystallisation the correct gene has got
to be cloned form genomic DNA and inserted into a plasmid. Once the correct gene is
inserted into the plasmid it is propagated and then transformed into E. coli for
production. Below are the steps taken in this polymerase chain reaction (PCR) process
for Bd 2093 and Bd 3099. The other genes of interest in this study Bd 3100 and RomR
had already gone through the two rounds of PCR and were successfully transformed
into our expression strain of E. coli BL21.
1st round PCR or primer PCR is performed to identify and clone our gene of
interest from Bdellovibrio genomic DNA. This was done by ordering both forward and
reverse PCR primers that were specific to the gene. Primers where then diluted down
to working stock concentration with dH2O. Forward and reverse primers can either be
added together in a primer mix or used separately. In the case of Bd 3099 and 2093 a
primer mix solution was made up using 10 µl of each primer adding them to 80 µl of
dH2O. The PCR reagents were the same for both Bd 3099 and 2093 are as follows: 4
µl of the primer mix, 72.5 µl dH2O, 20 µl of 5x Velocity buffer, 1 µl of 100mM dNTPs,
1 µl of 1/20 Bdellovibrio gDNA and 1.5 µl Velocity enzyme. The final 100 µl of primer
PCR were made into 30 µl aliquots and place into the PCR machine. Below is a table of
the general primer PCR program that was used.
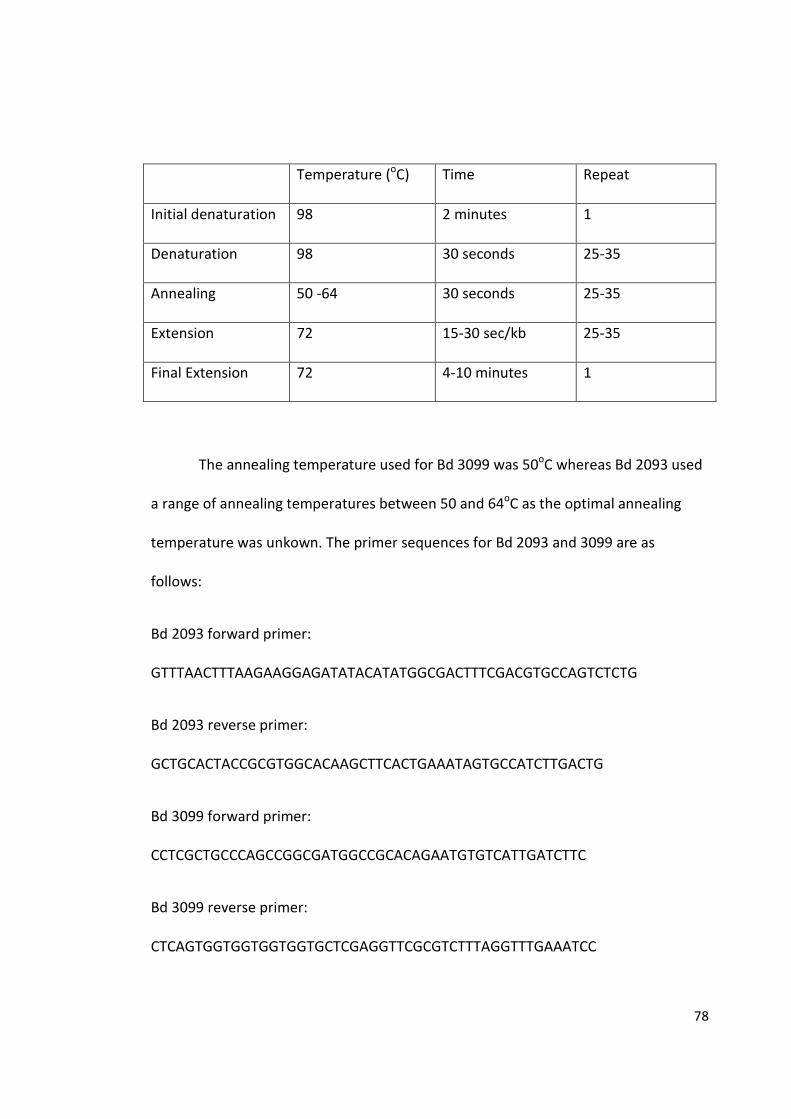
78
Temperature (oC) Time Repeat
Initial denaturation 98 2 minutes 1
Denaturation 98 30 seconds 25-35
Annealing 50 -64 30 seconds 25-35
Extension 72 15-30 sec/kb 25-35
Final Extension 72 4-10 minutes 1
The annealing temperature used for Bd 3099 was 50oC whereas Bd 2093 used
a range of annealing temperatures between 50 and 64oC as the optimal annealing
temperature was unkown. The primer sequences for Bd 2093 and 3099 are as
follows:
Bd 2093 forward primer:
GTTTAACTTTAAGAAGGAGATATACATATGGCGACTTTCGACGTGCCAGTCTCTG
Bd 2093 reverse primer:
GCTGCACTACCGCGTGGCACAAGCTTCACTGAAATAGTGCCATCTTGACTG
Bd 3099 forward primer:
CCTCGCTGCCCAGCCGGCGATGGCCGCACAGAATGTGTCATTGATCTTC
Bd 3099 reverse primer:
CTCAGTGGTGGTGGTGGTGCTCGAGGTTCGCGTCTTTAGGTTTGAAATCC

79
Once the primer PCR was completed the amplified DNA were purified using a
QI Aquick PCR Purification Kit and the manufactures instructions followed. The steps
and reagents are as follows: 5x the volume of PB buffer added to 1x PCR products. In
this case it was 500 µl of PB buffer added to 100 µl PCR products. This was placed into
the spin column provided and span at 13,000 rpm for 60 seconds to bind the DNA to
the column. The column was washed with 750 µl of PE buffer by again spinning at
13,000 rpm for 60 seconds. Before eluting off with 30 µl dH2O the spin column was
spun at 13,000 rpm for 60 seconds to get rid of any leftover PE buffer. The 30 µl of
purified primer PCR products were using in the 2nd round PCR.
2nd round PCR is performed using the 1st round products which is now the
gene of interest. This is then inserted into the plasmid of choice. The plasmids used in
this study were pET 26 for Bd 3099 and pET 41c for Bd 2093 for 2nd round PCR. Each
of these plasmids contained a Kanamycin resistance gene, an IPTG promoter gene
and a HIS tag. The process and reagents for 2nd round are as follow: 4 µl 1st round PCR
product, 20 µl of 5x Velocity buffer, 1 µl of 100mM dNTPs, 1.5 µl pET 41c or 0.5 µl of
pET 26b, 1.5 µl Velocity enzyme and made up to 100 µl with dH2O. The 2nd PCR
program used was the same as stated above with the 100 µl being separated into 30
µl aliquots and spread across a range on annealing temperatures. This PCR was done
without any restriction enzymes. After 2nd round PCR the products are cleaned up
using 1 µl of DNP1 per 100 µl of PCR product and left for 1-2 hours at 37oC, they were
then purified using the same purification kit and protocol as stated above.
80
To analyze the 1st and second round PCR products they were ran on a 1%
agarose gel containing 5 µl of SYBR green dye per 50 ml of gel. The gels were loaded
with 4 µl 2nd round PCR product mixed with 2 µl loading dye and ran at 100 volts for
30 minutes to 1 hour. Using a gel photo machine the gels were imaged and analysed.
Competent Cells and Transformation
Once the gene of interest was successfully cloned and inserted into the
correct plasmid it had to be amplified in DH5α cells and then transformed into BL21
cells. In order for this to work the cells have to be made competent to allow the
plasmid into the cells. The protocol and reagents are the same for both types of cells
and is as follows: a single colony form an overnight LB agar plate of streaked out cells
was picked and used to inoculate 10 ml of LB which was incubated overnight at 37oC.
100ml LB was inoculated with 1ml of overnight culture and shaken at 37oC until on
OD600 of 0.5 is reached. The culture was then cooled on ice before being centrifuged
for 5 minutes at 4oC at 4,000 rpm. The cell pellet was resuspened in 30ml of cold TFB
1 buffer and kept on ice for 90 minutes. This was then centrifuged for 5 minutes at
4oC at 4,000 rpm and resuspend in 4 ml of cold TFB 2 buffer. These were then
aliquoted out, flash frozen in liquid nitrogen and frozen at -80 oC.
Transformation of the plasmid into DH5α for plasmid amplification was done
by adding 15 µl of 2nd round PCR is to 100-120 µl of competent DH5α cells and left on
ice for 30 minutes- 2 hours. They were then heat-shocked at 42oC for 60-90 seconds
and placed back on ice for 60 seconds. 800 µl of LB was added to the cells and placed
81
in 37oC for 90 minutes then plated out on LB agar containing kanamycin and
incubated overnight at 37oC.
Colony PCR was then done on a selection of DH5α colonies to determine if the
colony contains the plasmid. Each colony is has a total reaction volume of 30 µl made
up of half the total volume of Bio Mix Red, 2 µl of each primer (forward and reverse)
at working concentrations and was made up with dH2O. The PCR products are then
run on a 1% agarose gel as above and the ones that contained the plasmid were then
incubated overnight in 10 ml of LB at 37oC and subjected to a Mini Prep.
Once the colony had been incubated overnight 4 ml were centrifuged at
13,000 rpm for 3 minutes at room temperature. The pellet was resuspened in 250 µl
of P1 buffer mixed then 250 µl P2 buffer was added and mixed. Finally 350 µl N3
buffer was added and mixed. This was centrifuged at 13,000 rpm for 10 minutes at
room temperature and the supernatant was applied to the spin column provide in
the Mini Prep Kit and spun through. The column was then washed with 500 µl of PB
buffer followed by 750 µl of PE buffer. The plasmid was the eluted off with 50 µl of
dH2O and sent for sequencing. If the sequence was correct then the plasmid was
transformed into the expression strain of E. coli BL21 using the same protocol as the
DH5α cells.
Once the plasmid had successfully been transformed into BL21 cell a 10ml overnight
culture was produced. This was then be aliquoted out and mixed 50/50 with 60%
glycerol, flash frozen and stored at -80oC.
82
Protein Expression and Purification
To gain a high enough concentration and purity of the protein of interest, in
this case Bd 1482, 3099, 3100 and RomR, the protein must be over-expressed and
then purified. The protocol for this was as follows: 15 ml overnight cultures of BL21 E.
coli in LB containing kanamycin (15 µl of 100mg/ml) where grown and then 5 ml was
used to inoculated 500 ml of 2xLB contain kanamycin. This was then grown in a
shaker at 37oC until a 0.5 OD600 is reached at which point it was induced with either
50 µM (Bd 3099) and 500 µM (Bd 1482 and RomR) IPTG and incubated at 20oC for 24
hours. The cultures were then centrifuged at 6000 rpm for 6 mins with Fiberlight (JLA
10.5) rotor. The cell pellet was then resuspended in 30mL of Buffer A (20mM
Imidazole, 300mM NaCl, 0.05% Tween 20 (pH 7)) and tumbled for 30-40mins at RT.
This was then sonicated 6 x 20 sec ON and 2 mins OFF while on ice and then
centrifuged at 20,000 rpm for 1 hour at 4oC.
If the protein was contained in the soluble supernatant according to an SDS
PAGE gel, it was loaded onto a 1mL nickel affinity column and purified on an AKTA
purification system. The column was first primed with 50 mM NiSO4 and equilibrated
with a buffer A. Once the supernatant was loaded onto the column the column was
washed with buffer A and then attached to the AKTA. Buffer A was passed over the
column until a base line was established. The protein was eluted by increasing the
amount of buffer B (500 mM Imidazole, 300 mM NaCl and 0.05% Tween 20) at 10%
increments. Once the correct amount of buffer B was reached and all the protein was
eluted off the fractions were pooled together into a dialysis bag with a molecular

83
weight cut off of 30 kD or 10 kD and dialysed overnight in 20mM Hepes, 200mM NaCl
(2L pH 7). The protein concentration was then measured using Bradford reagent and
concentrated using a 30 kD molecular cut off spin concentrator spun at 4000rpm at
4oC until the concentration reaches 10 mg/ml or higher. This was then flash frozen in
liquid nitrogen in 50 µL aliquots and stored at -80oC for crystallization.
If the protein was contained in the insoluble pellet of the centrifuged culture
then it was tumbled in 30 ml of 20mM Hepes, 200mM NaCl, 2% w/v Triton X (pH 7.5)
for 2 hours at RT. After which it was centrifuged at 16,000 rpm (20,000 g) for 25 mins.
The pellet was then tumbled overnight in a low imidazole GuHCl Buffer (20mM Tris-
HCl, 0.5M NaCl, 5mM Imidazole, 6M GuHCl and 1mM beta-mercaptoethanol). This
was then centrifuged at 16,000 rpm (20,000 g) for 25 mins and the supernatant was
kept. If the supernatant was still cloudy and containing contaminants it was
centrifuged in an ultra-centrifuge at 50,000 rpm from 30 minutes. The supernatant
was then loaded on a nickel affinity purification column which had been equilibrated
with low imidazole GuHCl buffer. The column was then washed with the low
imidazole GuHCl buffer (at least 3x bed volume) before elution with high (500mM)
imidazole GuHCl buffer (at least 3x bed volume) and the elution fractions were
collected. The protein concentration was measured using Bradford reagent and if
needed was dilute to around 5 mg/ml in 0mM imidazole, 6M urea. The protein was
then examined in a buffer screen to determine which buffer was optimal for
refolding. The buffer screen was set up in 2 ml cuvettes and measured at 340nm. The
buffer screen is comprised of 4 different buffers at 50mM with 6 different additives
over a pH range as shown below.
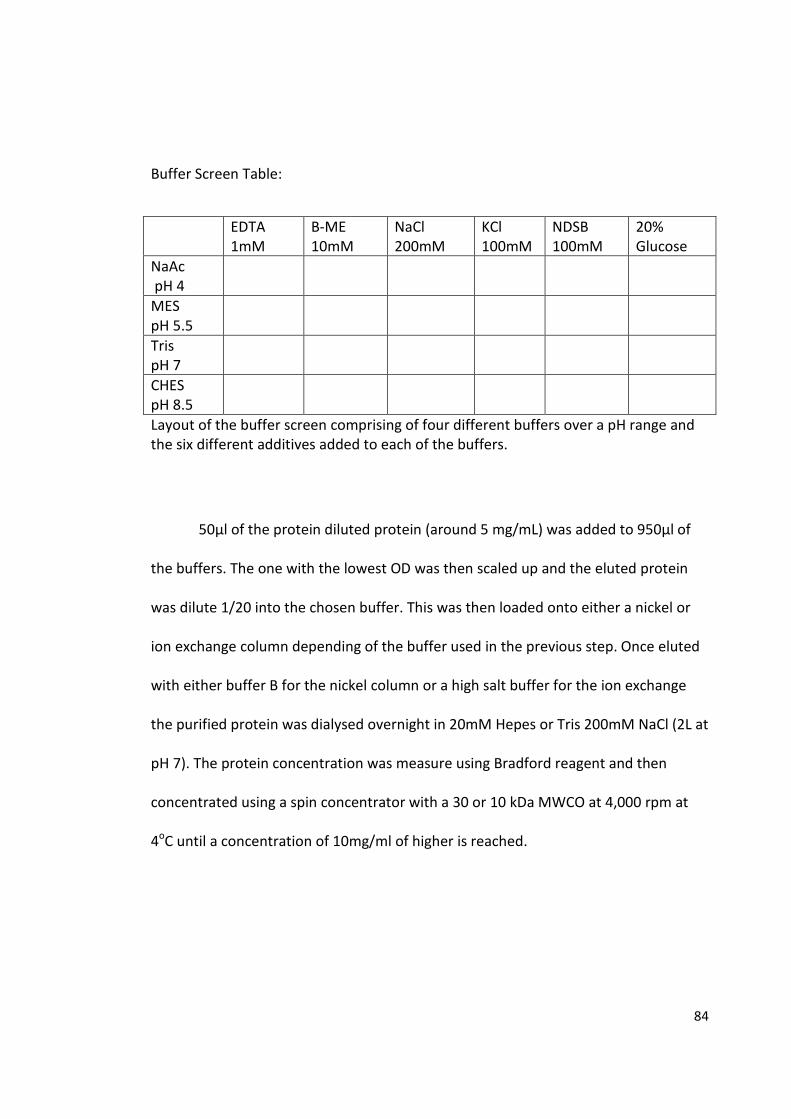
84
Buffer Screen Table:
EDTA 1mM
Β-ME 10mM
NaCl 200mM
KCl 100mM
NDSB 100mM
20% Glucose
NaAc pH 4
MES pH 5.5
Tris pH 7
CHES pH 8.5
Layout of the buffer screen comprising of four different buffers over a pH range and the six different additives added to each of the buffers.
50µl of the protein diluted protein (around 5 mg/mL) was added to 950µl of
the buffers. The one with the lowest OD was then scaled up and the eluted protein
was dilute 1/20 into the chosen buffer. This was then loaded onto either a nickel or
ion exchange column depending of the buffer used in the previous step. Once eluted
with either buffer B for the nickel column or a high salt buffer for the ion exchange
the purified protein was dialysed overnight in 20mM Hepes or Tris 200mM NaCl (2L at
pH 7). The protein concentration was measure using Bradford reagent and then
concentrated using a spin concentrator with a 30 or 10 kDa MWCO at 4,000 rpm at
4oC until a concentration of 10mg/ml of higher is reached.
85
Crystallization:
RomR was the only protein that was I able to be purify to a high enough
concentration and purity that would enable crystallization. Three crystal screens were
used to get a variety of different conditions. The three crystal screens were PACT,
JCSG+ and Proplex, all from Molecular Dimensions. In each of the screens RomR was
used at a concentration of around 20 mg/ml. The screens were performed in 96
sitting drop trays with each of the tray containing all condition from that individual
screen. The reservoir for all the different conditions was 120 µl and the drop size was
1.8 µl. To seal the sitting drop trays Crystal Clear tape was used and the trays were
stored at 18oC. The trays were checked regularly until crystals were formed. Once
crystals were form they were extracted then placed into the same conditions and a
cryoprotectant was added based on the condition used. These were then sent to the
Diamond Light Scource Synchrotron to be diffracted and gain a diffraction pattern.
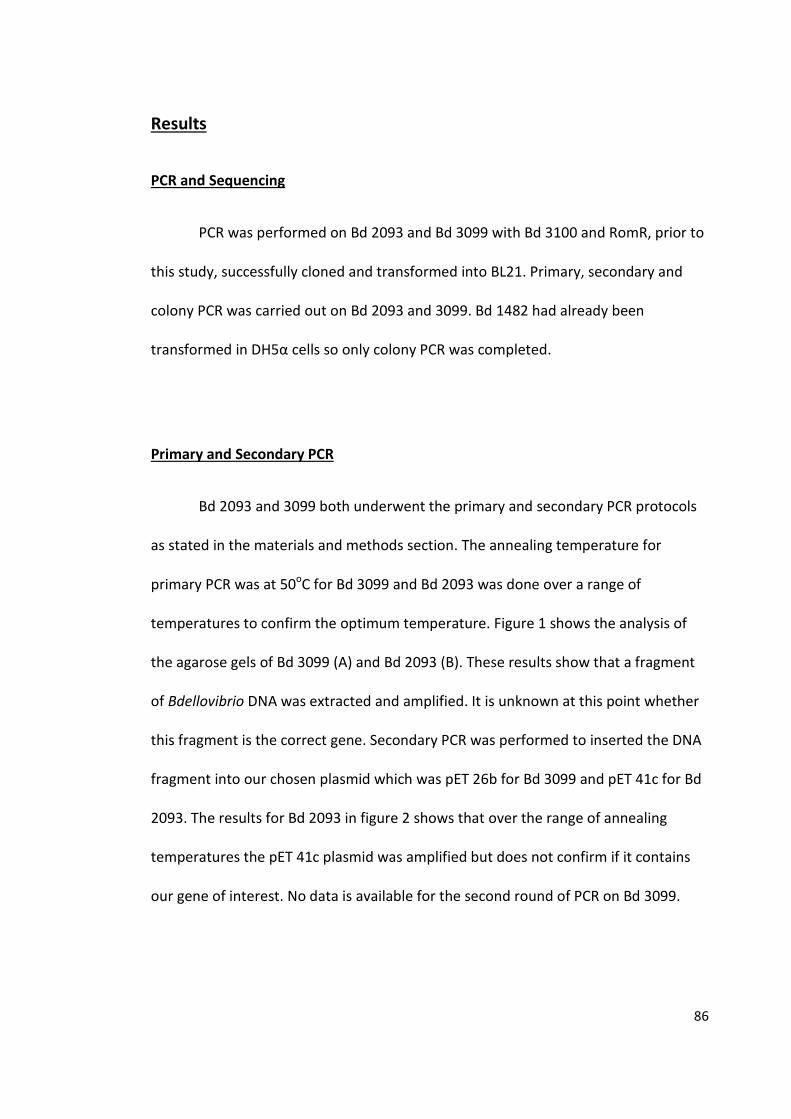
86
Results
PCR and Sequencing
PCR was performed on Bd 2093 and Bd 3099 with Bd 3100 and RomR, prior to
this study, successfully cloned and transformed into BL21. Primary, secondary and
colony PCR was carried out on Bd 2093 and 3099. Bd 1482 had already been
transformed in DH5α cells so only colony PCR was completed.
Primary and Secondary PCR
Bd 2093 and 3099 both underwent the primary and secondary PCR protocols
as stated in the materials and methods section. The annealing temperature for
primary PCR was at 50oC for Bd 3099 and Bd 2093 was done over a range of
temperatures to confirm the optimum temperature. Figure 1 shows the analysis of
the agarose gels of Bd 3099 (A) and Bd 2093 (B). These results show that a fragment
of Bdellovibrio DNA was extracted and amplified. It is unknown at this point whether
this fragment is the correct gene. Secondary PCR was performed to inserted the DNA
fragment into our chosen plasmid which was pET 26b for Bd 3099 and pET 41c for Bd
2093. The results for Bd 2093 in figure 2 shows that over the range of annealing
temperatures the pET 41c plasmid was amplified but does not confirm if it contains
our gene of interest. No data is available for the second round of PCR on Bd 3099.

87
A B
Figure 1: First round PCR products of Bd 3099 (A) and Bd 2093 (B). The arrow in A
shows the Bd 3099 DNA fragment. B shows the DNA fragment of Bd 2093 at 58 and
64oC. Both gels were 1% agarose in TBE and contained SYBR DNA dye.
Figure 2: Second round Bd 2093 product. The
arrows shows the position of the pET 41c
plasmid but still unconfirmed if it contains the
Bd 2093 gene. Sample was run on a 1% agarose
gel in TBE and contained SYBR DNA dye.
58 64
3 2
1.5
1
0.5
kb
0.5
1 1.5
2 3

88
Colony PCR and Sequencing
To confirm if the plasmids were transformed into DH5α cell colonies PCR and
sequencing were carried out. Figure 3 shows the results for the colony PCR of Bd 3099
(A) and Bd 2093 (B and C). It is clear that the Bd 3099 plasmid was not successfully
transfected into the DH5α cells and Bd 2093 showed a complete lack of any
transformation in all three of the colonies (figure 3 B) when colony PCR was
performed. After a Mini Prep was executed to produce more plasmid it was
confirmed by the bands in figure 3C that the Bd 2093 plasmid was present in all three
colonies. Colony PCR was also performed a second time on five more Bd 3099 DH5α
colonies and two of these colonies contained plasmids, data not shown. The two Bd
3099 and three Bd 2093 colonies were then sent off sequencing at the University of
Birmingham. The sequencing data showed that Bd 3099 was successfully
incorporated into the pET 26b plasmid and was successfully transformed into the
BL21 expression strain. Bd 2093 had unfortunately not been integrated in the pET 41c
plasmid. Due to time constraints Bd 2093 was not taken any further. Colony PCR and
sequencing was also performed on Bd 1482, data not shown, which verified the
correct gene was incorporated in the plasmid and was then successfully transformed
into BL21 cells.
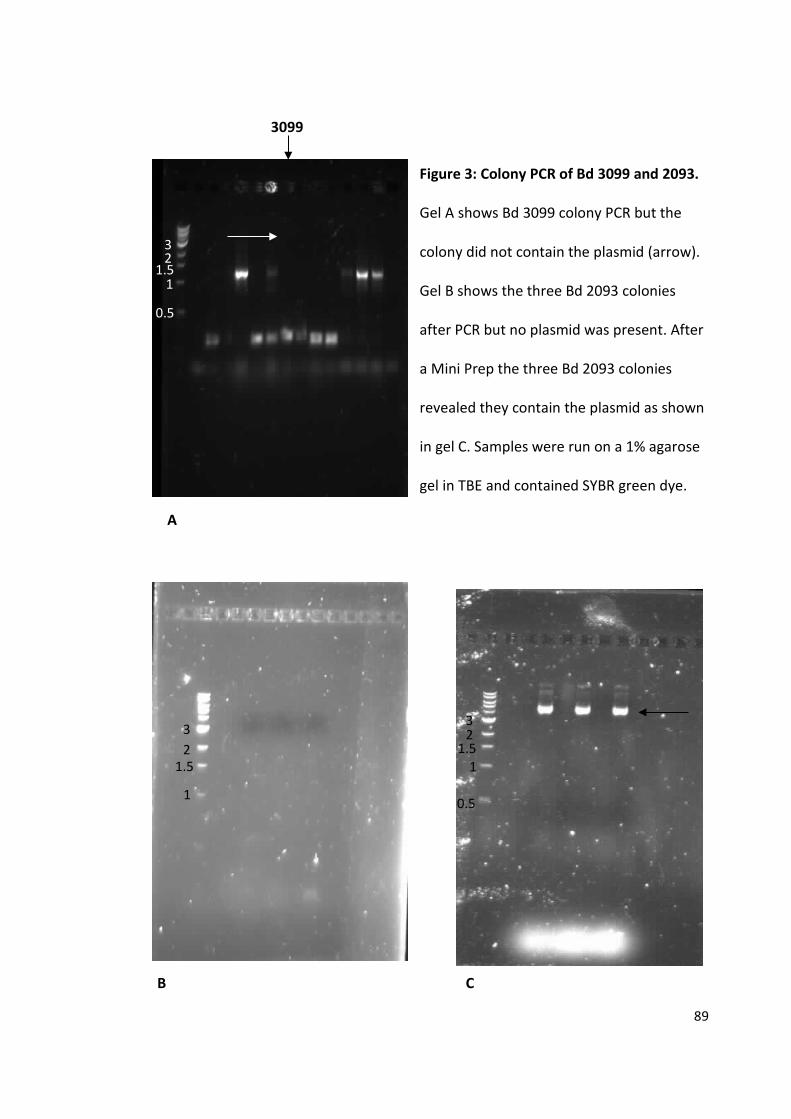
89
Figure 3: Colony PCR of Bd 3099 and 2093.
Gel A shows Bd 3099 colony PCR but the
colony did not contain the plasmid (arrow).
Gel B shows the three Bd 2093 colonies
after PCR but no plasmid was present. After
a Mini Prep the three Bd 2093 colonies
revealed they contain the plasmid as shown
in gel C. Samples were run on a 1% agarose
gel in TBE and contained SYBR green dye.
B C
A
3099
3 2
1.5 1
0.5
3 2
1.5
1
3 2
1.5 1
0.5
90
Trial Expressions of Bd 1482, Bd 3099 and Bd 3100
Trial expression was performed to find out in which fraction of the cell lysate
the proteins were expressed in, soluble or insoluble. Bd 1842, Bd 3099 and Bd 3100
were examined in this way as RomR had already been shown to be expressed in the
soluble supernatant. Bd 3100 had previously been shown only to be expressed in the
whole cell sample and not in the supernatant. To confirm this Bd 3100 was expressed
with varying concentrations of IPTG and at both 20oC and 37oC. Figure 4 shows SDS
PAGE gels that verify Bd 3100 is only present in the whole cell sample and not in the
supernatant at various IPTG concentrations and at the different temperatures. Bd
3100 was only expressed in the whole cell fraction in every condition confirming what
had previously been shown meaning Bd 3100 is most likely to be insoluble.

91
Figure 4: Whole cell (WC) and supernatant (S) samples of Bd 3100 (31 kD). Bd 3100
was expressed at 20oC and 37oC with varying concentrations from 0 to 1 M of IPTG.
Gel A shows the 37oC expression along with the first two lanes in gel B, with the other
lanes showing 20oC samples. Gel C shows the rest of the 20oC samples. Bd 3100 was
only found in the whole cell sample and not the supernatant in every expression
condition.
A
25 20
15 10
50 80 125
40
kD
kD
25 20
15 10
50 80 125
40 25 20
15 10
50 80 125
40
WC 0M
S 0M
WC 50 µM
S 50 µM
WC 0.1M
S 0.1 M
S 250 µM
WC 250 µM
WC 1M
S 1M
WC 0M
S 0M
WC 50 µM
S 50 µM
WC 0.1M
S 0.1 M
WC 250 µM
S 250 µM
WC 1M
S 1M
B
C
kD
92
Bd 1482 was only expressed at 20oC with varying amounts of both LB an IPTG
concentration (figure 5). Samples of the whole cell and supernatant were taken at 5
hours and 20 hours. In both cases no Bd 1482 was expressed in the supernatant
(figure 5) at either of the different concentrations of LB and IPTG. The whole cell
samples showed that after 5 hours there was a difference in the levels of expression
with 2xLB + 10µM IPTG having the least expression and 2xLB + 500µM IPTG having
the largest expression. At 20 hours there is no visible different between any of the
concentrations of LB and IPTG as shown in figure 5. For this reason 2xLB + 500µM
IPTG was chosen to be the expression condition for Bd 1482 with the idea that higher
concentrations of IPTG would stimulate more expression even though the protein is
expected to be insoluble.

93
Figure 5: SDS gels showing the trail expression of Bd 1482 (23kD) at 20oC. Gel A and
B are the whole cell (WC) samples taken at 5 and 20 hours respectively. These show
the expression of Bd 1482 at around 23 kD. Gel C and D are the supernatant (S)
samples at 5 and 20 hours respectively. The arrow indicates were Bd 1482 should be
25
20
15
10
50 80 125
40
B
C D
25
20
15
10
50 80 125
40
25
20
15
10
50 80 125
40
25
20
15
10
50 80 125
40
A
LB 1X 50µM
LB 2X 10µM
LB 2X 50µM
LB 2X 500µM LB 1X
50µM LB 2X 10µM
LB 2X 50µM
LB 2X 500µM
LB 1X 50µM
LB 2X 10µM
LB 2X 50µM
LB 2X 500µM
LB 1X 50µM
LB 2X 10µM
LB 2X 50µM
LB 2X 500µM
kD kD
kD kD
WC 5h WC 20h
S 5h
WC 5h
S 20h

94
shown if it were present. The LB strength and IPTG concentrations are stated above
each lane.
The same expression test was implemented on Bd 3099 only this time the
whole cell and supernatant sample were taken at 3 hours and 20 hours. After 3 hours
the only visibly large amount of expression was in both the whole cell and
supernatant of 1xLB + 50µM IPTG. After 20 hours the expression levels dramatically
changed with large amounts being produced in all conditions except 2xLB + 500µM
IPTG where expression levels were not visible in the supernatant fraction. Figure 6
shows there is more expression in the whole cell sample after 20 hours compared to
the supernatant but there is still visible over expression of Bd 3099 in the supernatant
except at 2xLB + 500µM IPTG. From this result it was concluded that Bd 3099 was
expressed in the soluble supernatant and the 2xLB + 50µM IPTG would be used for
expression.
Figure 6: Trail expression of Bd 3099 (35kD) at 20oC. Gel A shows the whole cell
samples taken at 3 hours (first four lanes) and at 20 hours (last four lanes). Gel B
shows the supernatant samples in the same layout. The arrow shows the position of
B
25
20
15
10
50 80 125
40
25
20
15
10
50 80 125
40
LB 1X 50 µM
LB 2X 10 µM
LB 2X 50µM
LB 2X 500µM
LB 1X 50 µM
LB 2X 10 µM
LB 2X 50 µM
LB 2X 500µM
LB 1X 50 µM
LB 2X 10 µM
LB 2X 50µM
LB 2X 500µM
LB 1X 50 µM
LB 2X 10 µM
LB 2X 50 µM
LB 2X 500µM kD kD
A

95
Bd 3099 at around 35kD. The LB strength and IPTG concentrations are stated above
each lane.
Purification of Soluble and Insoluble Proteins
Soluble RomR
RomR was tagged at the N and C terminus, RomR N and RomR C respectively,
with a HIS tag which was used for purification on a nickel affinity column. Most RomR
purification experiments were performed on an ATAK using a low Imidazole (20 mM)
as buffer A and a high Imidazole buffer (500 mM) as buffer B (p 82).
A RomR N cell pellet that had previously been cultured by another member of
the team was pelleted and stored at -20oC was then lysed and the supernatant was
loaded on the nickel column. Buffer B was increased at 10 percent increments to
increase the imidazole concentration until all the protein was eluted off as shown in
figure 7 A. Samples of the whole cell, supernatant, insoluble and flow through
fraction was taken along with purified fractions believed to contain RomR N were ran
on an SDS gel (figure 7 B) to confirm the whereabouts of the protein. The SDS gel
(figure 7 B) shows that large amounts of RomR N were contained in the whole cell,
supernatant, flow through fractions with minimal amounts in the insoluble fraction.
The elution fractions all contain high levels of RomR N with minimal contamination
with the exception of 100% buffer B fraction.
RomR N was also expressed at 20oC with an induction concentration of 500µM
IPTG. This led to similar results with most of the elution fractions containing RomR

96
with few contaminating proteins (figure 7 C). In both case the elution factions were
pooled together in a dialysis bag with a molecular cut off of 30 kDa and dialysed
overnight in 2L of dialysis buffer. The dialysed fractions were then spun down to
around 20 mg/ml using a 10 kDa MWCO spin column.
Figure 7: Purification of RomR N. (A) shows the elution profile of the RomR cell pellet
with the arrows indication the peaks where samples were taken and the percentage
100%
50
25
20
15 10
80 125
40
C
kD
kD 10% 100%
WC S IS FT
10% 20%
100%
B A
50
25
20
15 10
80 125
40
10%
20%
A280 [Buffer B]

97
of buffer B. These samples along with whole cell (WC), supernatant (S), insoluble (IS)
and flow through (FT) are shown in gel B with RomR N at 50kD. Gel C shows the
elution fractions at 10 and 100 % buffer B (p 82) of another RomR N purification.
RomR C was also expressed and purified under the same conditions and the
different fractions are shown in figure 8. Figure 8 A shows the cell fractions along with
the flow through and wash step during purification. This revealed that an excessive
amount of RomR C was contained in the flow through and a sizeable amount was
washed off during the wash step. The elution profile showed not significant peaks
but sample were taken and shown in figure 8 B. These elution fractions have
extremely minimal amounts of purified RomR C with most of them containing the
same amount of contaminating proteins as RomR C itself. The imidazole in flow
through was diluted to around 7mM before it was loaded back onto the column and
washed with a very low imidazole (5mM) buffer A. The same buffer B (p 82) was used
to elute off RomR C and the elution profile had no significant peaks. Some elution
fractions were taken and analysed on and SDS gel (figure 8 C). This illustrated that
most of RomR C did not bind to the nickel column and again fractional amounts were
eluted off. These factions were not pooled together and dialysed as they did not
contain high enough concentrations of RomR C.
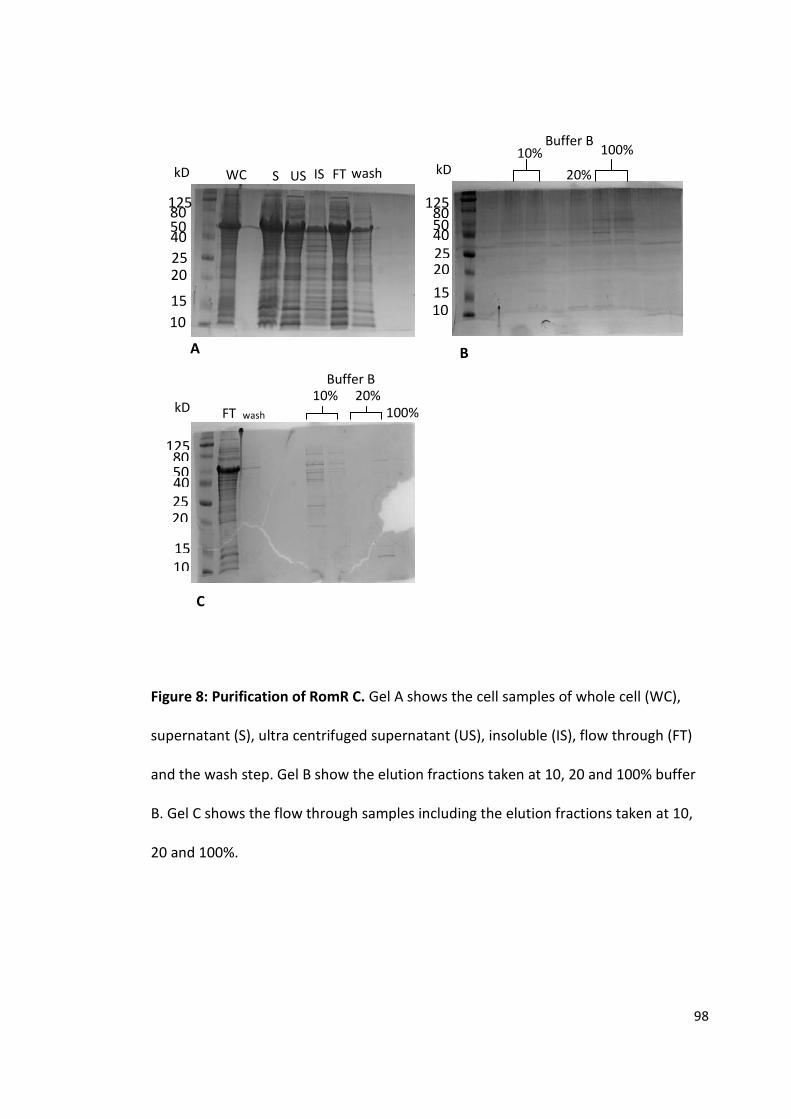
98
Figure 8: Purification of RomR C. Gel A shows the cell samples of whole cell (WC),
supernatant (S), ultra centrifuged supernatant (US), insoluble (IS), flow through (FT)
and the wash step. Gel B show the elution fractions taken at 10, 20 and 100% buffer
B. Gel C shows the flow through samples including the elution fractions taken at 10,
20 and 100%.
50
25 20 15 10
80 125
40
50
25 20
15 10
80 125
40
A B
C
kD
kD
50
25 20
15 10
80 125
40
kD WC S US IS FT wash 10%
20%
100%
FT wash
10% 20% 100%
Buffer B
Buffer B

99
Insoluble Bd 3099 and 1482
Bd 3099
The SDS PAGEs in figure 6 revealed that Bd 3099 was contained within the
supernatant and was most likely soluble. When tried in large scale expression and
purification it was exposed that most of the protein was contained within the
insoluble fraction. The supernatant was purified using the same methods as RomR N
and the elution fraction are also shown in figure 9 A . The SDS gel is not very clear but
does depict that minimal amounts of Bd 3099 are present in both the supernatant
and flow through when compare to the whole cell and insoluble fractions. The
purification profile showed no significant peaks and the three elution fractions taken
at 20, 50 and 100% buffer B indicated that only minimal amount of Bd 3099 was
eluted off at 20% buffer B. A second trial of this was performed with very comparable
results. Figures 9 B and C show the cell fraction and the elution fractions respectively.
Again large amount of Bd 3099 are in the whole cell and insoluble fraction with
minimal amount contained in the supernatant and flow through. The elutions profile
was very similar to the first attempt. Elution fractions were taken at 0, 10, 20 and
100% buffer B but this time no Bd 3099 was displayed in any of the elution fractions.
There was only minimal amount of contaminating protein seen in the 20 and 100%
buffer B fractions.

100
Figure 9: Elution profile of Bd 3099 from nickel column. Gel A shows the cell
fractions: whole cell (WC), supernatant (S), insoluble (IS) and flow through (FT) along
with three elution fractions at 20, 50 and 100% buffer B. Gel B displays the cell
samples from the second attempt at Bd 3099 purification and gel C shows the elution
fractions that were taken at 0, 10, 20 and 100% buffer B which contain no Bd 3099.
The arrow shows where Bd 3099 is present.
wash
B
C
kD kD WC S IS FT wash 20% 50% 100%
20% 100%
0% 10% kD
WC S IS FT
50
25 20
15 10
80 125
40 50
25 20
15 10
80 125
40
A
50
25
20
15
10
80 125
40
101
Bd 1482
Bd 1482 was expected to be insoluble as during the trial expression only the
whole cell samples contain the over expressed protein. The supernatant of the large
scale was still purified to confirm the insolubility. Figure 10 A does not clearly prove
that the protein is in the insoluble fraction as the three cell fraction and the flow
through have all merged together. The purification profile in figure 10 B shows no
peaks above the base line of buffer B, but elution fraction at both peaks were still
taken and analysed. The elution fractions that were taken at 10 and 100% buffer B
showed only negligible amounts of Bd 1482 along with other contaminating proteins.
This indicated that Bd 1482 was insoluble and the insoluble fraction was re-solubilised
in a 6M guanidine hydrochloride buffer. This was then refolded on column using a 6M
urea buffer which was slowly diluted down to 0M on the nickel column. Bd 1482 was
then eluted off using a gradient of 20mM imidazole to 500mM imidazole but no
peaks were shown on the elution profile. As there were no significant peaks showing
that elution had occurred no fractions were taken to be analysed.
.

102
Figure 10: Purification of Bd 1482
(23 kD). Gel A depicts the cell
samples whole cell (WC),
supernatant (S), insoluble (IS) and
flow through (FT) along with the
elution factions taken at both the
peaks in purification profile
indicated by the arrows in B and
the percentage of buffer B (p 82).
50
25
20
15
10
80
125
40
10%
100%
WC S IS FT 10% 100%
A
kD
[Buffer B]
A280
Buffer B
103
Refolding Insoluble Bd 3099, 1482 and Bd 3100
If the proteins were contained within the insoluble fraction of the cell lysate
they were purified using a series of refolding buffers and purification steps. Bd 3099
and Bd 1482 were shown to be insoluble during this study and Bd 3100 had already
been shown to be insoluble was also proved in this study. These three proteins all
underwent the refolding with varying success.
Bd 3099
Bd 3099 was the most successful, in terms of concentration and purity of the
protein. After elution from a nickel drip column using the GuHCl buffer it was diluted
down to around 6mg/ml and was tested against a buffer screen. The results are
presented in figure 11 where six different additives were used in four different
buffers over a range of pH creating a smorgasbord of different refolding conditions.
This clearly shows that only 6 out of the 24 buffers had very low absorbance levels
and allowed refolding to take place. Three out of the six screening results were using
a CHES buffer, two where using a Tris buffer and one was using a Sodium Acate
(NaAc) buffer. The most successful additive in aiding the refolding process was EDTA
followed by 20% Glucose. The buffer screen also contained a variety pH with the
higher pH values (pH 7 and 8.5) performing better overall.
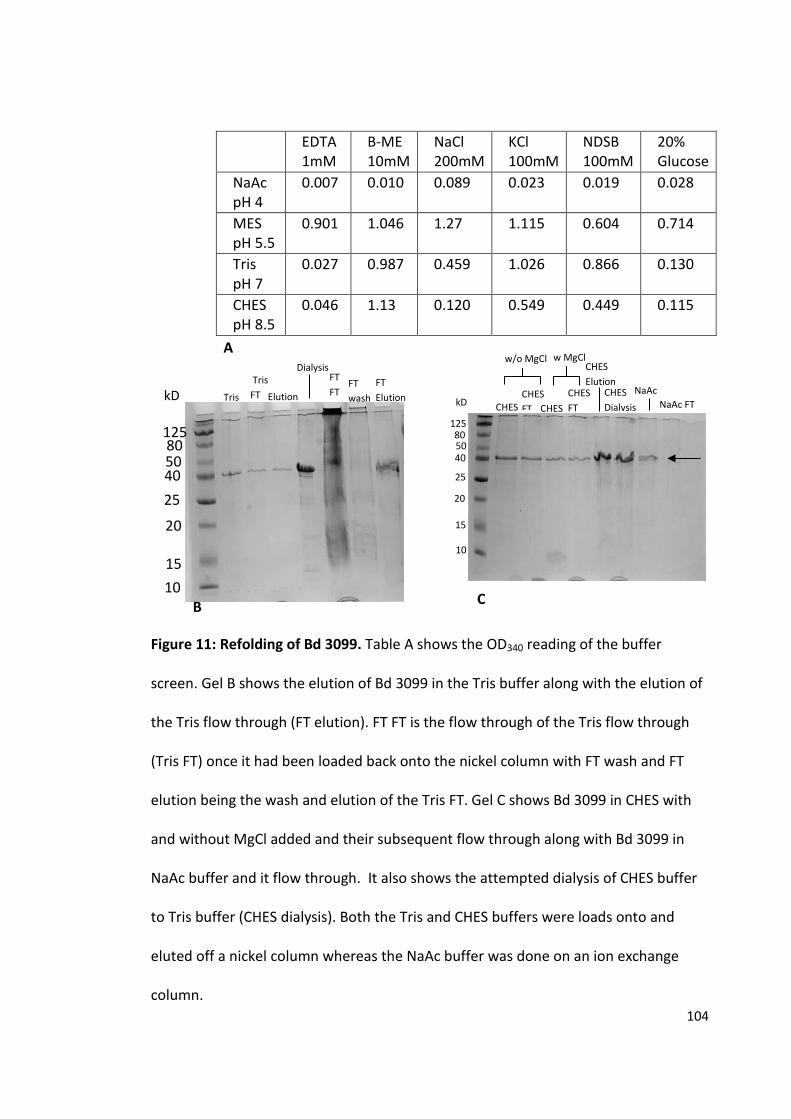
104
Figure 11: Refolding of Bd 3099. Table A shows the OD340 reading of the buffer
screen. Gel B shows the elution of Bd 3099 in the Tris buffer along with the elution of
the Tris flow through (FT elution). FT FT is the flow through of the Tris flow through
(Tris FT) once it had been loaded back onto the nickel column with FT wash and FT
elution being the wash and elution of the Tris FT. Gel C shows Bd 3099 in CHES with
and without MgCl added and their subsequent flow through along with Bd 3099 in
NaAc buffer and it flow through. It also shows the attempted dialysis of CHES buffer
to Tris buffer (CHES dialysis). Both the Tris and CHES buffers were loads onto and
eluted off a nickel column whereas the NaAc buffer was done on an ion exchange
column.
EDTA 1mM
Β-ME 10mM
NaCl 200mM
KCl 100mM
NDSB 100mM
20% Glucose
NaAc pH 4
0.007 0.010 0.089 0.023 0.019 0.028
MES pH 5.5
0.901 1.046 1.27 1.115 0.604 0.714
Tris pH 7
0.027 0.987 0.459 1.026 0.866 0.130
CHES pH 8.5
0.046 1.13 0.120 0.549 0.449 0.115
A
B C
kD kD Tris
Tris FT Elution
Dialysis FT FT
FT wash
FT Elution
CHES CHES FT CHES
CHES FT
CHES Elution
CHES Dialysis
NaAc NaAc FT
w/o MgCl w MgCl
50
25
20
15
10
80 125
40 50
25
20
15 10
80 125
40
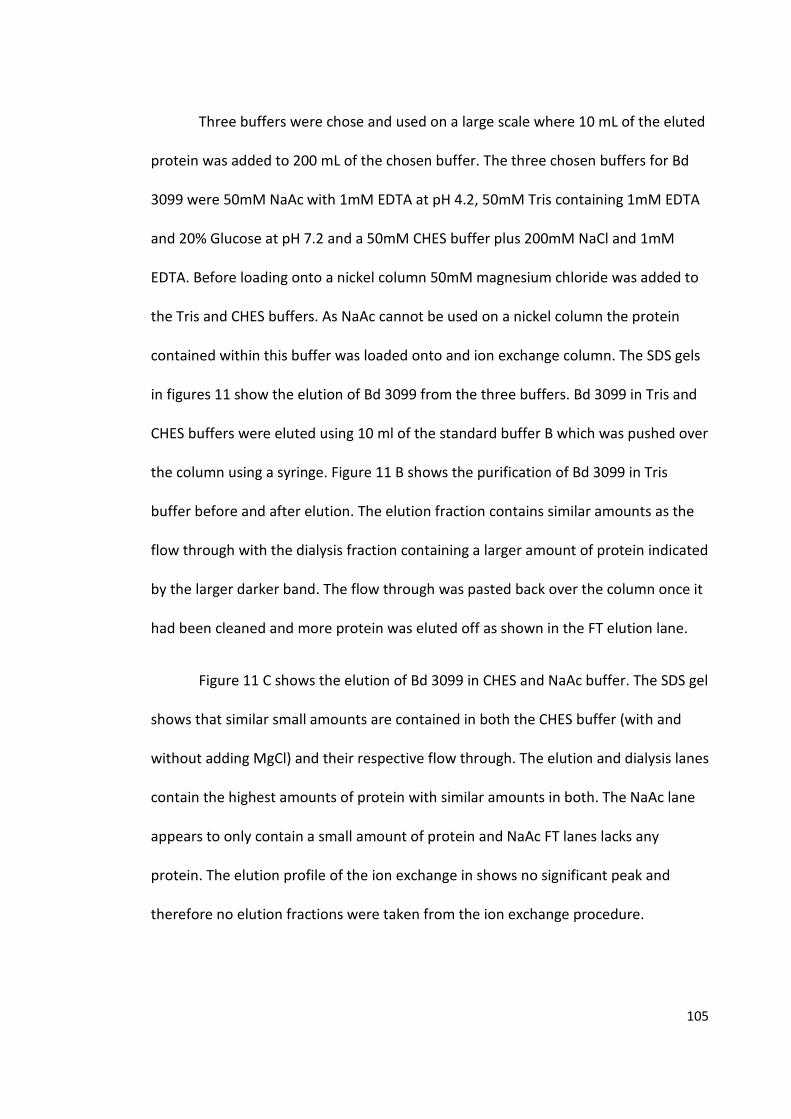
105
Three buffers were chose and used on a large scale where 10 mL of the eluted
protein was added to 200 mL of the chosen buffer. The three chosen buffers for Bd
3099 were 50mM NaAc with 1mM EDTA at pH 4.2, 50mM Tris containing 1mM EDTA
and 20% Glucose at pH 7.2 and a 50mM CHES buffer plus 200mM NaCl and 1mM
EDTA. Before loading onto a nickel column 50mM magnesium chloride was added to
the Tris and CHES buffers. As NaAc cannot be used on a nickel column the protein
contained within this buffer was loaded onto and ion exchange column. The SDS gels
in figures 11 show the elution of Bd 3099 from the three buffers. Bd 3099 in Tris and
CHES buffers were eluted using 10 ml of the standard buffer B which was pushed over
the column using a syringe. Figure 11 B shows the purification of Bd 3099 in Tris
buffer before and after elution. The elution fraction contains similar amounts as the
flow through with the dialysis fraction containing a larger amount of protein indicated
by the larger darker band. The flow through was pasted back over the column once it
had been cleaned and more protein was eluted off as shown in the FT elution lane.
Figure 11 C shows the elution of Bd 3099 in CHES and NaAc buffer. The SDS gel
shows that similar small amounts are contained in both the CHES buffer (with and
without adding MgCl) and their respective flow through. The elution and dialysis lanes
contain the highest amounts of protein with similar amounts in both. The NaAc lane
appears to only contain a small amount of protein and NaAc FT lanes lacks any
protein. The elution profile of the ion exchange in shows no significant peak and
therefore no elution fractions were taken from the ion exchange procedure.
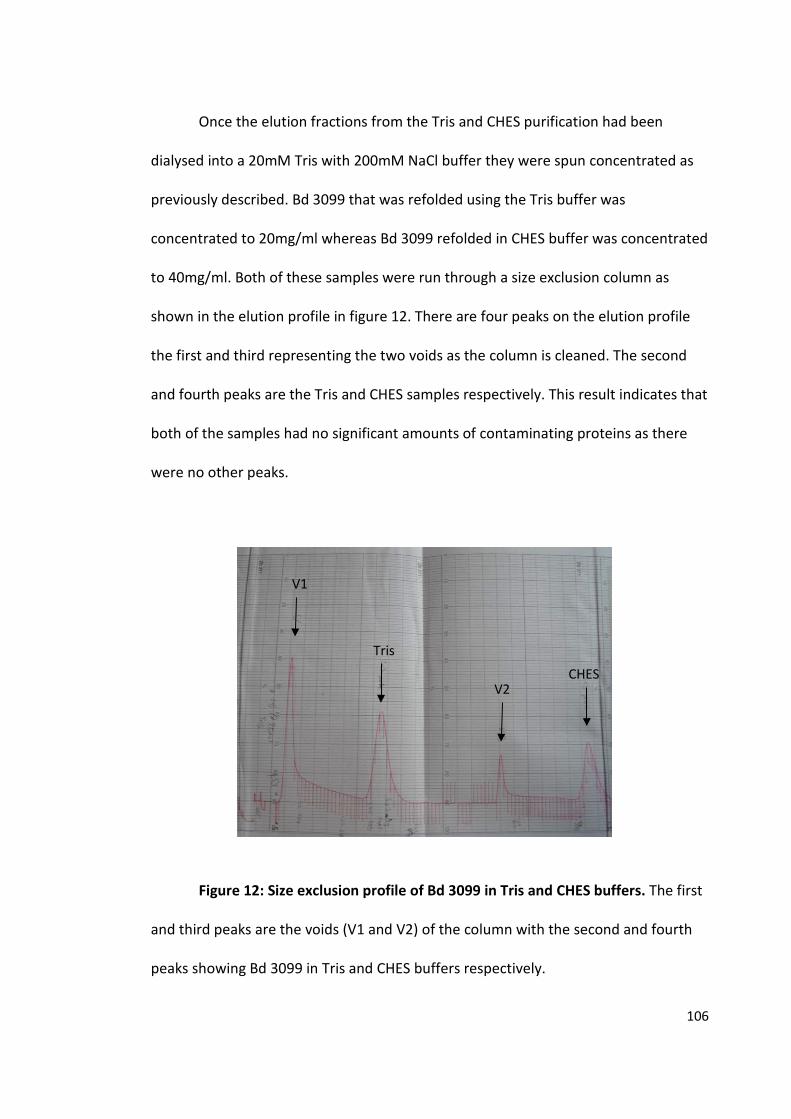
106
Once the elution fractions from the Tris and CHES purification had been
dialysed into a 20mM Tris with 200mM NaCl buffer they were spun concentrated as
previously described. Bd 3099 that was refolded using the Tris buffer was
concentrated to 20mg/ml whereas Bd 3099 refolded in CHES buffer was concentrated
to 40mg/ml. Both of these samples were run through a size exclusion column as
shown in the elution profile in figure 12. There are four peaks on the elution profile
the first and third representing the two voids as the column is cleaned. The second
and fourth peaks are the Tris and CHES samples respectively. This result indicates that
both of the samples had no significant amounts of contaminating proteins as there
were no other peaks.
Figure 12: Size exclusion profile of Bd 3099 in Tris and CHES buffers. The first
and third peaks are the voids (V1 and V2) of the column with the second and fourth
peaks showing Bd 3099 in Tris and CHES buffers respectively.
V1
V2
Tris
CHES

107
There were some problems with the nickel drip column during the refolding
purification of Bd 3099. To combat these issues Bd 3099 was refolded and purified
without using a nickel affinity drop column. Once the insoluble fraction had been
through a detergent wash using Triton and then re solublised in a low imidazole
GuHCl buffer as described before it was then dialysed straight into a 50mM Tris buffer
containing 1mM EDTA. At this point the concentration was not known so ½ and 1/8
dilutions of Bd 3099 in GuHCl were made and these were dialysed into the Tris buffer.
Large amounts of the 1/8 dilution precipitated and all of the ½ dilution was a thick
with precipitate. The dialysed samples were centrifuged to remove the precipitate
and were then run on an SDS gel as shown in figure 13 A. The different dilutions
appear to contain similar amounts of Bd 3099 in both supernatant and pellet. The
two different dilutions were then pooled together with a concentration of 1.5mg/ml.
Once loaded onto a nickel column it was eluted off using the standard buffer B (p 82)
and then dialysed into the 20mM Tris buffer with 200mM NaCl as shown in figure 13
B. Bd 3099 was then spin concentrated to around 7mg/ml.
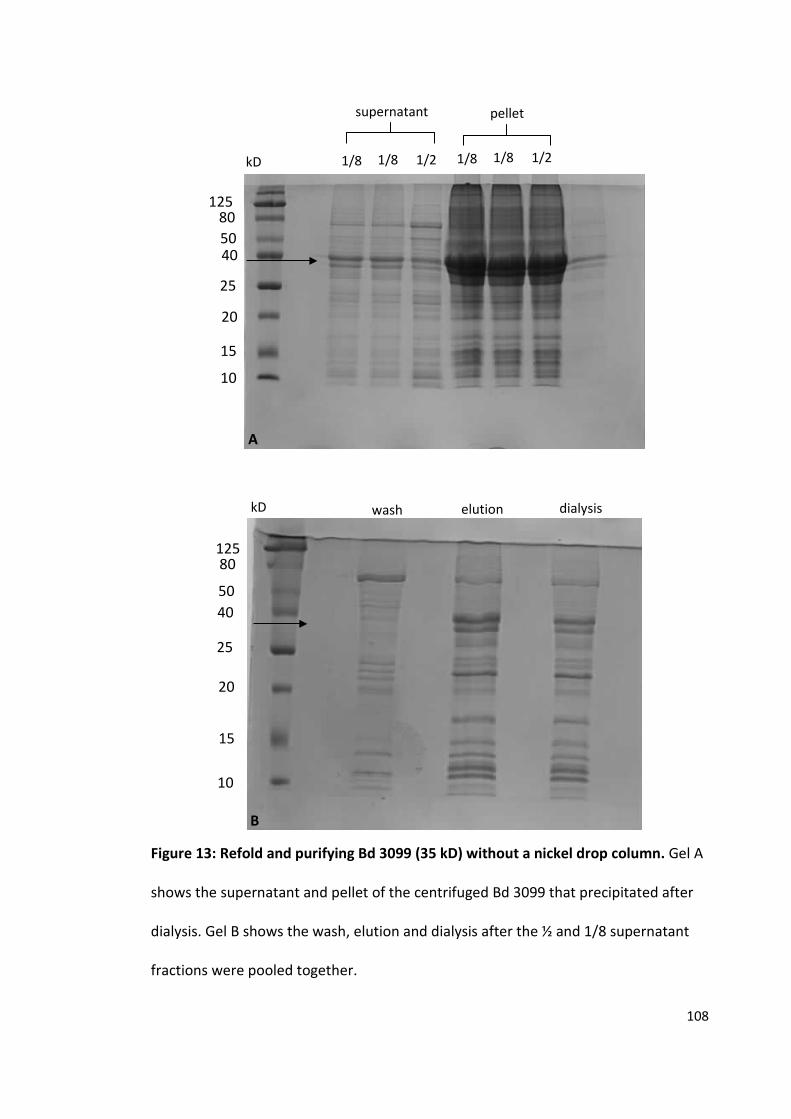
108
Figure 13: Refold and purifying Bd 3099 (35 kD) without a nickel drop column. Gel A
shows the supernatant and pellet of the centrifuged Bd 3099 that precipitated after
dialysis. Gel B shows the wash, elution and dialysis after the ½ and 1/8 supernatant
fractions were pooled together.
50
25
20
15
10
80 125
40
50
25
20
15
10
80 125
40
1/8 1/8 1/2 1/8 1/8 1/2
wash elution dialysis
supernatant pellet
kD
kD
A
B
109
Bd 1482 and 3100
Bd 1482 and 3100 were also refolded in a same way to Bd 3099 but with much
less success. Bd 1482 was eluted off a nickel drip column in a high imidazole GuHCl
and then tested on the same buffer screen as Bd 3099. The results shown in figure 14
A illustrate the NaAc buffer at pH 4.2 contain the least precipitate. NaAc containing
EDTA had the lowest OD value and NaAc with NDSB or 20% Glucose were the second
and third lowest. Two NaAc buffers were chosen for refolding purification once
containing 1mM EDTA and the other 20% Glucose and were examined on the SDS gel
in figure 14 B. This proves that 1482 was eluted off the drip column and was
contained within both of the NaAc buffers. The NaAc with 20% glucose was
attempted to be purified on an ion exchange column but no protein was eluted off
the column. The pH of the NaAc with 1mM EDTA buffer was attempted to be changed
to a higher pH with 1M Tris pH 7.5. Unfortunately this did not work as Bd 1482
precipitated out of solution at pH 6.5.

110
EDTA
1mM
Β-ME
10mM
NaCl
200mM
KCl
100mM
NDSB
100mM
20%
Glucose
NaAc
pH 4
0.007 0.058 0.125 0.124 0.037 0.041
MES
pH 5.5
0.411 0.710 0.812 0.801 0.637 0.607
Tris
pH 7
0.882 0.720 0.954 0.995 0.901 0.800
CHES
pH 8.5
0.801 0.917 0.798 0.844 0.895 0.765
Figure 14: Refolding of Bd 1482 (23 kD). Table A shows the OD340 readings of
the buffer screen on Bd 1482. The gel in B shows the supernatant (S) and insoluble
pellet (IS) of the cell lysate, the supernatant of the insoluble pellet after a Triton wash
(IS super), the supernatant after Bd 1482 had been resolubolised in GuHCl and
centrifuged (GuHCl super), the elution off the drip column and finally Bd 1482 in the
two chosen NaAc buffers. The arrows show where Bd 1482 appears at 23 kD.
kD
A
S IS IS super
GuHCl super Elution EDTA Glucose
NaAc
50
25
20
15
10
80 125
40
B
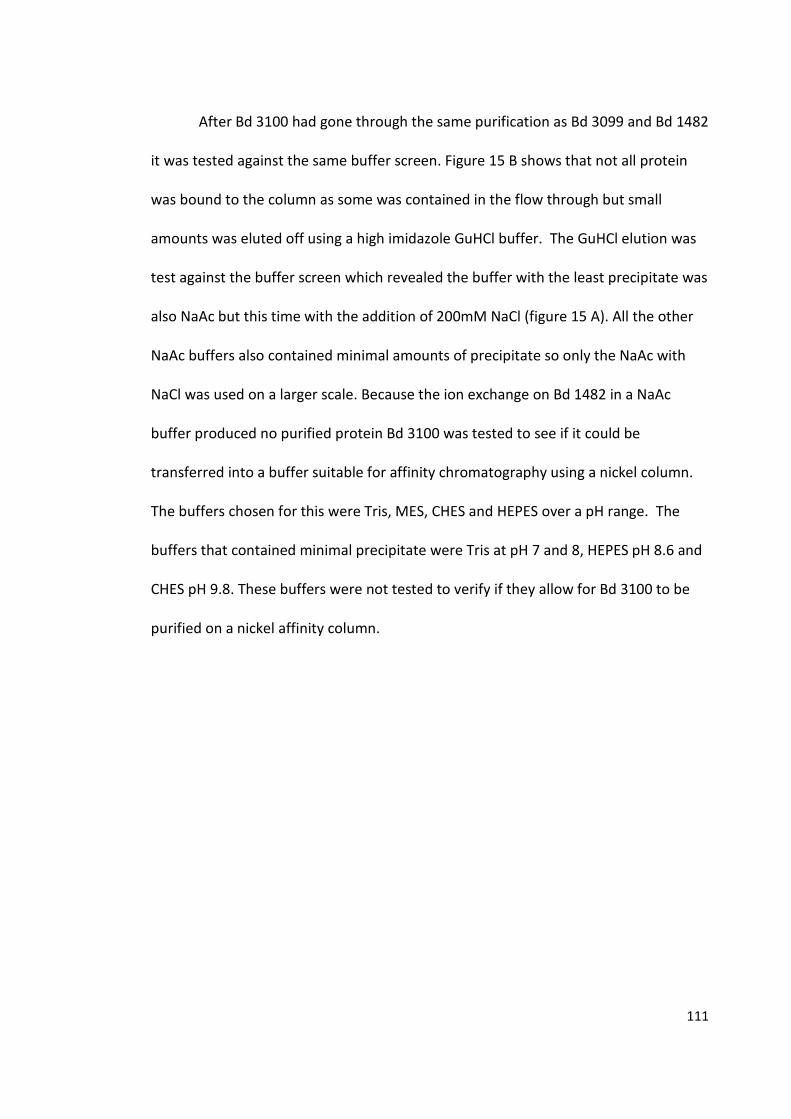
111
After Bd 3100 had gone through the same purification as Bd 3099 and Bd 1482
it was tested against the same buffer screen. Figure 15 B shows that not all protein
was bound to the column as some was contained in the flow through but small
amounts was eluted off using a high imidazole GuHCl buffer. The GuHCl elution was
test against the buffer screen which revealed the buffer with the least precipitate was
also NaAc but this time with the addition of 200mM NaCl (figure 15 A). All the other
NaAc buffers also contained minimal amounts of precipitate so only the NaAc with
NaCl was used on a larger scale. Because the ion exchange on Bd 1482 in a NaAc
buffer produced no purified protein Bd 3100 was tested to see if it could be
transferred into a buffer suitable for affinity chromatography using a nickel column.
The buffers chosen for this were Tris, MES, CHES and HEPES over a pH range. The
buffers that contained minimal precipitate were Tris at pH 7 and 8, HEPES pH 8.6 and
CHES pH 9.8. These buffers were not tested to verify if they allow for Bd 3100 to be
purified on a nickel affinity column.
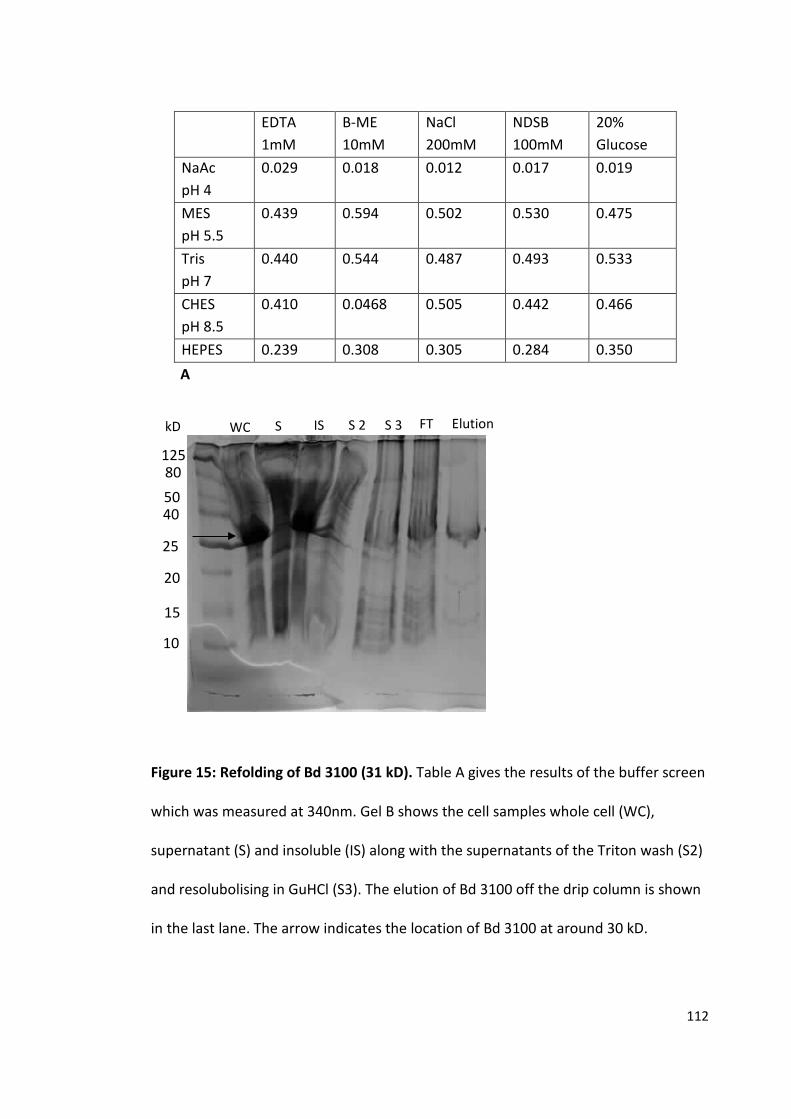
112
EDTA 1mM
Β-ME 10mM
NaCl 200mM
NDSB 100mM
20% Glucose
NaAc pH 4
0.029 0.018 0.012 0.017 0.019
MES pH 5.5
0.439 0.594 0.502 0.530 0.475
Tris pH 7
0.440 0.544 0.487 0.493 0.533
CHES pH 8.5
0.410 0.0468 0.505 0.442 0.466
HEPES 0.239 0.308 0.305 0.284 0.350
Figure 15: Refolding of Bd 3100 (31 kD). Table A gives the results of the buffer screen
which was measured at 340nm. Gel B shows the cell samples whole cell (WC),
supernatant (S) and insoluble (IS) along with the supernatants of the Triton wash (S2)
and resolubolising in GuHCl (S3). The elution of Bd 3100 off the drip column is shown
in the last lane. The arrow indicates the location of Bd 3100 at around 30 kD.
A
WC S IS S 2 S 3 FT Elution kD
50
25
20
15
10
80 125
40

113
Crystallization of RomR
The only protein that was able to be purified to a high enough purity and
concentration (20mg/mL) was RomR with the His tag at the N-terminus (RomR N). It
was subjected to three crystal screens: MIDAS, JCSG+ and Proplex with only the latter
two screens producing crystals. The JCSG screen had 10 different conditions that
produced crystals and Proplex had six different conditions capable of forming crystals.
Out of these 16 different conditions only one created a crystal suitable for diffraction.
The condition was in the Proplex screen box 2 condition 26 and contained 0.1 M
sodium acetate (pH 5.0) and 2 M ammonium sulphate. The pictures in figure 16 show
crystals form some of the 16 different crystallising conditions with E showing Proplex
box 2 condition 26.
A B
C D

114
H G
I J
K
F E
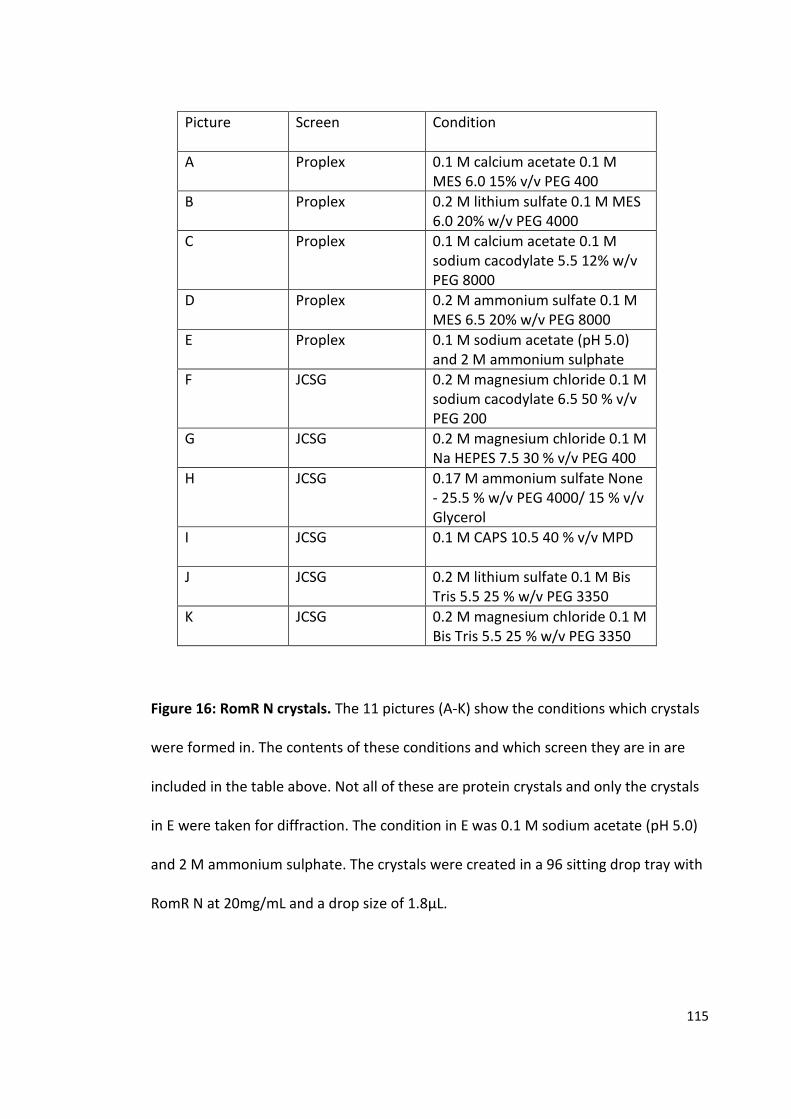
115
Picture Screen Condition
A Proplex 0.1 M calcium acetate 0.1 M MES 6.0 15% v/v PEG 400
B Proplex 0.2 M lithium sulfate 0.1 M MES 6.0 20% w/v PEG 4000
C Proplex 0.1 M calcium acetate 0.1 M sodium cacodylate 5.5 12% w/v PEG 8000
D Proplex 0.2 M ammonium sulfate 0.1 M MES 6.5 20% w/v PEG 8000
E Proplex 0.1 M sodium acetate (pH 5.0) and 2 M ammonium sulphate
F JCSG 0.2 M magnesium chloride 0.1 M sodium cacodylate 6.5 50 % v/v PEG 200
G JCSG 0.2 M magnesium chloride 0.1 M Na HEPES 7.5 30 % v/v PEG 400
H JCSG 0.17 M ammonium sulfate None - 25.5 % w/v PEG 4000/ 15 % v/v Glycerol
I JCSG 0.1 M CAPS 10.5 40 % v/v MPD
J JCSG 0.2 M lithium sulfate 0.1 M Bis Tris 5.5 25 % w/v PEG 3350
K JCSG 0.2 M magnesium chloride 0.1 M Bis Tris 5.5 25 % w/v PEG 3350
Figure 16: RomR N crystals. The 11 pictures (A-K) show the conditions which crystals
were formed in. The contents of these conditions and which screen they are in are
included in the table above. Not all of these are protein crystals and only the crystals
in E were taken for diffraction. The condition in E was 0.1 M sodium acetate (pH 5.0)
and 2 M ammonium sulphate. The crystals were created in a 96 sitting drop tray with
RomR N at 20mg/mL and a drop size of 1.8µL.

116
Diffraction of RomR Crystal
One crystal that was produced in the Proplex screen (box 2 condition 26) was
diffracted at the Diamond Light Source. The result in figure 17 shows the diffraction
pattern of the RomR N crystal which was able to diffract at 9.18A.
Figure 17: The diffraction pattern of RomR N shown both in the normal form (A) and
the inverted form (B). The crystal was grown in 0.1 M sodium acetate (pH 5.0) and 2
M ammonium sulphate and diffracted at the Diamond Light Source. The crystal was
able to diffract at 9.18 A.
117
Discussion
The only protein in this study that was soluble in the cell lysate was RomR.
Consequently RomR was also the only protein that was able to be crystallized. All
other proteins Bd 1482, 3099 and 3100 were produced as insoluble proteins and were
not able to be purified and crystallized. These proteins went through a vigorous
refolding procedure to try and resolubolise them. This was met with limited success
and is discussed later. Unfortunately Bd 2093 was not able to be made into a
recombinant protein due to PCR complications and time restraints.
RomR
Two versions of RomR had already been produced which contained a His tag
at either the N or C terminal. These two types of RomR were created because it was
unknown what affect the His tag had on purification of this protein. First a RomR N
cell pellet which was previously cultured was tested on its ability to purify. The results
showed that the N terminal His tag bound the nickel affinity column with a high
enough specificity to allow for high levels of purity and concentration purification.
The few contaminating proteins which were present would have been lost during the
dialysis procedure resulting in highly pure sample of RomR N ready for crystallization.
The C terminal His tagged RomR was still tested to evaluate whether or not it
would produce the similar or higher levels of purification as there was a sizeable
amount of RomR N flowed through the nickel affinity column. RomR C was cultured

118
under the same conditions as RomR N except instead of using Kanamycin as the
antibiotic Spectinomycin was used. This should not have an effect on the purification
as it only used for sterility and to select for the cells which contain the antibiotic
resistant gene in the plasmid and therefore RomR C. Figure 8 shows there were
similar amounts of RomR C in the flow through as in the supernatant indicating it did
not bind to the nickel affinity column. This was confirmed when RomR C was
attempted to be eluted off the column as there was no significant peaks in the elution
profile and the SDS gel reinstated this by showing no signs of eluted RomR C. To
overcome this problem a lower level of imidazole (5mM) in buffer A was used when
loading the flow through back onto the nickel affinity column. Imidazole is used to
cleave the proteins off the nickel affinity column by interacting with the His tag.
When a too high concentration of imidazole is used in buffer A the proteins will not
be able to bind to the column and simply get washed through. Lower the
concentration of imidazole should allow for RomR C to bind tighter to the column.
This was not the case as shown in figure 8 where it is clear RomR C once again did not
bind to the column as was only seen in the flow through.
The results show that RomR with the His tag at the N terminal was able to
bind to the nickel affinity column and be purified to a much greater than RomR C. For
this reason RomR N was used in the consequence purification and RomR C was not
further investigated. Not enough RomR N was produced from the single cell pellet to
allow for crystal screens so more was produced under the same condition as this had
previously led to a high purity and concentration of the protein. This resulted in RomR

119
N being purified to a concentration of around 20 mg/ml which is high enough for
crystallization.
Out of the three crystal screens done one RomR N only 16 of them produced
crystals. Not all of these crystals were protein crystal but were in fact salt crystals,
which is very common in crystallography. Some of the conditions were hard to
determine if the crystal was salt or protein but one of the conditions in the Proplex
screen produced a protein crystal that was large enough for diffraction experiment.
The diffraction patter shown in figure 17 proves this crystal can diffract at around 9 A.
To gain a better resolution and more detailed structure of RomR custom crystal
screens need to be used. These will allow for a fine tuning of the condition that
produced the diffracting crystal and hopefully produce a better structured crystal
suitable for diffraction.
PCR and Sequencing
This first step in the PCR process is primary PCR which entails producing PCR
primers that will clone our genes of interest. In this study our genes of interest are Bd
2093 and 3099 each having individual primers produced for them. The annealing
temperature was known to be 50oC for Bd 3099 from previous experiments done my
another member of the team, not shown here. To make sure this previous data was
correct a 50oC annealing temperature was used in primary PCR and as shown in figure
1 that annealing temperature was suitable for the selection of Bd 3099. As for Bd
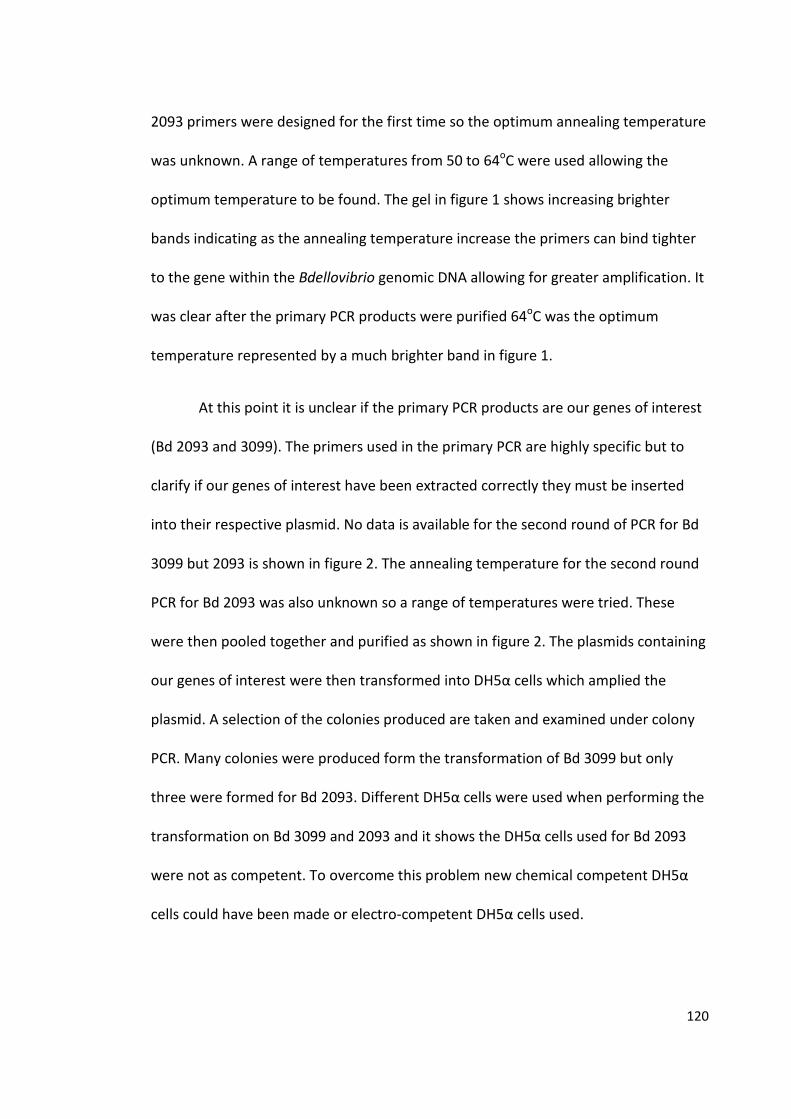
120
2093 primers were designed for the first time so the optimum annealing temperature
was unknown. A range of temperatures from 50 to 64oC were used allowing the
optimum temperature to be found. The gel in figure 1 shows increasing brighter
bands indicating as the annealing temperature increase the primers can bind tighter
to the gene within the Bdellovibrio genomic DNA allowing for greater amplification. It
was clear after the primary PCR products were purified 64oC was the optimum
temperature represented by a much brighter band in figure 1.
At this point it is unclear if the primary PCR products are our genes of interest
(Bd 2093 and 3099). The primers used in the primary PCR are highly specific but to
clarify if our genes of interest have been extracted correctly they must be inserted
into their respective plasmid. No data is available for the second round of PCR for Bd
3099 but 2093 is shown in figure 2. The annealing temperature for the second round
PCR for Bd 2093 was also unknown so a range of temperatures were tried. These
were then pooled together and purified as shown in figure 2. The plasmids containing
our genes of interest were then transformed into DH5α cells which amplied the
plasmid. A selection of the colonies produced are taken and examined under colony
PCR. Many colonies were produced form the transformation of Bd 3099 but only
three were formed for Bd 2093. Different DH5α cells were used when performing the
transformation on Bd 3099 and 2093 and it shows the DH5α cells used for Bd 2093
were not as competent. To overcome this problem new chemical competent DH5α
cells could have been made or electro-competent DH5α cells used.
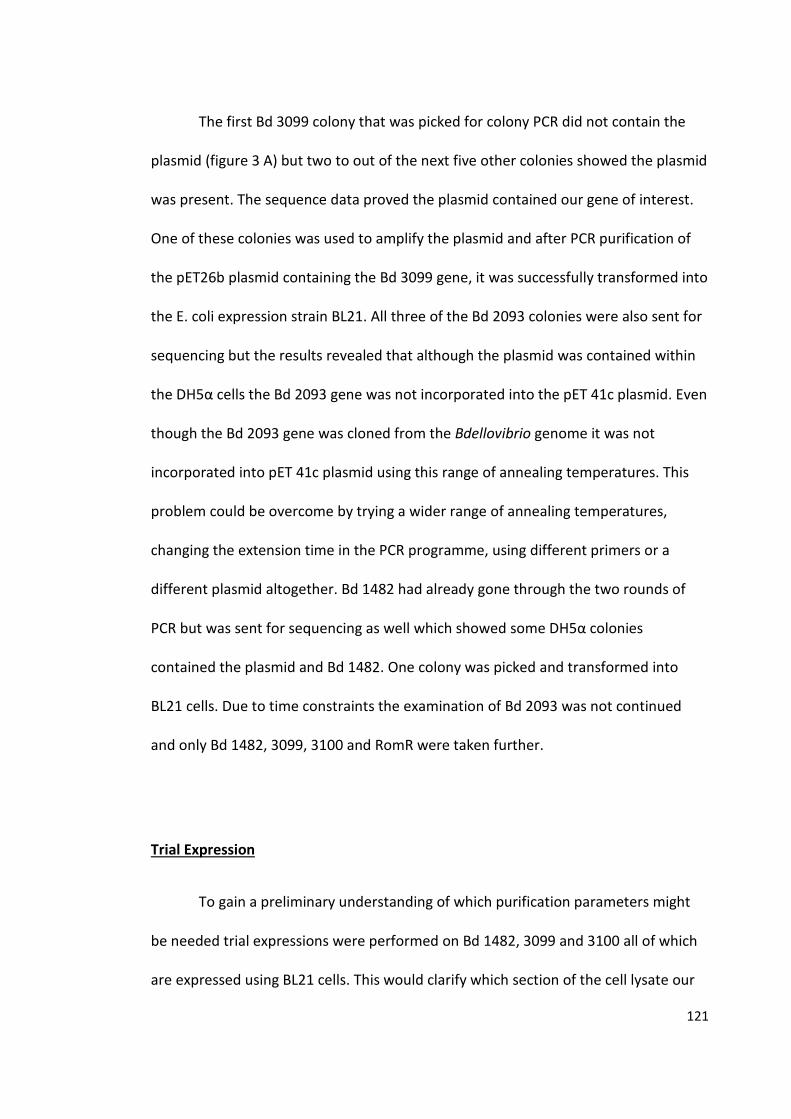
121
The first Bd 3099 colony that was picked for colony PCR did not contain the
plasmid (figure 3 A) but two to out of the next five other colonies showed the plasmid
was present. The sequence data proved the plasmid contained our gene of interest.
One of these colonies was used to amplify the plasmid and after PCR purification of
the pET26b plasmid containing the Bd 3099 gene, it was successfully transformed into
the E. coli expression strain BL21. All three of the Bd 2093 colonies were also sent for
sequencing but the results revealed that although the plasmid was contained within
the DH5α cells the Bd 2093 gene was not incorporated into the pET 41c plasmid. Even
though the Bd 2093 gene was cloned from the Bdellovibrio genome it was not
incorporated into pET 41c plasmid using this range of annealing temperatures. This
problem could be overcome by trying a wider range of annealing temperatures,
changing the extension time in the PCR programme, using different primers or a
different plasmid altogether. Bd 1482 had already gone through the two rounds of
PCR but was sent for sequencing as well which showed some DH5α colonies
contained the plasmid and Bd 1482. One colony was picked and transformed into
BL21 cells. Due to time constraints the examination of Bd 2093 was not continued
and only Bd 1482, 3099, 3100 and RomR were taken further.
Trial Expression
To gain a preliminary understanding of which purification parameters might
be needed trial expressions were performed on Bd 1482, 3099 and 3100 all of which
are expressed using BL21 cells. This would clarify which section of the cell lysate our

122
protein was contained in. When the protein is contained within the supernatant of
cell lysate it is most likely to be soluble as insoluble protein will aggregate and form
an insoluble pellet or inclusion bodies. RomR had already proven to be produced in
the supernatant of the cell lysate and optimal conditions for expression were known
so no trial expression was carried out.
Pervious experiments had shown that Bd 3100 expresses as an insoluble
protein, so to confirm this and to try and solve the problem trail expressions were
performed. A whole cell sample and a supernatant sample of Bd 3100 which was
expressed at two different temperatures over range of IPTG concentrations was
analysed on an SDS gel (figure 4). The whole cell sample confirms the protein is being
expressed but is not contained within the supernatant. The trial was performed at 20
and 37oC to investigate if different temperatures would results in a more soluble
protein. That was also the idea behind using different concentrations of IPTG. When
higher concentrations of IPTG are added to activate the expression of proteins it can
result in a massive over production of the protein which could result in protein
aggregation and insolubility. This is because large amounts are produced rapidly
which is why using lower concentrations of IPTG many help keep the protein soluble.
As Bd 3100 was only contained in the whole cell sample at both temperatures and all
IPTG concentrations it is likely to be an insoluble protein and will need a more
extensive purification procedure.
The trial expression of Bd 1482 was performed in a similar way but this time it
was all produced at 20oC. The difference was instead of changing the temperature the

123
strength of the LB would be changed along with the IPTG concentration. The strength
of the LB can affect the growth of the BL21 expression strain and therefore impact
the amount of protein produced. Different time points were also taken to see if a
change in the LB and IPTG would affect the rate at which Bd 1482 is produced. Figure
5 shows the results of this trail and indicate a change in the LB and IPTG have an
effect on protein production but only in the early stages of expression. The whole cell
sample at 5 hours proved a lower strength (1x) LB enable the cells to produces more
Bd 1482 compared to 2x LB, both having been induced with 50µM IPTG. This shows
that higher strengths of LB slow the production of this protein early on but after 20
hours there was no difference between of the condition indicating this in not a
deciding factor for Bd 1482 production. Unfortunately Bd 1482 was not produced in
supernatant of the cell lysate indicating it would also be an insoluble protein. With
this in mind the condition chosen for large scale expression was 2x LB inducing with
500µM IPTG.
Bd 3099 also underwent the same trail expression as Bd 1482 but this time
was produced in the supernatant of the cell lysate along with the whole cell. 3-4
hours after inoculation only minimal amounts of Bd 3099 were produced in whole cell
and supernatant of 1x LB with 50µM IPTG so it was known that this protein could not
be produced quickly. After 20 hours all whole cell and supernatant samples, except 2x
LB with 500 µM IPTG, showed similar production levels. The higher strength LB
combined with highest IPTG concentration appeared to significantly reduce the
production in the whole cell sample and almost abolishes it in the supernatant. This
shows that once again different concentrations of IPTG will affect the production of
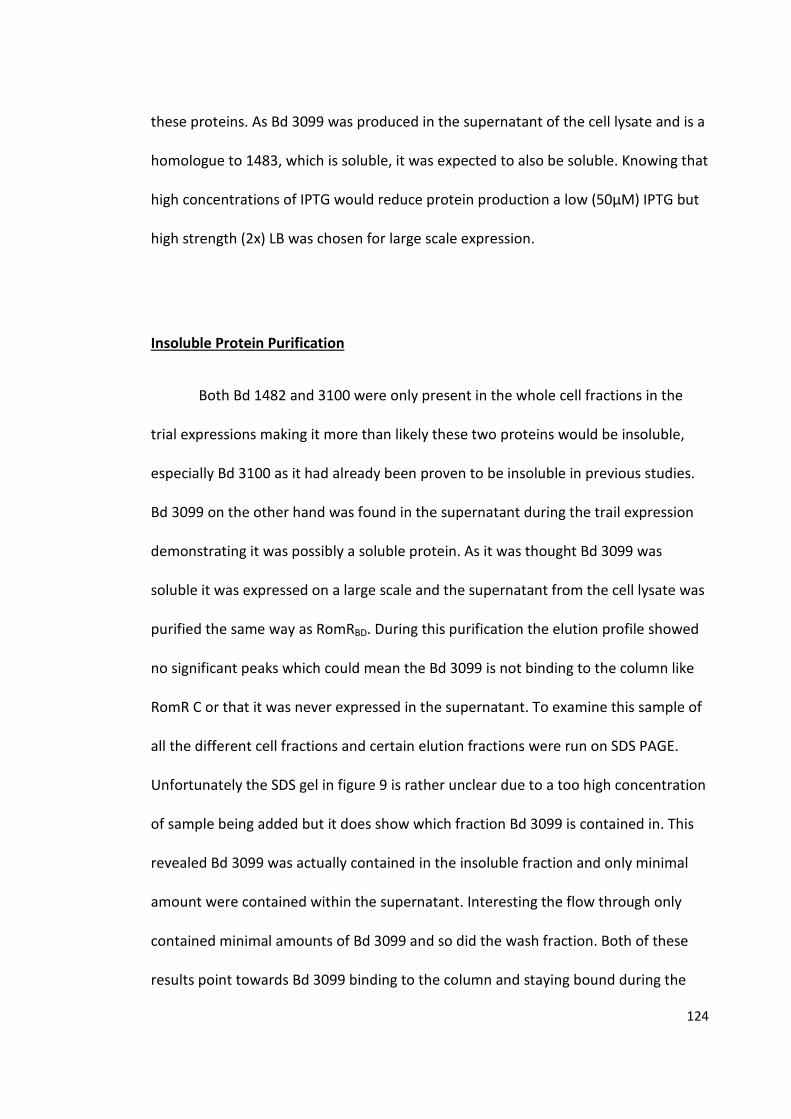
124
these proteins. As Bd 3099 was produced in the supernatant of the cell lysate and is a
homologue to 1483, which is soluble, it was expected to also be soluble. Knowing that
high concentrations of IPTG would reduce protein production a low (50µM) IPTG but
high strength (2x) LB was chosen for large scale expression.
Insoluble Protein Purification
Both Bd 1482 and 3100 were only present in the whole cell fractions in the
trial expressions making it more than likely these two proteins would be insoluble,
especially Bd 3100 as it had already been proven to be insoluble in previous studies.
Bd 3099 on the other hand was found in the supernatant during the trail expression
demonstrating it was possibly a soluble protein. As it was thought Bd 3099 was
soluble it was expressed on a large scale and the supernatant from the cell lysate was
purified the same way as RomRBD. During this purification the elution profile showed
no significant peaks which could mean the Bd 3099 is not binding to the column like
RomR C or that it was never expressed in the supernatant. To examine this sample of
all the different cell fractions and certain elution fractions were run on SDS PAGE.
Unfortunately the SDS gel in figure 9 is rather unclear due to a too high concentration
of sample being added but it does show which fraction Bd 3099 is contained in. This
revealed Bd 3099 was actually contained in the insoluble fraction and only minimal
amount were contained within the supernatant. Interesting the flow through only
contained minimal amounts of Bd 3099 and so did the wash fraction. Both of these
results point towards Bd 3099 binding to the column and staying bound during the

125
wash step. Although this might be true Bd 3099 was not biding to the column in the
manner it was intended, by using the His tag. Instead, because of the insolubility of
Bd 3099 it was aggregating inside the column forming small insoluble masses that
were not able to pass through the column. The reason they were not eluted off
during the wash step or any of the elution step was because Bd 3099 was not bound
using the His tag. The small insoluble masses the Bd 3099 would have formed would
block many of the His tags from binding and as the protein has aggregated together.
Only a small amount of Bd 3099 was eluted off showing that some was able to bind.
This meant that Bd 3099 was not completely insoluble but could be solubilised and
purified using different purification methods. Before this was tried the supernatant of
a second Bd 3099 was purified in the same way. Once again it showed similar results
as the first experiment with large amounts in the insoluble fraction and none eluted
off the column. Upon seeing this result it was clear that a different purification
method was needed.
During the trail expression of Bd 1482 only the whole cell sample contained Bd
1482 with the supernatant showing no signs of the protein. This pointed to the
prediction that Bd 1482 was an insoluble protein. When sample from the large scale
expression were analysed it was still not clear if Bd 1482 was insoluble as all the cells
sample lanes merged together. What figure 10 A does show is that the elution
factions which have a distinct lack of Bd 1482. This led to the conclusion that either
Bd 1482 was an insoluble protein or was not binding to the column for another
reason such as the problems with the column or too high a concentration of
imidazole was used in buffer A. The evidence pointed towards Bd 1482 being an

126
insoluble protein but not completely insoluble as small amounts were eluted off just
like Bd 3099. A simple refolding procedure was tested on Bd 1482 which should allow
the protein to unfolded and then refolded into a more soluble protein. This entailed
refolding the insoluble fraction of Bd 1482 in a 6M urea buffer which was then slowly
bought down to 0M. What this does is allow the protein to unfold and then slowly
refold exposing the His tags allowing the protein to bind to the column. Instead if
using a step wise approach to eluting off Bd 1482 a gradient from 20mM to 500mM
imidazole was run. Unfortunately the procedure did not work as planned as there
were no significant peaks on the elution profile indicating no protein was eluted off.
No elution samples were taken to be analysed and it was concluded that for both Bd
1482 and 3099 that different refolding purification step were needed. This would
potentially allow for the proteins to be refolded it the correct way allowing for
purification.
Refolding Insoluble Proteins Bd 1482, 3099 and 3100
It was clear from the result of the initial insoluble protein purification that a
different approach was needed to purify these proteins. A refolding protocol from
Vincentelli was used and modified to accommodate for the properties of these
proteins. The refolding procedure briefly it comprises of collecting the insoluble
fraction of the cell lysate and performing an extra detergent wash step, solubilisation
and purification in a GuHCl buffer, refolding buffer screen test and then a final
purification step. The idea behind this strategy is the first detergent wash would

127
remove any other cellular debris which was left behind form the previous step and
help to solubilise the protein. This sample would then be solubilised in a 6M GuHCl
buffer. The high concentration of GuHCl allows the protein to become much more
soluble and creates an environment suitable for purification because the protein will
not be able to form insoluble masses on the column as easily. This is also partly due
to the larger 5mL bed volume of the drip column allowing for a greater area for the
protein to bind to the column and less likely to interact with each other. Also by using
a low concentration of imidazole (5mM) in the GuHCl buffer it would allow for a
tighter binding to the column if the protein was struggling to bind due to imidazole
concentrations. Once the protein is eluted off using a high imidazole GuHCl buffer it
would be tested against a screen of buffers comprising of 4 different buffers and 6
different additives. Not only does the screen of 24 different buffers and their
additives give the protein a variety of different conditions for refolding but it also
dilutes the protein 20 times. This is a process called rapid dilution which can help the
protein refold into its original state as it is not as probable to interact with other
proteins. Depending on what the buffer contains a suitable final purification step is
used to increase concentration and purity.
The results for the refolding buffer screen on Bd 3099 showed six potential
buffer which would allow for it to refold and not precipitate out of solution. From
these six buffers three were used for larger scale dilution each contain a different
buffer that was successful in the buffer screen. This would allow us to see the effect
these different buffers have on the Bd 3099. The Tris and CHES buffer were the most
successful with them purifying to around 20 and 40 mg/mL respectively. These two

128
buffers are compatible with the nickel affinity column unlike the NaAc buffer which
had to be used on an ion exchange column but this led to an unsuccessful purification
of the Bd 3099. The buffers that were compatible with the nickel affinity column
allowed for the refolded 3099 to use its His tag, bind to the column and elute of with
high concentration of imidazole just like the soluble RomR N. The Tris and CHES Bd
3099 samples were put through a size exclusion column to check for contaminants
but it revealed no contaminants. This meant this method could be reproduced to
purify insoluble Bd 3099 to a high enough purity and concentration for crystallisation.
Although this refolding method does produce refold protein that can be purified and
potentially crystallized it is a complicated, long and expensive process and other
methods may be easier and less time consuming.
There are of course disadvantages to using this method, first it being very time
consuming with multiple overnight steps. Although the GuHCl buffer does a very good
job at making Bd 3099 soluble the initial purification of it on the nickel drop column
was a very slow process. The drip column was used to give a larger bed volume
allowing more space for Bd 3099 but the high concentration of GuHCl made the
column run very slowly. The GuHCl can precipitate very quickly which cause the
column to clog up and there is no pressure in these columns to help force Bd 3099
through. Once Bd 3099 had been eluted off it was just a matter of find a suitable
buffer for it to refold in without precipitating out of solution. The one problem with
the buffer screen was it contained buffers with NaAc and EDTA in them. These two
compounds cannot be used on a nickel column but if the EDTA containing buffers are
supplemented with MgCl they can be used on nickel column. Unfortunately NaAc
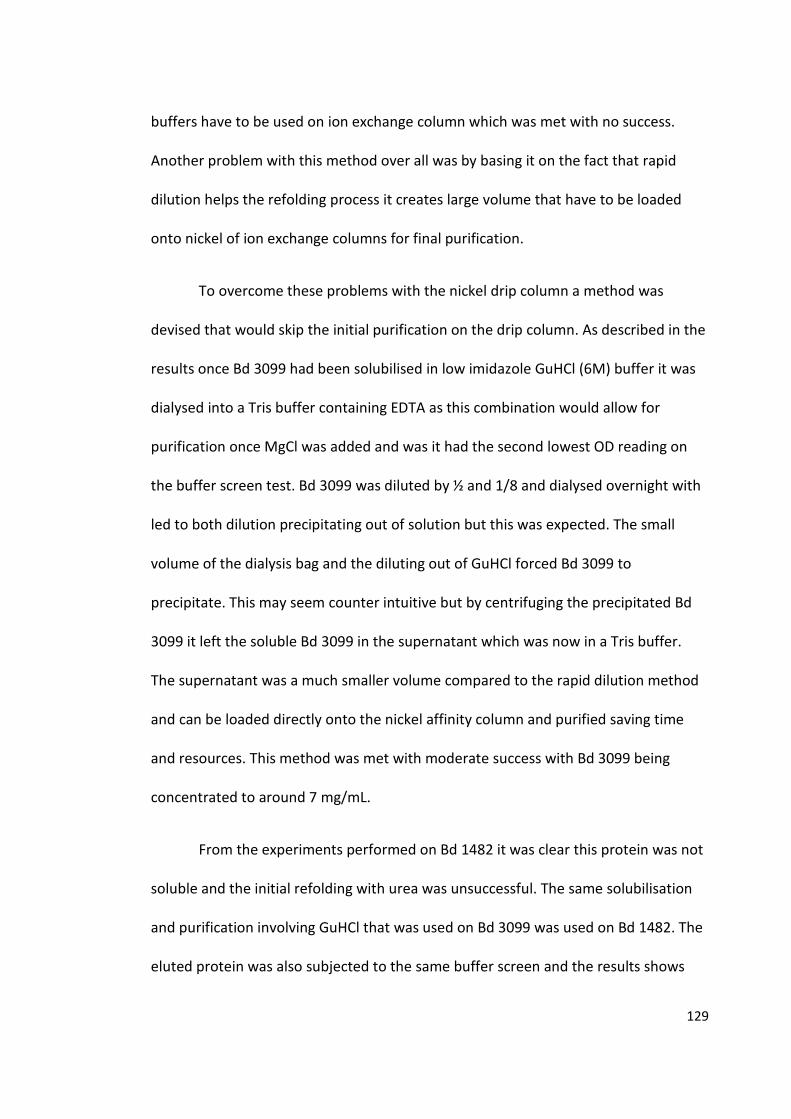
129
buffers have to be used on ion exchange column which was met with no success.
Another problem with this method over all was by basing it on the fact that rapid
dilution helps the refolding process it creates large volume that have to be loaded
onto nickel of ion exchange columns for final purification.
To overcome these problems with the nickel drip column a method was
devised that would skip the initial purification on the drip column. As described in the
results once Bd 3099 had been solubilised in low imidazole GuHCl (6M) buffer it was
dialysed into a Tris buffer containing EDTA as this combination would allow for
purification once MgCl was added and was it had the second lowest OD reading on
the buffer screen test. Bd 3099 was diluted by ½ and 1/8 and dialysed overnight with
led to both dilution precipitating out of solution but this was expected. The small
volume of the dialysis bag and the diluting out of GuHCl forced Bd 3099 to
precipitate. This may seem counter intuitive but by centrifuging the precipitated Bd
3099 it left the soluble Bd 3099 in the supernatant which was now in a Tris buffer.
The supernatant was a much smaller volume compared to the rapid dilution method
and can be loaded directly onto the nickel affinity column and purified saving time
and resources. This method was met with moderate success with Bd 3099 being
concentrated to around 7 mg/mL.
From the experiments performed on Bd 1482 it was clear this protein was not
soluble and the initial refolding with urea was unsuccessful. The same solubilisation
and purification involving GuHCl that was used on Bd 3099 was used on Bd 1482. The
eluted protein was also subjected to the same buffer screen and the results shows

130
the only buffers which caused minimal or no precipitation were NaA buffers. Two
NaAc buffers were scaled up but this meant they could not be used on the nickel
column for the secondary purification. One idea to overcome this problem as the ion
exchange did not work for Bd 3099 in NaAc buffer was to slowly change the buffer
and pH. The pH of the buffers needed to be at least pH 6.5 before they can be used
on the nickel affinity columns in the AKTA. This was done by adding 1M Tris buffer at
pH 7.5 to the NaAc buffer with EDTA but did not work as Bd 1482 precipitated out of
solution at around pH 6.4. As the pH gets closer to pI of the protein it is more likely to
precipitate out of solution. The pI of Bd 1482 is around 6 so it was not surprising it
precipitated at pH 6.4. The other buffer that was scaled up was NaAc with glucose
and purified on and ion exchange column. No protein was eluted off with the ion
exchange so a different purification strategy is need. One idea to circumvent these
problems could be to dialyse the NaAc buffers against a Tris buffer with a high
enough pH for nickel column purification.
The same principle of changing the pH of the buffer was used on Bd 3100 as
well but with greater range of buffers. The buffer screen showed that once again only
NaAc buffers did not precipitate. One NaAc buffer containing NaCl was then test
against an array of different buffers at different pH values by adding 50µl of Bd 3100
to 450µl of the chosen buffer. This would show if Bd 3100 could stay soluble when
changing buffers and pH. The results revealed three of the buffers contained only
minimal precipitation but were not tested for use in the AKTA. The best candidate for
this would probably a Tris buffer as Bd 3100 was able to stay soluble over a pH range.

131
Testing against other buffers at different pH values would also be a useful follow up
to get a better understanding of how to purify Bd 3100.

132
Conclusion
The aim of this project was to gain better structural knowledge of five
Bdellovibrio proteins. All of these proteins are thought to be involved in the attack
phase of the Bdellovibrio life cycle. Understanding their structure will help gain insight
into the function of these proteins and a more detailed understanding of how
Bdellovibrio functions. This structural information obtained in this study was
produced from x-ray crystallography. In order to create protein crystals suitable for x-
ray crystallography the protein must be of high purity and concentration. The main
goal of this project was to produce these five Bdellovibrio proteins to a high enough
stand for x-ray crystallography.
The five proteins in this study started at different points along the purification
procedure. The genes of two proteins Bd 2093 and 3099 had to be extracted and
integrated into expression plasmids before proteins production and purification could
be performed. Both Bd 2093 and 3099 were successfully extracted from Bdellovibrio
genomic DNA but only Bd 3099 was incorporated in its expression plasmid. Bd 1482
was already integrated into its expression plasmid was able to be transformed along
with Bd 3099 into BL21 cells ready for protein production. Bd 3100 and RomR had
already successfully been produced making it four out of the five proteins were able
to be produced during this study.
Four proteins were able to be produced the but only one of them (RomR) was
purified and concentrated to a high enough standard for crystallisation. The main
reason why the other three proteins (Bd 1482, 3099 and 3100) were not able to be

133
crystallised was because of their insolubility. It was known before this study that Bd
3100 was an insoluble protein so different culturing techniques were used to try and
produce soluble protein. Varying the temperature and IPTG concentration had no
effect on protein solubility and so the refolding procedure was attempted on the
insoluble protein. This proved difficult as Bd 3100 could only refold in low pH NaAc
buffers which are not suitable for purification on a nickel affinity column. Trying to
change the buffer through rapid dilution to a different buffer (Tris, CHES, HEPES or
MES) with a higher pH also proved mostly ineffective. To get around this problem a
larger buffer screen would be useful or instead of rapidly diluting the NaAc buffer it
could be done through dialysis and then remove the precipitate as done with Bd
3099.
During the trail expression Bd 1482 was only found in the whole cell fraction
indicating it was most likely insoluble. After the supernatant of the cell lysate showed
no signs of purified protein when run through the nickel column and initial refolding
experiment was performed. The insoluble fraction was re-suspended in 6M urea
which was then slowly diluted down to 0M. Eluting Bd 1482 off with a gradient from
20mM imidazole to 500mM was unsuccessful. Bd 1482 was able to be resolubilised
and purified in GuHCl but could only be refolded in NaAc buffer. Attempting to
change the buffer with a 1M Tris buffer at pH 7.5 was not possible above pH 6.5. Ion
exchange was also tried out and was once again unsuccessful but perhaps trying the
similar future strategies as Bd 3100 could help to purify this insoluble protein.
134
The purification of Bd 3099 was the most successful out of the insoluble
proteins. When tested on the buffer screen it was able to be refolded in NaAc, Tris
and CHES buffers. The Tris and CHES buffers were able to purified to around 20 and
40 mg/mL respectively. They were tested on a size exclusion column to check for
impurities and or if dimmers had formed but both came out clean. The NaAc buffer
was run through an ion exchange column but no protein was purified. This shows that
by solubilising and purifying in GuHCl then refolding in Tris or CHES Bd 3099 can be
purified to high enough standard for crystallisation. Purification without the initial
purification in GuHCl was also carried out on Bd 3099 as the drip column used for this
initial purification proved time consuming and troublesome. After solubilisation with
GuHCl Bd 3099 it was diluted to two different concentration (1/2 and 1/8 the original
concentration) and then dialysed into a Tris buffer. After the precipitated protein was
pelleted the soluble fraction was purified to around 7 mg/ml. Optimising this
procedure might help save time and resources in producing soluble Bd 3099 for
crystallisation.
The only protein during this study that was able to be crystallised was RomR.
RomR had previously been expressed with the His tag at the N and C terminal but it
was unknown which one purified better. The N terminal His tag proved to be most
effective with RomR N purifying to around 20 mg/ml. This was then used to create
protein crystals that were suitable for x-ray diffraction. Only one crystal formed in a
condition from the Proplex screen but many other showed signs of crystallisation. By
optimising these conditions it would be possible to produce more crystals that could
give a better diffraction. The crystal that was produced was only able to diffract at
135
around 9 A so greater resolution is need to gain full structural knowledge of this
protein.
The overall goal of this project was to produce purified Bdellovibrio proteins
that could create crystals of x-ray crystallography. Out of the five proteins examined
in this study the only one to crystallise and diffract was RomR N. The other proteins
were not as successful but Bd 3099 can now be refolded and purified ready for
crystallisation. Unfortunately both Bd 1482 and Bd 3100 were not able to be
produced soluble and could only refold in NaAc buffer which are not suitable for
affinity chromatography and ion exchange did not work. All in all the overall goal was
achieved with varying degrees of success with RomR crystallising, Bd 3099 refolding
and Bd 1482 and 3100 needing some optimisation.
Further studies could include the optimisation of the refolding
procedure for Bd 1482, 3099 and 3100. But as this is a long and fairly expensive
process out ways of producing these proteins as soluble proteins may be more
effective and less time consuming. One way to overcome the insolubility problem
would be to produce these proteins in the cytoplasm of the BL21 expression strain. As
for Bd 2093, which was not successfully cloned into a plasmid, needs more
investigation and maybe making different PCR primers. This might allow for the
cloning of Bd 2093 and insertion into a plasmid.
136
References
Amikam D and Galperin MY. (2006). PilZ domain is part of the bacterial c-di-GMP
binding protein. Bioinformatics; 22: 3-6.
Ash M, Faelber K, Kosslick D. (2010). Conserved β-hairpin recognition by the GYF
domains of Smy2 and GIGYF2 in mRNA surveillance and vesicular transport
complexes. Structure; 18: 944-954.
Capeness MJ, Lambert C, Lovering AL. (2013). Activity of Bdellovibrio Hit Locus
Proteins, Bd0108 and Bd0109, Links Type IVa Pilus Extrusion/Retraction Status to
Prey-Independent Growth Signalling. PloS one; 8 (11)
Dwidar M and Mitchell RJ. (2012). The dual probiotic and antibiotic nature of
Bdellovibrio bacteriovorus. Biochemistry and Molecular Biology Reports; 45: 71-78.
Hobley L, Fung RK, Lambert C. (2012). Discrete cyclic di-GMP-dependent control of
bacterial predation versus axenic growth in Bdellovibrio bacteriovorus. PLoS
pathogens; 8 (2): e1002493.
Kaiser D, Robinson M, Kroos L. (2012). Myxobacteria, Polarity, and Multicellular
Morphogenesis. Cold Spring Harb Perspect Biol 2

137
Keilberg D, Wuichet K, Drescher F, Søgaard-Andersen L (2012). A Response Regulator
Interfaces between the Frz Chemosensory System and the MglA/ MglB GTPase/GAP
Module to Regulate Polarity in Myxococcus xanthus. PLoS Genet; 8
Kofler M and Freund C. (2006). The GYF domain. FEBS Journal; 273: 245-256.
Kofler M, Motzny K and Freund C. (2005). GYF domain proteomics reveals interaction
sites in known and novel target proteins. Molecular & cellular proteomic :MCP; 4:
1797-1811.
Krasteva PV, Giglio KM and Sondermann H. (2012). Sensing the messenger: The
diverse ways that bacteria signal through c-di-GMP. Protein Science; 21: 929-948.
Lambert C, Morehouse KA, Chang C. (2006). Bdellovibrio growth and development
during the predatory cycle. Current opinion in microbiology; 9: 639-644.
Lambert C, Fenton AK, Hobley L. (2011). Predatory Bdellovibrio bacteria use gliding
motility to scout for prey on surfaces. Journal of Bacteriology; 193: 3139-3141.
Lerner TR, Lovering AL, Bui NK. (2012). Specialized peptidoglycan hydrolases sculpt
the intra-bacterial niche of predatory Bdellovibrio and increase population fitness.
PLoS pathogens; 8
Lovering AL, Capeness MJ, Lambert C. (2011). The structure of an unconventional HD-
GYP protein from Bdellovibrio reveals the roles of conserved residues in this class of
cyclic-di-GMP phosphodiesterases. mBio; 2

138
Milner DS, Till R, Cadby I, Lovering AL, Basford SM, et al. (2014) Ras GTPase-Like
Protein MglA, a Controller of Bacterial Social-Motility in Myxobacteria, Has Evolved to
Control Bacterial Predation by Bdellovibrio. PLoS Genet 10(4)
Rendulic S, Jagtap P, Rosinus A. (2004). A predator unmasked: life cycle of
Bdellovibrio bacteriovorus from a genomic perspective. Science; 303: 689-692.
Ryan RP, Tolker-Nielsen T and Dow JM. (2012). When the PilZ don’t work: effectors
for cyclic di-GMP action in bacteria. Trends in microbiology; 20: 235-242.
Ryan RP. (2013).Cyclic di-GMP signalling and the regulation of bacterial virulence.
Microbiology; 159: 1286-1297.
Ryjenkov DA, Simm R, Romling U. (2006). The PilZ domain is a receptor for the second
messenger c-di-GMP: the PilZ domain protein YcgR controls motility in
enterobacteria. The Journal of biological chemistry; 281: 30310-30314.
Saxena IM and Brown RM. (1995). Identification of a second cellulose synthase
gene (acsAII) in Acetobacter xylinum. J. Bacteriol; 177: 5276–5283.
Shilo M. (1969). Morphological and physiological aspects of the interaction of
Bdellovibrio with host bacteria. Curr. Top. Microbiol. Immunol; 50:174–204
Sockett RE. (2009). Predatory lifestyle of Bdellovibrio bacteriovorus. Annual Review of
Microbiology; 63: 523-539.
139
Thomashow MF and Cotter TW. (1992)s Bdellovibrio host dependence: the search for
signal molecules and genes that regulate the intraperiplasmic growth cycle. Journal of
Bacteriology; 174: 5767-5771.
Vincentelli R, Canaan S, Campanacci V. (2004). High-throughput automated refolding
screening of inclusion bodies. Protein Science; 13: 2782-2792.