Embed Size (px)
Citation preview
Project 05-07 Techniques for Prevention and Remediation of Non-Load Related Distresses on HMA Airport Pavements (Phase I)
Airfield Asphalt Pavement Technology Program (AAPTP)
FINAL REPORT
Submitted by:
Douglas I. Hanson AMEC Earth and Environmental
Dr. Gayle King
GHK, Inc
Dr. Mark Buncher The Asphalt Institute
John Duval
The Asphalt Institute
Phil Blankenship The Asphalt Institute
Mike Anderson
The Asphalt Institute
April 6, 2009

ACKNOWLEDGEMENT OF SPONSORSHIP This report has been prepared under the Airport Asphalt Pavement Technology Program (AAPTP). Funding is provided by the Federal Aviation Administration (FAA) under Cooperative Agreement Number 04-G-038. Dr. David Brill is the Contracting Officer’s Technical Representative and a Program Manager in the FAA Technology R & D Branch at the William J. Hughes Technical Center. Mr. Monte Symons served as the Project Director for this project. The AAPTP and the FAA thank the Project Technical Panel that willingly gave of their expertise and time for the development of this report. They were responsible for the oversight and the technical direction. The names of the individuals on the Technical Panel are as follows:
1. Monte Symons 2. Jeffrey L. Rapol 3. Gregory Cline 4. Mike DeVoy 5. John D’Angelo
DISCLAIMER The contents of this report reflect the views of the authors, who are responsible for the facts and the accuracy of the data presented within. The contents do not necessarily reflect the official views and policies of the Federal Aviation Administration. The report does not constitute a standard, specification or regulation. Neither the authors nor the United States Government endorse products or manufacturers. Company or equipment manufacturer’s names appear herein only because they are considered essential to the purpose of this report.

TABLE OF CONTENTS
Chapter 1 - Introduction 1 Problem Statement 1 Objectives 1 Research Approach 1 Scope of this Report 3 Chapter 2 - Factors Contributing to Non-Load Related Distress 4 Climate Conditions 4 Thermal Shrinkage Stresses Warping Stresses Resulting from Thermal Gradients in the Pavement Age Hardening of Binders Effect of Moisture on Age Hardening of Asphalt Binders Solar Radiation Crude Source and Asphalt Chemistry 7 Mixture Variables 9 Aggregate Absorptivity Binder PG Grade Binder Additives Pavement Variables 11 Temperature Gradient Exposure to Oxygen Interconnected Air Voids Conclusions 12 References 14 Chapter 3 - Geographical Distribution of Airfields Potentially Exhibiting
Specific Non-Load Related Distress 15
Data Sources 16
Data Acquisition and Comparison 16 Findings 17 Percent Non-load Associated Distress by State Effect of Climate and Age on Non-Load Associated Distress Conclusions 27

Chapter 4 - Products and Procedures Currently Being Used To Correct and/or Prevent Non-Load Associated Distresses In Airfield Pavements 28
Products and Procedures 28 Preventive Sealers and Rejuvenators Sealers Procedures Using Aggregates
Crack Sealing and Filling Ultrathin Overlays
Thin Overlays Interlayer/Sealers Systems
Hot In-Place Recycling Cold In-Place Recycling Techniques Being Used by State Aviation Agencies 49 Telephone Survey Field Visits
Guidance on Appropriate Preventive or Mitigation Method to be Used 53
Timing 57 Overview Pavement Preservation and Reconstruction Triggers Study to Evaluate Critical PCI’s
Conclusion 72 References 73 Chapter 5 - Laboratory Test Procedures That Can be used to Define
the Extent and Nature of Non-Load Associated Distress 74 Aging of Asphalt Binders 74 California Tilt-Oven Durability Test (TDOT) Thin-Film Accelerated Aging Test (TFAAT) Rotating Cylinder Aging Test (RCAT) Thin-Film Oven (TFOT) Rolling Thin-Film Oven (RTFO) Pressure Aging Vessel (PAV) Aging of HMA Mixtures 77 Short-term Oven Aging Long-term Oven Aging (Conditioning) of Prepared Specimens Weatherometer Laboratory Tests That Could be Used to Evaluate Long Term Aging 78 Static Bending Beam Using the BBR G* From the Dynamic Shear Rheometer DSR Creep Testing Dynamic Modulus Superpave Indirect Tensile (IDT) Strength Viscosity of Extracted Binders M-value of Extracted Binders
Disk-Shaped Compact Tension Test (DC(T)) Laboratory Study 80 Test Matrix and Materials Preparation Testing Results Conclusions Recommendations References 89 Chapter 6 - Test Plan for Phase II Study 90 Conclusions 90 Phase II Test Plan 90 Appendix A – Chemistry of Asphalt Aging 92 Appendix B - Geographical Extent Of HMA Airfields Exhibiting Non-Load Related Distress - Data Sources 111 Appendix C – Initial Outline for Guide for Prevention And Mitigation
Of Non-Load Related Distress 123
LIST OF FIGURES
Chapter 2 Figure 2-1 Effect of Air Voids on the Hardening of Asphalt Binders Chapter 3 Figure 3-1 Block Cracking Figure 3-2 Raveling/Weathering Figure 3-3 Map Showing Percent of Non-Load Associated Distress in Each State Figure 3-4 Levels of Severity of Non-Load Associated Distress Figure 3-5 Levels of Severity of For Airfield Features Figure 3-6 Block Cracking vs. Time Alaska Figure 3-7 Block Cracking vs. Time California Figure 3-8 Effect of Aging on Non-load Associated Distress Chapter 4 Figure 4-1 Pavement Aging Figure 4-2 Fog Seal Figure 4-3 CIR on Maple Lake Airport, Minnesota Figure 4-4 Traditional Treatment Strategy Based on Pavement Condition6 Figure 4-5 Pavement Preservation - Optimal Timing of Pavement Treatments Figure 4-6 Pavement Preservation Strategies to Prolong Pavement Life Figure 4-7 Pavement Condition Rating Scale Figure 4-8 Concept of Trigger Points for a Preventive Maintenance Strategy Figure 4-9 Slurry Seal Example Figure 4-10 Overlay Example Figure 4-11 Average PCI versus Age for Arizona Figure 4-12 Average PCI versus Age for Georgia Figure 4-13 Average PCI versus Age for Oregon Figure 4-14 Average PCI versus Age for Wyoming Figure 4-15 Average PCI versus Age for Michigan Chapter 5 Figure 5-1 Illustration of Severe Aging Gradients in Asphalt Pavements Figure 5-2 HMA Pavement Deterioration Curve Figure 5-3 Long-term oven aging of laboratory compacted samples Figure 5-4 DC(T) samples prepared for testing. Figure 5-5 DC(T) Fracture test showing crack-mouth opening displacement (CMOD) gage
and δ25 clip-gage. Figure 5-6 Comparison of CMOD fracture energy for asphalt mixture types subjected to
various aging levels
Appendix A Figure A-1 PG Parameters for a Roofing Flux at Five Oxidation Levels Figure A-2 S critical temperature vs “m-value” critical temperature with PAV aging Figure A-3 Black Space Diagram for Unaged and Aged asphalts in a Rheo-Reactor Appendix B Figure B-1 Schematic View of Data Collection and Analysis Figure B-2 Map Showing Participating States (and Number of Airports) Figure B-3 Screenshot of AAPTP 05-07 Extrapolated Distress Query Figure B-4 Screenshot of AAPTP 05-07 Total Area of Asphalt Pavement Query Figure B-5 Screenshot of LTPPBind Highlighting Ohio Data Figure B-6 Screenshot of LTPPBind Showing Tabular Report for Ohio Weather Station Data Figure B-7 Screenshot of Merged Distress and Temperature Data
LIST OF TABLES Chapter 3 Table 3-1 Levels of Non-Load Associated Distress for each State Table 3-2 Distribution of the Type of Non-Load Associated (NLA) Distress for each State Table 3-3 Weighting Factors for Calculating Distress Index Table 3-4 Block Cracking versus Age Table 3-5 Weathering/raveling versus Age Table 3-6 Comparison of Alaska and Ohio Table 3-7 Block Cracking Comparison Example - Alaska Table 3-8 Block Cracking Comparison Example - Ohio Table 3-9 Weathering/Raveling Comparison Example - Alaska Table 3-10 Weathering/Raveling Comparison Example – Ohio Table 3-11 Summary of Database Statistics for Each State Chapter 4 Table 4-1 Effectiveness of Treatments Based on Pavement Condition Index5 Table 4-2 Product Listing of Sealers/Rejuvenators Table 4-3 Advantages/Disadvantages of Pavement Sealers Table 4-5 Summary of Preventative Maintenance Techniques Being Used by State Aviation
Agencies Table 4-6 Summary of Field Visits Table 4-3 Maintenance and Repair of Flexible Pavement Surfaces – Cracking Table 4-4 Maintenance and Repair of Flexible Pavement Surfaces – Disintegration Table 4-5 Summary of Pavement Maintenance and Rehabilitation Techniques6 Table 4-7 Critical PCI Values Used by the Washington DOT Table 4-8 Arizona DOT Criteria Table 4-9 Critical PCI Values – Oregon Table 4-10 Estimation of impact of different treatment types
on the life of an HMA pavement Table 4-11 Trigger Values for Different Treatments - Arizona Table 4-12 Trigger Values for Different Treatments - Georgia Table 4-13 Trigger Points for Various Areas of The Airfield Table 4-14 Trigger Values for Different Treatments - Oregon Table 4-15 Trigger Points for Various Areas of the Airfield Table 4.16 Trigger Values for Different Treatments - Wyoming Table 4-17 Trigger Values for Different Treatments - Michigan Chapter 5 Table 5-1 Experimental Matrix Table 5-2 Gradation of Laboratory Standard Mixture for Aging Evaluation Table 5-3 Asphalt Binder Properties of Laboratory Standard Sources Table 5-4 Summary of DC(T) Fracture Energy Test Results
ABSTRACT
This report presents the results of Airfield Asphalt Pavement Technology Program (AAPTP) Project 05-07 Techniques for Prevention and Remediation of Non-Load Related Distresses on HMA Airport Pavements (Phase I). This report presents the results of the first phase of a two phase study that will provide comprehensive technical guidance on the causes and measures required to correct and/or prevent non-load related distress on Hot Mix Asphalt (HMA) airfield pavements. The Phase I report consists of a literature review of the extent of the problem, development of a comprehensive list of products and procedures presently used to address the problems, and a detailed work plan to be conducted in Phase II. This report defines non-load associated distress as block cracking, longitudinal and transverse cracking, and weathering and raveling. Chapter 1 provides an overview of the research project. Chapter 2 provides a review of the factors that contribute to non-load associated distress: climate, crude source, HMA mixture and pavement variables. Chapter 3 discusses the geographical distribution of non-load associated distress throughout the United States. Chapter 4 discusses the products and procedures currently being used to correct and/or prevent non-load associated distress on airfield pavements. Chapter 5 provides a discussion of the laboratory procedures that can be used to determine the extent of non-load associated distress. Included in Appendix A is a detailed discussion of the chemistry of asphalt aging. Appendix B contains a discussion of the data sources used to develop the information on the geographical extent of HMA airfield pavements that exhibit non-load associated distress. Appendix C contains a discussion of the initial outline for a guide that will describe techniques that can be used for the prevention and mitigation of non-load associated distress.
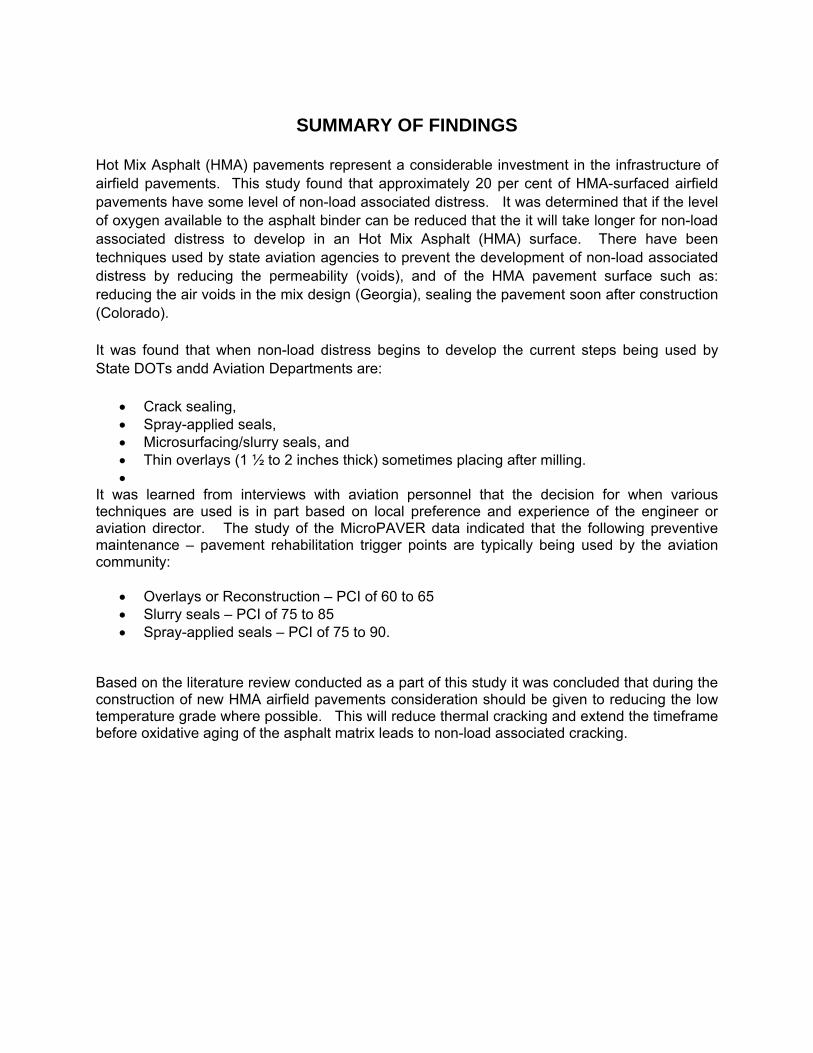
SUMMARY OF FINDINGS
Hot Mix Asphalt (HMA) pavements represent a considerable investment in the infrastructure of airfield pavements. This study found that approximately 20 per cent of HMA-surfaced airfield pavements have some level of non-load associated distress. It was determined that if the level of oxygen available to the asphalt binder can be reduced that the it will take longer for non-load associated distress to develop in an Hot Mix Asphalt (HMA) surface. There have been techniques used by state aviation agencies to prevent the development of non-load associated distress by reducing the permeability (voids), and of the HMA pavement surface such as: reducing the air voids in the mix design (Georgia), sealing the pavement soon after construction (Colorado). It was found that when non-load distress begins to develop the current steps being used by State DOTs andd Aviation Departments are:
• Crack sealing, • Spray-applied seals, • Microsurfacing/slurry seals, and • Thin overlays (1 ½ to 2 inches thick) sometimes placing after milling. •
It was learned from interviews with aviation personnel that the decision for when various techniques are used is in part based on local preference and experience of the engineer or aviation director. The study of the MicroPAVER data indicated that the following preventive maintenance – pavement rehabilitation trigger points are typically being used by the aviation community:
• Overlays or Reconstruction – PCI of 60 to 65 • Slurry seals – PCI of 75 to 85 • Spray-applied seals – PCI of 75 to 90.
Based on the literature review conducted as a part of this study it was concluded that during the construction of new HMA airfield pavements consideration should be given to reducing the low temperature grade where possible. This will reduce thermal cracking and extend the timeframe before oxidative aging of the asphalt matrix leads to non-load associated cracking.
1
CHAPTER 1 - INTODUCTION
1.1 PROBLEM STATEMENT
Hot Mix Asphalt (HMA) pavements represent a considerable investment in the infrastructure of airfields. It is estimated that 80 to 85 percent of the airfield pavements are surfaced with HMA. The majority of these pavements are on smaller, lightly trafficked airfields that have limited funding for repairs and pavement maintenance activities. These airfields are subjected to a wide range of climatic conditions that often result in thermal cracking, large block cracking and surface deterioration that are not load related. Many products and procedures are recommended as deterrent or corrective measures to address these types of distresses. A comprehensive study was needed to provide guidance to airfield engineers and managers for implementation of cost effective prevention and mitigation strategies to extend pavement life.
1.2 OBJECTIVES
The Project 05-07 Request for Proposal provided the following statement of the project objective:
The objective of this study is to provide comprehensive technical guidance on the causes and measures required to correct and/or prevent non-load related distress on HMA airfield pavements. This study is divided into two phases. Phase I will consist of a literature review of the extent of the problem, development of a comprehensive list of products and procedures presently used to address the problems, and a detailed work plan to be conducted in Phase II. Phase II of the project shall consist of conducting a work plan that was developed and approved in Phase I. Phase II work plan is to address the shortfalls and gaps in knowledge on the prioritized non load-related distresses and conditions and/or validate a systematic approach to select appropriate corrective measures and products for repair of pavement exhibiting non-load related distress. Phase II may be awarded without further competition pending performance and satisfactory completion of Phase I of this project.
1.3 RESEARCH APPROACH
The RFP for Project 05-07 stated that the final products from Phase I are to consist of the following:
1. Elements that contribute to non-load related distress and limiting values to prevent distress formations (Chapter 2)
2. Identification of specific site conditions or usage that promotes and/or restricts the development of non-load related distress on airfield pavements. (Chapter 2)
3. Identify and qualify the extent of non-load related distresses on HMA airfield pavements. Non-load related distress in this project shall be distresses as defined by ASTM D5340 and are generally those distresses associated with changes in the asphalt pavement temperature, moisture and other climatic exposure. Distresses that are primarily

2
associated with tire friction, aircraft wheel loads and/or fuel spills are not to be addressed in this project. (Chapter 3)
4. Identify and assess products and procedures currently being promoted to correct and/or prevent non-load related distresses in airfield pavements. (Chapter 4)
5. Identify existing laboratory test methods and procedures that address the issues associated with non-load related distress or products that repair/prevent distresses in HMA mixtures (Chapter 5)
6. Identify gaps and shortfall of knowledge on the cause and corrective measures for non-load related distress. (Chapter 6)
The project guidance provided in the Request for Proposal referenced ASTM D5430 that lists 16 distresses for HMA Pavements. Of the 16, three are identified as non-loaded distresses. Those three are: block cracking; longitudinal and transverse cracking; and raveling, weathering, and they are described in more detail below. They are caused by the age hardening of the asphalt pavement which is the result of the oxidation of the asphalt binder with a resultant increase in the stiffness of the binder (as indicated by an increase in the viscosity of the binder or the dynamic stiffness measured using the Superpave protocol). This report does not address load related distresses and makes the assumption that the HMA pavement has been properly designed to carry the aircraft operating from that airfield.
1.3.1 Block Cracking
Block cracks are interconnected cracks that divide the pavement into approximately rectangular pieces. The blocks may range in size from approximately 1 by 1 ft to 10 ft by 10 ft. Block cracking is caused mainly by volume changes within the HMA caused by daily temperature cycling (that results in daily stress/strain cycling). It is not load associated. The occurrence of block cracking usually indicates that the asphalt binder has age-hardened significantly. Block cracking normally occurs over a large portion of pavement area, but sometimes will occur only in non-traffic areas.
1.3.2 Longitudinal and Transverse Cracking
Longitudinal cracks are parallel to the pavement’s center line or laydown direction. They may be caused by:
(1) A poorly constructed paving lane joint.
(2) Shrinkage of the HMA pavement due to low temperatures or age-hardening of the asphalt binder or
(3) A reflection crack caused by cracks beneath the surface course, including joints and cracks in Portland cement concrete (PCC) slabs.
Transverse cracks extend across the pavement at approximately right angles to the pavement’s center line or direction of laydown. They may be caused by (2) or (3). These cracks are not usually load associated.
3
1.3.4 Raveling, Weathering
Raveling and weathering are the wearing away of the pavement surface caused by the dislodgement of aggregate particles and loss of asphalt binder. Such damage may indicate that the asphalt binder has age-hardened significantly.
The focus of this study is on asphalt binder aging in the HMA mixture as it relates to non-load associated distress in HMA pavements and steps that can be taken to reduce and/or prevent the occurrence of those distresses. Low-temperature thermal cracking (although it is a non-load associated cracking) was not included in this study due of the extensive work done on this subject during the Strategic Highway Research Program (SHRP). The results of that work has now been implemented for the majority of continental US highways. The AAPTP has another research project to implement this technology for airfields.
1.4 SCOPE OF THIS REPORT The purpose of this report is to summarize the work done to meet the objectives of this project to date. An initial plan for the completion of Phase II of this project is included. This plan provides a basis for discussion with the technical panel prior to implementing the work on Phase II of this study. This report consists of six chapters which are as follows. Chapter 1 - Introduction Chapter 2 - Factors Contributing to Non-Load Related Distress Chapter 3 - Geographical Distribution of Airfields Potentially Exhibiting
Specific Non-Load Related Distress Chapter 4 - Products and Procedures Currently Being Used To Correct and/or Prevent Non-
Load Associated Distresses In Airfield Pavements Chapter 5 - Laboratory Test Procedures that can be used to define the Extent and Nature of
Non-Load Associated Distress Chapter 6 - Test Program for Phase II of Study Appendix A - Chemistry of Asphalt Aging Appendix B - Geographical Extent Of HMA Airfields Exhibiting Non-Load Related Distress -
Data Sources Appendix C - Initial Outline for Guide for Prevention And Mitigation Of Non-Load Related
Distress
4
CHAPTER 2 - FACTORS CONTRIBUTING TO NON-LOAD RELATED DISTRESS
Distresses in asphalt concrete pavements that are not load related are almost exclusively caused by age hardening of the asphalt matrix. This age hardening begins during construction and continues throughout the service life of an HMA pavement. The longer term in-situ impact of the aging process is affected by:
• Climate, • Crude source, • Mixture variables, and • Construction variables.
Much of the following is based on a comprehensive study of asphalt binder aging conducted by Kemp at Caltrans1,2. Over 1000 mixture briquettes were formulated in the laboratory and then aged for 1, 2, and 4 years in boxes of sand at four field sites with widely varying climates. Study variables included aging time, climate, crude source, aggregate absorptivity, mixture air voids, and pavement depth. Numerous physical properties were measured, including absolute viscosity at 60° C, kinematic viscosity at 275° F, penetration at 25° C, ductility at 25° C, softening point, microviscosity at 25° C at two shear rates, and shear susceptibility. Largely based upon the findings of the study, the Caltrans lab developed the California Tilt-Oven Durability Test (TODT) to better discriminate asphalt binder durability, particularly for desert climates.
Another field aging study conducted on the Zaca-Wigmore3 test road showed a rapid increase in the binder hardening rate during the first 16 to 20 months and a decrease in the rate thereafter.
2.1 CLIMATE CONDITIONS In the Kemp study, asphalt binders placed in the hot desert climate aged very rapidly, asphalt binders placed in the warm valley climate aged moderately, and asphalt binders placed in the cooler climates of the northern coast and at higher altitudes aged more slowly. It is interesting to note that the some sites presented in the study did not rank as expected given current high pavement temperature predictions. It is not clear whether additional solar radiation at higher altitudes could have caused this anomaly. High temperatures dominate oxidation kinetics. The length of time that a pavement is exposed to high temperatures will increase the rate of oxidation of the asphalt binder and the non-load associated distress. Recently researchers have decided that the Mean Annual Air Temperature (MAAT) used in the current Superpave procedures is probably not the preferred parameter to rank local climates for aging rate. The computer model (LTPPBind) was recently modified (Version 3.1) to replace the high 7-day average temperature with a model much like the degree day concept used for cold temperature pavement design, This model multiplies the total hours per year spent at each temperature times the relative damage incurred due to high temperature effects.

5
Research studies funded by the FHWA and various state DOTs are using the hourly temperature database are already in place, as well as other data regarding solar radiation, altitude, and latitude, to develop a new environmental effects aging damage model based upon the Arrhenius equation (a formula for the rate of chemical reaction). This will be included as output in software tools such as LTPPBind. Until new models for aging can be developed, Thigh as calculated by LTPPBind at 50 percent reliability is probably the best single parameter available to rank pavement temperature’s impact on aging rate. As Thigh increases, it becomes even more important to specify an asphalt binder that age-hardens more slowly or has extra margin to allow for deterioration of critical parameters related to thermal shrinkage cracking. Although oxidation rates increase as temperature increases, resulting distresses accelerate as the pavement cools. At low temperatures, an asphalt binder can only flow to relieve stress and heal micro-cracks if it has enough time to do so before another stress is applied. Contrary to the “limiting stiffness” theories which are approximately correct for single event slow-cooling to fracture, soft asphalt binders can also crack if their m-value is so low that they cannot relax to relieve accumulating stresses. Non-load associated damage is driven by two fundamental mechanisms:
• Thermal shrinkage stresses and • Warping stresses resulting from thermal gradients in the pavement.
2.1.1 Thermal Shrinkage Stresses Thermal shrinkage stresses result from temperature-induced volume changes in the HMA. As previously discussed in sections on thermal cracking and failure properties, coefficients of thermal expansion reliably predict changes in HMA volume or density with changing temperature. Cooling decreases volume, and puts tensile stress on the asphalt binder bound between two shrinking rocks. Rapid cooling creates higher stress, just as if ductility or DTT were run at a faster rate of strain 2.1.2 Warping Stresses Resulting from Thermal Gradients in the Pavement Portland cement concrete (PCC) pavements are subject to cracking damage caused by warping stresses. If the surface of the pavement is warmer than underlying layers, the pavement bulges up into an arch (warps) to make room for the differential expansion in volume. When the surface is cooler, the volume is less (density is greater) at the surface and the pavement bows in the opposite direction such that the slab is unsupported on each end. Loads passing over the unsupported pavement cause significant damage to longer slabs. Gradients in pavement temperature from surface to base can occur in any season, but the effect is greatest when direct solar radiation heats the surface well-above ambient air temperature. HMA pavements experience thermal gradients at least as great as PCC pavements, but the viscoelastic asphalt binder is expected to flow to effectively counter the developing stresses. Although warping stresses are routinely estimated for the elastic PCC pavements where there is little possibility for flow, the viscoelastic properties of asphalt binder are more difficult to model. Because asphalt aging significantly reduces phase angle, the binder becomes less elastic with time, with the greatest impact near the surface where oxidation rates are highest. Given the level of complexity, a comprehensive model for HMA fracture due to thermal gradients in aged
6
pavements does not exist. Some fundamental analysis of the phenomenon using modified PCC algorithms might demonstrate whether thermal gradients represent a significant cause of block cracking. Dr. Buttlar4 recently initiated such a study at the University of Illinois, but no results are yet available. Because he uses the Disk-Shaped Compact Tension Test for his cracking models, DCT should be a good option for the phase II aging study so long as Dr. Buttlar’s work in this area continues. 2.1.3 Age Hardening of Asphalt Binders Asphalt binder aging, with resulting loss in ductility, is most severe at the pavement surface where temperatures are greatest during the summer. During winter, cracks initiate at the brittle surface where cooling occurs most rapidly, temperature swings are greatest, and pavements record their lowest temperatures. 2.1.4 Effect of Moisture on Age Hardening of Asphalt Binders Research conducted by Huang, Turner, and Thomas5,6,7 at the Western Research Institute (WRI) has shown that the rate of asphalt oxidation increases when moisture is present. Furthermore, the catalytic effect of water on asphalt aging seems to be most significant at shorter aging times. In general, those asphalt binders that are most sensitive to aging showed the greatest sensitivity to moisture-induced acceleration of the aging process, making the bad actors even worse. The change in the aging shift factor due to the presence of moisture was also measured. In this case, two of the eight asphalts showed less change in modulus when the asphalt was wet vs dry, but the other six asphalts exhibited markedly faster aging. In a personal communication, Dr. Turner estimates that oxidation rates increase by approximately 25 per cent on average when moisture is present on the surface of the asphalt binder. 2.1.5 Solar Radiation As the pavement surface absorbs solar rays during a hot summer day, the pavement surface temperature will be well above the ambient air temperature. Furthermore, this solar radiation includes damaging UV rays known to catalyze oxidation. Roofing asphalts are subjected to 30-day UV exposures in QUV units to determine relative sensitivity of different asphalt crude sources to UV. Poorly performing asphalts exhibit extensive surface cracking/checking. Because UV light cannot pass through aggregate, it is believed that UV-catalyzed oxidation only occurs in the top one or two millimeters of the pavement. This accelerated aging process should, therefore, be confined to the pavement surface, and can be countered effectively with periodic applications of fog seals or emulsion rejuvenators.
7
2.2 CRUDE SOURCE AND ASPHALT CHEMISTRY Appendix A gives a detailed discussion of the effect of asphalt chemistry on the age hardening of Hot Mix Asphalt mixtures. In summary, asphalt can harden in a number of ways, each of which has several competing mechanisms:
1. Loss of lighter molecules a. Volatilization b. Selective adsorption into porous aggregate c. Syneresis or phase separation
2. Chemical reactions which increase molecular weight a. Condensation b. Polymerization c. Vulcanization
3. Chemical reactions which increase molecular polarity a. Oxidation
i. Carbonyl Formation ii. Aromatization
Crude chemistry, environmental conditions, refining practice, and various HMA mix design and construction variables may contribute to asphalt aging. However, reaction of aromatic molecules in the bitumen with molecular oxygen is by far the most dominant cause of decreasing asphalt quality with pavement aging. High construction temperatures and the catalytic effects of ultraviolet light contribute to the well-known auto-oxidation mechanism which causes oxygen to form peroxides in a classic free radical mechanism. However, even at the highest pavement temperatures, there is not enough thermal energy available to break strong covalent bonds. Since UV light is largely blocked by the aggregate, reaction mechanisms below the immediate surface are thought to be concerted. That means that six or more atoms must participate in the key reaction step in a way that energy for breaking chemical bonds comes from the simultaneous formation of other bonds. Such reactions are often catalyzed by active organo-metallic catalysts. For example, the manganese complex marketed under the trade name Chemkrete and the Vanadium complex known as Vanadyl Aceto-Acetonate are extremely active oxidation catalysts at 60°C. However, other metal complexes such as Vanadyl Porphyrin are much less active. Hence, asphalts that are very low in metals tend to oxidize relatively slowly. However, the converse is not necessarily true. Asphalts which are high in metal content will oxidize more quickly only if those metals are complexed in the form of active catalysts. Metal content alone is not sufficient to predict oxidation. This finding also explains why the typical anti-oxidant compounds added to rubber, lubricants, and other petroleum applications do not slow asphalt oxidation in the pavement. The second important component of a bitumen’s aging susceptibility is the relative change in rheology that results from a single oxidation event. Gel-like asphalts contain large asphaltene clusters. Formation of a single carbonyl molecule can cause two of these clusters to form a polar bond between them, in effect doubling the already high apparent molecular weight. A sol type asphalt has fewer asphaltenes, so each polar bond resulting from a carbonyl links two much smaller molecules. The lower apparent molecular weight of the product molecule results in a much smaller rheological change in the bitumen. For a better understanding and quantification of the chemistry of oxidation in physical terms, the number of oxidation events
8
should be multiplied by the impact of each oxidized molecule on the rheological property of interest. Some example strategies that might then be considered to reduce the impact of either of these two variables:
1. Reduce the number of oxidation events a. Restrict the supply of oxygen into the pavement
i. Construct low permeability mixes, such as SMA ii. Seal the pavement to zero permeability soon after placement
b. Remove or chemically block metal complexes that serve as oxidation catalysts c. Reduce temperatures so that oxidation occurs more slowly
i. California requires slower aging asphalts for the desert, but allows faster aging asphalts in cooler climates & at higher elevations
2. Reduce the rheological impact of each oxidation event a. Use dispersants or compatibilizers which reduce the size of molecular clusters
(asphaltenes) b. Add small, highly polar molecules which will preferentially tie up carbonyls
Since auto-oxidation as catalyzed by UV light is only important in the top 1 mm of the surface, the best means to monitor long-term aging in the laboratory is to use lab oven-aging methods which simulate the highest pavement surface temperatures. In the above mentioned Kemp study, the Tilt-Oven Asphalt Durability (TOAD) test was developed specifically to predict results found in the Caltrans field aging study. The crude source was shown to have a substantial impact on aging rates, particularly in the hotter climates. Asphalt binders had been selected based upon known historical performance. Field and TOAD test rankings were consistent with expectations. During SHRP research, the Pressure Aging Vessel (PAV) replaced the TOAD test as the method of choice to simulate long-term asphalt aging in the pavement. Research showed that aging rates as measured by carbonyl formation approximately double with each 10°C increase in temperature. Harnsberger has an on-going national field study to evaluate the binder’s contribution to pavement aging. To better rank the susceptibility of specific asphalt sources to aging, his coworkers at WRI developed the concept of an aging shift factor8. This shift factor is handled similarly to the Williams-Landel-Ferry (WLF) shift factors as used to shift temperature and frequency in rheological mastercurves. The calculated shift factor should represent the aging susceptibility of a specific bitumen in a mathematical form that can be used in environmental effects aging models. Unfortunately, there remains one largely unanswered question that holds the key to all issues relating to the binder’s contribution to block cracking. At the lowest pavement temperatures where cracking is most likely to initiate, the binder does not stiffen significantly as it ages. Instead, a marked decrease in relaxation properties is observed; a sign that the binder becomes more brittle rather than harder. Two defining examples of oxidation-driven embrittlement are described in detail in Appendix A. Dr. Glover9 showed that extended PAV aging causes the critical temperature for the “m-value” (the m-value is a measure of the stiffness of an aged asphalt binder) to fall approximately five times faster than corresponding changes in the limiting stiffness temperature. Vargas (2008)

9
compared rheological mastercurves for unaged and aged binders on plots of G* vs phase angle (Black Space Diagrams) and demonstrated dramatic losses in phase angle with aging. Although Superpave rheological tools measure both hardness and relaxation properties, the unexpected evolution of these low temperature relaxation properties has not been appropriately included in various cracking models, particularly as driven by age-related initiation and propagation of block cracking. This could be done with low temperature rheology, with direct tension tests, or by using fracture mechanics. Below are some trends in binder or HMA physical characteristics that should be observed at low pavement temperatures as the asphalt ages:
1. Greater “m” control in the BBR. 2. Lower phase angles for a given modulus when plotting dynamic shear rheometer (DSR)
results in Black Space. 3. Lower failure strains and lower failure strength in direct tension tests. 4. Lower fracture energy when using fracture tests such as the Disk-Shaped Compact
Tension Test (DCT) or semi-circular bending (see chapter 5). 2.3 MIXTURE AND ASPHALT BINDER VARIABLES 2.3.1 Aggregate Absorptivity As discussed in Appendix A, aggregate absorptivity does impact asphalt binder rheology by selectively removing smaller, less polar molecules. Although important from a perspective of asphalt binder hardening at all temperatures, absorptivity does not significantly influence low temperature binder relaxation properties. Thermal cracking will likely be impacted more by selective absorption than block cracking. 2.3.2 Binder PG Grade Because softer binders have lower stiffness and better relaxation properties at low temperatures, one easy solution is to specify better low temperature PG grades for surface mixes. The potential benefits are recorded in two publications reporting on a number of Minnesota field research projects. There, Wegman and co-authors12,13 report continuing reductions in thermal and reflective cracking when surface mixes were designed with PG 58-22, PG 58-28, PG 58-34, and PG 58-40, respectively. Their conclusion states, “The new asphalt binders have been found to increase the resistance to thermal cracking on newly constructed roads and to inhibit reflective cracking on overlays.” Because these projects were built to validate new SHRP performance specifications, they were too new to exhibit significant distress caused by asphalt binder oxidation. Rather than relying exclusively on Bending Beam Rheometer (BBR) grading at low temperatures, it might be preferable to specify binders with particularly good initial relaxation/fracture properties as might be defined by Bending Beam Rheometer (BBR) S-control, Direct Tension Test (DTT) failure strain, or shear susceptibility.
10
2.3.4 Binder Additives • Antioxidants: Certain chemicals, such as phenols and organo-lead compounds, can trap
free radicals. They slow oxidation by eliminating active peroxy radicals which participate in chain mechanisms that continue from molecule to molecule so long as the radical site remains active. Thus, carbonyls would form more slowly. Of course, such activity is only effective if classic auto-oxidation mechanisms dominate in-situ oxidation. As discussed earlier, kinetic studies indicate this is clearly not the case in pavements. Although a few publications indicate modest success in very specific cases, the cost effectiveness of common antioxidant reaction inhibitors is seriously in doubt.
• Overbases: The lubricant industry discovered that acids catalyze the oxidative formation
of organic sludge that eventually builds up on internal engine parts. Since organic acids form in advanced stages of oxidation, it is not possible to remove or neutralize them as part of the refining process for base oils. Instead, lube oil manufacturers add a water soluble strong base (overbase) to the lube oil, which stands ready to neutralize acids immediately after they form in the engine. Because temperatures are much higher inside internal combustion engines than on pavement surfaces, it is not obvious that similar treatments of asphalt binder will delay oxidation. The most notable indication of possible success with strong bases in bitumen was noted by Petersen12. During studies using lime to improve mixture moisture resistance, he noted that aging hardening occurs more slowly when hydrated lime is added to some asphalt binders. However, other asphalt binders show no beneficial response. Because lime is a fine powder which is added to the mix in an amount approaching 20 percent of the asphalt binder by weight, it stiffens the asphalt binder significantly. Furthermore, the heavier solids fall out of the solution rapidly when the asphalt binder is heated during laboratory testing. Hence, keeping specimens uniform during aging and subsequent testing is problematic.
• Dispersing Agents: If it is not possible to inhibit the oxidation mechanism itself, perhaps it
is possible to disperse the polar molecular micellae (asphaltenes) forming as oxidized molecules flocculate. In theory, reducing apparent molecular size by interfering with micelle formation should reduce the viscosity of oxidized asphalt binders. When James and Stewart12 were unable to find effective antioxidants, they turned to dispersants such as proprietary fatty amine derivatives. They conclude, “Fatty amine derivatives have been found to be highly efficient dispersant agents in oxidized bitumen, i.e. maintain the colloidal balance of a bitumen after oxidation.” In the case of dispersants, the rate of carbonyl formation would not be affected. Only the resulting rheology would change because the product molecules would not be tied up in large micellae. Because lime also interacts with polar compounds, it is possible that hydrated lime acts as a dispersant for asphaltenes in gel-like asphalt binders.
• Polymers: Emery13 evaluated a number of pavements around the world. His conclusion,
“The use of polymer modified asphalt cements, typically SBS, in asphalt binder surface courses for enhanced resistance to top-down cracking (resistance to tensile and shear stress fracture) is commonly recommended. Polymer-modified asphalt binders also offer other performance improvements (rutting resistance, fatigue endurance and durability) and have been shown to extend the service life of asphalt binder pavements with

11
favorable life-cycle costing.” Laboratory studies indicate that DTT failure strain is substantially improved by polymer modification with elastomeric polymers even though the BBR stiffness and m-value do not change significantly. If Kandhal’s reported correlations between low temperature ductility and block cracking are correct, a specification parameter for DTT failure strain might be appropriate. D’Angelo15 suggested that polymers could be best differentiated by requiring DTT failure strain to be above 3 percent at a temperature 3°C above the low critical temperature for thermal cracking.
• Hydrated Lime: Research at WRI11 has shown that the hardening of asphalt binders can
be reduced by the addition of hydrated lime. 2.4 PAVEMENT VARIABLES 2.4.1 Temperature Gradient On a hot summer day, the maximum pavement temperature typically decreases one binder grade (6◦C) for each three-inch increment in pavement depth. Any given HMA oxidizes less as pavement depth increases due to lower temperatures, no ultra-violet (UV) exposure, and less available oxygen. 2.4.2 Exposure to Oxygen Oxygen must penetrate into the asphalt binder before it can react. The surface area of the asphalt binder and the available oxygen supply both play a role in oxidation kinetics. Since open-graded mixes expose a large binder surface area to an unlimited oxygen supply, they represent the most sensitive air-void level to aging. As the volume of air voids is reduced, and as those voids no longer remain interconnected to transport new oxygen into the mix, the reduced surface area and oxygen exposure should inhibit age-related hardening due to oxidation. Studies by Kemp and others have shown that higher air-void mixes do age-harden faster than denser counterparts. However, if interconnected air voids transport more oxygen to the asphalt binder, then pavement permeability, not in-place air voids, should yield better correlations with asphalt binder oxidation. Once enough oxygen is available to fully saturate the asphalt binder, additional pavement permeability should not matter. Asphalt binder hardening progresses from the top of the pavement surface with the greatest effect in the top ½ inch. 2.4.3 Air Voids and Permeability Less hardening was observed when HMA briquettes were compacted to lower air voids. The reduction in aging was particularly apparent as air voids approached 4 percent or less. Less variation was noted at higher air void levels. Kemp1,2 presents information on the effect of air voids on the hardening of asphalt binders as measured by an increase in viscosity. His results are summarized in Figure 2-1. As noted above, the goal is to reduce the opportunity for oxygen to come into contact with the asphalt binder – this can be done by reducing the permeability or interconnected air voids in the HMA pavement.

12
10
100
1000
10000
0 10 20 30 40 50 60
Weathering Period (Months - Average of Sites)
Abs
olut
e Vi
scos
ity a
t 140
F (6
0 C
)
10 to 12 % Air Voids7 to 9 % Air Voids3 to 5 % Air Voids
Figure 2-1: Effect of Air Voids on the Hardening of Asphalt Binders 2.5 CONCLUSIONS The cause of non-load associated distress (weathering and block-cracking) in an HMA pavement is generally thought to be the result of age hardening of the asphalt binder in the HMA mixture. The primary cause of this age hardening is the oxidation of the asphalt binder. This oxidation causes the binder to stiffen and as it stiffens (the ductility of the binder is lost) the ability of the asphalt binder to react to changes in temperature is reduced. The factors that relate to the rate at which an asphalt binder oxidizes which are the cause of age hardening are:
• Climate – The rate of oxidation increases as the temperature increases and when moisture is present in the voids of the mixture. The maximum pavement temperature decreases about 6oC for each three-inch of pavement depth. Therefore, the effect of the climate is more of a factor in the top layers of the HMA surface
• Crude source – The chemistry of the asphalt binder used in the HMA pavement will affect the rate of the oxidation of the binder. Each asphalt binder ages at a different rate. Thus, block cracking/weathering distress on two pavements built at the same time on an airfield could develop at different times.
• Mixture variables – The materials used in the asphalt mixture (aggregates and asphalt binder) will affect the onset of non-load associated distress. The use of an absorptive

13
aggregate will result in early loss of ductility of the binder used in the pavement. The proper selection of the asphalt binder can reduce or delay the onset of non-load associated distress. The use of softer binders with low stiffness and better relaxation properties at low temperatures can be very beneficial in reducing non-load associated distress. But, these same binders used in high traffic areas can contribute to a rutting problem. This can be offset to some extent by the use of polymer modified binders.
• Pavement variables –. Oxygen must penetrate the pavement surface before it can react. Studies have shown that as the air voids in the pavement (or permeability) increases the rate of hardening also increases.

14
REFERENCES
1. Kemp, G.R. and Predoehl, N.H., “A Comparison of Field and Laboratory Environments on Asphalt Durability”, AAPT, 1981, pp. 492-560
2. Predoehl, N.H. and Kemp, G.R., “An Investigation of the Effectiveness of Asphalt Binder Durability Tests – Initial Phase,” Caltrans Laboratory Research Report FHWA-CA-78-26, 1978
3. Simpson, W. C., R. L. Griffin, T.K. Miles, “Correlation of Microfilm Durability with Field Hardening Observed on the Zaca-Wigmore Experimental Project” Symposium on Road Paving Materials, 1959, ASTM Special Technical Publication No. 277, 1960
4. Apeagyei ,A.K. and W.G. Buttlar. Characterization of Asphalt Institute Mixture Specimens using the ASTM D7313-06 Fracture Energy Test: AAPTP Aging Study. Internal report, June 24, 2008.
5. Huang, S.C., T.F. Turner, and K. P. Thomas, “The Influence Of Moisture On The Aging Characteristics Of Bitumen”, 4th Eurasphalt & Eurobitume Congress, Sept. 2007
6. Thomas, K.P., “The Impact of Water During the Laboratory Aging of Asphalt”, Road Materials and Pavement Design, Vol. 3, No. 3, 2002, pp 299-315
7. WRI Quarterly Technical Progress Report, FHWA Contract “Fundamental Properties of Asphalts and Modified Asphalts III, Subtask 2-2.1, March, 2007
8. Haung Huang, S.C., Turner, T.F., and Thomas, K.P., “The Influence of Moisture on the Aging Characteristics of Bitumen”, 4th Eurasphalt & Eurobitume Congress, Sept. 2007
9. Glover, Davison, Domke, Ruan, Juristyarini, Knorr, and Jung, “Development of a New Method for Assessing Asphalt Binder Durability with Field Evaluation”, FHWA/TX report #05-1872-2, August 2005, pp.1-334.
10. Wegman, D., Weigel, J. and Forsberg, A., “Collaborative Evaluations of Low Temperature SuperPave PG Asphalt Binders,” TRB Research Record, V. 1661, 1999, 12 pp.
11. Huang, S.C., Petersen, J.C., Robertson, R.E., Branthaver, J.F., “Effect of Hydrated Lime on Long-term Oxidative Aging Characteristics of Asphalt”, TRB Record 1810, 2002, pp. 18-24
12. James, A.D. and Stewart, D., “The Use of Fatty-Amine Derivatives to Slow Down the Age-Hardening Process in Bitumen”, Proceeding of the International Symposium for Chemistry of Bitumen, Rome (Italy), 1991. pp. 671-684
13. Emery, J.J., “Evaluation and Mitigation of Top-Down Pavement Cracking”, Transportation Conference of Canada - 2006 Annual Meeting, Charlottetown PEI, 2006, 15 pp.
14. John D’Angelo, John and Raj Dongre “Superpave Binder Specifications and Their Performance Relationship to Modified Binders”, CTAA, 2002
15. Peterson, J. C. Chemical Composition of Asphalt as Related to Asphalt Durability-State of the Art, Transportation Research Record, Vol. 999, pp 13-30
15
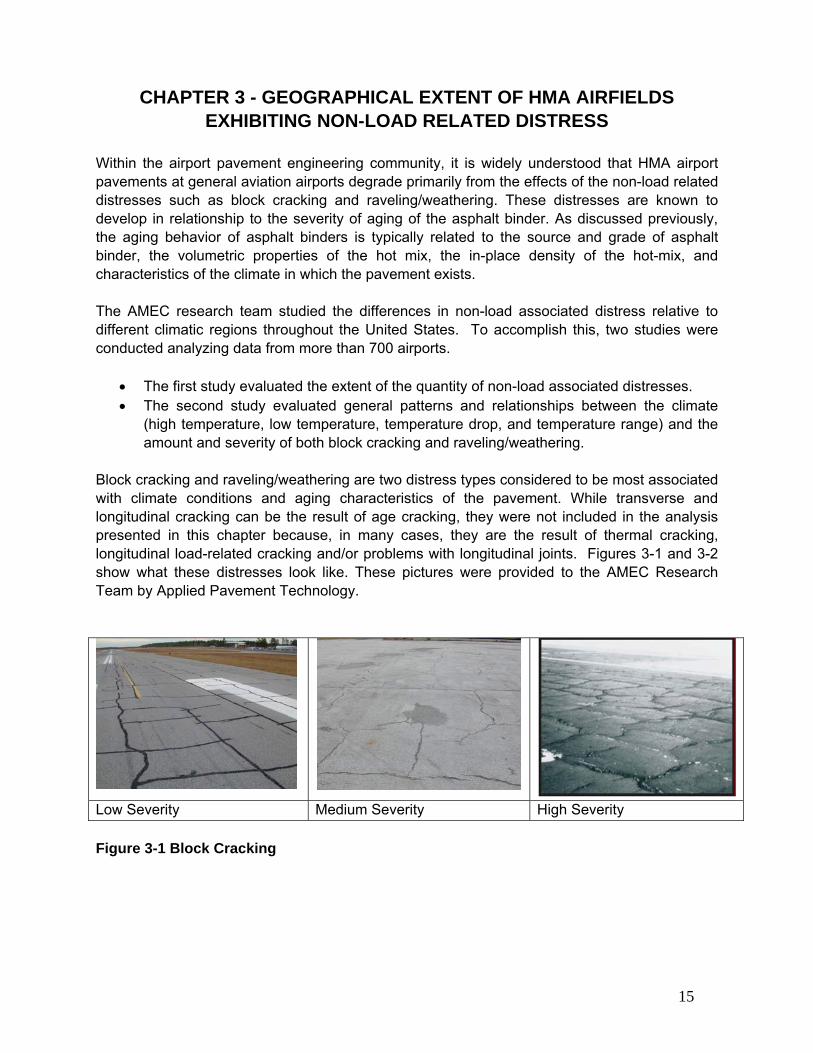
CHAPTER 3 - GEOGRAPHICAL EXTENT OF HMA AIRFIELDS EXHIBITING NON-LOAD RELATED DISTRESS
Within the airport pavement engineering community, it is widely understood that HMA airport pavements at general aviation airports degrade primarily from the effects of the non-load related distresses such as block cracking and raveling/weathering. These distresses are known to develop in relationship to the severity of aging of the asphalt binder. As discussed previously, the aging behavior of asphalt binders is typically related to the source and grade of asphalt binder, the volumetric properties of the hot mix, the in-place density of the hot-mix, and characteristics of the climate in which the pavement exists. The AMEC research team studied the differences in non-load associated distress relative to different climatic regions throughout the United States. To accomplish this, two studies were conducted analyzing data from more than 700 airports.
• The first study evaluated the extent of the quantity of non-load associated distresses. • The second study evaluated general patterns and relationships between the climate
(high temperature, low temperature, temperature drop, and temperature range) and the amount and severity of both block cracking and raveling/weathering.
Block cracking and raveling/weathering are two distress types considered to be most associated with climate conditions and aging characteristics of the pavement. While transverse and longitudinal cracking can be the result of age cracking, they were not included in the analysis presented in this chapter because, in many cases, they are the result of thermal cracking, longitudinal load-related cracking and/or problems with longitudinal joints. Figures 3-1 and 3-2 show what these distresses look like. These pictures were provided to the AMEC Research Team by Applied Pavement Technology.
Low Severity Medium Severity High Severity Figure 3-1 Block Cracking

16
Low Severity Medium Severity High Severity Figure 3-2 Raveling/Weathering 3.1 DATA SOURCES To conduct this study the research team obtained data from two sources:
• Pavement Distress Data from using MicroPAVER, and • Temperature data using LTTPBind.
Airports across the US use a variety of Pavement Management Systems (PMS) to inventory their pavement facilities and select the timing and type of maintenance treatments. The most commonly used PMS is the MicroPAVER system developed by the US Army Corps of Engineers primarily because of its non-proprietary format and longstanding use in the US, MicroPAVER is the PMS of choice for many airports. The MicroPAVER data for airports across the country was used to determine the amount and severity of non-load related distresses affecting airport HMA pavements. The amount and severity of non-load related pavement distresses were established for each airport. Data for the temperature characteristics of each airport was then combined with the pavement distress data. The climatic data was acquired using the Federal Highway Administration Long Term Pavement Program Bind 3.1 (LTPPBind) software program. Within the LTPPBind program is a climate database that uses 30 years of historical records to establish average high and low temperatures at hundreds of weather stations across the country. 3.2 DATA ACQUISITION AND COMPARISON The research team developed a plan to collect and compare data from MicroPAVER and LTPP Bind databases across the country. For a discussion of the procedures to collect the data the reader is referenced to Appendix B.
17
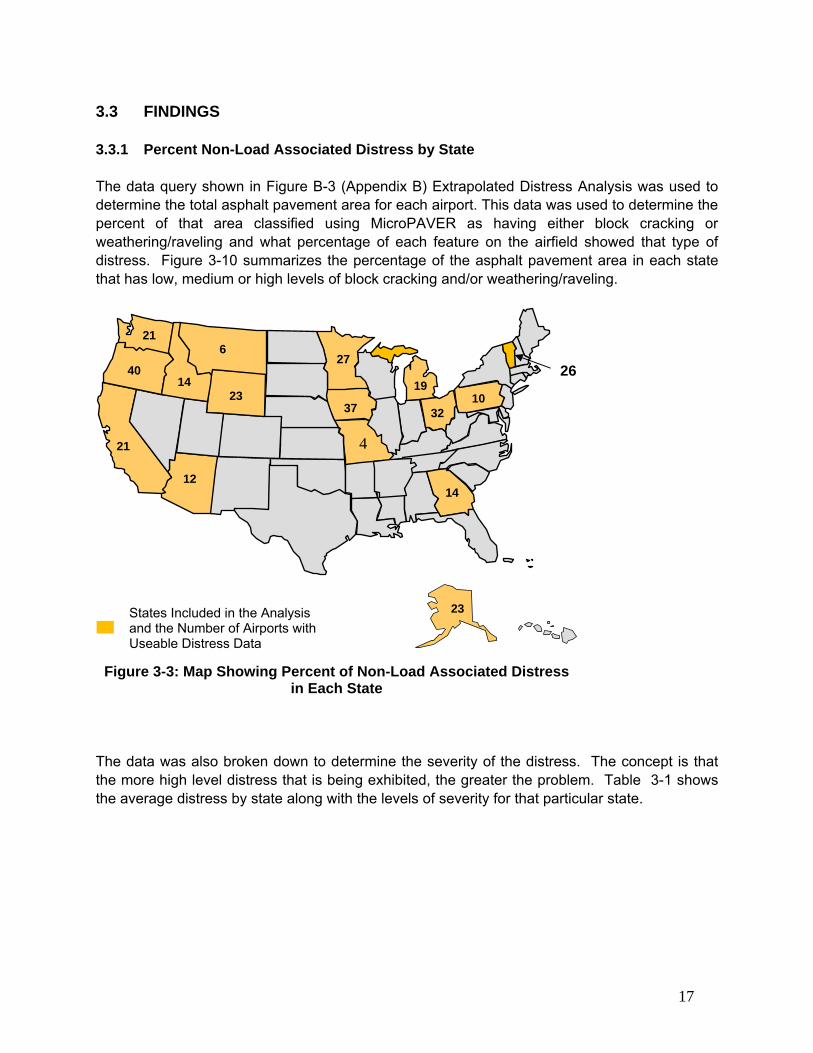
3.3 FINDINGS 3.3.1 Percent Non-Load Associated Distress by State The data query shown in Figure B-3 (Appendix B) Extrapolated Distress Analysis was used to determine the total asphalt pavement area for each airport. This data was used to determine the percent of that area classified using MicroPAVER as having either block cracking or weathering/raveling and what percentage of each feature on the airfield showed that type of distress. Figure 3-10 summarizes the percentage of the asphalt pavement area in each state that has low, medium or high levels of block cracking and/or weathering/raveling.
The data was also broken down to determine the severity of the distress. The concept is that the more high level distress that is being exhibited, the greater the problem. Table 3-1 shows the average distress by state along with the levels of severity for that particular state.
States Included in the Analysis and the Number of Airports with Useable Distress Data
12
23
6
23
21
40 14
21
27
14
19
32 10
37
4
Figure 3-3: Map Showing Percent of Non-Load Associated Distress in Each State
26
18
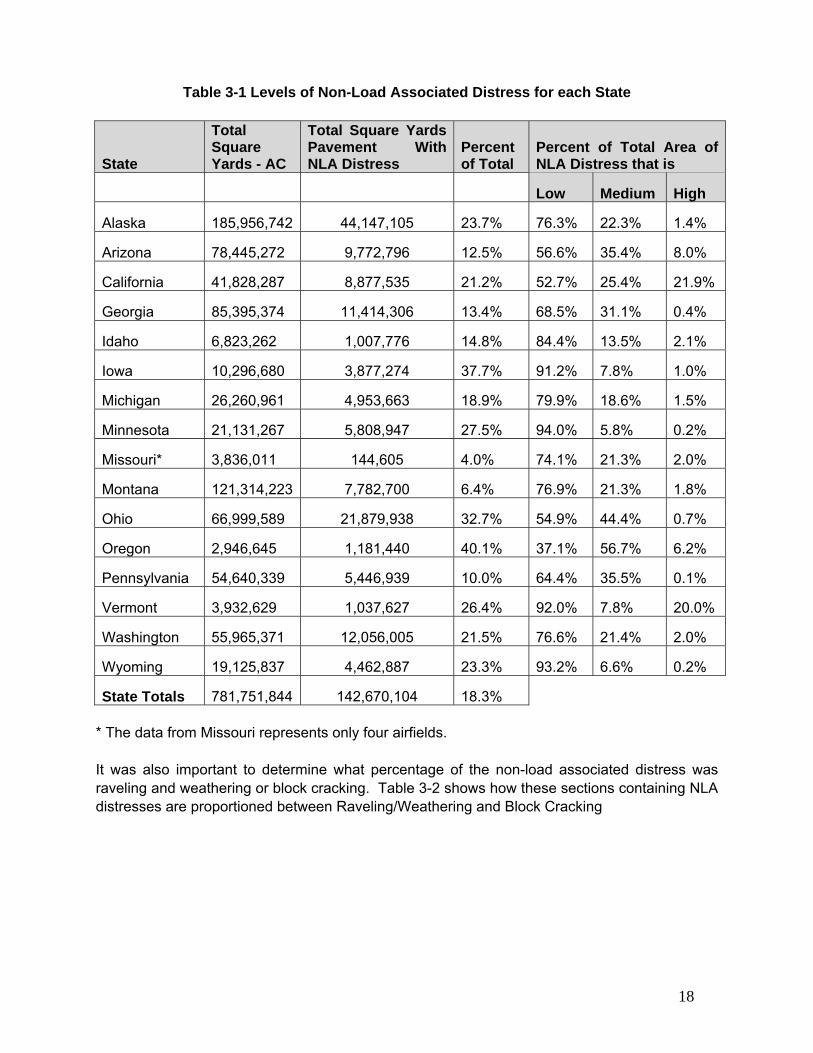
Table 3-1 Levels of Non-Load Associated Distress for each State
State
Total Square Yards - AC
Total Square Yards Pavement With NLA Distress
Percent of Total
Percent of Total Area of NLA Distress that is
Low Medium High
Alaska 185,956,742 44,147,105 23.7% 76.3% 22.3% 1.4%
Arizona 78,445,272 9,772,796 12.5% 56.6% 35.4% 8.0%
California 41,828,287 8,877,535 21.2% 52.7% 25.4% 21.9%
Georgia 85,395,374 11,414,306 13.4% 68.5% 31.1% 0.4%
Idaho 6,823,262 1,007,776 14.8% 84.4% 13.5% 2.1%
Iowa 10,296,680 3,877,274 37.7% 91.2% 7.8% 1.0%
Michigan 26,260,961 4,953,663 18.9% 79.9% 18.6% 1.5%
Minnesota 21,131,267 5,808,947 27.5% 94.0% 5.8% 0.2%
Missouri* 3,836,011 144,605 4.0% 74.1% 21.3% 2.0%
Montana 121,314,223 7,782,700 6.4% 76.9% 21.3% 1.8%
Ohio 66,999,589 21,879,938 32.7% 54.9% 44.4% 0.7%
Oregon 2,946,645 1,181,440 40.1% 37.1% 56.7% 6.2%
Pennsylvania 54,640,339 5,446,939 10.0% 64.4% 35.5% 0.1%
Vermont 3,932,629 1,037,627 26.4% 92.0% 7.8% 20.0%
Washington 55,965,371 12,056,005 21.5% 76.6% 21.4% 2.0%
Wyoming 19,125,837 4,462,887 23.3% 93.2% 6.6% 0.2%
State Totals 781,751,844 142,670,104 18.3% * The data from Missouri represents only four airfields. It was also important to determine what percentage of the non-load associated distress was raveling and weathering or block cracking. Table 3-2 shows how these sections containing NLA distresses are proportioned between Raveling/Weathering and Block Cracking
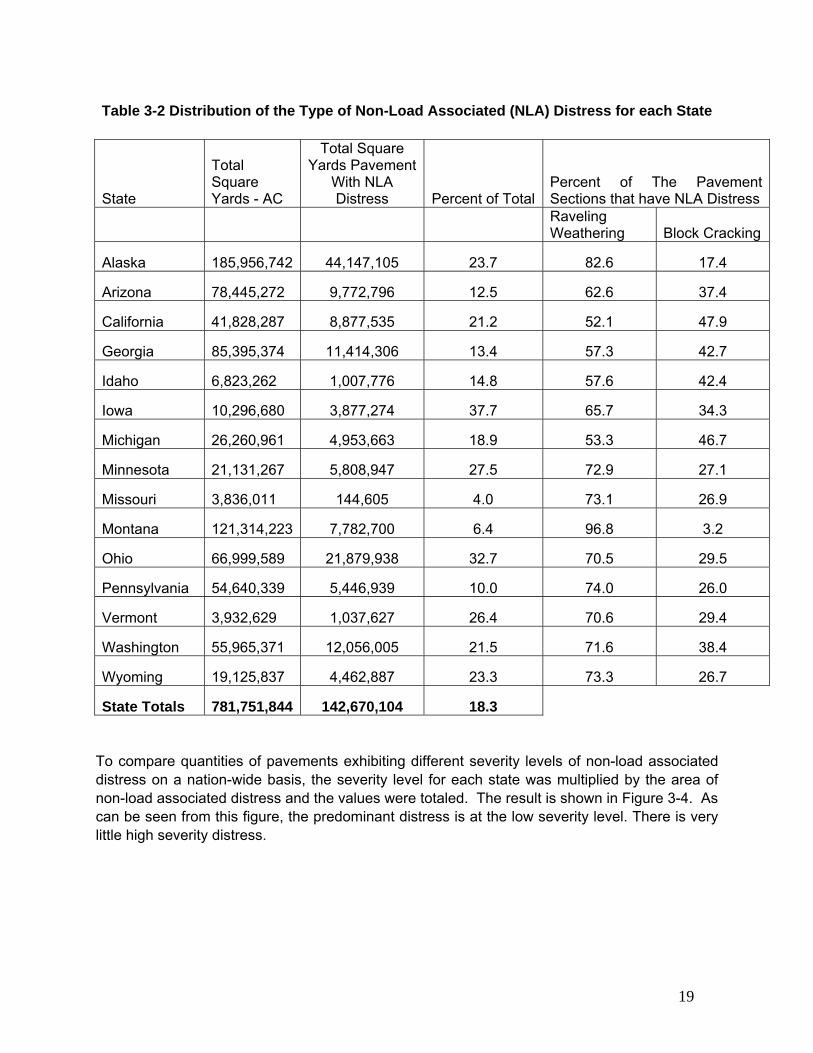
19
Table 3-2 Distribution of the Type of Non-Load Associated (NLA) Distress for each State
State
Total Square Yards - AC
Total Square Yards Pavement
With NLA Distress Percent of Total
Percent of The Pavement Sections that have NLA Distress
Raveling Weathering Block Cracking
Alaska 185,956,742 44,147,105 23.7 82.6 17.4
Arizona 78,445,272 9,772,796 12.5 62.6 37.4
California 41,828,287 8,877,535 21.2 52.1 47.9
Georgia 85,395,374 11,414,306 13.4 57.3 42.7
Idaho 6,823,262 1,007,776 14.8 57.6 42.4
Iowa 10,296,680 3,877,274 37.7 65.7 34.3
Michigan 26,260,961 4,953,663 18.9 53.3 46.7
Minnesota 21,131,267 5,808,947 27.5 72.9 27.1
Missouri 3,836,011 144,605 4.0 73.1 26.9
Montana 121,314,223 7,782,700 6.4 96.8 3.2
Ohio 66,999,589 21,879,938 32.7 70.5 29.5
Pennsylvania 54,640,339 5,446,939 10.0 74.0 26.0
Vermont 3,932,629 1,037,627 26.4 70.6 29.4
Washington 55,965,371 12,056,005 21.5 71.6 38.4
Wyoming 19,125,837 4,462,887 23.3 73.3 26.7
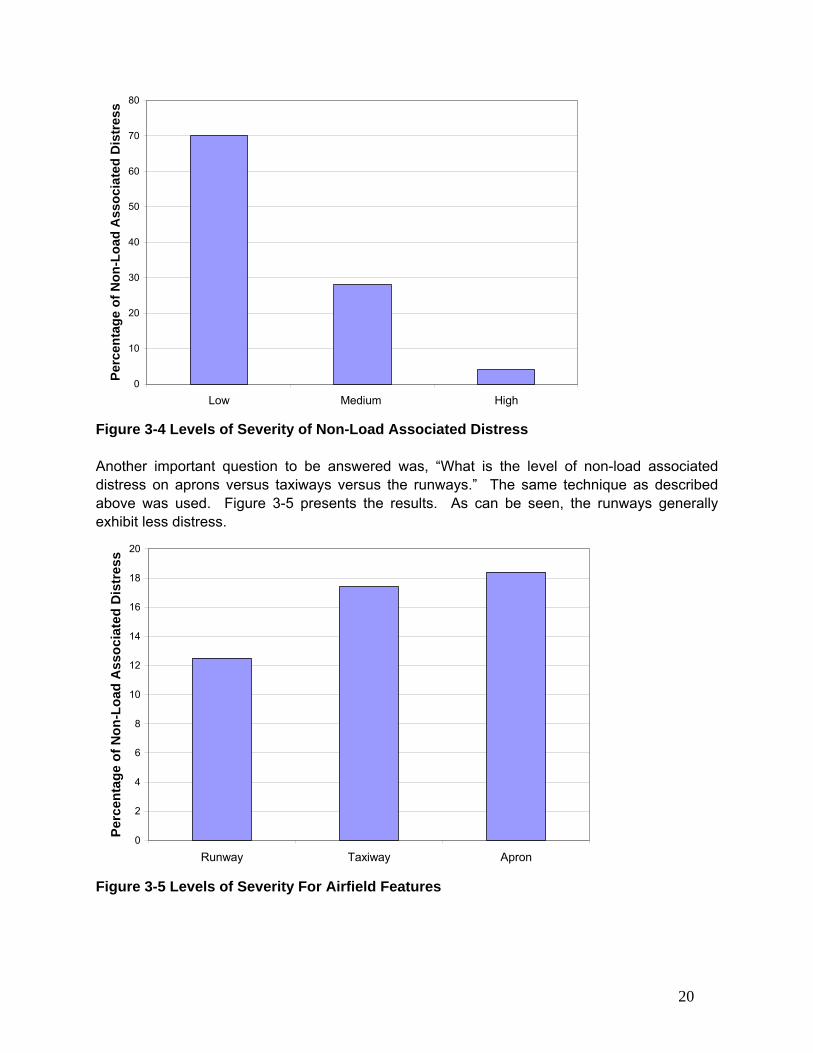
State Totals 781,751,844 142,670,104 18.3 To compare quantities of pavements exhibiting different severity levels of non-load associated distress on a nation-wide basis, the severity level for each state was multiplied by the area of non-load associated distress and the values were totaled. The result is shown in Figure 3-4. As can be seen from this figure, the predominant distress is at the low severity level. There is very little high severity distress.
20
0
10
20
30
40
50
60
70
80
Low Medium High
Perc
enta
ge o
f Non
-Loa
d A
ssoc
iate
d D
istr
ess
Figure 3-4 Levels of Severity of Non-Load Associated Distress Another important question to be answered was, “What is the level of non-load associated distress on aprons versus taxiways versus the runways.” The same technique as described above was used. Figure 3-5 presents the results. As can be seen, the runways generally exhibit less distress.
0
2
4
6
8
10
12
14
16
18
20
Runway Taxiway Apron
Perc
enta
ge o
f Non
-Loa
d A
ssoc
iate
d D
istr
ess
Figure 3-5 Levels of Severity For Airfield Features
21
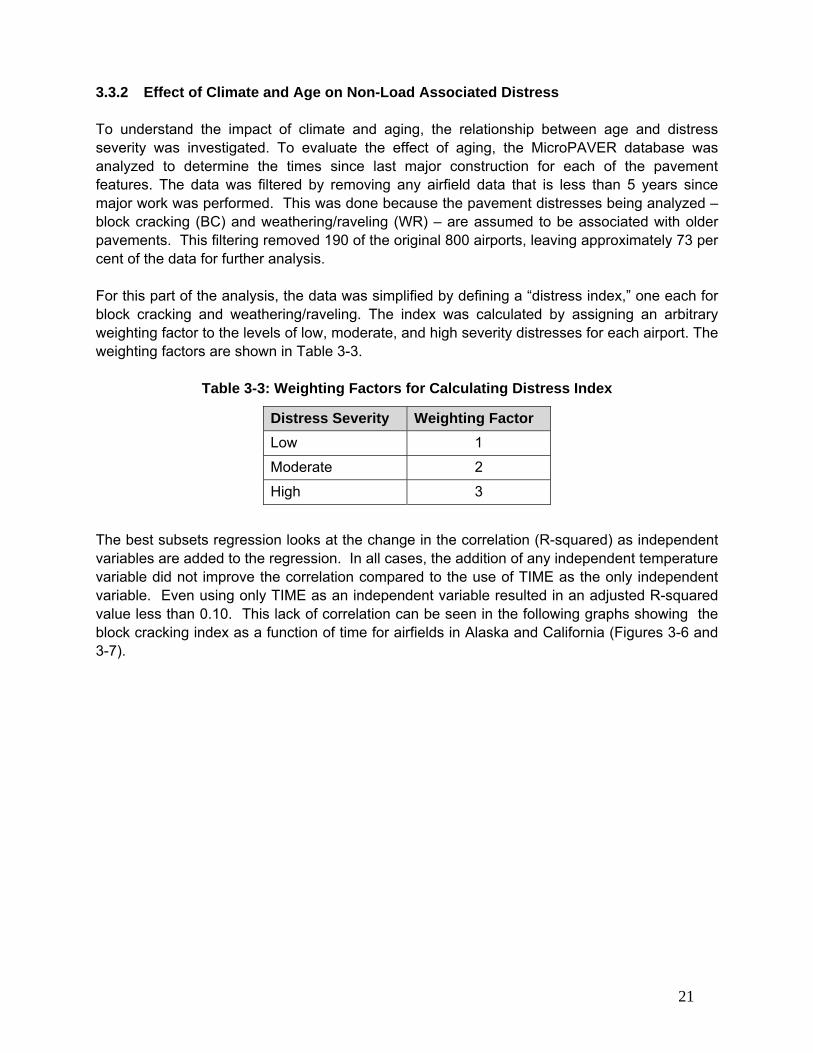
3.3.2 Effect of Climate and Age on Non-Load Associated Distress To understand the impact of climate and aging, the relationship between age and distress severity was investigated. To evaluate the effect of aging, the MicroPAVER database was analyzed to determine the times since last major construction for each of the pavement features. The data was filtered by removing any airfield data that is less than 5 years since major work was performed. This was done because the pavement distresses being analyzed – block cracking (BC) and weathering/raveling (WR) – are assumed to be associated with older pavements. This filtering removed 190 of the original 800 airports, leaving approximately 73 per cent of the data for further analysis. For this part of the analysis, the data was simplified by defining a “distress index,” one each for block cracking and weathering/raveling. The index was calculated by assigning an arbitrary weighting factor to the levels of low, moderate, and high severity distresses for each airport. The weighting factors are shown in Table 3-3.
Table 3-3: Weighting Factors for Calculating Distress Index
Distress Severity Weighting Factor Low 1
Moderate 2
High 3
The best subsets regression looks at the change in the correlation (R-squared) as independent variables are added to the regression. In all cases, the addition of any independent temperature variable did not improve the correlation compared to the use of TIME as the only independent variable. Even using only TIME as an independent variable resulted in an adjusted R-squared value less than 0.10. This lack of correlation can be seen in the following graphs showing the block cracking index as a function of time for airfields in Alaska and California (Figures 3-6 and 3-7).

22
Block Cracking Index vs. TimeAlaska
0
20
40
60
80
100
120
140
0 5 10 15 20 25 30 35
Time Since Major Work, Years
Blo
ck C
rack
ing
Inde
x
Figure 3-6 – Block Cracking vs. Time Alaska
Block Cracking Index vs. TimeCalifornia
0
50
100
150
200
250
300
0 10 20 30 40 50 60 70
Time Since Major Work, Years
Bloc
k Cr
acki
ng In
dex
Figure 3-7 - Block Cracking vs. Time California As can be seen in the graphs, some airfield pavements have a block cracking index of 0.0 despite having gone 61 years since major work (at least according to the database). The preponderance of pavements with a block cracking index of zero over a number of years is the cause of the lack of regression.
23
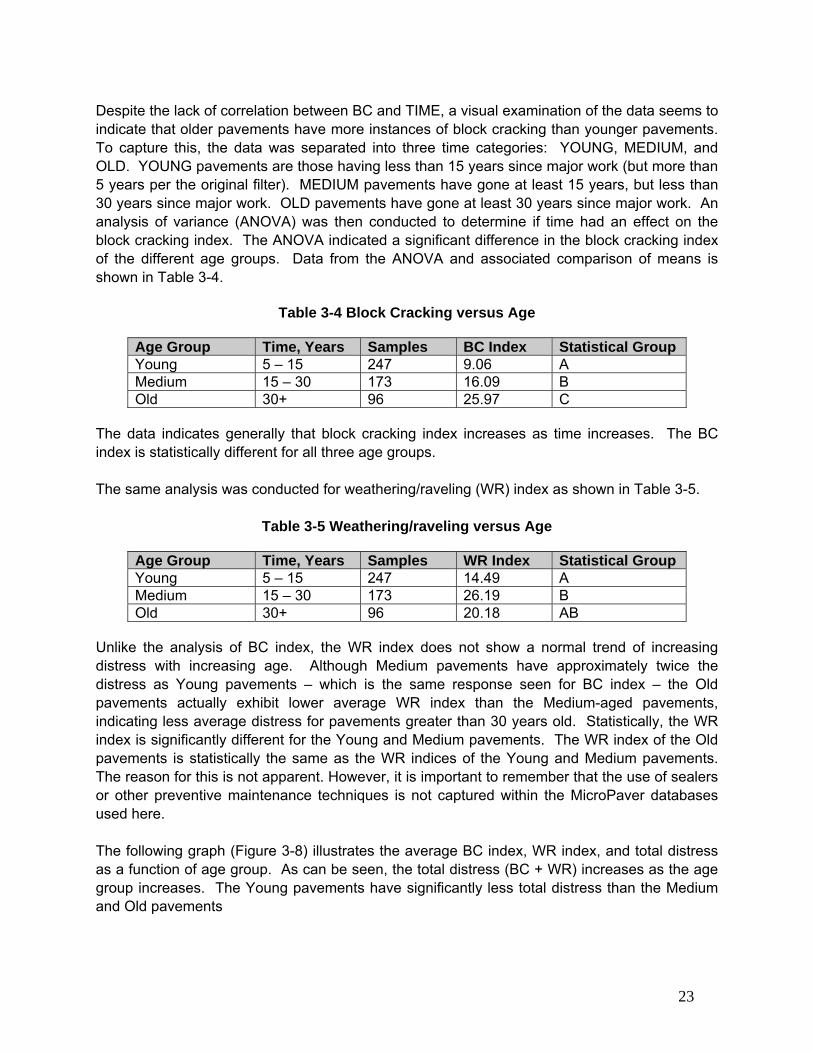
Despite the lack of correlation between BC and TIME, a visual examination of the data seems to indicate that older pavements have more instances of block cracking than younger pavements. To capture this, the data was separated into three time categories: YOUNG, MEDIUM, and OLD. YOUNG pavements are those having less than 15 years since major work (but more than 5 years per the original filter). MEDIUM pavements have gone at least 15 years, but less than 30 years since major work. OLD pavements have gone at least 30 years since major work. An analysis of variance (ANOVA) was then conducted to determine if time had an effect on the block cracking index. The ANOVA indicated a significant difference in the block cracking index of the different age groups. Data from the ANOVA and associated comparison of means is shown in Table 3-4.
Table 3-4 Block Cracking versus Age
Age Group Time, Years Samples BC Index Statistical Group Young 5 – 15 247 9.06 A Medium 15 – 30 173 16.09 B Old 30+ 96 25.97 C
The data indicates generally that block cracking index increases as time increases. The BC index is statistically different for all three age groups. The same analysis was conducted for weathering/raveling (WR) index as shown in Table 3-5.
Table 3-5 Weathering/raveling versus Age
Age Group Time, Years Samples WR Index Statistical Group Young 5 – 15 247 14.49 A Medium 15 – 30 173 26.19 B Old 30+ 96 20.18 AB
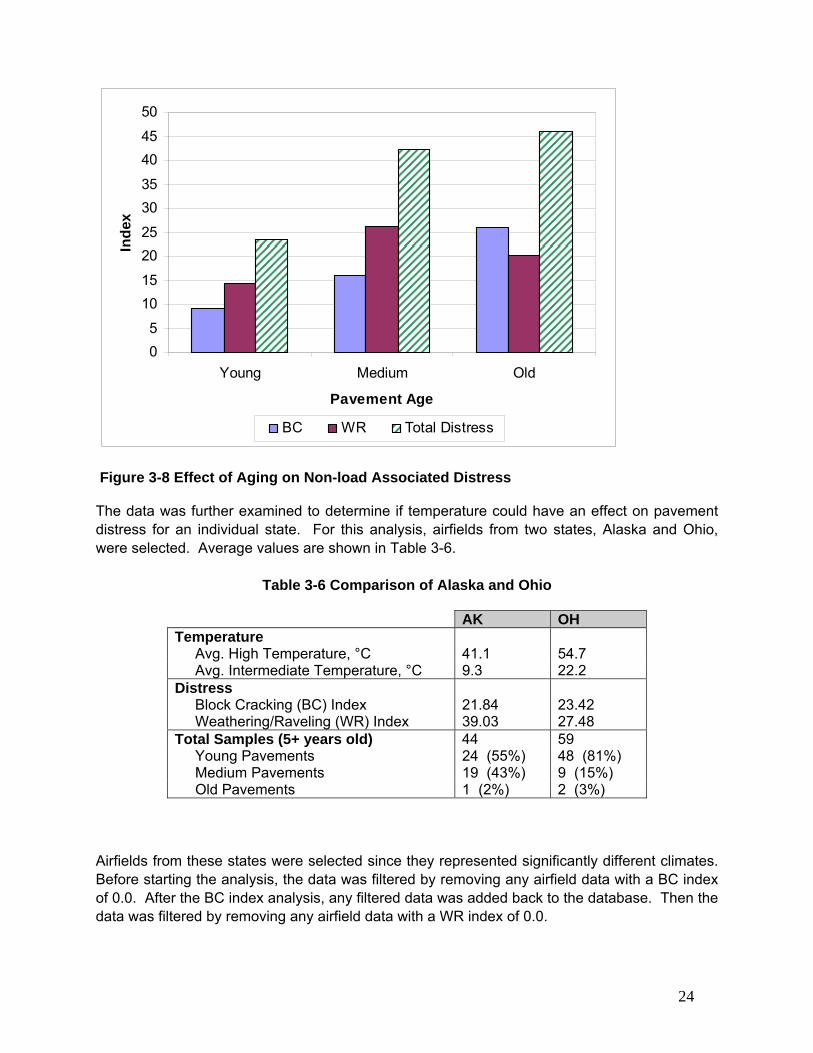
Unlike the analysis of BC index, the WR index does not show a normal trend of increasing distress with increasing age. Although Medium pavements have approximately twice the distress as Young pavements – which is the same response seen for BC index – the Old pavements actually exhibit lower average WR index than the Medium-aged pavements, indicating less average distress for pavements greater than 30 years old. Statistically, the WR index is significantly different for the Young and Medium pavements. The WR index of the Old pavements is statistically the same as the WR indices of the Young and Medium pavements. The reason for this is not apparent. However, it is important to remember that the use of sealers or other preventive maintenance techniques is not captured within the MicroPaver databases used here. The following graph (Figure 3-8) illustrates the average BC index, WR index, and total distress as a function of age group. As can be seen, the total distress (BC + WR) increases as the age group increases. The Young pavements have significantly less total distress than the Medium and Old pavements
24
05
1015
2025
3035
4045
50
Young Medium Old
Pavement Age
Inde
x
BC WR Total Distress
Figure 3-8 Effect of Aging on Non-load Associated Distress The data was further examined to determine if temperature could have an effect on pavement distress for an individual state. For this analysis, airfields from two states, Alaska and Ohio, were selected. Average values are shown in Table 3-6.
Table 3-6 Comparison of Alaska and Ohio
AK OH Temperature Avg. High Temperature, °C 41.1 54.7 Avg. Intermediate Temperature, °C 9.3 22.2 Distress Block Cracking (BC) Index 21.84 23.42 Weathering/Raveling (WR) Index 39.03 27.48 Total Samples (5+ years old) 44 59 Young Pavements 24 (55%) 48 (81%) Medium Pavements 19 (43%) 9 (15%) Old Pavements 1 (2%) 2 (3%)
Airfields from these states were selected since they represented significantly different climates. Before starting the analysis, the data was filtered by removing any airfield data with a BC index of 0.0. After the BC index analysis, any filtered data was added back to the database. Then the data was filtered by removing any airfield data with a WR index of 0.0.

25
For Alaska, 20 airfields that had existed at least five years since major work had a BC index of 0.0, including 13 Young and 7 Medium pavements. The data in Table 3-7 shows the analysis for the remaining 24 airfields.
Table 3-7 Block Cracking Comparison Example - Alaska
Age Group Time, Years Samples BC Index Statistical Group Young 5 – 15 11 25.35 A Medium 15 – 30 12 48.79 AB Old 30+ 1 96.80 B
For Ohio, 14 airfields that had existed at least five years since major work had a BC index of 0.0, all of which were Young pavements. The data in Table 3-8 shows the analysis for the remaining 45 airfields.
Table 3-8 Block Cracking Comparison Example - Ohio
Age Group Time, Years Samples BC Index Statistical Group Young 5 – 15 34 25.77 A Medium 15 – 30 9 43.22 A Old 30+ 2 58.35 A
The analysis of the BC index data for Alaska and Ohio indicates that temperature, as shown in the larger analysis, doesn’t seem to correlate to block cracking. The average high and intermediate temperatures for Alaska and Ohio are substantially different, yet the average block cracking index is approximately the same for airfields in the Young and Medium age groups. Assuming all other factors are the same, this data suggests that the asphalt binder physical properties are appropriate for the climate in which they are expected to operate. Although the average BC index increases as the average time increases, the small sample size for Alaska and Ohio results in no statistically significant difference between age groups for many comparisons. For the Alaska data, the average BC index of the Young airfields is considered statistically different from the average BC index of the Old airfields. For the Ohio data, the average BC index is considered statistically the same for all age groups. For Alaska, all of the airfields that had existed at least five years since major work had a WR index greater than zero. The data in Table 3-9 shows the analysis for the 44 airfields.
Table 3-9 Weathering/Raveling Comparison Example - Alaska
Age Group Time, Years Samples WR Index Statistical Group Young 5 – 15 24 24.71 A Medium 15 – 30 19 57.62 B Old 30+ 1 29.49 AB
As with the Alaska data, for Ohio all of the airfields that had existed at least five years since major work had a WR index greater than zero. The data in Table 3-10 shows the analysis for the 59 airfields.

26
Table 3-10 Weathering/Raveling Comparison Example - Ohio
Age Group Time, Years Samples WR Index Statistical Group Young 5 – 15 48 23.02 A Medium 15 – 30 9 53.04 B Old 30+ 2 19.45 AB
The analysis of the WR index data for Alaska and Ohio indicates that temperature, as shown in the larger analysis and the analysis of block cracking, doesn’t seem to impact weathering/raveling distress. The average high and intermediate temperatures for Alaska and Ohio are substantially different, yet the average weathering/raveling index is approximately the same for airfields in the Young and Medium age groups. As before, this data suggests that the asphalt binder physical properties and other HMA characteristics are appropriate for the climate in which they are expected to operate. As in the analysis of all airfields with at least 5 years since major work, the Medium pavements have the highest WR index and are statistically different than the Young pavements for both Alaska and Ohio. For these states, the WR index is lower for the Old pavements than the Medium pavements (although this observation should be tempered by the low number of Old pavements compared to the Medium and Young pavements. Table 3-11 provides a summary of the database statistics for each state (airfields with at least 5 years since major work).
Table 3-11 Summary of Database Statistics for Each State Average State #Airfields Time,
years Thigh, °C Tint, °C BC Index WR Index
AK 44 15.4 41.1 9.3 21.84 39.03 CA 115 33.3 58.4 30.6 19.43 11.61 GA 59 17.0 58.8 30.1 1.65 6.78 IA 22 20.8 55.3 20.4 9.47 33.64 ID 8 13.4 56.3 22.3 11.3 17.1 MI 23 11.2 53.7 21.3 20.17 6.16 MN 34 11.2 53.1 16.8 6.17 20.30 MO 3 10.7 57.7 24.6 1.93 6.03 OH 59 12.1 54.7 22.2 23.42 27.48 OR 4 8.3 52.9 23.6 15.90 14.52 PA 52 16.4 54.7 22.9 8.46 7.49 UT 32 20.3 57.2 23.9 27.48 53.52 VT 9 17.3 52.6 17.8 13.39 1.62 WA 52 14.6 52.8 23.1 6.89 20.63

27
An interesting note from this data is that OH and PA, although neighboring states with the same environmental conditions, have significantly different block cracking and weathering/raveling distress. Despite having older (on average) pavements, the PA airfields (16.4 years) have significantly lower BC and WR indices than the OH (12.1 years) airfields. The Average BC Index for PA and OH airfields is 8.46 and 23.42, respectively. The Average WR Index for PA and OH airfields is 7.49 and 27.48, respectively. Any number of reasons, including materials, construction, or pavement preservation strategies could be responsible for the differences in identified distresses. Much might be learned from a detailed comparison of PA vs OH materials and methodologies. 3.4 CONCLUSIONS From the analyses presented in this chapter, the following observations were made:
• A significant percentage of the HMA airfield pavements show some level of non-load associated distress with the majority of it being low-severity as defined by MicroPAVER.
• The analysis of LTTPBind and MicroPAVER data indicates that there is not a significant change in non-load associated distress across different climatic regions. This may suggest that the airfield agencies are designing and constructing HMA pavements as appropriate for their climatic conditions. But, it was not possible to obtain original binder properties and this may be masking the temperature effect.
• As HMA pavements age, the amount of non-load associated distress increases.
28
CHAPTER 4 – PRODUCTS AND PROCEDURES CURRENTLY BEING PROMOTED TO CORRECT AND/OR PREVENT NON-LOAD
RELATED DISTRESSES IN AIRFIELD PAVEMENTS
The prevention of potential non-load associated pavement problems at an early age is less costly in time and money than would be required for a pavement rehabilitation project (such as milling and inlay). More and more airports are constructing new pavements with higher quality materials. These include Superpave PG graded asphalts and mix designs developed to address climate-specific problems such as thermal cracking as well as other distresses.1 Engineering Brief 59a provides guidance and an interim specification for Superpave mixtures, titled P-401(SP).2 This specification can be used on all runway, taxiway, and apron pavements. Improved asphalt binders with polymers and other additives have been found to decrease non-load associated pavement distress (raveling and block cracking) by increasing the durability in the most difficult climates.3 Implementation of an effective pavement management system is required to ensure a long life airfield pavement4. The most cost-effective programs include both preventive and corrective actions. The FAA has prepared an advisory circular5 giving specific guidelines and procedures for maintaining airport pavements and establishing an effective maintenance program. The circular includes specific types of distress, their probable causes, inspection guidelines and recommended methods of repair. The FAA does not prescribe the exact format of a local program, allowing each agency or airport to customize their system for local needs, conditions, and resources. The techniques, therefore, vary significantly. This study conducted a review of available technical literature for available innovations, surveyed the states for their current procedures and completed site visits at several locations. Results from the survey and site visits are given below. 4.1 PRODUCTS AND PROCEDURES The best approach to reducing non-load associated distresses in HMA pavements is to create and fund a strong pavement preservation program based upon traditional and newly developed applications. This includes common preventive maintenance activities such as crack sealing, surface treatments (fog seals and slurry seals) and thin overlays, and evolving high-performance modified asphalt technologies such as microsurfacing and ultrathin bonded wearing courses. The preferred goal is to apply these preventive maintenance treatments before damage is visible to retard deterioration and prolong the life of the pavement. If the pavement structure is sound, but surface cracking has progressed beyond a state where conventional preventive maintenance tools can be effective, other pavement preservation tools such as interlayer-seals, hot in-place recycling (HIR) or cold in-place recycling (CIR) may be employed. However, conducting preventive maintenance activities on a sound pavement in good condition is usually the most cost-effective alternative. House painting is a good analogy for preventive maintenance. As with painting a house, the effectiveness of pavement preservation tools is directly related to the condition of the surface at the time of application.

29
Table 4-1 gives expected life extensions of various treatments, showing that treatment application at the right time (PCI level) results in a longer lasting pavement.
Table 4-1. Effectiveness of Treatments Based on Pavement Condition Index5
Estimated Life Extensions (years) Surface Treatment
Good Condition(PCI=80)
Fair Condition (PCI=60)
Poor Condition (PCI=40)
Fog Seal 3 - 5 1 - 3 1 – 2 Chip Seal 7 - 10 3 - 5 1 – 3 Slurry Seal 7 – 10 3 - 5 1 – 3 Microsurfacing 8 – 12 5 - 7 2 – 4 Ultrathin Bonded Wearing Course 10+ 5 - 10+ 2 - 10 Thin HMA 10 - 12 5 - 7 2 – 4 An inappropriate repair (either method or timing) can accelerate the rate of deterioration of the pavement. One useful tool applicable to all asphalt preservation activities is the “Pocket Guide to Pavement Preservation”, which is co-published by the FHWA and the Foundation for Pavement Preservation (FP2). Printed copies are available from the National Center for Pavement Preservation (NCPP), or it may be downloaded from the website6 The pamphlet includes a pavement rating form, a table showing the distress types and levels which are appropriately remedied with each type of treatment and descriptions of the treatments. The NCPP websites (www.pavementpreservation.org and www.tsp2.org) offer a wealth of information on all aspects of pavement preservation. The major cause of non-load associated distress is asphalt age hardening caused by oxidation of the asphalt binder. Therefore, one goal of pavement preservation is to delay aging by restricting the supply of oxygen to the pavement by reducing the surface permeability. Another important goal of preservation is to protect the pavement from moisture damage, which can also be delayed by reducing surface permeability. This can be done with varying degrees of success by applying fog seals, pavement sealers, chip seals, microsurfacing or slurry seals, ultrathin bonding wearing courses, or other applications that seal the surface to prevent intrusion of air and water. The condition of the existing pavement subsurface is an important factor in selecting the type of sealer is appropriate. For example heavier emulsion or rejuvenator applications would be needed to seal the surface when surface permeability is high. Unsealed cracks serve as pathways for moving air and water into underlying layers, so cracked, permeable pavements may not be candidates for preventive seals, unless they are crack-sealed before treatment. Since some oxygen will always be available to the asphalt, sealing strategies are most effective if applied early before binder properties age to critical cracking conditions. A graph showing typical asphalt age hardening (embrittlement) in a pavement over time is represented in Figure 4-1. The objective is to apply the surface seal prior to the point where significant age hardening occurs (where the curve begins to bend upward).

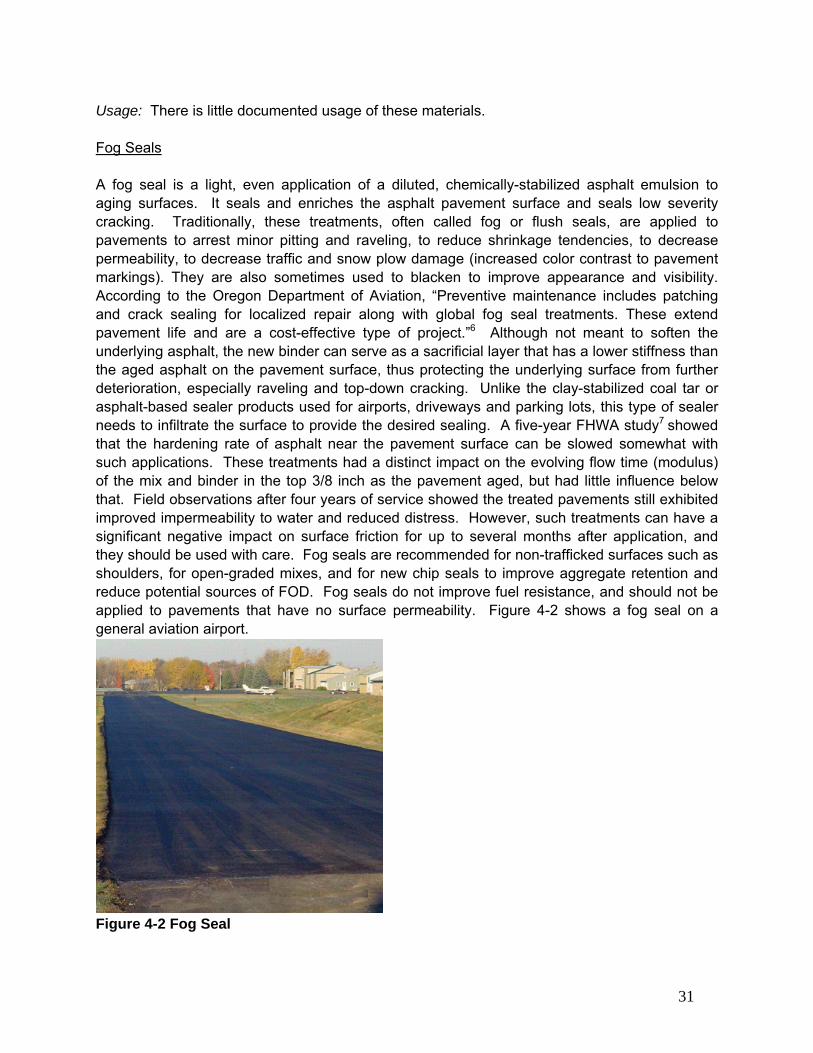
30
0
10
20
30
40
50
60
0 10 20 30 40 50 60 70 80 90 100 110
TIME
EMB
RIT
TLEM
ENT
STIF
FNES
S Historical Concept of How Pavements Age
Figure 4-1 Pavement Aging7 4.1.1 Spray Applied Sealers Seals applied early in a pavement’s life are the lowest cost treatments, and they can be the most cost-effective. As mentioned above, the goal is to seal out oxygen and water preventing premature cracking and raveling from embrittled, oxidized asphalt and moisture damage to the pavement structure. There are several types of seals currently used. Asphalt Based Clay-stabilized Emulsion Sealants These materials are handled and applied using an asphalt distributor. Several manufacturers have developed these to replace the traditional coal tar products. Although more friendly to the environment, these products rarely exhibit the same level of fuel-resistance expected from their coal tar counterparts. Some polymer additives can improve fuel resistance, but the cost is high and fuel resistance rarely equals current standards set for coal tar products. This remains an active area for on-going research. Advantages: Asphalt based sealants are considered safer for workers and the environment than coal tar, and they use the same equipment and application methods that are used for coal tar emulsions. Disadvantages: Clay-stabilized emulsions need agitation, are more difficult to handle, typically cure more slowly and are less available than chemically-stabilized asphalt emulsions.
31
Usage: There is little documented usage of these materials. Fog Seals A fog seal is a light, even application of a diluted, chemically-stabilized asphalt emulsion to aging surfaces. It seals and enriches the asphalt pavement surface and seals low severity cracking. Traditionally, these treatments, often called fog or flush seals, are applied to pavements to arrest minor pitting and raveling, to reduce shrinkage tendencies, to decrease permeability, to decrease traffic and snow plow damage (increased color contrast to pavement markings). They are also sometimes used to blacken to improve appearance and visibility. According to the Oregon Department of Aviation, “Preventive maintenance includes patching and crack sealing for localized repair along with global fog seal treatments. These extend pavement life and are a cost-effective type of project.”6 Although not meant to soften the underlying asphalt, the new binder can serve as a sacrificial layer that has a lower stiffness than the aged asphalt on the pavement surface, thus protecting the underlying surface from further deterioration, especially raveling and top-down cracking. Unlike the clay-stabilized coal tar or asphalt-based sealer products used for airports, driveways and parking lots, this type of sealer needs to infiltrate the surface to provide the desired sealing. A five-year FHWA study7 showed that the hardening rate of asphalt near the pavement surface can be slowed somewhat with such applications. These treatments had a distinct impact on the evolving flow time (modulus) of the mix and binder in the top 3/8 inch as the pavement aged, but had little influence below that. Field observations after four years of service showed the treated pavements still exhibited improved impermeability to water and reduced distress. However, such treatments can have a significant negative impact on surface friction for up to several months after application, and they should be used with care. Fog seals are recommended for non-trafficked surfaces such as shoulders, for open-graded mixes, and for new chip seals to improve aggregate retention and reduce potential sources of FOD. Fog seals do not improve fuel resistance, and should not be applied to pavements that have no surface permeability. Figure 4-2 shows a fog seal on a general aviation airport.
Figure 4-2 Fog Seal
32
Advantages: Fog seals are inexpensive compared to other surface treatments, and only a distributor truck is required to apply the fog seal in most cases. Disadvantages: The expected life of the fog seal is generally shorter than other surface treatments, and if applied too heavily or to a non-porous surface, the fog seal could be slippery and hazardous for the pavement users. A recent study found that friction is generally lowered by the seal, but returns over time. Sanding immediately after the water-based emulsion cures can mitigate the loss of friction. The study concluded that fog seals are safe and effective when used on the right pavements.7 Usage: Emulsified sealers and rejuvenators are best used as a preventive maintenance treatment on HMA pavements in good condition, although the surface may have begun the aging process. They can be used on any asphalt pavement, but traffic should be controlled until the emulsion has fully cured and minimum friction standards have been restored. Spray-applied seals should not be used when a pavement has poor surface texture, large cracks, rutting, shoving, or other structural deficiencies. Many airfield and highway agencies have a scheduled fog seal application program for preventive maintenance that begins between two and ten years after HMA construction. Test procedures which might be used as triggers to optimize timing strategies are not yet available, although concepts and prototypes have been proposed. The FHWA study evaluated a number of approaches. Such methods will be further evaluated in Phase II of this study. The cost of extensive material testing would be prohibitive for small airfields, but it may be possible to develop aging models and product performance curves with minimal test data, thus enabling individual airfields to develop timing strategies for their range of pavement needs. Numerous emulsion products are used for spray applied fog seals. Sealers such as SS-1 (Slow setting emulsified asphalt) or CSS-1 (Cationic slow setting emulsified asphalt) are commonly used to “seal” the pavement surface or to “bind” or “lock” cover material or fines in place reducing aggregate loss. Newer materials containing polymers and other additives are currently being promoted. Gilsonite asphalt resin based fog seals marketed under such names as GSB-88 have been widely used on airfields, such as general use in Colorado as well as on Duluth International Airport in Minnesota. Table 4-2 below lists many of the specialized sealer/rejuvenator products, and was compiled based on contacts within the industry. Much of the detail was obtained using the Internet and reflects the posted company information. This is information is therefore is subject to the accuracy and maintenance of various producer websites. Efforts were made through the Asphalt Emulsion Manufacturer’s Association to obtain the data – but it was unsuccessful. It is also important to note that virtually all asphalt emulsion manufacturers supply basic SS and CSS emulsions that can be diluted for many fog seal applications, and many also supply generic versions of other products listed below. Further information is available from the manufacturers listed in Table 4-2 or local emulsion suppliers. Rejuvenator Seals Asphalt rejuvenators are emulsions of oils intended to replace the oxidized "maltene" fractions in the asphalt, and may again include polymers, asphalt and other additives. They are also light applications of diluted water-based emulsions sprayed by a distributor. Rejuvenator emulsions are most useful on oxidized pavements where low temperature mix properties approach critical levels for surface-initiated block cracking.
33
Advantages: The FHWA study13 showed that properly formulated rejuvenator emulsions can significantly soften the asphalt in the upper 3/8 inch of the pavement surface, as long as the pavement is sufficiently permeable to accept the oil down to that depth. Disadvantages: If the pavement is impermeable, the oil may remain on the surface, leaving a surface that may track and/or exhibit poor skid resistance. The FHWA study participants found the term "infiltrate into the pavement" most apt for defining a critical performance parameter of successful rejuvenator seals. A common laboratory technique for judging the depth of emulsion penetration into the pavement is to cut thin slabs of mix (nominally 0.5 inch) from various depths, extract the binder with an 85:15 blend of toluene and 95 percent ethanol, and evaluate the extracted binder using conventional rheological test methods. It was noted in the FHWA study that the oil-based rejuvenator emulsions without asphalt may leave an oily residue on the tops of aggregates where the asphalt has been worn off, lowering friction. Tracking of oil onto unsealed sections has also been observed. Thus, sanding is strongly recommended for fog seal applications that include only rejuvenator oils. Other emulsions did not track noticeably after curing. However, for most products applied to a dense HMA pavement, friction numbers during the first four hours after application were typically cut by half. If angular sands were spread on the newly applied emulsion such that no loose sand remained, friction numbers soon after application had improved to about 80-90% of original values before opening the road to traffic. If sand is used, brooming should take place as soon as practical after the emulsion is fully cured. Supplier guidelines for some of these emulsions do not require sanding, particularly when residues are hard or are modified with polymers. Usage: See notes above for fog seals. Manufacturers recommend sanding rejuvenator emulsions before returning the pavement to use. Commercially available products are listed in Table 4-2. The FHWA study concluded that the use of spray applied sealers is generally inexpensive and an effective procedure for extending the life of HMA pavements. The primary concern with the use of these sealers is the possible loss of friction following application. Coal Tar Clay-Stabilized Emulsion Sealers Water-based, clay-stabilized coal tar surface sealants have long been applied to airfield pavements, largely to provide some pavement protection from fuel spills or hydraulic leaks. These products are typically sprayed with a distributor truck or hand sprayer or a squeegee is used to spread the sealer onto the pavement such that the newly coated surface is sealed to passage of moisture and oxygen. Coal tar sealers are manufactured with refined coal tar, which is a byproduct of the coking process used for steel production. Rather than the chemicals typically used to manufacture most asphalt emulsions, fine clay particles serve as the emulsifier/stabilizer for these products. The coal tar oils may be mixed with asphalt cement and/or a polymer modifier such as latex rubber. These products fully seal the pavement surface to air and water, and they exhibit good fuel resistance. Advantages: Coal tar based materials are insoluble in most solvents and are, therefore, the most effective at protecting against damage from spilled fuels and hydraulic fluids.

34
Disadvantages: Coal tar materials elicit environmental concerns and are considered carcinogenic because of high concentrations of benzo(a)pyrene in the coal tar base oils. Usage: The FAA Specification P-269 Coal-Tar Sealer Rejuvenator requires that the coal-tar sealers used for airfield applications contain 35 per cent coal tar pitch. Because coal tar is considered a danger to workers and the environment, these materials are largely being discontinued.
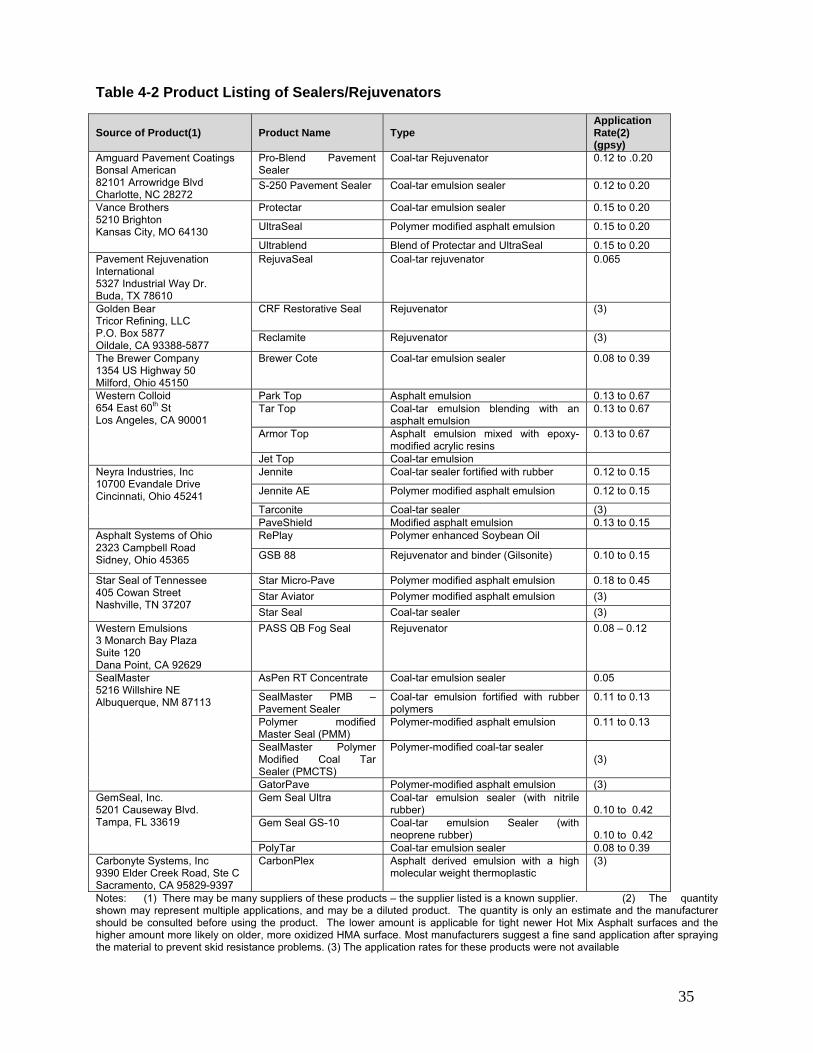
35
Table 4-2 Product Listing of Sealers/Rejuvenators
Source of Product(1) Product Name Type Application Rate(2)
(gpsy) Amguard Pavement Coatings Bonsal American 82101 Arrowridge Blvd Charlotte, NC 28272
Pro-Blend Pavement Sealer
Coal-tar Rejuvenator 0.12 to .0.20
S-250 Pavement Sealer Coal-tar emulsion sealer 0.12 to 0.20
Vance Brothers 5210 Brighton Kansas City, MO 64130
Protectar Coal-tar emulsion sealer 0.15 to 0.20
UltraSeal Polymer modified asphalt emulsion 0.15 to 0.20
Ultrablend Blend of Protectar and UltraSeal 0.15 to 0.20 Pavement Rejuvenation International 5327 Industrial Way Dr. Buda, TX 78610
RejuvaSeal Coal-tar rejuvenator 0.065
Golden Bear Tricor Refining, LLC P.O. Box 5877 Oildale, CA 93388-5877
CRF Restorative Seal Rejuvenator (3)
Reclamite Rejuvenator (3)
The Brewer Company 1354 US Highway 50 Milford, Ohio 45150
Brewer Cote Coal-tar emulsion sealer 0.08 to 0.39
Western Colloid 654 East 60th St Los Angeles, CA 90001
Park Top Asphalt emulsion 0.13 to 0.67 Tar Top Coal-tar emulsion blending with an
asphalt emulsion 0.13 to 0.67
Armor Top Asphalt emulsion mixed with epoxy-modified acrylic resins
0.13 to 0.67
Jet Top Coal-tar emulsion Neyra Industries, Inc 10700 Evandale Drive Cincinnati, Ohio 45241
Jennite Coal-tar sealer fortified with rubber 0.12 to 0.15
Jennite AE Polymer modified asphalt emulsion 0.12 to 0.15
Tarconite Coal-tar sealer (3) PaveShield Modified asphalt emulsion 0.13 to 0.15
Asphalt Systems of Ohio 2323 Campbell Road Sidney, Ohio 45365
RePlay Polymer enhanced Soybean Oil
GSB 88 Rejuvenator and binder (Gilsonite) 0.10 to 0.15
Star Seal of Tennessee 405 Cowan Street Nashville, TN 37207
Star Micro-Pave Polymer modified asphalt emulsion 0.18 to 0.45 Star Aviator Polymer modified asphalt emulsion (3) Star Seal Coal-tar sealer (3)
Western Emulsions 3 Monarch Bay Plaza Suite 120 Dana Point, CA 92629
PASS QB Fog Seal Rejuvenator 0.08 – 0.12
SealMaster 5216 Willshire NE Albuquerque, NM 87113
AsPen RT Concentrate Coal-tar emulsion sealer 0.05
SealMaster PMB – Pavement Sealer
Coal-tar emulsion fortified with rubber polymers
0.11 to 0.13
Polymer modified Master Seal (PMM)
Polymer-modified asphalt emulsion 0.11 to 0.13
SealMaster Polymer Modified Coal Tar Sealer (PMCTS)
Polymer-modified coal-tar sealer (3)
GatorPave Polymer-modified asphalt emulsion (3) GemSeal, Inc. 5201 Causeway Blvd. Tampa, FL 33619
Gem Seal Ultra Coal-tar emulsion sealer (with nitrile rubber)
0.10 to 0.42
Gem Seal GS-10 Coal-tar emulsion Sealer (with neoprene rubber)
0.10 to 0.42
PolyTar Coal-tar emulsion sealer 0.08 to 0.39 Carbonyte Systems, Inc 9390 Elder Creek Road, Ste C Sacramento, CA 95829-9397
CarbonPlex Asphalt derived emulsion with a high molecular weight thermoplastic
(3)
Notes: (1) There may be many suppliers of these products – the supplier listed is a known supplier. (2) The quantity shown may represent multiple applications, and may be a diluted product. The quantity is only an estimate and the manufacturer should be consulted before using the product. The lower amount is applicable for tight newer Hot Mix Asphalt surfaces and the higher amount more likely on older, more oxidized HMA surface. Most manufacturers suggest a fine sand application after spraying the material to prevent skid resistance problems. (3) The application rates for these products were not available
36
4.1.2 Sealer Procedures using Aggregates There are a number of procedures that are used for sealing HMA pavements that consist of the use of an asphalt product and an aggregate. The following sections describe those procedures. Chip Seals A chip seal is a binder (asphalt emulsion, hot applied asphalt or cutback asphalt) spray applied by a distributor followed immediately by the application of clean, single-sized, aggregate (chips). The binder shot rate is calculated in a laboratory design to achieve optimal embedment of the chip in the residual asphalt. In the field, the shot rate should be adjusted for the surface condition of the existing pavement. In a single chip seal, an asphalt emulsion is sprayed on the pavement with a distributor, then immediately covered by a single layer of uniformly sized chips from a chip spreader. A double chip seal repeats the same procedure using lower emulsion and aggregate application rates, and the second aggregate is smaller sized than the first. The new surface treatment is then rolled to seat the aggregate, and broomed to remove any loose chips. Traffic should be controlled so that the new surface is not disturbed until after the final sweeping. The asphalt may be modified with polymers and other additives for quicker chip retention, lower temperature susceptibility and more durable performance. Advantages: Chip seals waterproof and seal small cracks and imperfections in the pavement surface, enriches hardened and oxidized asphalt, improves skid resistance and surface macro-texture, and protects the underlying pavement from oxidation, aging and traffic wear. They last longer than spray applied seals. Disadvantages: Chip seals may have loose, unbound aggregates on airfield surfaces which contribute to FOD. However, they may be used on surface roads throughout the airfield with great success. Significant chip seal loss can occur if the seal is placed in marginal weather conditions. Usage: Chip seals are generally not used without some kind of bound cover material on airfield pavement surfaces due to possible foreign object damage (FOD). On those they are used as an interlayer in conjunction with slurry seals or microsurfacing for cape seals and prior to Hot Mix Asphalt (HMA) overlays. Since chip sealing does not significantly increase the structural capability of pavement, the existing pavement must be structurally sound. Moderate severity cracks or other distresses should be sealed or repaired, and the surface should be cleaned prior to the treatment. The treatment is ideal for pavements with loss of surface texture and as a preventive maintenance treatment on aging pavements in good condition with minimal surface distress. A fog seal applied to new chip seals can reduce FOD. Slurry Seals
A slurry seal is a mixture of well-graded fine aggregate, mineral filler such as Portland cement (if needed), emulsified asphalt, and water mixed and applied to a pavement with a single piece of equipment. As the truck moves forward, the slurry mixture is extruded from the back side of the sled. The slurry cures as the water evaporates, leaving only the asphalt to bond with the aggregate. The seal is very thin, typically one aggregate thick. Traffic can be returned once the
37
slurry has cured, usually within four to six hours. It is used in both the preventive and corrective maintenance of asphalt pavement surfaces. It does not increase the pavement’s structural strength. Any pavement that is structurally weak in localized areas should be repaired before applying the slurry seal. All ruts, humps, low pavement edges, crown deficiencies, waves, or other surface irregularities that diminish the riding quality should be corrected before placing the slurry seal. Timely application can help reduce surface distress caused by oxidation of the asphalt and embrittlement of the paving mixture.
Advantages: Slurry seals seal small surface cracks, stop raveling and loss of matrix, make open surfaces impermeable to air and water, and improve skid resistance and pavement appearance. Slurry seals protect the existing pavement structure from UV damage, oxidation, mechanical wear and exposure to some chemicals.
Disadvantages: Slurry seals cure more slowly than microsurfacing and cannot be used to fill depressions. They can be very tender for several weeks after placement leaving marks or damage from turning vehicles. This can result in a FOD problem and require diligent sweeping operation during the early life of the slurry seal. Larger underlying cracks ten to reflect through the slurry seal surface in two to three years because the surfacing is very thin.
Usage: Slurry seals are one of the oldest surface treatments and are commonly used on airfields,8 but some states have indicated that they do not use slurry seals on apron areas due to the possibility of raveling due to turning aircraft which may cause FOD problems. A Type I slurry seal uses a fine aggregate and is designed for parking lots and taxiways. Some slurry seals are modified with polymers to reduce raveling. Ideally, a slurry seal maintenance program should be undertaken before significant pavement deterioration becomes apparent. Slurry can be applied to oxidized pavements with moderate distresses. The slurry seal will fill small cracks and voids and provide some leveling of the road surface. Slurry seals are not designed to fill large depressions or ruts.
Microsurfacing Microsurfacing is sometimes referred to as high performance slurry seal. Microsurfacing is a mixture of dense-graded aggregate, polymer modified asphalt emulsion, water, mineral fillers and other additives. A continuously run machine is used for mixing the components. The material flow rates are continuously monitored as the components are fed into the pug mill where they are thoroughly mixed. The mix is then poured into a sled that is pulled behind the machine. The sled is equipped with augers to move the relatively stiff material to the full width of the sled. The material is extruded from the backside of the sled at a predetermined depth. Microsurfacing is similar to slurry seal, but the polymer-modified emulsion and other additives allow microsurfacing to cure very quickly so it can accept traffic within minutes. Some applications of microsurfacing can be placed in greater depths and it can be used to fill ruts and depressions up to one inch. Microsurfacing is designed to be stronger and to provide superior durability to slurry seal. The quicker cure reduces downtime with traffic return often within an hour of construction. Microsurfacing aggregates are also generally higher quality than those used for slurry seal. Therefore, microsurfacing provides long-life surfacing with more resistance to the reflection of minor surface cracking from the underlying HMA layer. Although microsurfacing mixes are rarely compacted for highway applications, light rolling is typically used on airfield pavements to prevent surface raveling and resulting concerns with FOD.

38
Advantages: The quick setting characteristics reduce user delay by allowing traffic in about an hour after construction. Microsurfacing may be used for surface improvement and protection of both asphalt and concrete pavements (tack coat required for concrete). The surface increases skid resistance, and has an attractive, smooth black surface which improves visibility. Microsurfacing emulsions have a chemical break, allowing them to be successfully applied in a broad range of temperatures and weather conditions, effectively lengthening the paving season and allowing night paving. Microsurfacing fills depressions, small cracks and ruts, and it provides some surface leveling. Microsurfacing is a cost-effective, long-lasting pavement preservation treatment that seals the pavement surface and protects the pavement from water, weathering, UV deterioration, mechanical wear and chemicals, prolonging the lifespan of the underlying pavement. Disadvantages: Microsurfacing requires special equipment that is heavier and sturdier than a slurry machine. The cost is higher than a slurry or chip seal treatment. Usage: Microsurfacing works well for runways and taxiways on airports and, therefore, has wide usage in the U.S. The high friction surface provides excellent skid resistance with no loose aggregates to damage engines or propellers. For example, it has been applied to more than 40 airports in Florida, including Clearwater, St. Augustine and Key West. Oklahoma applications include Max Westheimer Airport in Norman, Stillwater Regional Airport and R.L. Jones Airport in Tulsa. It has also been used on airports in Kansas, Kentucky, North Carolina, Maryland, Texas and Wisconsin. Pavement candidates may be asphalt or concrete pavements in good structural condition with low severity surface distresses, polished surfaces, raveling and minor rutting. Microsurfacing is typically available in two aggregate sizes:
• Type II, the most commonly used type, uses a coarse aggregate and is used for all applications including arterial roads, residential areas, highways and airports.
• Type III uses the coarsest aggregate and is used on higher traffic pavements, including freeways, high speed roads, industrial estates and runways.
Cape Seals A cape seal is a skid-resistant, durable preventive maintenance surfacing applied by a two-step system. The treatment is named for the Cape of Good Hope, the jurisdiction that initially developed the process. Cape seals consist of the application of an asphalt emulsion chip seal followed by the application of either a slurry seal or microsurfacing. A chip seal is the uniform application of an asphalt emulsion covered with stone. Advantages: The cape seal increases the life of a chip seal by enhancing binding of the chips and by protecting the surface. The cape seal surface does not have any loose aggregate and creates a dense mat. Cape seals seal and waterproof pavement surfaces, restore skid resistance, blacken surfaces, prevent raveling, prevent FOD from loose chips, protect the environment and worker safety with water-based emulsion applied at low temperatures, and are cost-effective surface preventive maintenance or new surfacing for preserving pavements
39
Disadvantages: Equipment for both the chip seal treatment and the slurry or microsurfacing application is required. The construction process is longer, more complicated and more expensive than either a chip seal treatment or a slurry seal application. Usage: The thin surface is an excellent choice for preventive maintenance and skid renewal on airports. The pavement to be sealed should have an essentially sound base and be properly drained. It should have a good profile and alignment and may have raveling or minor asphalt aging or cracking. There should be no sign of sub-base movements or surface bleeding. Potholes and cracks should be filled. The surface should be swept of any stones, sand, mud or other loose debris. Cape seals are widely used on airports, especially in Australia and New Zealand.8 An unusual project occurred at Santa Catalina Island Airport off of the coast of California where the technique was selected and materials were barged to the project site, because there were no asphalt plants on the island.9,10
Summary Table 4-3 presents a summary of the advantages and disadvantages of each of the pavement sealing options discussed above.
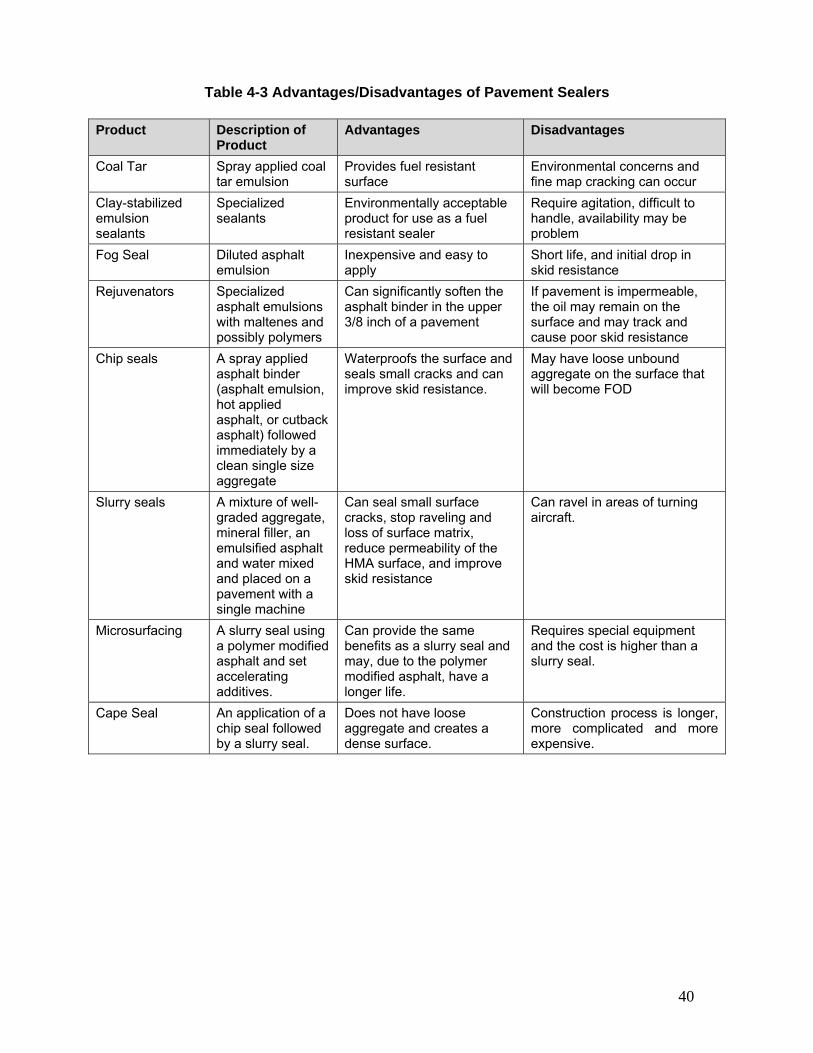
40
Table 4-3 Advantages/Disadvantages of Pavement Sealers Product Description of
Product Advantages Disadvantages
Coal Tar Spray applied coal tar emulsion
Provides fuel resistant surface
Environmental concerns and fine map cracking can occur
Clay-stabilized emulsion sealants
Specialized sealants
Environmentally acceptable product for use as a fuel resistant sealer
Require agitation, difficult to handle, availability may be problem
Fog Seal Diluted asphalt emulsion
Inexpensive and easy to apply
Short life, and initial drop in skid resistance
Rejuvenators Specialized asphalt emulsions with maltenes and possibly polymers
Can significantly soften the asphalt binder in the upper 3/8 inch of a pavement
If pavement is impermeable, the oil may remain on the surface and may track and cause poor skid resistance
Chip seals A spray applied asphalt binder (asphalt emulsion, hot applied asphalt, or cutback asphalt) followed immediately by a clean single size aggregate
Waterproofs the surface and seals small cracks and can improve skid resistance.
May have loose unbound aggregate on the surface that will become FOD
Slurry seals A mixture of well-graded aggregate, mineral filler, an emulsified asphalt and water mixed and placed on a pavement with a single machine
Can seal small surface cracks, stop raveling and loss of surface matrix, reduce permeability of the HMA surface, and improve skid resistance
Can ravel in areas of turning aircraft.
Microsurfacing A slurry seal using a polymer modified asphalt and set accelerating additives.
Can provide the same benefits as a slurry seal and may, due to the polymer modified asphalt, have a longer life.
Requires special equipment and the cost is higher than a slurry seal.
Cape Seal An application of a chip seal followed by a slurry seal.
Does not have loose aggregate and creates a dense surface.
Construction process is longer, more complicated and more expensive.
41
4.1.3 Crack Sealing and Filling Crack sealing or filling is the most common method to prevent water or incompressible materials from entering the cracks with low to medium severity. Crack sealing materials are designed to adhere to the walls of the crack, stretch with the movement of the crack over the range of climatic conditions associated with the crack location. Crack sealers used for HMA pavements are usually asphalt rubber or asphalt binders modified with polymers or other materials. The crack sealers are normally heated and applied at high temperatures. Cold pour crack fillers are made by the addition of fillers to heavily polymer-modified asphalt emulsions. They are designed for easy application to fill and seal cracks in pavement. When cured, the polymer-modified asphalt residue seals out water and incompressible materials. Advantages: The crack sealants and fillers prevent intrusion of water and incompressible materials which can widen the cracks and cause further deterioration. The processes prevent further raveling of the cracks and water damage to the underlying pavement structure. The high polymer content means the residue stays pliable in cold weather and retains its integrity at high temperatures. Crack fillers and sealers retard deterioration and have been found to be among the most cost-effective pavement preservation treatments. When used before resurfacing they help prevent reflective cracking in slurry seals, microsurfacing, ultrathin bonded wearing courses, thin hot mix overlays and other surface treatments. Disadvantages: If not applied correctly, the crack materials may bleed through new surfaces or create bumps. Usage: Normally crack fillers should be used on non-working cracks, and sealers on working cracks. The cracks should be cleaned of debris before either process. Crack sealers are heated and applied to the crack. The crack fillers are poured from pour pots into the crack and allowed to cure. Cold pour crack fillers can be used to fill low or moderate severity cracks on asphalt or concrete pavements. Working cracks or cracks of more than minor severity should be sealed before surface treatments are applied. Crack sealers and fillers are widely used on airfields. Damage at poorly constructed joints is a common problem. Proactive crack sealing is an ideal solution.
42
4.1.5 Ultrathin Overlays An ultrathin bonded wearing course (also known as Paver Placed Surface Seal or NovaChip®) is a very thin, open-graded, hot mixed asphalt friction course placed over a heavy application of polymer-modified asphalt emulsion which seals the existing pavement surface. The material is laid using specially built equipment which spreads both the asphalt emulsion and hot mix asphalt in a single pass. The material is placed at an average thickness of ⅜” (10 mm) to ¾” (20mm). This same paver can be used to place more traditional thin open-graded HMA (OGFC, PFC) or open-graded asphalt-rubber mixes with the advantage of the heavy emulsion tack and seal which blocks oxygen from reaching underlying pavement layers. Such treatments are being used successfully on heavily trafficked pavements, including Portland cement concrete surfaces. The new HMA surface can be opened to traffic within fifteen minutes after construction with little risk for FOD damage. Such techniques might be used where potential FOD damage eliminates the use of chip seals, or where premium surface aggregates are relatively expensive. Advantages: There is excellent bonding strength between the ultrathin bonded wearing course and the existing pavement, preventing delamination, raveling and danger of FOD. The surface is placed in one pass, without milling. Construction is quick and traffic return is typically within about five minutes after rolling. Work can proceed at two to three times the rate of a typical hot mix process. The open-graded aggregate matrix allows water to drain quickly. The process uses one-half to one-third the amount of aggregate of typical hot mix. The surface gives long lasting pavement preservation, with service life up to 10 years or longer with crack sealing. Disadvantages: The process is more expensive than other surface treatments and requires special equipment. Usage: Although not yet widely used on U.S. airfield pavements, such new technology deserves serious consideration for reducing non-load initiated distresses. The processes have been used on airfields throughout the world. Marketed under the name “Safepave” in the United Kingdom, it has been used on runways at Heathrow Airport in London. One application in the U.S. was on the Mustang Beach Airport in Port Aransas, Texas. 4.1.6 Thin Overlays Thin Hot Mix Asphalt (HMA) overlays have been the most common asphalt treatment on airports, with either a dense graded HMA layer or an open-graded porous friction course. A thin overlay is a one to two-inch layer of HMA placed either on the existing pavement or after the top layer of the existing HMA pavement has been milled to remove the surface distress. The HMA mix for an airfield is normally a ½ inch P-401 mixture placed 1 ½ to 3 inches thick. It is used as a part of an overall preventive maintenance program. Advantages: Thin overlays generally are quickly constructed and are available in all parts of the country. Thin HMA overlays are generally considered to be the longest lasting preventive maintenance surface treatment. Disadvantages: The overlay may be more expensive than other alternatives. Reflective cracking and delamination problems may occur.
43
Usage: Thin HMA overlays are routinely used on airports throughout the U.S. Arizona uses an asphalt-rubber modified binder. Some states use a porous friction course with a heavy tack coat. 4.1.7 Interlayer/Sealer Systems As surface initiated cracking reaches low to moderate severity, double layer systems offer additional options to delay further pavement damage. Some such systems first spray apply a heavy application of a polymer or crumb-rubber modified binder/emulsion, followed by an application of cover aggregate and then a very thin surface application. The polymer/rubber chip seal serves as an interlayer which slows the reflection of existing surface cracks through a new thin surface. Using larger aggregates for the interlayer enables heavier applications of the elastomeric binder. To reduce FOD and provide a smoother surface, any of the thin layers discussed above might then be considered for the finished surface. Hot mix asphalt (HMA) overlays are the traditional method for protecting deteriorating pavements. They strengthen the pavement structure, reduce roughness and restore skid resistance. However, existing cracks in the pavement begin to appear in the new surface within one or two years. It is common to see all cracks reflect through the new overlay in three to five years. To address the problem, pavement designers typically increase overlay thicknesses. When the cracks enable water infiltration, freeze-thaw cycles and repeated loadings cause the asphalt surface to deteriorate at the crack and eventually ravel resulting in roughness and potholing. The most serious problems are poor ride and deterioration of the base structure caused by moisture permeating through the cracked pavement. While no product will stop reflective cracking, it can be retarded with the use of interlayers. There are several new technologies to construct crack-reducing interlayers with asphalts combined with materials such as polymers, fabrics, rubber and fibers that seal, bridge and remain intact while flexing with the cracks. The following is a listing of some of the interlayer/sealer systems. Many of these are proprietary. Fibermat Fibermat is a high performance, skid resistant surface treatment produced by Owens-Corning. It is constructed with a one-pass application of a sandwiched matrix of polymer-modified asphalt emulsion, chopped fiberglass fibers and a second layer of emulsion. The strong, adhesive membrane is covered with chip seal aggregates. The tensile strength of the fibers gives outstanding reinforcement to the surface, bridging cracks, voids and other distresses in the existing pavement. The emulsion seals the surface and binds the aggregate top layer. The stone provides a durable, skid resistant surface. The interconnecting bonding of cured asphalt, fibers and aggregates results in a very tough, very durable surface. The process may be used as preventive and corrective maintenance on distressed asphalt, concrete and composite pavement surfaces. After any severe cracks and base and drainage problems are repaired, the process uses a trailer-mounted machine that is equipped with two slot-jet spray bars, a fiber chopping mechanism and compressed air. The first spray bar applies the asphalt emulsion. The machine then uses compressed air to expel the fibers from the chopping mechanism. The fiberglass comes on spools and is cut by the mechanism in the application machine to lengths from 1.2 to 3.5 inches. The operator controls the fiber length and coverage by the blade and rotation speeds. The fibers are immediately covered with emulsion by the second spray bar. The emulsion is typically applied at a shot rate of 0.2 to 0.25 gallons per yd2 for each of the two
44
applications, and the fiberglass at 2 to 4 ounces per yd2. The 3/8” or ¼” chip seal aggregate is then immediately applied with a chip spreader, at typical chip seal rates (just enough aggregate to cover the emulsion). Once the emulsion has set, the surface is rolled and swept, typically within 15 minutes, regardless of temperature or humidity. The surface is then ready to open. The system can be applied as a single or double seal resulting in finished thicknesses of ¼ to ¾ inch. Fibermat is a high-performance treatment for correcting and protecting structurally sound pavements with aging or distressed surfaces. Over asphalt or concrete, Fibermat waterproofs and seals cracked and crazed surfaces, restoring skid resistance and enhancing appearance. It is suitable for all types of pavements with distressed surfaces. For preventive maintenance, the pavement to be sealed should be essentially sound and properly drained. It should have a good profile and alignment with only minor asphalt aging and cracking. There should be no sign of sub-base movements or surface bleeding. When warranted, potholes and cracks should be filled. The surface should be swept of any stones, sand, mud or other loose debris. Because it is an emulsion application, Fibermat construction should be done on warm, dry days. Fibredec Fibredec is an interlayer designed to prevent reflective cracking through a hot mix overlay produced by COLAS. It is constructed similarly to Fibermat, but has a two-pass application of a sandwiched matrix of polymer-modified asphalt emulsion, chopped fiberglass fibers, followed by a second layer of emulsion and aggregates, designed as a stress-absorbing membrane interlayer (SAMI) to seal distressed pavements and retard reflection cracking of hot mix asphalt (HMA) overlays. The tensile strength of the fibers gives outstanding reinforcement to the SAMI. The interconnecting bonding of cured asphalt, fibers and aggregates results in a very tough, very durable interlayer. The process may be used on distressed asphalt, concrete and composite pavements. Fibredec layered membranes have been used for years in Australia and Europe, where they have delayed reflective cracking twice as long as road paving fabrics. The first step is to repair any severe cracks and any base and drainage problems. The process of placing the Fibredec begins with a trailer-mounted machine that is equipped with two slot-jet spray bars, a fiber chopping mechanism and compressed air. The first spray bar applies the asphalt emulsion. The machine then uses compressed air to expel the fibers from the chopping mechanism. The fiberglass comes on spools and is cut by the application machine to lengths from 1.2 to 3.5 inches. The operator controls the fiber length and coverage by the blade and rotation speeds. The fibers are immediately covered with emulsion by the second spray bar. The emulsion is typically applied at a shot rate of 0.2 to 0.25 gallons per yd2 for each of the two applications, and the fiberglass at 2 to 4 ounces per yd2. The 3/8” or ¼” chip seal aggregate is immediately applied with a chip spreader, at typical chip seal rates (just enough aggregate to cover the emulsion). Once the emulsion has set, the surface is rolled and swept, typically within 15 minutes. The membrane may be opened to traffic before the overlay is placed, if necessary. A hot mix asphalt overlay completes the construction. Fibredec can be used on any asphalt or concrete pavement to be overlaid with HMA, including airfields. There should be no sign of sub-base movements or moisture damage. When warranted, potholes and large cracks should be filled, and any structure or base problems should be repaired. The surface may have aged asphalt with extensive surface cracking, raveling and other surface distresses; or concrete pavements may have severe surface distresses. The surface should be swept of any stones, sand, mud or other loose debris. With the right hot mix overlay, Fibredec enables thinner
45
overlay lifts and retards reflective cracking, extending the serviceable life of the overlay. Because it is an emulsion application, Fibredec construction should be done on warm, dry days. Geotextiles Geotextiles are produced by many companies. They are synthetic polymer permeable membranes, especially designed for a wide range of civil engineering applications including airfields. In flexible and composite pavements, they reinforce the asphalt layer, accepting a large part of the horizontal tensile stress and distributing the stresses over a larger area. When impregnated with asphalt, geotextiles form an impermeable barrier that dissipates stresses over existing cracks and prevents water from reaching lower levels of the road. They delay reflection cracking and provide a waterproofing layer below an overlay when cracking does develop. Geotextiles are designed for a variety of uses, including segregating granular materials and dirt as well as reinforcing asphalt overlays on severely cracked asphalt and concrete pavements needing corrective maintenance. They have been successfully used on airfields. Any structure, base or drainage problems and severe cracks or potholes should be addressed before construction with the geotextile. Existing, distressed asphalt on the surface may be milled off, and a leveling course may be applied if warranted to correct the cross-slope or crown and alignment. A thin HMA overlay or other surface is usually placed over the textile. TruPave® TruPave® is an engineered paving mat produced by Owens-Corning. It is placed over a hot applied asphalt tack (typically a PG 64-22 applied at 0.2 gallons per yd2) to form an interlayer between the existing pavement and a hot mix asphalt (HMA) overlay. The thin (4 oz. per yd2) TruPave mat is a non-woven fiber glass/polyester hybrid. The interlayer combination of asphalt tack and TruPave mat provides a continuous, non-deforming, water-resistant barrier with low elongation and immediate tensile strength. The TruPave material remains intact at temperatures up to 495°F during construction, and unlike other fabrics, it can be milled and recycled at the end of its service life. The interlayer delays reflective cracking, extending the life of the pavement and dramatically lowering repair and maintenance costs. TruPave interlayers can be and have been successfully used on any asphalt or concrete pavement to be overlaid with HMA, including airfields. Any structure, base or drainage problems and severe cracks or potholes should be addressed before construction with the TruPave interlayer. Existing, distressed asphalt on the surface may be milled off, and a leveling course may be applied if warranted to correct the cross-slope or crown. TruPave interlayers may also be used before the application of a chip seal surface treatment. Asphalt Rubber SAMIs (Stress Absorbing Membrane Interlayers) Asphalt Rubber SAMIs are placed between distressed pavements and hot mix overlays to seal existing cracks and retard reflective cracking. The innovative interlayer includes 3/8” or ½” stone placed over a thick (0.5 to 0.7 gallons per yd2) hot-applied binder composed of asphalt blended with 20% by weight rubber from recycled tires. The interlayer is then covered with a traditional hot mix asphalt overlay. The tire rubber is finely ground at ambient temperatures then blended with asphalt at temperatures exceeding 350ºF. The high temperature causes the oils in the asphalt to swell the elastomeric rubber polymer, resulting in a stiff, elastic and flexible

46
binder material that remains flexible at low temperatures and doesn’t flow at high temperatures. The tire rubber contributes polymer, carbon black and anti-oxidants. The result is a thick, very adhesive and cohesive membrane binder that bridges and flexes with cracks, protects the pavement structure from water and retards reflective cracking. Asphalt rubber SAMIs are designed for waterproofing and sealing the existing distressed pavement surface and retarding reflective cracking when overlaying severely cracked and raveled surfaces. It has been proven effective for airfields. The pavement to be overlaid should have a structurally sound base and be properly drained. It may have aged asphalt with extensive surface cracking, raveling and other surface distresses. There should be no sign of sub-base movements or moisture damage. When warranted, potholes and large cracks should be filled. The surface should be swept of any stones, sand, mud or other loose debris. With the right hot mix overlay, asphalt rubber SAMIs enable thinner overlay lifts and retard reflective cracking, extending the serviceable life of the overlay. Strata® Strata® reflective crack relief system is a specially designed hot mix with a high asphalt content, highly polymer modified asphalt binder and fine aggregate produced by Strata Systems, Inc. It is placed using conventional hot mix equipment in a 1-inch layer over the existing asphalt or concrete pavement. It is then covered with a hot mix overlay. Advantages and Disadvantages of Interlayer Systems Advantages: The interlayers seal and waterproof existing pavement surface, retard reflective cracking, disrupt the pathway for water from surface into the pavement structure, allow thinner lifts of HMA overlays, and may be covered with even less expensive surface treatments such as microsurfacing. They are cost-effective protection for prolonging the service lives of new surfaces. Disadvantages: The cost benefit of an interlayer needs to be evaluated for each situation. The use of an asphalt rubber overlay or more frequent surface treatments may be more cost effective. There is also a concern about whether some of the interlayer materials can be included in a recycled HMA pavement. Usage: Interlayers can be used on any asphalt or concrete pavement to be overlaid with HMA. Any structure or base problems and severe cracks or potholes should be addressed before interlayer construction. There are a number of new crack reducing interlayers, including Asphalt Rubber Stress Absorbing Membrane Interlayer (SAMI), Fibredec Stress Absorbing Membrane Interlayer (SAMI), TruPave® Engineered Paving Mat, Geotextiles, Grids and Strata® crack relief system. Usage to date has been limited, but examples include the use of the Trupave fabric on the Ft. Lauderdale Executive Airport in Florida and a Strata interlayer on the Rock County Airport in Janesville, Wisconsin.
47
4.1.8 Hot In-Place Recycling Hot In-place Recycling (HIR) rehabilitates asphalt pavements on-site and in-place. The process removes one to four inches of the existing pavement, mixes it with new asphalt emulsion binder and places the recycled mix on the pavement, all in a continuous operation. The process minimizes the uses of additional virgin materials and demonstrates the ability of asphalt pavements to be recycled economically and quickly. The pavement is heated to approximately 300°F to soften the surface which is then scarified to prepare it for milling. The top one to four inches of the scarified pavement is milled and mixed with an emulsion that replaces the attributes that have been lost in the old material. The original material is completely coated with the emulsified asphalt. The mixture is then placed by a paver with a vibratory screed. The mix is compacted using traditional hot mix rollers. Hot in-place recycling may be performed as either a single pass or a two pass operation. In the single-pass operation, the rehabilitated material is combined with some virgin material and replaced. In the two-pass operation, the existing material is restored and replaced and then, after a curing period, is covered with a new wearing surface. Advantages: The process is quick with little down time. Cracks are closed and filled, flexibility is restored by chemically rejuvenating the aged and brittle pavement, and the skid resistance is increased. Deformations such as potholes, ruts, bumps and shoved pavement are leveled. There is excellent public acceptance of recycled materials. Disadvantages: Heating the existing pavement in-place may produce fumes. The process typically rejuvenates only the top one inch of the pavement. This material can only be used as a base material. It should not be used as the wearing surface on a airfield due to the possibly of raveling and FOD problems. Usage: Hot In-Place Recycling can be used on pavements displaying advanced surface distress and oxidation. But, since the process rehabilitates less than the top 4 inches, it is important that the structure and base of the pavement be in good condition. Traditionally, HIR has only been done for less than 2 inches. New technology has very recently been developed for deeper recycling. Furthermore, it is important to understand the root causes of the pavement distress since this process addresses surface issues and will not solve more serious pavement structural, base or drainage issues. HIR has been successful on several airports in North America, including Thompson Field Airport in Florida, Texarkana in Texas and Prince George Airport in British Columbia. 4.1.8 Cold In-Place Recycling Cold In-Place Recycling (CIR) is nearly complete reconstruction of an asphalt pavement experiencing severe distresses including transverse cracking, potholes, and other surface irregularities. The process involves removal, crushing, and rehabilitation of the existing pavement materials into a new pavement structure. The first step is testing samples taken from the pavement to be recycled. A design is then performed to determine the formulation of the emulsions and other materials required for recycling process. The next step is to determine a rolling pattern that will achieve target densities. It may be necessary to field test the rolling procedure to ensure proper compaction. After the mix design and rolling patterns are

48
determined, the construction process can proceed. A cold recycle train involves several pieces of equipment each performing a specialized task. The cold recycling process consists of:
• Milling the existing pavement (it is recommended that at least 5 to 10 percent of the pavement thickness remain after milling to provide a small amount of pavement to support the equipment during the construction process.
• Next, the material is crushed and screened. • Depending on the mix design, virgin aggregates or additional recycled asphalt pavement
may be required. • The aggregates, emulsion and other additives are combined and thoroughly mixed in the
pug mill. • This material is then placed by a laydown machine and quickly compacted using the
predetermined rolling pattern. • The final step is to cover the cold in-place recycled material with a surface course within
three to five days of placing the original material. Cold in-place recycled material has a higher void percentage than a standard mix and must be sealed with a wearing course. Advantages: CIR is the ideal treatment for pavements experiencing severe surface distresses. It is a quick method for rehabilitating distressed pavement surfaces. Using materials in-place minimizes hauling and use of virgin materials. CIR can use reclaimed asphalt pavement (RAP) milled from other pavements. Drainage and crowns are re-established, and cracks are closed and filled. Flexibility is restored by chemically rejuvenating the aged and brittle pavement. Surface characteristics such as skid resistance are improved, and deformations are leveled. The process is usually less expensive and/or longer lasting than other corrective treatments. Disadvantages: CIR does not correct base problems, and the pavement must be adequately strong to support the equipment. Usage: Cold in-place recycling (CIR) is the ideal solution for severely distressed pavements with potholes, cracking, shoving, ruts, and/or oxidation. Recycling candidates are normally 15 to 20 years old. The pavements need to have a structurally sound base as this process does not correct base failures. The pavements should be sufficiently thick (five to six inches) to leave at least one inch of pavement to support the equipment. The process has had some success on U.S. airports.11 Figure 4-3 shows CIR on the Maple Lake Airport in Minnesota.
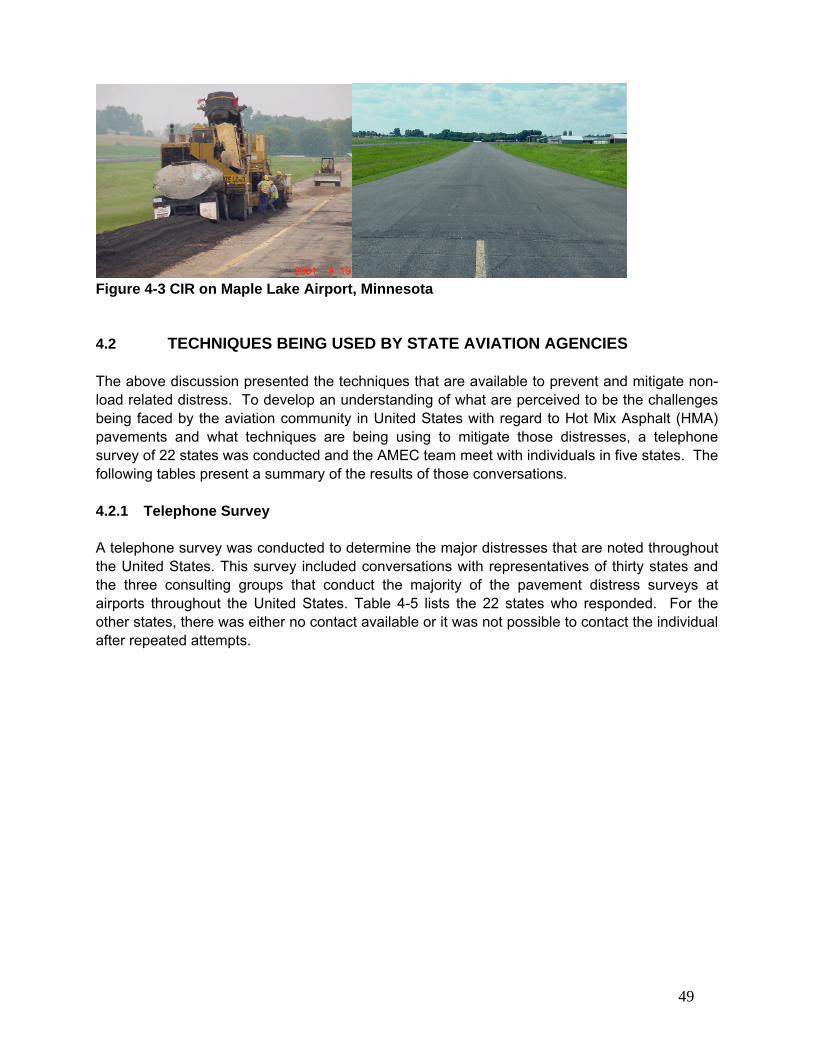
49
Figure 4-3 CIR on Maple Lake Airport, Minnesota 4.2 TECHNIQUES BEING USED BY STATE AVIATION AGENCIES The above discussion presented the techniques that are available to prevent and mitigate non-load related distress. To develop an understanding of what are perceived to be the challenges being faced by the aviation community in United States with regard to Hot Mix Asphalt (HMA) pavements and what techniques are being using to mitigate those distresses, a telephone survey of 22 states was conducted and the AMEC team meet with individuals in five states. The following tables present a summary of the results of those conversations. 4.2.1 Telephone Survey A telephone survey was conducted to determine the major distresses that are noted throughout the United States. This survey included conversations with representatives of thirty states and the three consulting groups that conduct the majority of the pavement distress surveys at airports throughout the United States. Table 4-5 lists the 22 states who responded. For the other states, there was either no contact available or it was not possible to contact the individual after repeated attempts.

50
Table 4-5 Summary of Preventive Maintenance Techniques Being Used by State Aviation Agencies
State Primary Distresses Observed Maintenance Methods Being Used
Alabama • Block cracking • Reflection cracking from trying to
overlay something that is cracked
• Cracking sealing • Spray-applied seal coats • Thin overlays
Arizona • Block cracking • Weathering/oxidation
• Crack sealing • Spray-applied seal coats • Slurry seals
Arkansas • Longitudinal and transverse cracking followed by weathering
• Coal tar and rejuvenator spray-applied seals
• Microsurfacing in some areas Colorado • Joint cracking
• Transverse cracking – thermal and geotechnical
• Extensive block cracking that progresses to alligator cracking
• Use GSB to seal everything on a 3- to 5- year cycle
• Use GSB as soon as possible after construction to seal surface
Florida • Shrinkage cracks and raveling • Block cracking – many FL
airfields are WW II vintage
• Gripflex, Polycon and whitetopping
Georgia • Block cracking, longitudinal and transverse cracking
• Seal cracks as soon as they develop
• Thin overlays (1 ½ to 2 inch) Idaho • Longitudinal and transverse
cracking. Once the crack opens up frost gets in and it further deteriorates
• Crack seal • Surface treatment – slurry seal
& rejuvenator on 6 yr cycle • Thin overlay
Illinois • Weathering with thermal cracking and some block cracking
• GSB seal coats • Crack sealing
Iowa • Not big problem – most airfields are PCC
• Crack sealing with rubberized sealant
Michigan • Transverse and longitudinal cracking
• Crack sealing • Experimenting with milling
cracks 6 to 12 inch wide and filling with HMA
Missouri • Shrinkage cracks and raveling • Rejuvenators • Avoid coal tar seals due to
chicken wire cracking Montana • Block cracking and reflection
cracking in thin overlays • Fog seal on 8 to 10 yr cycle • Cracking sealing by Highway
Dept New Mexico • Block cracking – longitudinal
joints opening up • Coal tar seal • Crack sealing
New York • Transverse and longitudinal cracking
• Decisions are made at local level
51
State Primary Distress Observed Maintenance Methods Being
Used Oregon • Weathering/raveling with some
block cracking • Spray-applied seals on 7 yr
cycle • Thin HMA overlays on 12 to 15
yr cycle Pennsylvania • Climate change is a big problem
• Longitudinal and transverse cracking, followed by alligator cracking along the cracks
• Crack sealing • Rejuvenators being evaluated
South Carolina • Opening up of longitudinal joints • “Chicken wire” cracking from coal
tar seals
• Crack sealing with rubberized asphalt
• Experimenting with PDC and rejuviseal
South Dakota • Longitudinal cracking • Transverse thermal cracking
• Three yr crack seal program • Using coal tar rejuvenators on
periodic basis Utah • Weathering, block cracking and
raveling • GSB 88 on a 3 yr cycle
(Northern Utah – 4 yrs, Southern Utah – 2 yrs)
Vermont • Longitudinal and transverse cracking
• Joints open up in winter causing frost heaves
• Regular crack sealing program • Tried fog sealing on one airfield
& have not done it since
Wyoming • Cracks and problems associated with weathering
• Crack seals • Fog seals with SS-1h
In summary, the states see lane joint cracking and block cracking as the principle forms of distress. Lane joint cracking and its prevention is addressed in AAPTP Project 04-05 Improved Performance of Longitudinal Joints on Asphalt Airfields. As discussed in Chapter 2, non-load associated distress is a major problem. It appears from this survey that the common preventative maintenance tools being used to address this type of distress are crack sealing, some type of spray applied seal, slurry or Microsurfacing, or the placement of thin overlays. 4.2.2 Field Visits In addition to the telephone surveys a limited number of states and aviation authorities were visited to further define what techniques the states are using. During these visits the objective was to answer the following questions:
• What type of distresses does your agency experience? • What processes are you using to address non-load associated distress? • What materials are considered for use to address these problems? • How do you program your maintenance work? Do you use your pavement management
system to program maintenance? Georgia, South Dakota, Oregon, Michigan, and the Massachusetts Port Authority were visited. The following table presents a summary of those interviews:
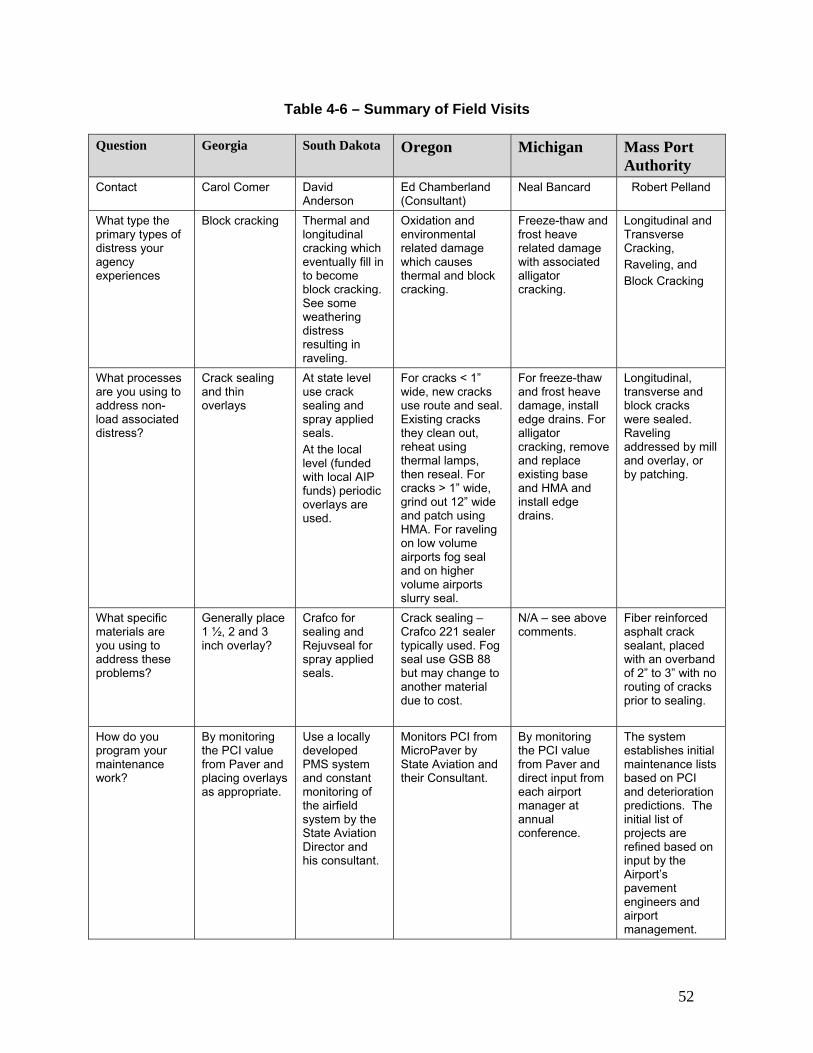
52
Table 4-6 – Summary of Field Visits
Question Georgia South Dakota Oregon Michigan Mass Port
Authority Contact Carol Comer David
Anderson Ed Chamberland (Consultant)
Neal Bancard Robert Pelland
What type the primary types of distress your agency experiences
Block cracking Thermal and longitudinal cracking which eventually fill in to become block cracking. See some weathering distress resulting in raveling.
Oxidation and environmental related damage which causes thermal and block cracking.
Freeze-thaw and frost heave related damage with associated alligator cracking.
Longitudinal and Transverse Cracking, Raveling, and Block Cracking
What processes are you using to address non-load associated distress?
Crack sealing and thin overlays
At state level use crack sealing and spray applied seals. At the local level (funded with local AIP funds) periodic overlays are used.
For cracks < 1” wide, new cracks use route and seal. Existing cracks they clean out, reheat using thermal lamps, then reseal. For cracks > 1” wide, grind out 12” wide and patch using HMA. For raveling on low volume airports fog seal and on higher volume airports slurry seal.
For freeze-thaw and frost heave damage, install edge drains. For alligator cracking, remove and replace existing base and HMA and install edge drains.
Longitudinal, transverse and block cracks were sealed. Raveling addressed by mill and overlay, or by patching.
What specific materials are you using to address these problems?
Generally place 1 ½, 2 and 3 inch overlay?
Crafco for sealing and Rejuvseal for spray applied seals.
Crack sealing – Crafco 221 sealer typically used. Fog seal use GSB 88 but may change to another material due to cost.
N/A – see above comments.
Fiber reinforced asphalt crack sealant, placed with an overband of 2” to 3” with no routing of cracks prior to sealing.
How do you program your maintenance work?
By monitoring the PCI value from Paver and placing overlays as appropriate.
Use a locally developed PMS system and constant monitoring of the airfield system by the State Aviation Director and his consultant.
Monitors PCI from MicroPaver by State Aviation and their Consultant.
By monitoring the PCI value from Paver and direct input from each airport manager at annual conference.
The system establishes initial maintenance lists based on PCI and deterioration predictions. The initial list of projects are refined based on input by the Airport’s pavement engineers and airport management.

53
Question Georgia South
Dakota Oregon Michigan Mass Port
Authority Do you use a pavement management system (PMS) to manage your pavement system?
Yes – Paver Yes – a locally developed system
Yes - MicroPAVER Yes - MicroPAVER
Yes - Proprietary Software (Airpave) utilizes visual and FWD data provided by outside consultants on a periodic basis.
Based on the telephone surveys and discussions presented above, it was determined that the primary procedures being used are cracking sealing, the application of some of seal (generally a spay-applied seal or a slurry seal) or the use of think overlays (1 ½ to 2 inches thick). 4.2.3 Guidance on Appropriate Preventive or Mitigation Method to be Used The FAA in Advisory Circular AC 150/5380 Guidelines and Procedures for Maintenance of Airport Pavements12 which was issued on September 28, 2007 includes two tables that provide guidance for the maintenance and repair of flexible pavements. These two tables (Table 6-7 on Cracking and 6-8 on Disintegration) are duplicated below as Tables 4-3 and 4-4, respectively.
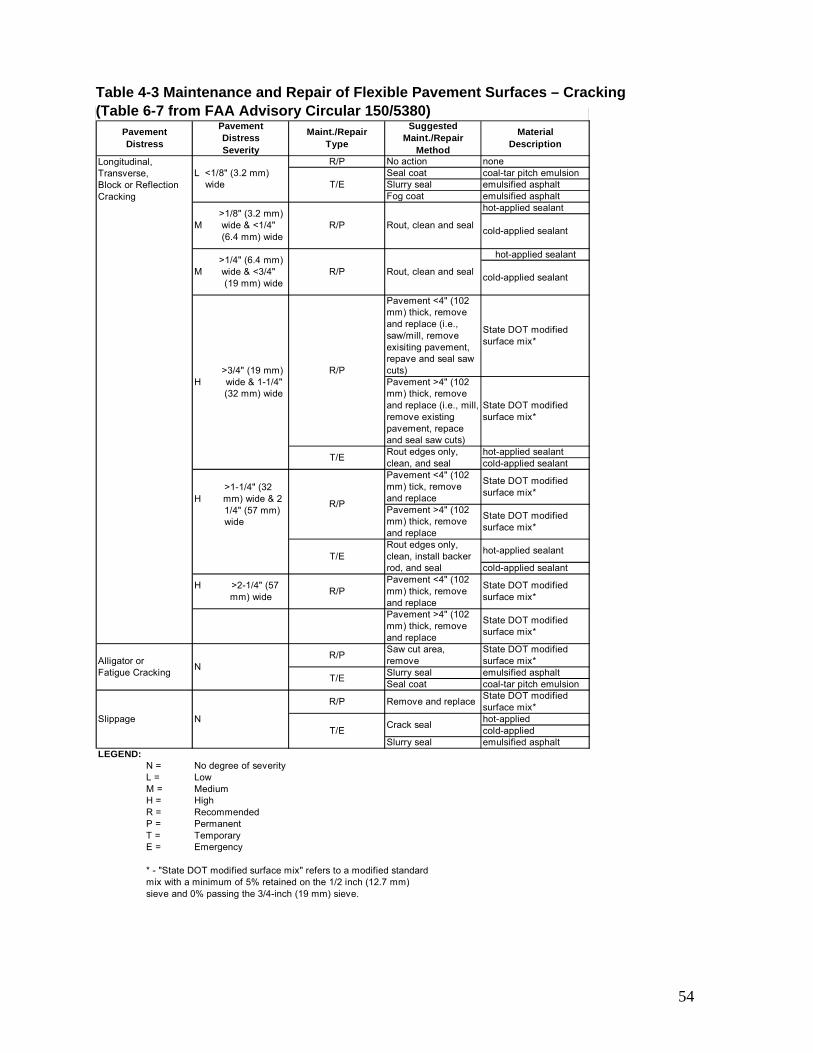
54
Table 4-3 Maintenance and Repair of Flexible Pavement Surfaces – Cracking (Table 6-7 from FAA Advisory Circular 150/5380)
LEGEND:N = No degree of severityL = LowM = MediumH = HighR = RecommendedP = PermanentT = TemporaryE = Emergency
PavementDistress
Pavement DistressSeverity
Maint./RepairType
SuggestedMaint./Repair
Method
MaterialDescription
none
T/ESeal coat coal-tar pitch emulsionSlurry seal emulsified asphaltFog coat emulsified asphalt
R/P No action
hot-applied sealant
cold-applied sealant
>1/4" (6.4 mm)M wide & <3/4" (19 mm) wide
R/P Rout, clean and seal
hot-applied sealant
cold-applied sealant
>1/8" (3.2 mm) M wide & <1/4" (6.4 mm) wide
R/P Rout, clean and seal
Pavement <4" (102mm) thick, removeand replace (i.e., saw/mill, remove exisiting pavement, repave and seal saw cuts)
State DOT modified surface mix*
Pavement >4" (102 mm) thick, remove and replace (i.e., mill, remove existing pavement, repace and seal saw cuts)
State DOT modifiedsurface mix*
Rout edges only, clean, and seal
hot-applied sealantcold-applied sealant
>1-1/4" (32H mm) wide & 2 1/4" (57 mm) wide
R/P
T/E
Pavement <4" (102 mm) tick, remove and replacePavement >4" (102mm) thick, remove and replaceRout edges only, clean, install backer rod, and seal
State DOT modified surface mix*
State DOT modified surface mix*
hot-applied sealant
cold-applied sealant
H >2-1/4" (57 mm) wide R/P
Pavement <4" (102mm) thick, remove and replace
State DOT modifiedsurface mix*
Pavement >4" (102mm) thick, removeand replace
State DOT modified surface mix*
Longitudinal, Transverse, Block or Reflection Cracking
Alligator or Fatigue Cracking N
R/P
L <1/8" (3.2 mm) wide
>3/4" (19 mm)H wide & 1-1/4" (32 mm) wide
R/P
T/E
R/P
T/E
State DOT modifiedsurface mix*
T/E Slurry sealSeal coat
emulsified asphaltcoal-tar pitch emulsion
Saw cut area, remove
* - "State DOT modified surface mix" refers to a modified standard mix with a minimum of 5% retained on the 1/2 inch (12.7 mm) sieve and 0% passing the 3/4-inch (19 mm) sieve.
Remove and replace State DOT modifiedsurface mix*
Crack seal
Slurry seal
hot-applied cold-applied emulsified asphalt
Slippage N
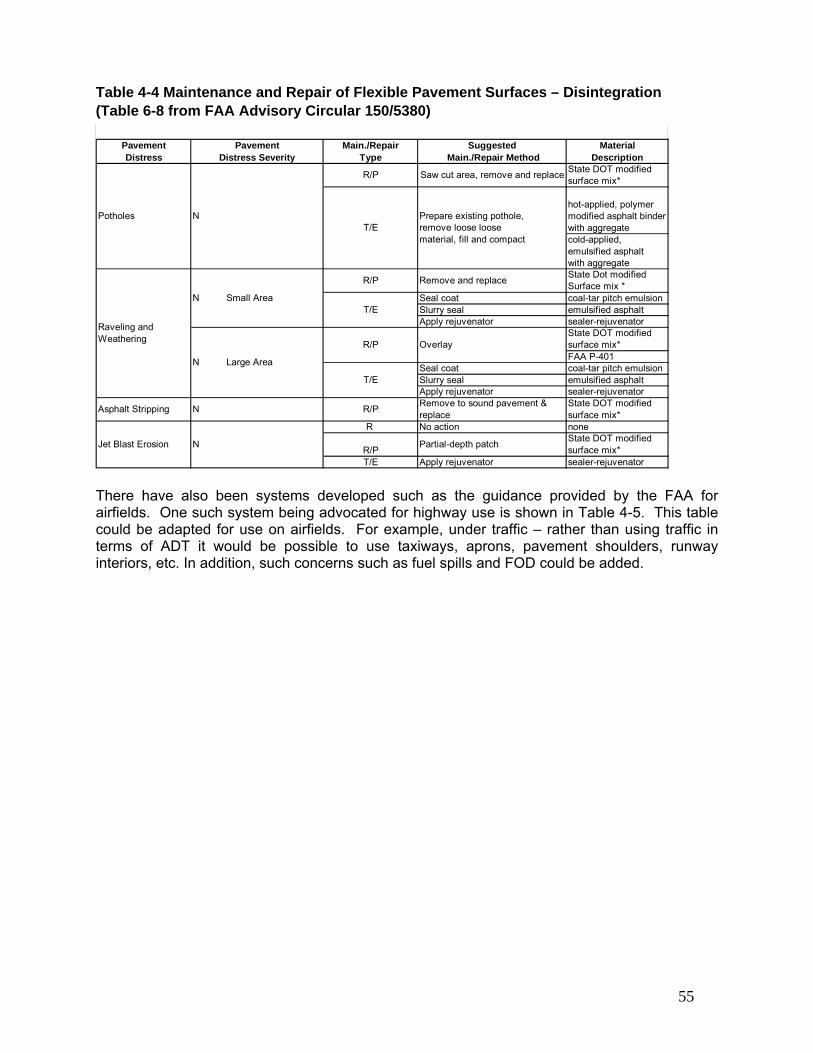
55
Table 4-4 Maintenance and Repair of Flexible Pavement Surfaces – Disintegration (Table 6-8 from FAA Advisory Circular 150/5380)
State DOT modified surface mix*
Jet Blast Erosion N
R No action none
R/P
Asphalt Stripping N
Apply rejuvenator sealer-rejuvenator
Raveling andWeathering
N Large Area
T/EApply rejuvenatorSlurry seal
Partial-depth patch State DOT modifiedsurface mix*
T/E
sealer-rejuvenator
sealer-rejuvenator
R/P Remove to sound pavement &replace
State DOT modifiedsurface mix*FAA P-401coal-tar pitch emulsionemulsified asphalt
R/P Overlay
Seal coat
N Small Area
R/P Remove and replace State Dot modified Surface mix *
T/ESeal coatSlurry sealApply rejuvenator
coal-tar pitch emulsionemulsified asphalt
R/P Saw cut area, remove and replace
hot-applied, polymer modified asphalt binder with aggregatecold-applied, emulsified asphalt with aggregate
State DOT modified surface mix*
T/EPrepare existing pothole, remove loose loose material, fill and compact
Pavement Distress
Pavement Distress Severity
Main./Repair Type
Suggested Main./Repair Method
Material Description
Potholes N
There have also been systems developed such as the guidance provided by the FAA for airfields. One such system being advocated for highway use is shown in Table 4-5. This table could be adapted for use on airfields. For example, under traffic – rather than using traffic in terms of ADT it would be possible to use taxiways, aprons, pavement shoulders, runway interiors, etc. In addition, such concerns such as fuel spills and FOD could be added.
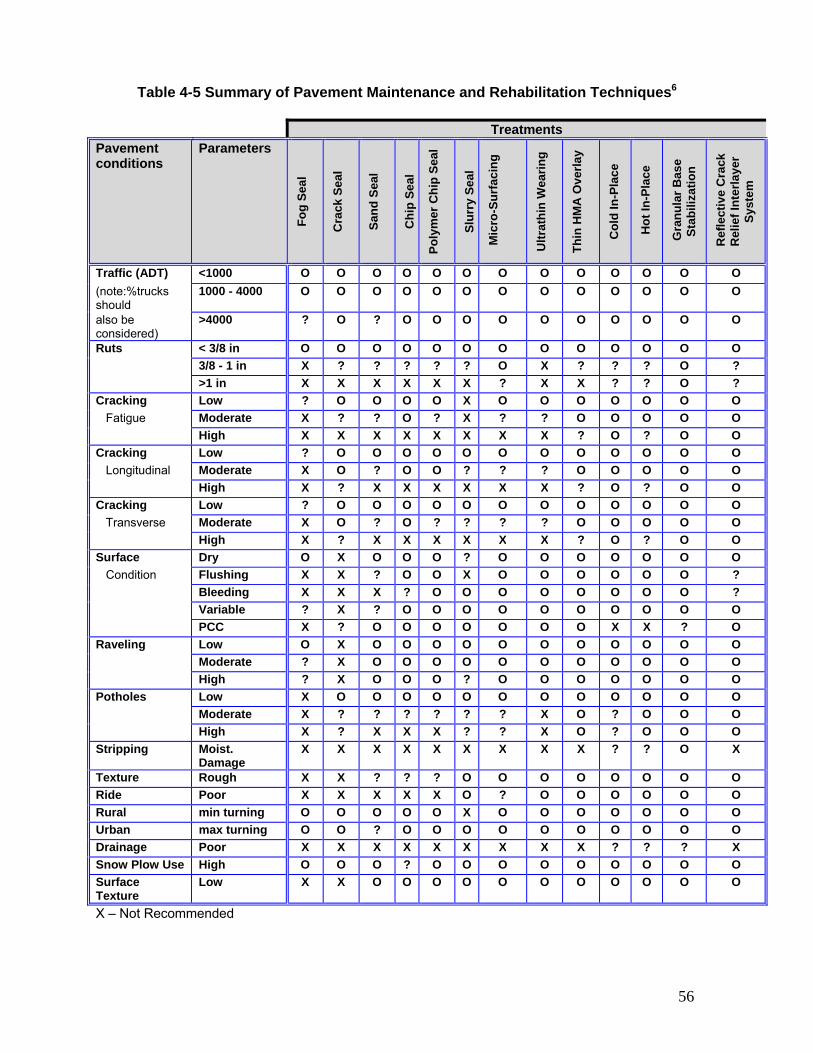
56
Table 4-5 Summary of Pavement Maintenance and Rehabilitation Techniques6
Treatments Pavement conditions
Parameters
Fog
Seal
Cra
ck S
eal
Sand
Sea
l
Chi
p Se
al
Poly
mer
Chi
p Se
al
Slur
ry S
eal
Mic
ro-S
urfa
cing
Ultr
athi
n W
earin
g
Thin
HM
A O
verla
y
Col
d In
-Pla
ce
Hot
In-P
lace
Gra
nula
r Bas
e St
abili
zatio
n
Ref
lect
ive
Cra
ck
Rel
ief I
nter
laye
r Sy
stem
Traffic (ADT) <1000 O O O O O O O O O O O O O(note:%trucks should
1000 - 4000 O O O O O O O O O O O O O
also be considered)
>4000 ? O ? O O O O O O O O O O
Ruts < 3/8 in O O O O O O O O O O O O O 3/8 - 1 in X ? ? ? ? ? O X ? ? ? O ? >1 in X X X X X X ? X X ? ? O ?
Cracking Low ? O O O O X O O O O O O O Fatigue Moderate X ? ? O ? X ? ? O O O O O
High X X X X X X X X ? O ? O OCracking Low ? O O O O O O O O O O O O Longitudinal Moderate X O ? O O ? ? ? O O O O O
High X ? X X X X X X ? O ? O OCracking Low ? O O O O O O O O O O O O Transverse Moderate X O ? O ? ? ? ? O O O O O
High X ? X X X X X X ? O ? O OSurface Dry O X O O O ? O O O O O O O Condition Flushing X X ? O O X O O O O O O ?
Bleeding X X X ? O O O O O O O O ? Variable ? X ? O O O O O O O O O O PCC X ? O O O O O O O X X ? O
Raveling Low O X O O O O O O O O O O O Moderate ? X O O O O O O O O O O O High ? X O O O ? O O O O O O O
Potholes Low X O O O O O O O O O O O O Moderate X ? ? ? ? ? ? X O ? O O O High X ? X X X ? ? X O ? O O O
Stripping Moist. Damage
X X X X X X X X X ? ? O X
Texture Rough X X ? ? ? O O O O O O O ORide Poor X X X X X O ? O O O O O ORural min turning O O O O O X O O O O O O OUrban max turning O O ? O O O O O O O O O ODrainage Poor X X X X X X X X X ? ? ? XSnow Plow Use High O O O ? O O O O O O O O OSurface Texture
Low X X O O O O O O O O O O O
X – Not Recommended
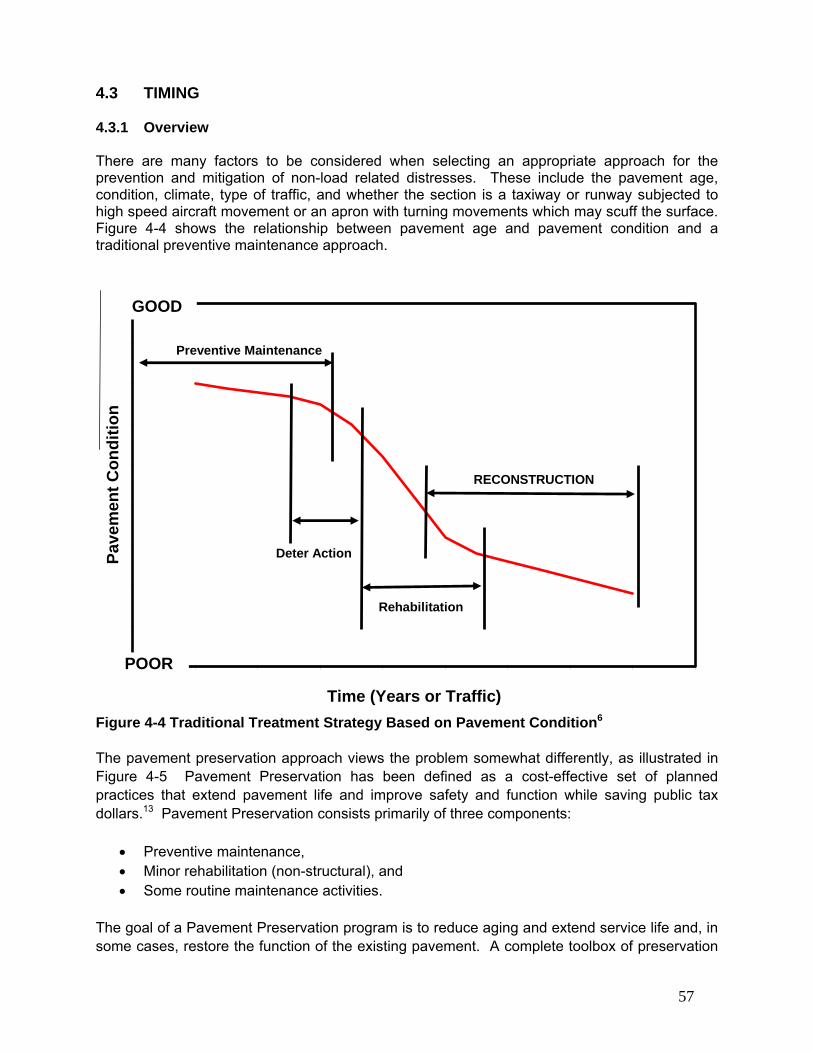
57
4.3 TIMING 4.3.1 Overview There are many factors to be considered when selecting an appropriate approach for the prevention and mitigation of non-load related distresses. These include the pavement age, condition, climate, type of traffic, and whether the section is a taxiway or runway subjected to high speed aircraft movement or an apron with turning movements which may scuff the surface. Figure 4-4 shows the relationship between pavement age and pavement condition and a traditional preventive maintenance approach.
0.5
1
1.5
2
2.5
3
3.5
4
4.5
5
0 2 4 6 8 10 12 14 16 18
Time (Years or Traffic)
Pave
men
t Con
ditio
n
Preventive Maintenance
Deter Action
Rehabilitation
RECONSTRUCTION
GOOD
POOR
Figure 4-4 Traditional Treatment Strategy Based on Pavement Condition6
The pavement preservation approach views the problem somewhat differently, as illustrated in Figure 4-5 Pavement Preservation has been defined as a cost-effective set of planned practices that extend pavement life and improve safety and function while saving public tax dollars.13 Pavement Preservation consists primarily of three components:
• Preventive maintenance, • Minor rehabilitation (non-structural), and • Some routine maintenance activities.
The goal of a Pavement Preservation program is to reduce aging and extend service life and, in some cases, restore the function of the existing pavement. A complete toolbox of preservation
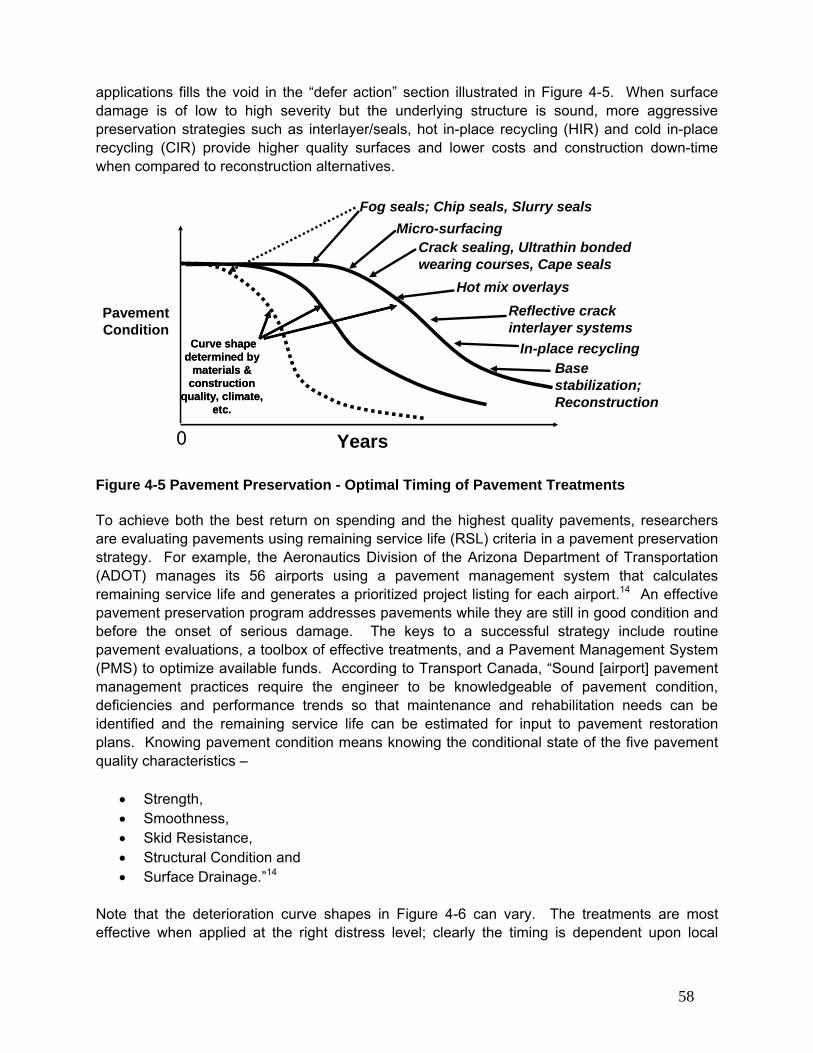
58
applications fills the void in the “defer action” section illustrated in Figure 4-5. When surface damage is of low to high severity but the underlying structure is sound, more aggressive preservation strategies such as interlayer/seals, hot in-place recycling (HIR) and cold in-place recycling (CIR) provide higher quality surfaces and lower costs and construction down-time when compared to reconstruction alternatives.
0 Years
Fog seals; Chip seals, Slurry seals
Crack sealing, Ultrathin bonded wearing courses, Cape seals
In-place recycling
Reflective crack interlayer systems
Micro-surfacing
Base stabilization; Reconstruction
Pavement Condition
Curve shape determined by
materials & construction
quality, climate, etc.
Curve shape determined by
materials & construction
quality, climate, etc.
Hot mix overlays
Figure 4-5 Pavement Preservation - Optimal Timing of Pavement Treatments
To achieve both the best return on spending and the highest quality pavements, researchers are evaluating pavements using remaining service life (RSL) criteria in a pavement preservation strategy. For example, the Aeronautics Division of the Arizona Department of Transportation (ADOT) manages its 56 airports using a pavement management system that calculates remaining service life and generates a prioritized project listing for each airport.14 An effective pavement preservation program addresses pavements while they are still in good condition and before the onset of serious damage. The keys to a successful strategy include routine pavement evaluations, a toolbox of effective treatments, and a Pavement Management System (PMS) to optimize available funds. According to Transport Canada, “Sound [airport] pavement management practices require the engineer to be knowledgeable of pavement condition, deficiencies and performance trends so that maintenance and rehabilitation needs can be identified and the remaining service life can be estimated for input to pavement restoration plans. Knowing pavement condition means knowing the conditional state of the five pavement quality characteristics –
• Strength, • Smoothness, • Skid Resistance, • Structural Condition and • Surface Drainage.”14
Note that the deterioration curve shapes in Figure 4-6 can vary. The treatments are most effective when applied at the right distress level; clearly the timing is dependent upon local
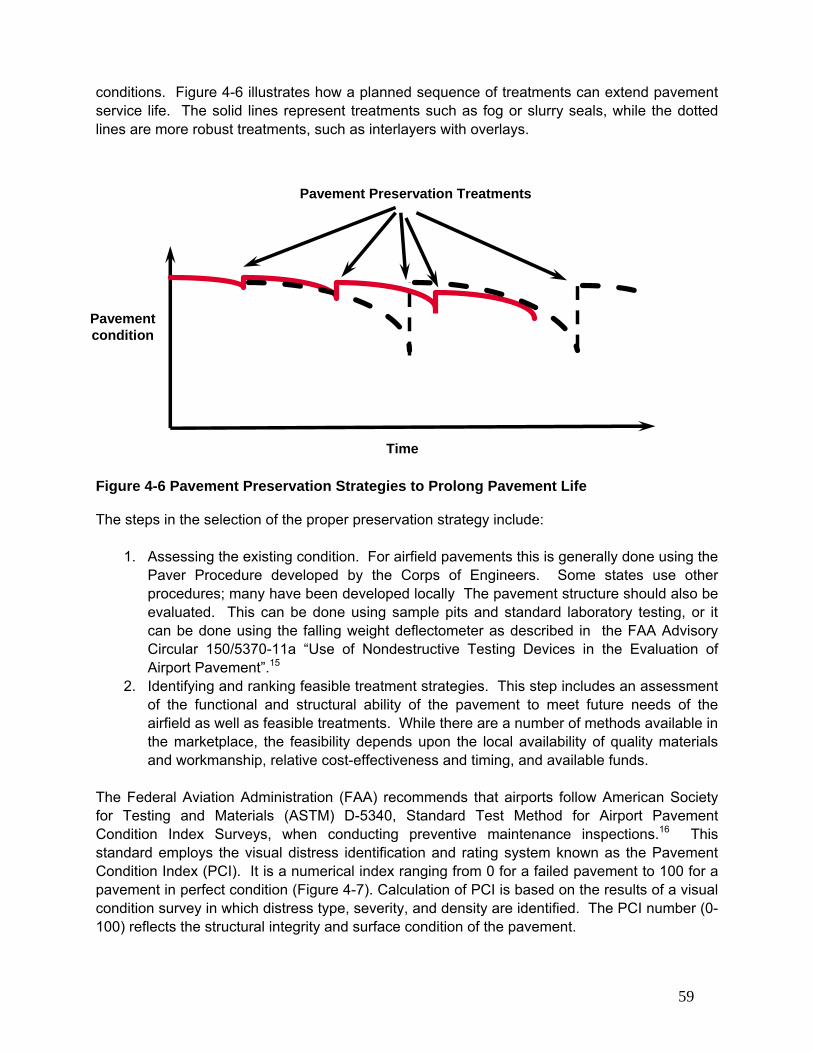
59
conditions. Figure 4-6 illustrates how a planned sequence of treatments can extend pavement service life. The solid lines represent treatments such as fog or slurry seals, while the dotted lines are more robust treatments, such as interlayers with overlays.
Figure 4-6 Pavement Preservation Strategies to Prolong Pavement Life The steps in the selection of the proper preservation strategy include:
1. Assessing the existing condition. For airfield pavements this is generally done using the Paver Procedure developed by the Corps of Engineers. Some states use other procedures; many have been developed locally The pavement structure should also be evaluated. This can be done using sample pits and standard laboratory testing, or it can be done using the falling weight deflectometer as described in the FAA Advisory Circular 150/5370-11a “Use of Nondestructive Testing Devices in the Evaluation of Airport Pavement”.15
2. Identifying and ranking feasible treatment strategies. This step includes an assessment of the functional and structural ability of the pavement to meet future needs of the airfield as well as feasible treatments. While there are a number of methods available in the marketplace, the feasibility depends upon the local availability of quality materials and workmanship, relative cost-effectiveness and timing, and available funds.
The Federal Aviation Administration (FAA) recommends that airports follow American Society for Testing and Materials (ASTM) D-5340, Standard Test Method for Airport Pavement Condition Index Surveys, when conducting preventive maintenance inspections.16 This standard employs the visual distress identification and rating system known as the Pavement Condition Index (PCI). It is a numerical index ranging from 0 for a failed pavement to 100 for a pavement in perfect condition (Figure 4-7). Calculation of PCI is based on the results of a visual condition survey in which distress type, severity, and density are identified. The PCI number (0-100) reflects the structural integrity and surface condition of the pavement.
Pavementcondition
Time
Pavement Preservation Treatments
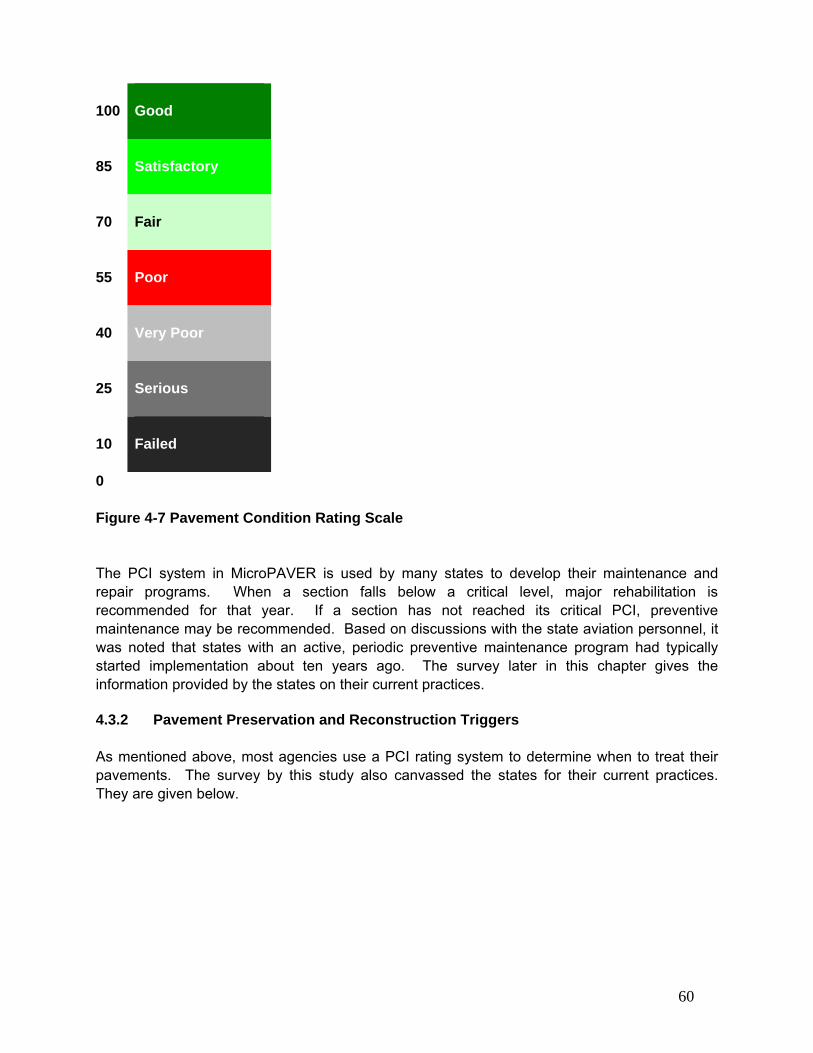
60
100 Good
85 Satisfactory
70 Fair
55 Poor
40 Very Poor
25 Serious
10 Failed
0 Figure 4-7 Pavement Condition Rating Scale The PCI system in MicroPAVER is used by many states to develop their maintenance and repair programs. When a section falls below a critical level, major rehabilitation is recommended for that year. If a section has not reached its critical PCI, preventive maintenance may be recommended. Based on discussions with the state aviation personnel, it was noted that states with an active, periodic preventive maintenance program had typically started implementation about ten years ago. The survey later in this chapter gives the information provided by the states on their current practices. 4.3.2 Pavement Preservation and Reconstruction Triggers As mentioned above, most agencies use a PCI rating system to determine when to treat their pavements. The survey by this study also canvassed the states for their current practices. They are given below.
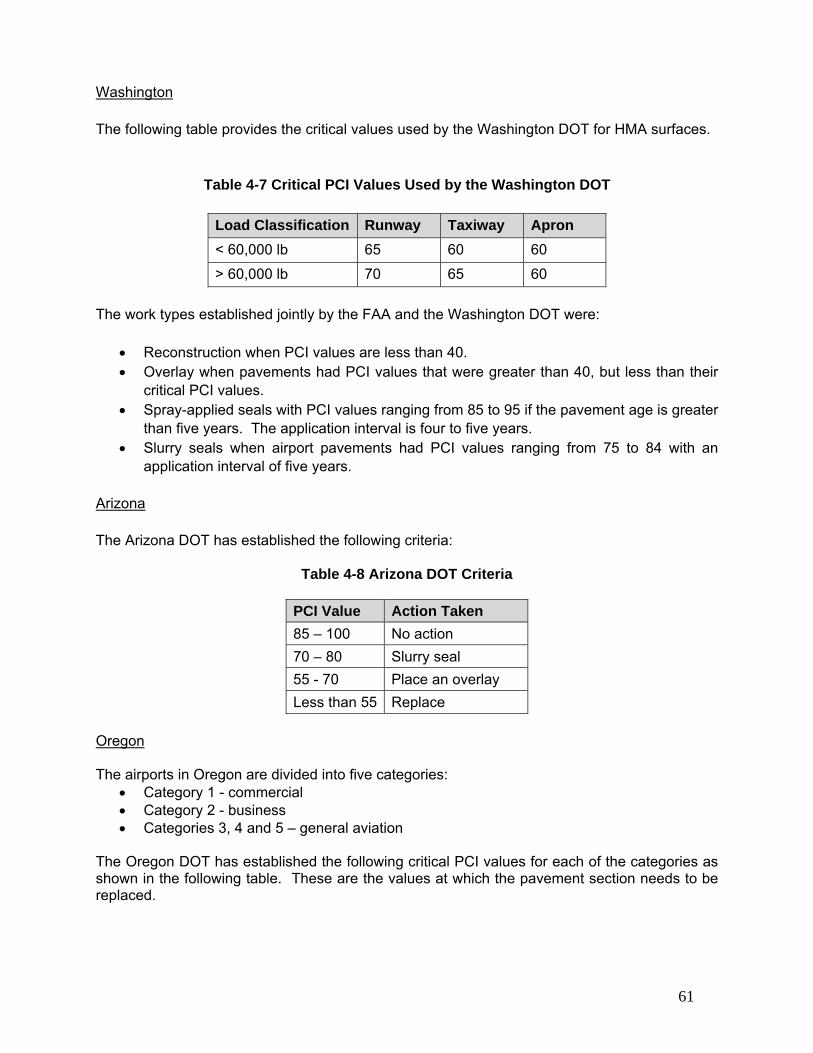
61
Washington The following table provides the critical values used by the Washington DOT for HMA surfaces.
Table 4-7 Critical PCI Values Used by the Washington DOT
Load Classification Runway Taxiway Apron < 60,000 lb 65 60 60
> 60,000 lb 70 65 60 The work types established jointly by the FAA and the Washington DOT were:
• Reconstruction when PCI values are less than 40. • Overlay when pavements had PCI values that were greater than 40, but less than their
critical PCI values. • Spray-applied seals with PCI values ranging from 85 to 95 if the pavement age is greater
than five years. The application interval is four to five years. • Slurry seals when airport pavements had PCI values ranging from 75 to 84 with an
application interval of five years. Arizona
The Arizona DOT has established the following criteria:
Table 4-8 Arizona DOT Criteria
PCI Value Action Taken 85 – 100 No action 70 – 80 Slurry seal 55 - 70 Place an overlay Less than 55 Replace
Oregon The airports in Oregon are divided into five categories:
• Category 1 - commercial • Category 2 - business • Categories 3, 4 and 5 – general aviation
The Oregon DOT has established the following critical PCI values for each of the categories as shown in the following table. These are the values at which the pavement section needs to be replaced.
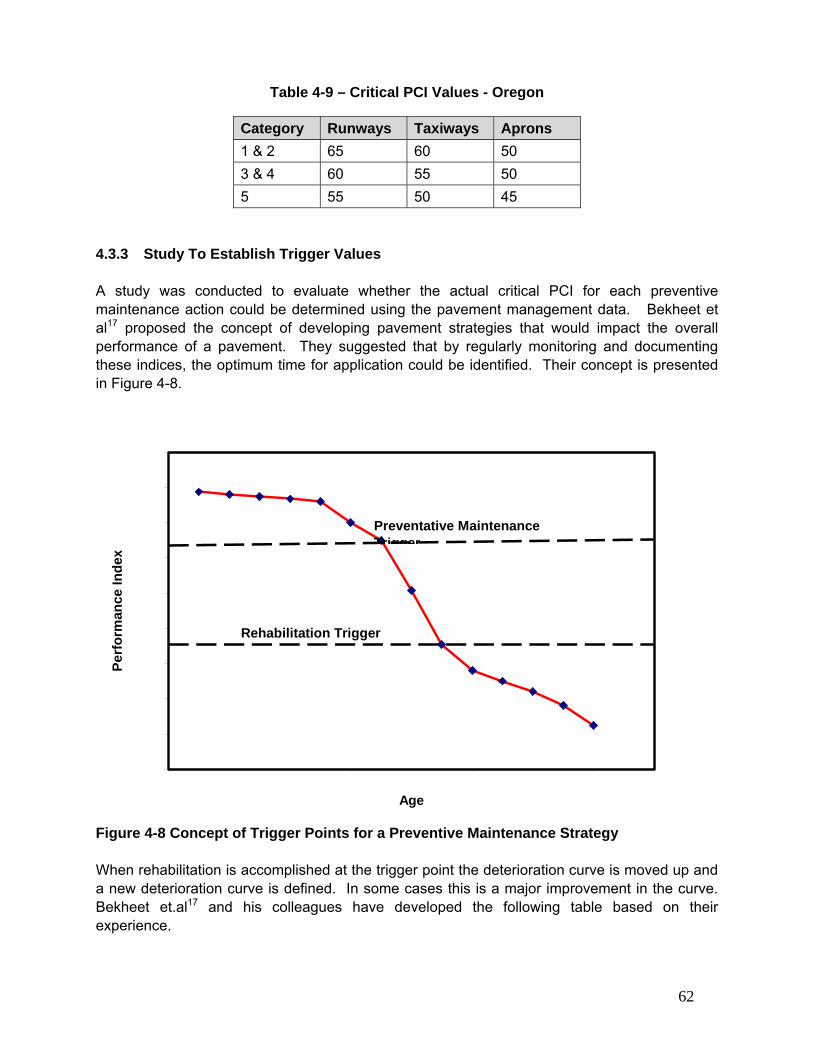
62
Table 4-9 – Critical PCI Values - Oregon
Category Runways Taxiways Aprons 1 & 2 65 60 50 3 & 4 60 55 50 5 55 50 45
4.3.3 Study To Establish Trigger Values A study was conducted to evaluate whether the actual critical PCI for each preventive maintenance action could be determined using the pavement management data. Bekheet et al17 proposed the concept of developing pavement strategies that would impact the overall performance of a pavement. They suggested that by regularly monitoring and documenting these indices, the optimum time for application could be identified. Their concept is presented in Figure 4-8.
84
86
88
90
92
94
96
98
100
102
0 2 4 6 8 10 12 14 16
Age
Perf
orm
ance
Inde
x
Rehabilitation Trigger
Preventative Maintenance Trigger
Figure 4-8 Concept of Trigger Points for a Preventive Maintenance Strategy When rehabilitation is accomplished at the trigger point the deterioration curve is moved up and a new deterioration curve is defined. In some cases this is a major improvement in the curve. Bekheet et.al17 and his colleagues have developed the following table based on their experience.
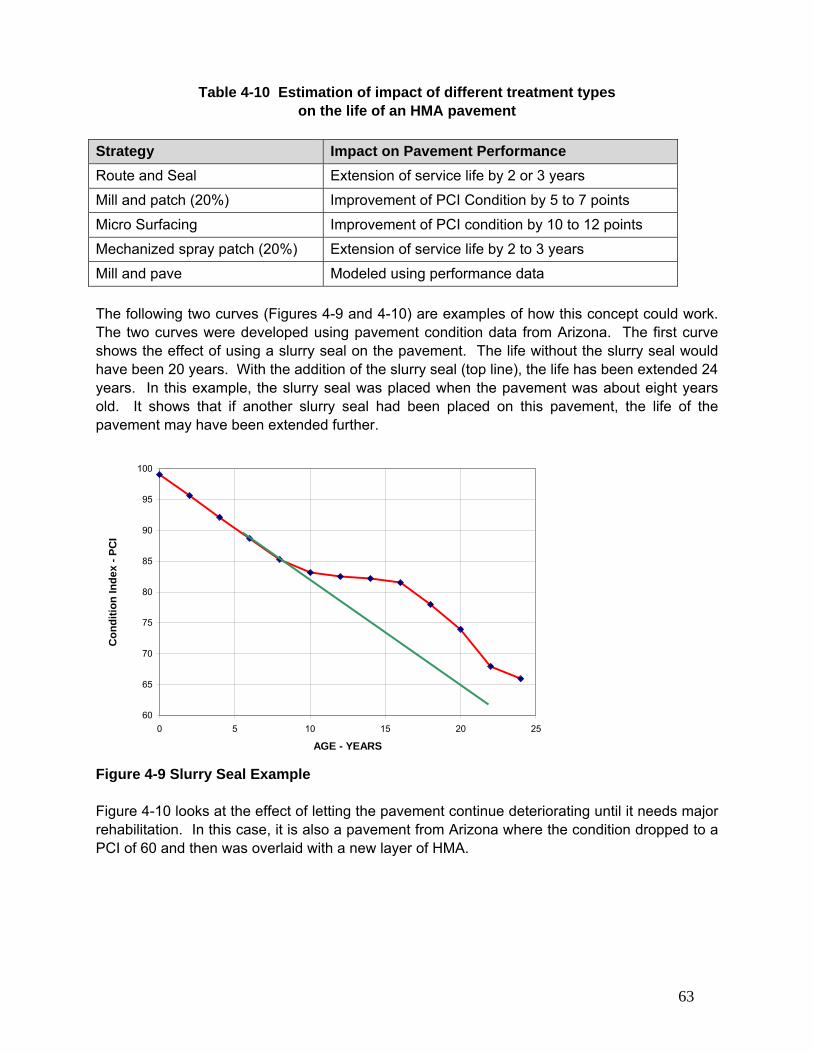
63
Table 4-10 Estimation of impact of different treatment types on the life of an HMA pavement
Strategy Impact on Pavement Performance Route and Seal Extension of service life by 2 or 3 years
Mill and patch (20%) Improvement of PCI Condition by 5 to 7 points
Micro Surfacing Improvement of PCI condition by 10 to 12 points
Mechanized spray patch (20%) Extension of service life by 2 to 3 years
Mill and pave Modeled using performance data The following two curves (Figures 4-9 and 4-10) are examples of how this concept could work. The two curves were developed using pavement condition data from Arizona. The first curve shows the effect of using a slurry seal on the pavement. The life without the slurry seal would have been 20 years. With the addition of the slurry seal (top line), the life has been extended 24 years. In this example, the slurry seal was placed when the pavement was about eight years old. It shows that if another slurry seal had been placed on this pavement, the life of the pavement may have been extended further.
60
65
70
75
80
85
90
95
100
0 5 10 15 20 25
AGE - YEARS
Con
ditio
n In
dex
- PC
I
Figure 4-9 Slurry Seal Example Figure 4-10 looks at the effect of letting the pavement continue deteriorating until it needs major rehabilitation. In this case, it is also a pavement from Arizona where the condition dropped to a PCI of 60 and then was overlaid with a new layer of HMA.
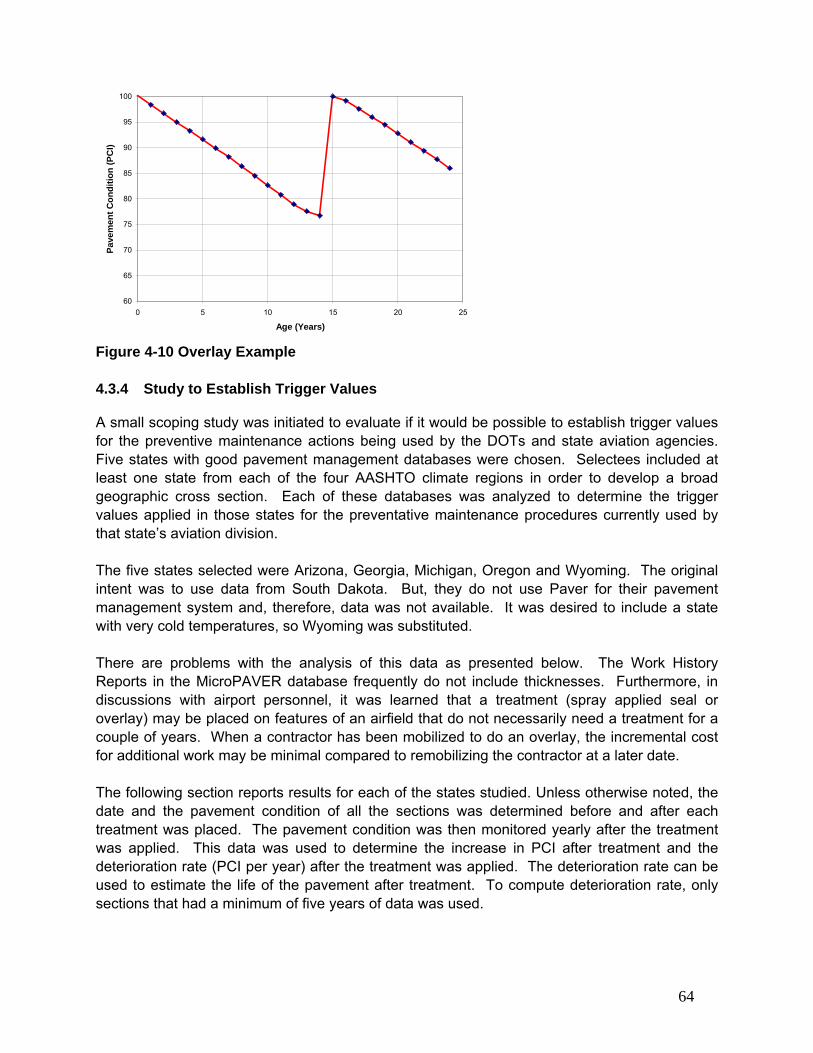
64
60
65
70
75
80
85
90
95
100
0 5 10 15 20 25
Age (Years)
Pave
men
t Con
ditio
n (P
CI)
Figure 4-10 Overlay Example 4.3.4 Study to Establish Trigger Values A small scoping study was initiated to evaluate if it would be possible to establish trigger values for the preventive maintenance actions being used by the DOTs and state aviation agencies. Five states with good pavement management databases were chosen. Selectees included at least one state from each of the four AASHTO climate regions in order to develop a broad geographic cross section. Each of these databases was analyzed to determine the trigger values applied in those states for the preventative maintenance procedures currently used by that state’s aviation division. The five states selected were Arizona, Georgia, Michigan, Oregon and Wyoming. The original intent was to use data from South Dakota. But, they do not use Paver for their pavement management system and, therefore, data was not available. It was desired to include a state with very cold temperatures, so Wyoming was substituted. There are problems with the analysis of this data as presented below. The Work History Reports in the MicroPAVER database frequently do not include thicknesses. Furthermore, in discussions with airport personnel, it was learned that a treatment (spray applied seal or overlay) may be placed on features of an airfield that do not necessarily need a treatment for a couple of years. When a contractor has been mobilized to do an overlay, the incremental cost for additional work may be minimal compared to remobilizing the contractor at a later date. The following section reports results for each of the states studied. Unless otherwise noted, the date and the pavement condition of all the sections was determined before and after each treatment was placed. The pavement condition was then monitored yearly after the treatment was applied. This data was used to determine the increase in PCI after treatment and the deterioration rate (PCI per year) after the treatment was applied. The deterioration rate can be used to estimate the life of the pavement after treatment. To compute deterioration rate, only sections that had a minimum of five years of data was used.

65
Arizona DOT The Arizona DOT has responsibility for 48 airports (not including Phoenix and Tucson). There are a total of 350 separate sections on these 48 airports. They use the Paver Pavement Management System to track the condition of their airfields and to prioritize their preventive maintenance program. They implemented Paver on a statewide basis in 2000. Figure 4-11 shows the average condition for their airfields from 2000 to 2007.
72
73
74
75
76
77
78
79
80
81
82
83
84
1999 2000 2001 2002 2003 2004 2005 2006 2007 2008
Year
Pave
men
t Con
ditio
n (P
CI)
Figure 4-11 Average PCI versus Age for Arizona The stated goal of the Arizona DOT is to maintain an overall average PCI for its system of 80. The Work History Report was reviewed to determine the type of treatments used by Arizona. It was found that since 1994, 103 sections had been treated; 54 sections received slurry seal, 25 sections received an overlay (generally one inch of a gap-graded asphalt rubber HMA mix) and 19 sections were treated with a spray-applied seal (Seal Master MTR). Table 4-11 shows results of the analysis for Arizona:

66
Table 4-11 Trigger Values for Different Treatments - Arizona
Treatment
Average PCI at time of
treatment
Range of average
PCI at time of
treatment
Average Increase in
PCI after treatment
Deterioration Rate (PCI per
year)
Estimated life of
Treatment
Spray applied seals 82 70 - 95 * * * Slurry Seals 80 66 - 90 7 2.4 2.9 Porous Friction Course** 73 61 - 89 24 1.1 21.8 Overlays 63 14 - 81 37 1.6 23.1 *Database included only three years of data, which was insufficient to conduct the analysis. ** There were only four data points for this analysis ADOT initiated paver inventories in 2000. As a comparison study, all of the pavement sections on which no work was recorded since 2000 were analyzed to determine the average deterioration rate for those pavements. The rate was 1.65 PCI per year. Georgia DOT Georgia DOT has responsibility for 94 general aviation airports. There are a total of 681 separate sections on these airports. They use the MicroPAVER Pavement Management System to track the condition of their airfields and use it to prioritize their preventive maintenance program. The State of Georgia began the use of MicroPAVER to track it’s the condition of its airfield pavements in 1998. Figure 4-14 shows the average condition for their airfields from 1998 to 2007.
72
74
76
78
80
82
84
1998 1999 2000 2001 2002 2003 2004 2005 2006 2007 2008
YEAR
PAVE
MEN
T C
ON
DIT
ION
(PC
I)
Figure 4-12 - Average PCI versus Age for Georgia
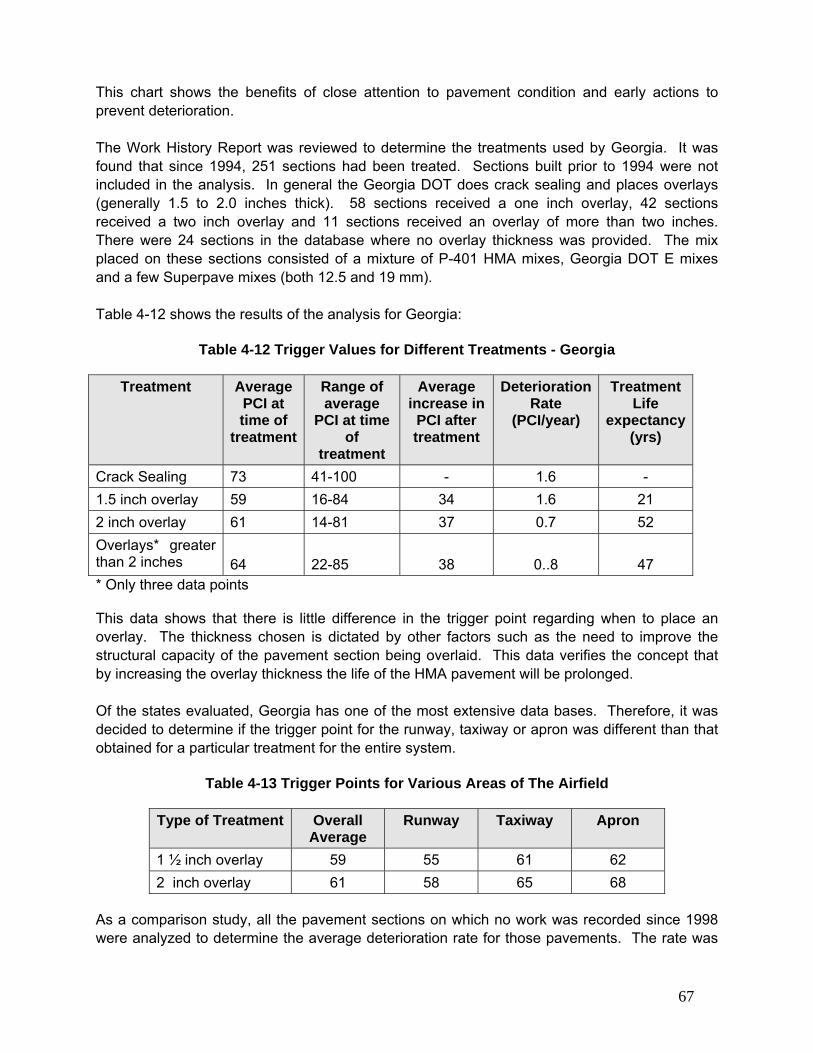
67
This chart shows the benefits of close attention to pavement condition and early actions to prevent deterioration. The Work History Report was reviewed to determine the treatments used by Georgia. It was found that since 1994, 251 sections had been treated. Sections built prior to 1994 were not included in the analysis. In general the Georgia DOT does crack sealing and places overlays (generally 1.5 to 2.0 inches thick). 58 sections received a one inch overlay, 42 sections received a two inch overlay and 11 sections received an overlay of more than two inches. There were 24 sections in the database where no overlay thickness was provided. The mix placed on these sections consisted of a mixture of P-401 HMA mixes, Georgia DOT E mixes and a few Superpave mixes (both 12.5 and 19 mm). Table 4-12 shows the results of the analysis for Georgia:
Table 4-12 Trigger Values for Different Treatments - Georgia
Treatment Average PCI at time of
treatment
Range of average
PCI at time of
treatment
Average increase in
PCI after treatment
Deterioration Rate
(PCI/year)
Treatment Life
expectancy (yrs)
Crack Sealing 73 41-100 - 1.6 - 1.5 inch overlay 59 16-84 34 1.6 21 2 inch overlay 61 14-81 37 0.7 52 Overlays* greater than 2 inches
64
22-85
38
0..8
47
* Only three data points This data shows that there is little difference in the trigger point regarding when to place an overlay. The thickness chosen is dictated by other factors such as the need to improve the structural capacity of the pavement section being overlaid. This data verifies the concept that by increasing the overlay thickness the life of the HMA pavement will be prolonged. Of the states evaluated, Georgia has one of the most extensive data bases. Therefore, it was decided to determine if the trigger point for the runway, taxiway or apron was different than that obtained for a particular treatment for the entire system.
Table 4-13 Trigger Points for Various Areas of The Airfield
Type of Treatment Overall Average
Runway Taxiway Apron
1 ½ inch overlay 59 55 61 62 2 inch overlay 61 58 65 68
As a comparison study, all the pavement sections on which no work was recorded since 1998 were analyzed to determine the average deterioration rate for those pavements. The rate was

68
1.54 PCI per year. To determine this average, 97 pavement sections were evaluated. The average for the runways is 1.65, for the taxiways it is 1.44 and for the aprons it is 1.79. Oregon Department of Aviation The Oregon Department of Aviation has responsibility for 97 airports. There are a total of 812 separate sections on these 97 airports. They use the MicroPAVER Pavement Management System to track the condition of their airfields and use it to prioritize their preventive maintenance program. They initiated the use of the MicroPAVER system in 2000. Figure 4-12 shows the average condition for their airfields from 2000 to 2006.
72
74
76
78
80
82
84
2000 2001 2002 2003 2004 2005 2006
Year
Con
ditio
n In
dex
(PC
I)
Figure 4-13 Average PCI versus Age for Oregon The Work History Report was reviewed to determine the treatments used by Oregon. It was found that since 1994, 254 sections had been treated. 82 sections had received a spray- applied seal, 130 sections received a slurry seal, and 42 sections received an overlay (generally one or two inches thick, but two sections had received a 3-inch overlay and one section had received a 3.5-inch overlay). Table 4-14 shows the results of the analysis for Oregon:
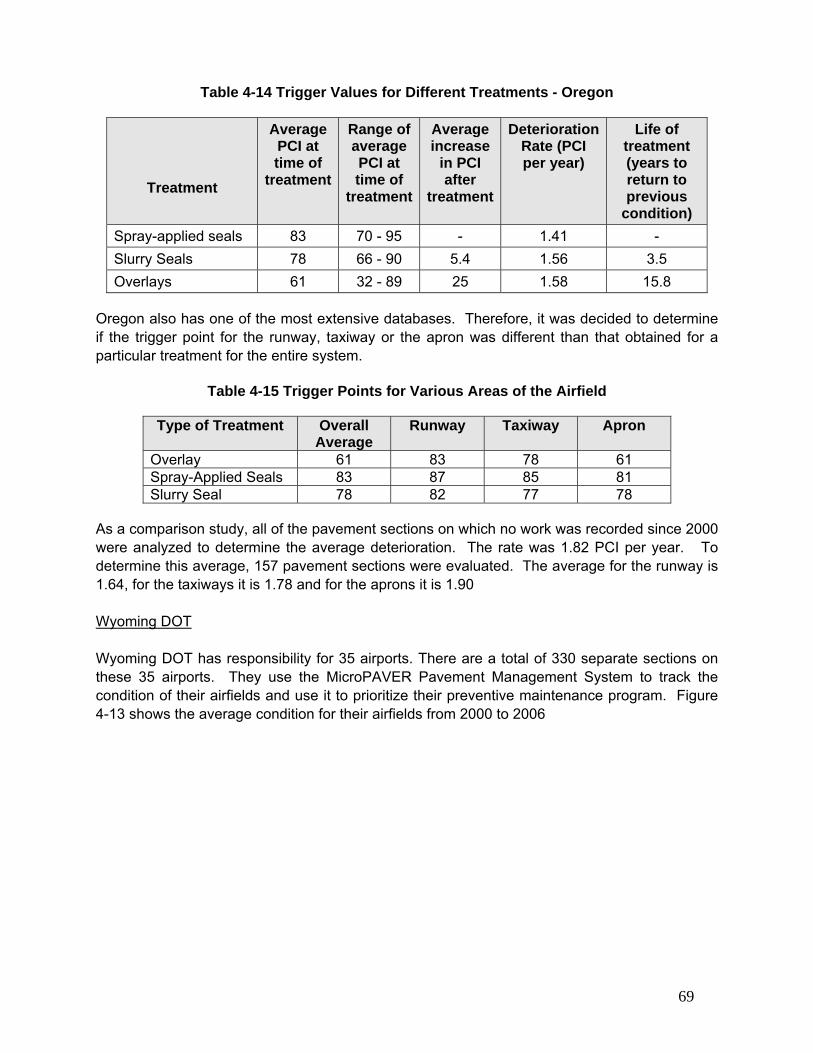
69
Table 4-14 Trigger Values for Different Treatments - Oregon
Treatment
Average PCI at time of
treatment
Range of average PCI at time of
treatment
Average increase
in PCI after
treatment
Deterioration Rate (PCI per year)
Life of treatment (years to return to previous
condition) Spray-applied seals 83 70 - 95 - 1.41 - Slurry Seals 78 66 - 90 5.4 1.56 3.5 Overlays 61 32 - 89 25 1.58 15.8
Oregon also has one of the most extensive databases. Therefore, it was decided to determine if the trigger point for the runway, taxiway or the apron was different than that obtained for a particular treatment for the entire system.
Table 4-15 Trigger Points for Various Areas of the Airfield
Type of Treatment Overall Average
Runway Taxiway Apron
Overlay 61 83 78 61 Spray-Applied Seals 83 87 85 81 Slurry Seal 78 82 77 78
As a comparison study, all of the pavement sections on which no work was recorded since 2000 were analyzed to determine the average deterioration. The rate was 1.82 PCI per year. To determine this average, 157 pavement sections were evaluated. The average for the runway is 1.64, for the taxiways it is 1.78 and for the aprons it is 1.90 Wyoming DOT Wyoming DOT has responsibility for 35 airports. There are a total of 330 separate sections on these 35 airports. They use the MicroPAVER Pavement Management System to track the condition of their airfields and use it to prioritize their preventive maintenance program. Figure 4-13 shows the average condition for their airfields from 2000 to 2006

70
72
74
76
78
80
82
84
1999 2000 2001 2002 2003 2004 2005 2006 2007 2008Year
PAVE
MEN
T C
ON
DIT
ION
(PC
I)
Figure 4-14 - Average PCI versus Age for Wyoming The work history report was reviewed to determine the treatments used by Wyoming. It was found that since 1994, 58 sections had been treated; 12 sections had received a spray applied seal, 14 sections received a complete reconstruction, and 32 sections received an overlay. Table 4-16 shows the results of the analysis for Wyoming:
Table 4.16 Trigger Values for Different Treatments - Wyoming
Treatment
Average PCI at time
of treatment
Range of average PCI
at time of treatment
Average increase
in PCI after
treatment
Deterioration Rate (PCI per year)
Life of treatment (years to return to previous
condition) Reconstruction 68 61-88 31 1.11 28 Overlay 63 48-84 34 1.36 25 Spray Applied Seals 73 47-91 5.7 1.51 4 As a comparison study, all the pavement sections on which no work was recorded since 2000 were analyzed to determine the average deterioration rate for those pavements. The rate was 1.68 PCI per year. To determine this average, 189 pavement sections were evaluated. The average for runways is 1.37, for taxiways it is 1.70 and for aprons it is 1.79.

71
Michigan DOT Michigan DOT has responsibility for 68 airports. There are a total of 704 separate sections on these 68 airports. They use the Paver Pavement Management System to track the condition of their airfields and use it to prioritize their preventive maintenance program. Figure 4-14 shows the average condition for their airfields from 1999 to 2007.
72
74
76
78
80
82
84
1998 1999 2000 2001 2002 2003 2004 2005 2006 2007 2008
YEAR
PAVE
MEN
T C
ON
DIT
ION
(PC
I)
Figure 4-15 - Average PCI versus Age for Michigan The Work History Report was reviewed to determine the types of treatments used by Michigan. No evidence was noted in the Work History Report that Michigan has used any type of sealer. It was found that since 1994, Michigan DOT has replaced or reconstructed 179 pavement sections (or about 25% of their pavement sections). The Work History Report indicates two other procedures used: major rehabilitation of HMA pavements and HMA overlays. Table 4-17 shows the results of the analysis for Michigan:
Table 4-17 Trigger Values for Different Treatments - Michigan
Treatment
Average PCI at time of
treatment
Range of average PCI at time of
treatment
Average increase
in PCI after
treatment
Deterioration Rate (PCI per year)
Life of treatment (years to return to previous
condition)Major Rehab with HMA 61 36-77 35 2.49 14.0 HMA Overlays 55 48-70 36 2.23 16.1
As a comparison study, all the pavement sections which were reconstructed since 1994 were analyzed to determine the average deterioration rate for those pavements. The rate was 1.31 PCI per year. This would provide a service life of 30 years.

72
4.4 CONCLUSION It was determined from this portion of the study that state DOTs and aviation departments generally use the following techniques for the maintenance of their airfield pavements: crack sealing, spray-applied seals, slurry seals, and thin overlays. The study of the MicroPAVER data indicated that the preventive maintenance – pavement rehabilitation trigger points given below are typically being used by the aviation community. The deterioration values should be used with care; the data used to develop them is limited and may not reflect other maintenance that was done but that has not been reported or the construction quality of the treatment. Typical PCI Trigger Points:
• Overlays or Reconstruction – o PCI at time of treatment - 60 to 65 o Deterioration rate – 1.41 PCI points per year
• Slurry seals o PCI at time of treatment - 75 to 85 o Deterioration rate – 1.91 PCI points per year
• Spray applied seals o PCI at time of treatment - 75 to 90 o Deterioration rate – 1.45 PCI points per year
It was also learned from the interviews and telephone conversations with aviation personnel that the decision for when various techniques are used is in part based on local preference and the experience of the engineer or aviation director. It is clear from this data and the options available for pavement preservation that some of the new technologies and techniques may be able to reduce costs and result in higher quality pavements while preserving airfield pavements.
73
REFERENCES
1. Duval, J. and Buncher, M., “Superpave For Airfields”, Presented at the 2004 FAA Worldwide Airport Technology Transfer Conference, Atlantic City, New Jersey, USA, April 2004. http://www.airporttech.tc.faa.gov/naptf/att07/ 2004%20Track%20P.pdf/P04005.pdf.
2. Engineering Brief No. 59A Item P-401 Plant Mix Bituminous Pavements (Superpave), Federal Aviation Authority, 2006. http://www.faa.gov/airports_airtraffic/airports /construction/engineering_briefs/media/EB_59a.pdf.
3. Wegman, D., “A Superpave Runway In The Icebox Of The Nation", Proceedings of the 2001 Airfield Pavement Specialty Conference, Transportation Research Board, 2001.
4. http://www.faa.gov/airports_airtraffic/airports/resources/advisory_circulars/media/150-5370-11A/150_5370_11a.pdf.
5. http://www.pavementpreservation.org/toolbox/links/PPGuide.pdf. 6. http://www.aviation.state.or.us/Aviation/pmp.shtml. 7. “Pavement Preservation -- New Technologies for Longer Lasting Roads”, Koch
Pavement Solutions , Powerpoint, http://www.tsp2.org/getfile.php?journal_id=193, accessed 9/4/2008.
8. King, G. and King, H., “Spray Applied Polymer Surface Seals”, Federal Highway Administration Cooperative Agreement DTFH61-01-X-0004, 2008,
9. http://www.pavementpreservation.org/fogseals. 10. Davis, R. and Rayner, G., “Airport-In-The-Sky, Rebuilding a Piece of History”,
http://www.roadsaver.com/Download/cs-01.pdf. 11. Advisory Circular 150/5380-6, “Guidelines and Procedures for Maintenance of Airport
Pavements”, http://www.faa.gov/airports_airtraffic/airports/resources/advisory_ circulars/media/150-5380-6B/150_5380_6b.pdf
12. Caltrans Maintenance Technical Advisory Guide (MTAG) State of California Department of Transportation, Office of Pavement Preservation, Division of Maintenance, Sacramento, CA, October 2003. http://www.dot.ca.gov/hq/maint/MTA_Guide.htm.
13. http://www.pavementpreservation.org/PP_Defs_Memo_09_05.pdf. 14. Holt, F B; Zaniewski, John P; Richards, M, Publication, “Arizona Airport Pavement
Management System”, Volume 2, Proceedings, Third International Conference on Managing Pavements, San Antonio, Texas, 1994 p. 207-216, published by the Transportation Research Board.
15. http://www.tc.gc.ca/CivilAviation/International/Technical/Pavement/evaluation/ menu.htm.
16. Bekkheet, Helali, Khaled, Kazmierowski, and Ningyuan, Li, “Integration of Pavement Maintenance in the Pavement Preservation Program.” First Conference on Roadway Pavement Preservation, Transportation Research Board, October 2005.

74
CHAPTER 5 - LABORATORY TEST METHODS AND PROCEDURES USED TO SIMULATE AND EVALUATE NON-LOAD ASSOCIATED
DISTRESS IN HMA PAVEMENTS There have been a number of procedures developed to simulate the long term aging of asphalt binders and HMA mixtures. The goal of these procedures has been to simulate the effect of aging on asphalt binders. In a comprehensive SHRP review of laboratory aging protocols for asphalt binder binders and mixes, Bell1 described a broad range of simulation tests that have been proposed throughout the years. Chemical and rheological changes occurring during HMA construction at elevated temperatures have been relatively easy to replicate for conventional asphalt binders, using tests such as the Thin-Film Oven Test (TFOT), the Rolling Thin-Film Oven Test (RTFO), the Stirred Air-Flow Test (SAFT), and the German Rolling-Flask Test (GRF), to name a few. It has proven difficult to develop tests which accurately replicate the rheological changes that occur in an asphalt binder in the pavement over time. Attempts to accelerate the process for laboratory convenience by increasing temperatures, and/or exposing the binder to elevated pressure in air or pure oxygen have been problematic. 5.1 AGING OF ASPHALT BINDERS There have been a number of test procedures developed that have been or are being used to evaluate the aging characteristics of asphalt binders. Testing of binder properties is performed to try to correlate these binder aging procedures to the actual aging that occurs in asphalt binders utilized in hot-mix asphalt (HMA), when in service on airfields. Developing correlations between lab binder aging procedures and actual field aging has been limited for a number of reasons. First, the binder must be extracted from aged pavement cores. The extraction procedure may alter binder properties. Second, the binder ages at different depths in the asphalt pavement cross section. Most aging will occur in the top of the pavement where the materials are most exposed to climatic changes and the sun. To illustrate this, typical results from the Witczak and Mirza global aging prediction model, that was calibrated using field data, are shown in Figure 5-1.

75
Figure 5-1. Illustration of Severe Aging Gradients in Asphalt Pavements The aging gradient presents a dilemma, with respect to both the development and calibration of mechanical laboratory tests to simulate field aging, which involve the testing of discrete thickness specimens. Usually, a minimum thickness of 50 mm or possibly 25 mm for mixtures with finer aggregates is required depending on the test method. Removing the top portion of the mixture can make the specimen more uniform for testing. But, by removing the top of the specimen, we may have greatly reduced our ability to properly measure a mixture’s surface brittleness where environmental aging occurs. Third, binder aging is dependent on mix properties. In particular, density or compaction level, which is not consistent across or within an asphalt pavement system, affects binder aging. Fourth, binder film thickness (asphalt coating on an aggregate particle) in a mixture is variable within a given mix and has not been simulated through a lab binder aging procedure. There are other reasons as well. In spite of these limitations to developing laboratory to field correlations to model aging asphalt technologists have developed test procedures.. 5.1.1 California Tilt-Oven Durability Test (TDOT) As part of the comprehensive Caltrans asphalt binder durability study,2 Predoehl and Kemp3 evaluated available accelerated aging tests, including extended time in the RTFO at 163° C and weathering under UV light, and found none of them could satisfactorily predict results of their field study. They then modified the AASHTO T-240 RTFO test by reducing the temperature to 113° C, increasing the aging time to 168 hours, and putting the oven on a 1° angle so the asphalt binder remained within the open tubes. The authors reported that the lower temperature more accurately ranked binders according to their respective aging in the field, and added TODT to Caltrans binder specifications.

76
5.1.2 Thin-Film Accelerated Aging Test (TFAAT) Peterson4 coated RTFO bottles with very thin asphalt binder films and then aged them in heated air for three days at 113° C (the same temperature specified by Caltrans). He recorded evolving asphalt binder viscosity and reported results which compared favorably to samples taken from the Zaca-WIgmore test road. 5.1.3 Rotating Cylinder Aging Test (RCAT) A promising accelerated aging test has been developed at the Belgium Road Research Centre by Verhasselt5 and Choquet6. The authors compared evolving rheology as they varied a number of test conditions, including temperature (70-100° C), aging time (up to 576 hours), air/oxygen pressure, and cylinder rotation rate. Test conditions of 85° C and 1 rv/min with oxygen flow for 240 hours provided similar chemical properties to a binder aged for 15-20 years in a Belgian pavement. A field aging study is ongoing with the goal of optimizing lab conditions to simulate changing physical and chemical (carbonyl, Asphaltenes) properties during aging. 5.1.4 Thin-Film Oven (TFOT) The TFOT procedure is performed by pouring a 50 ml (approximately 50 grams) sample of heated asphalt binder into a flat-bottomed, circular sample pan. The sample pans are placed on a rotating shelf in a ventilated oven operating at 163° C (325° F). The rotating shelf turns at a rate of approximately 5 to 6 revolutions per minute for a total testing time of 5 hours. After 5 hours, any sample pans being used for determining mass change are allowed to cool to room temperature before the final weight is determined. The remaining pans are then poured and scraped into a single sample container for testing. 5.15 Rolling Thin-Film Oven (RTFO) The rolling thin film oven test (ASTM 1995) measures the effect of heat and air on a moving film of asphalt binder. Thirty-five grams of asphalt binder is poured in a glass bottle that has a narrow top opening. The glass bottle is placed in a carriage such that the bottle is horizontal. A jet of air is blown into the bottle. The sample is tested at 163° C and the carriage is rotated at the rate of 15 revolutions per minute for 85 minutes. As the bottle rotates in the carriage, the asphalt coats the inside of the bottle. After aging, the glass bottles are removed and weighed to measure any mass loss. 5.1.5 Pressure Aging Vessel (PAV) As reviewed by Anderson7, numerous studies have used pressurized air or oxygen to accelerate aging in the laboratory. One notable precursor to Superpave’s two step aging process was the Iowa durability test as developed by Lee and co-workers5, which combined TFOT with a low-temperature (150° F) binder aging test under air pressure and a mixture aging test to predict pavement aging. After finding that asphalt binders aged longer at RTFO temperatures did not satisfactorily fit the shape of rheological master curves from field specimens, SHRP researchers also elected to simulate pavement aging by further aging the RTFO conditioned asphalt. The PAV used pressurized air to accelerate the process, while keeping temperatures between 60° C and 100° C. Although 60°C was preferred, aging under 300 psi air pressure at 100° C produced acceptable results within the 24 hour time limit needed by suppliers in order to satisfy QA/QC product certification protocols. The current practice is to use a pressure of 300 psi but vary the temperature from 90o C (for 52 grades and lower), to 100o C (for most “normal” grades PG 58-

77
infinity), to 110o C (only used in desert/super-hot climates.) PAV is the long-term aging test now included in Superpave binder specifications. It is believed that the PAV aging simulates about seven to ten years of aging. 5.2 AGING OF HMA MIXTURES As with the aging of asphalt binders, there are a number of test procedures developed that have been or are being used to evaluate the aging characteristics of an HMA mixture. The test results from these procedures have been correlated to the field aging of HMA pavements. The problem associated with these procedures is their limited ability to predict the aging characteristics within an HMA pavement at a particular airfield due to variable climatic conditions and HMA density levels. 5.2.1 Short-Term Oven Aging Short-term oven aging of the loose mix was originally used to simulate haul times from the hot mix plant to the jobsite. The aging times vary from 30 minutes to about 2 hours. This procedure was standardized by the SHRP and consists of aging a loose HMA mixture for a period of time in a forced draft oven at 275° F. It was found that two important processes happen during the oven aging of the mixture. First, the asphalt absorbs into the aggregate changing the potential mixture maximum gravity (Gmm). Second, the asphalt aging causes the mixture to stiffen. SHRP chose four hours aging at 275°C, a common compaction temperature, as the new standard to simulate the absorption and aging that a mixture encounters through the construction process. Once in use, it was determined that four hour aging was not needed in everyday production because only the absorption simulation was needed for use in the volumetric analysis procedures being used for quality control of HMA pavements. The procedure is now in two parts in AASHTO R30, Mixture Conditioning of Hot-Mix Asphalt: Short-Term Oven Aging for Volumetric Mixture Design (2 hours) and Short-Term Oven Aging for Mechanical Property Testing (4 hours). The aging temperature is set at the recommended compaction temperature of the hot mix asphalt. 5.2.2 Long-Term Oven Aging (Conditioning) of Prepared Specimens To further age the mixture for mechanical property testing, SHRP introduced long-term oven aging of the compacted HMA sample.8 This aging further conditions the already short-term aged mixture to simulate the aging that occurs over the service life of a pavement (maybe seven to 15 years). This is similar to the PAV aging results above and is typically performed on surface mixtures that are more exposed to environmental aging. The advantage of aging the compacted sample is to better understand the effect of air voids and permeability on the mixture aging process. This can only be accomplished when the mixture is in a compacted form. AASHTO R30, Section 7.3 requires that the sample be aged in a forced draft oven at 85C for 120 hours (5 days). 5.2.3 Weatherometer HMA specimens could be manufactured and then placed in a weatherometer to expose the surface to ultraviolet lighting. This type of testing is routinely done on materials used for roofing. But, as discussed in the section on asphalt chemistry it is the thinking of the AMEC team that the aging of asphalt binders in an HMA mixture is primarily due to oxidation and the aggregate
78
in the HMA mixture negates the influence of ultraviolet rays on the aging of the asphalt binder. Therefore, this technique is not recommended. 5.3 LABORATORY TESTS THAT COULD BE USED TO EVALUATE LONG-TERM AGING Laboratory testing on thin field cores is limited. Most current mixture property testing is limited to 2 inch (50mm) thick specimens. This is thicker than the average construction lift thickness or overlay thickness on some airfield pavements. We recognize that the asphalt surface design may be 3 to 4 inches or more in total thickness. However, the construction lifts to place the surface is less. These layers are then bonded with asphalt tack. Mechanical mixture testing can only be performed on an overlay or single construction lift since layers will debond during mechanical testing. Due to the overlay thickness being relatively thin, many surface property evaluations in the past have been limited to extraction and recovery of the asphalt binder and resilient modulus testing. In recent years, more mixture tests have been introduced to evaluate cores from surface layers. The following test procedures are being used to evaluate the effect of aging on asphalt binder binders. 5.3.1 Static Bending Test Using the Bending Beam Rheometer (BBR) This procedure was developed by Dr. Marasteanu9 at the University of Minnesota. It uses thin mix specimens cut to the standard BBR test geometry and then applies a 500 gram load in a BBR device. The test is run at -6oC to 18oC and requires an upgrade to the standard BBR. The stiffness and the m-value of the mix are determined. It may provide a method to measure the change in the properties of the HMA mixture as the mixture is aged. This test can have high variability due to the small sample size. 5.3.2 G* from the Dynamic Shear Rheometer This procedure evaluates the properties of the binder as it aged by aging the compacted HMA specimens or existing cores. The binder is chemically extracted from the mixture sample. The shear modulus of the binder is measured by the DSR. The disadvantage with the use of this procedure is that it requires chemical extraction of the binder, which if not done very carefully, can change the properties of the binder. 5.3.3 DSR Creep Testing This test was developed by Gerald Reinke10 and consists of testing mixture specimens that are approximately 50 mm by 12 mm by 10 mm. The test is conducted using a modified DSR. The test is a repeated creep test that consists of using a typical creep time of 1 second followed by a recovery time of 9 seconds. The repeated creep and recovery process is continued for 2000 cycles or until the specimen fails from fatigue. This test is very useful for determining the aging of an HMA sample by examining the effect of aging gradients of the pavement. Like the BBR mixture test, this test can have high variability due to the small sample size.
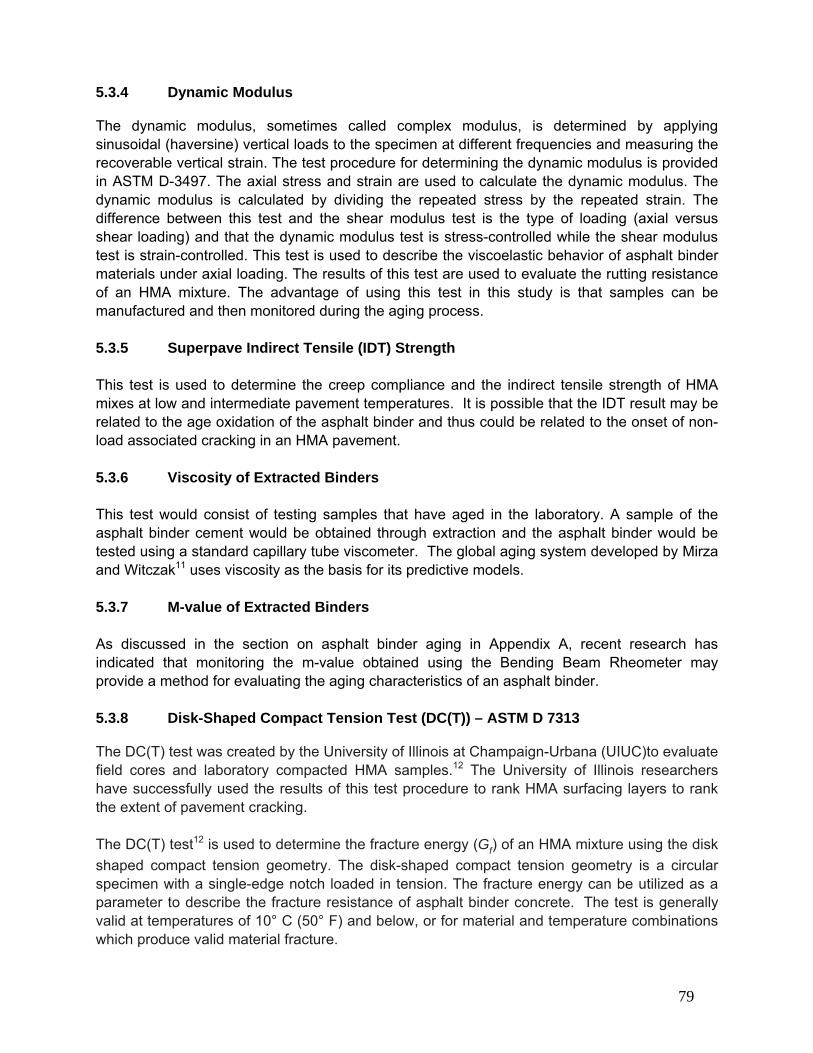
79
5.3.4 Dynamic Modulus The dynamic modulus, sometimes called complex modulus, is determined by applying sinusoidal (haversine) vertical loads to the specimen at different frequencies and measuring the recoverable vertical strain. The test procedure for determining the dynamic modulus is provided in ASTM D-3497. The axial stress and strain are used to calculate the dynamic modulus. The dynamic modulus is calculated by dividing the repeated stress by the repeated strain. The difference between this test and the shear modulus test is the type of loading (axial versus shear loading) and that the dynamic modulus test is stress-controlled while the shear modulus test is strain-controlled. This test is used to describe the viscoelastic behavior of asphalt binder materials under axial loading. The results of this test are used to evaluate the rutting resistance of an HMA mixture. The advantage of using this test in this study is that samples can be manufactured and then monitored during the aging process. 5.3.5 Superpave Indirect Tensile (IDT) Strength This test is used to determine the creep compliance and the indirect tensile strength of HMA mixes at low and intermediate pavement temperatures. It is possible that the IDT result may be related to the age oxidation of the asphalt binder and thus could be related to the onset of non-load associated cracking in an HMA pavement. 5.3.6 Viscosity of Extracted Binders This test would consist of testing samples that have aged in the laboratory. A sample of the asphalt binder cement would be obtained through extraction and the asphalt binder would be tested using a standard capillary tube viscometer. The global aging system developed by Mirza and Witczak11 uses viscosity as the basis for its predictive models. 5.3.7 M-value of Extracted Binders As discussed in the section on asphalt binder aging in Appendix A, recent research has indicated that monitoring the m-value obtained using the Bending Beam Rheometer may provide a method for evaluating the aging characteristics of an asphalt binder. 5.3.8 Disk-Shaped Compact Tension Test (DC(T)) – ASTM D 7313 The DC(T) test was created by the University of Illinois at Champaign-Urbana (UIUC)to evaluate field cores and laboratory compacted HMA samples.12 The University of Illinois researchers have successfully used the results of this test procedure to rank HMA surfacing layers to rank the extent of pavement cracking. The DC(T) test12 is used to determine the fracture energy (Gf) of an HMA mixture using the disk shaped compact tension geometry. The disk-shaped compact tension geometry is a circular specimen with a single-edge notch loaded in tension. The fracture energy can be utilized as a parameter to describe the fracture resistance of asphalt binder concrete. The test is generally valid at temperatures of 10° C (50° F) and below, or for material and temperature combinations which produce valid material fracture.

80
The fracture energy is particularly useful in the evaluation of field cores. The DC(T) test has also been used on polymer-modified mixtures and categorizes the varying levels of performance well. In particular, the test has been shown to discriminate between the polymer mixtures more broadly than the IDT strength parameter. Recently, the DC(T) was used to evaluate lab mixture aging with promising results in a similar unpublished study by Andrew F. Braham, Dr. William Buttlar, Timothy R. Clyne. In this recent unpublished study at UIUC, they examined the effect of laboratory and field aging on the mechanical properties of asphalt mixtures. Braham et al. attempted to develop a laboratory aging protocol to simulate field aging, based upon mechanical tests on asphalt mixtures such as creep, modulus, and fracture energy. Laboratory aging in a forced draft oven at 135 C produced a trend of fracture energy versus oven aging time as expected. Interestingly, fracture energy actually increased up to about 6 to 8 hours before decreasing, which was hypothesized to be related to additional mixture curing, where effects of mixture strengthening outweighed effects of mixture embrittlement on fracture energy at early stages of aging. Also, the fracture energy measured on field cores after field aging for eight years (using specimens with the top 12.5mm removed) was found to be only marginally lower than the unaged material.
5.4 LABORATORY STUDY The research team reviewed laboratory procedures for aging asphalt binders and mixtures to select the most promising evaluation techniques. In the case where an HMA pavement is in the aging process (see Figure 5-2) the DC(T) test was selected based on the following:
• This test is one of the few mixture tests that have successfully ranked field surface cores with pavement cracking.
• The DC(T) was successfully utilized in a recent Low Temperature Pool Fund study by northern states to better understand cracking in HMA pavements.
• This test has an ASTM standard procedure.
0.5
1
1.5
2
2.5
3
3.5
4
4.5
5
0 2 4 6 8 10 12 14 16 18
Time (Years or Traffic)
Pave
men
t Con
ditio
n
GOOD
POOR
Figure 5-2 HMA Pavement Deterioration Curve

81
The objective was to identify mixture and binder test(s) to measure non-load or environmental aging effects on asphalt surface mixtures taken from airfield pavements. Since surface layers are usually limited to 1 inch (25 mm) up to a typical maximum of 1 ½ inches (38 mm) in thickness, many current mixtures tests are eliminated. Current asphalt mixture tests are mostly designed to measure materials properties on laboratory compacted samples where the thickness can be specified. Since surface lifts on airfields can be less than 2 inches, applicable lab mixture testing procedures are limited because these current test procedures require more than 2 inch thick samples. In the past, testing has been limited to extraction and recovery of cores to evaluate the binder properties of the thinner surface layers. The binder properties are an indication of the age and performance of the in-place mixture, but are limited to the binder only. Also, extraction and recovery of the binder from the mixture is not as widely available today due to the handling of hazardous chemicals that is required. It is important to measure the complete mixture when possible to understand potential performance as it relates to the interaction of the binder and aggregate.
5.4.1 Test Matrix and Materials Preparation The experimental matrix in Table 5-1 was developed to determine if the DC(T) was able to measure the aging effect on a laboratory-produced mixture with two asphalt types and three aging levels. The test is run at three different temperatures and with 3 replicates for each cell, so a total of 54 test specimens were required.
Table 5-3 Experimental Matrix
Aging Time 4-hours 4-hours + 1 day 4-hours + 5 days PG 64-22 0°C -12°C -24°C 0°C -12°C -24°C 0°C -12°C -24°CPG 64-16 0°C -12°C -24°C 0°C -12°C -24°C 0°C -12°C -24°C
A standard Kentucky job mix formula (JMF), shown in Table 5-2, was blended with 5.4 percent asphalt binder. The composition of the aggregates was 25 per cent limestone #8’s, 26% limestone sand (unwashed), 14 percent limestone sand (washed), and 15 per cent natural sand (rounded). Two asphalt binders, PG 64-22 and PG 64-16, with different aging characteristics were used in this evaluation. The PG 64-22 was from a local terminal and used widely in KY. The PG 64-16 is made from a blend of West Texas sour crude. The PG 64-16 was selected since it has a tendency to age more than the average U.S. asphalt and was identified as such during the Strategic Highway Research Program asphalt evaluations. The binder properties are listed in Table 5-3. All materials were mixed at 149°C with a bucket mixer. The loose mixtures were aged 4 hours at the 135°C compaction temperature in accordance with AASHTO R30, Mixture Conditioning of Hot-Mix Asphalt, Section 7.2 - Short-Term Conditioning for Mixture Mechanical Property Testing. All samples had to be conditioned first with the 4-hour aging to simulate aging and absorption during the construction process. The mixtures were then compacted with a Superpave gyratory compactor set at an internal angle of 1.16°. The 6 inch (150 mm) diameter samples were cut into 2 inch (50 mm) tall samples and the mixture bulk specific gravities were measured. While the laboratory-produced samples were made 50mm thick, the DC(T) is not limited to this thickness. All samples had to meet a 7.0 ± 0.5 percent air voids tolerance. This measurement was important to reduce and control aging and testing variability.
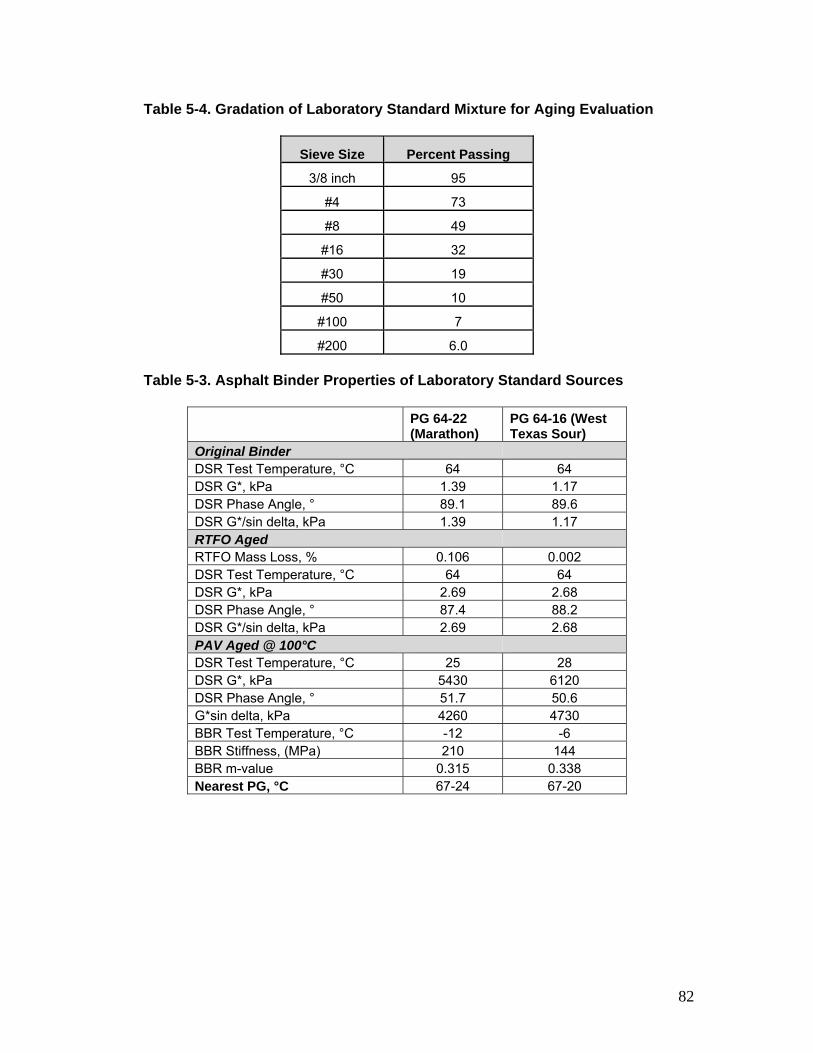
82
Table 5-4. Gradation of Laboratory Standard Mixture for Aging Evaluation
Table 5-3. Asphalt Binder Properties of Laboratory Standard Sources
PG 64-22 (Marathon)
PG 64-16 (West Texas Sour)
Original Binder DSR Test Temperature, °C 64 64 DSR G*, kPa 1.39 1.17 DSR Phase Angle, ° 89.1 89.6 DSR G*/sin delta, kPa 1.39 1.17 RTFO Aged RTFO Mass Loss, % 0.106 0.002 DSR Test Temperature, °C 64 64 DSR G*, kPa 2.69 2.68 DSR Phase Angle, ° 87.4 88.2 DSR G*/sin delta, kPa 2.69 2.68 PAV Aged @ 100°C DSR Test Temperature, °C 25 28 DSR G*, kPa 5430 6120 DSR Phase Angle, ° 51.7 50.6 G*sin delta, kPa 4260 4730 BBR Test Temperature, °C -12 -6 BBR Stiffness, (MPa) 210 144 BBR m-value 0.315 0.338 Nearest PG, °C 67-24 67-20
Sieve Size Percent Passing
3/8 inch 95
#4 73
#8 49
#16 32
#30 19
#50 10
#100 7
#200 6.0
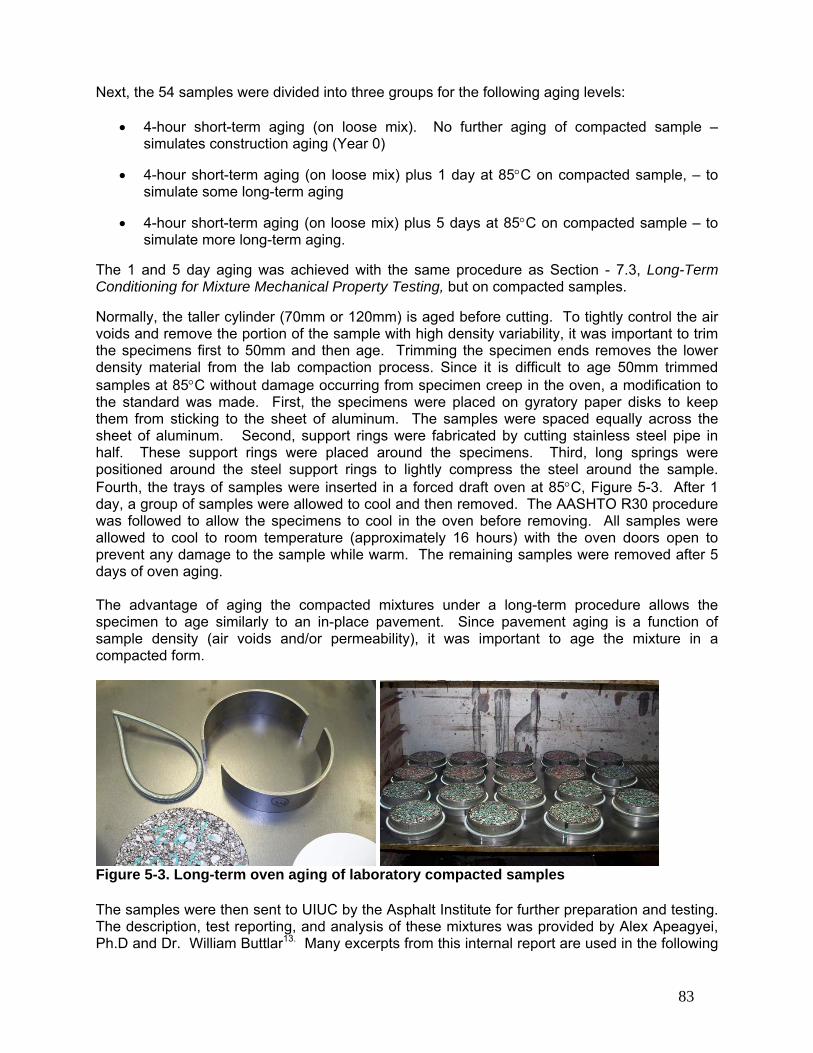
83
Next, the 54 samples were divided into three groups for the following aging levels:
• 4-hour short-term aging (on loose mix). No further aging of compacted sample – simulates construction aging (Year 0)
• 4-hour short-term aging (on loose mix) plus 1 day at 85°C on compacted sample, – to simulate some long-term aging
• 4-hour short-term aging (on loose mix) plus 5 days at 85°C on compacted sample – to simulate more long-term aging.
The 1 and 5 day aging was achieved with the same procedure as Section - 7.3, Long-Term Conditioning for Mixture Mechanical Property Testing, but on compacted samples.
Normally, the taller cylinder (70mm or 120mm) is aged before cutting. To tightly control the air voids and remove the portion of the sample with high density variability, it was important to trim the specimens first to 50mm and then age. Trimming the specimen ends removes the lower density material from the lab compaction process. Since it is difficult to age 50mm trimmed samples at 85°C without damage occurring from specimen creep in the oven, a modification to the standard was made. First, the specimens were placed on gyratory paper disks to keep them from sticking to the sheet of aluminum. The samples were spaced equally across the sheet of aluminum. Second, support rings were fabricated by cutting stainless steel pipe in half. These support rings were placed around the specimens. Third, long springs were positioned around the steel support rings to lightly compress the steel around the sample. Fourth, the trays of samples were inserted in a forced draft oven at 85°C, Figure 5-3. After 1 day, a group of samples were allowed to cool and then removed. The AASHTO R30 procedure was followed to allow the specimens to cool in the oven before removing. All samples were allowed to cool to room temperature (approximately 16 hours) with the oven doors open to prevent any damage to the sample while warm. The remaining samples were removed after 5 days of oven aging. The advantage of aging the compacted mixtures under a long-term procedure allows the specimen to age similarly to an in-place pavement. Since pavement aging is a function of sample density (air voids and/or permeability), it was important to age the mixture in a compacted form.
Figure 5-3. Long-term oven aging of laboratory compacted samples The samples were then sent to UIUC by the Asphalt Institute for further preparation and testing. The description, test reporting, and analysis of these mixtures was provided by Alex Apeagyei, Ph.D and Dr. William Buttlar13. Many excerpts from this internal report are used in the following
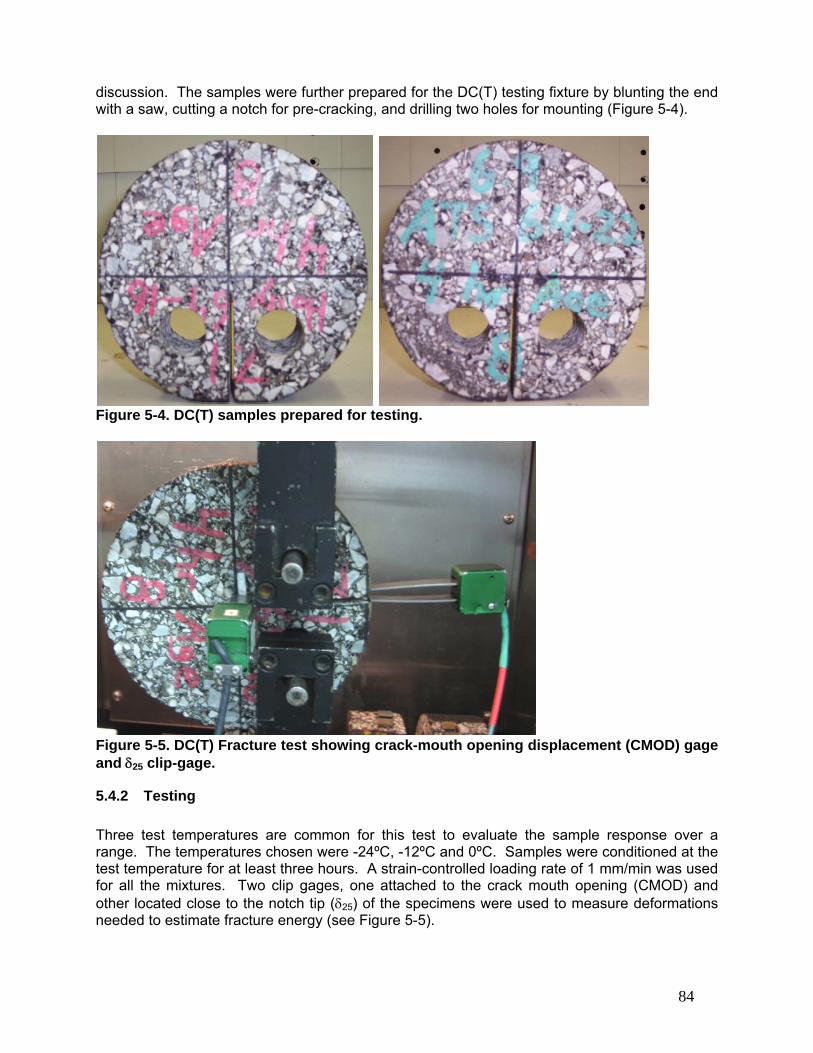
84
discussion. The samples were further prepared for the DC(T) testing fixture by blunting the end with a saw, cutting a notch for pre-cracking, and drilling two holes for mounting (Figure 5-4).
Figure 5-4. DC(T) samples prepared for testing.
Figure 5-5. DC(T) Fracture test showing crack-mouth opening displacement (CMOD) gage and δ25 clip-gage.
5.4.2 Testing Three test temperatures are common for this test to evaluate the sample response over a range. The temperatures chosen were -24ºC, -12ºC and 0ºC. Samples were conditioned at the test temperature for at least three hours. A strain-controlled loading rate of 1 mm/min was used for all the mixtures. Two clip gages, one attached to the crack mouth opening (CMOD) and other located close to the notch tip (δ25) of the specimens were used to measure deformations needed to estimate fracture energy (see Figure 5-5).
85
The use of CMOD and δ25 measurements provide two reference points for energy measurements. While one is not better than the other, they simply provide the technologist with measurement options. Some technologists prefer one over the other. CMOD allows for displacement (used in the energy calculation) measurements at the crack mouth opening where the movement is the largest. Using δ25 allows one to measure the displacement at the crack tip (end of saw cut on interior of specimen) process zone. The δ25 strain measurement targets are placed over a 25mm width at 12.5mm on each side of the crack tip. These two measurements allow for the calculation fracture energy at two separate locations. (For production use, this can be reduced to one measurement for simplicity.) The load is measured from a load cell on the test frame. The specimen is strained until fracture or weakening occurs.
5.4.3 Results Fracture energy is calculated by measuring the area under the load-displacement curve and reported in units of J/m2 for each sample. The area (m2) represents the fracture area of the sample (thickness x ligament length). All results are displayed in Table 5-4 for both CMOD and δ25 measured fracture energies. A summary of the data is shown in Figure 5-6. It is normal to see a larger variation in results when using a fracture test versus a non-destructive test like modulus. Also, the researchers chose to use triplicate samples at three different test temperatures to provide future options. To simplify this data for production use, the measurements could be reduced to one (CMOD for example) and the test temperature to one based on climate location. Variability can be reduced by increasing the number of test replicates since this is a fracture test. The results indicate that PG 64-22 (specifically 67-24) mixtures exhibited significantly higher fracture resistance at the temperatures tested compared to the PG 64-16 (specifically 67-20) mixtures. This is to be expected based on the Superpave grading system. It is worth noting that the DC(T) was able to see these differences even though the low temperature was within 4°C of each other. The effect of aging was most significant for the DC(T) fracture test conducted at 0°C. For most of the mixtures tested, no significant differences in fracture energy were observed at the lowest test temperature of -24°C. A closer look at this data reveals that little, if any, additional aging occurred with the 5-day 85°C oven aging for most of the mixtures. AASHTO R30 refers to this 5-day aging process as long-term conditioning for mechanical property testing. The lack of aging at 5-days was not expected. In their recent study, Braham et al. also found this same lack of aging under the 5-day long-term aging condition. This raises awareness that the 5-day aging on compacted samples may not be long enough to simulate long-term aging. This also raises question like: “When the 5-day aging was utilized in SHRP, what was it supposed to simulate and was it test specific?” It is also possible that the specimens could have been damaged due to creep over the 5-day condition time. This does not seem logical since the specimens would have been weaker (less energy) if they had been damaged in the conditioning process.
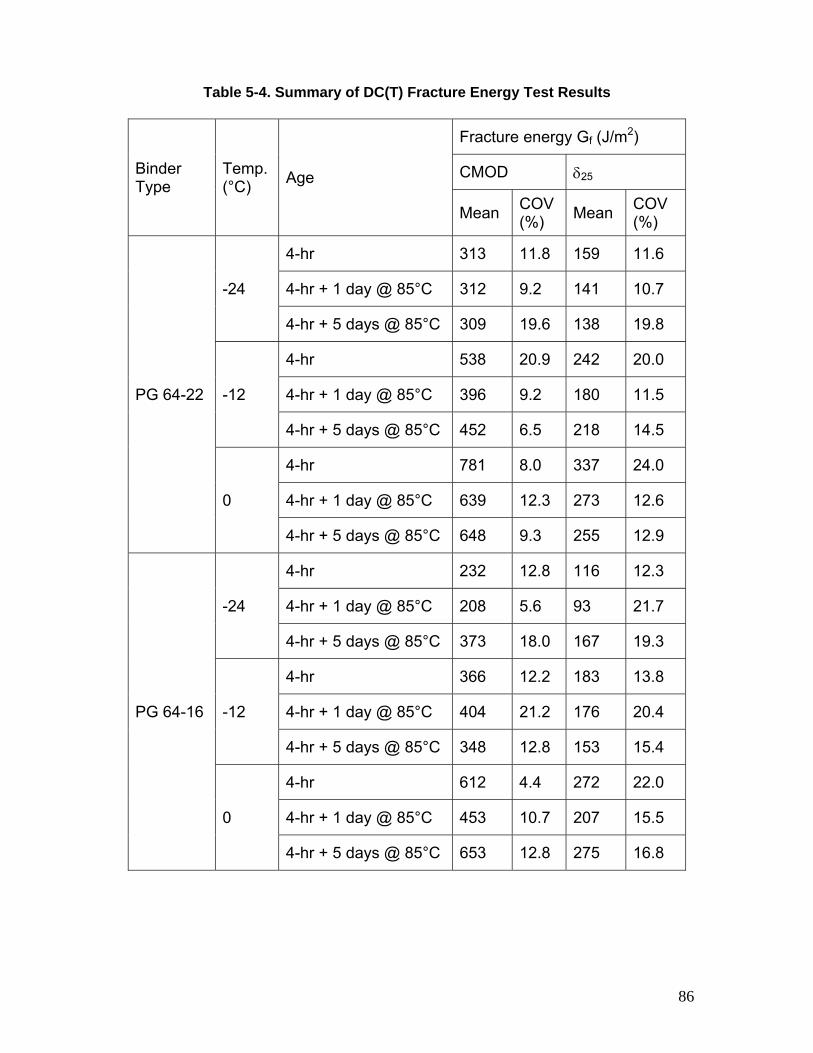
86
Table 5-4. Summary of DC(T) Fracture Energy Test Results
Binder Type
Temp. (°C) Age
Fracture energy Gf (J/m2)
CMOD δ25
Mean COV (%) Mean COV
(%)
PG 64-22
-24
4-hr 313 11.8 159 11.6
4-hr + 1 day @ 85°C 312 9.2 141 10.7
4-hr + 5 days @ 85°C 309 19.6 138 19.8
-12
4-hr 538 20.9 242 20.0
4-hr + 1 day @ 85°C 396 9.2 180 11.5
4-hr + 5 days @ 85°C 452 6.5 218 14.5
0
4-hr 781 8.0 337 24.0
4-hr + 1 day @ 85°C 639 12.3 273 12.6
4-hr + 5 days @ 85°C 648 9.3 255 12.9
PG 64-16
-24
4-hr 232 12.8 116 12.3
4-hr + 1 day @ 85°C 208 5.6 93 21.7
4-hr + 5 days @ 85°C 373 18.0 167 19.3
-12
4-hr 366 12.2 183 13.8
4-hr + 1 day @ 85°C 404 21.2 176 20.4
4-hr + 5 days @ 85°C 348 12.8 153 15.4
0
4-hr 612 4.4 272 22.0
4-hr + 1 day @ 85°C 453 10.7 207 15.5
4-hr + 5 days @ 85°C 653 12.8 275 16.8
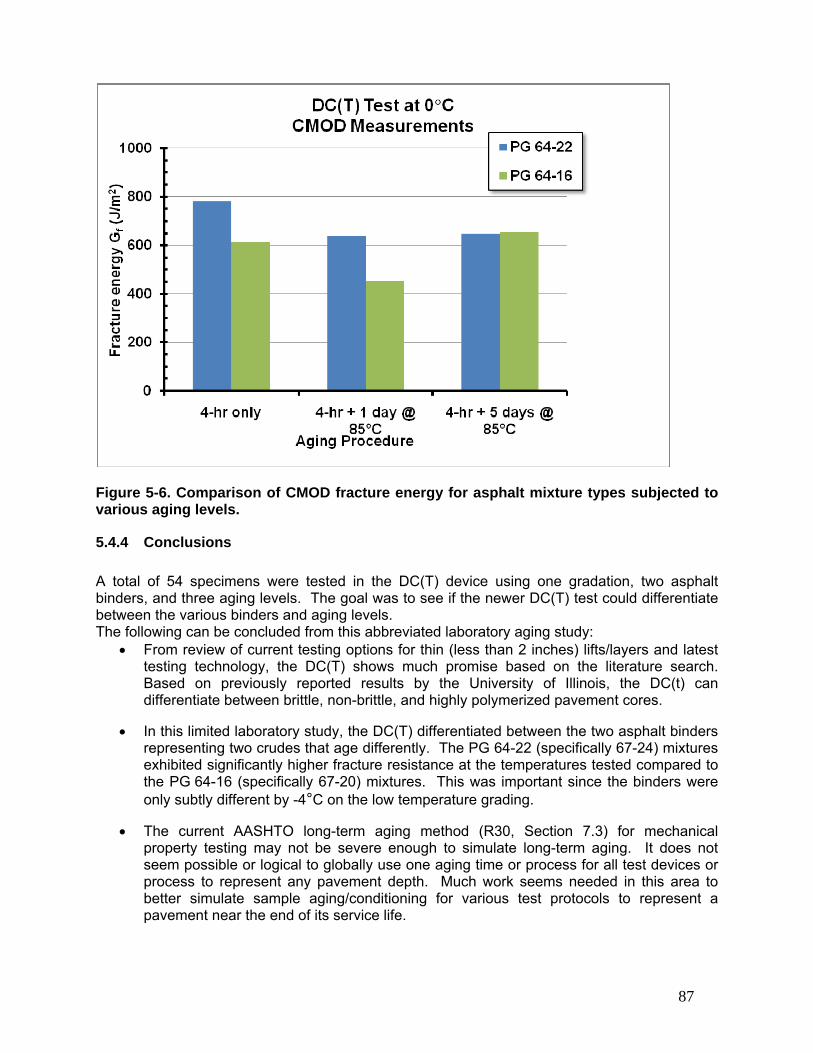
87
Figure 5-6. Comparison of CMOD fracture energy for asphalt mixture types subjected to various aging levels.
5.4.4 Conclusions A total of 54 specimens were tested in the DC(T) device using one gradation, two asphalt binders, and three aging levels. The goal was to see if the newer DC(T) test could differentiate between the various binders and aging levels. The following can be concluded from this abbreviated laboratory aging study:
• From review of current testing options for thin (less than 2 inches) lifts/layers and latest testing technology, the DC(T) shows much promise based on the literature search. Based on previously reported results by the University of Illinois, the DC(t) can differentiate between brittle, non-brittle, and highly polymerized pavement cores.
• In this limited laboratory study, the DC(T) differentiated between the two asphalt binders representing two crudes that age differently. The PG 64-22 (specifically 67-24) mixtures exhibited significantly higher fracture resistance at the temperatures tested compared to the PG 64-16 (specifically 67-20) mixtures. This was important since the binders were only subtly different by -4°C on the low temperature grading.
• The current AASHTO long-term aging method (R30, Section 7.3) for mechanical property testing may not be severe enough to simulate long-term aging. It does not seem possible or logical to globally use one aging time or process for all test devices or process to represent any pavement depth. Much work seems needed in this area to better simulate sample aging/conditioning for various test protocols to represent a pavement near the end of its service life.
88
5.4.5 Recommendations
While limited, the initial data suggests that the DC(T) should be able to differentiate the effect of aging of various airfield asphalt surfaces. To further validate this test, measurements on field cores from a sampling of airfield pavements should be made in Phase 2. For example, if a taxiway or runway has been sealed and the shoulder has not been sealed, a comparison could be made from cores of these locations to measure the effectiveness of the sealant to reduce aging, assuming the shoulder surface is made of similar materials. Cores can also be taken from new construction as a baseline for a new pavement that should exhibit no cracking. Cores should be sampled from varying locations of non-load distresses in wet-freeze, dry-freeze, wet -no freeze, and dry-no freeze climatic zones. To provide other testing options to the research review panel for Phase 2, other tests can be evaluated in addition to the DC(T) test recommendation. Extra samples (4 each) conditioned at the three aging levels were stored and can be used for further testing. More samples can be easily duplicated since this mixture is from a local KY standard aggregate source and similar binders can be obtained. Some binder tests that could be used to further evaluate the aging of the mixture are, but not limited to: classification using the dynamic shear rheometer (DSR) and bending beam rheometer (BBR), capillary tube viscosity, and the newer Multiple Stress Creep Recovery (MSCR) test. The binder tests are useful when sample size is limited, but require chemical extraction of the asphalt binder. A strong potential mixture test is the BBR mixture test by Dr. Marasteanu. This test has shown much initial promise using a small sample. In this test, mixtures can be compacted and cut into small beams similar in size to asphalt binder BBR beams. The beams are then tested in a BBR that has been retrofitted to handle the stiffer mixture sample. The small sample size lends itself to higher variability. Since the most severe environmental aging occurs closer to the surface, it seems logical that a test must be able to evaluate this material. Any test that is chosen should meet constraints of being able to take measurements from relatively thin (~25mm) airfield pavement surfaces obtained from coring with as little trimming as possible.

89
REFERENCES
1. Bell, Chris A. “Aging of Asphalt Aggregate Systems,” Prepared for the Strategic Highway Research Program, National Research Council, SR-OSU-A-003A-89-September 1989.
2. Kemp, G.R. and Predoehl, N..H.., “A Comparison of Field and Laboratory Environments on Asphalt binder Durability,” AAPT, 1981, pp. 492-560
3. Predoehl, N.H. and Kemp, G.R., “An Investigation of the Effectiveness of Asphalt binder Durability Tests – Initial Phase,” Caltrans Laboratory Research Report FHWA-CA-78-26, 1978
4. Petersen, J.C., "A Thin-Rim Accelerated Aging Test for Evaluating Asphalt binder Oxidative Aging,” AAPT, V. 58, 1989, pp. 220-237
5. Verhasselt, A, “Long-term Aging of Bituminous Binders,” Symposium – Aging of Pavement Asphalt binders, Laramie, 2003
6. Choquet, F, and Verhasselt, A, “Long-term Aging of Bituminous Binders,” Rome International Asphalt binder Chemistry Symposium, 1991
7. Anderson, D.A, Christensen, D.W., Bahia, H.U., Dongre, R, Sharma, M.G, and Antle, C.E., “Binder Characterization and Evaluation: Volume 3 – Physical Characterization,” SHRP report 369, reference Ch. 5 “Oxidative Aging Studies,” 1993, pp. 303-401
8. R.B. McGennis, R.M. Anderson, R.M., Kennedy, T.W., Solaimanian M. “Background of SUPERPAVE Asphalt Mixture Design & Analysis” FHWA SA-95-03, 1994
9. Zofka, A., Marasteanu, M.O., Li, Xinjun, Clyne, T.R., McGraw, J. 2005. Simple method to obtain asphalt binders low temperature properties from asphalt mixtures properties. AAPT. Volume 74, 2005, pp 255-282.
10. Reinke, Gerald, “Report to NCAT-Rejuvenator Study - Study of Rejuvenator Type of Mixture Stiffness” Mathy Technology and Engineering Services, Inc, May 2002
11. Mirza, M.W. and Witczak, M.W., “Development of a Global Aging System for Short- and Long-Term Aging of Asphalt Cements”, AAPT, Vol. 64, 1995, pp. 393–424
12. Wagoner, M.P., W.G., Buttlar, G.H., Paulino, and P. Blankenship. Investigation of the Fracture Resistance of Hot-Mix Asphalt Concrete Using a Disk-Shaped Compact Tension Test. Transportation Research Record No. 1929, Transportation Research Board, Washington, D.C., pp 183-192, 2005.
13. Apeagyei ,A.K. and W.G. Buttlar. Characterization of Asphalt Institute Mixture Specimens using the ASTM D7313-06 Fracture Energy Test: AAPTP Aging Study. Internal report, June 24, 2008.

90
CHAPTER 6 - TEST PLAN FOR PHASE II 6.1 CONCLUSIONS Based on the work presented in this study the following conclusions can be drawn:
• A significant percentage of the HMA airfield pavements show some level of non-load associated distress with the majority of it being low-severity as defined by MicroPAVER.
• There is not a significant change in non-load associated distress across different climatic regions which may suggest that the airfield agencies are designing and constructing HMA pavements as appropriate for their climatic conditions.
• As HMA pavements age, the amount of non-load associated distress increases. • That the new technology (developed in research conducted as the result of part of the
testing associated with the implementation of Superpave) when properly applied can be used to extend the time before non-load associated distress begins to develop in new HMA pavements and overlays.
• There are a number of pavement preservation techniques (when used appropriately) that can mitigate non-load related distress on existing HMA pavement surfaces.
• The DC(t) test shows promise for the evaluation of the aging characteristics of HMA pavements and may provide a tool for predicting the age cracking of an HMA pavement.
6.2 PHASE II TEST PLAN It is recommended that a Phase II study be conducted that would have two objectives: Task 1 - Write a Guide For Prevention And Mitigation Of Non-Load Related Distress
• This guide would include
o The basics of a pavement management and pavement preservation system. o Steps that can be taken during new construction to reduce aging of HMA
pavements. o A detailed discussion of techniques that can be used to reduce non-load
associated distress in existing pavements to include as a minimum Detailed design and construction procedures Advantages and disadvantages of each procedure Guidance of when each of these techniques should be chosen or not
chosen • An initial outline for this document is presented in Appendix B.
Task 2 - The objective of this task will be to determine what test(s) could be run that could predict when an airfield pavement is expected to begin showing non-load related cracking? This task will be completed by completion of two subtasks. A small-scale laboratory study will be conducted to identify potential tests that can be used to identify the non-load associated cracking process. During this phase, laboratory-prepared binders and laboratory prepared mixtures will be aged and tested. The second subtask will consist of obtaining cores from airfield pavements which will be evaluated utilizing the most promising tests from the small-

91
scale laboratory evaluation. The goal of this task is to answer the question: What test(s) can be run that will predict when an airfield pavement is expected to begin showing non-load related cracking?

92
- APPENDIX A –
MECHANISMS OF ASPHALT BINDER AGING

93
APPENDIX A - MECHANISMS OF ASPHALT BINDER AGING The following presents a background on the mechanisms associated with asphalt binder aging and the resultant non-load related distress. In a 1981 paper for AAPT, Vallerga1 described the two damage mechanisms specific to asphalt binder aging in HMA pavements:
Embrittleness Cracking - Asphalt binder becomes brittle as it ages. As it ages block cracking forms. Block cracks are interconnected cracks that divide the pavement into approximately rectangular pieces. The blocks may range in size from approximately 1 by 1 ft to 10 ft by 10 ft. Block cracking is caused mainly by volume changes within the HMA caused by daily temperature cycling (that results in daily stress/strain cycling). It is not load associated. The occurrence of block cracking usually indicates that the asphalt binder has age-hardened significantly. Block cracking normally occurs over a large portion of pavement area, but sometimes will occur only in non-traffic areas.
Shrinkage Cracking - Shrinkage cracking is a volume change in the asphalt binder during aging. The AMEC team feels that although shrinkage cracking is often cited in discussions of pavement durability, there is no clear evidence that the volume of the asphalt binder changes significantly during long-term aging. As will be discussed later, relatively small reversible changes in density do occur if waxes within the asphalt binder crystallize and re-melt. However, there is no evidence that oxidation, the primary cause of asphalt binder embrittlement, creates significant changes in asphalt binder density. Likewise, extractions of aged pavements do not suggest a large mass loss over time, suggesting that volatilization is also not a significant contributor to asphalt binder volume changes. Absorptive aggregates might continue to absorb fractions of the asphalt binder over time, but most absorption is thought to occur during construction when the binder viscosity is low. Of course, temperature fluctuations do cause large swings in asphalt binder density. Volume changes of the asphalt binder and aggregate during cooling create the thermal stresses that cause most non-load associated cracking. However, these volume changes related to coefficients of thermal expansion are totally reversible with temperature. Shrinkage cracking, as defined by Vallerga as permanent asphalt binder volume changes over long periods of time, is probably a myth and should be removed from distress identification manuals! It would be appropriate to replace this term with “thermal shrinkage cracking,” as defined by reversible volume changes driven by thermal cycles, so long as there was no lingering confusion with the Vallerga definition above. THEORY OF ASPHALT BINDER AGING In-situ asphalt binder hardening has a long history of literature citations mentioning numerous causes for the evolving rheology2,3,4,5,6 Some of the proposed hardening mechanisms are totally
94
reversible within the normal range of pavement surface temperatures, whereas other chemical and physical changes are permanent. Reversible hardening is usually the result of temperature dependent molecular associations, such as wax crystallization or steric effects resulting from weaker Van der Waals forces. Irreversible hardening may be caused by chemical reactions such as oxidation or molecular cross-linking, or by physical changes resulting from loss of smaller molecules via volatilization or selective absorption. Although many hardening mechanisms have been proposed, only a few have been shown to have long term performance implications. It is important to first consider the magnitude of pavement damage that might occur from each, and then focus attention on the cause and remediation for those that result in significant pavement distress. Because asphalt binder hardening and asphalt binder embrittlement represent two very different failure mechanisms, each aging mechanism must be analyzed to understand how it will respectively impact binder consistency and relaxation properties. Ultimately, the extent of block cracking and the environmental conditions under which damage accumulates will depend upon the specific rheological changes caused by each type of hardening. REVERSIBLE HARDENING MECHANISMS Masson and co-workers7 begin a paper on reversible hardening mechanisms with the statement, “Bitumen is an oligomeric material with a time-dependent microstructure that affects viscoelastic properties. After it is cooled from the melt, bitumen becomes harder over time; the hardening rate is defined by the storage temperature immediately after cooling.” Molecular associations bound by Van der Waals attractions are generally weak bonds which are slow to form, but dissociate quickly as temperature is increased. Over time periods ranging from days to months, asphalt binder density may increase slightly as molecules within the asphalt binder slowly reorient themselves into a more tightly packed orientation with less net free volume. This results in a stiffer, more rigid binder. Corresponding changes in stiffness are usually observed at low or possibly ambient temperatures. At high pavement temperatures, the weak Van der Waals attractions are destroyed, and the hardening effect caused by higher densities disappears until the asphalt binder is cooled again. Several unique reversible hardening mechanisms have been reported: Low Temperature Physical Hardening Low temperature physical hardening is a fairly new concept identified by Anderson and Bahia as they developed testing protocols for the Bending Beam Rheometer (BBR)8. The authors noticed that certain asphalt binders exhibit a substantial increase in low temperature stiffness (S) over a period of four days when stored at low pavement temperatures (-15° C), whereas other asphalt binders show little effect. The increase in BBR Stiffness (S) directly correlates with a measured increase in asphalt binder density. The hardening effect is not observed at higher temperatures, because the molecular associations responsible for the effect appear to be destroyed as the asphalt binder cement is heated to higher pavement temperatures. Because low temperature stiffness is considered to be the key binder parameter related to thermal cracking, pavements may thermally crack at higher temperatures than predicted by the standard BBR protocol when beams are conditioned for only one hour at the prescribed testing temperature. For SHRP
95
Asphalt Binder AAM-1, the original grade of PG 64-22 was reduced to a PG 64-10 after conditioning for four days at -15° C.
Using a series of physico-chemical techniques including Differential Scanning Calorimetry (DSC), phase contrast microscopy, and polarized light microscopy, Claudy and co-authors 9,10,11
identified the cause of low temperature physical hardening to be the reversible micro-crystallization of long-chain aliphatic molecules, or waxes. As the waxes crystallize, asphalt binder density and low temperature stiffness both increase accordingly. However, wax crystallization can be slow, taking up to four days at -15° C. When heated to 60° C, the crystalline waxes melt and the stiffening/density effect disappears. If the asphalt binder is then cooled again, the wax re-crystallizes to recreate exactly the same stiffness changes observed during the initial cooling. Low wax asphalt binders show little low-temperature stiffening, but low wax asphalt binders doped with wax additives exhibit exactly the same thermal and microscopic evidence seen with asphalt binders known to contain natural waxes. An unpublished SHRP report12 compared DSC thermal curves before and after storage for one month at ambient temperature. Enthalpy peaks became sharper with storage time, suggesting first that physical hardening occurs more slowly at ambient temperature than at -15° C, and that crystalline structures organize to more uniform structures as they approach ultimate thermodynamic stability. Physical hardening was included in initial SHRP binder specifications, but was later abandoned because of the extended time required to certify binders for shipment. More recently, based upon the work of Hesp and coworkers,13,14 physical hardening has been found to be a significant contributor to cracking in cold climates. New Ontario specifications have reinstituted physical hardening as a key performance parameter for asphalt binders. Steric Hardening Petersen used penetration measurements at 25° C to monitor gradual changes in asphalt binder stiffness at ambient temperatures over time periods of one month or more. He related this steric hardening effect to the gradual reorientation of polar molecules as they strive to reach thermodynamic equilibrium15 Asphaltenes appear to play a strong role in steric hardening, but maltene fractions can also exhibit hardening. Although the exact mechanism is not well understood, this theory has been recently extended to cover the continuing reorientation of polar molecules along the surface of aggregates with differing mineralogy.16,17 At the time of Petersen’s initial work, the effect of physical hardening as caused by wax crystallization was not known. It is possible that some of the hardening effects Petersen observed at ambient temperature were in fact caused by the same wax crystallization mechanism that proceeds more quickly at lower temperatures. Steric hardening as defined by Petersen has not been shown to have a significant impact on pavement performance and no binder specifications currently judge binder quality with this parameter.

96
Thixotropy The property of asphalt binder whereby it "sets" when it is not agitated. Thixotropy is thought to result from “hydrophilic suspended particles that form a lattice structure throughout the asphalt binder. This causes an increase in viscosity and thus, hardening. Thixotropic effects can be somewhat reversed by heat and agitation. The cracking in HMA pavements with little or no traffic are occasionally associated with thixotropic hardening. It is not clear how thixotropy differs from steric hardening for conventional bitumen. It is true that block cracking in un-trafficked areas may be more severe, because there is no kneading action from tires to heal surface cracks. However, rheological evidence for thixotropy with a definable yield stress is usually observed only when conventional bitumen is tested in ultra-thin films of 10 microns or less. Gelling Agents These are additives that create strong gel structures within the asphalt binder cement. Although pseudoplastic behavior is of minimal importance for conventional bitumen, Schweyer and co-workers showed that saponified tall oil additives create very strong gelled networks which exhibit a relatively high yield stress18. Such additives have long been used to make “high float” emulsions and have more recently been sold as “Multigrade” modified asphalt binder. King19 used Superpave binder tools to show that these gels increase asphalt binder consistency at high temperatures, as measured by G*, but have minimal impact on low temperature stiffness. G* exhibits some shear sensitivity, in that G* drops with increasing shear rate. The most notable difference was noted when plotting G* vs. phase angle on Black diagrams and observing that the strong gel causes the phase angle to decrease with increasing high temperatures. Little information is available on low temperature relaxation properties, although gels may reduce ductility. Depending upon temperature, gel formation may take hours to weeks to reach thermodynamic equilibrium, but should remain relatively stable once it does. The gel structure is thermally reversible, but only if heated to temperatures well in excess of maximum pavement temperatures. IRREVERSIBLE HARDENING MECHANISMS Loss of Lighter Molecules
In his state-of-the-art review, Petersen20 notes that asphalt binder becomes stiffer as lighter oil fractions are lost. Not surprising, since this is exactly what happens in vacuum towers as petroleum crude is refined to harder asphalt binder grades by increasing distillation temperatures to remove more volatile molecules. There are several mechanisms through which the small, less polar maltene oils can be lost, including volatilization, selective absorption, and syneresis. Because they are widely cited as causes for asphalt binder hardening, it is important to consider their relative contribution to aged-asphalt binder rheology. Volatilization Volatilization is the evaporation of lighter constituents from asphalt binder. Heavy sour crudes require lower distillation temperatures than lighter crudes to produce paving grade asphalt binders. Furthermore, distillation towers operate at different separation efficiencies based upon
97
column conditions and production rates. Asphalt binder volatility, as defined by mass loss following RTFO or TFOT aging tests, is therefore directly related to the cut point and the efficiency of the refinery crude distillation process. Volatility is principally an issue during HMA production and placement, where fume issues such as worker safety or plant opacity are important. Although asphalt cutback solvents are volatile enough to evaporate from the pavement, asphalt binders that meet standard mass loss specifications should have very low in-situ volatility.
Selective Absorption Selective absorption is the movement of smaller, mobile asphalt binder molecules into pores within the aggregate, which is sometimes referenced as separation. The science of separating large from small molecules using Size-Exclusion Chromatography (SEC) or Gel Permeation Chromatography (GPC) has been developed on the premise that molecules will selectively absorb into pores on a solid substrate when the size of the opening is larger than the molecule itself. This same principle applies to thin films of asphalt binder that cover an adsorptive surface. If smaller, less polar molecules become entrapped in pores of an absorptive aggregate, the asphalt binder remaining on the surface stiffens as lower viscosity oils are lost. The magnitude of this hardening mechanism was evaluated during the Caltrans aging study conducted by Kemp21. In this research, a series of asphalt binder mix specimens were prepared using different aggregates and asphalt binder crude sources. After identical groups of specimens were aged for several years in four different California climates, they were tested for consistency. Mixes made with high air voids and mixes with absorptive aggregates exhibited more hardening than specimens made with the same asphalt binder but non-absorptive materials. However, impact of selective absorption on hardening was not large when compared to other contributing variables such as pavement temperature/depth, crude source, and in-place air voids. It has sometimes been argued that aggregate or filler mineralogy may also impact aging. However, a limited SHRP aging study of asphalt binder mastics containing five very different fillers concluded that the mineralogy of the filler did not have an important effect on oxidative aging22.
Syneresis Syneresis is the separation of less viscous liquids from the more viscous asphalt binder molecular network. The liquid loss hardens the asphalt binder and is caused by shrinkage or rearrangement of the asphalt binder’s structure due to either physical or chemical changes. Syneresis is a form of bleeding. An asphalt binder should not phase separate over time unless it is internally incompatible. Evaluation of Heithaus Parameters or use of the Automated Flocculation Titrimeter (AFT) should identify the few bad actors. Impact on Asphalt Binder Rheology Any process which selectively removes smaller, less polar molecules leads to asphalt hardening, in the same sense that petroleum crude can be distilled to a higher temperature to make harder paving grade asphalt. Correspondingly, rejuvenator oils can be added to soften the asphalt binder. Asphalt rejuvenator oil blending charts or refinery vacuum tower yield curves
98
would indicate that relatively large mass changes are needed to have a significant impact on rheology. With a mass loss of 1 percent, the upper limit allowed by RTFO specifications, the high temperature PG grade should not change by more than 2° C. At low temperatures, this 1 percent mass loss might increase the critical cracking temperature by approximately 1° C. More importantly, the relative relationship between low temperature stiffness and relaxation properties as determined by the temperature at which S and “m-value” meet their respective continuous grades, does not significantly change. Based upon these relatively small rheological changes, particularly with respect to binder relaxation properties, one would conclude that loss of lighter oils is not a significant contributor to block cracking. However, data which appears to contradict this conclusion was presented in the final report of SHRP research23. In a TFOT volatilization experiment under different environmental conditions, including the replacement of air with an inert argon atmosphere, authors reported the following:
Aging asphalt binders in the standard TFOT oven under an inert environment harden significantly. Therefore, volatilization or the loss of volatile constituents contributes greatly to the hardening of asphalt binders at high temperatures.
The mass change under an air environment is only marginally less than the mass change under an inert environment. This finding reflects the fact that during aging in the TFOT the mass gain because of oxidation is very small. This small mass gain, however, results in significant hardening.
The more polar asphalt binders (SHRP Binders AAD-1 and AAK-1) showed more mass loss in both air and argon environments than the less polar asphalt binders (SHRP Binders AAG-1 and AAM-1). The relative difference in mass is not a good indicator of the relative hardening.
Asphalt binders that showed maximum mass loss during the volatilization experiment under inert environment showed the maximum mass gain during the PAV high-temperature aging. This behavior may need further analysis and investigation.
Summary The puzzling results from the oxidations in an inert environment do not correspond with expectations as described previously, nor is there an accepted explanation for the final reported finding regarding high mass loss vs. high mass gain under the different environments. Moreover, the finding that hardening rates under air and argon are similar falls in direct conflict with widely reported correlations between carbonyl formation and hardening. Further study of asphalt oxidation in inert environments is needed before the initial conclusion of this study can be accepted. New experiments might include thorough degassing to remove dissolved oxygen before aging in Argon, and monitoring carbonyl formation during aging in an inert atmosphere to insure that the hardening mechanism is not oxidation from dissolved/bound oxygen. Also, doping experiments are needed to add the volatile components back into the aged asphalt binder to determine if any rheological changes are due only to mass loss. Hence, these findings leave many more questions than answers. If they are correct, it is very possible that chemical reactions which increase apparent molecular size at TFOT temperatures could be responsible for the rheological change, rather than mass loss. Such molecular condensations are known to occur during the ambient temperature storage of heavy fuels, as discussed below.
99
INCREASING MOLECULAR SIZE Functional groups on different molecules can react with each other, linking different molecules together through covalent sigma bonds. Common reactions of this type include condensation and polymerization. Condensation Condensation reactions typically join two different functional groups such as an organic acid reacting with a primary amine to form an amide. These condensations can also occur as part of an oxidation reaction, such as the reaction of indoles with other aromatics to create a thick, filter-plugging sludge in heavy fuels24. Once one of the co-reactants is consumed, the reaction stops. Such reactions can be reversible. That is, the amide might be favored in hot liquid asphalt binder, but the presence of water with a high or low pH might reverse the condensation reaction to restore the original organic acid and amine. Polymerization Polymerization implies the combination of many smaller molecules to form high molecular weight polymers. In its most common form, polymerization occurs when molecules contain carbon-carbon double bonds which can be coaxed into forming new sigma bonds with adjacent molecules which also contain a double bond. The new bond, or cross-link, causes the double bond in the second molecule to reach out to a third, and so on. Once this reaction starts, it can continue to join many more molecules which contain double bonds to create one very large covalently bonded molecule. Although frequently cited as a cause of hardening, polymerization is not common in asphalt, because most double bonds are tied up in aromatic rings where cross-linking is severely restricted by energy considerations. Elastomeric polymer additives do contain double bonds, and may continue to cross-link over time. Vulcanization Vulcanization is a chemical process through which elemental sulfur cross-links polymer molecules to make them larger. This reaction is useful for in-situ cross-linking of polymers, or for cross-linking a few asphalt binder molecules to polymers, but has very little influence on conventional bitumen. Impact on Binder Rheology: Typical polymer additives have molecular weights in excess of 100,000 amu, whereas asphalt binder molecules range from 600 to 2000 amu. Although HP-GPC chromatography does show a substantial increase in the large molecular size (LMS) fraction as asphalt binder ages, these large molecular clusters dissociate as they are further diluted in the very polar solvent tetrahydrofuran (THF)25. Hence, these asphalt binderene-like clusters are much more likely to be polar associations caused by oxidation, rather than physically cross-linked molecules. Even if

100
chemical reactions could increase average molecular weight enough to significantly impact G* at high temperatures, cracking damage would not necessarily be affected. As seen with polymer-modification of asphalt binder, higher-molecular-weight molecules generally improve asphalt binder temperature susceptibility by increasing the binder modulus at high temperatures without significantly impacting low temperature performance as measured by S and “m-value.” If anything, larger covalently bonded molecules would be likely to improve strain tolerance. Neither condensation nor polymerization deserves serious consideration as a cause for block cracking.
ASPHALT BINDER OXIDATION Oxidation is the chemical reaction of asphalt binder with molecular oxygen (O2), such that individual carbon or sulfur atoms within asphalt binder molecules increase in oxidation state as oxygen atoms change from (0) to (-2). Asphalt binder oxidation is commonly recognized to be the dominant cause for long-term age hardening, and block cracking resulting there from. The most conclusive evidence comes from lab and field research that consistently reports very high correlations between carbonyl content and the various rheological measures of hardening26. Oxidation Chemistry When asphalt binder is exposed to elemental oxygen, one of three things can happen:
1. At elevated temperatures (230-320° C) under the controlled conditions within air blowing stills, molecular oxygen (O2) removes hydrogen atoms from carbon atoms, creating carbon-carbon double bonds and the by-product water (H2O). In a study of blown bitumen blends, Hardee reported reaction kinetics favor withdrawing hydrogen from naphthene-aromatic molecules. That is, 6-carbon naphthenic rings which are already bonded to aromatic rings lose four hydrogen atoms in two consecutive oxidation steps to form a larger conjugated aromatic ring system. The increasing aromaticity can be quantified by using Nuclear Magnetic Resonance (NMR) spectroscopy.27,28,29 When such reactions occur, both reacting oxygen atoms from O2 will be given off as part of the water by-product rather than being bonded to asphalt binder molecules. Increasing aromaticity leads to higher asphalt binderene concentrations. Although Boduzynski30 used Field Ionization Mass Spectroscopy to show that the formation of asphalt binderenes does not significantly increase the true molecular weight of asphalt binder, it is clear that the increasingly polar nature of the molecules causes them to associate strongly enough to change rheological behavior as if the molecular weight had been increased. As intended when air blowing fluxes to roofing-grade asphalt binder, significant asphalt binder hardening occurs as the dehydrogenation reaction proceeds, particularly as noted by increases in high temperature R&B, viscosity or G*.
2. Asphalt binder chemists report two common organo-sulfur functionalities in newly refined
asphalt binder. Sulfur as bonded between two carbons is called a sulfide, and may be further classified as aliphatic sulfide or aromatic sulfide based on the form of carbon to which it is attached. When sulfur as bonded to two carbon atoms as part of an aromatic ring, the resulting functional group is called a thiophene. These sulfur compounds have
101
been analyzed in some detail, particularly during the Strategic Highway Research Program (SHRP), by Greene31, Mil32, Petersen33, and others.
Petersen34 showed that molecular oxygen reacts very rapidly with sulfur atoms which exist in the sulfide form. The initial product is sulfoxide, in which the sulfur remains bonded to the same two carbon atoms, but gains a double bond to an oxygen atom. In a later mechanistic step, the sulfoxide functional group can further oxidize to a disulfoxide, where the original sulfur atom picks up another double bond to a second oxygen atom. A third oxidation step can break one of the carbon-sulfur bonds to create acidic sulfur functionality. Although this third oxidation step is less common, the acidic molecules formed may be sensitive to moisture damage. Sulfur atoms in the form of thiophenes do not appear to oxidize. This is not surprising, since the electrons in the aromatic pi-orbital would block the formation of the double bonds to oxygen necessary to form sulfoxides. The oxidation of sulfide occurs during early stages of asphalt binder oxidation, and the product sulfoxide quickly reaches a steady state concentration as the sulfide available for reaction at that temperature is consumed35. If the temperature is increased, less reactive sulfide groups quickly oxidize until sulfoxides reach a new steady state concentration. Although sulfoxides are the first oxidation products to be observed as asphalt binder is exposed to molecular oxygen, this functionality has surprisingly little impact on asphalt binder rheology. Hence, the oxidation of sulfur functional groups is not considered to be a significant contributor to asphalt binder hardening.
3. Oxygen adds to carbon atoms while extracting hydrogen atoms to form water. This
reaction occurs almost exclusively at more reactive sites, such as benzylic carbons. The benzylic position defines an aliphatic carbon atom attached directly to an aromatic ring. Although most active carbon sites react to form a simple ketone, Petersen36 showed that oxidization can occur step-wise in up to three successive reaction steps.
Step 1: Formation of a carbon-oxygen double bond, or carbonyl, on the benzylic carbon, creating a benzylic ketone. Water is a by-product. Step 2: Rupture of the bond between the benzylic carbon and the second carbon in the aliphatic chain, creating a benzoic acid and an aliphatic aldehyde. Step 3: In a few cases, the formation of dicarboxylic anhydrides37, specifically located on bi-cyclic aromatic ring systems. Although the dehydration of two carboxylic acid molecules to form an anhydride is a well-documented reaction, high temperatures are usually required. Such reactions would be considered highly unusual at ambient pavement temperatures, but Petersen’s findings are definitive. The fact that Petersen only finds anhydrides attached to adjacent aromatic rings suggests that the reaction may be a direct conversion from a ketone and an acid to the anhydride without forming the second acid functionality first.
102
Kinetics and Reaction Mechanisms The reaction products of chemical oxidation, as discussed above, were studied by Dr. Claine Petersen38,39 and his fellow researchers at the Western Research Institute (WRI). However, Dr. Petersen’s original hypothesis that classic free-radical auto-oxidation mechanisms controlled the process was not supported by the reported product slate. In a kinetic study of the uptake of oxygen by bitumen dissolved in dichlorobenzene, Van Gooswilligen40 determined the reaction rate was not affected by adding free radical initiators. Moreover, the reaction rate is always first order in bitumen concentration, is dependent upon the partial pressure of oxygen (order approximately 3/5), and is reduced 50-80 percent by inorganic compounds such as KCN or azides, which are strong organo-metallic ligands and known metal catalyst poisons. The presence of a bitumen molecule, molecular oxygen, and a metal catalyst at the rate determining step clearly eliminated the oft-proposed free-radical chain mechanisms for ambient temperature asphalt binder oxidation. King41 then showed that a series of concerted oxy-cyclic reaction mechanisms could explain both the surprising reaction kinetics observed by Van Gooswilligen, as well as all oxidized carbon products found by Petersen, including the unexpected anhydrides. Furthermore, the oxy-cyclic mechanisms were able to explain catalytic activity and deactivation, as well as postulate the source of energy needed to consummate reaction steps requiring relatively high activation energies at ambient conditions. Petersen42 and WRI coworkers then conducted kinetic studies of asphalt binder oxidation over a range of temperatures, and tied their findings to the state of dispersion of the molecular microstructure. Later, Petersen and Harnsberger43 modified this point of view and discussed the possibility for dual, competing oxidations mechanisms, one of which dominates early stages of the reaction, while the second controls the slower long term reaction. Oxidation: Impact on Binder Rheology The oxidation of aliphatic carbon atoms occurs more slowly than sulfide oxidation. However, this reaction is clearly the predominant cause of pavement distress resulting from asphalt binder aging at pavement service temperatures. Ketones and organic acids, the primary reaction products, are highly polar molecules. Van der Waals forces create strong molecular associations between these and other active polar sites, thus increasing asphalt binderene content. The apparent average molecular weight of the asphalt binder increases, and its modulus/viscosity increases accordingly. More importantly, unlike all other hardening mechanisms, oxidation dramatically changes the shape of the rheological mastercurve, or “R-value.” The temperature susceptibility of the binder appears to improve as G* increases at high temperatures while remaining relatively constant at low pavement temperatures. However, the substantial flattening of the BBR’s “stiffness vs. loading time” curve indicates that the “m-value” is falling rapidly with advanced aging, as is the tensile strain at failure in the DTT test. Although the asphalt binder is indeed harder at high pavement temperatures, block cracking is more likely caused by the binder’s loss of strain tolerance when put in tension at lower pavement temperatures. Essentially, the binder becomes brittle and cracks largely because it can not flow enough to relieve stresses induced by either temperature change or traffic. This hypothesis is contrary to most published theories, including current aging models in the mechanistic-empirical design guide, which postulate increasing viscosity/stiffness to be the cause for block cracking, so it deserves further review and analysis.
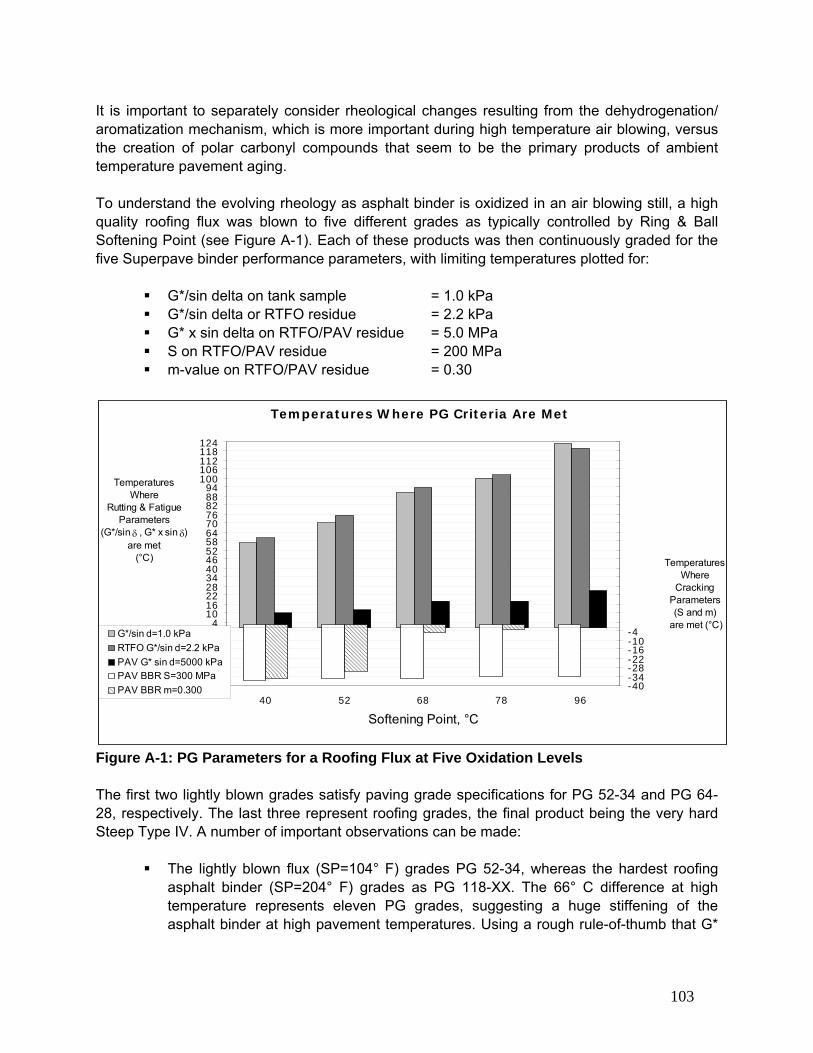
103
It is important to separately consider rheological changes resulting from the dehydrogenation/ aromatization mechanism, which is more important during high temperature air blowing, versus the creation of polar carbonyl compounds that seem to be the primary products of ambient temperature pavement aging. To understand the evolving rheology as asphalt binder is oxidized in an air blowing still, a high quality roofing flux was blown to five different grades as typically controlled by Ring & Ball Softening Point (see Figure A-1). Each of these products was then continuously graded for the five Superpave binder performance parameters, with limiting temperatures plotted for:
G*/sin delta on tank sample = 1.0 kPa G*/sin delta or RTFO residue = 2.2 kPa G* x sin delta on RTFO/PAV residue = 5.0 MPa S on RTFO/PAV residue = 200 MPa m-value on RTFO/PAV residue = 0.30
Temperatures Where PG Criteria Are Met
-38-32-26-20-14
-8-24
101622283440465258647076828894
100106112118124
40 52 68 78 96
Softening Point, °C
Temperatures Where
Rutting & Fatigue Parameters
(G*/sin δ , G* x sin δ) are met
(°C)
-40-34-28-22-16-10-428142026323844505662687480869298104110116122
Temperatures Where
Cracking Parameters (S and m)
are met (°C)G*/sin d=1.0 kPaRTFO G*/sin d=2.2 kPaPAV G* sin d=5000 kPaPAV BBR S=300 MPaPAV BBR m=0.300
Figure A-1: PG Parameters for a Roofing Flux at Five Oxidation Levels The first two lightly blown grades satisfy paving grade specifications for PG 52-34 and PG 64-28, respectively. The last three represent roofing grades, the final product being the very hard Steep Type IV. A number of important observations can be made:
The lightly blown flux (SP=104° F) grades PG 52-34, whereas the hardest roofing asphalt binder (SP=204° F) grades as PG 118-XX. The 66° C difference at high temperature represents eleven PG grades, suggesting a huge stiffening of the asphalt binder at high pavement temperatures. Using a rough rule-of-thumb that G*
104
doubles for each increase in PG grade, one would project that G* at a given high temperature had increased by 200,000 percent (211 x 100).
Although changes in G* at high temperature are huge, evolution in binder stiffness at the lowest pavement temperatures is amazingly small. Blowing to the steep grade increased the limiting stiffness by approximately 30 percent, a change of about 2°C or 1/3 PG grade at low temperature.
Even though stiffness changes at low temperature are barely significant, binder relaxation properties as defined by m-value are altered dramatically. Air-blowing from a soft paving grade PG 52-34 to the somewhat harder PG 64-28 (R&B=125 F) increased the critical temperature for “m-value” by 5°C, representing a loss of just under one PG grade at low temperature. However, as the flux is blown further to PG 88, the “m-value collapses, and its critical temperature moves above -5°C. This evolution in “m-value” with increasing oxidation to PG 88 represents a loss of 30°C in the quality of the PG grade at low temperatures, an amount about twenty times greater than related changes in low temperature stiffness. Using standard AASHTO M-320 protocols, the BBR is no longer able to accurately measure “m-value” as R&B approaches 154° F. At the temperature where the m-value reaches its critical level (0.30), the binder stiffness is so low that the beam deflects beyond BBR equipment limitations in the defined sixty second testing time. One can only make very rough projections for “m-value” as the binder further oxidizes to PG 118. The fact that a steep-grade has poor relaxation properties is evident, as it shatters like a lump of coal when struck with a hammer at ambient temperature.
Because oxidation impacts limiting temperatures for BBR stiffness and m-value so differently, the evaluation of S versus m control (TS – Tm) becomes a useful parameter for monitoring the oxidation process. As this difference becomes increasingly negative, induced stresses accumulate faster to cause cracking.
Although it is clear that binder relaxation properties are greatly reduced following oxidation in blowing stills, one cannot assume that carbonyls formed during pavement aging will have the same impact on rheology as the polycyclic aromatics formed by dehydrogenation reactions during high temperature processing. Comparable increases in high temperature rheology are widely reported, but the concurrent changes in m-value or tensile failure strain are less well understood. Given the observations from the air blowing experiment described earlier, the evolving difference between critical temperatures for S and m-value provide a good starting point for comparing rheology for the different oxidation mechanisms. As one excellent example, the previously mentioned TTI report43 plots Limiting Stiffness Temperature versus Limiting m-Value Temperature to track two asphalt binders as they are aged under increasingly severe conditions. The slopes of the two aging curves are approximately parallel, but much flatter than the equi-temperature line, indicating that m-value is deteriorating much faster than low temperature stiffness. Although the relative relationships between S and m are evolving in a similar manner for the two binders, the actual change in the limiting temperature for S and m respectively varied markedly for the two asphalt binders under similar aging conditions. Domke’s PhD thesis44, which was part of this same study, includes data for more binders aged up to 60 hours in the PAV. All data is consistent with the conclusion that the limiting T-critical for m-value is falling rapidly, whereas BBR stiffness changes very little.
105
Domke converts m-value into an m-value index, which expresses changes as an m-value ratio after/before aging. Based upon relatively small percentage changes in m-value, Domke’s first summary conclusion in Chapter 3 of his paper is that oxidative aging does not significantly affect the BBR stiffness or m-value. This finding represents a common mistake in many literature citations, and needs clarification. It is important to remember that a loss of 0.01 in m-value, or a change of 3.3 percent near the spec limit, increases the limiting low temperature for m-value by approximately 1.2° C. Hence, an increase of 15 percent in m-value means one full PG grade loss, whereas that same percentage increase in low temperature stiffness would cause the critical stiffness temperature to change by only 1° C. Although Domke’s m-index tables can be useful for determining which asphalt binders are most sensitive to m-value aging, the m-index can be misleading. It is very important to transform all reported data into temperatures or modeled failure criteria that correspond to environmental or pavement performance conditions before drawing conclusions regarding their relative impact. As a perfect example, Dr. Charles Gloveri (53) reanalyzed Domke’s data, and showed definitively that extended PAV aging causes the critical temperature for the “m-value” to fall much faster than stiffness. One can observe in Figure A-2 below that two different asphalts lose approximately 5°C in “m-value” for each 1°C lost in stiffness as PAV aging continues at 100°C.
Aging curve
Figure A-2: S critical temperature vs “m-value” critical temperature with PAV aging Another example comes from a recent thermo-oxidation study of a Columbian asphalt in a rheo-reactorii. A rheo-reactor continuously measures the rheology of the asphalt as it is oxidizes at 250°C. Although this elevated temperature (typical of air-blowing) changes the oxidation reaction mechanism to produce more aromatic molecules than would be expected at high
106
pavement temperatures, it does offer insight as to evolving physical changes that occur with oxygen uptake. As the asphalt ages, plots of G* vs phase angle (Black Space Diagrams) indicate a marked change in rheological behavior towards lower phase angles for any given modulus (see Figure A-3). That means the oxidized asphalt is less viscous, or more brittle, at any given stiffness. The change in phase angle is greatest at lower temperatures. This finding is consistent with Glover’s observations using PAV and the Bending Beam Rheometer (BBR).
Figure A-3: Black Space Diagram for Unaged and Aged asphalts in a Rheo-Reactor Only small quantities of bitumen can be extracted from very thin surface slices of 6” field cores. BBR tests require larger test specimens, rendering this test impractical as a tool for predicting the potential onset of block cracking. DSR tests require much less binder when tested in parallel plate geometry, but compliance problems and specimen debonding from the plate have limited this test to temperatures above 0°C. Ongoing research at the Western Research Institute (Turner) and the University of Wisconsin (Bahia) suggests that DSR test methods can be extended to BBR temperatures, either by using smaller diameter plates (4 mm) with compliance corrections or by using CAM rheological models to predict low temperate modulus and phase angle from intermediate temperature measurements. Should either of these approaches be successful, it will be important to develop Black Space analyses of PAV-aged and field-aged asphalt rather than thermally oxidized binders. Although newer rheological tools measure both hardness and relaxation properties, the unexpected evolution of these low temperature relaxation properties has not been appropriately

107
included in various cracking theories, particularly as driven by age-related initiation and propagation of block cracking. This could be done with low temperature rheology, with direct tension tests, or by using fracture mechanics. Below are some trends in binder or HMA physical characteristics that should be observed at low pavement temperatures as the asphalt ages:
5. Greater “m” control in the BBR. 6. Lower phase angles for a given modulus when plotting dynamic shear rheometer (DSR)
results in Black Space. 7. Lower failure strains and lower failure strength in direct tension tests. 8. Lower fracture energy when using fracture tests such as the Disk-Shaped Compact
Tension Test (DCT) or semi-circular bending (see Chapter 5).
108
REFERENCES 1. Vallerga, B.A., “Pavement Deficiencies Related to Asphalt Durability”, AAPT, V.50, 1981,
pp. 481-491 2. Vallerga, B.A.; Monismith, C.L. and Granthem, K., “A Study of Some Factors Influencing
the Weathering of Paving Asphalts”. AAPT, vol. 26, 1957 3. Finn, F.N. (1967). National Cooperative Highway Research Program Report 39: Factors
Involved in the Design of Asphaltic Pavement Surfaces. National Cooperative Highway Research Program, Transportation Research Board, National Research Council. Washington, D.C.
4. Roberts, F.L.; Kandhal, P.S.; Brown, E.R.; Lee, D.Y. and Kennedy, T.W. (1996). Hot Mix Asphalt Materials, Mixture Design, and Construction. National Asphalt Pavement Association Education Foundation. Lanham, MD
5. Bahia, H.U. and Anderson, D.A. "Low-Temperature Physical Hardening of Asphalt Cements," Proceeding of the International Symposium for Chemistry of Bitumen, Rome (Italy),June 5-8, 1991.
6. Bahia, H.U. and Anderson, D.A. "Glass Transition Behavior and Physical Hardening of Asphalt Binders," AAPT, Vol. 62, 1993, pp. 93-129.
7. Masson, J.F., Polomark, G.M. and Collins, P., “Time-Dependent Microstructure of Bitumen and Its Fractions by Modulated Differential Scanning Calorimetry”, Report NRCC-45, Energy & Fuels, V. 16, 2002, pp. 470-476
8. Anderson, D.A., Christensen, D.W. and Bahia, H., “Physical Properties of Asphalt Cement and the Development of Performance-Related Specifications”, AAPT, V. 60, 1991, pp. 437-532
9. Brule, B. Planche, J. P., King, G., Claudy, P. and Letoffe, J. M., “Characterization of Paving Asphalts by Differential Scanning Calorimetry”, Fuel Science & Technology International, Vol. 9, 1991, pp. 71-92.
10. Brulé, B.; Planche, J.P.; King, G.N.; Claudy, P.; Létoffé, J.M. “A New Interpretation of Time-Dependent Physical Hardening in Asphalt Based on DSC and Optical Thermoanalysis,” ACS, Washington, D.C. 1992
11. Claudy, P.; Létoffé, J.M.; Germanaud, L.; King, G.N.; Planche, J.P.; Ramond, G.; Such, C.; Buisine, J.M.; Joly, G.; Edlanio, A, “Thermodynamic Behavior and Physico-Chemical Analysis of the Eight SHRP Bitumens,” TRB, Washington, D.C., 1993
12. Harrison, I.R., Wang, G. and Hsu, T.C., “A Differential Scanning Calorimetry Study of Asphalt Binders”, SHRP A/UFR-92-612, 1992, pp. 1-49
13. Basu, A., M.O. Marasteanu, and S.A.M. Hesp. Time-Temperature Superposition and Physical Hardening Effects in Low-Temperature Asphalt Binder Grading. Transportation Research Record: Journal of the Transportation Research Board, No. 1829, pp. 1-7, 2003.
14. Yee, P., B. Aida, S.A.M. Hesp, P. Marks, and K.K. Tam. Analysis of Three Premature Pavement Failures. Submitted to Journal of the Transportation Research Board, 2006.
15. Petersen, J. C., “Chemical Composition of Asphalt as Related to Asphalt Durability: State-of-the Art”, Transp. Res. Rec., V. 999, 1984, pp. 13-30
16. Huang, S.C., Robertson, R, Branthaver J. and McKay, J., Study of Steric Hardening Effect on Thin Asphalt Films in Presence of Aggregate Surface”, Trans. Res. Rec. #1661, 1999, pp. 15-21
17. McKay, J.F., D.E. Walrath, R.E. Robertson, and M.N. Cavalli, 2001, "Effect of Aggregates on Isothermal (Steric) Hardening of Asphalts." Road Materials and Pavement Design, 2 (2): 2001: 195-204
109
18. Hardin, J.R., Ban, S.D., and Schweyer, H.E., “Rheology of Asphalt Emulsion Residues”, AAPT, V. 48, 1979, p. 65
19. King, G.N., Lesueur, D., Planche, J.P., and King, H.W., “Using SHRP Procedures to Evaluate High Float and Polymer Bitumen Emulsion Residues,” World Emulsion Congress, Paris, 1993
20. Petersen, J.C., “Chemical Composition of Asphalt as Related to Asphalt Durability-State of-the-Art”, Transp. Res. Rec., V. 999, 1984, pp. 13-30.
21. Kemp, G.R. and Predoehl, N.H., “A Comparison of Field and Laboratory Environments on Asphalt Durability”, AAPT, 1981, pp. 492-560
22. Anderson, D.A, Christensen, D.W., Bahia, H.U., Dongre, R, Sharma, M.G, and Antle, C.E., “Binder Characterization and Evaluation: Volume 3 – Physical Characterization”, SHRP report 369, reference Ch. 5 “Oxidative Aging Studies”, 1993, pp. 303-401
23. Anderson, D.A, Christensen, D.W., Bahia, H.U., Dongre, R, Sharma, M.G, and Antle, C.E., “Binder Characterization and Evaluation: Volume 3 – Physical Characterization”, SHRP report 369, reference Ch. 5 “Oxidative Aging Studies”, 1993, pp. 303-401
24. Pedley, J.F., Hiley, R.W., and Hancock, R.A., “Storage Stability of Petroleum-Derived Diesel Fuel 4. Synthesis of Sediment Precursor Compounds and Simulation of Sediment Formation Using Model Systems”, Fuel, V. 68, 1989, pp. 27-31
25. Jennings, P.W., Pribanic, J.A., Raub, M.F., Smith, J.A., and Mendes, T.M., “Advanced High Performance Gel Permeation Chromatography Methodology”, SHRP Report #630, 1993, pp 1-132
26. Glover, Davison, Domke, Ruan, Juristyarini, Knorr, and Jung, “Development of a New Method for Assessing Asphalt Binder Durability with Field Evaluation”, FHWA/TX report #05-1872-2, August 2005, pp.1-334.
27. Jennings, P.W., Pribanic, J.A., Desando, M.A., Raub, M.F., Stewart, F., Hoberg, J. and Moats, R., “Binder Characterization and Evaluation by Nuclear Magnetic Resonance Spectroscopy”, SHRP report A-335, 1993, pp. 1-150
28. Hardee, J.R., “Physical and Chemical Characteristics of SuperPave Binders Containing Air-Blown Asphalt”, Final Report MBTC 2049 prepared for the Arkansas State Highway and Transportation Department, Henderson State Univ.
29. Boduzynski, M.M., McKay, J.F. and Latham, D.R., “Asphaltenes- - Where are You?”, AAPT, V. 49, 1980, p. 123
30. Greene, J., Yu, S., Pearson, C. and Reynolds, J., “Analysis of Sulfur Compound Types in Asphalt”, SHRP Report A-667, 1993, pp 1-51
31. Mill, T. Tse, B.L., Yao, C.D., and Canaresi, E., “Oxidation Pathways for Asphalt”, Preprints, American Chemical Society – Division of Fuel Chemistry, V. 37, 1992, pp. 1367-1375
32. Branthaver, J.F., Petersen, J.C., Robertson, R.E. Duvall, J.J, Kim, S.S., Harnsberger, P.M., Mill, T., Ensley, E.K., Barbour, F.A., and Schrabron, J.F., “Binder Characterization and Evaluation: Volume II – Chemistry”, SHRP report A-368, 1993, pp 1-597
33. Petersen, J.C., “Oxidation of Sulfur Compounds in Petroleum Residues: Reactivity-Structural Relationships and Reaction Kinetics”, Confab 82: Fossil Fuel Chem. Energy., Saratoga, WY, 1982
34. Petersen, J.C., Dorrence, M.N., Plancher, H. and Barbour, F.A., “Oxidation of Sulfur Compounds in Petroleum Residues: Reactivity-Structural Relationships”, Preprint, American Chemical Society – Division of Petroleum Chemistry, 1981
35. Petersen, J.C., Dorrence, S.M., Nazir, M., Plancher, H. and Barbour, F.A., “Oxidation of Sulfur compounds in Petroleum Residues: Reactivity – Structural Relationships”, ACS Petroleum Division Preprints, 1981, pp. 898-906
110
36. Petersen, J.C., “Quantitative Functional Group Analysis of Asphalts Using Differential Infrared Spectrometry and Selective Chemical Reactions – Theory and Application”, TRB preprint, 1986
37. Petersen, J.C., Barbour, F.A., and Dorrence, S.M., “Identification of Dicarboxylic Anhydrides in Oxidized Asphalts”, Analytical Chemistry, V. 47, 1975, pp. 107-111
38. Petersen, J.C., “Quantitative Functional Group Analysis of Asphalts Using Differential Infrared Spectrometry and Selective Chemical Reactions – Theory and Application”, TRB preprint, 1986
39. Van Gooswilligen, G., Berger, H., and De Bats, F.T., “Oxidation of Bitumens in Various Tests”, Eurobitume Proceedings, 1985, pp. 95-101
40. King, G.N., “Oxycyclics: Understanding Catalyzed Oxidation Mechanisms in Bitumen and Other Petroleum Products”, Fuel Science and Technology International, V. 11(1), 1993, pp. 201-238
41. Petersen, J.C., Branthaver, J.F., Robertson, R.E., Harnsberger, P.M., Duvall, J.J. and Ensley, E.K., “Effects of Physicochemical Factors on Asphalt Oxidation”, Transportation Research Record, V. 1391, 1993, pp. 1-10
42. Petersen, J.C. and Harnsberger, P.M., “Asphalt Aging: Dual Oxidation Mechanism and Its Interrelationships with Asphalt Composition and Oxidative Age Hardening”, Transportation Research Board Record 1638, 1998, pp. 47-55
43. Glover, Davison, Domke, Ruan, Juristyarini, Knorr, and Jung, “Development of a New Method for Assessing Asphalt Binder Durability with Field Evaluation”, FHWA/TX report #05-1872-2, August 2005, figure 3-30, p.3-39
44. Domke, C.H., “Asphalt Compositional Effects on Physical and Chemical Properties”, Dissertation submitted to Texas A&M University, 1999, pp. 1-1971
45. Kemp, G.R. and Predoehl, N..H.., “A Comparison of Field and Laboratory Environments on Asphalt Durability”, AAPT, 1981, pp. 492-560
46. 1 Predoehl, N.H. and Kemp, G.R., “An Investigation of the Effectiveness of Asphalt Durability Tests – Initial Phase”, Caltrans Laboratory Research Report FHWA-CA-78-26, 1978
47. Wegman, D., Weigel, J. and Forsberg, A., “Collaborative Evaluations of Low Temperature SuperPave PG Asphalt Binders,” TRB Research Record, V. 1661, 1999, 12 pp.
48. Wegman, D., Weigel, J. and Forsberg, A., “Evaluations of Low Temperature SuperPave PG
49. Huang, S.C., Petersen, J.C., Robertson, R.E., Branthaver, J.F., “Effect of Hydrated Lime on Long-term Oxidative Aging Characteristics of Asphalt”, TRB Record 1810, 2002, pp. 18-24
50. James, A.D. and Stewart, D., “The Use of Fatty-Amine Derivatives to Slow Down the Age-Hardening Process in Bitumen”, Proceeding of the International Symposium for Chemistry of Bitumen, Rome (Italy), 1991. pp. 671-684
51. Emery, J.J., “Evaluation and Mitigation of Top-Down Pavement Cracking”, Transportation Conference of Canada - 2006 Annual Meeting, Charlottetown PEI, 2006, 15 pp.
52. Bell, C., “Aging of Asphalt-Aggregate Systems”, SHRP report 305, 1989, 121 pp. 53. Glover, C., et.al., FHWA/TX Report 05/1872-2 54. Vargas, X.A., Afanasjeva, N., Alvarez, M., Marchal, P.H., and Choplin, L., “Asphalt
Rheology Evolution Through Thermo-oxidation (aging) in a Rheo-reactor”, Fuel, Vol. 87, 2008, pp. 3018-3023

111
- -APPENDIX B –
GEOGRAPHICAL EXTENT OF HMA AIRFIELDS EXHIBITING NON-LOAD RELATED DISTRESS - DATA SOURCES
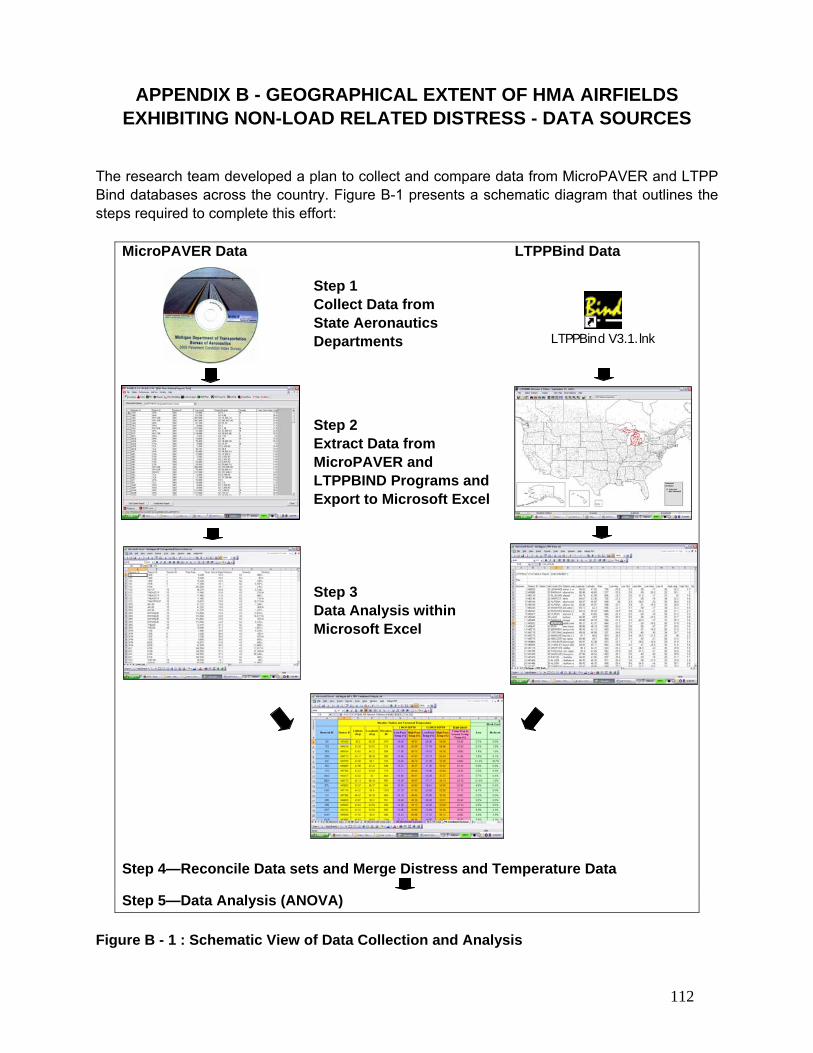
112
APPENDIX B - GEOGRAPHICAL EXTENT OF HMA AIRFIELDS EXHIBITING NON-LOAD RELATED DISTRESS - DATA SOURCES
The research team developed a plan to collect and compare data from MicroPAVER and LTPP Bind databases across the country. Figure B-1 presents a schematic diagram that outlines the steps required to complete this effort:
MicroPAVER Data
Step 1 Collect Data from State Aeronautics Departments
LTPPBind Data
Step 2 Extract Data from MicroPAVER and LTPPBIND Programs and Export to Microsoft Excel
Step 3 Data Analysis within Microsoft Excel
Step 4—Reconcile Data sets and Merge Distress and Temperature Data
Step 5—Data Analysis (ANOVA) Figure B - 1 : Schematic View of Data Collection and Analysis
LTPPBind V3.1.lnk

113
Step 1—Data Collection As part of this effort, 42 State Aeronautics Departments were contacted to determine whether they could participate in this phase of the project. Of the 42 states contacted, it was determined that 33 states used some kind of PMS to manage their airport system. The research team requested PMS data from 32 of these states. One state, Oklahoma, used a one-of-a-kind PMS that was developed in-house. Due to the unique nature of the PMS, we did not request data from the State of Oklahoma. Of the 32 requests for data, the research team received MicroPAVER data from 18 states. This means that 14 states did not participate in the research effort. Unfortunately, the data received from three states was not usable, leaving the team with usable MicroPAVER data from 15 states. In two cases, the MicroPAVER data files were damaged and could not be read by the research team’s MicroPAVER program. In the third case, the data file contained only one airport. The team recognized that receiving data from 15 states would likely provide a large enough sample with which to work since they represented all of the climatic and geographic regions within the US. For the 15 states with valid and usable data, the team had access to more than 1,099 airports. Not all of these airports were constructed of HMA surfaces. Indeed, some were not even paved at all. Others were constructed entirely out of concrete. Furthermore, many of the airports constructed of asphalt binder pavements did not exhibit the non-load related distresses that are the focus of this project. After filtering out the non-relevant airports, this data collection effort netted a total of 800 airports containing valid data from 15 states across the US. In the end, the data collection efforts resulted in a good size sample from which to complete the remainder of the task. Figure B-2 provides a graphic representation of which states supplied the MicroPAVER data together with the number of airfields in each state.
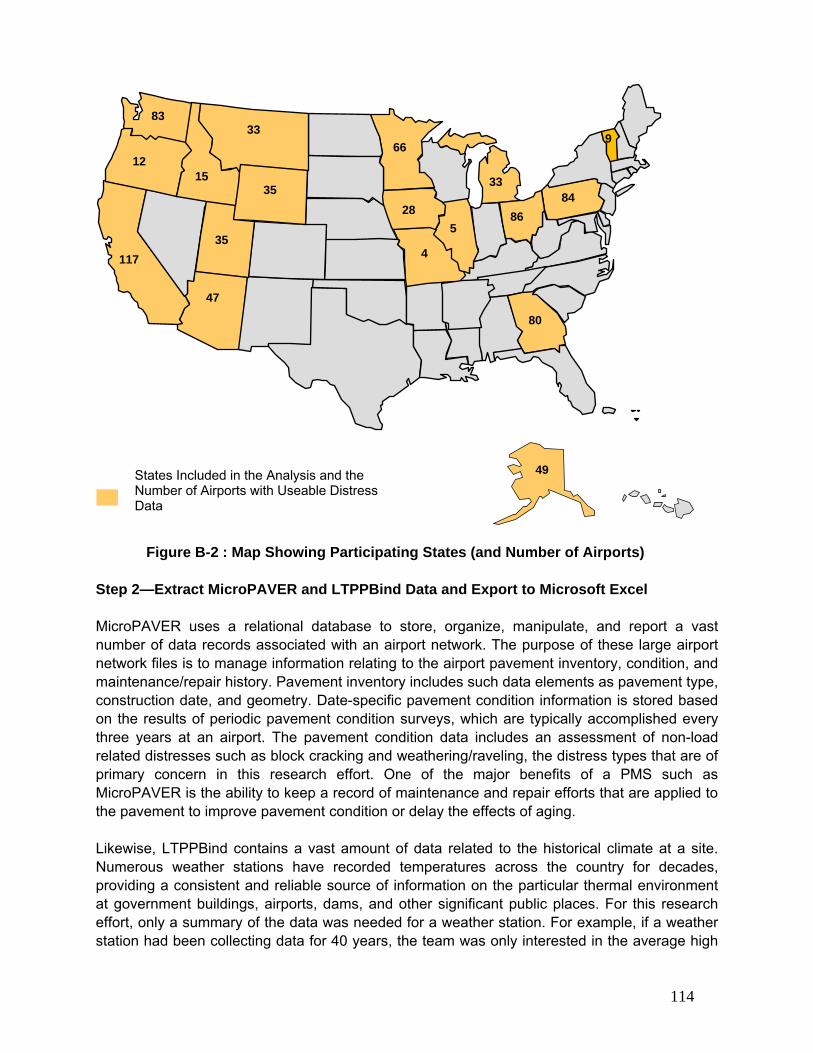
114
Step 2—Extract MicroPAVER and LTPPBind Data and Export to Microsoft Excel MicroPAVER uses a relational database to store, organize, manipulate, and report a vast number of data records associated with an airport network. The purpose of these large airport network files is to manage information relating to the airport pavement inventory, condition, and maintenance/repair history. Pavement inventory includes such data elements as pavement type, construction date, and geometry. Date-specific pavement condition information is stored based on the results of periodic pavement condition surveys, which are typically accomplished every three years at an airport. The pavement condition data includes an assessment of non-load related distresses such as block cracking and weathering/raveling, the distress types that are of primary concern in this research effort. One of the major benefits of a PMS such as MicroPAVER is the ability to keep a record of maintenance and repair efforts that are applied to the pavement to improve pavement condition or delay the effects of aging. Likewise, LTPPBind contains a vast amount of data related to the historical climate at a site. Numerous weather stations have recorded temperatures across the country for decades, providing a consistent and reliable source of information on the particular thermal environment at government buildings, airports, dams, and other significant public places. For this research effort, only a summary of the data was needed for a weather station. For example, if a weather station had been collecting data for 40 years, the team was only interested in the average high
States Included in the Analysis and the Number of Airports with Useable Distress Data
47
35
33
49
117
12 15
83
66
35
80
33
86 84
9
28
4
5
Figure B-2 : Map Showing Participating States (and Number of Airports)
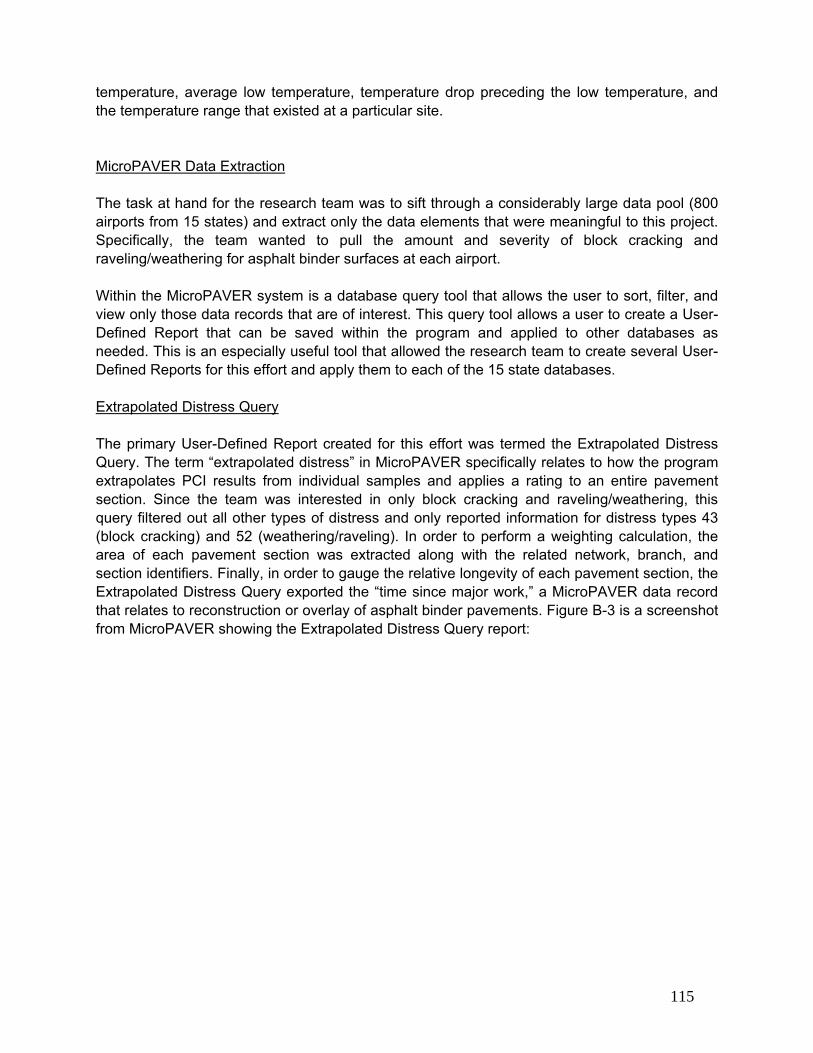
115
temperature, average low temperature, temperature drop preceding the low temperature, and the temperature range that existed at a particular site. MicroPAVER Data Extraction The task at hand for the research team was to sift through a considerably large data pool (800 airports from 15 states) and extract only the data elements that were meaningful to this project. Specifically, the team wanted to pull the amount and severity of block cracking and raveling/weathering for asphalt binder surfaces at each airport. Within the MicroPAVER system is a database query tool that allows the user to sort, filter, and view only those data records that are of interest. This query tool allows a user to create a User-Defined Report that can be saved within the program and applied to other databases as needed. This is an especially useful tool that allowed the research team to create several User-Defined Reports for this effort and apply them to each of the 15 state databases. Extrapolated Distress Query The primary User-Defined Report created for this effort was termed the Extrapolated Distress Query. The term “extrapolated distress” in MicroPAVER specifically relates to how the program extrapolates PCI results from individual samples and applies a rating to an entire pavement section. Since the team was interested in only block cracking and raveling/weathering, this query filtered out all other types of distress and only reported information for distress types 43 (block cracking) and 52 (weathering/raveling). In order to perform a weighting calculation, the area of each pavement section was extracted along with the related network, branch, and section identifiers. Finally, in order to gauge the relative longevity of each pavement section, the Extrapolated Distress Query exported the “time since major work,” a MicroPAVER data record that relates to reconstruction or overlay of asphalt binder pavements. Figure B-3 is a screenshot from MicroPAVER showing the Extrapolated Distress Query report:
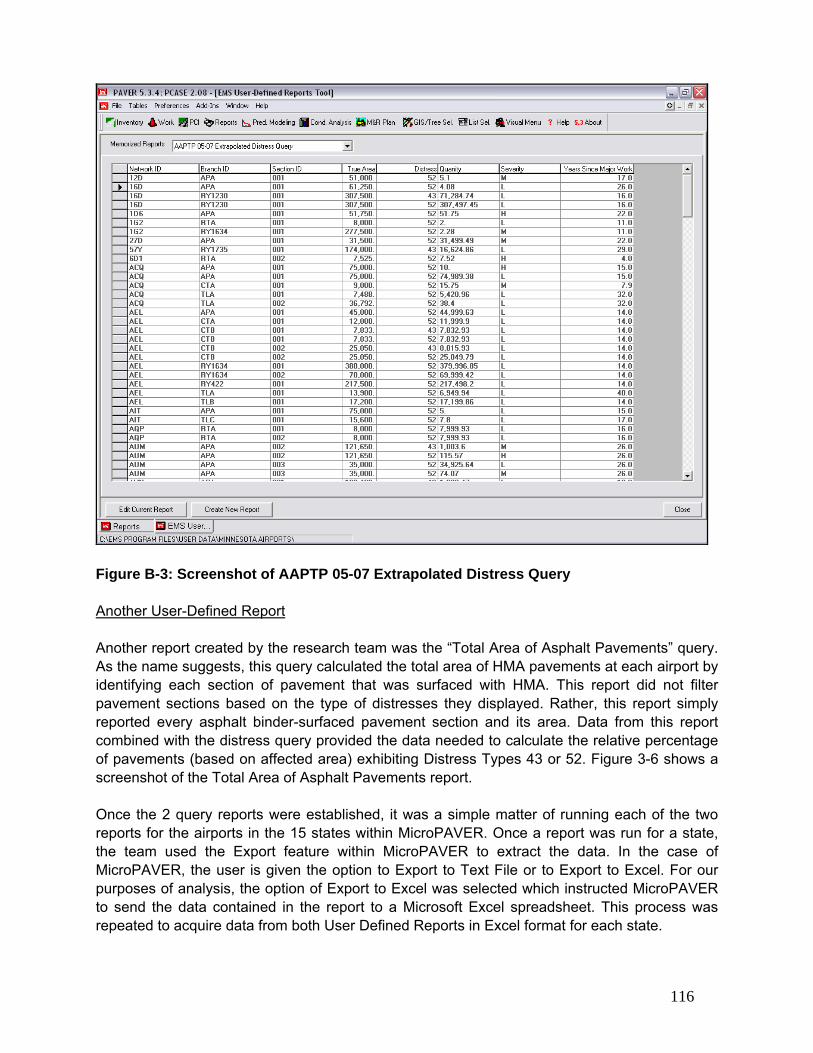
116
Figure B-3: Screenshot of AAPTP 05-07 Extrapolated Distress Query Another User-Defined Report Another report created by the research team was the “Total Area of Asphalt Pavements” query. As the name suggests, this query calculated the total area of HMA pavements at each airport by identifying each section of pavement that was surfaced with HMA. This report did not filter pavement sections based on the type of distresses they displayed. Rather, this report simply reported every asphalt binder-surfaced pavement section and its area. Data from this report combined with the distress query provided the data needed to calculate the relative percentage of pavements (based on affected area) exhibiting Distress Types 43 or 52. Figure 3-6 shows a screenshot of the Total Area of Asphalt Pavements report. Once the 2 query reports were established, it was a simple matter of running each of the two reports for the airports in the 15 states within MicroPAVER. Once a report was run for a state, the team used the Export feature within MicroPAVER to extract the data. In the case of MicroPAVER, the user is given the option to Export to Text File or to Export to Excel. For our purposes of analysis, the option of Export to Excel was selected which instructed MicroPAVER to send the data contained in the report to a Microsoft Excel spreadsheet. This process was repeated to acquire data from both User Defined Reports in Excel format for each state.
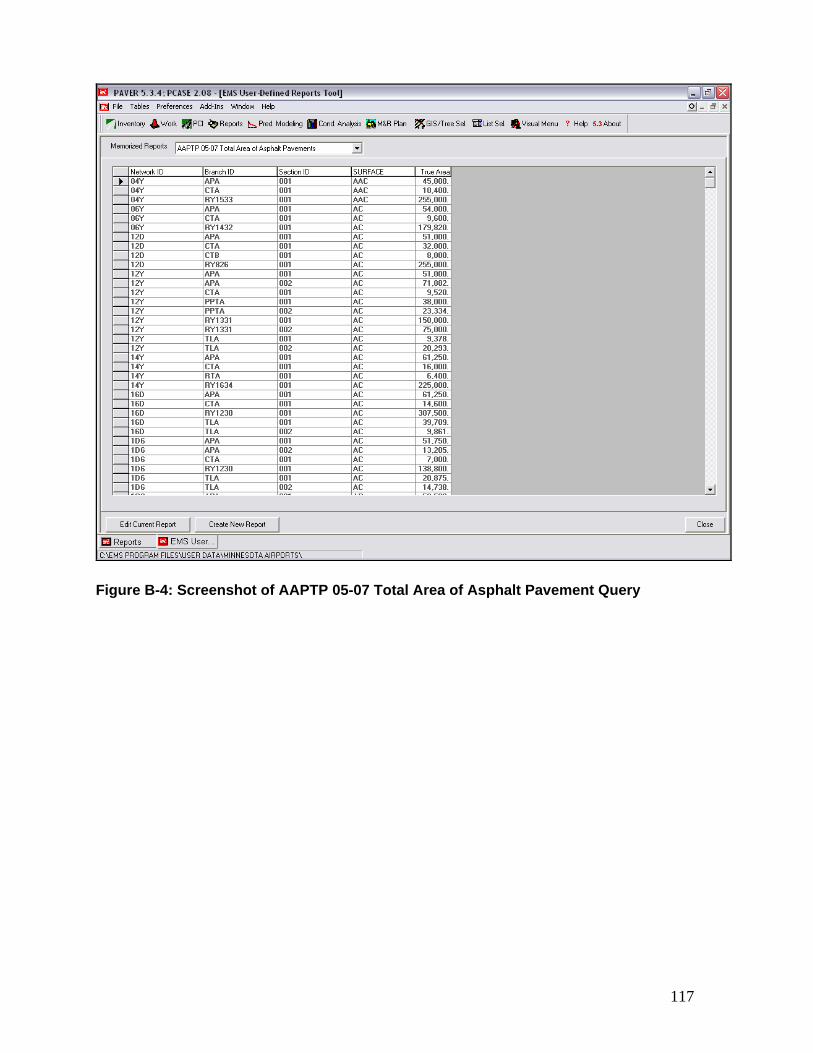
117
Figure B-4: Screenshot of AAPTP 05-07 Total Area of Asphalt Pavement Query
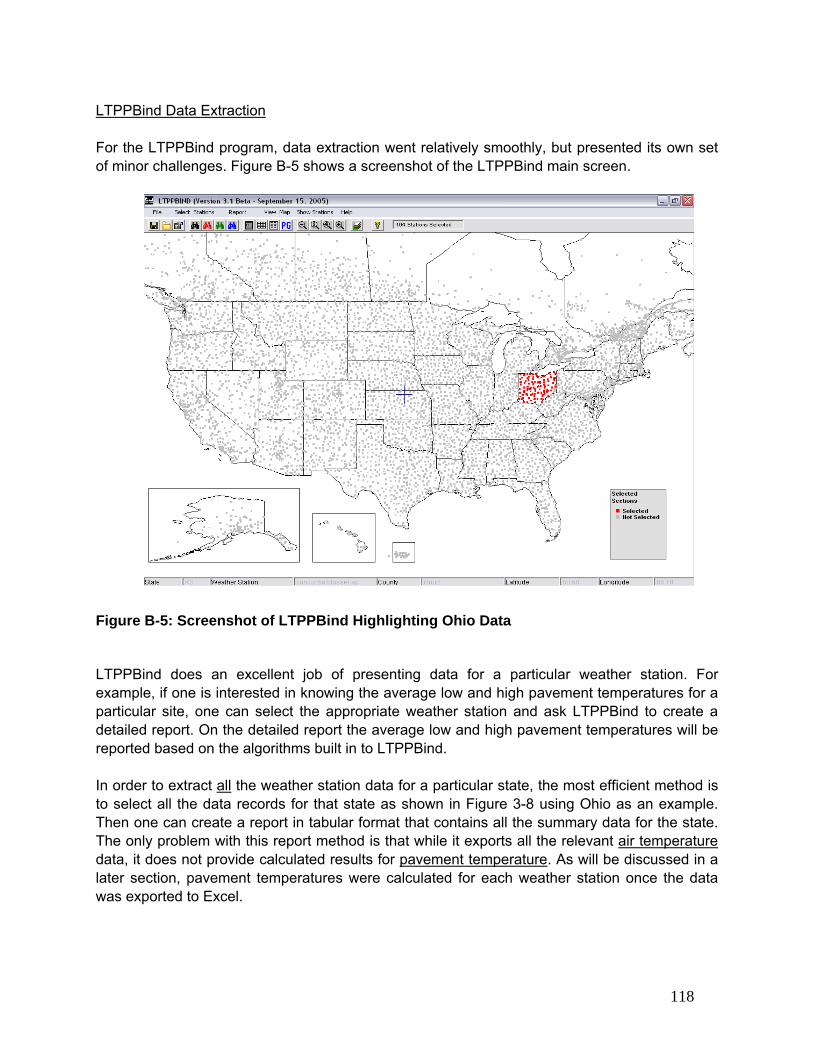
118
LTPPBind Data Extraction For the LTPPBind program, data extraction went relatively smoothly, but presented its own set of minor challenges. Figure B-5 shows a screenshot of the LTPPBind main screen.
Figure B-5: Screenshot of LTPPBind Highlighting Ohio Data
LTPPBind does an excellent job of presenting data for a particular weather station. For example, if one is interested in knowing the average low and high pavement temperatures for a particular site, one can select the appropriate weather station and ask LTPPBind to create a detailed report. On the detailed report the average low and high pavement temperatures will be reported based on the algorithms built in to LTPPBind. In order to extract all the weather station data for a particular state, the most efficient method is to select all the data records for that state as shown in Figure 3-8 using Ohio as an example. Then one can create a report in tabular format that contains all the summary data for the state. The only problem with this report method is that while it exports all the relevant air temperature data, it does not provide calculated results for pavement temperature. As will be discussed in a later section, pavement temperatures were calculated for each weather station once the data was exported to Excel.
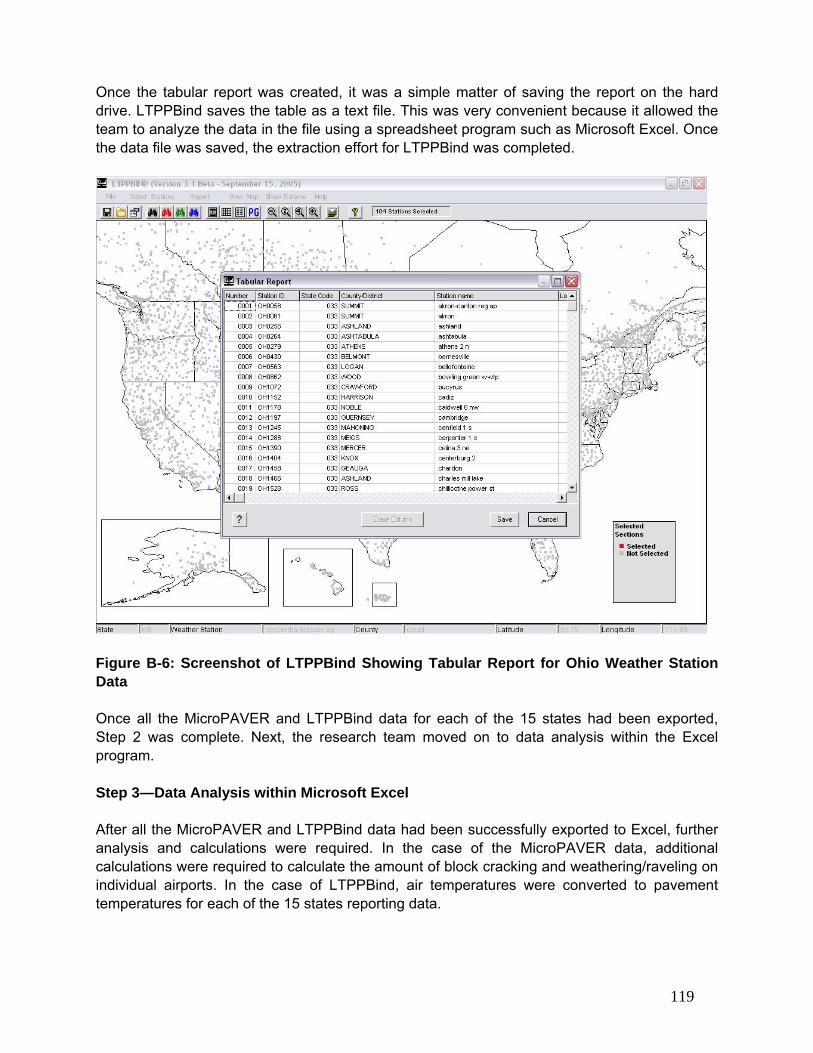
119
Once the tabular report was created, it was a simple matter of saving the report on the hard drive. LTPPBind saves the table as a text file. This was very convenient because it allowed the team to analyze the data in the file using a spreadsheet program such as Microsoft Excel. Once the data file was saved, the extraction effort for LTPPBind was completed.
Figure B-6: Screenshot of LTPPBind Showing Tabular Report for Ohio Weather Station Data Once all the MicroPAVER and LTPPBind data for each of the 15 states had been exported, Step 2 was complete. Next, the research team moved on to data analysis within the Excel program. Step 3—Data Analysis within Microsoft Excel After all the MicroPAVER and LTPPBind data had been successfully exported to Excel, further analysis and calculations were required. In the case of the MicroPAVER data, additional calculations were required to calculate the amount of block cracking and weathering/raveling on individual airports. In the case of LTPPBind, air temperatures were converted to pavement temperatures for each of the 15 states reporting data.
120
Pavement Distress Percentage Working within the Microsoft Excel spreadsheet, the research team analyzed the pavement distress data exported from MicroPAVER. The objective was to ascertain the quantity of block cracking and weathering/raveling at each airport to determine the percentage of HMA pavements exhibiting such distresses throughout the United States. To that end, several calculations were required to sum pavement distress data reported for each section to first determine the accumulated distress in each branch, and then for the entire airport pavement network. One important goal of these calculations is to establish a single number that indicates the relative amount of block cracking or weathering/raveling on each airport.
For the purposes of this research project, it is important to recognize that the team chose to find the percentage of HMA pavements at each airport that exhibited either block cracking or weathering/raveling. Since MicroPAVER reports actual dimensions (i.e. square feet), it was necessary to extract the area of each section in order to calculate the percentage of distressed pavement within that section. In order to properly weigh damage, it was also necessary to determine the total HMA surface area within each feature (i.e., taxiway, runway, etc.) as well as for the entire airport. Once the total area of HMA pavements was known for an airport, it was a straightforward calculation to determine the percentage of HMA pavements exhibiting low, moderate, or high severity block cracking or weathering/raveling.
Temperature Data Analysis LTPPBind temperature data reporting the historical average air temperature data for each weather station in the database was exported to a Microsoft Excel spreadsheet. LTPPBind algorithms were then included in the spreadsheet to convert air temperature data to corresponding low and high pavement temperatures at any depth for each site. The pertinent algorithms are clearly documented in the LTPPBind Help File. Asphalt oxidation, the primary cause for block cracking, occurs most rapidly near the pavement surface. To better relate climate to the onset or severity of block cracking and weathering/raveling, it was decided to calculate pavement temperature at a depth of 0.5 inch rather than at the 2 inch depth that is typically used in LTPPBind. This was readily accomplished by adjusting the depth factor in the LTPPBind low and high temperature algorithms to 12.5mm (0.5 inch). With the weighting calculations complete for the pavement distress data and the pavement temperature calculations complete for the climate data, the research team was ready to move to the next step, reconciling the two databases to assign pavement distress and temperature data to the same airport.

121
Step 4—Reconcile Data Sets and Merge Distress and Temperature Data This task compares the pavement distress data for an airport to that airport’s historical average pavement temperatures. While this sounds straightforward, one of the more difficult tasks of this project was coming to agreement on which weather stations in LTPPBind matched the airport network in MicroPAVER. At this stage of the project, the extracted data resided on Microsoft Excel spreadsheets. The pavement distress data from MicroPAVER usually had some descriptive information that identified the name of the airport. For example, within the Minnesota airport system, one airport network is identified as 1G2. The descriptive information within MicroPAVER further describes this airport as Granite Falls Airport. With a brief Internet search, the place name can be confirmed and latitude and longitude coordinates can be obtained. If needed, further identifying information such as city, county, and elevation is readily available on the Internet, The LTPPBind pavement temperature database lists dozens, or sometimes hundreds, of weather stations per state. Some type of identifying code, as well as latitude, longitude, and elevation of each weather station is provided along with some descriptive text. The team sifted through the hundreds of weather stations to find an appropriate match for each airport network. In some cases, the weather stations were located right at an airport of interest and the names of the two were close enough that the relationship was evident. For example, while comparing data for airports in Minnesota, a weather station identified as “crookston nw exp stn” in LTPPBind was found to be a likely match to an airport with a network name of “CROOKSTON” in the MicroPAVER database. Based on the relative similarity of the names and descriptions used for these data points and a check of the latitude/longitude coordinates, the research team concluded that these two site locations matched. In other cases, though, the process of matching records from the two databases was not as straightforward as described above. In another example from Minnesota, the MicroPAVER database shows an airport named “BLUE EARTH MUNICIPAL AIRPORT.” Given the clear description of the airport with the name of the city, it would appear to be an easy task to find the matching weather station within the LTTPBind database. On the initial review, none of the weather stations matched the MicroPAVER description. It took further analysis of latitude and longitude coordinates to pin down a relationship between “BLUE EARTH MUNICIPAL AIRPORT” and a weather station identified as “MN9046” with a description of “winnebago" in Faribault County Minnesota. It should be noted that an exact match could not always be established, because not all local airports have official weather stations. In such cases, a “reasonably close” weather station that should provide similar temperature data was selected so that all pertinent pavement distress data could be included in the analysis. The “reasonably close” standard might mean just a few miles away or it might mean within the same county. In some areas of the country a multitude of weather stations were available to choose from. In others, one weather station had to be used for several airports within a county. The areas of greatest concern for data reliability fall in regions where there might be significant differences in altitude between the airport and the

122
weather station. These cases were the exception, not the rule. In most cases, the team established a clear relationship between an airport and a weather station. Figure B-7 shows a screenshot of a merged Excel file that represents the culmination of the data collection, extraction, and merging efforts. These 15 resultant worksheets, one for each state, allow a comparative analysis of 800 airports across the country. As shown in the figure, each row of data represents a single airport with a unique Airport ID code. As one scans across the spreadsheet, one can see that each row contains both the historical climate data with low and high pavement temperatures calculated for a depth of 0.5 inches. Scanning further to the right one sees that a summary of the pavement distresses observed on the asphalt binder pavements is displayed on each row. This single sheet allows the team to conduct a comparative analysis of distress data across an entire state.
Figure B-7: Screenshot of Merged Distress and Temperature Data
Airport ID
Temperature Data
Distress Data
123
APPENDIX C
INITIAL OUTLINE FOR GUIDE FOR PREVENTION AND MITIGATION OF NON-LOAD RELATED DISTRESS
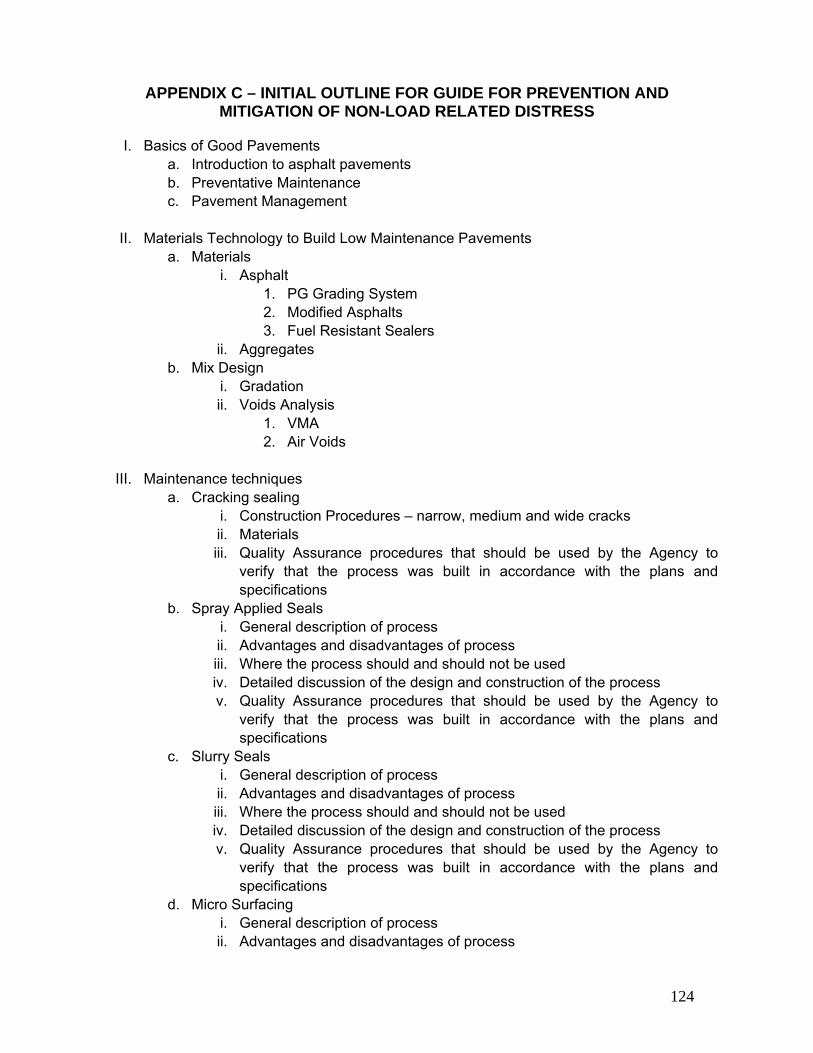
124
APPENDIX C – INITIAL OUTLINE FOR GUIDE FOR PREVENTION AND MITIGATION OF NON-LOAD RELATED DISTRESS
I. Basics of Good Pavements
a. Introduction to asphalt pavements b. Preventative Maintenance c. Pavement Management
II. Materials Technology to Build Low Maintenance Pavements a. Materials
i. Asphalt 1. PG Grading System 2. Modified Asphalts 3. Fuel Resistant Sealers
ii. Aggregates b. Mix Design
i. Gradation ii. Voids Analysis
1. VMA 2. Air Voids
III. Maintenance techniques a. Cracking sealing
i. Construction Procedures – narrow, medium and wide cracks ii. Materials iii. Quality Assurance procedures that should be used by the Agency to
verify that the process was built in accordance with the plans and specifications
b. Spray Applied Seals i. General description of process ii. Advantages and disadvantages of process iii. Where the process should and should not be used iv. Detailed discussion of the design and construction of the process v. Quality Assurance procedures that should be used by the Agency to
verify that the process was built in accordance with the plans and specifications
c. Slurry Seals i. General description of process ii. Advantages and disadvantages of process iii. Where the process should and should not be used iv. Detailed discussion of the design and construction of the process v. Quality Assurance procedures that should be used by the Agency to
verify that the process was built in accordance with the plans and specifications
d. Micro Surfacing i. General description of process ii. Advantages and disadvantages of process
125
iii. Where the process should and should not be used iv. Detailed discussion of the design and construction of the process v. Quality Assurance procedures that should be used by the Agency to
verify that the process was built in accordance with the plans and specifications
e. Chip seals i. General description of process ii. Advantages and disadvantages of process iii. Where the process should and should not be used iv. Detailed discussion of the design and construction of the process v. Quality Assurance procedures that should be used by the Agency to
verify that the process was built in accordance with the plans and specifications
f. Cape seals i. General description of process ii. Advantages and disadvantages of process iii. Where the process should and should not be used iv. Detailed discussion of the design and construction of the process v. Quality Assurance procedures that should be used by the Agency to
verify that the process was built in accordance with the plans and specifications
i ii


![Luftwaffe Airfields 1935-45 Austria (1937 Borders) - Austria [1937 Borders].pdf · Luftwaffe Airfields 1935-45 Airfields Austria (1937 borders) Introduction Preface The Germans marched](https://img.pdfslide.us/doc/110x75/5b67ba067f8b9a68538b8c0b/luftwaffe-airfields-1935-45-austria-1937-borders-austria-1937-borderspdf.jpg)