Embed Size (px)
Citation preview
Prohibition or profit motive?Competing visions for the endgame
Global Forum on Nicotine6th June 2015
Clive BatesCounterfactual
www.clivebates.com

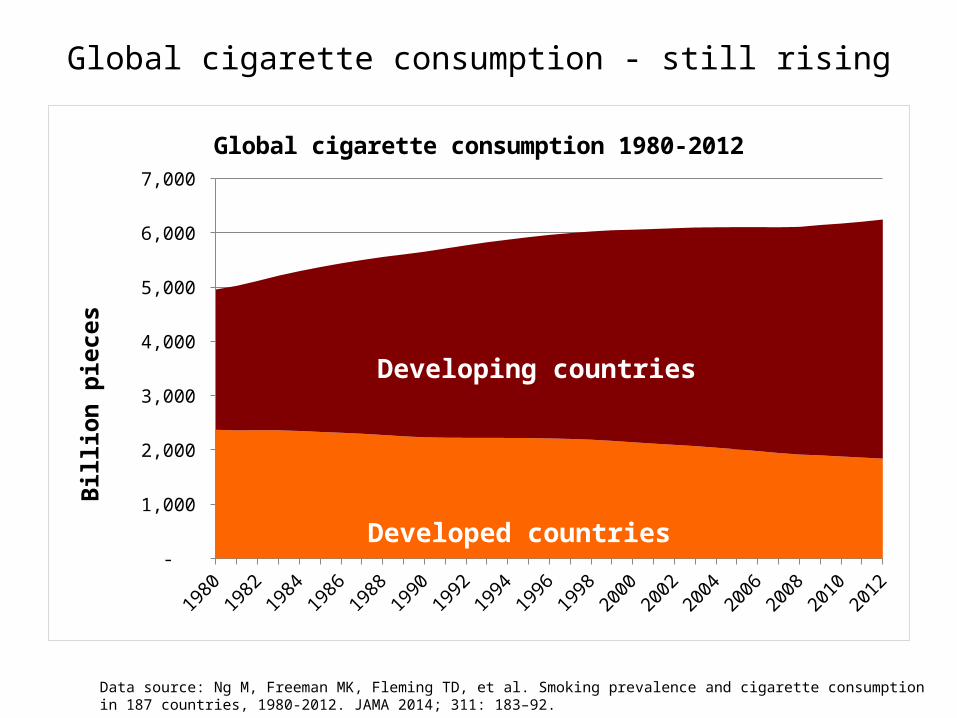
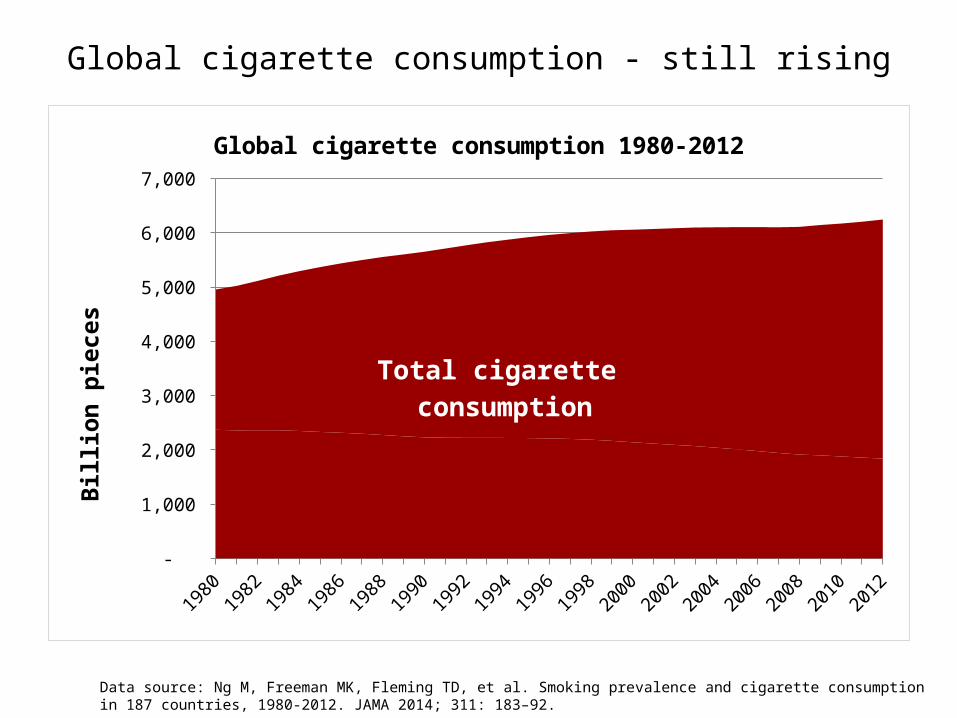
Global cigarette consumption - still rising
Data source: Ng M, Freeman MK, Fleming TD, et al. Smoking prevalence and cigarette consumption in 187 countries, 1980-2012. JAMA 2014; 311: 183–92.
19801982
19841986
19881990
19921994
19961998
20002002
20042006
20082010
2012 -
1,000
2,000
3,000
4,000
5,000
6,000
7,000
Global cigarette consumption 1980-2012
Billi
on p
iece
s
Total cigarette consumption
Global cigarette consumption - still rising
Data source: Ng M, Freeman MK, Fleming TD, et al. Smoking prevalence and cigarette consumption in 187 countries, 1980-2012. JAMA 2014; 311: 183–92.
19801982
19841986
19881990
19921994
19961998
20002002
20042006
20082010
2012 -
1,000
2,000
3,000
4,000
5,000
6,000
7,000
Global cigarette consumption 1980-2012
Billi
on p
iece
s
Developing countries
Developed countries

The Big Idea
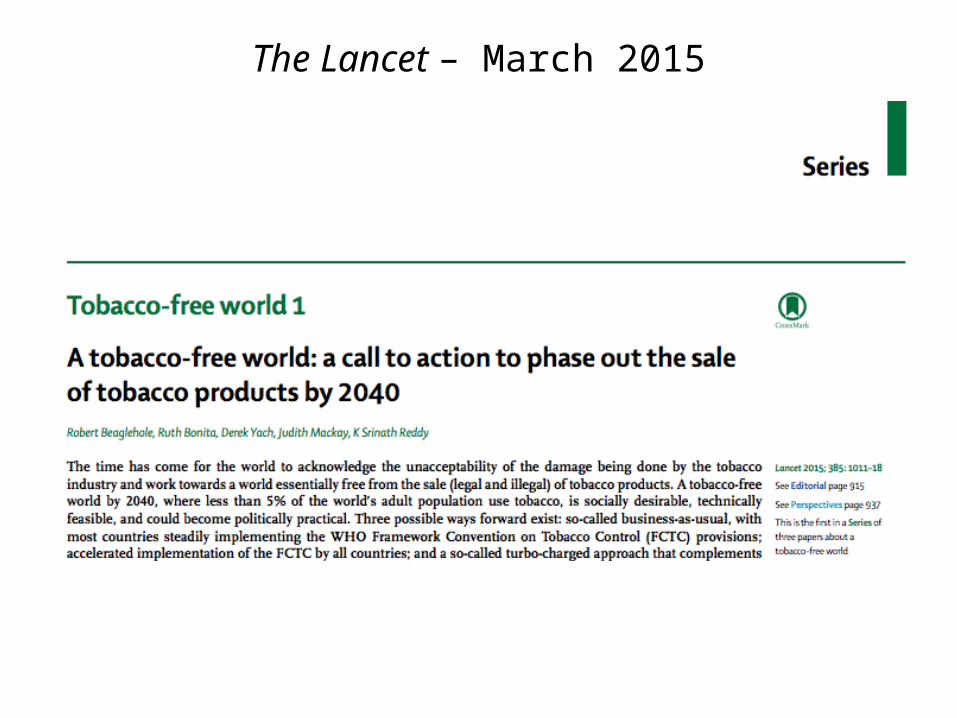
The Lancet – March 2015
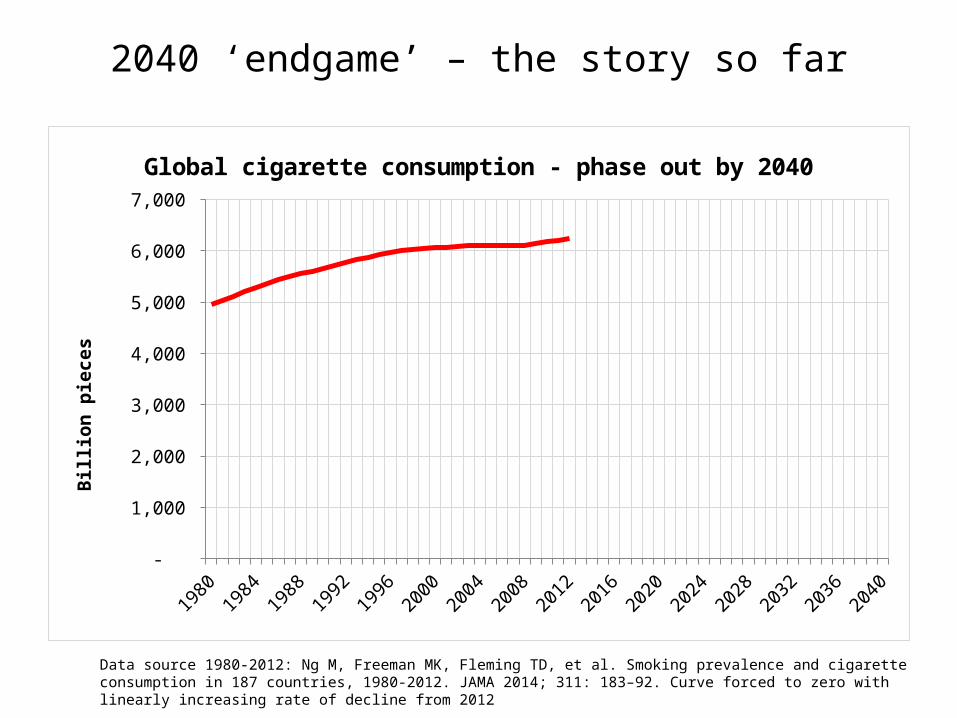
2040 ‘endgame’ – the story so far
Data source 1980-2012: Ng M, Freeman MK, Fleming TD, et al. Smoking prevalence and cigarette consumption in 187 countries, 1980-2012. JAMA 2014; 311: 183–92. Curve forced to zero with linearly increasing rate of decline from 2012
19801983
19861989
19921995
19982001
20042007
20102013
20162019
20222025
20282031
20342037
2040 -
1,000
2,000
3,000
4,000
5,000
6,000
7,000
Global cigarette consumption - phase out by 2040
Billi
on p
iece
s
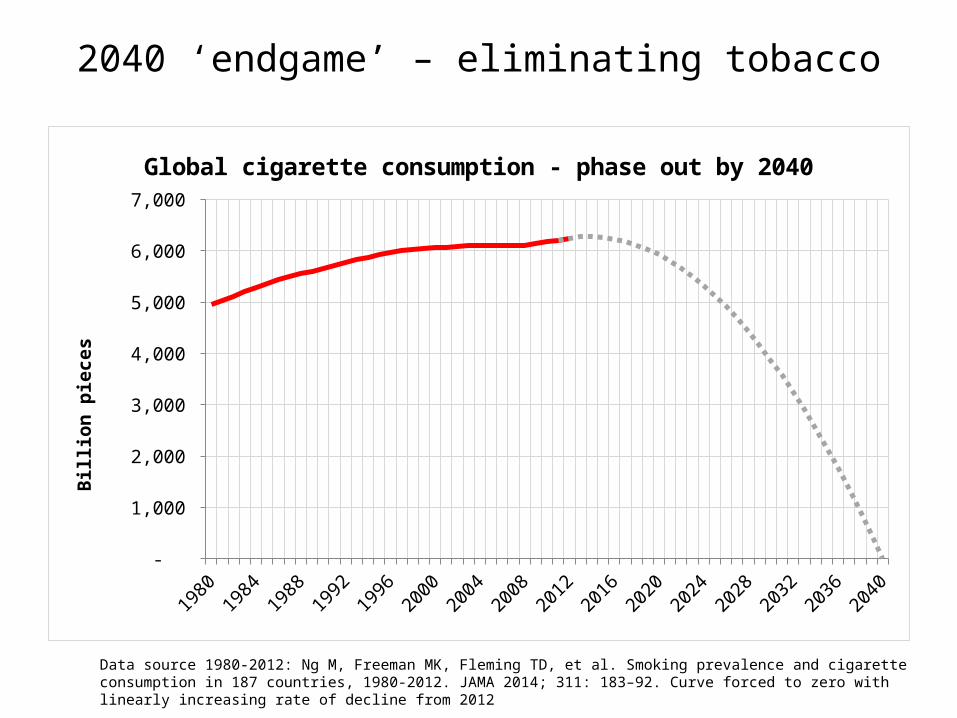
2040 ‘endgame’ – eliminating tobacco
Data source 1980-2012: Ng M, Freeman MK, Fleming TD, et al. Smoking prevalence and cigarette consumption in 187 countries, 1980-2012. JAMA 2014; 311: 183–92. Curve forced to zero with linearly increasing rate of decline from 2012
19801983
19861989
19921995
19982001
20042007
20102013
20162019
20222025
20282031
20342037
2040 -
1,000
2,000
3,000
4,000
5,000
6,000
7,000
Global cigarette consumption - phase out by 2040
Billi
on p
iece
s
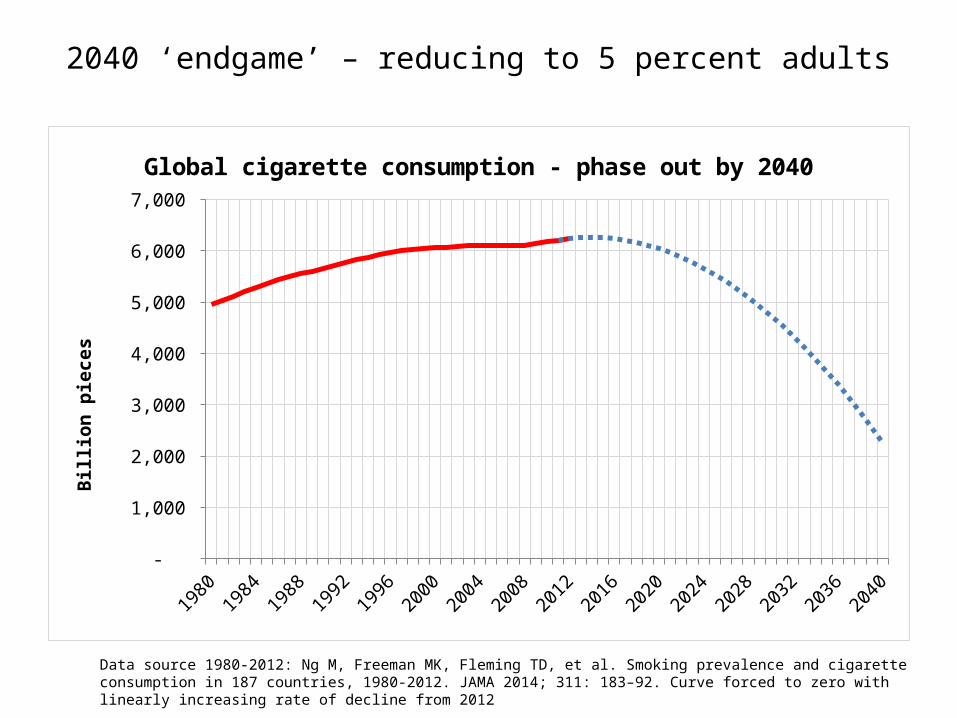
2040 ‘endgame’ – reducing to 5 percent adults
Data source 1980-2012: Ng M, Freeman MK, Fleming TD, et al. Smoking prevalence and cigarette consumption in 187 countries, 1980-2012. JAMA 2014; 311: 183–92. Curve forced to zero with linearly increasing rate of decline from 2012
19801983
19861989
19921995
19982001
20042007
20102013
20162019
20222025
20282031
20342037
2040 -
1,000
2,000
3,000
4,000
5,000
6,000
7,000
Global cigarette consumption - phase out by 2040
Billi
on p
iece
s
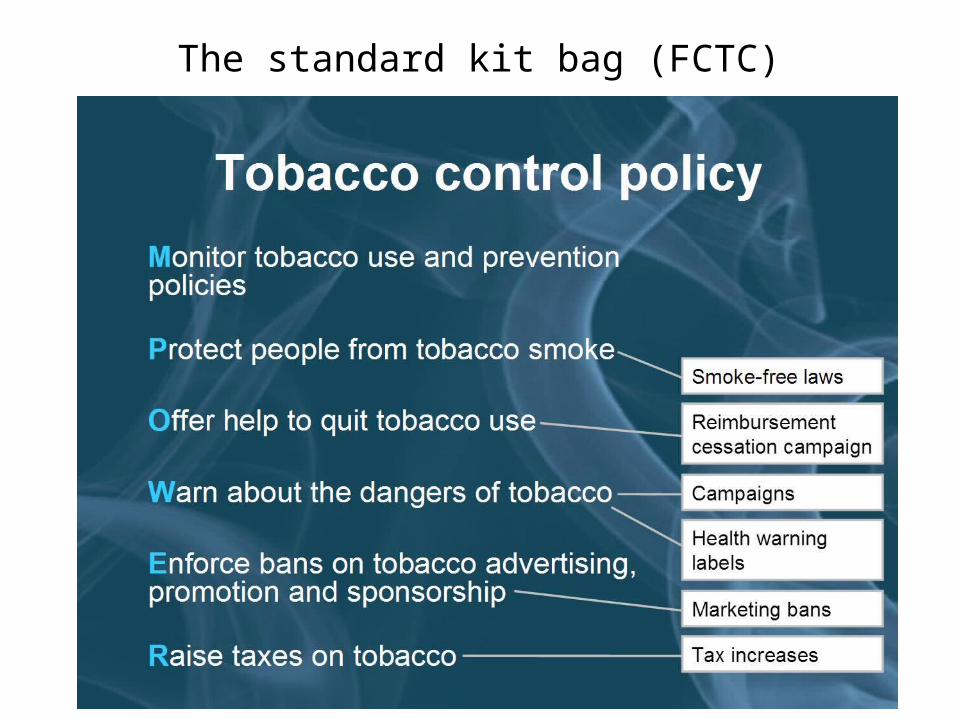
The standard kit bag (FCTC)
Endgame through prohibition
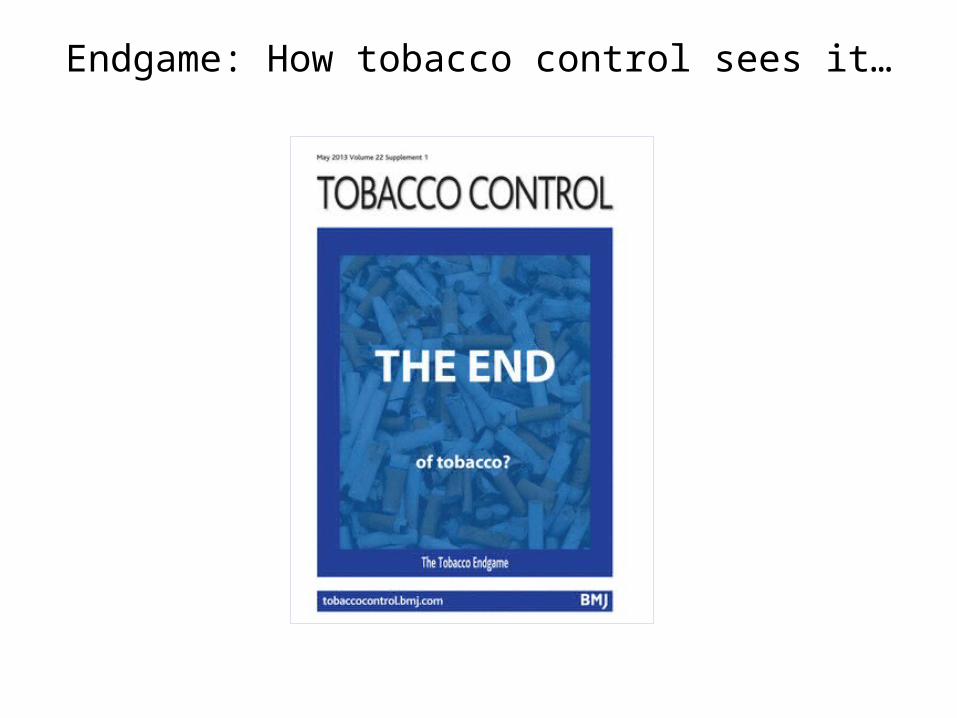
Endgame: How tobacco control sees it…
1. Prohibition
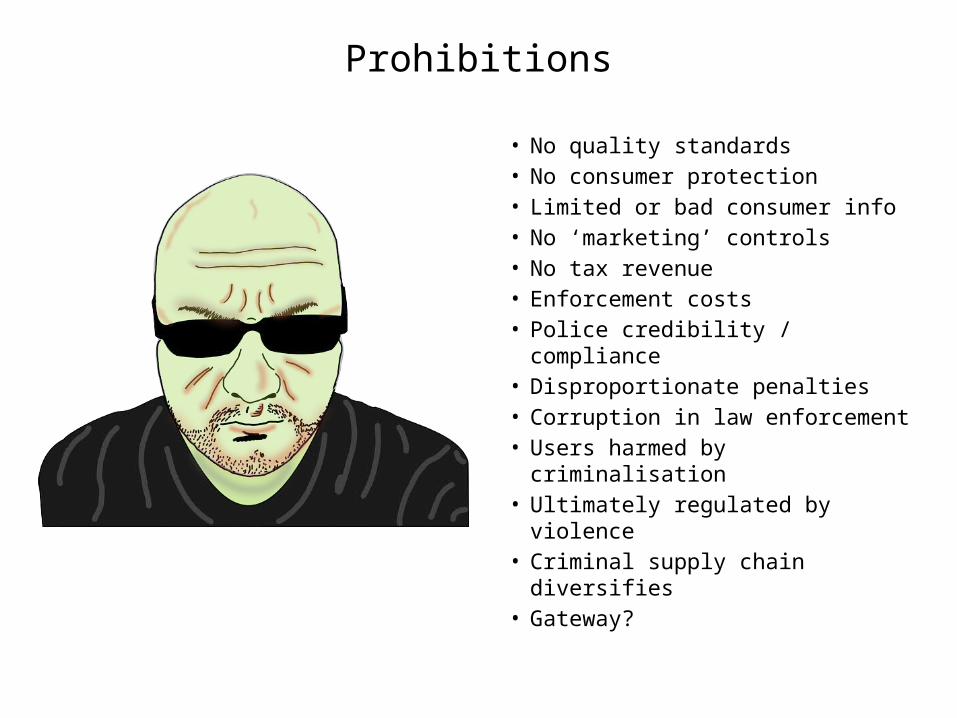
Prohibitions
• No quality standards• No consumer protection• Limited or bad consumer info• No ‘marketing’ controls• No tax revenue• Enforcement costs• Police credibility / compliance• Disproportionate penalties• Corruption in law enforcement• Users harmed by criminalisation• Ultimately regulated by violence• Criminal supply chain diversifies• Gateway?
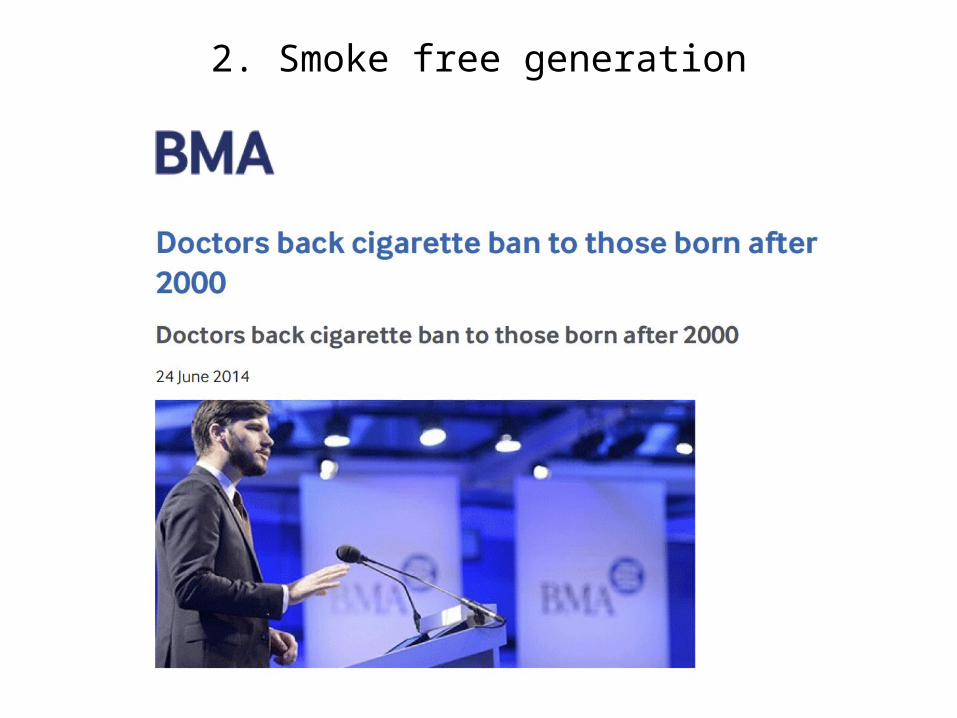
2. Smoke free generation
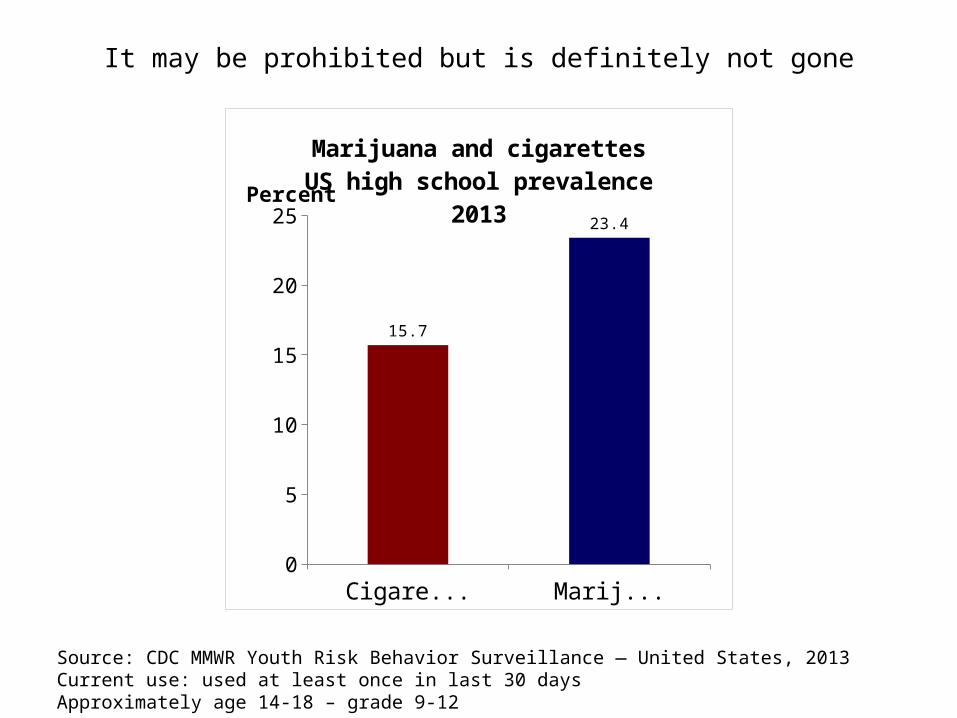
It may be prohibited but is definitely not gone
Cigarettes Marijuana0
5
10
15
20
25
15.7
23.4
Marijuana and cigarettesUS high school prevalence 2013
Percent
Source: CDC MMWR Youth Risk Behavior Surveillance — United States, 2013Current use: used at least once in last 30 daysApproximately age 14-18 – grade 9-12
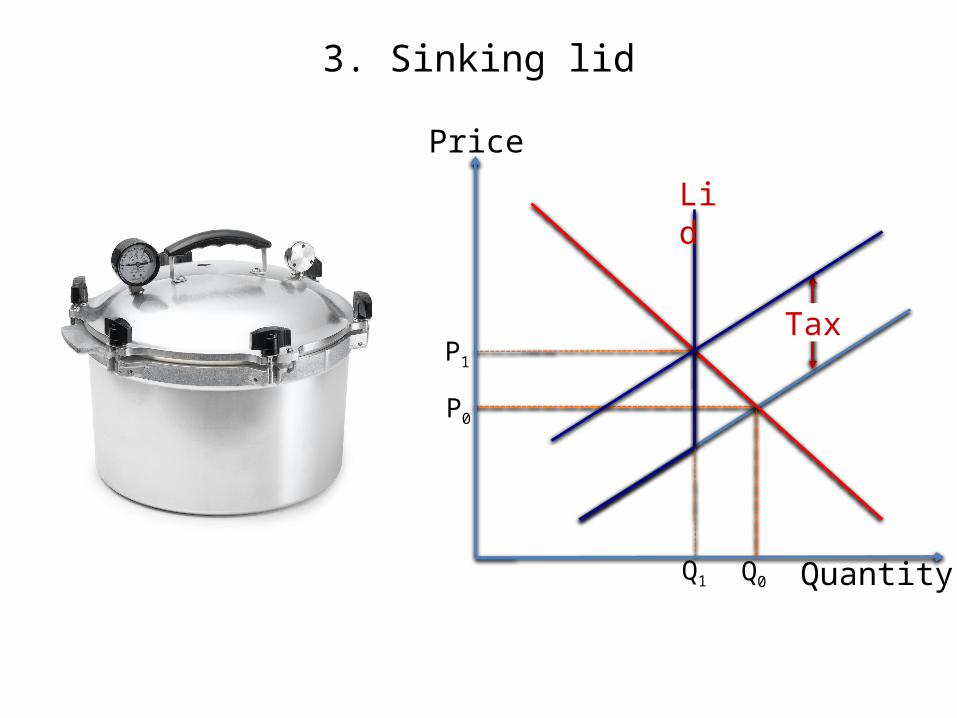
3. Sinking lid
Q0
P0
P1
Q1 Quantity
Price
Lid
Tax
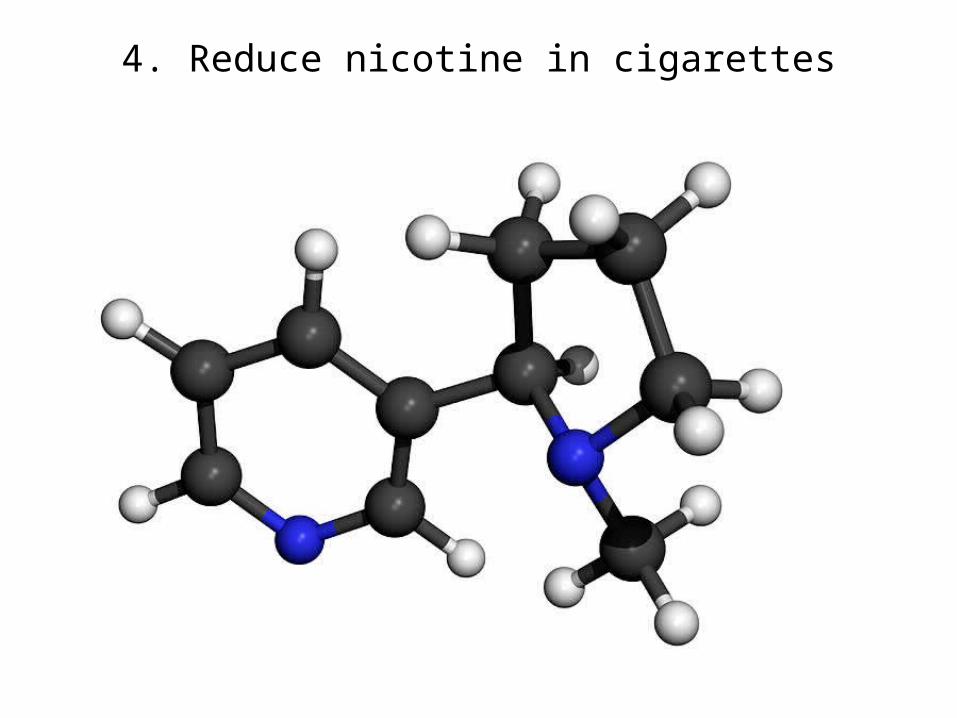
4. Reduce nicotine in cigarettes

5. Expropriation
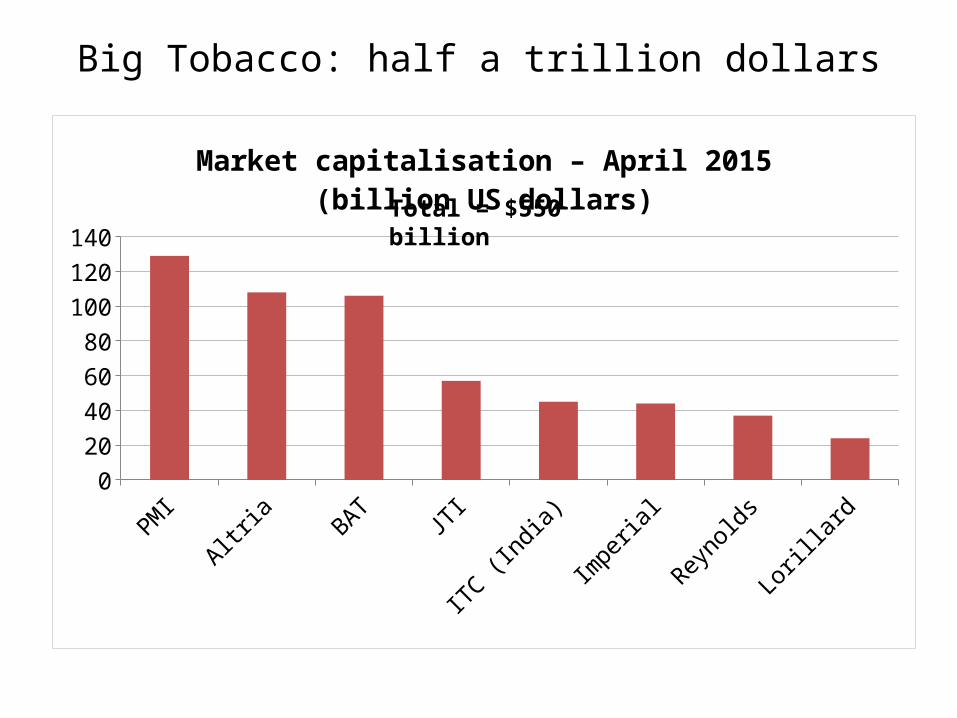
Big Tobacco: half a trillion dollars
PMI Altria BAT JTI ITC (India)
Imperial Reynolds Lorillard0
20
40
60
80
100
120
140
Market capitalisation – April 2015 (billion US dollars)
Total = $550 billion
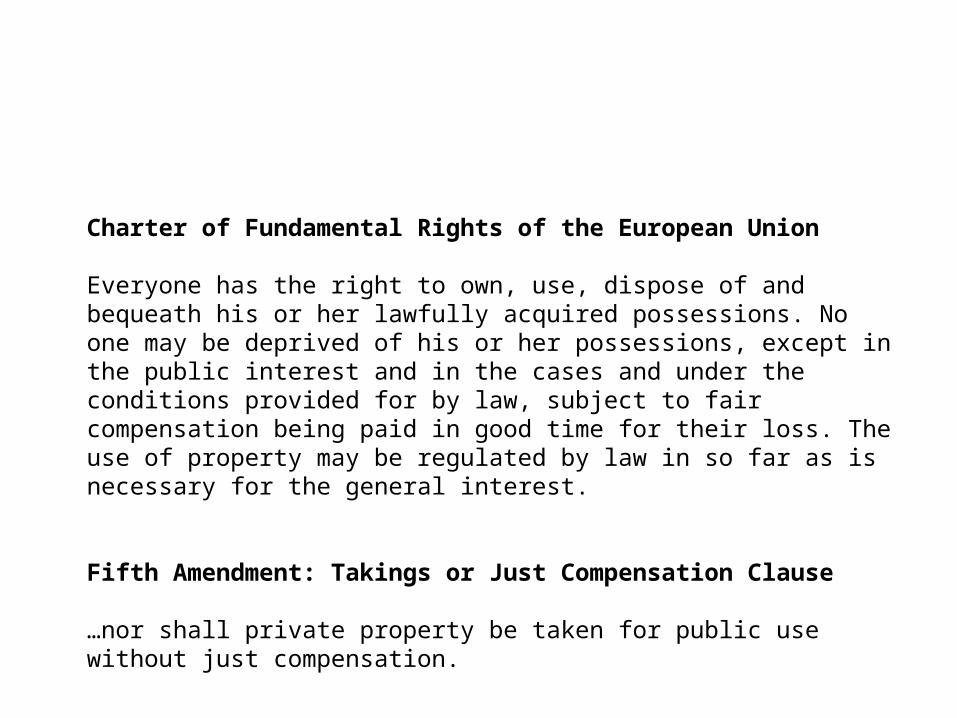
Charter of Fundamental Rights of the European Union
Everyone has the right to own, use, dispose of and bequeath his or her lawfully acquired possessions. No one may be deprived of his or her possessions, except in the public interest and in the cases and under the conditions provided for by law, subject to fair compensation being paid in good time for their loss. The use of property may be regulated by law in so far as is necessary for the general interest.
Fifth Amendment: Takings or Just Compensation Clause
…nor shall private property be taken for public use without just compensation.
What’s the right thing to do?
Right thing to do?• Legitimate objective• Appropriate relationship between citizen and state• Respect for rights, property, liberty• Harm principle
Right way to do it?• Unintended consequences• Proportionate• Non-discriminatory• Evidence based

Endgame through profit
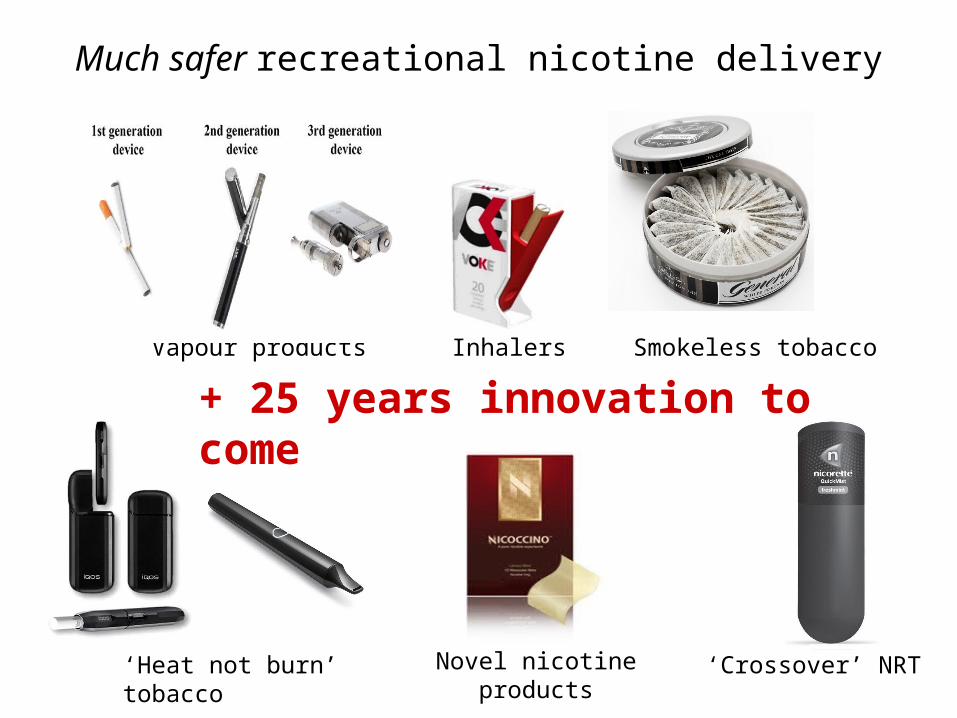
Much safer recreational nicotine delivery
Vapour products
‘Heat not burn’ tobacco
Smokeless tobacco
Novel nicotine products ‘Crossover’ NRT
Inhalers
+ 25 years innovation to come
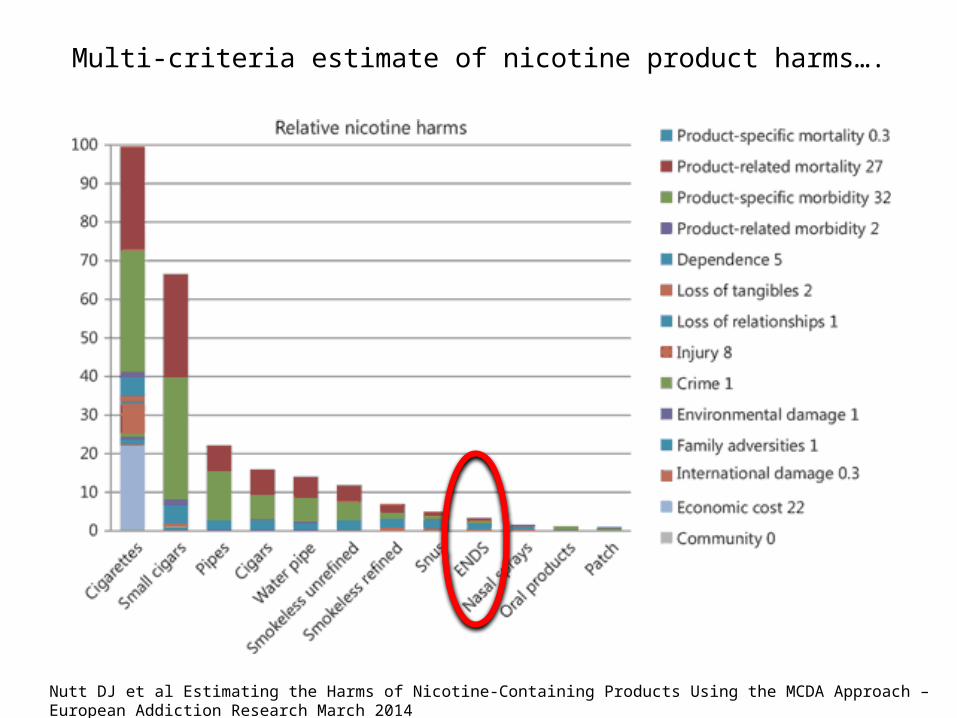
Multi-criteria estimate of nicotine product harms….
Nutt DJ et al Estimating the Harms of Nicotine-Containing Products Using the MCDA Approach – European Addiction Research March 2014
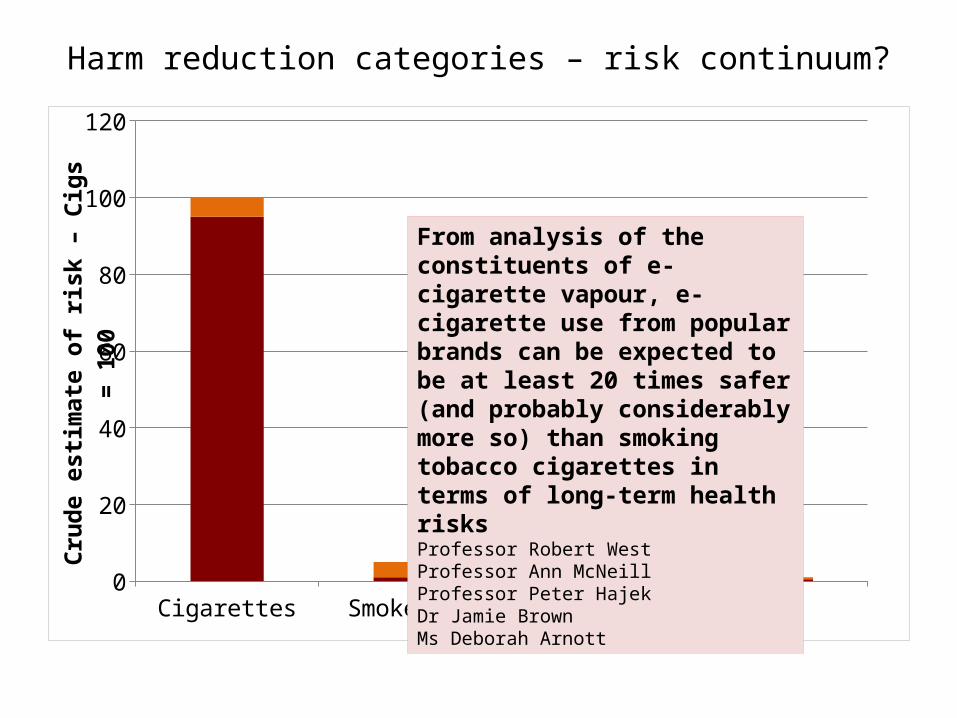
Harm reduction categories – risk continuum?
Cigarettes Smokeless E-cigs NRT0
20
40
60
80
100
120
Crud
e es
timat
e of
risk
– C
igs
= 10
0
From analysis of the constituents of e-cigarette vapour, e-cigarette use from popular brands can be expected to be at least 20 times safer (and probably considerably more so) than smoking tobacco cigarettes in terms of long-term health risksProfessor Robert WestProfessor Ann McNeillProfessor Peter HajekDr Jamie BrownMs Deborah Arnott
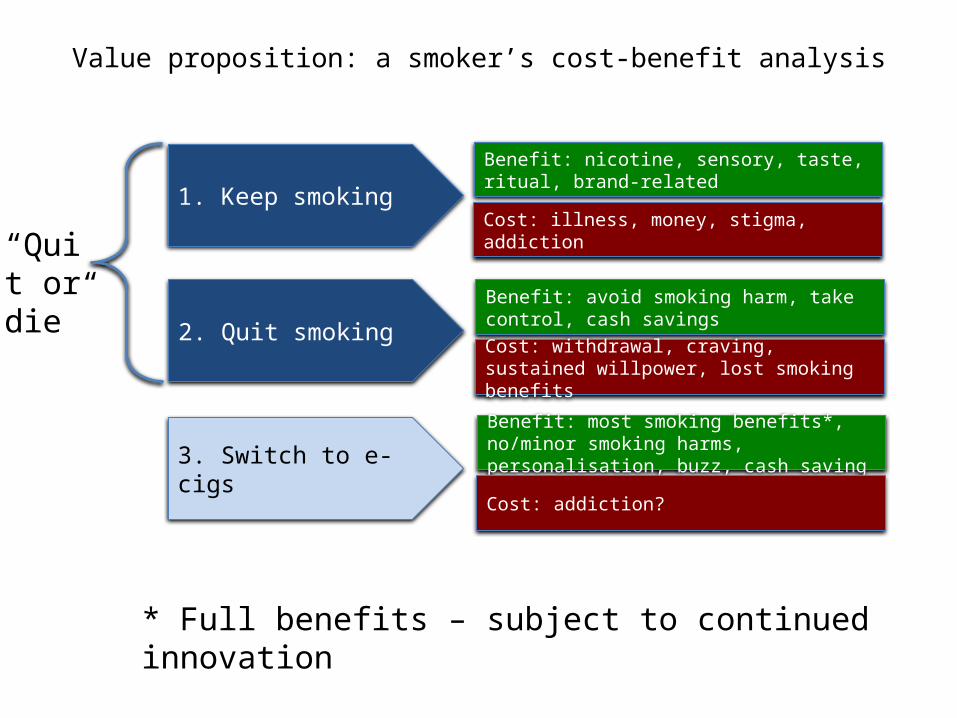
Value proposition: a smoker’s cost-benefit analysis
1. Keep smoking
Benefit: nicotine, sensory, taste, ritual, brand-related
Cost: illness, money, stigma, addiction
2. Quit smoking
Benefit: avoid smoking harm, take control, cash savings
Cost: withdrawal, craving, sustained willpower, lost smoking benefits
3. Switch to e-cigs
Benefit: most smoking benefits*, no/minor smoking harms, personalisation, buzz, cash saving
Cost: addiction?
* Full benefits – subject to continued innovation
“Quit or die”
Global cigarette consumption - still rising
Data source: Ng M, Freeman MK, Fleming TD, et al. Smoking prevalence and cigarette consumption in 187 countries, 1980-2012. JAMA 2014; 311: 183–92.
19801982
19841986
19881990
19921994
19961998
20002002
20042006
20082010
2012 -
1,000
2,000
3,000
4,000
5,000
6,000
7,000
Global cigarette consumption 1980-2012
Billi
on p
iece
s
Total cigarette consumption
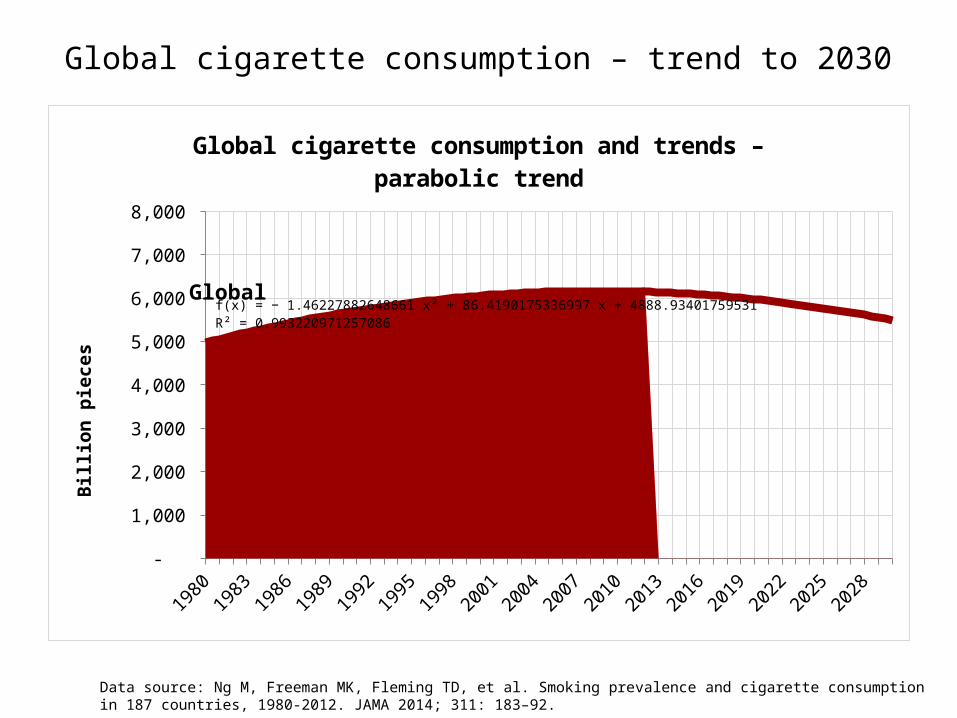
Global cigarette consumption – trend to 2030
Data source: Ng M, Freeman MK, Fleming TD, et al. Smoking prevalence and cigarette consumption in 187 countries, 1980-2012. JAMA 2014; 311: 183–92.
19801982
19841986
19881990
19921994
19961998
20002002
20042006
20082010
20122014
20162018
20202022
20242026
20282030
-
1,000
2,000
3,000
4,000
5,000
6,000
7,000
8,000
f(x) = − 1.46227882648661 x² + 86.4190175336997 x + 4888.93401759531R² = 0.993220971257086
Global cigarette consumption and trends – parabolic trend
Billi
on p
iece
s
Global
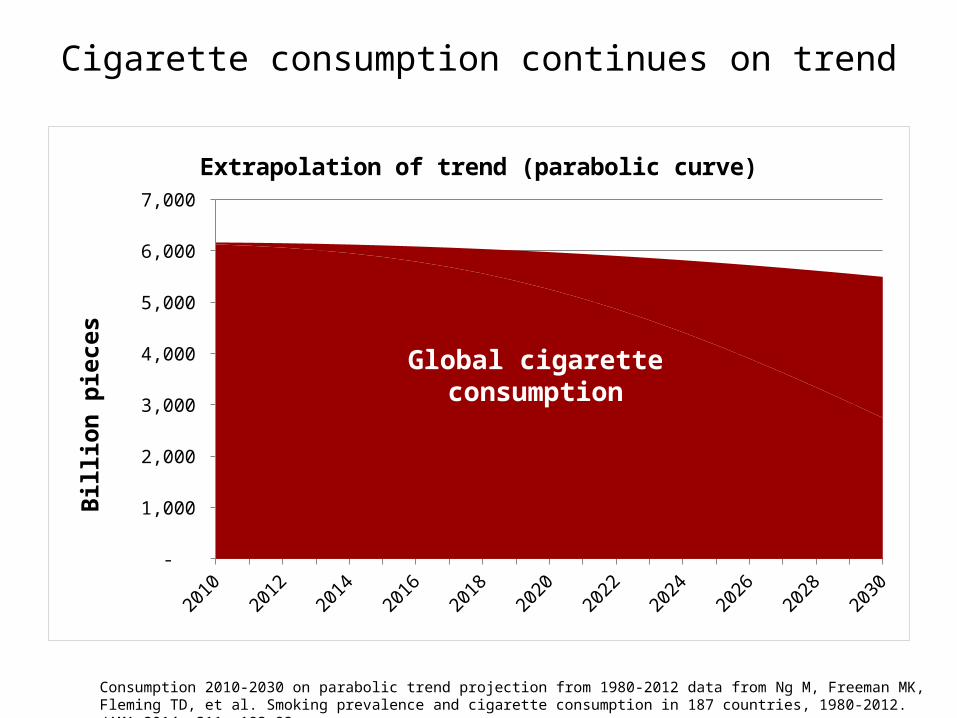
Cigarette consumption continues on trend
Consumption 2010-2030 on parabolic trend projection from 1980-2012 data from Ng M, Freeman MK, Fleming TD, et al. Smoking prevalence and cigarette consumption in 187 countries, 1980-2012. JAMA 2014; 311: 183–92.
20102011
20122013
20142015
20162017
20182019
20202021
20222023
20242025
20262027
20282029
2030 -
1,000
2,000
3,000
4,000
5,000
6,000
7,000
Extrapolation of trend (parabolic curve)
Billi
on p
iece
s Global cigarette consumption
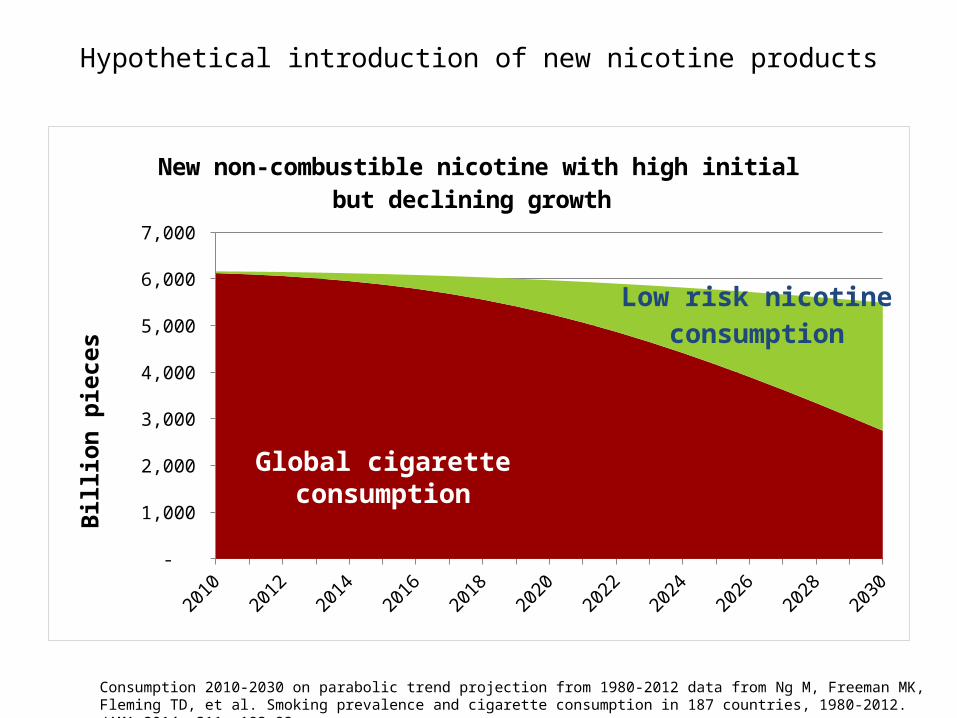
Hypothetical introduction of new nicotine products
Consumption 2010-2030 on parabolic trend projection from 1980-2012 data from Ng M, Freeman MK, Fleming TD, et al. Smoking prevalence and cigarette consumption in 187 countries, 1980-2012. JAMA 2014; 311: 183–92.
20102011
20122013
20142015
20162017
20182019
20202021
20222023
20242025
20262027
20282029
2030 -
1,000
2,000
3,000
4,000
5,000
6,000
7,000
New non-combustible nicotine with high initial but declining growth
Billi
on p
iece
s
Low risk nicotineconsumption
Global cigarette consumption
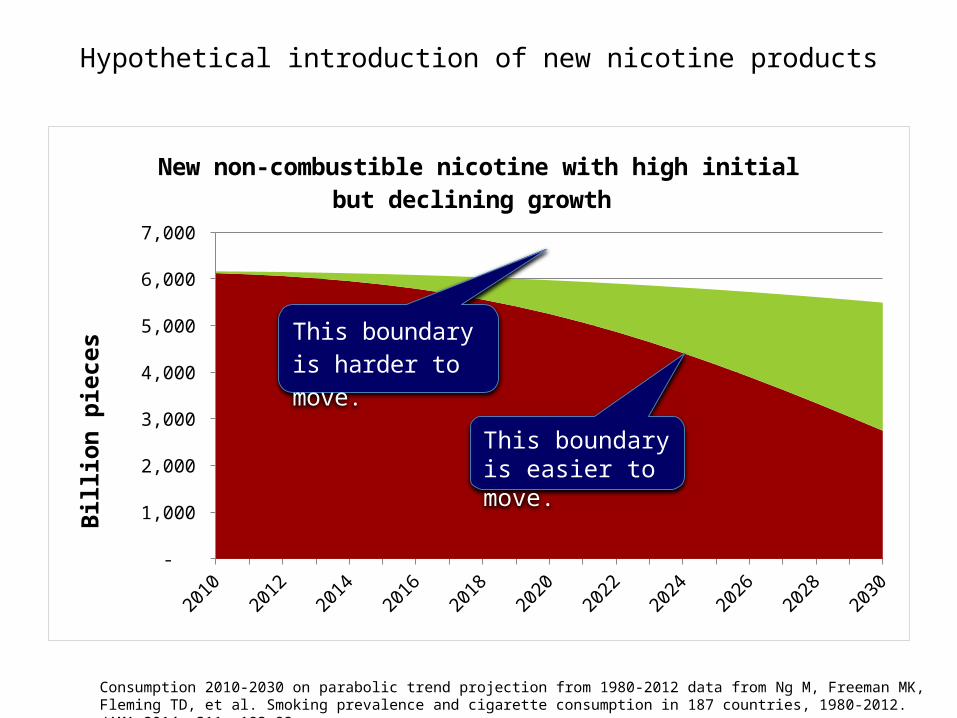
Hypothetical introduction of new nicotine products
Consumption 2010-2030 on parabolic trend projection from 1980-2012 data from Ng M, Freeman MK, Fleming TD, et al. Smoking prevalence and cigarette consumption in 187 countries, 1980-2012. JAMA 2014; 311: 183–92.
20102011
20122013
20142015
20162017
20182019
20202021
20222023
20242025
20262027
20282029
2030 -
1,000
2,000
3,000
4,000
5,000
6,000
7,000
New non-combustible nicotine with high initial but declining growth
Billi
on p
iece
s
This boundary is harder to move.
This boundary is easier to move.
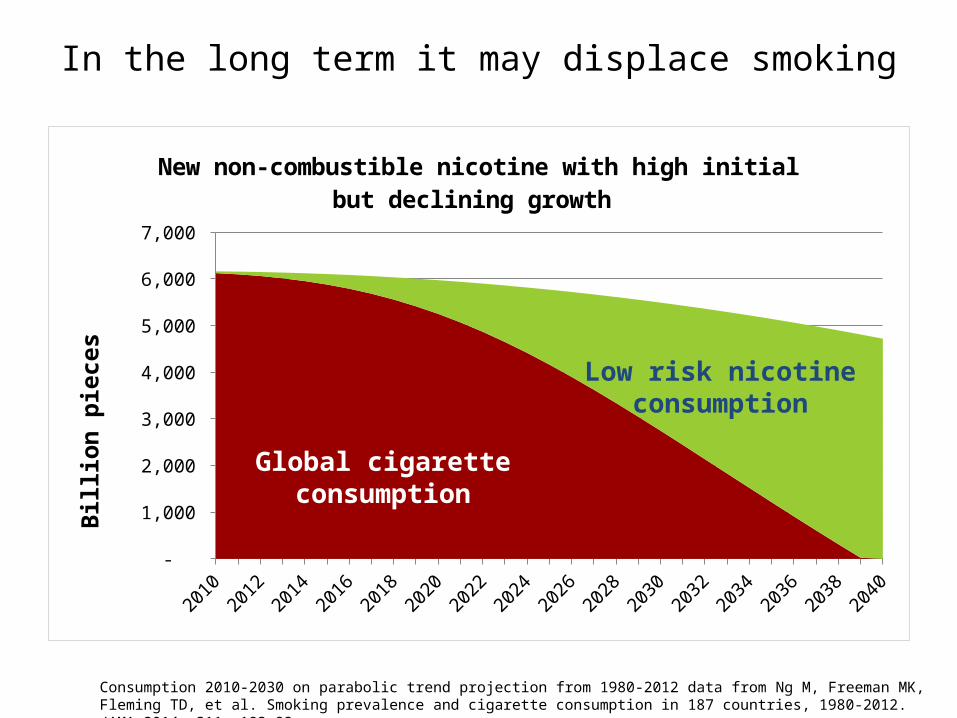
In the long term it may displace smoking
Consumption 2010-2030 on parabolic trend projection from 1980-2012 data from Ng M, Freeman MK, Fleming TD, et al. Smoking prevalence and cigarette consumption in 187 countries, 1980-2012. JAMA 2014; 311: 183–92.
20102012
20142016
20182020
20222024
20262028
20302032
20342036
20382040
-
1,000
2,000
3,000
4,000
5,000
6,000
7,000
New non-combustible nicotine with high initial but declining growth
Billi
on p
iece
s
Global cigarette consumption
Low risk nicotineconsumption

Not if, how?
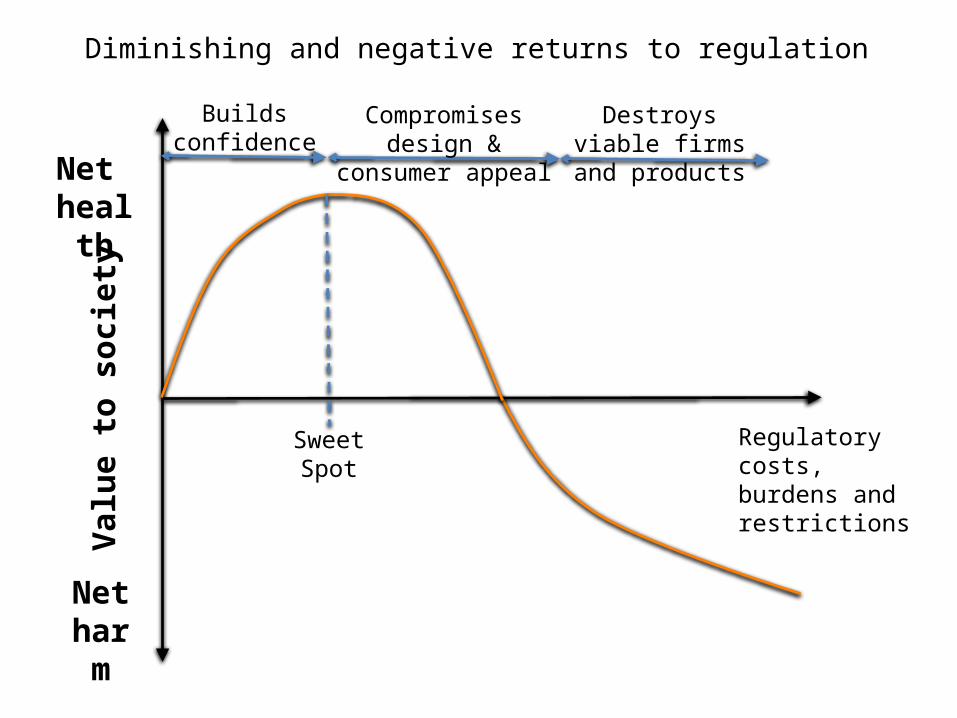
Diminishing and negative returns to regulation
Net health
Net harm
Valu
e to
soc
iety
Regulatory costs, burdens and restrictions
Builds confidence
Destroys viable firms and products
Compromises design & consumer appeal
Sweet Spot
Morgan Stanley on FDA deeming regulations
The greater barriers to entry (slower approval process, higher costs, higher product standards), will ultimately take a toll onthe number of available products and rationalize the category.
This could result in the larger tobacco companies dominating the category in the future, given the burden it would place on smaller manufacturers.
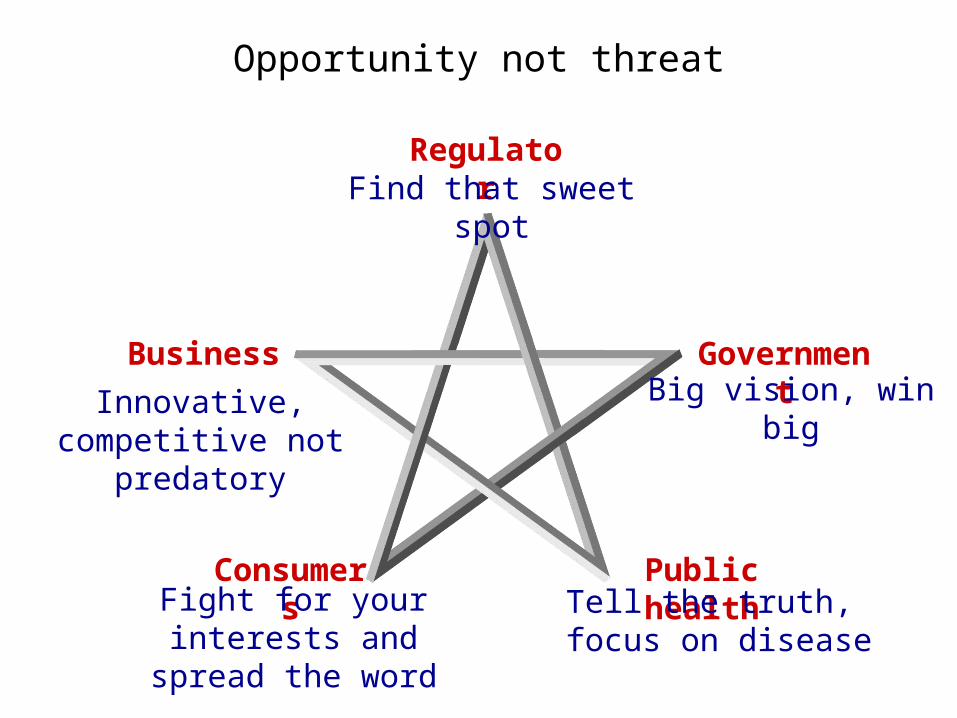
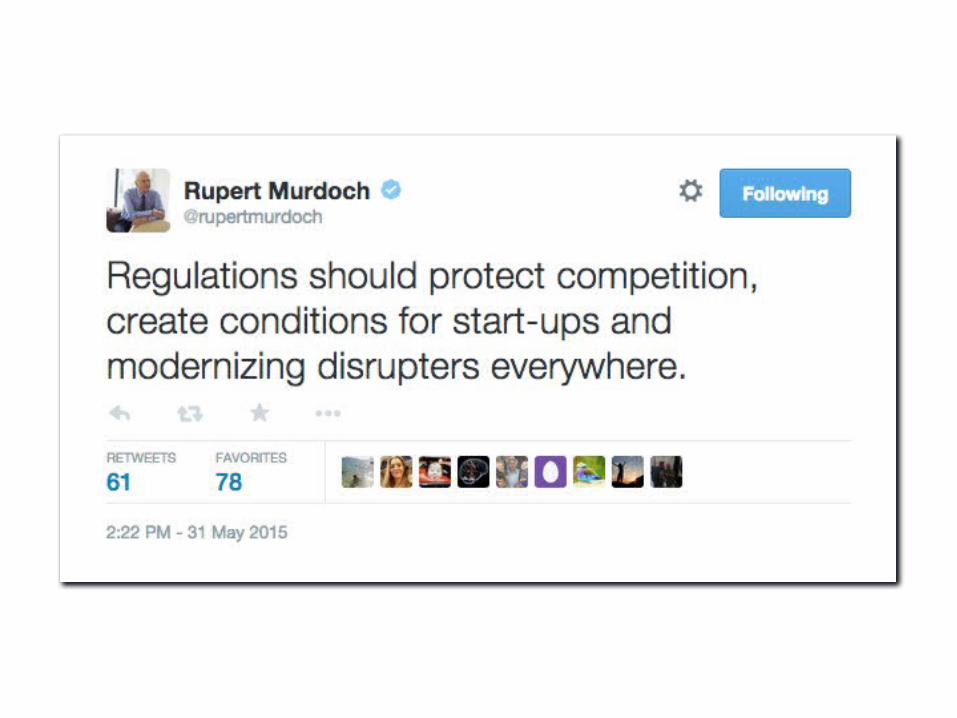
Opportunity not threat
Regulator
Consumers Public health
Business Government
Find that sweet spot
Big vision, win big
Tell the truth, focus on disease
Fight for your interests and spread the word
Innovative, competitive not predatory
Enjoy the disruption!
Counterfactual
www.clivebates.com@clive_bates