Embed Size (px)
DESCRIPTION
Progress Towards Nested Space and Sub-Space Filling Latin Hypercube Sample Designs . Keith Dalbey, PhD Sandia National Labs, Dept 1441 Optimization & Uncertainty Quantification George N. Karystinos, PhD - PowerPoint PPT Presentation
Citation preview

Progress Towards Nested Space and Sub-Space Filling Latin Hypercube
Sample Designs
July 25 – July 28, 2011
Keith Dalbey, PhDSandia National Labs, Dept 1441
Optimization & Uncertainty QuantificationGeorge N. Karystinos, PhD
Technical University of Crete, Dept of Electronic & Computer Engineering
Sandia is a multiprogram laboratory operated by Sandia Corporation, a Lockheed Martin Company, for the United States Department of Energy’s National Nuclear
Security Administration under Contract DE-AC04-94AL85000.

Outline
• Sampling: Why & What’s Good?• Sample Design Quality Metric: Centered L2 Discrepancy• “Binning Optimality,” a New Space-filling Metric• Latin Hypercube Sampling (LHS)• Jittered Sampling• Binning Optimal Symmetric Latin Hypercube Sampling
(BOSLHS)• Nested Sub-Space Filling BOSLHS• Conclusions• Current / Ongoing Work

Sampling: Why & What’s Good?
Problem: generate a M dimensional sample design with Npoints at which to evaluate a simulator
Why sample simulator input? To…• Calculate statistics of outputs with uncertain inputs• Optimize, e.g. guess several times & pick best guess• Construct meta-models (fast surrogates for slow simulators)
What qualities do we want in a sample design?• Design should be space-filling• Low - dimensional projections of points should be well-spaced• Sample point locations should be uncorrelated with each other• Regularity is bad, leads to biased results• Nesting: want SEQUENCE of designs that inherit all points
from earlier members in the sequence

Sample Design Quality Metric:Centered L2 Discrepancy
• Lots of metrics; fortunately one of them is almost always most important
• “Discrepancy” (some norm of difference between points per sub-volume & uniform density): lower is better– “Koksma - Hlawka - like inequality” bounds error in a computed
mean in terms of discrepancy– Centered L2 Discrepancy (usually most important metric)– Wrap-Around L2 Discrepancy (important for periodic variables)
• Unfortunately, discrepancy is expensive (O(M N2) ops) to calculate for designs with large numbers of points, N, so...
• Can’t guess a large number of designs & pick the best
• WARNING: Regularity is easy way to get low discrepancy

“Binning Optimality”a New Space-filling Metric
A sample design is “Binning Optimal” (in base 2) ifShort answer:
Every sub-bin that should contain a point does
Long answer:• When you recursively subdivide M-dimensional hypercube into 2M disjoint congruent sub-cube bins, all bins of same generation contain same number of points
• Above must hold true until bins are so small that they each contain either 0 or 1 points
Degree of Binning Non-Optimality...
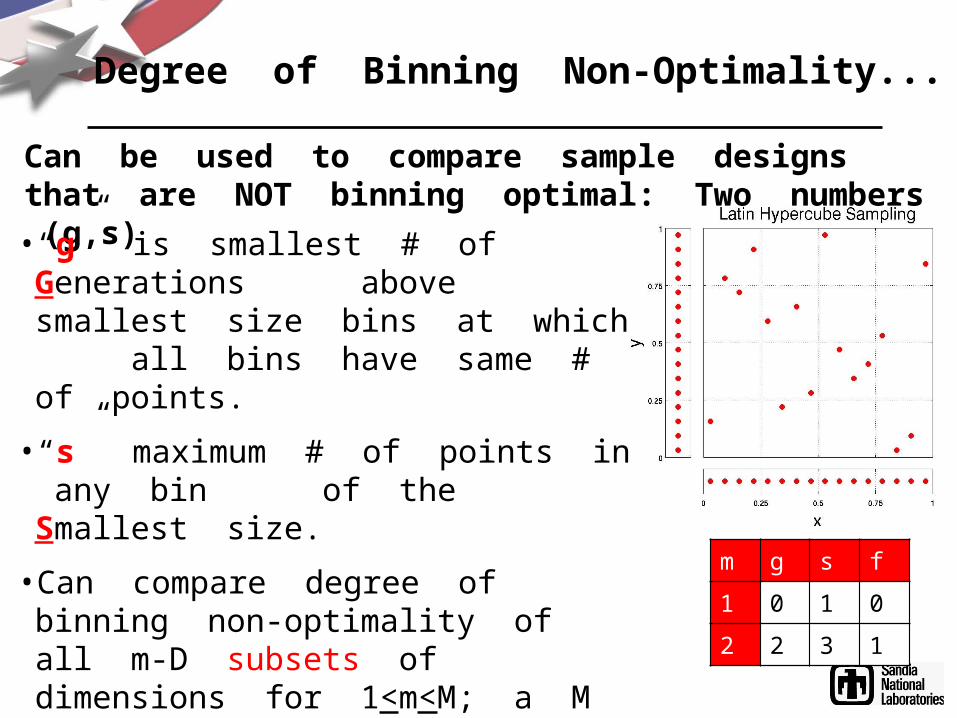
Can be used to compare sample designs that are NOT binning optimal: Two numbers (g,s)
• “g” is smallest # of Generations above smallest size bins at which all bins have same # of points.
• “s” maximum # of points in any bin of the Smallest size.
• Can compare degree of binning non-optimality of all m-D subsets of dimensions for 1<m<M; a M by 3 array of numbers. Third number, “f” is Fraction of m-D designs that are not binning optimal.
m g s f1 0 1 02 2 3 1

• Generate bin IDs as indices into Morton space filling curve, a.k.a. “Z-curve.” O(N log(N))+O(N M) work to collect leading Bits Per Dimension (BPD)
• Quicksort bin IDs: O(N log(N)) work
• Tally bins IDs: O(N) work
Degree of Binning Non-OptimalityCan Be Evaluated in O(N log(N)) Ops
• A FFT of difference of sequential sorted Z-curve bin IDs reveals regularity (cyclic patterns)
1 BPD 2 BPD
3 BPD 4 BPD

• Form of stratified random sampling that converges with fewer points than Monte Carlo Sampling
• Each column contains 1 point• Each row contains 1 point• Quality of design depends on pairing of dimensions used to form points (tough problem)
• Cell-centered LHS with randomly paired dimensions– gets 1D projections “perfect”– is NOT space-filling
Latin Hypercube Sampling (LHS)
This is notBinning Optimal
m g s f
1 0 1 02 2 3 1

Jittered Sampling
• Jittered Sampling = Tensor product sampling + random offset• Better 1D projections than Tensor Product sampling• Worse 1D projections than LHS• Each cell contains a point space-filling as cell size 0
m g s f1 2 4 12 0 1 0
m g s f1 2 3 12 0 1 0
These are Binning Optimal

Binning Optimal Symmetric Latin Hypercube Sampling (BOSLHS)
• Gets 1D projections right• Is space-filling• Combines most of best features of LHS and Jittered sampling
• Design quality is better than regular LHS or Jittered sampling
• Is very fast: generated Nested BOSLHS M=8 dim, N=216=65536 points design in 8.21 seconds
• Currently limited to M=2p < 16 dimensions (low degree of binning non-optimality for non integer p, working on extending to M > 16)
m g s f1 0 1 02 0 1 0

BOSLHS Compared to Other Methods: Centered L2 Discrepancy (Lower is Better)
10.26
Plots are for average of 40 random designs

•Need to get leading ceil( log2(N)/m ) BPD “right” to be binning optimal in m-dimensions
•m = 1 is easy (Latin Hypercube Sampling)•m = M = 2p (space-filling) isn’t too hard, just need list of which bins to fill (Dalbey & Karystinos 2011)
•Other m (space and/or sub-space filling) are harder•Also making it nested / inherited, is harder still•First cut was to randomly match first log2(N)/M BPD of M/2 2D BOSLHS designs to M-D design
Nested Sub-Space Filling BOSLHS

• Want binning optimality in more subsets of dimensions
• Good sub-space filling properties lets one discard dimensions & still have good space filling properties
• Difficulties because of initial design (end points of a rotated orthogonal axis) in nested sequence
• Need to keep leading BPD (from Sylvester construction of Hadamard matrices) to ensure it’s still binning optimal in M-D but can change less significant BPD
• Undertaking “piecewise brute force” (use solutions from previous pieces to reduce work) examination of optimal starting designs
Nested Sub-Space Filling BOSLHS

In 8D, an Optimal Choice of First 2 BPD

Can Randomly Match First 2 BPD to 8 1D LHS designs to Make it BOSLHS

Previous 8D, 2 BPD, 16 Point Design
•Was 1 of 64 equivalent optimal designs found by brute force matching of 128 optimal 4D designs with leading BPD from 8D Sylvester Hadamard Matrix
•Was space-filling in all 3D, 5D, 6D, 7D, & 8D projections
m g s f1 2 4 12 1 4 0.14293 0 1 04 1 2 0.25 0 1 06 0 1 07 0 1 08 0 1 0
•Was space-filling in 24/28 of 2D projections & 56/70 of 4D projections

There were other designs that differed in s2, f2, and centered L2 discrepancy•Notice that # of equivalent designs, s2, and f2 are symmetric vertically
•Compare next 4 designs: 2 were selected from top group, 2 were selected from bottom group
CD2(X)
#Equiv s2 f2
0.361915 64 4 0.142857
0.368682 192 3 0.571429
0.372019 512 4 0.357143
0.373236 512 3 0.571429
0.375327 192 2 0.428571
0.376533 1536 3 0.571429
0.379801 1536 3 0.571429
0.380993 1536 3 0.571429
0.381856 64 3 0.571429
0.383041 512 3 0.571429
0.384223 3072 3 0.571429
0.385402 512 3 0.571429
0.386577 64 3 0.571429
0.387427 1536 3 0.571429
0.388596 1536 3 0.571429
0.391763 1536 3 0.571429
0.392919 192 2 0.428571
0.394905 512 3 0.571429
0.396052 512 4 0.357143
0.399161 192 3 0.571429
0.405306 64 4 0.142857

Design # 1 (Top Group)

Design # 2 (Top Group)

Design # 3 (Bottom Group)

Design # 4 (Bottom Group)

What Does This Mean?
It may be possible (and easy / fast) to
• Start with leading BPD design that is space-filling in full M dimensional space and most subsets of dimensions
• Add matched leading BPD designs to evenly fill in “holes” to obtain a nested sequence of designs, and
• Avoid regularity by randomly matching leading BPD with M one dimensional LHS designs

Conclusions•Defined new space-filling metric “Binning Optimality” that evaluates in O(N log(N)) time
•Found related way to detect regularity in sample designs
•Developed fast algorithm for Nested Binning Optimal Symmetric Latin Hypercube Sampling (BOSLHS) that– is also Binning Optimal in some Low D
subsets – combines best features of LHS & Jittered
Sampling

• Sub-space filling BOSLHS
• Extension to larger ( > 16) & arbitrary (non power of 2) numbers of dimensions (sub-space filling BOSLHS could solve the latter)
• Better numerical quantification of “regularity”
• ? Induce correlations between dimensions?
• How well do emulators built from BOSLHS designs predict? (paper submitted to Statistics & Computing)
• Gradient Enhanced Kriging emulators
Current / Ongoing Work

References
1. K. R. Dalbey and G. N. Karystinos, “Fast Generation of Space-filling Latin Hypercube Sample Designs,” Proceedings of the 13th AIAA/ISSMO Multidisciplinary Analysis and Optimization Conference, 2010.
2. K. R. Dalbey and G. N. Karystinos, “Generating a Maximally Spaced Set of Bins to Fill for High Dimensional Space-filling Latin Hypercube Sampling,” International Journal for Uncertainty Quantification, vol. 1(3), pp. 241 - 255, 2011.

Bonus Slides Start Here

10.26
What Complete Irregularity (Monte Carlo Sampling) Looks Like

The Sobol Sequence Has Lower Discrepancy But Is Regular
10.26
Regularity in sample designs results in biased statistics
This FFT showsStrong Cyclic
Patterns
m g s f
1 0 1 0
2 1 2 0.333
3 0 1 0
4 0 1 0

First Cut of Nested Sub-Space Filling BOSLHS
m g s f
1 0 1 0
2 2 4 0.667
3 1 3 1
4 0 1 0
This FFTsays it’s
not regular

Design # 5 (2nd From Top Group)

Sample Design Quality MetricsOther “partial” metrics
• “Coverage” (fraction of hypercube's volume filled by convex hull of points, VERY expensive for even moderately high dimensions): higher coverage is better
• Condition number of sample design's correlation matrix (can be evaluated in O(M2N) ops): lower is better
• “t” quality metric when design is considered to be a tms-net (quasi-Monte Carlo; metric moderately expensive O((m-t+1+s)Cs s bm) ops where s=M, bm=N): lower “t” is better
• NEW! degree of Binning Non-Optimality (can be evaluated in O(N log(N)) time): lower is better

Results: Wrap Around L2 Discrepancy (Lower is Better)
10.26
Plots are for average of 40 random designs

Results: Coverage (higher is better)

Results: Condition # of CorrelationMatrix (lower is better)

Results: (t,m,s)-net, “t” quality metric (lower is better)

• Plotted all 6 combinations of 2 out of M = 4 dimensions• BOSLHS is visibly space-filling!
N=128 N=4096N=1024
Results: Eyeball Metric M=4D

First Cut Sub-Space (Dims 1&2, 3&4)Results: Eyeball Metric M = 4D
• Plotted all 6 combinations of 2 out of M = 4 dimensions• BOSLHS is visibly space-filling!
N=128 N=4096N=1024