Embed Size (px)
Citation preview
Progress Report Action D3 Monitoring of the populations of rabbits, rock pigeons and red partridges Douro International Natural Park
2017 - 2018
Monitoring of the populations of rabbits, rock pigeons and red partridges. Douro International Natural Park. 2017-2018.
Authors: João P.V. Santos1, Américo Guedes1, Antonio Lecegui1, Armando Barbosa2,
Eduardo Realinho2, Iván Gutiérrez1, José Pereira1, Luís Queirós1, Miguel Nóvoa1, Núria
Vallverdú2
Author contributions Text: João P.V. Santos1
Data analysis: João P.V. Santos1
Data collection and compilation: Américo Guedes1, Antonio Lecegui1, Armando
Barbosa2, Eduardo Realinho2, Iván Gutierrez1, José Pereira1, Luís Queirós1, Miguel
Nóvoa1, Núria Vallverdú2
1 Palombar – Associação de Conservação da Natureza e do Património Rural 2 ATN – Associação Transumância e Natureza
Date: October 2018
Table of contents
1. INTRODUCTION 4 2. METHODS FOR MONITORING BONELLI’S EAGLE MAIN PREY SPECIES 7 2.1. Wild rabbit Oryctolagus cuniculus 8 2.2. Red-legged partridge Alectoris rufa 10 2.3. Rock pigeon Columba livia 13 3. RESULTS 15
3.1. Wild rabbit 15 3.2. Red-legged partridge 20 3.3. Rock pigeon 33 4. CONCLUSIONS 36 5. REFERENCES 38
1. INTRODUCTION
The Bonelli’s eagle (Aquila fasciata) is a medium to large-sized bird of prey whose populations have
suffered a marked decline over the last decades throughout its distribution range, including in Mediter-
ranean Europe. The European population size is currently estimated at 1,100–1,200 pairs and is con-
sidered stable, however it have decreased in the past at a rate of approximately 30% in three genera-
tions, i.e. 54 years (BirdLife International, 2016). The species is listed as “Near Threatened” at both
European and EU 27 levels (BirdLife International, 2015) and is classified as a Species of European
Conservation Concern (SPEC), being included in the category SPEC3 (i.e. species not concentrated in
Europe, but with unfavourable conservation status in Europe) (BirdLife International, 2017). Moreover,
the Bonelli’s eagle is listed in the Annex I of the EU Birds Directive (species that are subjected to
special conservation measures), Appendix II of Bern Convention (strictly protected fauna species),
Appendix II of Bonn Convention (species with an unfavourable conservation status that would benefit
significantly from international cooperation), and Appendix II of the Convention on International Trade
in Endangered Species of Wild Fauna and Flora (CITES).
The Iberian Peninsula holds 78% of the European population of Bonelli’s eagles. According to the last
update of BirdLife International (2017), the population size is now estimated at 741–763 pairs in Spain
and 128–150 pairs in Portugal (i.e. 66% and 12% of the European population, respectively). The spe-
cies is listed as “Endangered” in both countries, according to the respective Red Data Books (Spain:
Madroño et al., 2004; Portugal: Cabral et al., 2005). During the period 1980–2000, several subpopula-
tions/nuclei have reduced drastically in Iberia. In some Spanish regions, population declines were
around 40–50% (e.g. Carrete et al., 2002; Alcántara et al., 2003). In Portugal, Palma et al. (1999)
reported an overall population decline of about 15% over a similar period. More recently, since the
early 2000’s, the Spanish population has remained stable (733–768 pairs were estimated in the
country in 2005; Del Moral, 2006), while in Portugal the population has shown a slight increase (only
92–99 pairs had been estimated in the Portuguese territory between 1999 and 2005; Equipa Atlas,
2008). This increase was particularly evident in the southern part of Portugal, where populations have
grown successfully during the last decade, thus reversing the overall national trend. However, in the
northern part of the country, the population has continued to decline, plummeting more than 40% since
then.
The decline of Bonelli’s eagle populations has been related to several factors, including high mortality
rates due to collision or electrocution at power lines and direct persecution either by shooting, poison-
ing or trapping (Real et al., 2001), low reproductive rates (Real & Mañosa, 1997), poor availability of
prey species (see Ontiveros et al., 2004), loss of favourable habitat (Ontiveros, 1997; Arroyo et al.,
1998), and interspecific competition with other raptors showing similar ecological requirements (Arroyo
et al., 1998; Carrete et al., 2005). Many of these factors are still nowadays important threats for the
conservation of this species.
In the cross-border region of the Douro valley (Northwestern Iberia), where the LIFE Rupis project is
being implemented, the number of Bonelli’s eagle pairs has remained stable over the last decade
(13–14 breeding pairs since 2006), however their breeding success decreased from 8 fledglings/pair in
2006 to only 4 in 2013. One of the main objectives of the LIFE Rupis project is to reverse this trend.
The low productivity values verified in the region has been associated, in part, to the low availability of
optimal prey species (see Hernández & Real 2011, Hernández et al., 2012), such as the wild rabbit
(Oryctolagus cuniculus), the red legged-partridge (Alectoris rufa) and pigeons (Columba spp.). These
are the main prey species of Bonelli’s eagle in the Iberian Peninsula, both during the breeding season
and non-breeding season, as attested by several studies (e.g. Gil–Sanchez et al., 2004; Moleón et al.,
2007, 2011; Caro et al., 2011). However, the populations of these species declined sharply in many
parts of Iberia as a result of land-use changes (Delibes–Mateos et al., 2009, 2010), disease outbreaks
(in the case of wild rabbit; Moreno et al., 2007) and/or inappropriate hunting management (e.g. Díaz–
Fernandez et al., 2013), with negative consequences for a large community of vertebrate predators,
including the Bonelli’s eagle. The relative scarcity of the main prey in many areas of the Douro valley
has forced Bonelli’s eagles to capture and feed on alternative (and probably energetically sub-optimal)
prey species (e.g. medium to large-sized passerines and reptiles; Hernández et al., 2012).
The effective management and conservation of the Bonelli’s eagle main preys is therefore crucial for
the population viability of this raptor in the Douro valley. Several actions aimed at recovering and
boosting the populations of those species in the region are of central importance in the context of the
LIFE Rupis project, in order to increasing prey availability for the Bonelli’s eagles. Actions targeted at
improving the habitat quality for the wild rabbit and red-legged partridge (actions C5 and C6), on the
one hand, and the restoration of traditional pigeon houses and restocking of individuals (action C4), on
the other hand, are some conservation/management actions proposed and already underway.
Furthermore, assessing the distribution and abundance of Bonelli’s eagle main preys (actions A4 and
D3), as well as monitoring their population trends (action D3), is fundamental to increasing the
knowledge on the status of those populations in the project’s area and to evaluating the success of the
conservation/management actions implemented.
The aim of this report is to present the main results obtained from the monitoring actions conducted as
part of action D3 of the LIFE Rupis project in the Douro International Natural Park and compare them
with results obtained from the baseline study performed to estimate the initial prey abundances in the
project’s area (action A4).
2. METHODS FOR MONITORING BONELLI’S EAGLE MAIN PREY SPECIES
This section is aimed at describing the methods used for monitoring and evaluating the status of the
main prey species of Bonelli’s eagle (wild rabbit Oryctolagus cuniculus, red legged-partridge Alectoris
rufa and rock pigeon Columba livia) in the Douro International Natural Park, one of the protected areas
where the LIFE Rupis project is taking place.
The general sampling approach consisted of the following steps. After a previous evaluation of the
situation of Bonelli’s eagle population in the Douro valley and identification of the existing territories,
the study area was first divided into ETRS89 grid cells. Two grid cell sizes were used: 2.5 x 2.5 km
and 10 x 10 km. Subsequently, since Bonelli’s eagle territories were established as priority areas for
the implementation of conservation actions, the grid cells overlapping with or located close to those
territories were selected for conducting the surveys of prey populations. Wild rabbit surveys were
carried out within 2.5 x 2.5 km grid cells, whereas red-legged partridge and rock pigeon surveys were
conducted within 10 x 10 km grid cells. The survey methods used for monitoring and estimating the
abundance of Bonelli’s eagle main prey species are described in detail in sections 2.1, 2.2 and 2.3.
The surveys conducted in the Douro International Natural Park covered a total of 9 Bonelli’s eagle
territories (of the 14 considered in the LIFE Rupis project). The territory size of a Bonelli’s eagle was
defined as the area located within a 4 km radius around the nest (e.g. Gil-Sanchez et al., 2004).
The field survey methods used and the sampling designs were the same for actions A4 – Baseline
study to estimate initial densities of key prey-populations: pigeons, rabbits and partridges and
D3 – Monitoring of the populations of rabbits, rock pigeons and red partridges, in order to
effectively compare the results obtained in the different years of monitoring.
The baseline study on the abundance of prey species in the project’s area (action A4) was carried out
in 2016 and the main results for both Portuguese and Spanish protected areas can be consulted in the
LIFE Rupis mid-term report (LIFE Rupis team, 2017) and its Annexes 7b (García, 2016) and 7c
(Realinho & Vallverdú, 2017). The action D3 started in 2017 and will continue until 2019. The results
of the first year of monitoring are shown in the section 3 of this report. The monitoring actions planned
for 2018 are almost finished and the results will be included in a future report, since data needs to be
analysed and interpreted.
2.1. Wild rabbit Oryctolagus cuniculus
Field surveys based on latrine counts in linear transects were conducted in the Douro International
Natural Park in order to assess the distribution and relative abundance of wild rabbit population. This
method has been widely used in Mediterranean habitats of the Iberian Peninsula mainly because it is
easy to implement and allows assessing spatio-temporal fluctuations of rabbit abundance and distribu-
tion across large surface areas reliably and with relatively little effort (Virgós et al., 2003; Calvete et al.,
2006; Sarmento et al. 2012; Simón et al., 2012; Monterroso et al., 2016). Despite some methodologi-
cal limitations have been pointed out regarding the use of latrine counts at regional scale monitoring
programmes, it has been argued that this method may result in reproducible variations in rabbit densi-
ties at local scales (see Fernandez-de-Simon et al., 2011).
Latrine counts were carried out between mid-July and early August 2017, at the end of rabbit’s breed-
ing season (i.e. period of maximum abundance of the species) and before the beginning of the hunting
season. The number of latrines was counted along transects established in 2.5 x 2.5 km grid cells
overlapping the territories of Bonelli’s eagles (Figure 1). Three to five grid cells were surveyed per
territory. Transects were made by foot along trails during 2.5h and the geographic location of all la-
trines found was registered by using a GPS navigator.
Latrines were defined as recent faecal accumulations having more than 20 rabbit pellets over a sur-
face of 20 cm diameter (Virgós et al., 2003; Simón et al., 2012) and classified into categories accord-
ing to its size as follows: class 1 (21–50 pellets), class 2 (51–120 pellets) and class 3 (more than 120
pellets). Faecal accumulations having less than 20 pellets were included in a separate category (class
0) and considered as dispersed pellets. Based on this classification, the number of rabbit latrines origi-
nally counted in each transect was then converted by using correction factors reflecting the degree of
importance of latrines according to its size.
The wild rabbit relative abundance was calculated using a kilometric abundance index (KAI) of latrines
by dividing the number of latrines by the total effort (in km) in each 2.5 x 2.5 km grid cell (e.g. Calvete
et al., 2006; Simón et al., 2012).
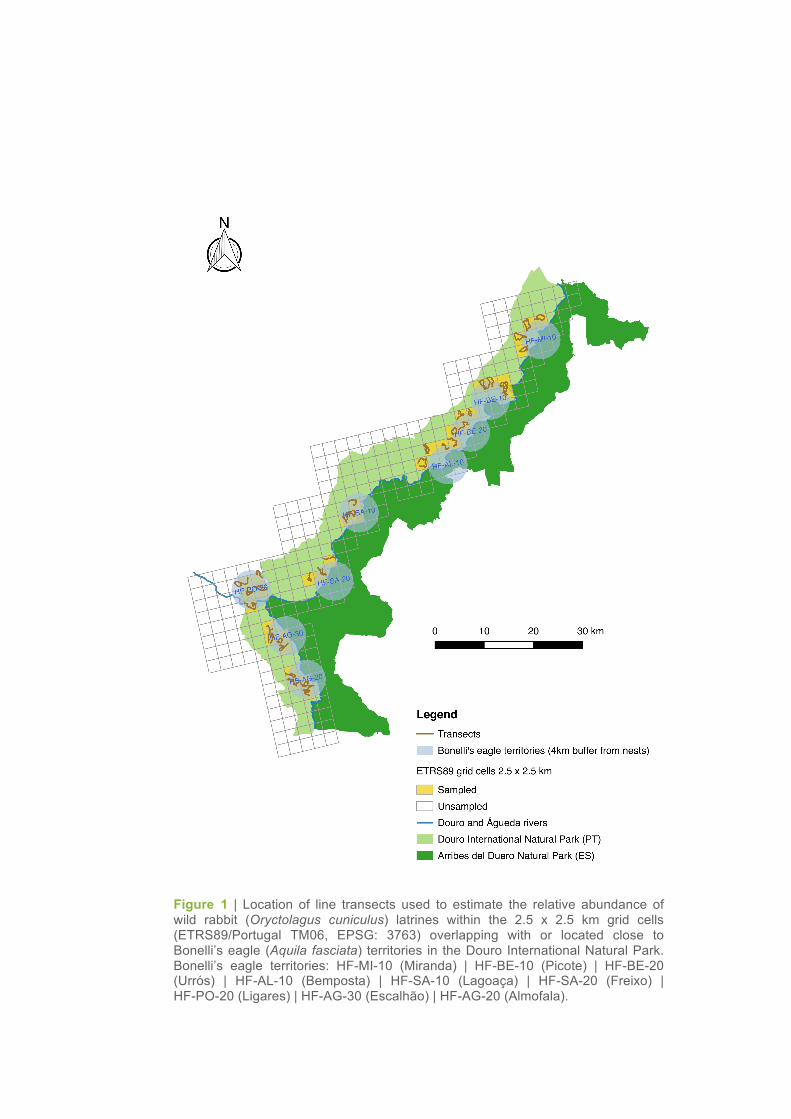
Figure 1 | Location of line transects used to estimate the relative abundance of wild rabbit (Oryctolagus cuniculus) latrines within the 2.5 x 2.5 km grid cells (ETRS89/Portugal TM06, EPSG: 3763) overlapping with or located close to Bonelli’s eagle (Aquila fasciata) territories in the Douro International Natural Park. Bonelli’s eagle territories: HF-MI-10 (Miranda) | HF-BE-10 (Picote) | HF-BE-20 (Urrós) | HF-AL-10 (Bemposta) | HF-SA-10 (Lagoaça) | HF-SA-20 (Freixo) | HF-PO-20 (Ligares) | HF-AG-30 (Escalhão) | HF-AG-20 (Almofala).
2.2. Red-legged partridge Alectoris rufa
Field surveys were based on both line transect and point count sampling, since these are the main
methods used for monitoring and estimating the abundance of red-legged partridge populations (e.g.
Borralho et al., 1996; Díaz-Fernández et al., 2013; Caro et al., 2015).
Sampling was carried out in thirteen 12-km line transects (one transect per each 10 x 10 km grid cell
overlapping or located close to the territories of Bonelli’s eagle previously identified and selected for
monitoring; Figure 2). Transect routes were designed in order to cover the different habitats present in
the area. Two observers performed partridge counts from a four-wheel drive vehicle at a speed of 10–
20 km/h during the first 3h after dawn and 3h before dusk in good weather conditions. The surveys
were conducted during two periods of red-legged partridge’s annual cycle, i.e. the pre-reproductive
season (March–April 2017), during the formation of breeding pairs and period in which partridges
reach the population minimum, and the post-reproductive season (July–September 2017), which coin-
cides with the population peak following juvenile recruitment. Three replicates of each transect were
carried out in each season (ideally at no more than 4-day intervals) in order to increase the possibility
of detecting all individuals present in the sampling areas. All partridges observed during the transect
surveys were recorded, including the number of individuals, age class (adults or juveniles) and wheth-
er they were seen alone, in pairs or in ‘clusters’ (i.e. ≥ 3 individuals), as well as their perpendicular
distances in relation to the transect and the direction of their movements. All observations were
recorded using a GPS device.
In each transect, nine count points were also established along the 12-km routes (Figure 2). While
conducting line transect surveys, the observers stopped every 1.5 km, turned off the vehicle, and rec-
orded all partridges detected, their age class and location during 5 minutes. All visual and/or auditory
contacts were recorded. The radial distances of partridges in relation to the observers were estimated
visually.
From the data collected during field surveys, the following abundance estimates and indices were cal-
culated:
Line transects
Kilometric abundance index (KAI) was calculated by dividing the total number of partridges ob-
served by the total of kilometres travelled in each 10 x 10 km grid cell and was expressed as partridg-
es per km (Caro et al., 2015; Carpio et al., 2015).
Partridge density was estimated by using a strip transect sampling approach using a 25 m fixed-strip
width and applying the formula D = n/2wL, where n corresponds to the total number of partridges ob-
served, w is the fixed width of the transect and L the transect length (Borralho et al., 1996; Beça,
2005). Partridge density was expressed as partridges per ha.
Point counts
Punctual abundance index (PAI) was calculated by dividing the total number of partridges seen or
heard (i.e. visual and/or auditory contacts) by the total number of points sampled in each 10 x 10 km
grid cell and was expressed as partridges per point (Díaz-Fernández et al., 2013; Caro et al., 2015).
Partridge density was estimated by using a 25 m fixed-radius and applying the formula
D = ln(n/n2) (n/m) (π r2), where n is the total number of partridges counted, n2 the total number of par-
tridges recorded outside the fixed radius, m the total number of points sampled, and r the fixed radius
(Baticón, 1998 in Dias, 2006). Partridge density was expressed as partridges per ha.
For both line transects and point counts, the survey (of the three conducted in each season) that had
the maximum number of partridge records was used for abundance calculations.
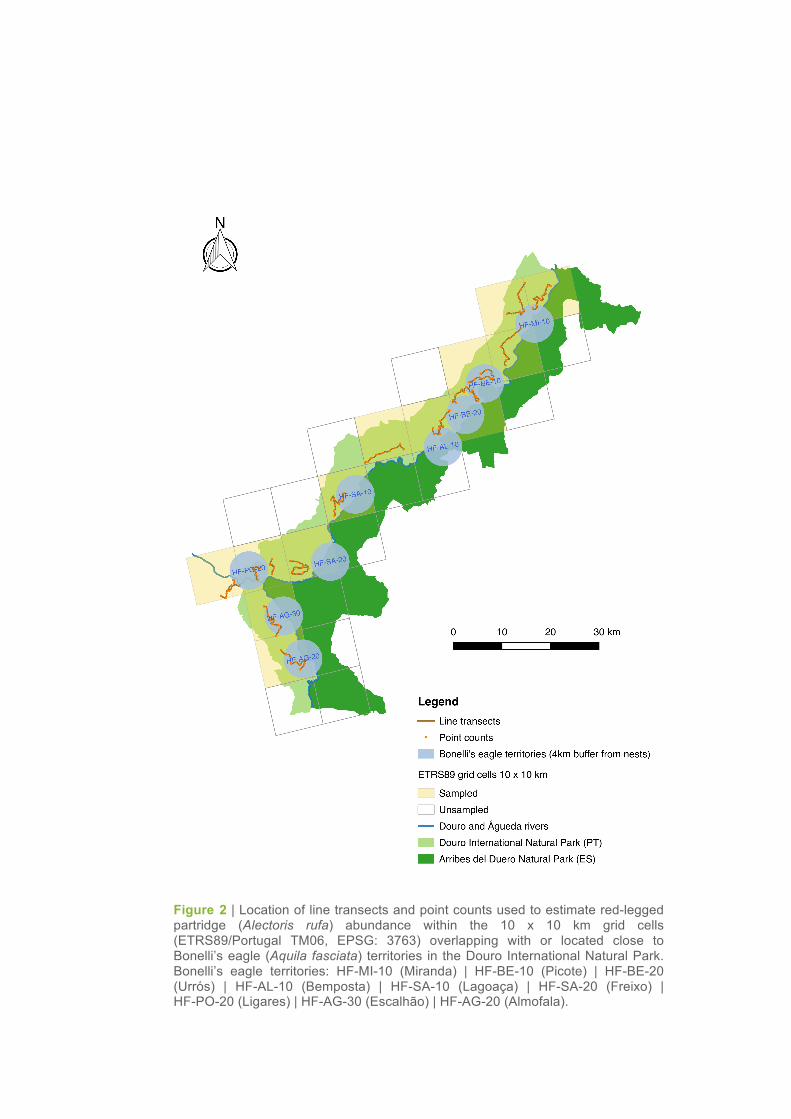
Figure 2 | Location of line transects and point counts used to estimate red-legged partridge (Alectoris rufa) abundance within the 10 x 10 km grid cells (ETRS89/Portugal TM06, EPSG: 3763) overlapping with or located close to Bonelli’s eagle (Aquila fasciata) territories in the Douro International Natural Park. Bonelli’s eagle territories: HF-MI-10 (Miranda) | HF-BE-10 (Picote) | HF-BE-20 (Urrós) | HF-AL-10 (Bemposta) | HF-SA-10 (Lagoaça) | HF-SA-20 (Freixo) | HF-PO-20 (Ligares) | HF-AG-30 (Escalhão) | HF-AG-20 (Almofala).
2.3. Rock pigeon Columba livia
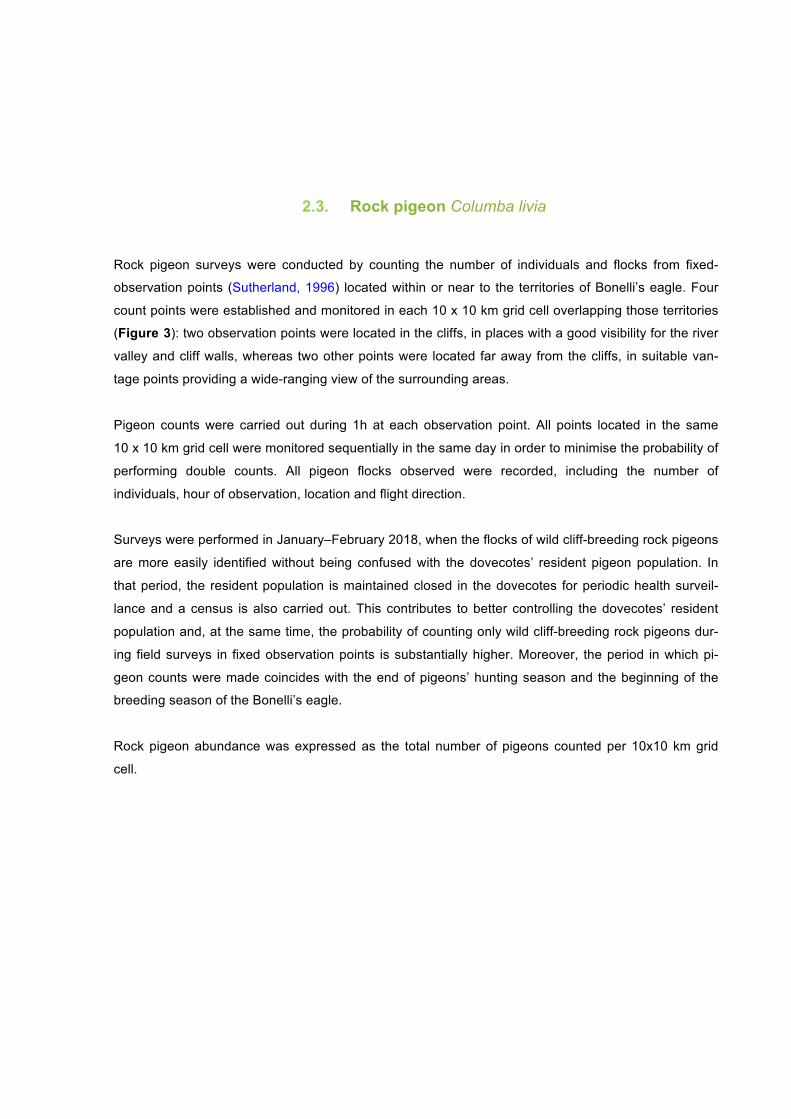
Rock pigeon surveys were conducted by counting the number of individuals and flocks from fixed-
observation points (Sutherland, 1996) located within or near to the territories of Bonelli’s eagle. Four
count points were established and monitored in each 10 x 10 km grid cell overlapping those territories
(Figure 3): two observation points were located in the cliffs, in places with a good visibility for the river
valley and cliff walls, whereas two other points were located far away from the cliffs, in suitable van-
tage points providing a wide-ranging view of the surrounding areas.
Pigeon counts were carried out during 1h at each observation point. All points located in the same
10 x 10 km grid cell were monitored sequentially in the same day in order to minimise the probability of
performing double counts. All pigeon flocks observed were recorded, including the number of
individuals, hour of observation, location and flight direction.
Surveys were performed in January–February 2018, when the flocks of wild cliff-breeding rock pigeons
are more easily identified without being confused with the dovecotes’ resident pigeon population. In
that period, the resident population is maintained closed in the dovecotes for periodic health surveil-
lance and a census is also carried out. This contributes to better controlling the dovecotes’ resident
population and, at the same time, the probability of counting only wild cliff-breeding rock pigeons dur-
ing field surveys in fixed observation points is substantially higher. Moreover, the period in which pi-
geon counts were made coincides with the end of pigeons’ hunting season and the beginning of the
breeding season of the Bonelli’s eagle.
Rock pigeon abundance was expressed as the total number of pigeons counted per 10x10 km grid
cell.
Figure 3 | Location of sampling points used to estimate rock pigeon (Columba livia) abundance within the 10 x 10 km grid cells (ETRS89/Portugal TM06, EPSG: 3763) overlapping with the Bonelli’s eagle (Aquila fasciata) territories in the Douro Inter-national Natural Park. Bonelli’s eagle territories: HF-MI-10 (Miranda) | HF-BE-10 (Picote) | HF-BE-20 (Urrós) | HF-AL-10 (Bemposta) | HF-SA-10 (Lagoaça) | HF-SA-20 (Freixo) | HF-PO-20 (Ligares) | HF-AG-30 (Escalhão) | HF-AG-20 (Almofala).
3. RESULTS
3.1. Wild rabbit Oryctolagus cuniculus
Sixteen 2.5 x 2.5 km grid cells were sampled in the northern part of the Douro International Natural
Park between mid-July and early August 2017 (action D3) in order to estimate the relative abundance
of wild rabbit (based on latrine counts) in the territories of Bonelli’s eagle.
A total effort of 96.5 km was completed in 16 line transects of variable length (average ± std. error
(SE): 6.03 ± 0.28 km, Minimum – Maximum: 4.08 – 7.58 km) during the field surveys (Table 1).
The average KAI of rabbit latrines obtained for the grid cells sampled was (average ± SE, Min–Max)
3.47 ± 1.07, 0.00 – 11.52 latrines/km (Table 1). Nearly 70% of the grid cells sampled presented zero
or very low KAI values (0.0 – 5.0 latrines/km), whereas 18.8% and 12.5% of the remaining grid cells
showed low (5.1 – 9.9 latrines/km) and moderate (10.0 – 20.0 latrines/km) KAI values, respectively
(Table 1, Figure 4; see Simón et al. (2012) for a reference on latrine abundance classes).
The rabbit abundance was not homogeneous across the northern part of the project area, as well as
within the different territories of Bonelli’s eagles. The KAI values obtained in the territories of Picote,
Urrós and Bemposta showed a higher variability (with grid cells showing moderate, low and/or zero
values of latrine abundance) as compared to the territory of Miranda (Table 1, Figure 4).
The highest average KAI of latrines were found in the territories of Urrós (5.88 ± SE 2.20 latrines/km)
and Picote (4.90 ± SE 2.84 latrines/km), followed by the territories of Bemposta (2.48 ± SE 2.05 la-
trines/km) and Miranda do Douro (0.63 ± SE 0.43 latrines/km). In relation to the results obtained in
2016 (action A4), there was a slight increase of the average KAI values in the territories of Urrós, Pico-
te and Bemposta, whereas an inverse trend was found in the territory of Miranda do Douro (Table 2,
Figure 5).
Overall, the results obtained in 2017 are in line with the pattern observed in the surveys conducted in
2016 in the context of the action A4.
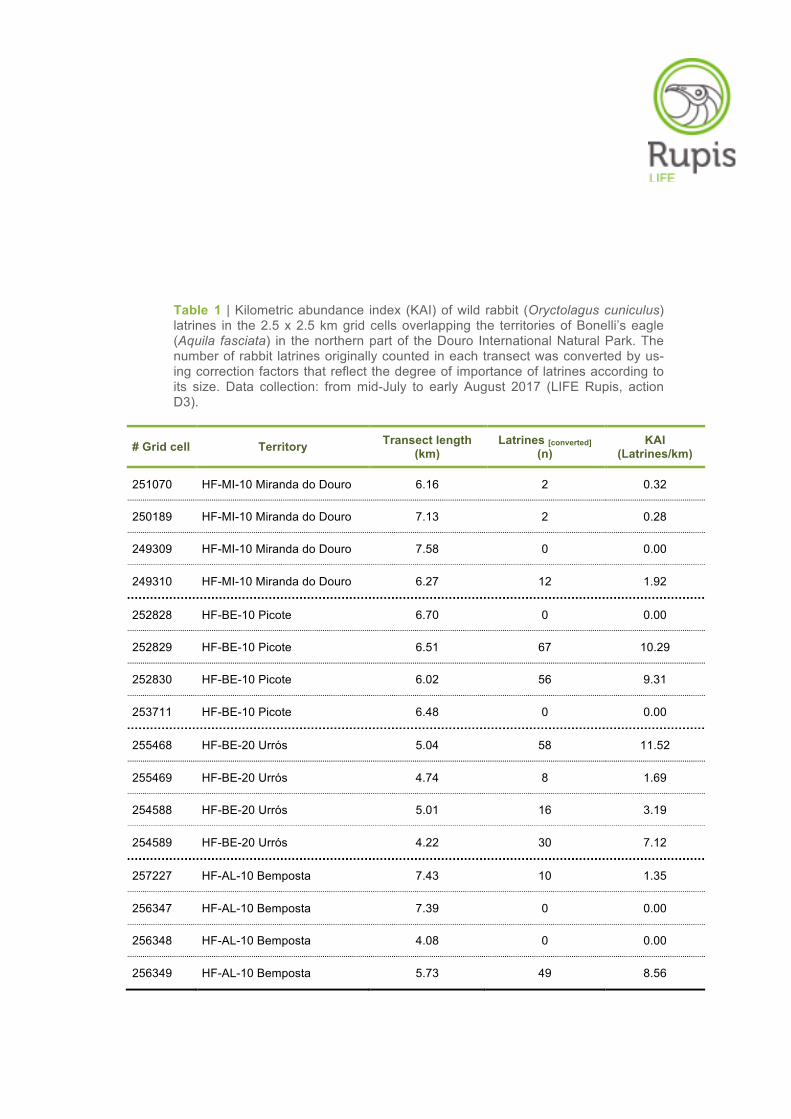
Table 1 | Kilometric abundance index (KAI) of wild rabbit (Oryctolagus cuniculus) latrines in the 2.5 x 2.5 km grid cells overlapping the territories of Bonelli’s eagle (Aquila fasciata) in the northern part of the Douro International Natural Park. The number of rabbit latrines originally counted in each transect was converted by us-ing correction factors that reflect the degree of importance of latrines according to its size. Data collection: from mid-July to early August 2017 (LIFE Rupis, action D3).
# Grid cell Territory Transect length (km)
Latrines [converted] (n)
KAI (Latrines/km)
251070 HF-MI-10 Miranda do Douro 6.16 2 0.32
250189 HF-MI-10 Miranda do Douro 7.13 2 0.28
249309 HF-MI-10 Miranda do Douro 7.58 0 0.00
249310 HF-MI-10 Miranda do Douro 6.27 12 1.92
252828 HF-BE-10 Picote 6.70 0 0.00
252829 HF-BE-10 Picote 6.51 67 10.29
252830 HF-BE-10 Picote 6.02 56 9.31
253711 HF-BE-10 Picote 6.48 0 0.00
255468 HF-BE-20 Urrós 5.04 58 11.52
255469 HF-BE-20 Urrós 4.74 8 1.69
254588 HF-BE-20 Urrós 5.01 16 3.19
254589 HF-BE-20 Urrós 4.22 30 7.12
257227 HF-AL-10 Bemposta 7.43 10 1.35
256347 HF-AL-10 Bemposta 7.39 0 0.00
256348 HF-AL-10 Bemposta 4.08 0 0.00
256349 HF-AL-10 Bemposta 5.73 49 8.56
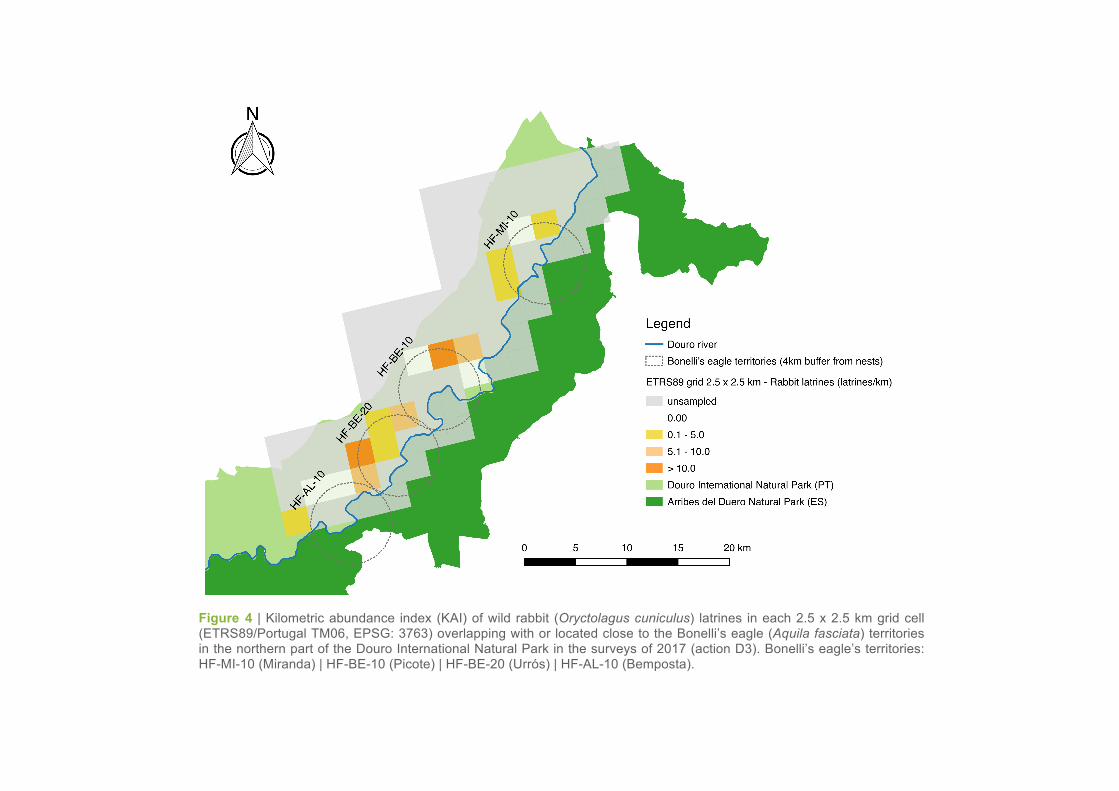
Figure 4 | Kilometric abundance index (KAI) of wild rabbit (Oryctolagus cuniculus) latrines in each 2.5 x 2.5 km grid cell (ETRS89/Portugal TM06, EPSG: 3763) overlapping with or located close to the Bonelli’s eagle (Aquila fasciata) territories in the northern part of the Douro International Natural Park in the surveys of 2017 (action D3). Bonelli’s eagle’s territories: HF-MI-10 (Miranda) | HF-BE-10 (Picote) | HF-BE-20 (Urrós) | HF-AL-10 (Bemposta).
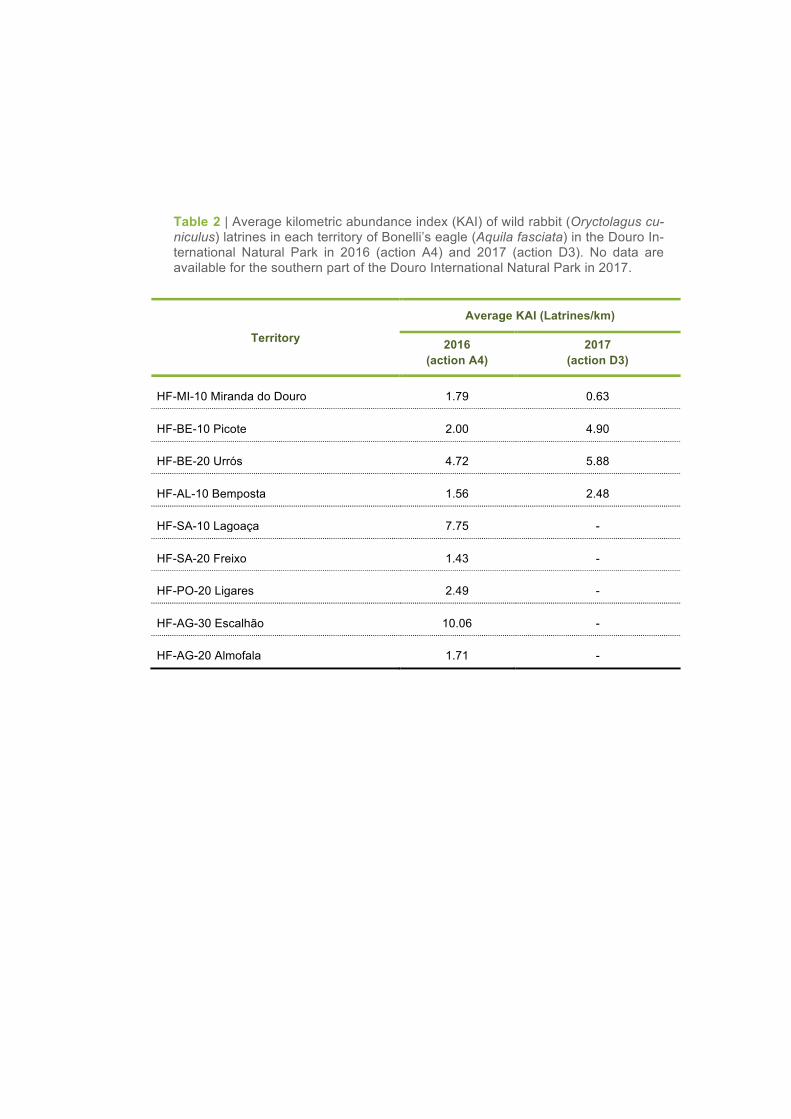
Table 2 | Average kilometric abundance index (KAI) of wild rabbit (Oryctolagus cu-niculus) latrines in each territory of Bonelli’s eagle (Aquila fasciata) in the Douro In-ternational Natural Park in 2016 (action A4) and 2017 (action D3). No data are available for the southern part of the Douro International Natural Park in 2017.
Territory
Average KAI (Latrines/km)
2016 (action A4)
2017 (action D3)
HF-MI-10 Miranda do Douro 1.79 0.63
HF-BE-10 Picote 2.00 4.90
HF-BE-20 Urrós 4.72 5.88
HF-AL-10 Bemposta 1.56 2.48
HF-SA-10 Lagoaça 7.75 -
HF-SA-20 Freixo 1.43 -
HF-PO-20 Ligares 2.49 -
HF-AG-30 Escalhão 10.06 -
HF-AG-20 Almofala 1.71 -
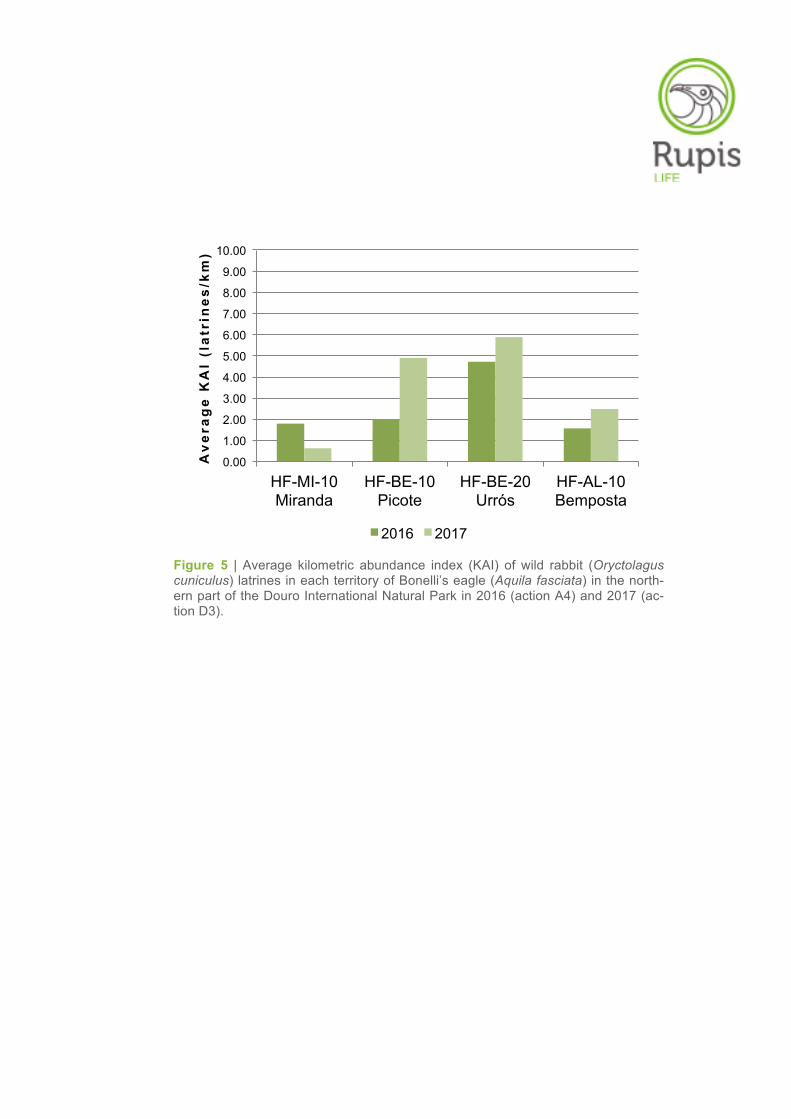
Figure 5 | Average kilometric abundance index (KAI) of wild rabbit (Oryctolagus cuniculus) latrines in each territory of Bonelli’s eagle (Aquila fasciata) in the north-ern part of the Douro International Natural Park in 2016 (action A4) and 2017 (ac-tion D3).
0.00
1.00
2.00
3.00
4.00
5.00
6.00
7.00
8.00
9.00
10.00
HF-MI-10 Miranda
HF-BE-10 Picote
HF-BE-20 Urrós
HF-AL-10 Bemposta
Av
era
ge
KA
I (l
atr
ine
s/k
m)
2016 2017
3.2. Red-legged partridge Alectoris rufa
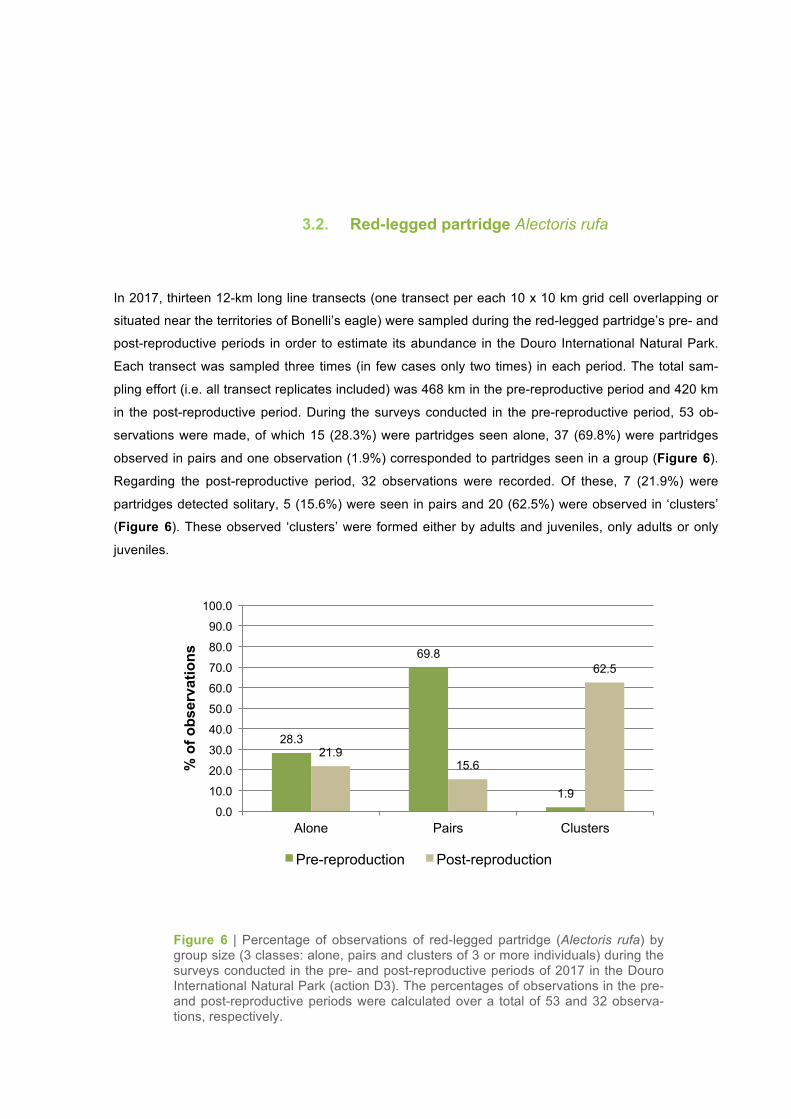
In 2017, thirteen 12-km long line transects (one transect per each 10 x 10 km grid cell overlapping or
situated near the territories of Bonelli’s eagle) were sampled during the red-legged partridge’s pre- and
post-reproductive periods in order to estimate its abundance in the Douro International Natural Park.
Each transect was sampled three times (in few cases only two times) in each period. The total sam-
pling effort (i.e. all transect replicates included) was 468 km in the pre-reproductive period and 420 km
in the post-reproductive period. During the surveys conducted in the pre-reproductive period, 53 ob-
servations were made, of which 15 (28.3%) were partridges seen alone, 37 (69.8%) were partridges
observed in pairs and one observation (1.9%) corresponded to partridges seen in a group (Figure 6).
Regarding the post-reproductive period, 32 observations were recorded. Of these, 7 (21.9%) were
partridges detected solitary, 5 (15.6%) were seen in pairs and 20 (62.5%) were observed in ‘clusters’
(Figure 6). These observed ‘clusters’ were formed either by adults and juveniles, only adults or only
juveniles.
Figure 6 | Percentage of observations of red-legged partridge (Alectoris rufa) by group size (3 classes: alone, pairs and clusters of 3 or more individuals) during the surveys conducted in the pre- and post-reproductive periods of 2017 in the Douro International Natural Park (action D3). The percentages of observations in the pre- and post-reproductive periods were calculated over a total of 53 and 32 observa-tions, respectively.
28.3
69.8
1.9
21.9 15.6
62.5
0.0
10.0
20.0
30.0
40.0
50.0
60.0
70.0
80.0
90.0
100.0
Alone Pairs Clusters
% o
f obs
erva
tions
Pre-reproduction Post-reproduction
From the replicates of each transect with the maximum number of partridge records, a kilometric
abundance index (KAI) and density estimates were calculated for all the 10 x 10 km grid cells sur-
veyed in the pre- and post-reproductive periods (Tables 3–4).
For the entire area surveyed, the KAI for partridge ranged from 0.17 to 0.83 individuals/km (average
0.38 ± SE 0.06) in the pre-reproductive period and from 0.00 to 1.00 individuals/km (average 0.43 ±
SE 0.10) in the post-reproductive period (Tables 3–4). The density of partridges, calculated within a
fixed-strip width of 25 m, varied between 0.03 and 0.17 individuals/ha (average 0.07 ± SE 0.01) in the
first survey period and between 0.00 and 0.20 individuals/ha (average 0.08 ± SE 0.02) in the second
survey period (Tables 3–4).
Regarding the spatial distribution of partridge abundances, different scenarios were observed between
the two survey periods (Figure 7). In the pre-reproductive period, the results showed a clear spatial
pattern between the northern and southern parts of the Douro International Natural Park. The highest
KAI and density values were obtained in those grid cells and territories situated in the southern part of
the study area, particularly in Almendra, Ligares and Freixo EC, where partridge abundances varied
from moderate to relatively high (Tables 3–5, Figure 7). In contrast, in the northern part of study area
(territories of Miranda do Douro, Picote, Urrós and Bemposta) the KAI and density values were in
general very low (Tables 3–5, Figure 7).
Contrary to what was observed in the first survey period, it was not possible to identify any spatial pat-
tern between the northern and southern parts of the Douro International area in terms of partridge
abundance in the post-reproductive period. The KAI and density values varied considerably throughout
the study area. The highest values were found in the grid cells/territories of Almofala and Aldeia Nova
(territory of Miranda), followed by the grid cells/territories of Escalhão, Freixo EC and Urrós. The re-
maining grid cells/territories showed low or very low KAI and density values (Tables 3–5, Figure 7).
No partridges were observed in Picote and Almendra during the field surveys conducted in the post-
reproductive period (see Table 4).
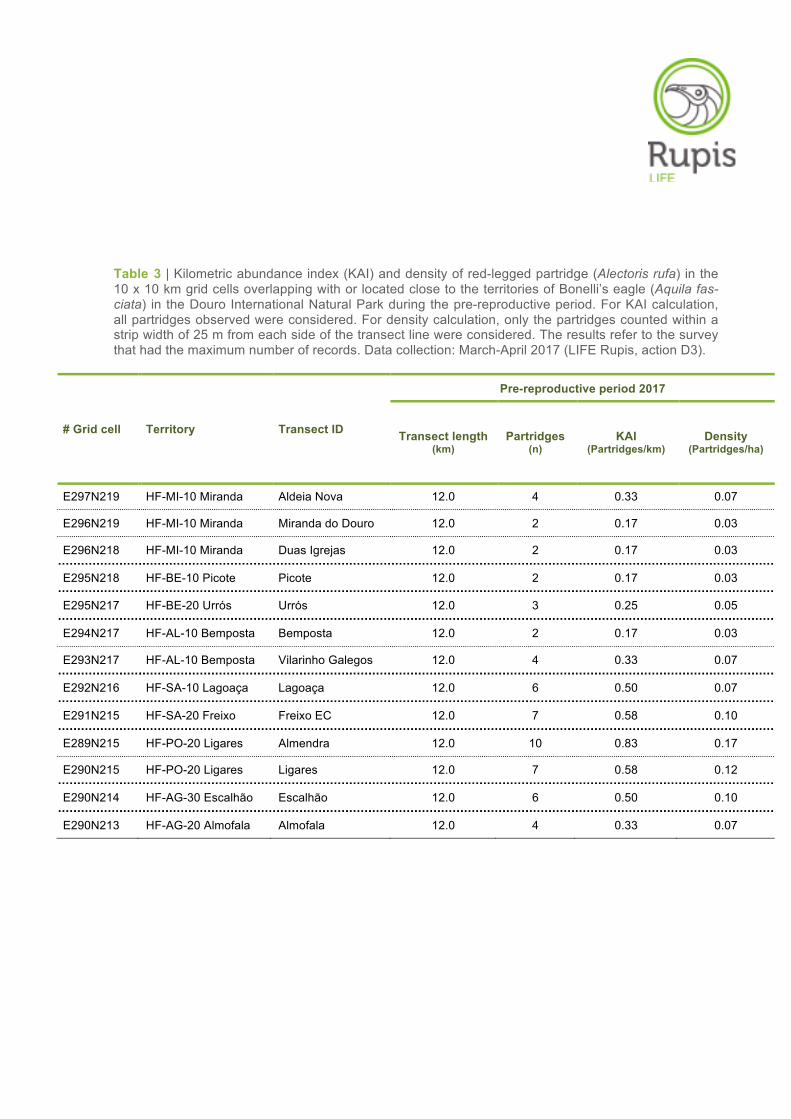
Table 3 | Kilometric abundance index (KAI) and density of red-legged partridge (Alectoris rufa) in the 10 x 10 km grid cells overlapping with or located close to the territories of Bonelli’s eagle (Aquila fas-ciata) in the Douro International Natural Park during the pre-reproductive period. For KAI calculation, all partridges observed were considered. For density calculation, only the partridges counted within a strip width of 25 m from each side of the transect line were considered. The results refer to the survey that had the maximum number of records. Data collection: March-April 2017 (LIFE Rupis, action D3).
# Grid cell Territory Transect ID
Pre-reproductive period 2017
Transect length (km)
Partridges (n)
KAI (Partridges/km)
Density (Partridges/ha)
E297N219 HF-MI-10 Miranda Aldeia Nova 12.0 4 0.33 0.07
E296N219 HF-MI-10 Miranda Miranda do Douro 12.0 2 0.17 0.03
E296N218 HF-MI-10 Miranda Duas Igrejas 12.0 2 0.17 0.03
E295N218 HF-BE-10 Picote Picote 12.0 2 0.17 0.03
E295N217 HF-BE-20 Urrós Urrós 12.0 3 0.25 0.05
E294N217 HF-AL-10 Bemposta Bemposta 12.0 2 0.17 0.03
E293N217 HF-AL-10 Bemposta Vilarinho Galegos 12.0 4 0.33 0.07
E292N216 HF-SA-10 Lagoaça Lagoaça 12.0 6 0.50 0.07
E291N215 HF-SA-20 Freixo Freixo EC 12.0 7 0.58 0.10
E289N215 HF-PO-20 Ligares Almendra 12.0 10 0.83 0.17
E290N215 HF-PO-20 Ligares Ligares 12.0 7 0.58 0.12
E290N214 HF-AG-30 Escalhão Escalhão 12.0 6 0.50 0.10
E290N213 HF-AG-20 Almofala Almofala 12.0 4 0.33 0.07
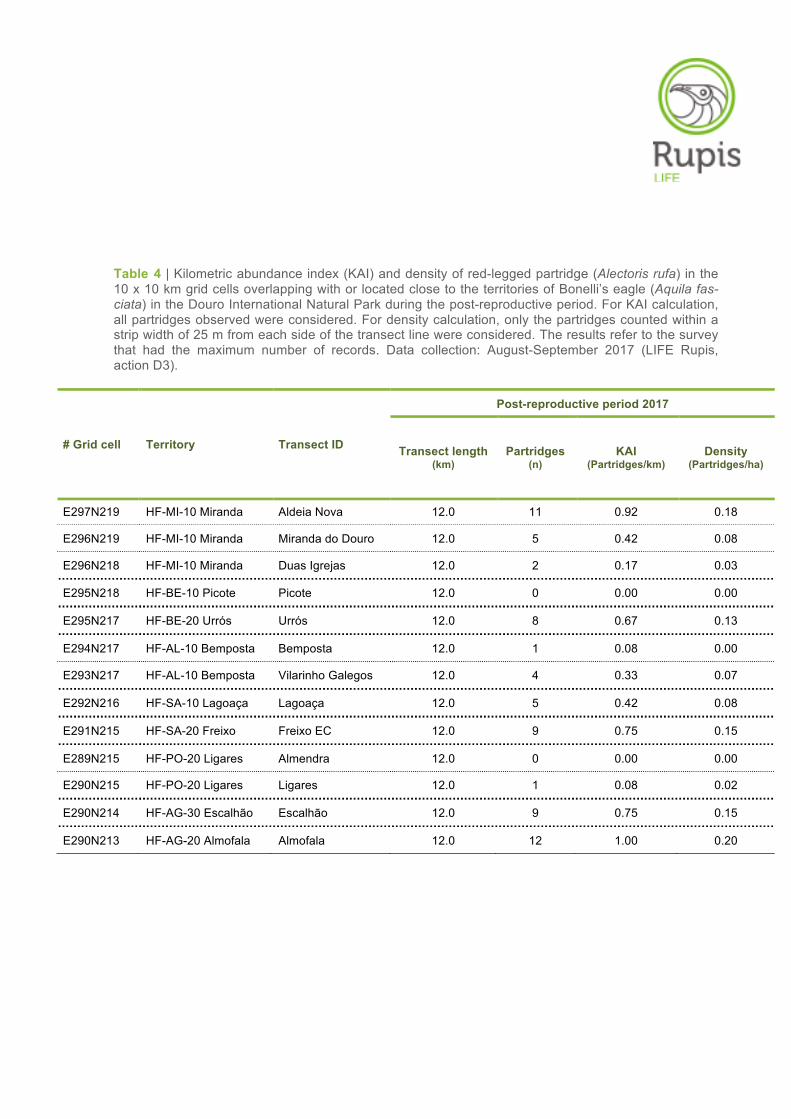
Table 4 | Kilometric abundance index (KAI) and density of red-legged partridge (Alectoris rufa) in the 10 x 10 km grid cells overlapping with or located close to the territories of Bonelli’s eagle (Aquila fas-ciata) in the Douro International Natural Park during the post-reproductive period. For KAI calculation, all partridges observed were considered. For density calculation, only the partridges counted within a strip width of 25 m from each side of the transect line were considered. The results refer to the survey that had the maximum number of records. Data collection: August-September 2017 (LIFE Rupis, action D3).
# Grid cell Territory Transect ID
Post-reproductive period 2017
Transect length (km)
Partridges (n)
KAI (Partridges/km)
Density (Partridges/ha)
E297N219 HF-MI-10 Miranda Aldeia Nova 12.0 11 0.92 0.18
E296N219 HF-MI-10 Miranda Miranda do Douro 12.0 5 0.42 0.08
E296N218 HF-MI-10 Miranda Duas Igrejas 12.0 2 0.17 0.03
E295N218 HF-BE-10 Picote Picote 12.0 0 0.00 0.00
E295N217 HF-BE-20 Urrós Urrós 12.0 8 0.67 0.13
E294N217 HF-AL-10 Bemposta Bemposta 12.0 1 0.08 0.00
E293N217 HF-AL-10 Bemposta Vilarinho Galegos 12.0 4 0.33 0.07
E292N216 HF-SA-10 Lagoaça Lagoaça 12.0 5 0.42 0.08
E291N215 HF-SA-20 Freixo Freixo EC 12.0 9 0.75 0.15
E289N215 HF-PO-20 Ligares Almendra 12.0 0 0.00 0.00
E290N215 HF-PO-20 Ligares Ligares 12.0 1 0.08 0.02
E290N214 HF-AG-30 Escalhão Escalhão 12.0 9 0.75 0.15
E290N213 HF-AG-20 Almofala Almofala 12.0 12 1.00 0.20
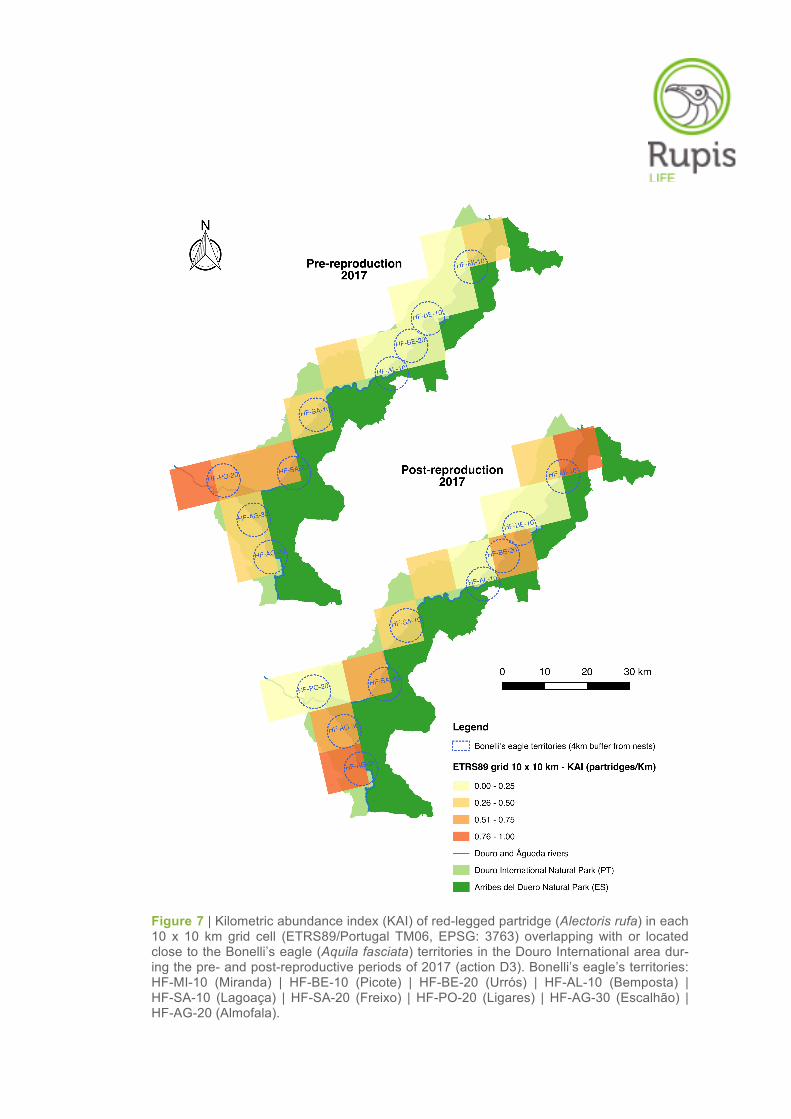
Figure 7 | Kilometric abundance index (KAI) of red-legged partridge (Alectoris rufa) in each 10 x 10 km grid cell (ETRS89/Portugal TM06, EPSG: 3763) overlapping with or located close to the Bonelli’s eagle (Aquila fasciata) territories in the Douro International area dur-ing the pre- and post-reproductive periods of 2017 (action D3). Bonelli’s eagle’s territories: HF-MI-10 (Miranda) | HF-BE-10 (Picote) | HF-BE-20 (Urrós) | HF-AL-10 (Bemposta) | HF-SA-10 (Lagoaça) | HF-SA-20 (Freixo) | HF-PO-20 (Ligares) | HF-AG-30 (Escalhão) | HF-AG-20 (Almofala).
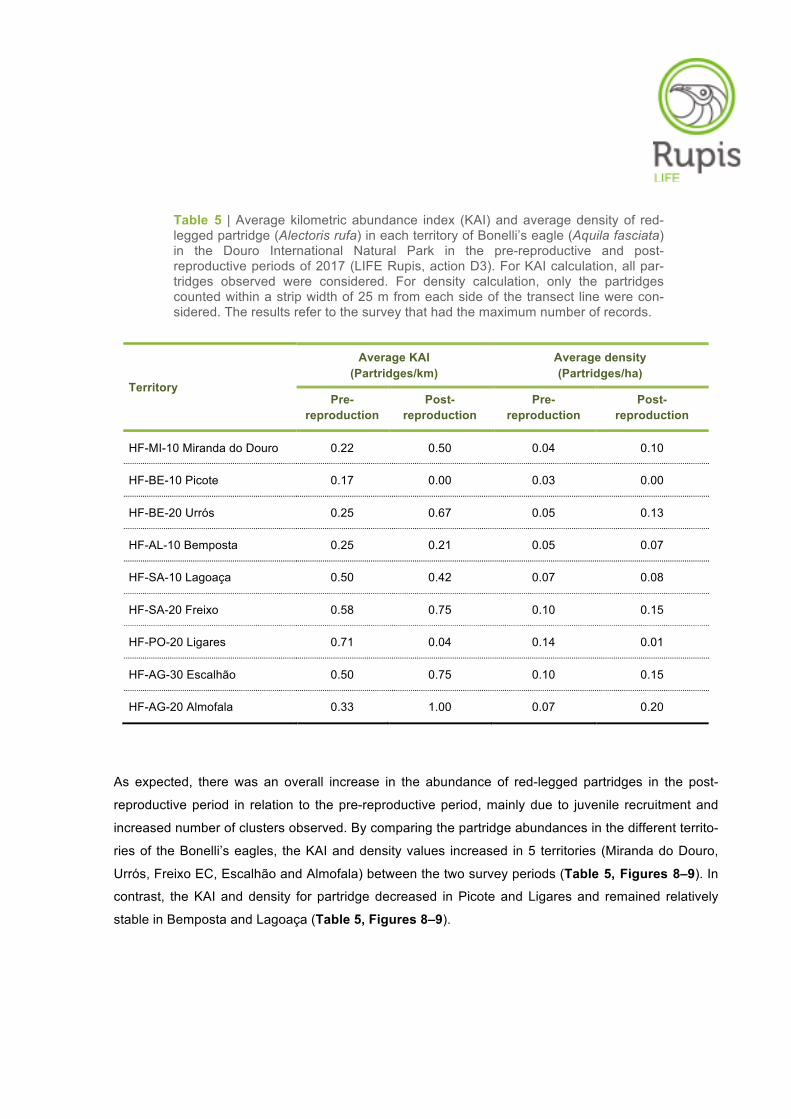
Table 5 | Average kilometric abundance index (KAI) and average density of red-legged partridge (Alectoris rufa) in each territory of Bonelli’s eagle (Aquila fasciata) in the Douro International Natural Park in the pre-reproductive and post-reproductive periods of 2017 (LIFE Rupis, action D3). For KAI calculation, all par-tridges observed were considered. For density calculation, only the partridges counted within a strip width of 25 m from each side of the transect line were con-sidered. The results refer to the survey that had the maximum number of records.
Territory
Average KAI (Partridges/km)
Average density (Partridges/ha)
Pre-reproduction
Post-reproduction
Pre-reproduction
Post-reproduction
HF-MI-10 Miranda do Douro 0.22 0.50 0.04 0.10
HF-BE-10 Picote 0.17 0.00 0.03 0.00
HF-BE-20 Urrós 0.25 0.67 0.05 0.13
HF-AL-10 Bemposta 0.25 0.21 0.05 0.07
HF-SA-10 Lagoaça 0.50 0.42 0.07 0.08
HF-SA-20 Freixo 0.58 0.75 0.10 0.15
HF-PO-20 Ligares 0.71 0.04 0.14 0.01
HF-AG-30 Escalhão 0.50 0.75 0.10 0.15
HF-AG-20 Almofala 0.33 1.00 0.07 0.20
As expected, there was an overall increase in the abundance of red-legged partridges in the post-
reproductive period in relation to the pre-reproductive period, mainly due to juvenile recruitment and
increased number of clusters observed. By comparing the partridge abundances in the different territo-
ries of the Bonelli’s eagles, the KAI and density values increased in 5 territories (Miranda do Douro,
Urrós, Freixo EC, Escalhão and Almofala) between the two survey periods (Table 5, Figures 8–9). In
contrast, the KAI and density for partridge decreased in Picote and Ligares and remained relatively
stable in Bemposta and Lagoaça (Table 5, Figures 8–9).
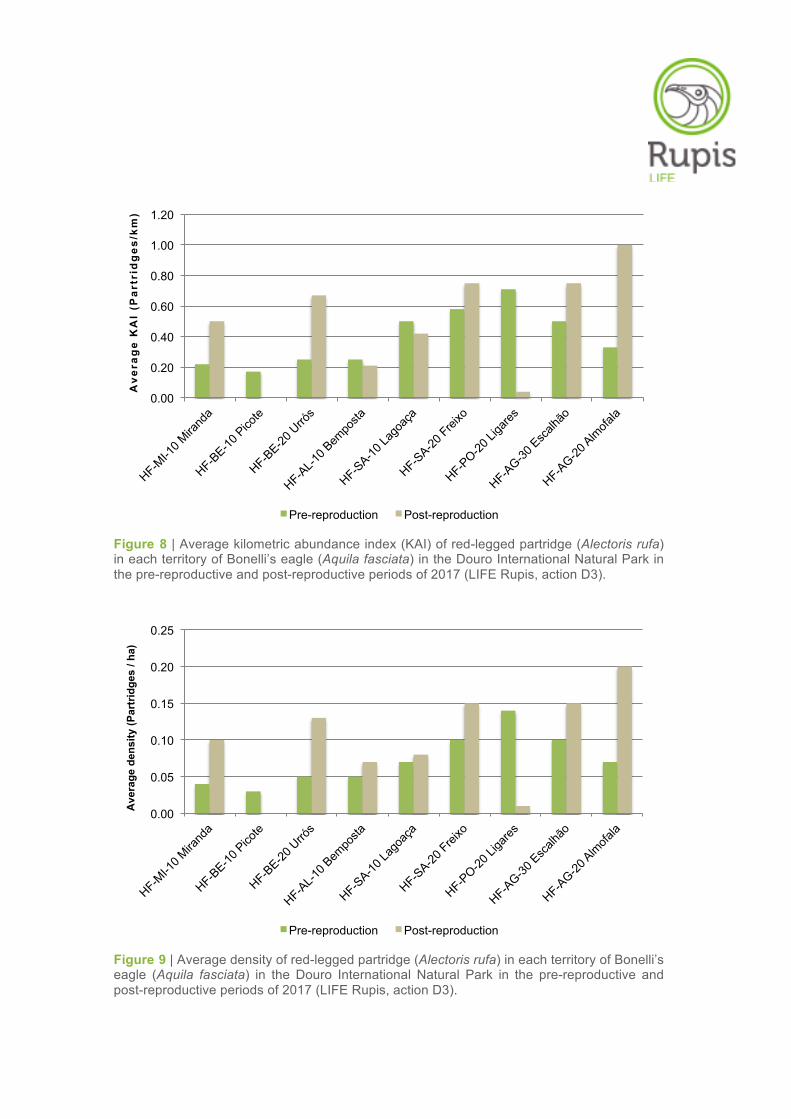
Figure 8 | Average kilometric abundance index (KAI) of red-legged partridge (Alectoris rufa) in each territory of Bonelli’s eagle (Aquila fasciata) in the Douro International Natural Park in the pre-reproductive and post-reproductive periods of 2017 (LIFE Rupis, action D3).
Figure 9 | Average density of red-legged partridge (Alectoris rufa) in each territory of Bonelli’s eagle (Aquila fasciata) in the Douro International Natural Park in the pre-reproductive and post-reproductive periods of 2017 (LIFE Rupis, action D3).
0.00
0.20
0.40
0.60
0.80
1.00
1.20
Ave
rag
e K
AI
(Par
trid
ges
/km
)
Pre-reproduction Post-reproduction
0.00
0.05
0.10
0.15
0.20
0.25
Ave
rage
den
sity
(Par
trid
ges
/ ha)
Pre-reproduction Post-reproduction
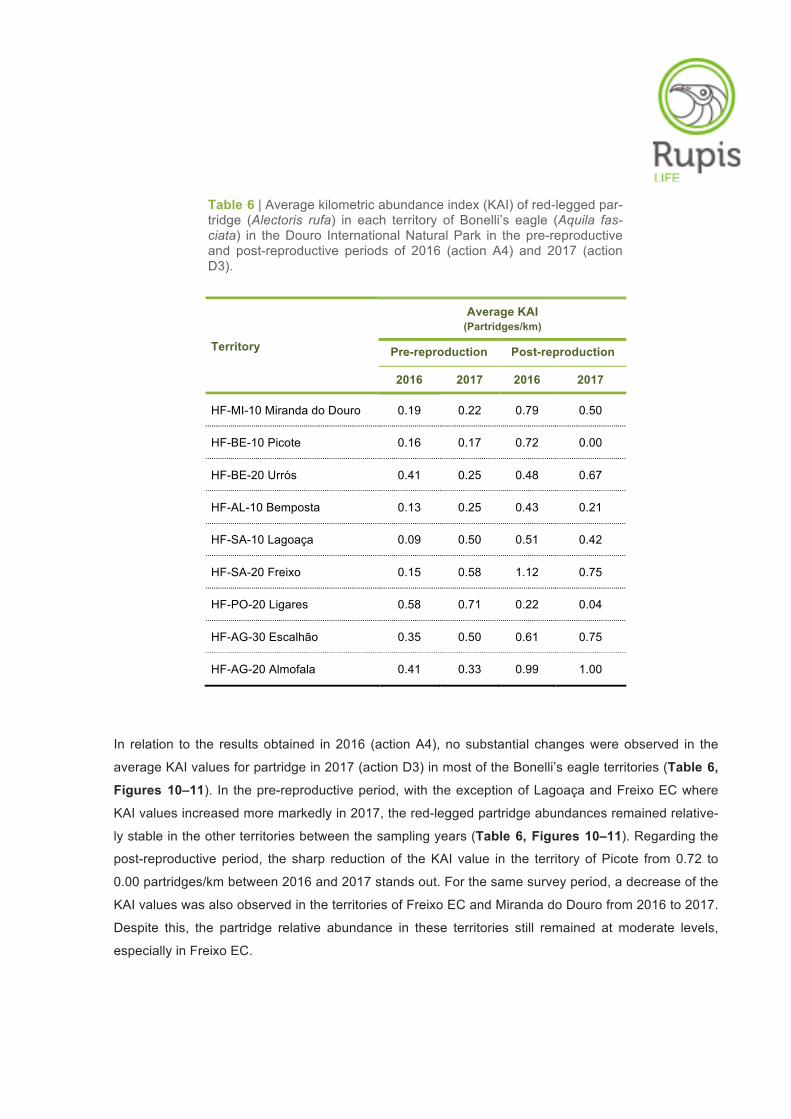
Table 6 | Average kilometric abundance index (KAI) of red-legged par-tridge (Alectoris rufa) in each territory of Bonelli’s eagle (Aquila fas-ciata) in the Douro International Natural Park in the pre-reproductive and post-reproductive periods of 2016 (action A4) and 2017 (action D3).
Territory
Average KAI (Partridges/km)
Pre-reproduction Post-reproduction
2016 2017 2016 2017
HF-MI-10 Miranda do Douro 0.19 0.22 0.79 0.50
HF-BE-10 Picote 0.16 0.17 0.72 0.00
HF-BE-20 Urrós 0.41 0.25 0.48 0.67
HF-AL-10 Bemposta 0.13 0.25 0.43 0.21
HF-SA-10 Lagoaça 0.09 0.50 0.51 0.42
HF-SA-20 Freixo 0.15 0.58 1.12 0.75
HF-PO-20 Ligares 0.58 0.71 0.22 0.04
HF-AG-30 Escalhão 0.35 0.50 0.61 0.75
HF-AG-20 Almofala 0.41 0.33 0.99 1.00
In relation to the results obtained in 2016 (action A4), no substantial changes were observed in the
average KAI values for partridge in 2017 (action D3) in most of the Bonelli’s eagle territories (Table 6,
Figures 10–11). In the pre-reproductive period, with the exception of Lagoaça and Freixo EC where
KAI values increased more markedly in 2017, the red-legged partridge abundances remained relative-
ly stable in the other territories between the sampling years (Table 6, Figures 10–11). Regarding the
post-reproductive period, the sharp reduction of the KAI value in the territory of Picote from 0.72 to
0.00 partridges/km between 2016 and 2017 stands out. For the same survey period, a decrease of the
KAI values was also observed in the territories of Freixo EC and Miranda do Douro from 2016 to 2017.
Despite this, the partridge relative abundance in these territories still remained at moderate levels,
especially in Freixo EC.
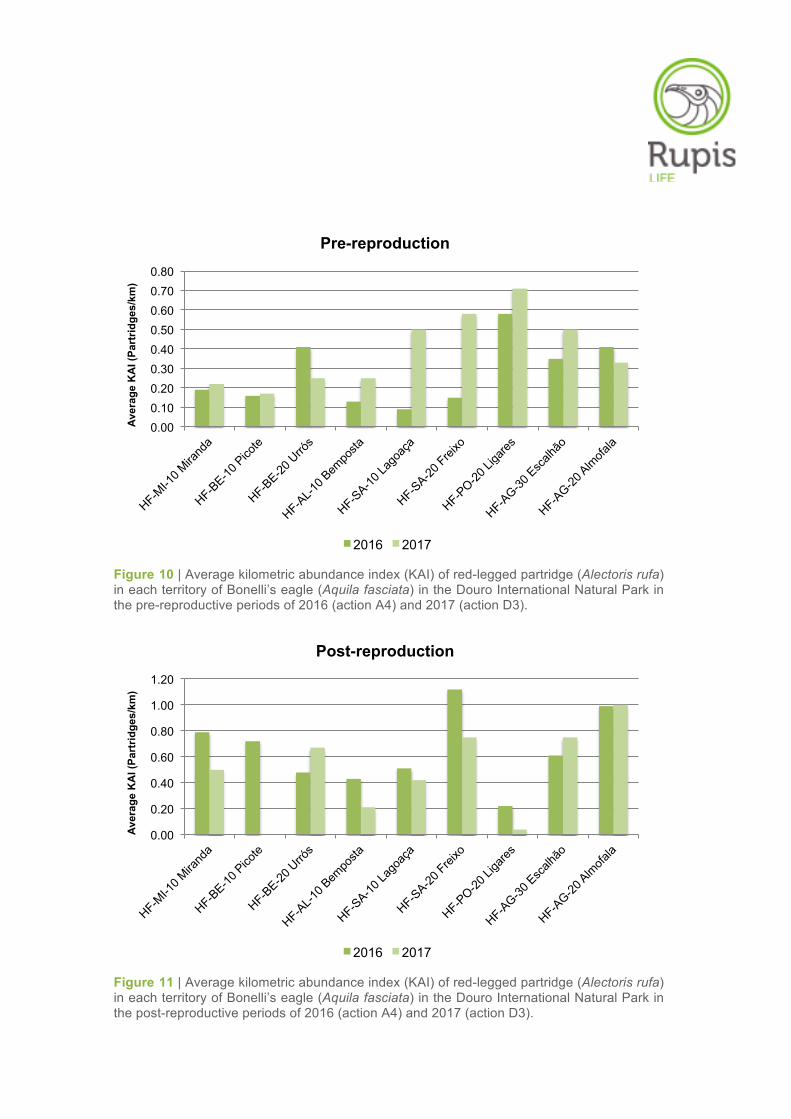
Figure 10 | Average kilometric abundance index (KAI) of red-legged partridge (Alectoris rufa) in each territory of Bonelli’s eagle (Aquila fasciata) in the Douro International Natural Park in the pre-reproductive periods of 2016 (action A4) and 2017 (action D3).
Figure 11 | Average kilometric abundance index (KAI) of red-legged partridge (Alectoris rufa) in each territory of Bonelli’s eagle (Aquila fasciata) in the Douro International Natural Park in the post-reproductive periods of 2016 (action A4) and 2017 (action D3).
0.00 0.10 0.20 0.30 0.40 0.50 0.60 0.70 0.80
Aver
age
KA
I (Pa
rtrid
ges/
km)
Pre-reproduction
2016 2017
0.00
0.20
0.40
0.60
0.80
1.00
1.20
Aver
age
KA
I (Pa
rtrid
ges/
km)
Post-reproduction
2016 2017
In point counts, the total sampling effort was 29.25 h in the pre-reproductive period and 26.25 h in the
post-reproductive period. These values include all visits (replicates) to the line transects sampled,
along which the point counts were distributed. Nine points were sampled per line transect (see
Methods section for details).
A total of 11 contacts (i.e. visual or auditory detections) with partridges were recorded in the pre-
reproductive period, of which 7 (63.6%) were auditory and 4 (36.4%) were direct observations. Of the-
se visual contacts, 2 (50%) were partridges seen solitary and 2 other observations (50%) correspond-
ed to partridge pairs. Concerning the post-reproductive period, only 3 contacts were recorded (2 were
auditory contacts and 1 was a direct observation of a cluster of five individuals).
The replicate with the highest number of contacts (per set of points distributed along each transect)
was used to calculate a punctual abundance index (PAI) and density estimates for all the 10 x 10 km
grid cells surveyed during the pre- and post-reproductive periods (Tables 7–8).
The PAI for partridge ranged from 0.00 to 0.33 individuals/point (average 0.09 ± SE 0.03) in the pre-
reproductive period and between 0.00 and 0.67 individuals/point (average 0.06 ± SE 0.05) in the post-
reproductive period (Tables 7–8). In the first survey period, the highest PAI value was obtained in
Lagoaça (0.33 individuals/point), followed by Urrós and Escalhão (0.22 individuals/point) and then by
Miranda do Douro, Bemposta and Almendra (0.11 individuals/point) (Table 7). No visual and/or audito-
ry records were made during point count sampling in the remaining grid cells (Table 7). Regarding the
second survey period, the maximum value of red-legged partridge relative abundance was obtained in
Aldeia Nova (0.67 individuals/point), territory of Miranda do Douro (Table 8). The PAI values were zero
in the remaining grid cells/territories, with the exception of Urrós, where partridge relative abundance
was 0.11 individuals/point (Table 8).
The partridge densities are also shown in Tables 7–8 for both survey periods. By using a fixed-radius
of 25 m, the density values varied between 0.00 and 0.04 partridges/ha in the pre-reproductive period,
with the highest value observed in the grid cell/territory of Escalhão (Table 7). In the post-reproductive
period, by using the same calculation approach, the density values were zero in all grid cells/territories
(Table 8).
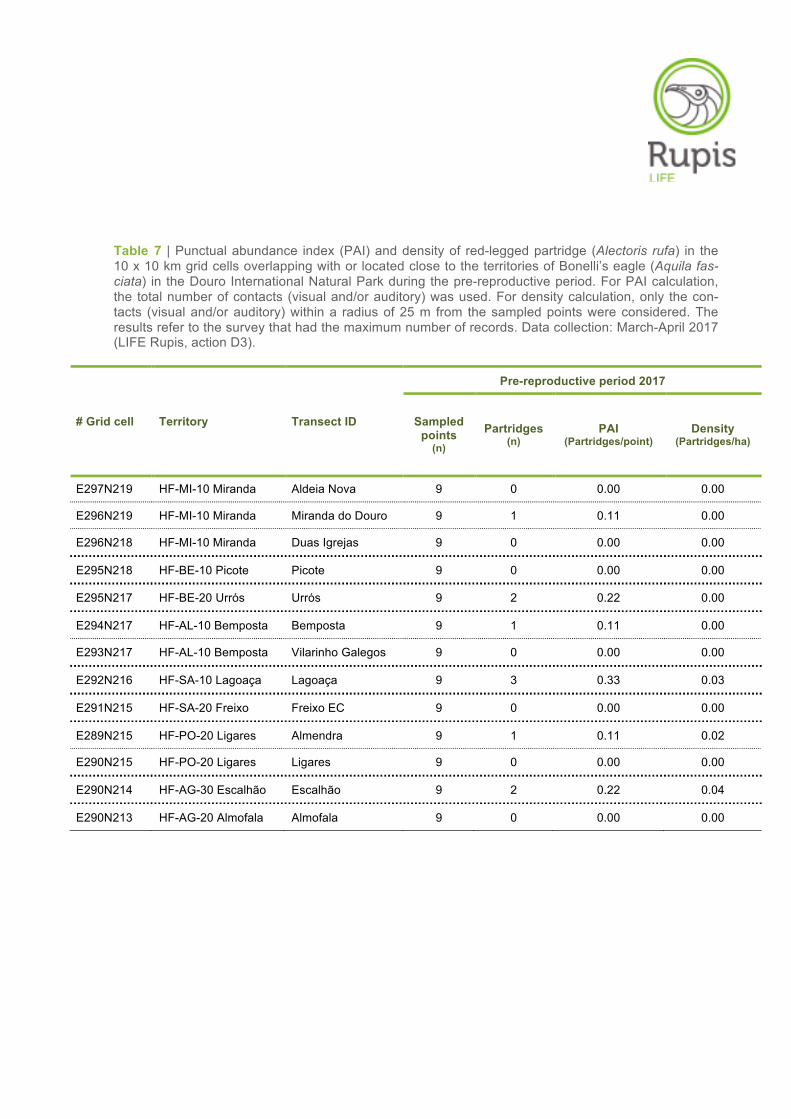
Table 7 | Punctual abundance index (PAI) and density of red-legged partridge (Alectoris rufa) in the 10 x 10 km grid cells overlapping with or located close to the territories of Bonelli’s eagle (Aquila fas-ciata) in the Douro International Natural Park during the pre-reproductive period. For PAI calculation, the total number of contacts (visual and/or auditory) was used. For density calculation, only the con-tacts (visual and/or auditory) within a radius of 25 m from the sampled points were considered. The results refer to the survey that had the maximum number of records. Data collection: March-April 2017 (LIFE Rupis, action D3).
# Grid cell Territory Transect ID
Pre-reproductive period 2017
Sampled points
(n)
Partridges (n)
PAI (Partridges/point)
Density (Partridges/ha)
E297N219 HF-MI-10 Miranda Aldeia Nova 9 0 0.00 0.00
E296N219 HF-MI-10 Miranda Miranda do Douro 9 1 0.11 0.00
E296N218 HF-MI-10 Miranda Duas Igrejas 9 0 0.00 0.00
E295N218 HF-BE-10 Picote Picote 9 0 0.00 0.00
E295N217 HF-BE-20 Urrós Urrós 9 2 0.22 0.00
E294N217 HF-AL-10 Bemposta Bemposta 9 1 0.11 0.00
E293N217 HF-AL-10 Bemposta Vilarinho Galegos 9 0 0.00 0.00
E292N216 HF-SA-10 Lagoaça Lagoaça 9 3 0.33 0.03
E291N215 HF-SA-20 Freixo Freixo EC 9 0 0.00 0.00
E289N215 HF-PO-20 Ligares Almendra 9 1 0.11 0.02
E290N215 HF-PO-20 Ligares Ligares 9 0 0.00 0.00
E290N214 HF-AG-30 Escalhão Escalhão 9 2 0.22 0.04
E290N213 HF-AG-20 Almofala Almofala 9 0 0.00 0.00
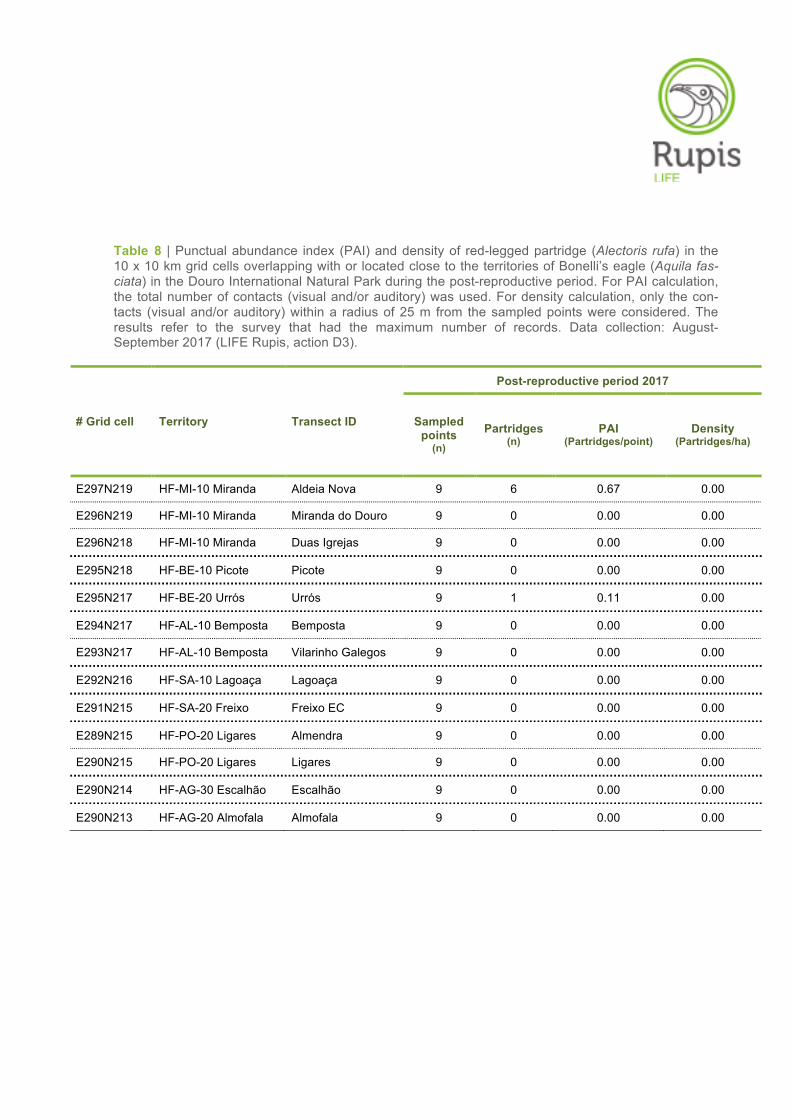
Table 8 | Punctual abundance index (PAI) and density of red-legged partridge (Alectoris rufa) in the 10 x 10 km grid cells overlapping with or located close to the territories of Bonelli’s eagle (Aquila fas-ciata) in the Douro International Natural Park during the post-reproductive period. For PAI calculation, the total number of contacts (visual and/or auditory) was used. For density calculation, only the con-tacts (visual and/or auditory) within a radius of 25 m from the sampled points were considered. The results refer to the survey that had the maximum number of records. Data collection: August-September 2017 (LIFE Rupis, action D3).
# Grid cell Territory Transect ID
Post-reproductive period 2017
Sampled points
(n)
Partridges (n)
PAI (Partridges/point)
Density (Partridges/ha)
E297N219 HF-MI-10 Miranda Aldeia Nova 9 6 0.67 0.00
E296N219 HF-MI-10 Miranda Miranda do Douro 9 0 0.00 0.00
E296N218 HF-MI-10 Miranda Duas Igrejas 9 0 0.00 0.00
E295N218 HF-BE-10 Picote Picote 9 0 0.00 0.00
E295N217 HF-BE-20 Urrós Urrós 9 1 0.11 0.00
E294N217 HF-AL-10 Bemposta Bemposta 9 0 0.00 0.00
E293N217 HF-AL-10 Bemposta Vilarinho Galegos 9 0 0.00 0.00
E292N216 HF-SA-10 Lagoaça Lagoaça 9 0 0.00 0.00
E291N215 HF-SA-20 Freixo Freixo EC 9 0 0.00 0.00
E289N215 HF-PO-20 Ligares Almendra 9 0 0.00 0.00
E290N215 HF-PO-20 Ligares Ligares 9 0 0.00 0.00
E290N214 HF-AG-30 Escalhão Escalhão 9 0 0.00 0.00
E290N213 HF-AG-20 Almofala Almofala 9 0 0.00 0.00
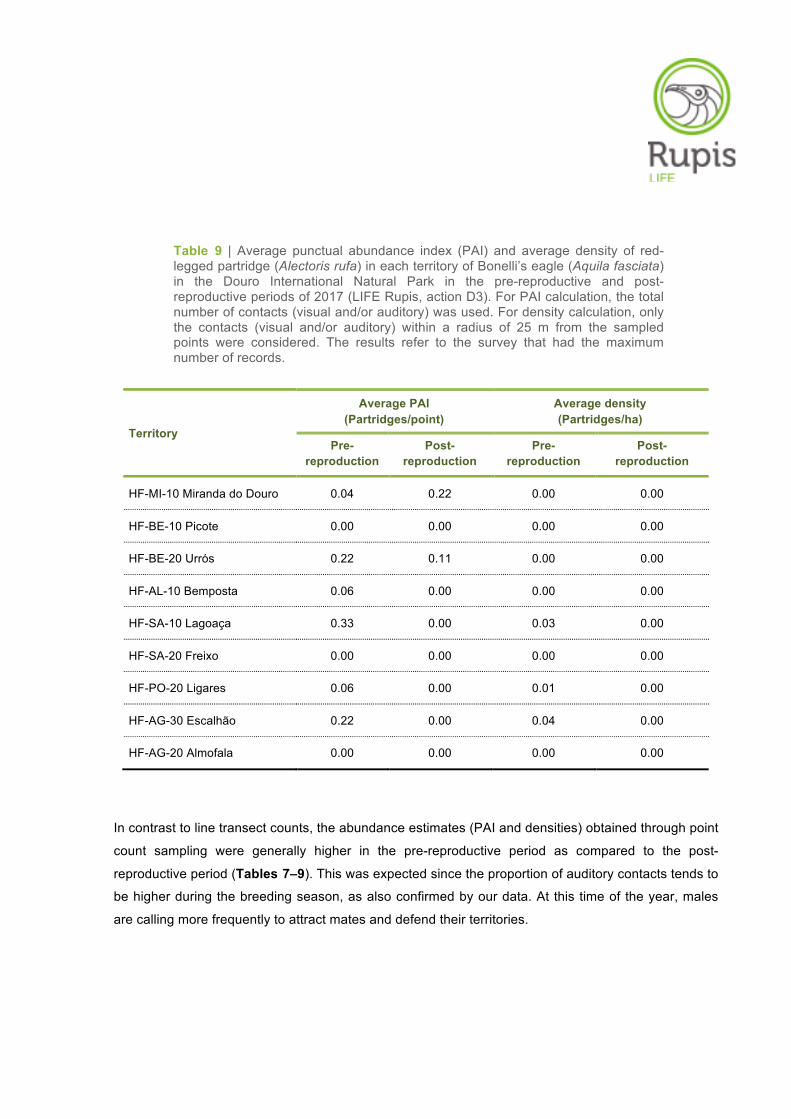
Table 9 | Average punctual abundance index (PAI) and average density of red-legged partridge (Alectoris rufa) in each territory of Bonelli’s eagle (Aquila fasciata) in the Douro International Natural Park in the pre-reproductive and post-reproductive periods of 2017 (LIFE Rupis, action D3). For PAI calculation, the total number of contacts (visual and/or auditory) was used. For density calculation, only the contacts (visual and/or auditory) within a radius of 25 m from the sampled points were considered. The results refer to the survey that had the maximum number of records.
Territory
Average PAI (Partridges/point)
Average density (Partridges/ha)
Pre-reproduction
Post-reproduction
Pre-reproduction
Post-reproduction
HF-MI-10 Miranda do Douro 0.04 0.22 0.00 0.00
HF-BE-10 Picote 0.00 0.00 0.00 0.00
HF-BE-20 Urrós 0.22 0.11 0.00 0.00
HF-AL-10 Bemposta 0.06 0.00 0.00 0.00
HF-SA-10 Lagoaça 0.33 0.00 0.03 0.00
HF-SA-20 Freixo 0.00 0.00 0.00 0.00
HF-PO-20 Ligares 0.06 0.00 0.01 0.00
HF-AG-30 Escalhão 0.22 0.00 0.04 0.00
HF-AG-20 Almofala 0.00 0.00 0.00 0.00
In contrast to line transect counts, the abundance estimates (PAI and densities) obtained through point
count sampling were generally higher in the pre-reproductive period as compared to the post-
reproductive period (Tables 7–9). This was expected since the proportion of auditory contacts tends to
be higher during the breeding season, as also confirmed by our data. At this time of the year, males
are calling more frequently to attract mates and defend their territories.
3.3. Rock pigeon Columba livia
A total of eleven 10 x 10 km grid cells were sampled during January–February 2018 for estimating the
abundance of rock pigeons in the Douro International Natural Park. Four observation points were
monitored in each grid cell (with the exception of Miranda do Douro sector where only three points
were monitored), resulting in 43 observation points surveyed. A total effort of 43 h was completed (one
hour per observation point).
Forty-three observations were made, of which 10 (23.3%) were pigeons detected alone and 33
(76.7%) were pigeons seen in flocks of two or more individuals.
In total, 430 rock pigeons were counted in the entire area sampled (Table 10). The average number of
pigeons counted per grid cell was 39.09 (± SE 11.49, Min – Max: 2 – 130 pigeons/grid cell). Flock size
varied from 2 to 80 pigeons (average 12.73 ± SE 2.95).
The spatial distribution of rock pigeon abundance was not homogeneous across the Douro Interna-
tional area (Figure 12). The highest abundance of pigeons was found in the grid cell/territory of
Bemposta (> 100 individuals), whereas the lowest abundances were observed in the grid cells of
Picote, Lagoaça, Escalhão and Almofala (≤ 20 individuals) (Table 10, Figure 12).
Despite some fluctuations in the number of pigeons counted, the results obtained in 2018 (action D3)
were similar to those obtained in the surveys conducted in 2017 (action A4). The number of rock
pigeons was consistently higher in Bemposta in both sampling years (Table 10, Figure 12). On the
other hand, the grid cells/territories of Picote, Lagoaça and Escalhão showed the lowest pigeon abun-
dances for the second consecutive year of monitoring (Table 10, Figure 12).
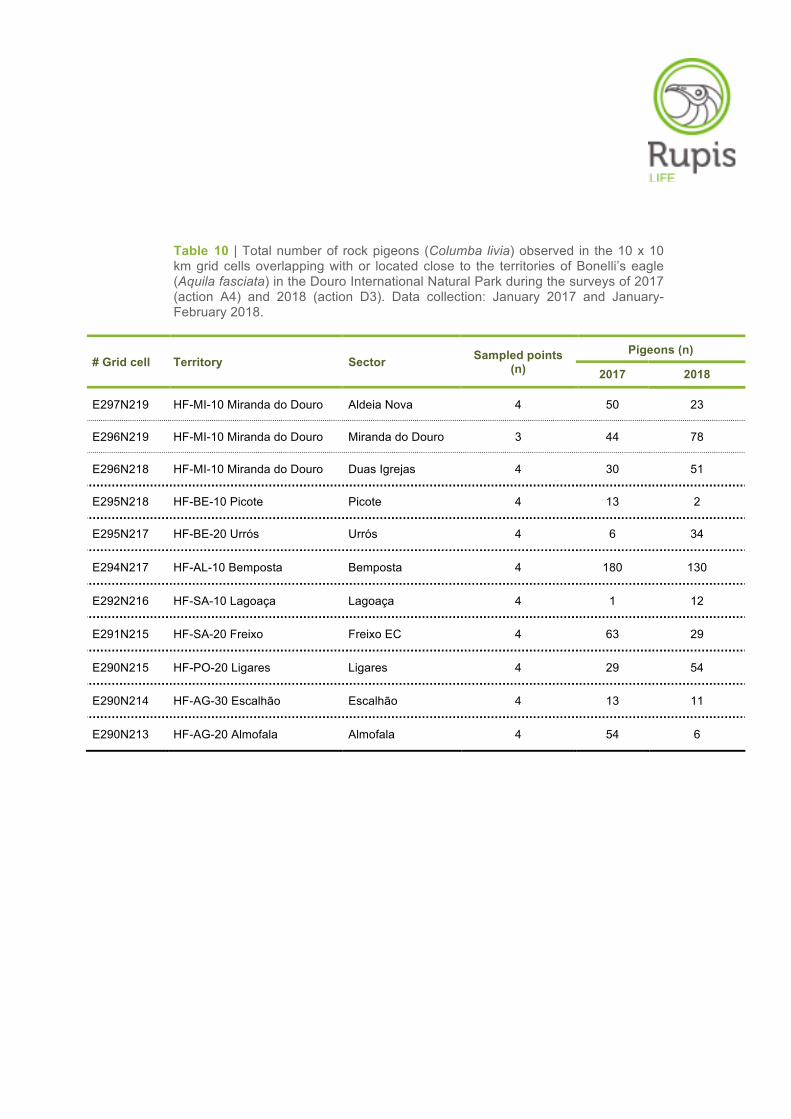
Table 10 | Total number of rock pigeons (Columba livia) observed in the 10 x 10 km grid cells overlapping with or located close to the territories of Bonelli’s eagle (Aquila fasciata) in the Douro International Natural Park during the surveys of 2017 (action A4) and 2018 (action D3). Data collection: January 2017 and January-February 2018.
# Grid cell Territory Sector Sampled points (n)
Pigeons (n)
2017 2018
E297N219 HF-MI-10 Miranda do Douro Aldeia Nova 4 50 23
E296N219 HF-MI-10 Miranda do Douro Miranda do Douro 3 44 78
E296N218 HF-MI-10 Miranda do Douro Duas Igrejas 4 30 51
E295N218 HF-BE-10 Picote Picote 4 13 2
E295N217 HF-BE-20 Urrós Urrós 4 6 34
E294N217 HF-AL-10 Bemposta Bemposta 4 180 130
E292N216 HF-SA-10 Lagoaça Lagoaça 4 1 12
E291N215 HF-SA-20 Freixo Freixo EC 4 63 29
E290N215 HF-PO-20 Ligares Ligares 4 29 54
E290N214 HF-AG-30 Escalhão Escalhão 4 13 11
E290N213 HF-AG-20 Almofala Almofala 4 54 6
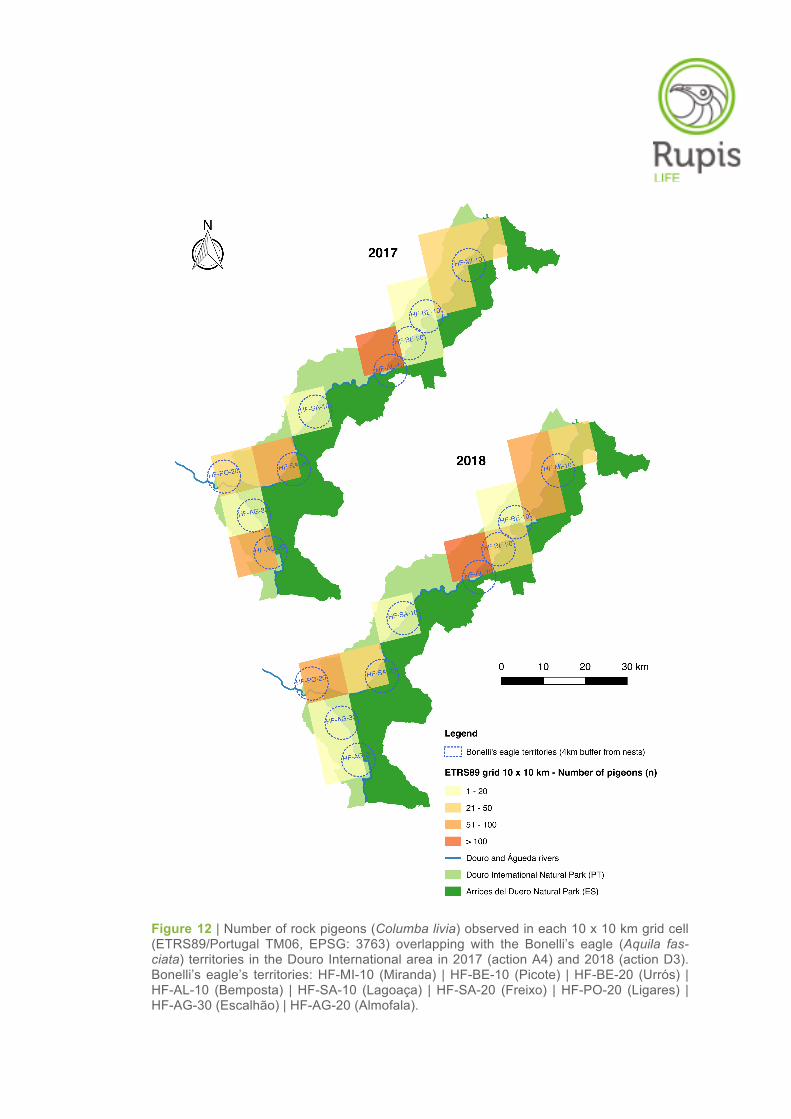
Figure 12 | Number of rock pigeons (Columba livia) observed in each 10 x 10 km grid cell (ETRS89/Portugal TM06, EPSG: 3763) overlapping with the Bonelli’s eagle (Aquila fas-ciata) territories in the Douro International area in 2017 (action A4) and 2018 (action D3). Bonelli’s eagle’s territories: HF-MI-10 (Miranda) | HF-BE-10 (Picote) | HF-BE-20 (Urrós) | HF-AL-10 (Bemposta) | HF-SA-10 (Lagoaça) | HF-SA-20 (Freixo) | HF-PO-20 (Ligares) | HF-AG-30 (Escalhão) | HF-AG-20 (Almofala).
4. CONCLUSIONS
Based on the results obtained from the monitoring actions performed as part of the action D3 (and
their comparison with the results obtained in the context of action A4), the following general conclu-
sions can be drawn regarding the population status of the main prey species of Bonelli’s eagle in the
Douro International Natural Park:
• The spatial distribution of the abundance of wild rabbits, partridges and rock pigeons is not
uniform throughout the Douro International area, as well as within the territories of Bonelli’s
eagles. Those species are relatively well distributed across the project area, however some of
them are present at suboptimal levels of abundance at various locations and/or show a
fragmented distribution pattern (e.g. wild rabbit);
• The relative abundance of wild rabbit latrines (used as an indicator of rabbit abundance) was
very low (≤ 5.0 latrines/km) in most of the areas sampled, thus suggesting a poor availability of
this prey item in the project area. According to Layna & Aparicio (2011), a value of 6
latrines/km (a value derived from correlations between the number of latrines and absolute
rabbit densities) would be the minimum threshold that would allow the use of the wild rabbit as
a trophic resource by Bonelli’s eagles;
• The red-legged partridge was present in all the territories sampled, however its relative abun-
dances were essentially low (≤ 0.5 partridges/km) in the Douro International Park. Overall, the
results obtained in the Portuguese side were similar to those reported by García (2016) in the
Arribes del Duero Natural Park;
• Rock pigeons were also present in all the territories surveyed, but their abundances were
highly variable across the Douro International area. The species was especially abundant in
the territory of Bemposta, whereas in other territories its presence was scarce (e.g. Picote,
Lagoaça, Escalhão);
• Overall, the populations of wild rabbits, partridges and rock pigeons remained relatively stable
between sampling years (actions A4 and D3) in the Douro International Park, despite some
inter-annual fluctuations and localised changes in their abundance;
• The current situation of Bonelli’s eagle main prey species in some territories highlights the
need to continue implementing species-specific management actions [i.e. restoration and
management of traditional pigeon houses in order to increase pigeons abundance (action C4)
and habitat management for recovering both partridge and wild rabbit populations (action C5),
as well as an appropriate hunting management of these species];
• Detailed analyses targeted at evaluating 1) the effect of habitat management actions already
implemented on wild prey abundances and 2) the effect of prey availability on the population
dynamics and reproductive performance of Bonelli’s eagle in the project area are required.
Such analyses should integrate data from both Portuguese and Spanish sides. Concerning the
first subject, the surveys for estimating the abundance of wild rabbit and partridges during the
current year of 2018 (i.e. second year of implementation of action D3) were designed for such
purpose. The results will be available soon and will be part of a future report. In relation to the
second issue, the analyses of prey availability should also include the abundance of other
relevant species in the diet of Bonelli’s eagle, such as the Iberian azure-winged magpie
(Cyanopica cyanus), wood pigeon (Columba palumbus), common starling (Sturnus vulgaris)
and several species of the family Turdidae.
5. REFERENCES
Alcántara, M., Ferreiro, E. & Gardiazábal, A. (2003). El Águila-azor Perdicera en Aragón. Naturaleza
Aragonesa, 10: 41–47. [In Spanish]
Arroyo, B., Ferreiro, E. & Garza, V. (1998). Causas de la regresión del Águila Perdicera Hieraaetus
fasciatus en España Central. Pp. 291-304. In: Chancellor, R.D., Meyburg, B.-U., Ferrero, J.J.
(Eds.), Holarctic Birds of Prey. ADENEX-WWGBP. [In Spanish]
Baticón, A.O. (1998). Métodos de censo y estima poblacional. Seminario sobre La Perdiz Roja, I Cur-
so, Escuela Española de Caza. Ed. FEDENCA / Grupo Editorial V. Madrid: 49-60. [In Spanish]
Beça, A. (2005). A Perdiz. Colecção Património Natural Transmontano. João Azevedo Editor, Miran-
dela. [In Portuguese]
BirdLife International (2015). European Red List of Birds. Office for Official Publications of the Europe-
an Communities, Luxembourg.
BirdLife International (2016). Aquila fasciata. The IUCN Red List of Threatened Species 2016:
e.T22696076A89510184. http://dx.doi.org/10.2305/IUCN.UK.2016-
3.RLTS.T22696076A89510184.en. Downloaded on 21 August 2018.
BirdLife International (2017). European birds of conservation concern: populations, trends and national
responsibilities. BirdLife International, Cambridge, UK.
Borralho, R., Rego, F. & Vaz Pinto, P. (1996). Is driven transect sampling suitable for estimating red-
legged partridge Alectoris rufa densities? Wildlife Biology 2: 259–268.
Cabral, M.J. (Coord.), Almeida, J., Almeida, P.R., Dellinger, T., Ferrand de Almeida, N., Oliveira M.E.,
Palmeirim, J.M., Queiroz, A.I., Rogado, L. & Santos-Reis, M. (Eds.) (2005). Livro Vermelho dos
Vertebrados de Portugal. Instituto da Conservação da Natureza, Lisboa. [In Portuguese]
Calvete, C., Pelayo, E. & Sampietro, J. (2006). Habitat factors related to wild rabbit population trends
after the initial impact of rabbit haemorrhagic disease. Wildlife Research 33: 467–474.
Caro, J. Delibes-Mateos, M., Viñuela, J., López-Lucero, J.F. & Arroyo, B. (2015). Improving decision-
making for sustainable hunting: regulatory mechanisms of hunting pressure in red-legged par-
tridge. Sustainability Science 10(3): 479–489.
Caro, J., Ontiveros, D. & Pleguezuelos, J.M. (2011). The feeding ecology of Bonelli’s eagle (Aquila
fasciata) floaters in southern Spain: implications for conservation. European Journal of Wildlife
Research 57(4): 729–736.
Carpio, A.J., Oteros, J., Vicente, J., Tortosa, F.S. & Guerrero-Casado, J. (2015). Factors affecting red-
legged partridge Alectoris rufa abundance on big-game hunting estates: implications for man-
agement and conservation. Ardeola 62(2): 283–297.
Carrete, M., Sánchez-Zapata, J.A., Calvo, F. & Lande, R. (2005). Demography and habitat availability
in territorial occupancy of two competing species. Oikos 108: 125–136.
Carrete, M., Sánchez-Zapata, J.A., Martínez, J.E., Sánchez, M.A. & Calvo, J.F. (2002). Factors influ-
encing the decline of a Bonelli’s eagle population Hieraaetus fasciatus in southeastern Spain:
demography, habitat or competition? Biodiversity and Conservation 11: 975–985.
Del Moral, J.C. (Ed.) (2006). El águila perdicera en España. Población en 2005 y método de censo.
SEO/BirdLife, Madrid. [In Spanish]
Delibes-Mateos, M., Farfán, M.A., Olivero, J., Márquez, A.L. & Vargas, J.M. (2009). Long-term
changes in game species over a long period of transformation in the Iberian Mediterranean
landscape. Environmental Management 43: 1256–1268.
Delibes-Mateos, M., Farfán, M.A., Olivero, J. & Vargas, J.M. (2010). Land-use changes as a critical
factor for long-term wild rabbit conservation in the Iberian Peninsula. Environmental
Conservation 37: 169–176.
Díaz-Fernández, S., Arroyo, B., Casas, F., Martinez-Haro, M. & Viñuela, J. (2013). Effect of game
management on wild red-legged partridge abundance. PLoS ONE 8(6): e66671.
Dias, A.S.R.C.P. (2006). Métodos de censo de perdiz-vermelha (Alectoris rufa L.) em zonas de alta e
baixa densidades. MSc Thesis. University of Algarve, Portugal. [In Portuguese]
Equipa Atlas (2008). Atlas das Aves Nidificantes em Portugal (1999-2005). Instituto da Conservação
da Natureza e da Biodiversidade, Sociedade Portuguesa para o Estudo das Aves, Parque Natu-
ral da Madeira e Secretaria Regional do Ambiente e do Mar. Assírio & Alvim, Lisboa.
Fernandez-de-Simon, J., Díaz-Ruiz, F., Cirilli, F., Tortosa, F.S., Villafuerte, R., Delibes-Mateos, M. &
Ferraras, P. (2011). Towards a standardized index of European rabbit abundance in Iberian
Mediterranean habitats. European Journal of Wildlife Research 57: 1091–1100.
García, J. (2016). Estudio básico para estimar densidades iniciales de poblaciones presa: palomas,
conejos y perdices en los territorios de águila perdicera (Acción A4). Parque Natural Arribes del
Duero. Informe LIFE Rupis. Fundación del Patrimonio Natural de Castilla y León, Valladolid. [In
Spanish]
Gil–Sanchéz, J.M., Moleón, M., Otero, M. & Bautista, J. (2004). A nine-year study of successful breed-
ing in a Bonelli’s eagle population in southeast Spain: a basis for conservation. Biological
Conservation 118: 685–694.
Hernández, A. & Real, J. (2011). Evaluación de las actuaciones de alimentación suplementaria para la
conservación del águila perdicera (Aquila fasciata) en Castilla y León y aplicaciones a su
conservación. Acciones de desarrollo del Plan de Conservación del Águila Perdicera en Castilla
y León. Fundación Tierra Ibérica, Fundación Patrimonio Natural de Castilla y León, Junta de
Castilla y León. Informe inédito. [In Spanish]
Hernández, A., Resano, J. & Real, J. (2012). Monitorización demográfica del águila perdicera (Aquila
fasciata) en Castilla y León, análisis de la dieta, de la calidad de los pollos y aplicaciones a la
conservación. Fundación Tierra Ibérica, Fundación Patrimonio Natural de Castilla y León, Junta
de Castilla y León. Informe inédito. [In Spanish]
Layna J.F. & Aparico, F. (2011). Seguimiento de las poblaciones de conejo de monte en territorios de
águila perdicera en Castilla y León. Plan de Conservación del águila perdicera en Castilla y
León. Acción B: Análisis de la situación de las principales especies presa (conejo silvestre y
perdiz roja). Consultores en Iniciativas Ambientales, S. L., Madrid. [In Spanish]
LIFE Rupis team (2017). LIFE Rupis mid-term report. Sociedade Portuguesa para os Estudo das Aves
(Coord.), Associação Transumância e Natureza, Palombar, Guarda Nacional Republicana,
Fundación Patrimonio Natural de Castilla y León, EDP Distribuição – Energia SA, Vulture
Conservation Foundation, Instituto da Conservação da Natureza e das Florestas and Junta de
Castilla y León. Lisboa.
Madroño, A., González, C. & Atienza, J.C. (Eds.) (2004). Libro Rojo de las Aves de España. Dirección
General para la Biodiversidad-SEO/BirdLife, Madrid. [In Spanish]
Moléon, M., Gil–Sanchéz, J.M., Real, J., Sánchez-Zapata, J.A., Bautista, J., & Sánchez-Clemot, J.F.
(2007). Non-breeding feeding ecology of territorial Bonelli’s eagles Hieraaetus fasciatus in the
Iberian Peninsula. Ardeola 54: 135–143.
Moléon, M., Sánchez-Zapata, J.A., Gil–Sanchéz, J.M., Barea-Azcón, J.M., Ballesteros-Duperón, E. &
Virgós, E. (2011). Laying the foundations for a human-predator conflict solution: assessing the
impact of Bonelli’s Eagle on rabbits and partridges. PLoS ONE 6(7): e22851.
Monterroso, P., Garrote, G., Serronha, A., Santos, E., Delibes-Mateos, M., Abrantes, J., Ayala, R.P.,
Silvestre, F., Carvalho, J., Vasco, I., Lopes, A.M., Maio, E., Magalhães, M.J., Mills, L.S., Este-
ves, P.J., Simón, M.A. & Alves, P.C. (2016). Disease-mediated bottom-up regulation: An emer-
gent virus affects a keystone prey, and alters the dynamics of trophic webs. Scientific Reports 6:
36072.
Moreno, S., Beltrán, J.F., Cotilla, I., Kuffner, B., Lafitte, R., Jordán, G., Ayala, J., Quintero, C.,
Jiménez, A., Castro, F., Cabezas, S. & Villafuerte, R. (2007). Long-term decline of the European
wild rabbit (Oryctolagus cuniculus) in south-western Spain. Wildlife Research 34: 652–658.
Ontiveros, D. (1997). Pérdida de hábitat del Águila perdicera en la provincia de Granada. Quercus
135: 16–19. [In Spanish]
Ontiveros, D., Real, J., Balbontín, J., Carrete, M., Ferreiro, E., Ferrer, M., Mañosa, S., Pleguezuelelos,
J.M. & Sánchez-Zapata, J.A. (2004). Biología de la conservación del águila perdicera Hieraae-
tus fasciatus en España: Investigación científica y gestión. Ardeola 51: 461–470. [In Spanish]
Palma, L., Onofre, N. & Pombal, E. (1999). Revised distribution and status of diurnal birds of prey in
Portugal. Avocetta 23: 3–18.
Real, J., Grande, J.M., Mañosa, S. & Sánchez-Zapata, J.A. (2001). Causes of death in different areas
for Bonelli’s Eagle Hieraaetus fasciatus in Spain. Bird Study 48: 221–228.
Real, J., & Mañosa, S. (1997). Demography and conservation of western European Bonelli's eagle
Hieraaetus fasciatus populations. Biological Conservation 79: 59–66.
Realinho, E. & Vallverdú, N. (2017). Estudo inicial para estimar a densidade inicial das populações
das principais presas para a águia-de-Bonelli: pombo-das-rochas, coelho-bravo e perdiz-
vermelha (Ação A4). Parque Natural do Douro Internacional. Relatório LIFE Rupis. Associação
Transumância e Natureza, Figueira de Castelo Rodrigo. [In Portuguese]
Sarmento, P., Cruz, J., Paula, A., Eira, C., Capinha, M., Ambrósio, I., Ferreira, C. & Fonseca, C.
(2012). Occupancy, colonization and extinction patterns of rabbit populations: implications for
Iberian lynx conservation. European Journal of Wildlife Research 58: 523–533.
Simón, M. et al. (2012). Ten years conserving the Iberian lynx. Consejería de Agricultura, Pesca y
Medio Ambiente. Junta de Andalucía, Sevilla.
Sutherland, W.J. (1996). Ecological census techniques: a handbook. Cambridge University Press,
Cambridge.
Virgós, E., Cabezas-Díaz, S., Malo, A., Lozano, J. & López-Huertas, D. (2003). Factors shaping Euro-
pean rabbit abundance in continuous and fragmented populations of central Spain. Acta Therio-
logica 48: 113–122.