Embed Size (px)
Citation preview

DEME-QHSES-RPT-015
Rev. 2015-08-01 Uncontrolled if printed. Most recent version is available on DEME Navigator. page 1 of 11
Progress report energy management
2015: H1

DEME-QHSES-RPT-015
Rev. 2015-08-01 Uncontrolled if printed. Most recent version is available on DEME Navigator. page 2 of 11
CONTENT
1 INTRODUCTION ...................................................................................................................................... 3
2 DEME’S REDUCTION OBJECTIVE ........................................................................................................ 3
3 BOUNDARIES ......................................................................................................................................... 3
3.1 ORGANISATIONAL BOUNDARIES .............................................................................................................. 3 3.2 OPERATIONAL BOUNDARIES ................................................................................................................... 3
4 EMISSIONS & REDUCTIONS ON COMPANY LEVEL .......................................................................... 4
4.1 DEME EMISSIONS ................................................................................................................................. 4 4.2 DEME PROGRESS REDUCTION .............................................................................................................. 6 4.2.1 SCOPE 1 .......................................................................................................................................... 6 4.2.2 SCOPE 2 .......................................................................................................................................... 7 4.2.3 SCOPE 3 .......................................................................................................................................... 8 4.3 DEME’S ACTION PLAN .................................................................................................................... 10
5 EMISSIONS & REDUCTIONS ON PROJECT LEVEL .......................................................................... 11
5.1 PROJECTS WITH CO2-RELATED AWARD ADVANTAGE .............................................................................. 11
6 DOCUMENT REFERENCES ................................................................................................................. 11

DEME-QHSES-RPT-015
Rev. 2015-08-01 Uncontrolled if printed. Most recent version is available on DEME Navigator. page 3 of 11
1 INTRODUCTION
This report describes the progress and the trends of the energy reduction initiatives for DEME and its
projects in Belgium & the Netherlands 2015–H1 in accordance to the requirements of the CO2–
Performance Ladder.
2 DEME’S REDUCTION OBJECTIVE
DEME is aiming to increase energy efficiency by 7% in 2022 (compared to 2011). This includes its own
direct emissions (scope 1) and its indirect emissions from the consumption of purchased electricity and
business travel (scope 2).
For all other indirect emissions not owned or controlled by the group DEME (scope 3) is committed to
making similar energy efficiency increase and started with two different pilot projects with the DEME
companies DBM and GeoSea.
All the energy measures are described in DEME’s Energy Management Action Plan
(DEME-QHSES-DOC-031).
3 BOUNDARIES
3.1 Organisational boundaries
DEME N.V. uses the operational control approach according to the GHG Protocol to determine the
organizational boundary of its emission inventory.
3.2 Operational boundaries
To define the operational boundaries, the CO2 emissions are reported in different scopes:
• Scope 1 contains all direct emissions. Direct emissions occur from sources that are owned or
controlled by the company such as the consumption of fuel and natural gas.
• Scope 2 accounts for indirect emissions from the consumption of purchased electricity. Scope 2
emissions physically occur at the facility where electricity is generated.
• Scope 3 is a reporting category that allows for the inventory of all other indirect emissions. Scope 3
emissions are a consequence of the activities of the company, but occur from sources not
owned or controlled by the company. This includes outsourced emissions such as business
air travel and subcontractor equipment.

DEME-QHSES-RPT-015
Rev. 2015-08-01 Uncontrolled if printed. Most recent version is available on DEME Navigator. page 4 of 11
4 EMISSIONS & REDUCTIONS ON COMPANY LEVEL
4.1 DEME Emissions
The CO2 emissions for DEME activities in Belgium and the Netherlands (CO2 Performance ladder
boundary) for 2015-H1 are stated in the table below.
In tonnes CO2 2015-H1
Scope 1: 63.637
- DEME marine equipment HFO 0
- DEME marine equipment MGO 47.266
- Diesel all site (excl. personnel transport) 13.427
- Diesel cars (personnel transport) 2.442
- Natural gas 77
- Office Heating diesel 487
- Unleaded cars (personnel transport) 139
Scope 2: 742
- Air travel 204
- Belgium use of private car 88
- Electricity Grey 1.666
- Electricity Green 0
- Solar Power 0
Grand total 65.596
Table 1: Evolution scope 1 CO2 emissions
The scope 1 CO2 emissions are stated in de figure below.
Figure 1: Evolution scope 1 CO2 emissions

DEME-QHSES-RPT-015
Rev. 2015-08-01 Uncontrolled if printed. Most recent version is available on DEME Navigator. page 5 of 11
Overview of the CO2 emissions (scope 1 & 2) for DEME activities in Belgium and the Netherlands (CO2
Performance ladder boundary) per year from 2011 is given in the figure below.
Figure 2: Evolution scope 2 CO2 emissions
Remark:
For 2011 and 2012 there is no separate business travel data available for DEME activities in Belgium
and the Netherlands. The total emissions for business travel for DEME worldwide activities
amounted in 2011; 24.304 tons and 27.188 tonnes for 2012.

DEME-QHSES-RPT-015
Rev. 2015-08-01 Uncontrolled if printed. Most recent version is available on DEME Navigator. page 6 of 11
4.2 DEME Progress reduction
DEME has the ambition to improve its efficiency in energy use over the next 10 years.
For this reason, DEME has established different energy efficiency targets. These targets are focussed on
five key areas:
• Fuel efficiency (scope 1);
• Lease cars (scope 1);
• Buildings (scope 2);
• Transport of sand and gravel for the concrete industry (scope 3);
• Use of subcontracted equipment for the installation of windmills (scope 3).
Energy savings are realised by a wide set of measures and evaluated through different key parameters.
4.2.1 Scope 1
FUEL EFFICIENCY
As a result of serious endeavours on project level, following energy-efficiency improvements are
achieved, see table below:
Year
Realised
CO2-reductions
scope 1
Progress
energy efficiency
Year reduction
Objective
(in tons)
(%) (%)
2012 11.368 2,0% 0,7%
2013 18.306 3,2% 0,7%
2014 19.677 3,4% 0,7%
2015-H1 5.563 1% 0,7%
Table 2: energy-efficiency scope 1
Based on these results, DEME is fully on a par with the long-term objective of 6% by 2022 as compared
to 2011 for its world-wide activities.
LEASE CARS
In terms of CO2 reduction, DEME makes efforts to optimise its lease vehicle fleet. The evolution of CO2
emissions is represented in figure below.
Figure 3: Evolution CO2 emissions DEME fleet lease cars

DEME-QHSES-RPT-015
Rev. 2015-08-01 Uncontrolled if printed. Most recent version is available on DEME Navigator. page 7 of 11
The results herewith presented, demonstrate a positive trend which is entirely in line with the DEME
reduction objective for lease cars, i.e. a decrease of 25% in CO2 emissions by the end of 2022.
4.2.2 Scope 2
Measures have been taken to reduce the CO2 emissions resulting from electricity consumption in
buildings. In 2013 DEME started purchasing green electricity. In addition to buying renewable electricity
from a utility or buying renewable energy certificates, DEME is also installing renewable power generation
at its facilities (solar panels, wind turbines and geothermal heat pumps).
DEME’s objective is to reduce CO2 emissions per Full Time Equivalent (FTE) with 35% by 2022
compared to 2011.
The evolution of scope 2 emissions per FTE is expressed in the figure below.
Figure 4: Scope 2 CO2 emissions head office per FTE
The ratio green versus grey electricity is expressed in the figure below.
Figure 5: Ratio green versus grey electricity
The share of green electricity within DEME increases every year. The proportion of green electricity
amounts about 80% of the total DEME electricity consumption.

DEME-QHSES-RPT-015
Rev. 2015-08-01 Uncontrolled if printed. Most recent version is available on DEME Navigator. page 8 of 11
4.2.3 Scope 3
The actions for scope 3 emissions are restricted to 2 domains: installation of windmills and fluvial and
maritime transport of sand and gravel for the benefit of the concrete industry.
4.2.3.1 Installation/maintenance activities of windfarms
HIRED VESSELS
The evolution of scope 3 CO2 emissions for fuel use of hired vessels is expressed in the figure below.
Figure 6: Evolution of scope 3 CO2 emissions hired vessels
In 2015 DEME has started to monitor the fuel consumption of hired vessels which are used for
installation and maintenance works of windfarms. Due to a lack of information specific reduction targets
are not yet defined. As stated in DEME’s action plan for scope 3 emissions, DEME will take efforts in
the fourthcoming period to clarify the CO2 intensity and define a specific reduction objective.
There is a specific plan of action for the reduction of scope 3 emissions for this type of activities.
Actions already taken:
• 2015: consultation meeting with steel fabricators
• 2015: consultation meeting with charter vessel shipping companies
• 2015: Fuel monitoring & CO2 reporting of activities
STEEL PROCUREMENT
Steel is one of the main CO2 emission contributors for offshore windfarm projects. Therefore DEME
wants to make efforts to visualize the effective CO2 emissions of every steel that is procured.
Actions aready taken:
• 2015: consultation meeting with steel fabricators/suppliers
• 2015: requesting information from steel fabricators/suppliers by means of a questionnaire

DEME-QHSES-RPT-015
Rev. 2015-08-01 Uncontrolled if printed. Most recent version is available on DEME Navigator. page 9 of 11
4.2.3.2 Aggregrates and minerals
SUBCONTRACTED FLUVIAL TRANSPORT
DEME has analysed its chain of activities for maritime and fluvial transport and got insight in its most
material emissions of this chain.
The evolution of the scope 3 CO2 emissions is expressed in the figure below.
Figure 7: Scope 3 CO2 emissions subcontracted fluvial transport
The progress in energy efficiency is cleary stated in the graph below.
Figure 8: Overview CO2 emissions per ton km (in gram) subcontracted fluvial transport
DBM is getting more and more insight in its scope 3 emissions for transport activities. Based on the first
results of monitoring, the average transport emission factor amounts 34 grams CO2 per ton km. DBM has
set a reduction objective of 6% increase in energy efficiency by 2022 compared to 2015. The objective to
achieve is then 31 grams CO2 per ton km.
There is a specific plan of action for the reduction of scope 3 emissions for this type of activities.
3.596 3.486
817
0
500
1000
1500
2000
2500
3000
3500
4000
2013 2014 2015 H1
CO
2 i
n t
on
ne
s
Van Ouwerkerk Transport

DEME-QHSES-RPT-015
Rev. 2015-08-01 Uncontrolled if printed. Most recent version is available on DEME Navigator. page 10 of 11
Actions aready taken:
• 2015: consultation meeting with charter vessel shipping company
• 2015: requesting details of the vessel fleet (Van Ouwerkerk)
o applied energy saving measures
o fuel consumption specifications
• 2015: CO2 emission reporting for fluvial transport activities
.
4.3 DEME’S ACTION PLAN
DEME’s energy reduction programme is scheduled to last for a number of years and the implementation
of the measures is half-yearly evaluated.
Document DEME-QHSES-DOC-031 Energy management action plan describes the taken energy
reduction measures.
DEME-QHSES-RPT-015
Rev. 2015-08-01 Uncontrolled if printed. Most recent version is available on DEME Navigator. page 11 of 11
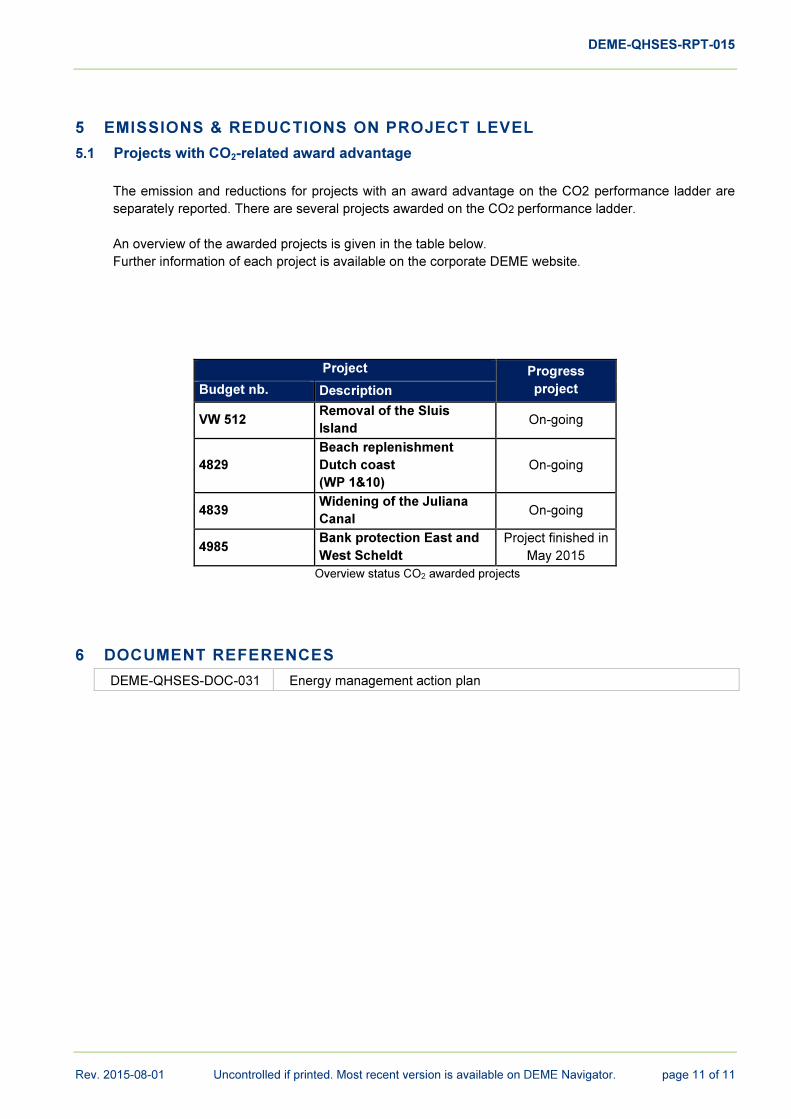
5 EMISSIONS & REDUCTIONS ON PROJECT LEVEL
5.1 Projects with CO2-related award advantage
The emission and reductions for projects with an award advantage on the CO2 performance ladder are
separately reported. There are several projects awarded on the CO2 performance ladder.
An overview of the awarded projects is given in the table below.
Further information of each project is available on the corporate DEME website.
Project Progress
project Budget nb. Description
VW 512 Removal of the Sluis
Island On-going
4829
Beach replenishment
Dutch coast
(WP 1&10)
On-going
4839 Widening of the Juliana
Canal On-going
4985 Bank protection East and
West Scheldt
Project finished in
May 2015
Overview status CO2 awarded projects
6 DOCUMENT REFERENCES
DEME-QHSES-DOC-031 Energy management action plan