Embed Size (px)
Citation preview

Progress Report: Aviation Tourism Demand under Carbon Pricing
Joint Transport and Tourism WG Project TPT 02/2009
Susan Jabs, Department of Resources and Energy
15 September 2009

Background
• Full title: Study of International Visitor Flows and Greenhouse Gas Emissions for a Template to Examine the Impact on APEC Economies of Future Market-based Measures Applying to International Transport
• Objectives:• understand aviation flows and GHG emissions
• impact on APEC member economies of CO2 pricing for flights
• develop a pilot economic model to assist in policy decisions; and• inform APEC policy for international aviation emissions.

Project administration
• Project lead by Australia and overseen by Dept Resources, Energy & Tourism and Department of Infrastructure
• New Zealand, Thailand and Singapore are co-sponsors• Project focus on sample of APEC member economies including:
Australia, Brunei Darussalam, Indonesia, Malaysia, New Zealand, Papua New Guinea, Philippines, Singapore, Thailand and Viet Nam
• Project undertaken by Australian transport economics and policy consultancy GHD Meyrick, part of global infrastructure and policy company GHD Pty Ltd
• Core project team: Neil Aplin, Daniel Veryard, Steve Meyrick and Zarmina Nasir

Outline
• economic, social and tourism indicators
• stakeholder visits
• modelling
• future directions

Economic and social indicators
0
200
400
600
800
Aust. Brunei Indo. Malay. NZ PNG Philip. Sing. Thai. Viet.0
20
40
60
80
Source: International Monetary Fund
Gross Domestic ProductUS dollars at average market exchage rates, 2007
$b $'0000
GDP(Left scale)
GDP per capita(Right scale)

Economic and social indicators
0
20
40
60
80
100
Aust. Brunei Indo. Malay. NZ PNG Philip. Sing. Thai. Viet.0
20
40
60
80
100
Source: World Bank
Labour Force ParticipationPeople employed or seeking employment, percent of people 15-64 years, 2007% %
Male Female
Tourism Indicators
0
5
10
15
20
Aust. Brunei Indo. Malay. NZ PNG Philip. Sing. Thai. Viet.0
5
10
15
20
* No tourism income data availableSource: Consultant estimates, UNWTO, IMF
Annual Tourism Arrivals and IncomeUS dollars, 2007
mb
$b
Aviation Arrivals(Left scale)
Tourism Income(Right scale)
**
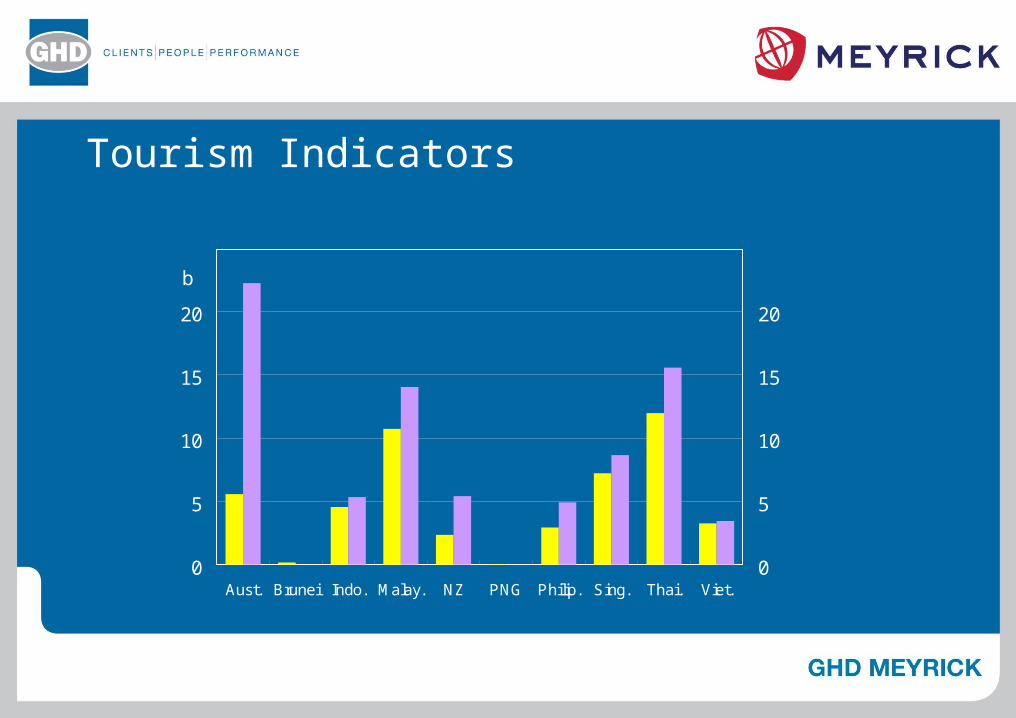
Tourism Indicators
0
2
4
6
Aust. Brunei Indo. Malay. NZ PNG Philip. Sing. Thai. Viet.0
500
1000
1500
* No tourism income data availableSource: Consultant estimates, UNWTO, IMF
Annual Tourism Arrivals and IncomeUS dollars at average market exchage rates, 2007
%b
$Tourism
Share of GDP(Left scale)
Tourism Income Per Capita(Right scale)
**

Consultation Visits
• Purpose:
1. Gather data and information
2. Meet stakeholders and contacts for later assistance
• Economies visited• New Zealand• Indonesia• Malaysia• Thailand• Australia
Consultation Visits - Information Gained
• Variable data availability – as anticipated• Useful background context• Some very useful insights
• e.g. international arrivals in Malaysia dominated by Singapore visitors (in numbers)
many are very short-term (shoppers and petrol)
useful for mode share assumptions when data unavailable• Data sources, websites and agencies that we were unaware of
Modelling Approach
• Key challenges:
• How large is a CO2 price likely to be?
• What proportion of air prices is this likely to account for?• How will international tourist arrivals respond?• Will this demand response vary across destinations based
linearly on distance between origin and destination?• How will this change in aviation-based tourism affect tourism
income, GDP and the welfare of women in APEC economies?
Modelling Approach
• Price of CO2 review policy status and forecasts in literature
• Distances between economies
Main airport in each economyGreat circle distance from airport to airport
• Tourism arrivals review and ‘interpolate’ available data• Relationship between distance and fuel cost as share of op. costs
review literature on fuel = f(distance) and op. cost = f(distance)
scenario-based with fuel prices able to be chosen by user
• Physical relationship between fuel use, distance and CO2
Modelling Aproach cont.
• Demand response review available elasticity estimates • Assume that prices in aviation industry reflect long-term avg. costs• Apply elasticities to % change in price from aviation
yields % change and ‘scenario’ level of tourism arrivals• Apply shares of GDP accounted for by tourism
yields % impact on national incomes of APEC economies
flow-on impacts for women examined

Preliminary Results
0
2
4
6
8
10
12
Aust. Brunei Indo. Malay. NZ PNG Phili. Sing. Thai. Viet.
0
2
4
6
8
10
12
200 100
50 10
0
m mVisitors Expected at Different Carbon Prices ($US/T)*
* Millions of international arrivals per year. Assumptions: fuel price = US$0.53/L, fuel cost share sensitivity = +/- 15%, long haul cut off = 4000km, demand responsiveness adjustment = 1
-3
-2
-1
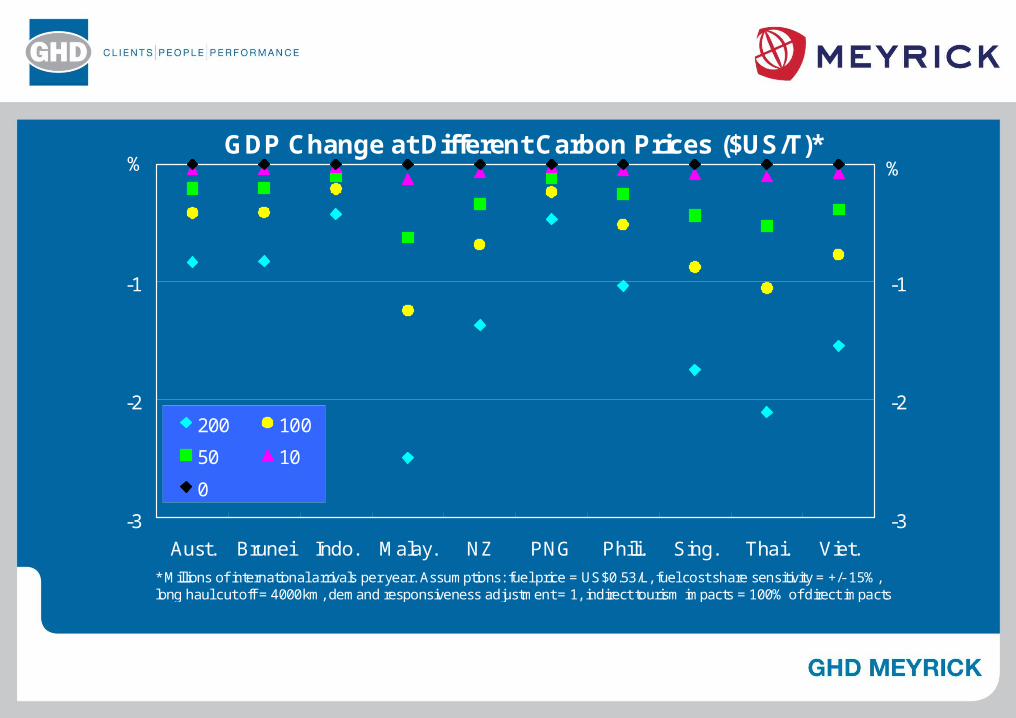
Aust. Brunei Indo. Malay. NZ PNG Phili. Sing. Thai. Viet.
-3
-2
-1
200 100
50 10
0
% %GDP Change at Different Carbon Prices ($US/T)*
* Millions of international arrivals per year. Assumptions: fuel price = US$0.53/L, fuel cost share sensitivity = +/- 15%, long haul cut off = 4000km, demand responsiveness adjustment = 1, indirect tourism impacts = 100% of direct impacts
Preliminary Results
• For realistic carbon prices (less than US$50/Tonne)• GDP cost from reduced international aviation tourism income is
less than 1 percentage point (most countries less than 0.5 %pts)• Does not model benefits from avoided climate change that will
mitigate this figure to some extent• Demand for long-haul tourism aviation not particularly
responsive to prices visitor numbers not expected to be much reduced
• Very high carbon prices (over $US100/Tonne)• More significant tourism number reductions• GDP costs more likely to exceed 1 %pt for some economies
Future Directions
• Case studies• Impact of including stopovers and indirect routing• International visitors for economies with significant land-border
crossings (e.g. Malaysia-Singapore)• Gender factors in the Indonesian tourism industry
• Draft/Final report• Draft circulated early October 2009 for WP comment• Feedback through Australian Dept Resources, Energy & Tourism• Report will include full results, sensitivity analysis and
suggestions for model extensions.