Embed Size (px)
Citation preview
PPRROOGGRREESSSS OONN AA LLOONNGG VVOOYYAAGGEE
Decades of Effort Show Improvement In Minnesota River Water Quality January 2007
Minnesota River Progress Report
January 2007
his report provides an overview of what has been accomplished to improve and protect water quality in the Minnesota River and its tributaries. Many
organizations periodically report on their activities. Examples include agricultural practices, individual sewage treatment systems, wastewater treatment facility upgrades, and impaired waters projects. This does not include the many private or voluntary practices that may not be recorded by an agency.
Contents
Introduction......................................................................................................................1
Creating a Vision .............................................................................................................2
Performance indicators....................................................................................................3
Best Management Practices............................................................................................4
Unsewered Communities.................................................................................................4
Non-compliant Private Sewage Systems.........................................................................5
Municipal Wastewater Treatment ....................................................................................6
Livestock Feedlots...........................................................................................................8
State of the Minnesota River Report................................................................................9
Total Maximum Daily Loads (TMDLs)..............................................................................9
Watershed Projects .......................................................................................................11
Minnesota River Basin Web Sites .................................................................................15 Contact: Larry Gunderson Minnesota Pollution Control Agency 520 Lafayette Rd. No. St. Paul, MN 55155-4194 651-297-3825
Cover photo: Minnesota River above confluence with Yellow Medicine River in Yellow Medicine County.
T
Minnesota River Progress Report
1 January 2007
Introduction In the early 1990s Governor Arne Carlson stood on the banks of the Minnesota River and issued a challenge to make it “fishable and swimmable” in 10 years. At the same time, the Minnesota River Assessment Project provided information on pollutants and their sources. Since then, water quality monitoring data have been collected and provide a much better picture of pollutant problems. The following pollutants have remained priorities since the beginning of the clean-up effort:
Sediment clouds the water, limits light on the bottom making it difficult for plants to thrive, destroys fish and aquatic organism habitat and spawning beds, and discourages recreational use;
Bacteria indicate the potential presence of disease-causing organisms;
Nutrients such as phosphorus and nitrogen encourage algae growth; as algae die and decay, the process uses oxygen in the water resulting in lower dissolved oxygen levels.
Throughout the 1990s and into this decade, many people have been working to clean up the Minnesota River and its tributaries. Farmers, citizens, all levels of government, non-government organizations, environmental groups and others have worked to improve and protect water quality. Some say that we have failed or that we haven’t made enough progress. In reality, the job is much more complicated and challenging than many people realized. It’s about changing society, which will take time. The original 10-year goal may have seemed like plenty of time. But when we consider the many decades during which we used the river primarily for drainage, we realize that it will take more time to turn things around. Encouraging Signs Today we are encouraged to see declining pollutant levels since the 1970s. A Metropolitan Council water quality study near Jordan in the southwest metropolitan area indicates declining trends for biochemical oxygen demand, fecal coliform bacteria, and nitrogen compounds. Total phosphorus and total suspended solids (TSS) decreased from the 1970s to 1993 or 1994 and then increased during the rest of the period. A similar study conducted by the MPCA in 2002 found a 31 percent reduction in TSS near Jordan and a 38 percent reduction on the Blue Earth River near Mankato. Additional data are collected every summer at many Minnesota River Basin sites. Trend analysis will be conducted at many of these stations. Public Perceptions The perceptions of Minnesota River Basin residents about pollution levels, water quality, pollution sources, and clean water responsibilities are important to the various agencies, non-profit groups, and local government units. In August 2005 St. Cloud State University conducted a telephone survey of 673 Minnesota River Basin residents to obtain information about their perceptions of the issues listed above.
• 79 percent thought the Minnesota River was somewhat or very polluted; • Nearly 40 percent thought it would take more than ten years to clean up the river; • 96 percent agreed that they had a responsibility to protect water quality for future
generations; and

Minnesota River Progress Report
2 January 2007
• Nearly 50 percent were willing to pay something annually to support water quality protection of the Minnesota River and nearby lakes and streams.
The survey was sponsored by the Minnesota River Board, Friends of the Minnesota Valley, Minnesota State University, Mankato, and the Minnesota Pollution Control Agency. A summary of survey results, which includes a statistical margin of error of 3.7 percent, is available at http://mrbdc.mnsu.edu/
Creating a Vision The Minnesota River Citizens’ Advisory Committee was among the first groups to create a vision for improving the Minnesota River. In 1994 they issued 10 recommendations:
• Restore floodplain and riparian areas • Restore wetlands • Manage drainage ditches and storm sewers as tributaries • Improve land management practices • Monitor water quality throughout the Minnesota River Basin • Establish a Minnesota River Commission to oversee the cleanup effort • Establish local joint powers agreements • Improve technical assistance to local governments • Engage the general public • Enforce existing laws
Many organizations are involved in the Minnesota River clean-up effort. Counties and Soil and Water Conservation Districts (SWCD) develop and implement comprehensive local Water Management Plans at the county level. Counties also are responsible for programs to permit feedlots, septic systems, and planning and zoning. At the major watershed level, watershed projects monitor water quality and implement practices for many of the basin’s 13 major watersheds. The Minnesota River Board provides policy and basin-wide program support to the major watersheds, counties, and other entities working in the basin. Agencies provide regulation, education, and incentives to improve the river. Academic institutions conduct research and provide information. Non-government organizations engage the general public, help popularize and communicate scientific information, and catalyze public debate on issues affecting the river. Often it is the citizen
Minnesota River Progress Report
3 January 2007
engagement carried out by non-profit organizations that leads to public investment in the river research and clean up programs carried out by the government agencies mentioned above. The Minnesota River Basin Plan was developed with citizen input in 2001. Strategies in the plan address impaired waters, phosphorus, sediment, bacteria, monitoring, and watershed management. The basin plan is available on the Web at: www.pca.state.mn.us/water/basins/mnriver/publications.html
Performance Indicators In 2001, Ph.D. candidate Kathy Draeger completed a dissertation entitled “Defining and Evaluating Watershed Organizational Effectiveness.” The performance indicators she evaluated are summarized in the table below. Although the evaluation of individual organizations is not the subject here, we’ll show the relationship between these categories and Minnesota River activities.
Performance indicator Minnesota River examples 1. The installation of best management
practices (BMPs) BMPs adopted; installation of up to code septic systems
2. Construction of capital improvement projects
Wastewater treatment facilities adopting improved technology to decrease pollutants in discharges; communities that previously lacked wastewater treatment have adequate treatment in place;
3. Riparian, wetland, and/or shoreline restoration
100,000 acres of crop land lie fallow in the Conservation Reserve Enhancement Program known as CREP
4. Education and outreach Education and outreach activities to adults and children
5. Regulation and enforcement of water quality protection measures
Local, state, and federal programs to enforce protection measures
6. Monitoring Monitoring water quality in nearly every watershed; compiling data to develop the State of the Minnesota River Report
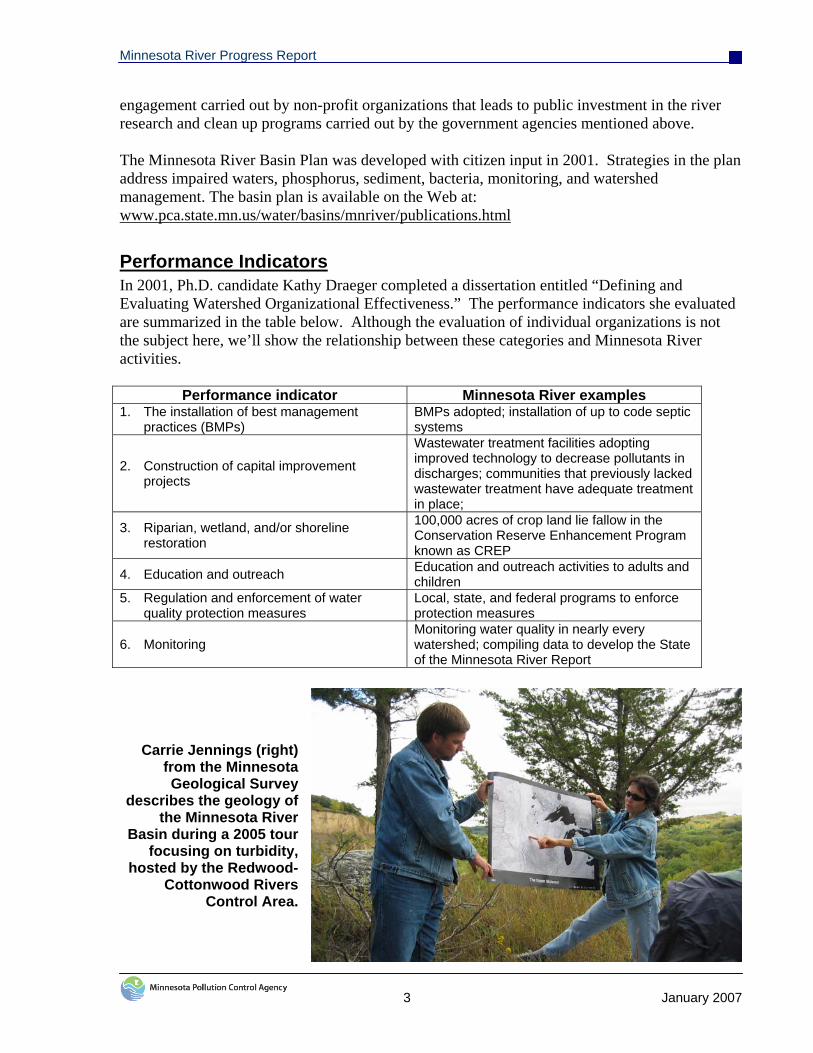
Carrie Jennings (right) from the Minnesota Geological Survey
describes the geology of the Minnesota River
Basin during a 2005 tour focusing on turbidity,
hosted by the Redwood-Cottonwood Rivers
Control Area.
Minnesota River Progress Report
4 January 2007
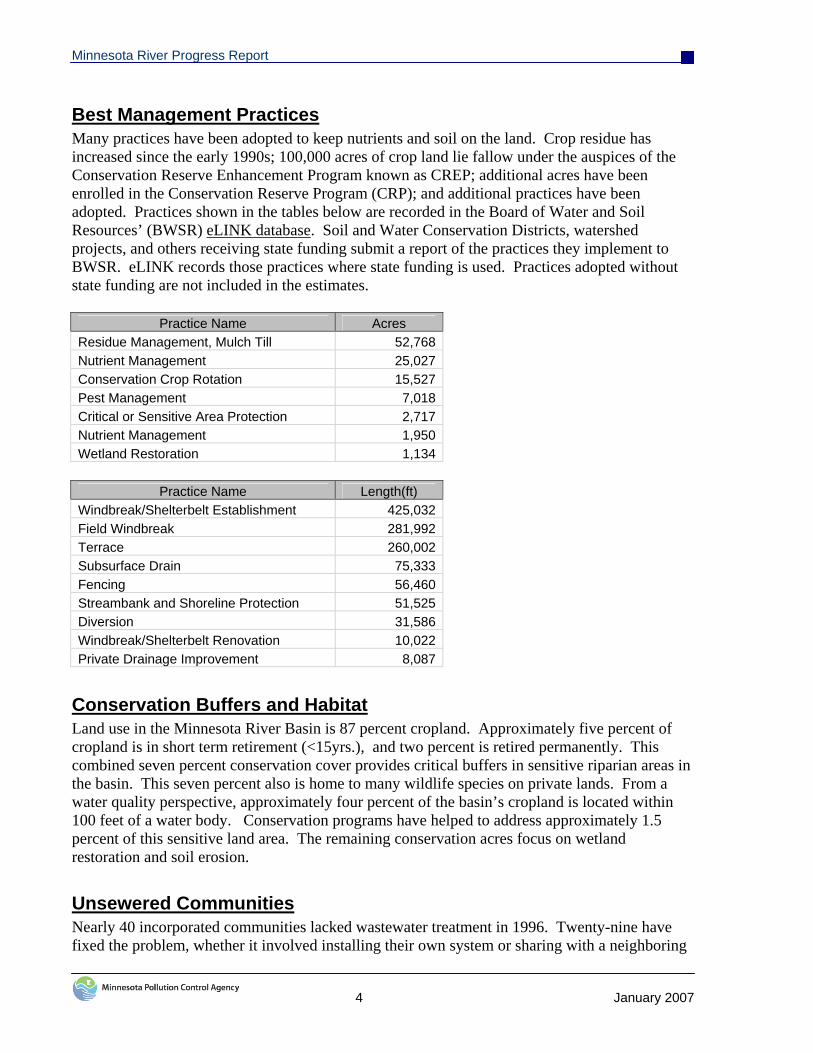
Best Management Practices Many practices have been adopted to keep nutrients and soil on the land. Crop residue has increased since the early 1990s; 100,000 acres of crop land lie fallow under the auspices of the Conservation Reserve Enhancement Program known as CREP; additional acres have been enrolled in the Conservation Reserve Program (CRP); and additional practices have been adopted. Practices shown in the tables below are recorded in the Board of Water and Soil Resources’ (BWSR) eLINK database. Soil and Water Conservation Districts, watershed projects, and others receiving state funding submit a report of the practices they implement to BWSR. eLINK records those practices where state funding is used. Practices adopted without state funding are not included in the estimates.
Practice Name Acres Residue Management, Mulch Till 52,768Nutrient Management 25,027Conservation Crop Rotation 15,527Pest Management 7,018Critical or Sensitive Area Protection 2,717Nutrient Management 1,950Wetland Restoration 1,134
Practice Name Length(ft)
Windbreak/Shelterbelt Establishment 425,032Field Windbreak 281,992Terrace 260,002Subsurface Drain 75,333Fencing 56,460Streambank and Shoreline Protection 51,525Diversion 31,586Windbreak/Shelterbelt Renovation 10,022Private Drainage Improvement 8,087
Conservation Buffers and Habitat Land use in the Minnesota River Basin is 87 percent cropland. Approximately five percent of cropland is in short term retirement (<15yrs.), and two percent is retired permanently. This combined seven percent conservation cover provides critical buffers in sensitive riparian areas in the basin. This seven percent also is home to many wildlife species on private lands. From a water quality perspective, approximately four percent of the basin’s cropland is located within 100 feet of a water body. Conservation programs have helped to address approximately 1.5 percent of this sensitive land area. The remaining conservation acres focus on wetland restoration and soil erosion.
Unsewered Communities Nearly 40 incorporated communities lacked wastewater treatment in 1996. Twenty-nine have fixed the problem, whether it involved installing their own system or sharing with a neighboring
Minnesota River Progress Report
5 January 2007
community. The MPCA continues efforts to see that the remaining communities step up and treat their wastewater.
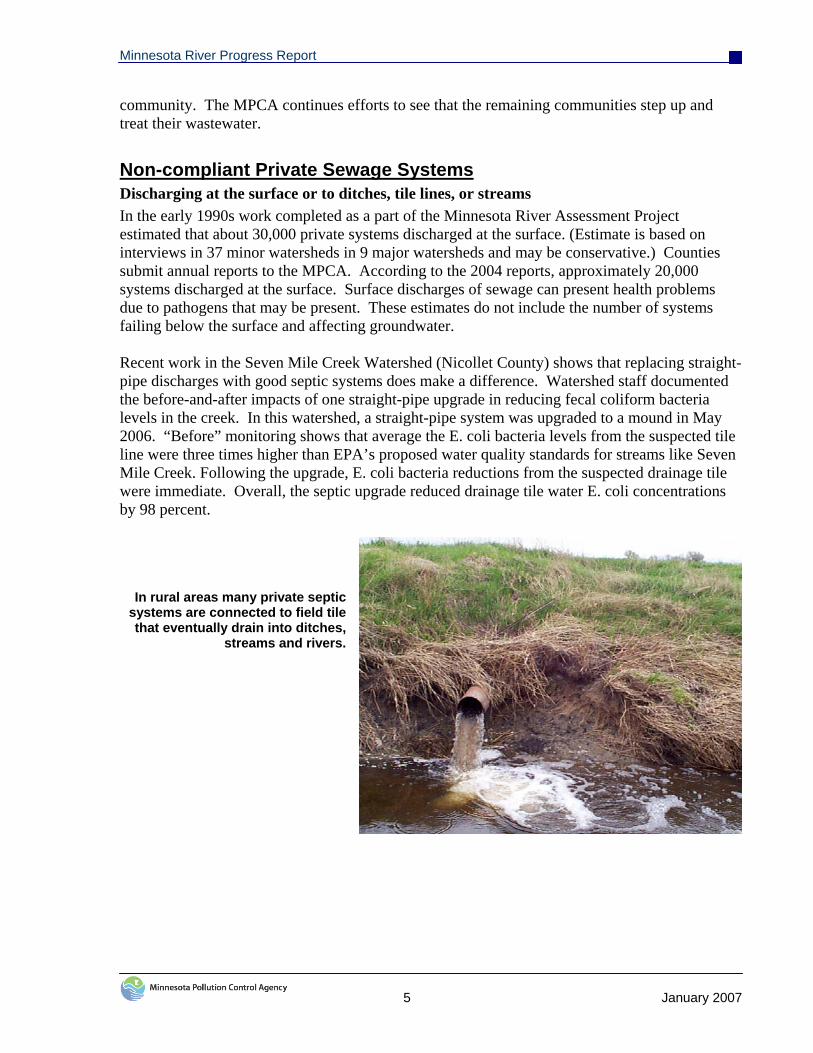
Non-compliant Private Sewage Systems Discharging at the surface or to ditches, tile lines, or streams In the early 1990s work completed as a part of the Minnesota River Assessment Project estimated that about 30,000 private systems discharged at the surface. (Estimate is based on interviews in 37 minor watersheds in 9 major watersheds and may be conservative.) Counties submit annual reports to the MPCA. According to the 2004 reports, approximately 20,000 systems discharged at the surface. Surface discharges of sewage can present health problems due to pathogens that may be present. These estimates do not include the number of systems failing below the surface and affecting groundwater. Recent work in the Seven Mile Creek Watershed (Nicollet County) shows that replacing straight-pipe discharges with good septic systems does make a difference. Watershed staff documented the before-and-after impacts of one straight-pipe upgrade in reducing fecal coliform bacteria levels in the creek. In this watershed, a straight-pipe system was upgraded to a mound in May 2006. “Before” monitoring shows that average the E. coli bacteria levels from the suspected tile line were three times higher than EPA’s proposed water quality standards for streams like Seven Mile Creek. Following the upgrade, E. coli bacteria reductions from the suspected drainage tile were immediate. Overall, the septic upgrade reduced drainage tile water E. coli concentrations by 98 percent.
In rural areas many private septic systems are connected to field tile that eventually drain into ditches,
streams and rivers.
Minnesota River Progress Report
6 January 2007
Municipal Wastewater Treatment
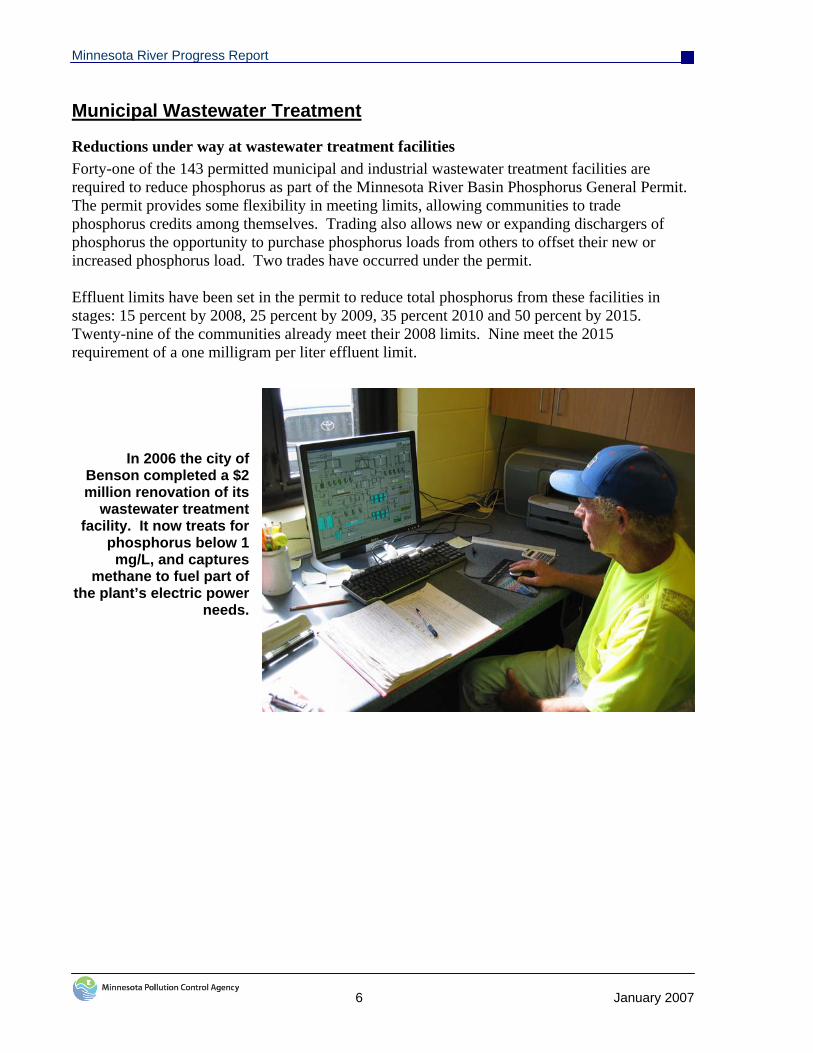
Reductions under way at wastewater treatment facilities Forty-one of the 143 permitted municipal and industrial wastewater treatment facilities are required to reduce phosphorus as part of the Minnesota River Basin Phosphorus General Permit. The permit provides some flexibility in meeting limits, allowing communities to trade phosphorus credits among themselves. Trading also allows new or expanding dischargers of phosphorus the opportunity to purchase phosphorus loads from others to offset their new or increased phosphorus load. Two trades have occurred under the permit. Effluent limits have been set in the permit to reduce total phosphorus from these facilities in stages: 15 percent by 2008, 25 percent by 2009, 35 percent 2010 and 50 percent by 2015. Twenty-nine of the communities already meet their 2008 limits. Nine meet the 2015 requirement of a one milligram per liter effluent limit.
In 2006 the city of Benson completed a $2 million renovation of its
wastewater treatment facility. It now treats for
phosphorus below 1 mg/L, and captures
methane to fuel part of the plant’s electric power
needs.

Minnesota River Progress Report
7 January 2007
Minnesota River Progress Report
8 January 2007
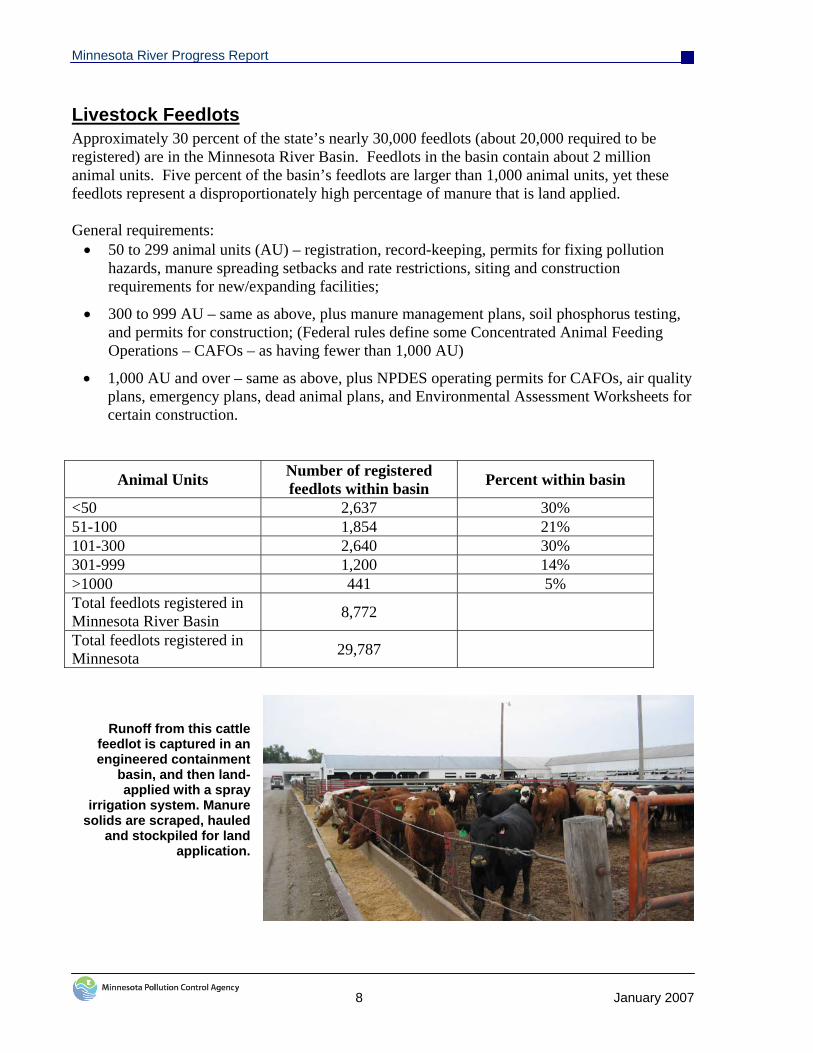
Livestock Feedlots Approximately 30 percent of the state’s nearly 30,000 feedlots (about 20,000 required to be registered) are in the Minnesota River Basin. Feedlots in the basin contain about 2 million animal units. Five percent of the basin’s feedlots are larger than 1,000 animal units, yet these feedlots represent a disproportionately high percentage of manure that is land applied. General requirements: • 50 to 299 animal units (AU) – registration, record-keeping, permits for fixing pollution
hazards, manure spreading setbacks and rate restrictions, siting and construction requirements for new/expanding facilities;
• 300 to 999 AU – same as above, plus manure management plans, soil phosphorus testing, and permits for construction; (Federal rules define some Concentrated Animal Feeding Operations – CAFOs – as having fewer than 1,000 AU)
• 1,000 AU and over – same as above, plus NPDES operating permits for CAFOs, air quality plans, emergency plans, dead animal plans, and Environmental Assessment Worksheets for certain construction.
Animal Units Number of registered feedlots within basin Percent within basin
<50 2,637 30% 51-100 1,854 21% 101-300 2,640 30% 301-999 1,200 14% >1000 441 5% Total feedlots registered in Minnesota River Basin 8,772
Total feedlots registered in Minnesota 29,787
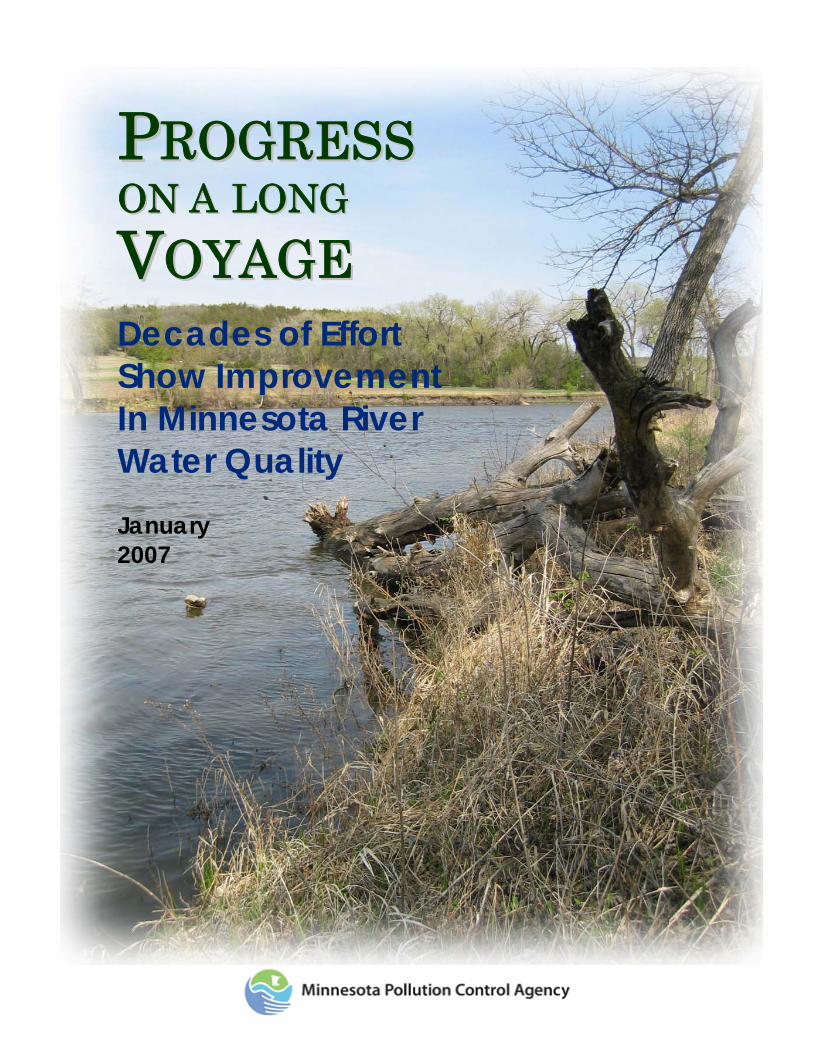
Runoff from this cattle feedlot is captured in an engineered containment
basin, and then land-applied with a spray
irrigation system. Manure solids are scraped, hauled
and stockpiled for land application.
Minnesota River Progress Report
9 January 2007
State of the Minnesota River Report
State of the Minnesota River Report annually documents water quality data A multi-agency team annually reviews and evaluates water quality data and prepares a State of the Minnesota River monitoring report. This overview summarizes water quality monitoring at four Minnesota River mainstem locations and fourteen major tributaries. The information in the most recent report represents results from more than 2,200 water quality samples collected during 2000-2005. This information will be key to determining whether or not water quality is improving. It also identifies the highest contributing watersheds in the Minnesota River Basin.
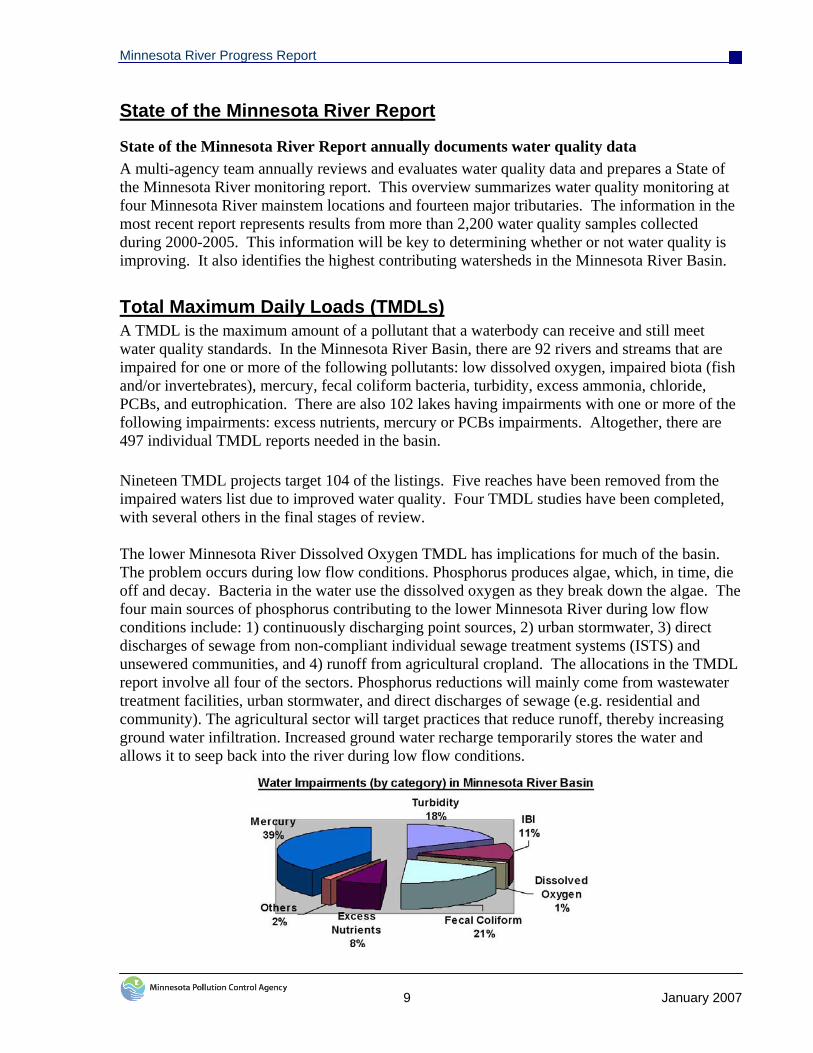
Total Maximum Daily Loads (TMDLs) A TMDL is the maximum amount of a pollutant that a waterbody can receive and still meet water quality standards. In the Minnesota River Basin, there are 92 rivers and streams that are impaired for one or more of the following pollutants: low dissolved oxygen, impaired biota (fish and/or invertebrates), mercury, fecal coliform bacteria, turbidity, excess ammonia, chloride, PCBs, and eutrophication. There are also 102 lakes having impairments with one or more of the following impairments: excess nutrients, mercury or PCBs impairments. Altogether, there are 497 individual TMDL reports needed in the basin. Nineteen TMDL projects target 104 of the listings. Five reaches have been removed from the impaired waters list due to improved water quality. Four TMDL studies have been completed, with several others in the final stages of review. The lower Minnesota River Dissolved Oxygen TMDL has implications for much of the basin. The problem occurs during low flow conditions. Phosphorus produces algae, which, in time, die off and decay. Bacteria in the water use the dissolved oxygen as they break down the algae. The four main sources of phosphorus contributing to the lower Minnesota River during low flow conditions include: 1) continuously discharging point sources, 2) urban stormwater, 3) direct discharges of sewage from non-compliant individual sewage treatment systems (ISTS) and unsewered communities, and 4) runoff from agricultural cropland. The allocations in the TMDL report involve all four of the sectors. Phosphorus reductions will mainly come from wastewater treatment facilities, urban stormwater, and direct discharges of sewage (e.g. residential and community). The agricultural sector will target practices that reduce runoff, thereby increasing ground water infiltration. Increased ground water recharge temporarily stores the water and allows it to seep back into the river during low flow conditions.

Minnesota River Progress Report
10 January 2007

Minnesota River Progress Report
11 January 2007
Watershed Projects Water quality improvement efforts are underway in nearly every watershed. Most are active in monitoring water quality, identifying priority areas to target restoration efforts, implementing practices, and educating residents. The descriptions below highlight some of the projects and only begin to describe the ongoing activities. Local leaders meet regularly to discuss priorities, next steps, research, funding opportunities, and progress. Soil and Water Conservation Districts, County Water Planners, Watershed Districts, and others are often involved in these projects. The list below is organized from upstream to downstream, beginning with the Upper Minnesota River Watershed and ending with the Lower Minnesota River Watershed.
Upper Minnesota River The Upper Minnesota River Watershed District has completed the following projects within the basin: 2,400 feet of eroded streambank and an additional 6,300 feet of shoreline have been stabilized through erosion control practices. Streambank buffer strips have been installed along 13,000 feet of protected watercourses. In terms of improving water quality, 41,000 cubic yards of sediment and 20,000 cubic yards of debris have been removed from the Whetstone and Minnesota Rivers. A new debris barrier was constructed that will prevent 90 percent of the debris in the Whetstone River from entering the Minnesota River. Fifty-four previously drained wetland basins have been restored for a total of 830 acres of water with more than 1,100 acres of upland. Citizens are active in collecting water samples from lakes, streams and groundwater. The District plans to reestablish the watershed monitoring program to evaluate BMPs that have been implemented over the past 10 years. Over 10,000 acres are currently enrolled in CRP, with an additional 1,200 acres enrolled in CREP and RIM.
Pomme de Terre River The Pomme de Terre Watershed is in the process of creating a TMDL for fecal coliform bacteria from Muddy Creek to the Minnesota River. The assessment of data will determine the required practices for reduction. A reach from Pomme de Terre Lake to Muddy Creek is impaired for aquatic life and fish IBI (Index of Biotic Integrity). This will be the next priority for study and recommendation. The counties within the Pomme de Terre have taken advantage of the CREP program, WRP, GRP, RIM and other BMP programs along the main stem and throughout the watershed. Stevens County alone has 52 CREP/RIM easements totaling 1,635 acres and WRP easements totaling 16,721. Douglas County has over 400 acres in grassland, and Big Stone County has a 200-acre CREP wetland restoration project. Programs will be focused on the impaired reaches after determination of areas of maximum impact.
Minnesota River Progress Report
12 January 2007
Lac qui Parle River The Lac qui Parle-Yellow Bank Watershed District sponsored the Clean Water Partnership Diagnostic Study that identified reaches of the Lac qui Parle that need conservation practices implemented to control erosion and to establish buffer strips along the riverbanks. Currently the Clean Water Partnership is implementing practices along the mainstem of the Lac qui Parle from Canby to Dawson, and is increasing education throughout the watershed with a grant funded by the Minnesota Pollution Control Agency. Efforts are enhanced by working with multiple agencies to improve water quality locally. The watershed district is also working on a low dissolved oxygen TMDL from Dawson to Lac qui Parle Lake where it merges with the Minnesota River.
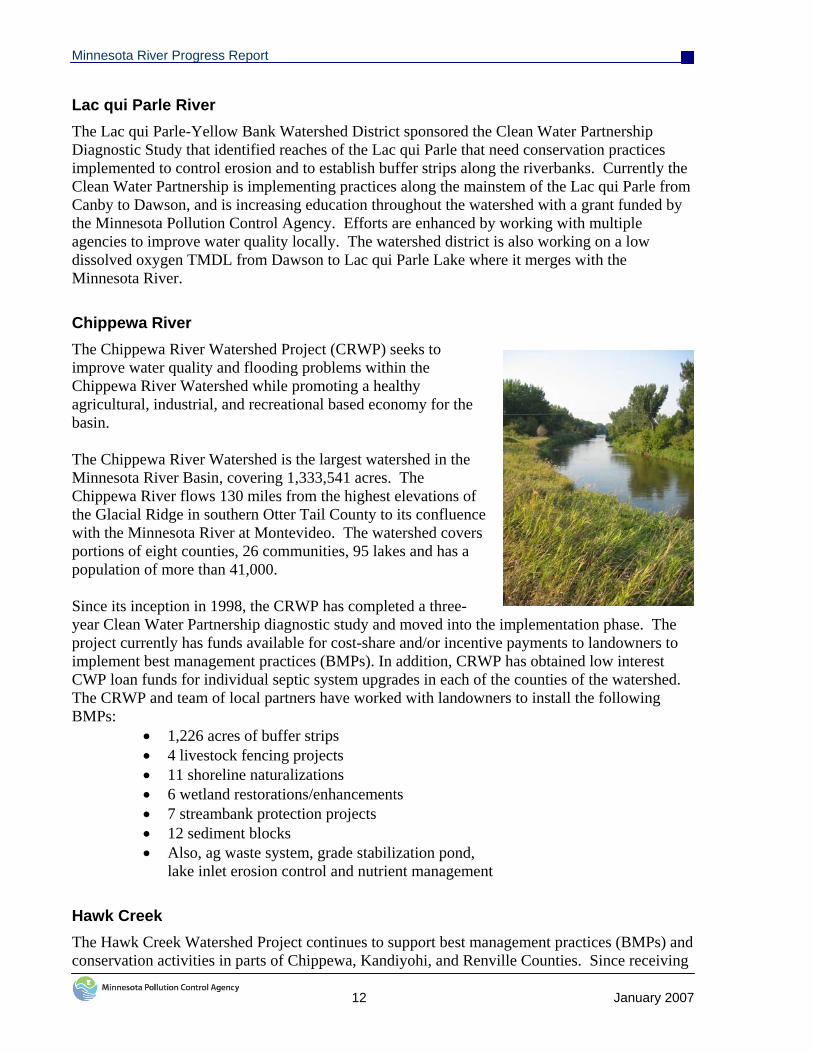
Chippewa River The Chippewa River Watershed Project (CRWP) seeks to improve water quality and flooding problems within the Chippewa River Watershed while promoting a healthy agricultural, industrial, and recreational based economy for the basin. The Chippewa River Watershed is the largest watershed in the Minnesota River Basin, covering 1,333,541 acres. The Chippewa River flows 130 miles from the highest elevations of the Glacial Ridge in southern Otter Tail County to its confluence with the Minnesota River at Montevideo. The watershed covers portions of eight counties, 26 communities, 95 lakes and has a population of more than 41,000. Since its inception in 1998, the CRWP has completed a three-year Clean Water Partnership diagnostic study and moved into the implementation phase. The project currently has funds available for cost-share and/or incentive payments to landowners to implement best management practices (BMPs). In addition, CRWP has obtained low interest CWP loan funds for individual septic system upgrades in each of the counties of the watershed. The CRWP and team of local partners have worked with landowners to install the following BMPs:
• 1,226 acres of buffer strips • 4 livestock fencing projects • 11 shoreline naturalizations • 6 wetland restorations/enhancements • 7 streambank protection projects • 12 sediment blocks • Also, ag waste system, grade stabilization pond,
lake inlet erosion control and nutrient management
Hawk Creek The Hawk Creek Watershed Project continues to support best management practices (BMPs) and conservation activities in parts of Chippewa, Kandiyohi, and Renville Counties. Since receiving

Minnesota River Progress Report
13 January 2007
the first grant in 1997 the watershed project has cost-shared conservation projects with more than 400 landowners. Many of these projects were a shared effort with local Natural Resources Conservation Service, Soil and Water Conservation District, and County offices. Effective partnerships have contributed greatly to the Hawk Creek Watershed Project’s success. Side inlets, blind intakes, grassed waterways and buffer strips are used to reduce sediment and phosphorus loads in the watershed. Low interest loans are available to upgrade failing septic systems. So far more than $2 million in loan funds have been received. In conjunction with BMP installation, the water quality of Hawk, Chetomba, and Beaver Creeks is monitored several times annually to assess the effectiveness of BMPs. Since the project started, the watershed has seen moderate reductions in both sediment and phosphorus. Public education has been and will continue to be a major focus. Past activities include youth education through several interactive programs and presentations. Staff have developed brochures and have attended local fairs and farm shows to promote watershed projects. The long term goal of the Hawk Creek Watershed Project is to improve water quality and quantity issues while promoting a healthy agricultural, industrial, and recreation-based economy.
Yellow Medicine River The Yellow Medicine River Watershed District has addressed numerous water control and flooding issues in the past 10 years by establishing and maintaining 10 dam structures and five road retention structures in the upper reaches of the district where the fall in elevation is the greatest. The erosion and flood reduction projects have greatly reduced the occurrence of massive flooding of croplands, and road and bridge washouts. Water quality issues became a concern in the 1990s with excess nutrients, specifically in Lake Shaokatan, due to excess runoff of phosphorus and nitrogen from nearby agricultural operations. This reduced the recreational value of the lake and caused fish kills from low dissolved oxygen. A diagnostic study and implementation plan were completed for the Lake Shaokatan area, with continued monitoring and careful scrutiny of projects and agricultural practices around the lake. The recent Lake Shaokatan TMDL project promises continued protection of the lake. The district also has been involved in a Clean Water Partnership project of the Yellow Medicine River and its tributaries to detect specific areas in need of improved best management practices and to reduce the amounts of pollutants entering the river. Pollutant reduction goals have been set at 25 percent and based on pollutant. Estimates show progress toward meeting goals, with the exception of one priority site that will become the subject of an intensive landowner education program.
Minnesota River Progress Report
14 January 2007
The district uses low interest loans to help finance upgrades of non-compliant septic systems. Many septic system upgrades have occurred in Lyon, Lincoln and Yellow Medicine Counties, specifically those within the watershed district.
Redwood and Cottonwood Rivers The Redwood-Cottonwood Rivers Control Area (RCRCA) has set pollutant reduction goals of 30 to 40 percent, based on pollutant. Estimates indicate they are on track toward meeting the goals. RCRCA uses low interest loans to help finance fixes of non-compliant septic systems. Goals of 69 replacements for the Redwood and 109 for the Cottonwood have been set. The project has also been working with local Farm Service Agency offices by actively promoting and identifying areas along ditches and streams eligible for buffer enrollment under continuous CRP. Nine continuous water monitoring stations have been established since the early 1990s and water quality trends are annually correlated to implementation activities. RCRCA has implemented 760 structural BMPs from 378, 10-year contracts in both watersheds, yielding reductions of 35,723 tons per year of soil loss, 26,200 tons per year of sediment and 30,708 pounds of phosphorus annually. Currently under the low interest loan program in both watersheds, 304 septic systems have been upgraded that were listed as imminent threats to public health with an annual phosphorus reduction of 12,480 pounds.
Middle Minnesota River Seven Mile Creek and Little Cottonwood River have been targeted in this watershed. More than 5,000 acres have been enrolled in CRP, CREP, and EQIP. Practices include wetland restorations, filter strips, minimum tillage, and rock inlets. Nearly 90 non-compliant septic systems have been upgraded using low interest loan funding. About 1,000 fourth graders attend the annual Children’s Water Festival.
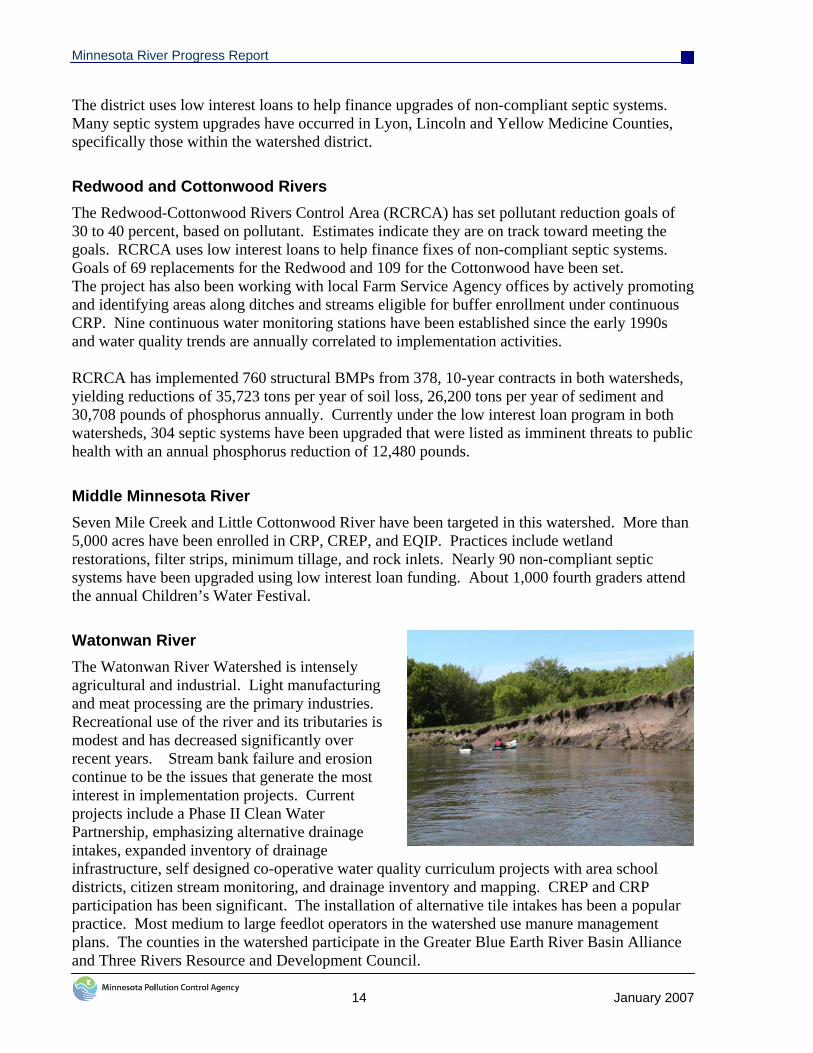
Watonwan River The Watonwan River Watershed is intensely agricultural and industrial. Light manufacturing and meat processing are the primary industries. Recreational use of the river and its tributaries is modest and has decreased significantly over recent years. Stream bank failure and erosion continue to be the issues that generate the most interest in implementation projects. Current projects include a Phase II Clean Water Partnership, emphasizing alternative drainage intakes, expanded inventory of drainage infrastructure, self designed co-operative water quality curriculum projects with area school districts, citizen stream monitoring, and drainage inventory and mapping. CREP and CRP participation has been significant. The installation of alternative tile intakes has been a popular practice. Most medium to large feedlot operators in the watershed use manure management plans. The counties in the watershed participate in the Greater Blue Earth River Basin Alliance and Three Rivers Resource and Development Council.
Minnesota River Progress Report
15 January 2007
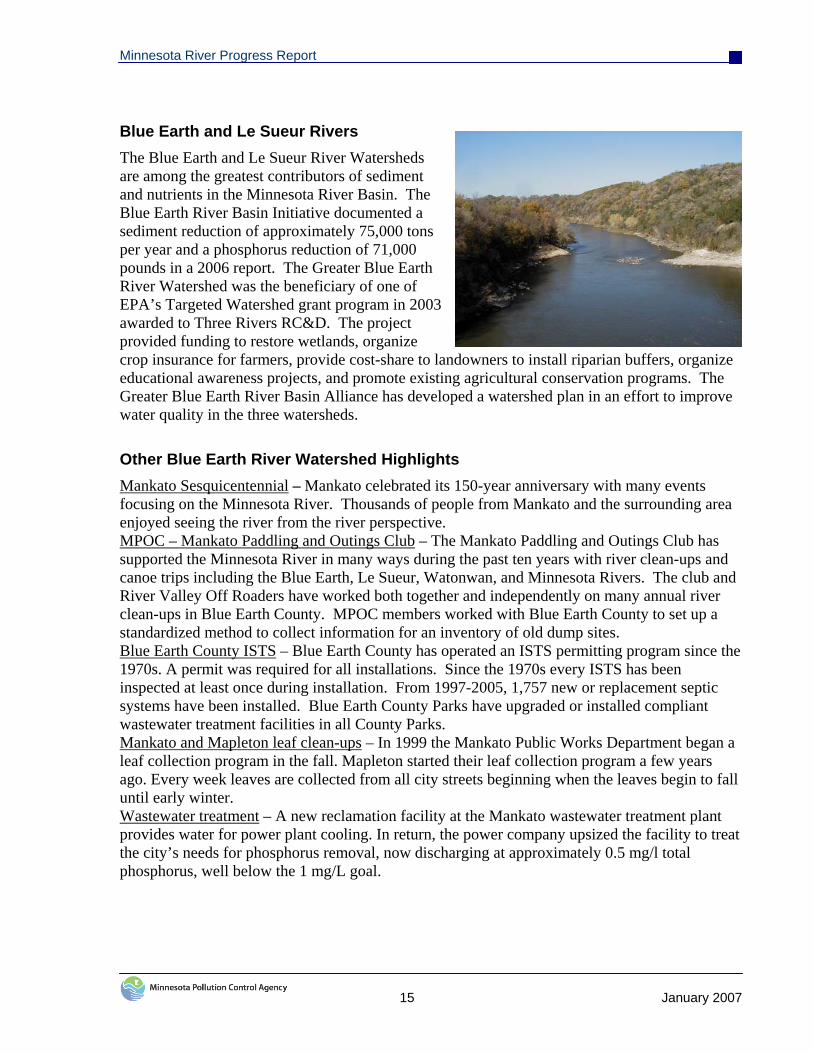
Blue Earth and Le Sueur Rivers The Blue Earth and Le Sueur River Watersheds are among the greatest contributors of sediment and nutrients in the Minnesota River Basin. The Blue Earth River Basin Initiative documented a sediment reduction of approximately 75,000 tons per year and a phosphorus reduction of 71,000 pounds in a 2006 report. The Greater Blue Earth River Watershed was the beneficiary of one of EPA’s Targeted Watershed grant program in 2003 awarded to Three Rivers RC&D. The project provided funding to restore wetlands, organize crop insurance for farmers, provide cost-share to landowners to install riparian buffers, organize educational awareness projects, and promote existing agricultural conservation programs. The Greater Blue Earth River Basin Alliance has developed a watershed plan in an effort to improve water quality in the three watersheds.
Other Blue Earth River Watershed Highlights Mankato Sesquicentennial – Mankato celebrated its 150-year anniversary with many events focusing on the Minnesota River. Thousands of people from Mankato and the surrounding area enjoyed seeing the river from the river perspective. MPOC – Mankato Paddling and Outings Club – The Mankato Paddling and Outings Club has supported the Minnesota River in many ways during the past ten years with river clean-ups and canoe trips including the Blue Earth, Le Sueur, Watonwan, and Minnesota Rivers. The club and River Valley Off Roaders have worked both together and independently on many annual river clean-ups in Blue Earth County. MPOC members worked with Blue Earth County to set up a standardized method to collect information for an inventory of old dump sites. Blue Earth County ISTS – Blue Earth County has operated an ISTS permitting program since the 1970s. A permit was required for all installations. Since the 1970s every ISTS has been inspected at least once during installation. From 1997-2005, 1,757 new or replacement septic systems have been installed. Blue Earth County Parks have upgraded or installed compliant wastewater treatment facilities in all County Parks. Mankato and Mapleton leaf clean-ups – In 1999 the Mankato Public Works Department began a leaf collection program in the fall. Mapleton started their leaf collection program a few years ago. Every week leaves are collected from all city streets beginning when the leaves begin to fall until early winter. Wastewater treatment – A new reclamation facility at the Mankato wastewater treatment plant provides water for power plant cooling. In return, the power company upsized the facility to treat the city’s needs for phosphorus removal, now discharging at approximately 0.5 mg/l total phosphorus, well below the 1 mg/L goal.

Minnesota River Progress Report
16 January 2007
Lower Minnesota River High Island Creek and Rush River Watersheds With water quality studies recently completed, implementation is underway in these two watersheds. Cover crops on land growing sugar beets and canning crops will hold the soil in place on more than 2,100 acres. Twenty rock tile intakes and 33 slotted risers will hold soil back and slow water as it drains through fields. Other practices include grade stabilization structures, restoration of 200 acres of wetlands, installation of 70 acres of filter strips, and loans to upgrade 14 non-compliant septic systems. Friends of the Minnesota Valley This organization was instrumental in establishing the Minnesota Valley Wildlife Refuge located in Bloomington. The Refuge protects floodplain and other wildlife habitat. The Friends of the Minnesota Valley was also one of the groups involved in securing CREP funding and have organized a Community Cleanups for Water Quality Program to remove trash, grass clippings, and leaves. Friends of the Minnesota Valley recruits sponsors, provides materials, and coordinates with city staff, and educates residents. Thirteen cleanups have resulted in the removal of 14,100 pounds of trash, and the removal of 1,358 pounds of phosphorus in leaves and grass clippings.
Minnesota River Basin Web sites Minnesota Pollution Control Agency www.pca.state.mn.us/water/basins/mnriver
Minnesota River Basin Data Center/Minnesota State University http://mrbdc.mnsu.edu
University of Minnesota/Department of Soil Water and Climate www.soils.umn.edu/research/mn-river
Clean Up the River Environment http://curemnriver.org/
Coalition for a Clean Minnesota River www.newulmweb.com/ccmr
Friends of the Minnesota Valley www.friendsofmnvalley.org
Minnesota River Valley Scenic Byway www.mnrivervalley.com
Explore the Basin http://experiencenature.com