Embed Size (px)
Citation preview

Progress in Nuclear Magnetic Resonance Spectroscopy 100 (2017) 1–16
Contents lists available at ScienceDirect
Progress in Nuclear Magnetic Resonance Spectroscopy
journal homepage: www.elsevier .com/locate /pnmrs
Beyond the paradigm: Combining mass spectrometry and nuclearmagnetic resonance for metabolomics
http://dx.doi.org/10.1016/j.pnmrs.2017.01.0010079-6565/� 2017 Elsevier B.V. All rights reserved.
⇑ Corresponding author at: University of Nebraska-Lincoln, Department of Chemistry, 722 Hamilton Hall, Lincoln, NE 68588-0304, United States.E-mail address: [email protected] (R. Powers).
Darrell D. Marshall, Robert Powers ⇑Department of Chemistry, University of Nebraska-Lincoln, Lincoln, NE 68588-0304, United States
Edited by David Gadian and David Neuhaus
a r t i c l e i n f o a b s t r a c t
Article history:Received 17 December 2016Accepted 8 January 2017Available online 11 January 2017
Metabolomics is undergoing tremendous growth and is being employed to solve a diversity of biologicalproblems from environmental issues to the identification of biomarkers for human diseases. Nuclearmagnetic resonance (NMR) and mass spectrometry (MS) are the analytical tools that are routinely, butseparately, used to obtain metabolomics data sets due to their versatility, accessibility, and uniquestrengths. NMR requires minimal sample handling without the need for chromatography, is easily quan-titative, and provides multiple means of metabolite identification, but is limited to detecting the mostabundant metabolites (P1 lM). Conversely, mass spectrometry has the ability to measure metabolitesat very low concentrations (femtomolar to attomolar) and has a higher resolution (�103–104) anddynamic range (�103–104), but quantitation is a challenge and sample complexity may limit metabolitedetection because of ion suppression. Consequently, liquid chromatography (LC) or gas chromatography(GC) is commonly employed in conjunction with MS, but this may lead to other sources of error. As aresult, NMR and mass spectrometry are highly complementary, and combining the two techniques islikely to improve the overall quality of a study and enhance the coverage of the metabolome. Whilethe majority of metabolomic studies use a single analytical source, there is a growing appreciation ofthe inherent value of combining NMR and MS for metabolomics. An overview of the current state of uti-lizing both NMR and MS for metabolomics will be presented.
� 2017 Elsevier B.V. All rights reserved.
Contents
1. Introduction . . . . . . . . . . . . . . . . . . . . . . . . . . . . . . . . . . . . . . . . . . . . . . . . . . . . . . . . . . . . . . . . . . . . . . . . . . . . . . . . . . . . . . . . . . . . . . . . . . . . . . . . . . . 22. Brief overview of metabolomics . . . . . . . . . . . . . . . . . . . . . . . . . . . . . . . . . . . . . . . . . . . . . . . . . . . . . . . . . . . . . . . . . . . . . . . . . . . . . . . . . . . . . . . . . . . 3
2.1. Current state of NMR and MS metabolomics . . . . . . . . . . . . . . . . . . . . . . . . . . . . . . . . . . . . . . . . . . . . . . . . . . . . . . . . . . . . . . . . . . . . . . . . . . . 32.2. Analyte compatibility for analysis by NMR and MS metabolomics . . . . . . . . . . . . . . . . . . . . . . . . . . . . . . . . . . . . . . . . . . . . . . . . . . . . . . . . . . 4
3. Approaches for combining NMR and MS for metabolomics . . . . . . . . . . . . . . . . . . . . . . . . . . . . . . . . . . . . . . . . . . . . . . . . . . . . . . . . . . . . . . . . . . . . . 6
3.1. Interfacing NMR and MS hardware . . . . . . . . . . . . . . . . . . . . . . . . . . . . . . . . . . . . . . . . . . . . . . . . . . . . . . . . . . . . . . . . . . . . . . . . . . . . . . . . . . . 63.2. Chemical modification . . . . . . . . . . . . . . . . . . . . . . . . . . . . . . . . . . . . . . . . . . . . . . . . . . . . . . . . . . . . . . . . . . . . . . . . . . . . . . . . . . . . . . . . . . . . . 83.3. Stable isotope tracers . . . . . . . . . . . . . . . . . . . . . . . . . . . . . . . . . . . . . . . . . . . . . . . . . . . . . . . . . . . . . . . . . . . . . . . . . . . . . . . . . . . . . . . . . . . . . . 93.4. Combined cheminformatics methods. . . . . . . . . . . . . . . . . . . . . . . . . . . . . . . . . . . . . . . . . . . . . . . . . . . . . . . . . . . . . . . . . . . . . . . . . . . . . . . . . 113.5. Multivariate statistical methods. . . . . . . . . . . . . . . . . . . . . . . . . . . . . . . . . . . . . . . . . . . . . . . . . . . . . . . . . . . . . . . . . . . . . . . . . . . . . . . . . . . . . 114. Conclusion . . . . . . . . . . . . . . . . . . . . . . . . . . . . . . . . . . . . . . . . . . . . . . . . . . . . . . . . . . . . . . . . . . . . . . . . . . . . . . . . . . . . . . . . . . . . . . . . . . . . . . . . . . . 14Acknowledgements . . . . . . . . . . . . . . . . . . . . . . . . . . . . . . . . . . . . . . . . . . . . . . . . . . . . . . . . . . . . . . . . . . . . . . . . . . . . . . . . . . . . . . . . . . . . . . . . . . . . 14References . . . . . . . . . . . . . . . . . . . . . . . . . . . . . . . . . . . . . . . . . . . . . . . . . . . . . . . . . . . . . . . . . . . . . . . . . . . . . . . . . . . . . . . . . . . . . . . . . . . . . . . . . . . 14

Fig. 1. The chart plots the number of MS metabolomics (green), NMRmetabolomics(blue), and combined NMR and MS metabolomics (red) studies published per yearfrom 2001 to 2016. These data were obtained from a keyword search of alldocuments on PubMed using the key words ‘‘MS and metabolomics”, ‘‘NMR andmetabolomics”, or ‘‘MS and NMR and metabolomics”.
2 D.D. Marshall, R. Powers / Progress in Nuclear Magnetic Resonance Spectroscopy 100 (2017) 1–16
1. Introduction
Metabolic profiling has existed for hundreds of years and was acommon practice in ancient Chinese medicine [1]. At the turn ofthe century the term ‘‘metabolomics”1 was coined and ignitedrenewed interest in the field [2–4], which has led to rapid develop-ments and advancements in metabolomics procedures and technolo-gies [2–4]. In effect, metabolic profiling has transitioned from the useof smell and/or taste to the application of advanced spectrometricmethods such as nuclear magnetic resonance (NMR) or mass spec-trometry (MS) [5–8]. Consequently, metabolomics has become acornerstone of systems biology [9,10] since it enables uniqueinsights that cannot be obtained from other ‘‘omics” methods [10–13]. Metabolomics directly relates a measurable chemical responseto a biological event, thereby linking the genotype and phenotypeof an organism [14]. Thus, the method is increasingly being usedin nutrition science [15], environmental science [16], biomedicalresearch [17] and precision medicine [18]. While interest hasexpanded exponentially in recent years (Fig. 1), the field of metabo-lomics is still in an early stage of growth and development, and facesmany technical challenges [5,7,8,19,20]. Before it can become a rou-tine tool for the life sciences, many of these current limitations needto be overcome. Similar to other ‘‘omics” methods, a single metabo-lomics study may contain an abundance of data making it difficult tocorrectly extract the relevant biological information [20–22]. Fur-thermore, the specific analytical platform chosen for metabolomicswill uniquely limit the analysis because of spectral and chemicalambiguity, which, in turn, will yield an imperfect biological pictureand incomplete coverage of the metabolome [23]. Sensitivity, resolu-tion, dynamic range, ambiguous assignments, limits of detection,and various other issues are universal problems encountered by allanalytical methods; there simply is not a single analytical sourcethat will detect the entire metabolome.
Over three decades ago, the fundamental importance and ben-efit of employing several analytical methods to improve the qualityof data analysis and advance compound elucidation was highlytouted, which, at the time, produced an alphabet soup of hyphen-ated methods [24]. Although successful hyphenated techniquesrarely expanded beyond combining a form of separation such asliquid chromatograph (LC), gas chromatograph (GC), or capillaryelectrophoresis (CE) with an analysis tool such as NMR or MS,the need for multiple analytical platforms for complex analysiswas readily apparent [25]. This is especially true in the field ofmetabolomics [23]. Nevertheless, to date, the majority of metabo-lomics data sets have been acquired using only MS or NMR despitetheir fundamental complementarity [23]. Fortunately, there is agrowing appreciation that combining MS and NMR data greatlyimproves the coverage of the metabolome and enhances the accu-racy of metabolite identification [26–31]. For example, it is well-established that the structure elucidation of an unknown naturalproduct is greatly facilitated by combining the unique informationfrom NMR (e.g., chemical shifts, coupling constants, NOEs, spin sys-tems, etc.) with MS (e.g., exact mass [molecular formula], molecularfragments) [32,33].
A metabolomics study is defined by both the capabilitiesand limitations of the analytical method employed, and may be
1 The term metabonomics is often used interchangeably with metabolomics andthe primary distinction between the two terms is historical instead of scientific. Theword metabolome was first used by Oliver et al. in 1998 to define, similar to the termsproteome or transcriptome, the collection of metabolites present in a cell, tissue ororganism. Consequently, metabolomics as defined by Fiehn in 2001 is the ‘compre-hensive and quantitative analysis of all metabolites’. The term metabonomics wasdefined in 1999 by Nicholson et al. as ‘ the quantitative measurement of the dynamicmultiparametric metabolic response of living systems to pathophysiological stimulior genetic modification’.
significantly hindered if only NMR or MS is used for the analysis.The important advantages of using NMR for metabolomics includea relatively high-throughput, non-destructive data acquisition,minimal sample handling, simple methods for metabolite quanti-tation, and redundant spectral information to improve the accu-racy of metabolite identification [34–36]. Conversely, NMR islimited to detecting only the most abundant metabolites(P1 lM), while MS has a much higher sensitivity and readily mea-sures concentrations in the femtomolar to attomolar range. MSalso boasts higher resolution (�103–104) and dynamic range(�103–104). Conversely, MS only detects metabolites that readilyionize, as a result of which upwards of 40% of chemical librariesare not observable by MS [37,38]. Similarly, ion suppression is awell-known problem in MS, which further reduces the detectionof ions of interest due to matrix effects [39]. Simply, the presenceof other compounds in the sample or containments from externalsources (e.g., plastics, buffers, solid phase, etc.) is a ‘matrix’ thatreduces the ability of a specific compound to be ionized througha variety of proposed mechanisms [39]. For example, an ion sup-pressing agent from the matrix may simply out-compete the com-pound for available ions. Thus, ion suppression due to matrixeffects is a significant concern for metabolomics given the com-plexity and heterogeneity of metabolomics samples. In effect, thepresence of one metabolite may lead to other metabolites beingundetected [40]. Thus, MS-based metabolomics typically involveschromatography [41,42] to reduce peak overlap arising from therelatively narrow nominal mass and mass defect distribution ofthe metabolome [43]. But the use of chromatography may inducebiologically irrelevant variations in the metabolome resulting fromnon-uniform metabolite derivatization, variable metabolite col-umn recovery, metabolite decomposition during derivatization orseparation, metabolite ion-suppression due to co-eluting matrixcompounds, or misalignment of replicate retention times [44–48]. Simply, NMR and MS have distinct strengths and weaknessesand both uniquely benefit metabolomics.
In recent years, technical advancements in high field magnets,pulse sequences, and cryoprobe technology have led to some sig-nificant improvements in the sensitivity and resolution of NMRexperiments [23]. This, in turn, has improved the quality of

D.D. Marshall, R. Powers / Progress in Nuclear Magnetic Resonance Spectroscopy 100 (2017) 1–16 3
metabolomics data and has contributed to the observed increase inNMR-based metabolomics studies. Despite these advancements,one-dimensional (1D) 1H NMR spectra are still hindered by a sig-nificant amount of peak overlap, even for high field magnets,because of the limited chemical shift dispersion of metabolites[8,49,50]. Thus, these recent improvements in NMR still do notmatch the sensitivity and resolution advantages of MS [23,51].Analogous advancements in MS have also occurred, which haveled to similar improvements in the quality of metabolomics datasets. High resolution spectrometry, accurate mass, and isotopelabeling methods means that virtually every metabolite that isnot an isomer produces a unique m/z and should be readily identi-fied [52]. In fact, a majority of metabolomics studies routinely relyon MS (Fig. 1). Additionally, improvements in ionization methodsand separation techniques have helped reduce matrix effects dueto co-eluting compounds common in complex mixtures, but ionsuppression remains a primary issue for MS metabolomics[11,53]. Electrospray ionization mass spectrometry (ESI-MS) sensi-tivity is directly dependent on a compound’s pKa and hydrophobic-ity, which can be negatively impacted by the heterogeneouscomposition of a metabolomics sample [54]. For example, if twocompounds with different pKa values are present in the same elec-trospray droplet, only the compound with the lower pKa value maybe protonated and detected. Thus, given the various limitations ofboth NMR and MS, no single analytical platform has the ability toanalyze the entire metabolome alone [11,55]. Instead, while someoverlap exists, NMR and MS observe a highly complementary set ofmetabolites [56,57]. Thus, applying both NMR and MS during ametabolomics study will allow for a more comprehensive coverageof the metabolome [57]. The combination of NMR and MS data willalso improve the identification of unknown analytes and willincrease the accuracy of identifying known metabolites[28,31,51,57–60]. This occurs because metabolite identificationwill be based on distinct and confirmatory evidence.
A grand challenge in the field of metabolomics is the rapid andaccurate identification of metabolites from the variety of complexbiological samples routinely analyzed (e.g., tissues, serum and cellextracts) [61,62]. As a consequence, nearly all published metabolo-mic studies contain at least one misidentified or unidentifiedmetabolite [62]. This is an unfortunate and unavoidable outcomeof our limited knowledge of the metabolome (the exact composi-tion is currently unknown), the severe limitations in the softwareand databases available for metabolite identification, and the rou-tine reliance on a single analytical method. Despite the routineapplication of NMR and MS to elucidate the structures of naturalproducts for drug discovery [32,33], most metabolic studies stillrely on only NMR or MS spectral data for metabolite identificationbased on database searches [63]. Unfortunately, metabolic data-bases only contain, at most, a few thousand reference NMR orMS spectra of known metabolites. There is also minimal, if any,coordination between the various metabolomics databases. Thisleads to a significant amount of redundancy between databases,and also results in unique data being present in individual data-bases, requiring an investigator to search across multiple data-bases. Also, many databases are cumbersome and utilize simplesearch algorithms, which only allow for a single spectral categoryper query [63]. Finally, most metabolomics databases are limitedto either NMR or MS reference data. Again, this is a result of thefact that the metabolomics field has evolved to support only a sin-gle analytical source. Thus, it is not possible to easily search meta-bolomics databases for simultaneous matches against NMR andMSspectral data. As a result, metabolomics will greatly benefit fromthe creation of a unified NMR and MS database and the mergingof data. This is especially true given the growing recognition ofthe value of combining NMR and MS for metabolite assignments[28,29,51,57,58].
Multivariate statistical methods are normally applied to meta-bolomics data sets in order to simplify and expedite the data anal-ysis [12,64]. While chemometric techniques regularly streamlinethe process of data analysis, these advanced multivariate statisticaltechniques are routinely used incorrectly, lack proper validation,and have, unfortunately, lead to a proliferation of erroneous datain the scientific literature [65,66]. This problem becomes com-pounded when an investigator is combining multiple analyticalsources. In most cases, the samples, data, and analysis are doneseparately. The NMR and MS data sets are not integrated into a sin-gle chemometrics model because, until recently, the field lackedsoftware capable of handling data from multiple analytical sources[57,67,68]. Thus, any observed changes in the NMR and MS spectraare not statistically correlated and, importantly, the metabolitesand pathways separately identified by NMR and MS may not bebiologically related. Only a minimal number of studies have beenreported that actually utilized both NMR and MS in a singlechemometrics model [69–72].
As outlined above, NMR and MS are routinely, but separately,used for metabolomics studies despite their complementarystrengths. Nevertheless, there is a growing recognition of the ben-efits of combining the two techniques for metabolomics as evidentby the increasing number of published manuscripts that utilizedboth NMR and MS (Fig. 1). NMR and MS have been combined ina number of ways that includes: (1) physically interfacing NMRand MS hardware, (2) chemical modification of samples by deriva-tization of metabolites with compounds that display unique char-acteristics for MS and NMR detection, (3) stable isotope tracing byisotopically labeling metabolites, (4) using combined cheminfor-matics techniques on MS and NMR data sets for an accurate andrapid analysis, or (5) unique data handling and data mining tech-niques which correlate trends in both data sets by using multivari-ate statistical-based methods [29,30,58]. Herein, we provideillustrative examples for each of these methods and present anoverview of the various benefits derived from combining NMRand MS for the analysis of metabolomics samples.
2. Brief overview of metabolomics
2.1. Current state of NMR and MS metabolomics
Both NMR- and MS-based metabolomics have been extensivelyreviewed in the recent scientific literature [3,11,13,23,73–80]. Sim-ilarly, a number of reviews describing the proper handling, prepa-ration, and extraction of metabolic samples from urine, serum, cellcultures, tissue cultures, and a variety of other biological sourcesare readily available [36,81–85]. So, only a very brief overview ofthe general procedure for metabolic profiling will be presentedhere, primarily to highlight important differences when NMR andMS are combined for a metabolomics study (Fig. 2) [86]. In princi-ple, metabolomics is a relatively straightforward method: themetabolome is harvested or extracted from two or more groups(e.g., healthy vs. diseased), and an analytical technique (e.g., NMRor MS) is used to acquire a spectral profile of each metabolic sam-ple. Then, multivariate statistical techniques (e.g., principal compo-nent analysis [PCA], orthogonal projections to latent structures[OPLS], etc.) are used to determine whether the metabolomes differand, if they do, to identify the spectral features (i.e., the metabo-lites) defining group separation. A typical outcome of a PCA or OPLSmodel is a scores plot, where each NMR or MS spectrum has beenreduced to a single point in PC-space. The relative clustering of thespectra in the scores plot identifies group membership. Similarly, abackscaled loadings plot is often generated from the OPLS modelthat is a pseudospectrum of the original NMR or MS data wherethe relative intensity and direction of the spectral peaks indicates

4 D.D. Marshall, R. Powers / Progress in Nuclear Magnetic Resonance Spectroscopy 100 (2017) 1–16
the contribution and correlation of the peak to the group separa-tion. Alternatively, a heatmap can be generated that compares allof the relative metabolite concentration changes per replicate. Fol-lowing hierarchal clustering, if all or most of the replicates fromthe same group cluster together, then the heatmap identifies keymetabolite concentration changes that define each group.
Since the numbers of replicates for a metabolomics data set aretypically far fewer then the number of variables, overfitting thedata, especially for supervised techniques like PLS or OPLS, is a seri-ous concern [65,66,87]. In fact, a PLS/OPLS model can produce theappearance of a clear group separation even for noise or com-pletely random data [88]. As a result, model validation is a criticalfinal step before any biological interpretation of the model is reli-able. CV-ANOVA [89], response permutation tests [87], and recei-ver operating characteristic (ROC) curves [90] are routinely usedto provide standard p values and assess model validity. With a val-idated model, the observed metabolite changes can then be used togenerate a metabolic network and identify the important meta-bolic pathways associated with the phenotype [91].
Unlike the proteome and genome, the metabolome is relativelyunstable and is easily perturbed by the handling and processing ofthe sample. For example, metabolites have different enzyme turn-over rates and different temperature stabilities [92–94]. Thus, akey concern is avoiding any changes in the metabolome that maybe induced from sample preparation. Therefore, fast and uniformsample preparation protocols, rapid quenching of enzymatic activ-ity, keeping samples cold throughout, and randomizing samplesthrough the entire sample handling and data collection procedureare all important details that require optimization for a successfulmetabolomics study. Since biological samples are the materialsthat are analyzed, there is inherently a large natural variance tothe data. Thus, to obtain statistical significance a maximal numberof replicates, within practical constraints, is highly desirable [36].Similarly, the data need to be properly normalized, scaled andaligned to account for both biological and instrument variance,and to remove bias due to the large range of metabolite concentra-tions. Again, various normalization, scaling and alignment algo-rithms are available and their utility for metabolomics has beenpreviously reviewed [95–97]. Finally, the raw NMR or mass spec-tral data need to be properly processed before a reliable chemo-metrics model can be generated. For NMR, processing includesFourier transformation, phasing, baseline correction, apodization,zero filling and chemical shift referencing. Similarly, MS requirescentroiding, de-noising, de-isotoping, deconvolution and peakalignment. It cannot be overstated that the resulting chemometricmodels are incredibly sensitive to all aspects of the sample han-dling and data processing. Thus, changing processing details, suchas a different apodization function or deconvolution algorithm will
Fig. 2. Illustration of the metabolomics work flow that combines advanced NMR spectrosto minimize variability and are analyzed by NMR profile to collect data on all metabolitprincipal component analysis, partial least squares discriminant analysis, orthogonal promethod, and other modes aiming to highlight underlying trends and visualization tools soperating characteristic (ROC) curves are generally considered the method of choice foplaced in a metabolic pathway to provide insight on the biochemical phenomena. (Samurine, plasma, etc.) for each group (e.g., healthy vs. disease). (NMR profile) A 1D 1H NMRmass spectrum can be used instead or in addition to the NMR spectrum. (PRA) IllustraClockwise from upper-left, a scores plot from a PCA model indicating two distinct clusterschanges (x-axis) relative to each group replicate (y-axis). The relative color of each biheatmap identifies which set of metabolites are uniquely changing between each group.error rate or misclassifications versus the number of trees. The results indicate that the hnumber of trees. A back-scaled loadings plot, which is a pseudo 1D 1H NMR spectrum,conveys the importance and correlation of the NMR peak to the observed group separafurther analysis of the key metabolites identified from the multivariate statistical analysi(true positive rate) versus 1-specificity (false positive rate). The area under the curve is aright is the pathway topology analysis produced by MetPA (http://metpa.metabolomicMetPA assists in identifying the set of important metabolic pathways associated with thidentified from the observed metabolomic changes between the groups. Reproduced wi
likely lead to a different chemometrics model and, potentially, adifferent biological interpretation. Consequently, great care mustbe taken in optimizing data processing protocols in order to avoidunintended biases in the data analysis. The complexity of the situ-ation expands exponentially if two or more analytical sources arecombined to generate a single chemometrics model simplybecause of the greater number of possible processing protocolcombinations. Thus, while metabolomics is conceptually quitesimple and straightforward to conduct, in practice it is difficultto do correctly because of the complex number of steps and choicesavailable, with multiple sources of error encountered at each stepof the process.
2.2. Analyte compatibility for analysis by NMR and MS metabolomics
NMR and MS are the most popular analytical methods used formetabolomics because of the wide array of chemical species bothtechniques can probe and are likely to encounter in a complexand heterogeneous metabolite mixture. MS is generally coupledwith a separation technique, with the majority of metabolomicsstudies utilizing LC-ESI-MS [11,64,98]. The coupling of MS withLC or GC is critical for reducing ion suppression, spectral complex-ity and spectral overlap. To further reduce ion suppression, sam-ples are typically acidified and salt concentrations are reduced,usually with a desalting column [99]. Although NMR is occasion-ally paired with a separation method, the hardware for an onlineLC-NMR system can be somewhat crude or cumbersome, and theprocess of manually collecting fractions is extremely time-consuming. Moreover, a hybrid LC-NMR system does not providea substantial benefit since individual metabolites are readilydetectable by NMR without chromatographic separation [100].
Besides different chromatographic needs, MS and NMR requiredifferent sample conditions. NMR samples are commonly preparedin a buffered deuterated solvent to provide a lock signal and main-tain a constant pH of 7.4 in order to minimize chemical shift devi-ations and replicate physiological conditions [9,99]. In general,detecting a metabolite by NMR is not dependent on the samplecondition. However, NMR is a relatively insensitive techniqueand requires maximizing metabolite concentrations to ensuredetection. On average, NMR metabolomics requires a minimalsample volume of approximately 30–600 lL, with metabolite con-centrations of approximately lM to mM. Because of the highersensitivity of MS, the concentration requirements can be signifi-cantly reduced to as low as nM to pM, with sample volumes onthe order of a few microliters. While MS is intrinsically more sen-sitive than NMR, detecting a specific metabolite does require themetabolite to be efficiently ionized. Different groups of metaboliteswill preferentially ionize under drastically different experimental
copy techniques with multivariate statistics. Samples are collected in a uniform wayes potentially present in the sample. Pattern recognition approaches (PRA) includejections to latent structures, heat map, support vector machines, and random forestsuch as contribution. Trend and box plots are used to further evaluate these. Receiverr evaluating the performance of potential biomarkers. The markers are eventuallyples) Multiple replicate samples are obtained from cells, tissues, or biofluids (e.g.,spectrum is collected for each metabolomics sample, which becomes the data set. Ations of typical multivariate statistical analysis of the metabolomics NMR data set.or groups are present in the data set. A heatmap shows the clustering of metabolite
n corresponds to the metabolite concentration difference between replicates. TheThe result of a random forest classification is summarized by plotting the out-of-bagealthy and disease groups can be separated with an error rate of <5% with a nominalis generated from an OPLS model. The relative intensity and direction of each peaktion in the corresponding scores plot. (ROC) Illustrations of the validation and thes that define the group separation. On the left is a ROC curve, which plots sensitivitymeasure of the accuracy of the model to correctly predict group membership. On thes.ca) from the list of metabolites identified by the multivariate statistical analysis.e phenotype. (Pathways) Illustration of metabolic networks or signaling pathwaysth permission from Ref. [86].
"

D.D. Marshall, R. Powers / Progress in Nuclear Magnetic Resonance Spectroscopy 100 (2017) 1–16 5
6 D.D. Marshall, R. Powers / Progress in Nuclear Magnetic Resonance Spectroscopy 100 (2017) 1–16
conditions, which depend on mode of polarization, pH and the ion-ization efficiency of the specific metabolite. Thus, the detectabilityof a metabolite may vary dramatically depending on sample condi-tions. For example, 0.1% formic acid or acetic acid is commonlyadded to MS samples to enhance protonation and increase sensi-tivity. Conversely, a deuterated solvent used in NMR could compli-cate the analysis of an MS spectrum because exchangeablehydrogens would still be observed, but ambiguous mass shiftsmay occur. The exchangeable hydrogens are likely not observedin the NMR spectrum, potentially eliminating the ability to detecta given metabolite. Moreover, minimal sample handling is desiredto reduce experimental errors. Thus, these necessary differences insample conditions present a practical challenge, namely how can asingle metabolomics sample be analyzed by two distinct analyticalplatforms?
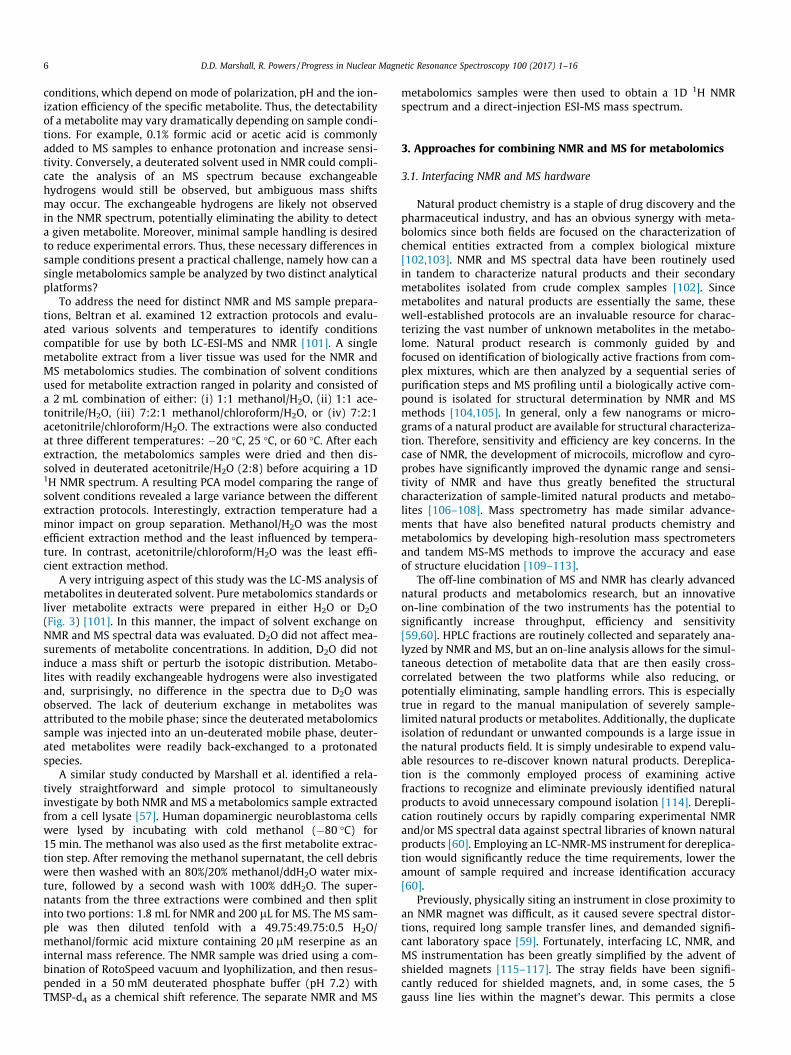
To address the need for distinct NMR and MS sample prepara-tions, Beltran et al. examined 12 extraction protocols and evalu-ated various solvents and temperatures to identify conditionscompatible for use by both LC-ESI-MS and NMR [101]. A singlemetabolite extract from a liver tissue was used for the NMR andMS metabolomics studies. The combination of solvent conditionsused for metabolite extraction ranged in polarity and consisted ofa 2 mL combination of either: (i) 1:1 methanol/H2O, (ii) 1:1 ace-tonitrile/H2O, (iii) 7:2:1 methanol/chloroform/H2O, or (iv) 7:2:1acetonitrile/chloroform/H2O. The extractions were also conductedat three different temperatures: �20 �C, 25 �C, or 60 �C. After eachextraction, the metabolomics samples were dried and then dis-solved in deuterated acetonitrile/H2O (2:8) before acquiring a 1D1H NMR spectrum. A resulting PCA model comparing the range ofsolvent conditions revealed a large variance between the differentextraction protocols. Interestingly, extraction temperature had aminor impact on group separation. Methanol/H2O was the mostefficient extraction method and the least influenced by tempera-ture. In contrast, acetonitrile/chloroform/H2O was the least effi-cient extraction method.
A very intriguing aspect of this study was the LC-MS analysis ofmetabolites in deuterated solvent. Pure metabolomics standards orliver metabolite extracts were prepared in either H2O or D2O(Fig. 3) [101]. In this manner, the impact of solvent exchange onNMR and MS spectral data was evaluated. D2O did not affect mea-surements of metabolite concentrations. In addition, D2O did notinduce a mass shift or perturb the isotopic distribution. Metabo-lites with readily exchangeable hydrogens were also investigatedand, surprisingly, no difference in the spectra due to D2O wasobserved. The lack of deuterium exchange in metabolites wasattributed to the mobile phase; since the deuterated metabolomicssample was injected into an un-deuterated mobile phase, deuter-ated metabolites were readily back-exchanged to a protonatedspecies.
A similar study conducted by Marshall et al. identified a rela-tively straightforward and simple protocol to simultaneouslyinvestigate by both NMR and MS a metabolomics sample extractedfrom a cell lysate [57]. Human dopaminergic neuroblastoma cellswere lysed by incubating with cold methanol (�80 �C) for15 min. The methanol was also used as the first metabolite extrac-tion step. After removing the methanol supernatant, the cell debriswere then washed with an 80%/20% methanol/ddH2O water mix-ture, followed by a second wash with 100% ddH2O. The super-natants from the three extractions were combined and then splitinto two portions: 1.8 mL for NMR and 200 lL for MS. The MS sam-ple was then diluted tenfold with a 49.75:49.75:0.5 H2O/methanol/formic acid mixture containing 20 lM reserpine as aninternal mass reference. The NMR sample was dried using a com-bination of RotoSpeed vacuum and lyophilization, and then resus-pended in a 50 mM deuterated phosphate buffer (pH 7.2) withTMSP-d4 as a chemical shift reference. The separate NMR and MS
metabolomics samples were then used to obtain a 1D 1H NMRspectrum and a direct-injection ESI-MS mass spectrum.
3. Approaches for combining NMR and MS for metabolomics
3.1. Interfacing NMR and MS hardware
Natural product chemistry is a staple of drug discovery and thepharmaceutical industry, and has an obvious synergy with meta-bolomics since both fields are focused on the characterization ofchemical entities extracted from a complex biological mixture[102,103]. NMR and MS spectral data have been routinely usedin tandem to characterize natural products and their secondarymetabolites isolated from crude complex samples [102]. Sincemetabolites and natural products are essentially the same, thesewell-established protocols are an invaluable resource for charac-terizing the vast number of unknown metabolites in the metabo-lome. Natural product research is commonly guided by andfocused on identification of biologically active fractions from com-plex mixtures, which are then analyzed by a sequential series ofpurification steps and MS profiling until a biologically active com-pound is isolated for structural determination by NMR and MSmethods [104,105]. In general, only a few nanograms or micro-grams of a natural product are available for structural characteriza-tion. Therefore, sensitivity and efficiency are key concerns. In thecase of NMR, the development of microcoils, microflow and cyro-probes have significantly improved the dynamic range and sensi-tivity of NMR and have thus greatly benefited the structuralcharacterization of sample-limited natural products and metabo-lites [106–108]. Mass spectrometry has made similar advance-ments that have also benefited natural products chemistry andmetabolomics by developing high-resolution mass spectrometersand tandem MS-MS methods to improve the accuracy and easeof structure elucidation [109–113].
The off-line combination of MS and NMR has clearly advancednatural products and metabolomics research, but an innovativeon-line combination of the two instruments has the potential tosignificantly increase throughput, efficiency and sensitivity[59,60]. HPLC fractions are routinely collected and separately ana-lyzed by NMR and MS, but an on-line analysis allows for the simul-taneous detection of metabolite data that are then easily cross-correlated between the two platforms while also reducing, orpotentially eliminating, sample handling errors. This is especiallytrue in regard to the manual manipulation of severely sample-limited natural products or metabolites. Additionally, the duplicateisolation of redundant or unwanted compounds is a large issue inthe natural products field. It is simply undesirable to expend valu-able resources to re-discover known natural products. Dereplica-tion is the commonly employed process of examining activefractions to recognize and eliminate previously identified naturalproducts to avoid unnecessary compound isolation [114]. Derepli-cation routinely occurs by rapidly comparing experimental NMRand/or MS spectral data against spectral libraries of known naturalproducts [60]. Employing an LC-NMR-MS instrument for dereplica-tion would significantly reduce the time requirements, lower theamount of sample required and increase identification accuracy[60].
Previously, physically siting an instrument in close proximity toan NMR magnet was difficult, as it caused severe spectral distor-tions, required long sample transfer lines, and demanded signifi-cant laboratory space [59]. Fortunately, interfacing LC, NMR, andMS instrumentation has been greatly simplified by the advent ofshielded magnets [115–117]. The stray fields have been signifi-cantly reduced for shielded magnets, and, in some cases, the 5gauss line lies within the magnet’s dewar. This permits a close
Fig. 3. (A) Scatter plot representing the area of each feature from the XCMS matrix of LC/MS data of liver samples reconstituted in H2O and D2O. A correlation coefficient (R2)of 0.998 indicates a high linear regression, which demonstrates that differences between the number and abundance of features detected in liver extracts reconstituted inH2O and D2O are insignificant. (B) Mass spectra of phenylalanine, tryptophan, and LysoPC (16:0) reconstituted in D2O (top) and H2O (bottom). Labile hydrogens are marked inred. Mass spectra show that the isotopic distributions of the compounds are not altered by D2O, indicating either slow H/D exchange of acidic protons in solution or fast back-exchange of labile deuterons in aqueous LC/MS buffers due to a total solvent accessibility of small molecule structures. (For interpretation of the references to color in thisfigure legend, the reader is referred to the web version of this article.) Reproduced with permission from Ref. [101].
D.D. Marshall, R. Powers / Progress in Nuclear Magnetic Resonance Spectroscopy 100 (2017) 1–16 7
arrangement of instruments without incurring any magnetic inter-ference or disturbing field homogeneity. The availability of bench-top mass spectrometers has also aided in the coupling of multipleplatforms. An MS instrument with a small footprint and superiorresolution makes it possible to site an LC-NMR-MS spectrometerin a smaller laboratory space then previously possible. Moreover,the proximity of the instruments simplifies sample transferbetween them. For example, an NMR and mass spectrometer canbe interfaced to LC by using a post-column splitter or the BrukerNMR-Mass Spectrometry Interface (BNMI). The post-column split-ter simultaneously directs LC flow to both the NMR and MS spec-trometers in a 9–1 ratio, respectively. BNMI is a valve-switchinginterface that is a computer-controlled splitter and double dilutor,which allows for proton–deuterium exchange to occur for NMR,
and the optimal selection of solvent polarity for MS. Additionally,BNMI has a loop storage mode, which allows for a portion of theLC eluent to be temporarily stored in a sample loop while waitingfor the NMR instrument to be available. A storage mode allows forNMR acquisition times that are significantly longer than the LCexperiment to maximize NMR signal-to-noise.
Recently, Lin et al. described an LC-NMR-MS approach, whichsignificantly reduced sample size, increased concentration sensi-tivity by 10-fold, and enhanced mass sensitivity by 1000-fold[59,98]. The method significantly outperformed traditional offlineLC-NMR-MS by the addition of a nanoSplitter for nanospray LC-MS and a microcoil flow probe for NMR analysis. In addition, theanalysis of the LC flow normally occurs with a 9:1 split betweenNMR and MS, respectively. But, instead, the improved performance

8 D.D. Marshall, R. Powers / Progress in Nuclear Magnetic Resonance Spectroscopy 100 (2017) 1–16
required an LC flow that was split 98% to NMR and 2% to MS [59].The LC-NMR-MS system exhibited a 93% sample recovery andyielded a limit of detection as low as 50-ng (RSD 1.17%) for NMR.Similarly, four natural products (ambiguine A, I, E, and hapalindoleH) from a cyanobacterial extract were readily detected by LC-MS ata concentration of only 30 lg/mL. Thus, interfacing LC with parallelNMR and MS analysis may greatly benefit metabolomics byimproving throughput, by increasing sensitivity and coverage,and by reducing the amount of sample required for a study.
3.2. Chemical modification
The diverse and complementary set of information obtainedfrom NMR and mass spectral data is the major reason for combin-ing the two methods for metabolomics. However, combining twodistinct data sets also increases the complexity of the analysis.The NMR and MS results obtained from a single heterogeneoussample are not easily correlated [30]. For example, it is not a trivialtask to definitively assign an NMR chemical shift and a MS m/zvalue to a specific metabolite. Simply, there is no information inthe NMR or MS spectrum that indicates that the chemical shiftand m/z value are from the same metabolite. The lack of a correla-tion may also appear to produce contradictory results. For exam-ple, the presence of a metabolite may only be supported by onemethod or the two methods may appear to predict vastly differentconcentrations. As a result, the complexity of analyzing NMR andMS spectra may hinder an interpretation or yield erroneous results.Consequently, a novel twist on the well-established method ofchemical derivation has been employed to overcome this lack ofa correlation between NMR and MS spectral data [30]. A chemical
Fig. 4. Schematic figure illustrating the ‘‘smart isotope tag” approach used to detect tcontaining metabolites with 15N-cholamine enables their enhanced detection by both N
agent is introduced into a complex mixture that reacts with aspecific chemical moiety or functional group within the metabo-lite. The resulting chemical modification is then visible by bothNMR and MS.
Chemical modification has frequently been used for LC-MS andGC–MS [118–121]. Traditionally, compound derivatization hasbeen used to separate stereoisomers or to improve ionization effi-ciency in LC-MS. Chemical modification for GC–MS is generallyused to promote the volatility of compounds [122]. Fariba et al.exploited the benefits of chemical modification by using 15N-cholamine, a so-called ‘‘smart tag”, to specifically label carboxyl-containing metabolites [30,123]. A permanent charge and an 15Nisotope label are incorporated into the metabolites through a con-densation reaction [30]. Each chemically labeled metabolite wouldthen have a unique set of 1H and 15N chemical shifts that can beeasily detected with a 2D 1H-15N HSQC NMR spectrum. Onlymetabolites labeled with 15N-cholamine are observed in the NMRspectrum because of the low natural abundance of 15N (0.37%).Similarly, the incorporation of a permanent charge into themetabolite significantly improved its ionization efficiency. Sensi-tivity enhancements exceeding three orders of magnitude wereobserved for labeled metabolites, which could be easily detectedin the positive mode compared to unlabeled metabolites in thenegative mode. Thus, the increased MS sensitivity and the unique1H-15N chemical shifts establish a correlation between the NMRand MS data for a labeled metabolite. The smart-tag approachwas successfully demonstrated with a standard mixture of 48metabolites that each contain a carboxyl-group and are prevalentin human biofluids (Fig. 4) [30]. The experiment was successfullyrepeated with human serum and urine samples. The chemical shift
he same metabolites using NMR and MS with high sensitivity. Tagging carboxyl-MR and MS. Reproduced with permission from Ref. [30].

D.D. Marshall, R. Powers / Progress in Nuclear Magnetic Resonance Spectroscopy 100 (2017) 1–16 9
assignments obtained from the standard metabolite mixture wasused to quickly and accurately assign the 48 metabolites in thebiofluids. Thus, 15N-cholamine was shown to be useful for correlat-ing data across multiple analytical platforms through chemicalderivatization, and as a valuable approach to aid in the metaboliteprofiling of complex biological mixtures.
3.3. Stable isotope tracers
The ability to simultaneously measure hundreds of chemicalspecies from a complex biological sample is the primary reasonNMR and MS are routinely used in metabolomics, but the over-whelming amount of data can also confound the analysis. Conse-quently, the majority of metabolomics studies are end-point orsingle time-point measurements despite the obvious advantageof flux analysis. Fortunately, MS and NMR can de-convolute thesecomplex data sets based on their unique ability to identify and dis-tinguish between different isotopes. Thus, NMR and MS metabolo-mics analysis can be greatly simplified by using stable isotopetracers. Stable Isotope-Resolved Metabolomics (SIRM) has beenused to monitor metabolite flux, to reveal novel metabolicnetworks, and has recently been shown to correlate data acrossMS and NMR platforms [124–130]. In this manner, SIRM mayovercome common limitations encountered with steady-statemetabolite profiling. SIRM also enables the combined use of NMRand MS for metabolomics, but, more importantly, the SIRMapproach greatly benefits from combining both NMR and MS[126–129,131].
SIRM uses stable isotope-enriched nutrients containing 13C-carbons or 15N-nitrogens, which are provided to an organism asthe primary source of carbon or nitrogen. The 13C-carbons or15N-nitrogens are distributed throughout the organism’s metabo-lome based on active metabolic processes. The resulting 13C- or
Fig. 5. Metabolic model of liver acetate oxidative metabolism used to estimate hepatic Tred occurs during the initial incorporation of label from 1-13C-acetate to glutamate onduring the 2nd pass through the TCA cycle, with label originating from internal scramblinof the references to color in this figure legend, the reader is referred to the web version
15N-labeled metabolites are readily detected by NMR and MS. Inthis manner, SIRM reveals the unique flow of 13C-carbons or 15N-nitrogens through metabolic pathways in order to highlight sys-tematic changes due to environmental stress, genetic mutations,a disease state, a drug treatment, or numerous other factors.Importantly, SIRM allows for monitoring the flow of position-specific carbons or nitrogens between metabolites (i.e., isotopomeror isotopologue probing). In essence, it is possible to decipher thechemical source of each carbon or nitrogen in a given metabolite(Fig. 5) [132]. Moreover, the analysis can be fine-tuned by repeat-ing the experiments with different labeled metabolites (e.g., glu-cose, pyruvate, etc.) or different labeling within a metabolite (e.g.,[1-13C] glucose, [2-13C] glucose, etc.). Identification of position-specific carbon or nitrogen labeling is relatively straightforwardby NMR since, in general, each carbon or nitrogen has a uniquechemical shift. For example, consider the distinct carbon chemicalshifts observed for L-alanine: 178.5 ppm (C0), 53.4 ppm (Ca) and19.0 ppm (Cb). Conversely, it is not possible to identify position-specific carbon or nitrogen labeling by MS except in the case of acompound containing a single carbon or nitrogen, or by employingMSn fragmentation analysis. Instead, the number of isotopicallylabeled carbons or nitrogens is easily determined by MS from anobserved mass shift. In addition, the abundance of each isotopomeris readily obtainable from an MS spectrum by comparing the rela-tive intensity of each molecular-ion peak. Conversely, obtainingthe number and abundance of each isotopomer and isotopologueis not easily obtained from an NMR spectrum.
Lane et al. used direct infusion FT-ICR-MS combined with 1Dand 2D NMR methods to identify isotopomers of glycerophospho-lipids (GPL) derived from [U-13C]-glucose in breast cancer MCF7-LCC2 cell extracts [124]. An algorithm was also presented thataccounts for the contribution of natural abundance 13C followingthe incorporation of 13C-carbon derived from glucose [133]:
CA cycle flux (VTCA) and anaplerosis (VANA). Carbon positional enrichment denoted inthe first pass through the TCA cycle. Positional enrichment denoted in blue occursg at succinate or from bicarbonate (HCO3
�)/13CO2 via anaplerosis. (For interpretationof this article.) Reproduced with permission from Ref. [145].

Fig. 6. High resolution NMR spectra of a methanolic extract of LCC2 cells. Glycerophospholipids were extracted from LCC2 cells grown in the presence of 10 mM [U-13C]-glucose for 24 h. (A) 1D 1H NMR spectrum and (B) TOCSY spectrum. The TOCSY spectrum was recorded at 18.8 T 293 K with 50 ms mixing time at a B1 field strength of 9 kHz.The data were processed with one linear prediction and zerofilling in t1 and apodized using an unshifted Gaussian function in both dimensions. (C) 1D 1H NMR spectra, top:1D 13C-edited 1H (HSQC) spectrum, bottom: high resolution 1H NMR spectrum. High resolution FT-ICR mass spectrum of a methanolic extract of LCC2 cells. (D) FT-ICR-MSprofile spectrum of an LCC2 methanol extract after 24 h labeling with [U-13C]-glucose. A close up of them/z region from 760 to 782 is shown. The accurate masses (better than1 ppm) at high resolution (>100,000 at measured mass) enable assignment of the GPLs and their isotopologues. Masses were externally calibrated, and secondarily calibratedwith respect to internal standard reserpine; intensities have been arbitrarily scaled to 100 units for m0 at m/z = 760.5860. (E) Mass distribution of PC 34:1 normalized to thetotal intensity as a function of time. The distribution at 0 h is indistinguishable from the expected natural abundance intensity. Line graphs are used here for clarity only; novalues are implied between data points. (F) Time courses of selected mass peaks. (j) m0, (h) m0 + 3, (d)R(m0 + 2n); (s)R(m0 + 3 + 2n). The m0 + 3 intensities were fitted to a(1 � exp(�kt)) with a = 0.11 ± 0.008 and k = 0.19 ± 0.04 h�1. Reproduced with permission from Ref. [124].
10 D.D. Marshall, R. Powers / Progress in Nuclear Magnetic Resonance Spectroscopy 100 (2017) 1–16
IMþi ¼ IMþi;NA—Px<i
x¼0IMþx � BCðx; iÞ1� BcsumðiÞ ;
BcsumðiÞ ¼XCMax
k¼nþ1
Bcðn; kÞ;
BCðn; kÞ ¼CMax � n
k� n
� �ð1� NA13C ÞCMax�kNAk�n
13C
where IMþi;NA is the expected intensity of the ith isotopologue peak,NA13C is the 13C natural abundance (1.1%), CMax is the total number
of carbons in the molecule, k is the total number of 13C carbons, n isthe number of 13C carbons incorporated from a labeling source, k-nis the number of natural abundant 13C carbons. Analysis of the 1D1H NMR spectra identified phosphatidylcholines with approxi-mately two double bonds as the major GPL present in the MCF7-LCC2 cell extracts (Fig. 6A–C). Based on the relative intensity ofthe assigned GPL NMR resonances, it was determined that the cho-line head groups were not 13C labeled, but the fatty acyl chains andthe glycerol moieties were predominately derived from [U-13C]-glucose. Specifically, the glycerol moiety was determined to be

D.D. Marshall, R. Powers / Progress in Nuclear Magnetic Resonance Spectroscopy 100 (2017) 1–16 11
44 ± 1.2% 13C, and the C2, C3 and C4 positions of the fatty acids weredetermined to have an average 13C incorporation of 46 ± 4%. Theseresults indicated that nearly 50% of GPL was newly synthesized in24 h. The FT-ICR-MS data (Fig. 6D–F) complemented the NMRresults by identifying the individual GPL species [i.e., PC (34:1)]and the abundance of the corresponding 13C isotopologues as afunction of time. Specifically, the m0 isotopologue decreased andthe m0 + 3, m0 + 2n + m0 + 3 + 2n isotopologues sequentiallyincreased as 13C-carbon from glucose was incorporated into PC(34:1). The odd number isotopologues were derived from 13C glyc-erol and unlabeled fatty acids, while conversely; even number iso-topologues resulted from unlabeled glycerol and 13C fatty acids.Interestingly, the abundance of the n = 10–20 fatty acid chainsincreased with time, but only a minimal mass shift was observed.A 12C acetate pool persisted for twenty-four hours from fatty acidturnover and internal triglyceride stores. In fact, only 30 to 50% ofthe 34 carbons were incorporated into PC (34:1) from 13C acetylCoA. Consistent with the NMR results, the mass spectral data indi-cates that 46% of glycerol and 44% of the fatty acyl moieties are 13C-labeled. Moreover, based on these measurements, isotopologue dis-tributions of GPLs over a twenty-four period were accurately mea-sured and simulated. Thus, the authors clearly demonstrate thevalue of combining NMR and MS to monitor the synthesis of variousGPLs from pools of metabolite. The combination of MS and NMRyielded positional isotope labeling information, 13C isotopologuedistributions, and enabled the accurate and efficient identificationof GPL species. SIRM using both NMR and MS greatly improvesthe analysis of metabolomic flux (i.e., metabolite synthesis andturnover).
3.4. Combined cheminformatics methods
The effective handling and analysis of large amounts of infor-mation (i.e., ‘‘Big data”) presents unique challenges [134–137].The field of metabolomics faces similar concerns, which make itdifficult to handle the large amounts of information with tradi-tional methods such as database management, basic statisticalmethods, or simple manual analysis [138]. Combined cheminfor-matic approaches present a valuable alternative to accelerate theaccurate processing of ‘‘omics” data sets. Since a considerableamount of data may be generated by combining NMR and MS,combined cheminformatics approaches are increasingly beingemployed during metabolomics studies. Recently, the SUMMITand NMR/MS translator methods were developed for the rapidand accurate identification of metabolites [28,29]. SUMMIT MS/NMR and the NMR/MS translator combine NMR and MS to eluci-date the structures of unknown metabolites from complex mix-tures. NMR/MS translator combines COLMAR [139] databasesearch queries and experimental NMR and MS spectral data toaccelerate accurate metabolite identification [28]. NMR/MS trans-lator uses 1D 1H NMR, or 2D 1H-13C HSQC and 2D 1H-13C HSQCTOCSY chemical shifts to perform a COLMAR database search andreturn a list of possible metabolite candidates. The query candidatelist is then used to produce a simulated mass spectrum for eachpossible metabolite, which includes possible adducts, fragments,and isotope distributions. These simulated mass spectra are thencompared against an experimental metabolomics mass spectrumto make metabolite assignments. In effect, potential metabolitesidentified by NMR are confirmed by MS. As a proof of concept,the NMR/MS translator was used to successfully analyze a modelmixture of 26 metabolites with 2D 1H-13C HSQC NMR spectraand DI-ESI-MS positive and negative mode spectra. The NMR/MStranslator was further validated using a set of human urine sam-ples from healthy volunteers. A total of 98 urine metabolites wereidentified by the NMR/MS translator, which included 8 metabolitesthat were not previously observed in a comprehensive study of
human urine. Importantly, only 48 of these metabolites were cor-rectly identified using MS data alone, including MS/MS fragmenta-tion patterns. The NMR/MS translator approach automates themetabolite assignment and avoids labor-intensive manual analy-sis, which enhances coverage, improves consistency, and increasesthroughput.
SUMMIT MS/NMR is an alternative high throughput approachthat combines MS with NMR data to identify unknownmetabolitesin a complex biological sample (Fig. 7) [29]. The SUMMIT MS/NMRapproach relies on the acquisition of a high-resolution mass spec-trum, in which each m/z peak is converted into a molecular for-mula. The list of molecular formulas is then used to generate aset of all feasible structures (e.g., a structural manifold) with theChemSpider database [140], which are used to predict an NMRspectrum using MestReNova 9.0.1 (Mestrelab Research, Santiagode Compostela, Spain). The COLMAR algorithm [139] is then usedto compare the experimental NMR data against the database ofpredicted NMR spectra. Importantly, the experimental 2D 1H–13CHSQC NMR spectrum is deconvoluted into subspectra correspond-ing to the individual components of the mixture using connectivityinformation derived from 2D 1H–1H TOCSY, 2D 1H–13C HSQC-TOCSY, and 2D 1H–13C HMBC spectra. The potential metabolitesare rank-ordered based on the relative agreement betweenthe experimental NMR subspectrum and the simulated NMRspectra.
SUMMIT MS/NMR was validated using a DI-ESI-MS spectrum ofa model mixture containing 10 metabolites [29]. The 50 largestm/zpeaks were selected, which yielded 22 molecular formulas, 362potential structures, and 4772 predicted 2D 1H–13C HSQC NMRspectra. SUMMIT MS/NMR ranked 6 of the 10 metabolites as thetop hit and three other metabolites were identified as thesecond-best hit. The remaining metabolite did not ionize. For thethree metabolites identified as second best, the top hits were struc-turally very similar (i.e., allo-isoleucine instead of leucine). Theapproach was repeated using an MS spectrum of a polar extractof an E. coli lysate. The 500 largest m/z peaks were selected corre-sponding to 56 molecular formulas and 13,872 structures and1H–13C HSQC spectra. A total of 21 metabolites were accuratelyand rapidly identify by SUMMIT MS/NMR, and then confirmedusing a set of 2D 1H-13C NMR experiments. Thus, both SUMMITMS/NMR and NMR/MS translator clearly illustrate the inherentvalue of combining NMR and MS to enhance metabolomics.
3.5. Multivariate statistical methods
A well-known problem with metabolomics data is the presenceof confounding factors that may complicate the identification ofgroup membership. For example, the analysis of urine or serumto identify biomarkers may be masked by metabolites associatedwith age, diet, ethnicity, gender, or race, among other factors. Mul-tivariate statistical methods are able to cope with these multipara-metric data sets and extract group membership [141]. For adetailed and comprehensive review of multivariate statistics andits application for metabolomics see Worley et al. [12]. Chemomet-ric techniques can be divided into supervised or unsupervisedmethods. In metabolomics, unsupervised methods are commonlyused to identify global trends or group membership. Alternatively,supervised methods are highly valuable for identifying the spectralfeatures (or metabolites) that primarily contribute to the differen-tiation between groups. PCA, PLS, and OPLS are the chemometricmethods commonly used in metabolomics based on a single analyt-ical source. The limited availability of chemometric methods appli-cable to multiple analytical sources is one reason NMR and MShave not been commonly combined for metabolomics.
Nevertheless, multivariate statistical techniques have been pre-viously applied for the combined analysis of MS and NMR data sets.

Fig. 7. Schematic representation of the SUMMIT MS/NMR strategy for the identification of metabolites in complex metabolomic mixtures by the combined use of massspectrometry and 1D 1H NMR spectroscopy. High-resolution MS yields the unique molecular formulas of the metabolites present in the mixture (left). For each molecularformula, all possible structures are generated, representing the total structural manifold depicted as the sum of the three local manifolds (green, red, blue; middle), eachbelonging to a different mass. Next, NMR chemical shifts are predicted for all manifold structures. Comparison of the predicted with the experimental NMR chemical shifts(right) allows identification of the structures that are present in the mixture, requiring neither an NMR nor an MSmetabolomics database [28,29,58]. (For interpretation of thereferences to color in this figure legend, the reader is referred to the web version of this article.) Reproduced with permission from Ref. [29].
12 D.D. Marshall, R. Powers / Progress in Nuclear Magnetic Resonance Spectroscopy 100 (2017) 1–16
Chen et al. generated individual PCA models for NMR and MS datasets and then combined the scores from each analysis into a threedimensional (3D) scores plot. The combined scores yielded agreater between-class separation than the original NMR or MSscores alone. Unfortunately, such an analysis ignores the highlyinformative correlations that exist between the two data sets. Guet al. replaced the binary class designation of an MS data set withthe first principal component (PC1) from a PCA model generatedfrom NMR data to produce a subsequent OPLS-DA model for theMS data [70]. Again, a greater class separation was observed whenthe MS OPLS-DA model was generated with the NMR PC1 com-pared to the binary classification [57]. Nevertheless, such an anal-ysis carries no statistical guarantee of success for any data set.
Recently, it was shown that a chemometrics model generatedby integrating NMR and MS metabolomics data provided bettergroup separation and a greater level of model interpretability thanwith NMR or MS data sets alone [57]. Marshall et al. combined 1D1H NMR and DI-ESI-MS. Multiblock methods are similar to tradi-tional PLS and PCA, but provide a means for analyzing data frommultiple analytical sources [142–144]. The spectral observationsfrom each analytical method are placed into separate ‘‘blocks,”
which allows for the generation and simultaneous usage ofwithin-block and between-block data correlations. Since the blocksshare common trends, a model based on the between-block corre-lations will provide a better agreement with the biological groups.In effect, better discrimination between groups is expected bycombining NMR and MS data than would be achieved from onlythe individual data sets. DI-ESI-MS and 1D 1H NMR spectra werecollected on cell lysates obtained from human dopaminergicneuroblastoma cells (SK-N-SH) treated with different neurotoxins:rotenone, 6-hydroxydopamine (6-OHDA), 1-methyl-4-phenylpyridinium (MPP+), or paraquat. The PCA model producedfrom the 1D 1H NMR data set yielded only two groups correspond-ing to the untreated controls and cells treated with the differentneurotoxins. In effect, NMR detected no difference in the metabo-lome of neuronal cells after treatment with the different neurotox-ins. The PCA model generated from the MS data set produced amodest separation between four groups. The untreated controls,MPP+, and paraquat treatment each formed a separate group. Boththe rotenone and 6-OHDA cell treatment were clustered togetherand formed the fourth group (Fig. 8). The MB-PCA and MB-PLSmodels generated from both the DI-ESI-MS and 1D 1H NMR data

Fig. 8. Scores generated from (A) PCA of 1H NMR, (B) PCA of DI-ESI-MS, and (C) MB-PCA of 1H NMR and DI-ESI-MS. Separations between classes are greatly increased uponcombination of the two data sets via MB-PCA. Symbols designate the following classes: Control ( ), Rotenone ( ), 6-OHDA ( ), MPP+ ( ), and Paraquat ( ). Correspondingdendrograms are shown in (D–F). The statistical significance of each node in the dendrogram is indicated by a p value. Reproduced with permission from Ref. [57].
D.D. Marshall, R. Powers / Progress in Nuclear Magnetic Resonance Spectroscopy 100 (2017) 1–16 13
sets yielded five distinct groups corresponding to each neurotoxintreatment and the untreated controls. This clearly demonstratedthat each neurotoxin induced dopaminergic neuronal cell deaththrough a distinct molecular mechanism. A detailed analysis ofthe metabolic impact of paraquat revealed that paraquat ‘‘hijacks”
the pentose phosphate pathway (PPP) to increase NADPH-reducingequivalents and stimulate paraquat redox cycling, oxidative stress,and cell death [57,71]. Thus, a successful outcome for a metabolo-mics study was critically dependent on combining NMR and MSdata.

14 D.D. Marshall, R. Powers / Progress in Nuclear Magnetic Resonance Spectroscopy 100 (2017) 1–16
4. Conclusion
Metabolomics is an invaluable tool of systems biology and hasmade significant contributions to several diverse fields, includingdrug discovery, disease diagnosis, nutrition, environmental studies,and personalized medicine. To date, the majority of metabolomicsdata sets have been acquired using either MS or NMR separately.However, it is well known that combining MS and NMR datagreatly improves the coverage of the metabolome and enhancesthe accuracy of metabolite identification. Consequently, combiningNMR and MS techniques for metabolomics is a growing trend thatwill greatly benefit the quality and accuracy of metabolomics data.Herein we have reviewed several methodologies for integratingNMR and MS for the analysis of metabolomics samples. As demon-strated throughout this review, combining NMR and MS greatlyenhances and improves the outcomes of metabolomics studies.
Acknowledgements
We would like to thank Dr. Eric D. Dodds, Dr. Rodrigo Franco,Dr. Aracely Garcia-Garcia, Dr. Yuting Huang, Dr. Shulei Lei, andDr. Bradley Worley for their contributions to the metabolic studiespresented in this manuscript. This manuscript was supported inpart by funds from the National Institute of Health (R01AI087668, R21 AI087561, R01 CA163649, P20 RR-17675, P30GM103335), the University of Nebraska, the Nebraska Tobacco Set-tlement Biomedical Research Development Fund, and the NebraskaResearch Council. The research was performed in facilities reno-vated with support from the National Institutes of Health(RR015468-01).
References
[1] S. Wachtel-Galor, I.F.F. Benzie, Herbal Medicine: An Introduction to ItsHistory, Usage, Regulation, Current Trends, and Research Needs, 2011.
[2] S.G. Oliver, M.K. Winson, D.B. Kell, F. Baganz, Systematic functional analysis ofthe yeast genome, Trends Biotechnol. 16 (1998) 373–378.
[3] J.K. Nicholson, J.C. Lindon, E. Holmes, ’Metabonomics’: understanding themetabolic responses of living systems to pathophysiological stimuli viamultivariate statistical analysis of biological NMR spectroscopic data,Xenobiotica 29 (1999) 1181–1189.
[4] O. Fiehn, Combining genomics, metabolome analysis, and biochemicalmodelling to understand metabolic networks, Comp. Funct. Genom. 2(2001) 155–168.
[5] W.B. Dunn, N.J. Bailey, H.E. Johnson, Measuring the metabolome: currentanalytical technologies, Analyst 130 (2005) 606–625.
[6] L.R. Bijland, M.K. Bomers, Y.M. Smulders, Smelling the diagnosis A review onthe use of scent in diagnosing disease, J. Med. 71 (2013).
[7] J.L. Wolfender, G. Marti, A. Thomas, S. Bertrand, Current approaches andchallenges for the metabolite profiling of complex natural extracts, J.Chromatogr. A 1382 (2015) 136–164.
[8] K. Bingol, R. Brüschweiler, Multidimensional approaches to NMR-basedmetabolomics, Anal. Chem. 86 (2014) 47–57.
[9] V.A. Likic, M.J. McConville, T. Lithgow, A. Bacic, Systems biology: the nextfrontier for bioinformatics, Adv. Bioinform. (2010) 268925.
[10] D.S. Wishart, Current progress in computational metabolomics, Brief. Bioinf. 8(2007) 279–293.
[11] K. Dettmer, P.A. Aronov, B.D. Hammock, Mass spectrometry-basedmetabolomics, Mass Spectrom. Rev. 26 (2007) 51–78.
[12] B. Worley, R. Powers, Multivariate Analysis in Metabolomics, Curr.Metabolom. 1 (2013) 92–107.
[13] T. Gebregiworgis, R. Powers, Application of NMR metabolomics to search forhuman disease biomarkers, Comb. Chem. High Throughput Screen 15 (2012)595–610.
[14] O. Fiehn, Metabolomics - the link between genotypes and phenotypes, PlantMol. Biol. 48 (2002) 155–171.
[15] G. Astarita, J. Langridge, An emerging role for metabolomics in nutritionscience, J. Nutrigenet. Nutrigenom. 6 (2013) 181–200.
[16] D.P. Jones, Sequencing the exposome: a call to action, Toxicol. Rep. 3 (2016)29–45.
[17] S.J. Kim, S.H. Kim, J.H. Kim, H.J. Yoo, S. Hwang, Understanding metabolomicsin biomedical research, Endocrinol. Metab. (Seoul) 31 (2016) 7–16.
[18] R.D. Beger, W. Dunn, M.A. Schmidt, S.S. Gross, J.A. Kirwan, M. Cascante, L.Brennan, D.S. Wishart, M. Oresic, T. Hankemeier, D.I. Broadhurst, A.N. Lane, K.Suhre, G. Kastenmuller, S.J. Sumner, I. Thiele, O. Fiehn, R. Kaddurah-Daouk,
Metabolomics enables precision medicine: ‘‘A White Paper, CommunityPerspective”, Metabolomics 12 (2016) 1–15.
[19] G.A.N. Gowda, D. Raftery, Can NMR solve some significant challenges inmetabolomics?, J Magn. Reson. 260 (2015) 144–160.
[20] G.A.N. Gowda, D. Raftery, Biomarker discovery and translation inmetabolomics, Curr. Metabolom. 1 (2013) 227–240.
[21] J.C. Lindon, J.K. Nicholson, The emergent role of metabolic phenotyping indynamic patient stratification, Expert Opin. Drug Metab. Toxicol. 10 (2014)915–919.
[22] E.P. Rhee, R.E. Gerszten, Metabolomics and cardiovascular biomarkerdiscovery, Clin. Chem. 58 (2012) 139–147.
[23] J.L. Markley, R. Bruschweiler, A.S. Edison, H.R. Eghbalnia, R. Powers, D. Raftery,D.S. Wishart, The future of NMR-based metabolomics, Curr. Opin. Biotechnol.43 (2017) 34–40.
[24] T. Hirschfeld, The hy-phen-ated methods, Anal. Chem. 52 (1980) 297A–312A.[25] A. Zhang, H. Sun, P. Wang, Y. Han, X. Wang, Modern analytical techniques in
metabolomics analysis, Analyst (Cambridge, UK) 137 (2012) 293–300.[26] G.A. Barding, S. Beni, T. Fukao, J. Bailey-Serres, C.K. Larive, Comparison of GC-
MS and NMR for metabolite profiling of rice subjected to submergence stress,J. Proteome Res. 12 (2013) 898–909.
[27] H. Dai, C. Xiao, H. Liu, F. Hao, H. Tang, Combined NMR and LC-DAD-MSanalysis reveals comprehensive metabonomic variations for three phenotypiccultivars of salvia miltiorrhiza bunge, J. Proteome Res. 9 (2010) 1565–1578.
[28] K. Bingol, R. Brüschweiler, NMR/MS translator for the enhanced simultaneousanalysis of metabolomics mixtures by NMR spectroscopy and mass spectrometry:application to human urine, J. Proteome Res. 14 (2015) 2642–2648.
[29] K. Bingol, L. Bruschweiler-Li, C. Yu, A. Somogyi, F. Zhang, R. Brüschweiler,Metabolomics beyond spectroscopic databases: a combined MS/NMRstrategy for the rapid identification of new metabolites in complexmixtures, Anal. Chem. 87 (2015) 3864–3870.
[30] F. Tayyari, G.A. Gowda, H. Gu, D. Raftery, 15N-cholamine–a smart isotope tagfor combining NMR- and MS-based metabolite profiling, Anal. Chem. 85(2013) 8715–8721.
[31] J.M. Baker, J.L. Ward, M.H. Beale, Combined NMR and flow injection ESI-MSfor Brassicaceae metabolomics, Meth. Mol. Biol. 860 (2012) 177–191.
[32] J. Prichystal, K.A. Schug, K. Lemr, J. Novak, V. Havlicek, Structural analysis ofnatural products, Anal. Chem. 88 (2016) 10338–10346.
[33] Z. Yang, Online hyphenated liquid chromatography-nuclear magneticresonance spectroscopy-mass spectrometry for drug metabolite and natureproduct analysis, J. Pharm. Biomed. Anal. 40 (2006) 516–527.
[34] Z. Pan, D. Raftery, Comparing and combining NMR spectroscopy and massspectrometry in metabolomics, Anal. Bioanal. Chem. 387 (2007) 525–527.
[35] R. t’Kindt, R.A. Scheltema, A. Jankevics, K. Brunker, S. Rijal, J.C. Dujardin, R.Breitling, D.G. Watson, G.H. Coombs, S. Decuypere, Metabolomics to unveiland understand phenotypic diversity between pathogen populations, PLoSNegl. Trop. Dis. 4 (2010) e904.
[36] S. Halouska, B. Zhang, R. Gaupp, S. Lei, E. Snell, R.J. Fenton, R.G. Barletta, G.A.Somerville, R. Powers, Revisiting protocols for the NMR analysis of bacterialmetabolomes, J. Integ. OMICS 2 (2013) 120–137.
[37] J.C. Copeland, L.J. Zehr, R.L. Cerny, R. Powers, The applicability of moleculardescriptors for designing an electrospray ionization mass spectrometrycompatible library for drug discovery, Comb. Chem. High Through. Screen.15 (2012) 806–815.
[38] F.J. Moy, K. Haraki, D. Mobilio, G. Walker, K. Tabei, H. Tong, M.M. Siegel, R.Powers, MS/NMR: a structure-based approach for discovering protein ligandsand for drug design by coupling size exclusion chromatography, massspectrometry, and nuclear magnetic resonance spectroscopy, Anal. Chem. 73(2001) 571–581.
[39] J.-P. Antignac, K. de Wasch, F. Monteau, H. De Brabander, F. Andre, B. Le Bizec,The ion suppression phenomenon in liquid chromatography-massspectrometry and its consequences in the field of residue analysis, Anal.Chim. Acta 529 (2005) 129–136.
[40] T.O. Metz, J.S. Page, E.S. Baker, K. Tang, J. Ding, Y. Shen, R.D. Smith, High-resolution separations and improved ion production and transmission inmetabolomics, TrAC, Trends Anal. Chem. 27 (2008) 205–214.
[41] D.J. Crockford, E. Holmes, J.C. Lindon, R.S. Plumb, S. Zirah, S.J. Bruce, P.Rainville, C.L. Stumpf, J.K. Nicholson, Statistical Heterospectroscopy, an approachto the integrated analysis of NMR and UPLC-MS data sets: application inmetabonomic toxicology studies, Anal. Chem. 78 (2006) 363–371.
[42] N.L. Kuehnbaum, P. Britz-McKibbin, New advances in separation science formetabolomics: resolving chemical diversity in a post-genomic era, Chem.Rev. 113 (2013) 2437–2468.
[43] D.B. Kell, Metabolomics and systems biology: making sense of the soup, Curr.Opin. Microbiol. 7 (2004) 296–307.
[44] A.B. Canelas, A. ten Pierick, C. Ras, R.M. Seifar, J.C. van Dam, W.M. van Gulik, J.J. Heijnen, Quantitative evaluation of intracellular metabolite extractiontechniques for yeast metabolomics, Anal. Chem. 81 (2009) 7379–7389.
[45] H. Kanani, P.K. Chrysanthopoulos, M.I. Klapa, Standardizing GC-MSmetabolomics, J. Chromatogr. B: Anal. Technol. Biomed., Life Sci. 871 (2008)191–201.
[46] F. Xu, L. Zou, C.N. Ong, Multiorigination of chromatographic peaks inderivatized GC/MS metabolomics: a confounder that influences metabolicpathway interpretation, J. Proteome Res. 8 (2009) 5657–5665.
[47] P.J. Taylor, Matrix effects: the Achilles heel of quantitative high-performanceliquid chromatography-electrospray-tandem mass spectrometry, Clin.Biochem. 38 (2005) 328–334.

D.D. Marshall, R. Powers / Progress in Nuclear Magnetic Resonance Spectroscopy 100 (2017) 1–16 15
[48] J. Kopka, Current challenges and developments in GC-MS based metaboliteprofiling technology, J. Biotechnol. 124 (2006) 312–322.
[49] D. Marion, P.C. Driscoll, L.E. Kay, P.T. Wingfield, A. Bax, A.M. Gronenborn, G.M.Clore, Overcoming the overlap problem in the assignment of 1H NMR spectraof larger proteins by use of three-dimensional heteronuclear 1H–15NHartmann-Hahn-multiple quantum coherence and nuclear Overhauser-multiple quantum coherence spectroscopy: application to interleukin 1beta, Biochemistry 28 (1989) 6150–6156.
[50] E.A. Mahrous, M.A. Farag, Two dimensional NMR spectroscopic approachesfor exploring plant metabolome: a review, J. Adv. Res. 6 (2015) 3–15.
[51] K. Bingol, L. Brüschweilerr-Li, D. Li, B. Zhang, M. Xie, R. Brüschweiler,Emerging new strategies for successful metabolite identification inmetabolomics, Bioanalysis 8 (2016) 557–573.
[52] Z. Lei, D.V. Huhman, L.W. Sumner, Mass spectrometry strategies inmetabolomics, J. Biol. Chem. 286 (2011) 25435–25442.
[53] Y. Iwasaki, T. Sawada, K. Hatayama, A. Ohyagi, Y. Tsukuda, K. Namekawa, R.Ito, K. Saito, H. Nakazawa, Separation technique for the determination of highlypolar metabolites in biological samples, Metabolites 2 (2012) 496–515.
[54] N.B. Cech, C.G. Enke, Practical implications of some recent studies inelectrospray ionization fundamentals, Mass Spectrom. Rev. 20 (2001) 362–387.
[55] F. Tugizimana, P.A. Steenkamp, L.A. Piater, I.A. Dubery, Multi-platformmetabolomic analyses of ergosterol-induced dynamic changes in Nicotianatabacum cells, PLoS One 9 (2014) e87846.
[56] Y.S. Ling, H.J. Liang, M.H. Chung, M.H. Lin, C.Y. Lin, NMR- and MS-basedmetabolomics: various organ responses following naphthalene intervention,Mol. Biosyst. 10 (2014) 1918–1931.
[57] D.D. Marshall, S. Lei, B. Worley, Y. Huang, A. Garcia-Garcia, R. Franco, E.D.Dodds, R. Powers, Combining DI-ESI-MS and NMR datasets for metabolicprofiling, Metabolomics 11 (2015) 391–402.
[58] K. Bingol, R. Brüschweiler, Two elephants in the room, Curr. Opin. Clin. Nut.Metab. Care 18 (2015) 471–477.
[59] Y. Lin, S. Schiavo, J. Orjala, P. Vouros, R. Kautz, Microscale LC-MS-NMRplatform applied to the identification of active cyanobacterial metabolites,Anal. Chem. 80 (2008) 8045–8054.
[60] O. Corcoran, M. Spraul, LC–NMR–MS in drug discovery, Drug Discov. Today 8(2003) 624–631.
[61] C.H. Johnson, J. Ivanisevic, G. Siuzdak, Metabolomics: beyond biomarkers andtowards mechanisms, Nat. Rev. Mol. Cell Biol. 17 (2016) 451–459.
[62] S.S. Bird, D.P. Sheldon, R.M. Gathungu, P. Vouros, R. Kautz, W.R. Matson, B.S.Kristal, Structural characterization of plasma metabolites detected via LC-electrochemical coulometric array using LC-UV fractionation, MS, and NMR,Anal. Chem. 84 (2012) 9889–9898.
[63] A. Alonso, S. Marsal, A. Julia, Analytical methods in untargeted metabolomics:state of the art in 2015, Front. Bioeng. Biotechnol. 3 (2015) 23.
[64] W.B. Dunn, D.I. Ellis, Metabolomics: current analytical platforms andmethodologies, TrAC Trends Anal. Chem. 24 (2005) 285–294.
[65] B. Worley, R. Powers, PCA as a predictor of OPLS-DA model reliability, Curr.Metabolom. 4 (2016) 97–103.
[66] R.G. Brereton, A short history of chemometrics: a personal view, J. Chemom.28 (2014) 749–760.
[67] B. Worley, R. Powers, MVAPACK: a complete data handling package for NMRmetabolomics, ACS Chem. Biol. 9 (2014) 1138–1144.
[68] B. Worley, R. Powers, A sequential algorithm for multiblock orthogonalprojections to latent structures, Chemometr. Intell. Lab. Syst. 149 (2015) 33–39.
[69] H. Chen, Z. Pan, N. Talaty, D. Raftery, R.G. Cooks, Combining desorptionelectrospray ionization mass spectrometry and nuclear magnetic resonancefor differential metabolomics without sample preparation, Rapid Commun.Mass Spectrom. 20 (2006) 1577–1584.
[70] H. Gu, Z. Pan, B. Xi, V. Asiago, B. Musselman, D. Raftery, Principal componentdirected partial least squares analysis for combining nuclear magneticresonance and mass spectrometry data in metabolomics: application to thedetection of breast cancer, Anal. Chim. Acta 686 (2011) 57–63.
[71] S. Lei, L. Zavala-Flores, A. Garcia-Garcia, R. Nandakumar, Y. Huang, N.Madayiputhiya, R.C. Stanton, E.D. Dodds, R. Powers, R. Franco, Alterations inenergy/redox metabolism induced by mitochondrial and environmentaltoxins: a specific role for glucose-6-phosphate-dehydrogenase and thepentose phosphate pathway in paraquat toxicity, ACS Chem. Biol. 9 (2014)2032–2048.
[72] A. Anandhan, S. Lei, R. Levytskyy, A. Pappa, M.I. Panayiotidis, R.L. Cerny, O.Kalimonchuk, R. Powers, R. Franco, Glucose Metabolism and AMPK signalingregulate dopaminergic cell death induced by gene (a-synuclein)-environment (paraquat) interactions, Mol. Neurobiol. (2016), http://dx.doi.org/10.1007/s12035-016-9906-2.
[73] R. Powers, NMR metabolomics and drug discovery, Magn. Reson. Chem. 47(2009) S2–S11.
[74] M.E. Bollard, E.G. Stanley, J.C. Lindon, J.K. Nicholson, E. Holmes, NMR-basedmetabonomic approaches for evaluating physiological influences on biofluidcomposition, NMR Biomed. 18 (2005) 143–162.
[75] W.B. Dunn, D.I. Broadhurst, H.J. Atherton, R. Goodacre, J.L. Griffin, Systemslevel studies of mammalian metabolomes: the roles of mass spectrometryand nuclear magnetic resonance spectroscopy, Chem. Soc. Rev. 40 (2011)387–426.
[76] J.K. Nicholson, J.C. Lindon, E. Holmes, ‘‘Metabonomics”: understanding themetabolic responses of living systems to pathophysiological stimuli via
multivariate statistical analysis of biological NMR spectroscopic data,Xenobiotica 29 (1999) 1181–1189.
[77] D.S. Wishart, Quantitative metabolomics using NMR, TrAC, Trends Anal.Chem. 27 (2008) 228–237.
[78] K. Chughtai, R.M.A. Heeren, Mass spectrometric imaging for biomedical tissueanalysis, Chem. Rev. 110 (2010) 3237–3277.
[79] M. Katajamaa, M. Oresic, Data processing for mass spectrometry-basedmetabolomics, J. Chromatogr. A 1158 (2007) 318–328.
[80] S.G. Villas-Boas, S. Mas, M. Aakesson, J. Smedsgaard, J. Nielsen, Massspectrometry in metabolome analysis, Mass Spectrom. Rev. 24 (2005) 613–646.
[81] A.C. Dona, B. Jimenez, H. Schafer, E. Humpfer, M. Spraul, M.R. Lewis, J.T.M.Pearce, E. Holmes, J.C. Lindon, J.K. Nicholson, Precision high-throughputproton nmr spectroscopy of human urine, serum, and plasma for large-scalemetabolic phenotyping, Anal. Chem. 86 (2014) 9887–9894.
[82] A.-H. Emwas, C. Luchinat, P. Turano, L. Tenori, R. Roy, R.M. Salek, D. Ryan, J.S.Merzaban, R. Kaddurah-Daouk, A.C. Zeri, G.A. Nagana Gowda, D. Raftery, Y.Wang, L. Brennan, D.S. Wishart, Standardizing the experimental conditionsfor using urine in NMR-based metabolomic studies with a particular focus ondiagnostic studies: a review, Metabolomics 11 (2015) 872–894.
[83] D. Troyer, Biorepository standards and protocols for collecting, processing,and storing human tissues, Meth. Mol. Biol. (Totowa, NJ, US) 441 (2008) 193–220.
[84] S.G. Villas-Boas, J. Hoejer-Pedersen, M. Aakesson, J. Smedsgaard, J. Nielsen,Global metabolite analysis of yeast: evaluation of sample preparationmethods, Yeast 22 (2005) 1155–1169.
[85] W.B. Dunn, D. Broadhurst, P. Begley, E. Zelena, S. Francis-McIntyre, N.Anderson, M. Brown, J.D. Knowles, A. Halsall, J.N. Haselden, A.W. Nicholls, I.D.Wilson, D.B. Kell, R. Goodacre, Procedures for large-scale metabolic profilingof serum and plasma using gas chromatography and liquid chromatographycoupled to mass spectrometry, Nat. Protoc. 6 (2011) 1060–1083.
[86] A.-H. Zhang, H. Sun, S. Qiu, X.-J. Wang, NMR-based metabolomics coupledwith pattern recognition methods in biomarker discovery and diseasediagnosis, Magn. Reson. Chem. 51 (2013) 549–556.
[87] J.A. Westerhuis, H.C.J. Hoefsloot, S. Smit, D.J. Vis, A.K. Smilde, E.J.J. van Velzen,J.P.M. van Duijnhoven, F.A. van Dorsten, Assessment of PLSDA crossvalidation, Metabolomics 4 (2008) 81–89.
[88] K. Kjeldahl, R. Bro, Some common misunderstandings in chemometrics, J.Chemom. 24 (2010) 558–564.
[89] L. Eriksson, J. Trygg, S. Wold, CV-ANOVA for significance testing of PLS andOPLS models, J. Chemom. 22 (2008) 594–600.
[90] T.A. Lasko, J.G. Bhagwat, K.H. Zou, L. Ohno-Machado, The use of receiveroperating characteristic curves in biomedical informatics, J. Biomed. Inf. 38(2005) 404–415.
[91] J. Xia, D.S. Wishart, MetPA: a web-based metabolomics tool for pathwayanalysis and visualization, Bioinformatics 26 (2010) 2342–2344.
[92] J.J. Heijnen, Impact of thermodynamic principles in systems biology, Adv.Biochem. Eng./Biotechnol. 121 (2010) 139–162.
[93] S. Arrivault, M. Guenther, A. Ivakov, R. Feil, D. Vosloh, J.T. van Dongen, R.Sulpice, M. Stitt, Use of reverse-phase liquid chromatography, linked totandem mass spectrometry, to profile the Calvin cycle and other metabolicintermediates in Arabidopsis rosettes at different carbon dioxideconcentrations, Plant J. 59 (2009) 826–839.
[94] M. Breier, S. Wahl, C. Prehn, M. Fugmann, U. Ferrari, M. Weise, F. Banning, J.Seissler, H. Grallert, J. Adamski, A. Lechner, Targeted metabolomics identifiesreliable and stable metabolites in human serum and plasma samples, PLoSOne 9 (2014), e89728/89721-e89728/89711, 89711 pp.
[95] R.A. van den Berg, H.C.J. Hoefsloot, J.A. Westerhuis, A.K. Smilde, M.J. van derWerf, Centering, scaling, and transformations: improving the biologicalinformation content of metabolomics data, BMC Genom. 7 (2006) 142.
[96] A. Craig, O. Cloarec, E. Holmes, J.K. Nicholson, J.C. Lindon, Scaling andnormalization effects in NMR spectroscopic metabonomic data sets, Anal.Chem. 78 (2006) 2262–2267.
[97] T.N. Vu, K. Laukens, Getting your peaks in line: a review of alignmentmethods for NMR spectral data, Metabolites 3 (2013) 259–276.
[98] C.L. Andrews, C.P. Yu, E. Yang, P. Vouros, Improved liquid chromatography-mass spectrometry performance in quantitative analysis using a nanosplitterinterface, J. Chromatogr. A 1053 (2004) 151–159.
[99] A.H. Emwas, R. Roy, R.T. McKay, D. Ryan, L. Brennan, L. Tenori, C. Luchinat, X.Gao, A.C. Zeri, G.A. Gowda, D. Raftery, C. Steinbeck, R.M. Salek, D.S. Wishart,Recommendations and standardization of biomarker quantification usingNMR-based metabolomics with particular focus on urinary analysis, J.Proteome Res. 15 (2016) 360–373.
[100] E. Appiah-Amponsah, K. Owusu-Sarfo, G.A. Gowda, T. Ye, D. Raftery,Combining hydrophilic interaction chromatography (HILIC) and isotopetagging for off-line LC-NMR applications in metabolite analysis, Metabolites3 (2013) 575–591.
[101] A. Beltran, M. Suarez, M.A. Rodríguez, M. Vinaixa, S. Samino, L. Arola, X.Correig, O. Yanes, Assessment of compatibility between extraction methods forNMR- and LC/MS-based metabolomics, Anal. Chem. 84 (2012) 5838–5844.
[102] A.L. Harvey, R. Edrada-Ebel, R.J. Quinn, The re-emergence of natural productsfor drug discovery in the genomics era, Nat. Rev. Drug Discovery 14 (2015)111–129.
[103] B. David, J.-L. Wolfender, D.A. Dias, The pharmaceutical industry and naturalproducts: historical status and new trends, Phytochem. Rev. 14 (2014) 299–315.

16 D.D. Marshall, R. Powers / Progress in Nuclear Magnetic Resonance Spectroscopy 100 (2017) 1–16
[104] J.J. Kellogg, D.A. Todd, J.M. Egan, H.A. Raja, N.H. Oberlies, O.M. Kvalheim, N.B.Cech, Biochemometrics for natural products research: comparison of dataanalysis approaches and application to identification of bioactivecompounds, J. Nat. Prod. 79 (2016) 376–386.
[105] F. Bucar, A. Wube, M. Schmid, Natural product isolation–how to get frombiological material to pure compounds, Nat. Prod. Rep. 30 (2013) 525–545.
[106] A. Krunic, J. Orjala, Application of high-field NMR spectroscopy forcharacterization and quantitation of submilligram quantities of isolatednatural products, Magn. Reson. Chem. 53 (2015) 1043–1050.
[107] T.F. Molinski, Nanomole-scale natural products discovery, Curr. Opin. DrugDisc. Dev. 12 (2009) 197–206.
[108] D.L. Olson, J.A. Norcross, M. O’Neil-Johnson, P.F. Molitor, D.J. Detlefsen, A.G.Wilson, T.L. Peck, Microflow NMR: concepts and capabilities, Anal. Chem. 76(2004) 2966–2974.
[109] K.C. Nicolaou, S.A. Snyder, Chasing molecules that were never there:misassigned natural products and the role of chemical synthesis in modernstructure elucidation, Angew. Chem., Int. Ed. 44 (2005) 1012–1044.
[110] K. Biemann, High-resolution mass spectrometry of natural products, PureAppl. Chem. 9 (1964) 95–118.
[111] K.-W. Cheng, C.-C. Wong, M. Wang, Q.-Y. He, F. Chen, Identification andcharacterization of molecular targets of natural products by massspectrometry, Mass Spectrom. Rev. 29 (2010) 126–155.
[112] R.G. Cooks, D.R. Ifa, G. Sharma, F.K. Tadjimukhamedov, Z. Ouyang,Perspectives and retrospectives in mass spectrometry: one view, Eur. J.Mass Spectrom. 16 (2010) 283–300.
[113] K. Biemann, Structure determination of natural products by massspectrometry, Annu. Rev. Anal. Chem. 8 (2015) 1–19.
[114] S.P. Gaudencio, F. Pereira, Dereplication: racing to speed up the naturalproducts discovery process, Nat. Prod. Rep. 32 (2015) 779–810.
[115] I.F. Duarte, M. Godejohann, U. Braumann, M. Spraul, A.M. Gil, Application ofNMR spectroscopy and LC-NMR/MS to the identification of carbohydrates inbeer, J. Agric. Food Chem. 51 (2003) 4847–4852.
[116] J.P. Shockcor, S.E. Unger, P. Savina, J.K. Nicholson, J.C. Lindon, Application ofdirectly coupled LC-NMR-MS to the structural elucidation of metabolites ofthe HIV-1 reverse-transcriptase inhibitor BW935U83, J. Chromatogr. BBiomed. Sci. Appl. 748 (2000) 269–279.
[117] M. Spraul, A.S. Freund, R.E. Nast, R.S. Withers, W.E. Maas, O. Corcoran,Advancing NMR sensitivity for LC-NMR-MS using a cryoflow probe:application to the analysis of acetaminophen metabolites in urine, Anal.Chem. 75 (2003) 1536–1541.
[118] Y. Iwasaki, Y. Nakano, K. Mochizuki, M. Nomoto, Y. Takahashi, R. Ito, K. Saito,H. Nakazawa, A new strategy for ionization enhancement by derivatizationfor mass spectrometry, J. Chromatogr. B: Anal. Technol. Biomed., Life Sci. 879(2011) 1159–1165.
[119] T. Santa, Derivatization reagents in liquid chromatography/electrosprayionization tandem mass spectrometry, Biomed. Chromatogr. 25 (2011) 1–10.
[120] J.M. Halket, D. Waterman, A.M. Przyborowska, R.K.P. Patel, P.D. Fraser, P.M.Bramley, Chemical derivatization and mass spectral libraries in metabolicprofiling by GC/MS and LC/MS/MS, J. Exp. Bot. 56 (2005) 219–243.
[121] J.M. Halket, V.G. Zaikin, Derivatization in mass spectrometry-1. Silylation,Eur. J. Mass Spectrom. 9 (2003) 1–21.
[122] M. Brattoli, E. Cisternino, P.R. Dambruoso, G. de Gennaro, P. Giungato, A.Mazzone, J. Palmisani, M. Tutino, Gas chromatography analysis with olfactometricdetection (GC-O) as a useful methodology for chemical characterization ofodorous compounds, Sensors (Basel) 13 (2013) 16759–16800.
[123] G.A. Gowda, F. Tayyari, T. Ye, Y. Suryani, S. Wei, N. Shanaiah, D. Raftery,Quantitative analysis of blood plasma metabolites using isotope enhancedNMR methods, Anal. Chem. 82 (2010) 8983–8990.
[124] A.N. Lane, T.W. Fan, Z. Xie, H.N. Moseley, R.M. Higashi, Isotopomer analysis oflipid biosynthesis by high resolution mass spectrometry and NMR, Anal.Chim Acta 651 (2009) 201–208.
[125] A.N. Lane, T.W.M. Fan, M. Bousamra, R.M. Higashi, J. Yan, D.M. Miller, Stableisotope-resolved metabolomics (SIRM) in cancer res. with clinical applicationto nonsmall cell lung cancer, OMICS 15 (2011) 173–182.
[126] T.W.M. Fan, A.N. Lane, Applications of NMR spectroscopy to systemsbiochemistry, Prog. Nucl. Magn. Reson. Spectrosc. 92–93 (2016) 18–53.
[127] T.W.M. Fan, A.N. Lane, R.M. Higashi, M.A. Farag, H. Gao, M. Bousamra, D.M.Miller, Altered regulation of metabolic pathways in human lung cancerdiscerned by (13)C stable isotope-resolved metabolomics (SIRM), Mol. Can. 8(2009) 41.
[128] T.W.M. Fan, P. Yuan, A.N. Lane, R.M. Higashi, Y. Wang, A.B. Hamidi, R. Zhou, X.Guitart, G. Chen, H.K. Manji, R. Kaddurah-Daouk, Stable isotope-resolvedmetabolomic analysis of lithium effects on glial-neuronal metabolism andinteractions, Metabolomics 6 (2010) 165–179.
[129] R.M. Higashi, T.W.M. Fan, P.K. Lorkiewicz, H.N.B. Moseley, A.N. Lane, Stableisotope-labeled tracers for metabolic pathway elucidation by GC-MS and FT-MS, 1198 (2014) 147-167.
[130] A.N. Lane, R.M. Higashi, T.W.M. Fan, Preclinical models for interrogating drugaction in human cancers using stable isotope resolved metabolomics (SIRM),Metabolomics 12 (2016) 1–15.
[131] T.W.M. Fan, A.N. Lane, R.M. Higashi, J. Yan, Stable isotope resolvedmetabolomics of lung cancer in a SCID mouse model, Metabolomics 7(2011) 257–269.
[132] T.W.M. Fan, P.K. Lorkiewicz, K. Sellers, H.N.B. Moseley, R.M. Higashi, A.N.Lane, Stable isotope-resolved metabolomics and applications for drugdevelopment, Pharmacol. Ther. 133 (2012) 366–391.
[133] H.N. Moseley, Correcting for the effects of natural abundance in stableisotope resolved metabolomics experiments involving ultra-high resolutionmass spectrometry, BMC Bioinf. 11 (2010) 139.
[134] W. Callebaut, Scientific perspectivism: a philosopher of science’s response tothe challenge of big data biology, Stud. Hist. Philos. Biol. Biomed. Sci. 43(2012) 69–80.
[135] K. Dolinski, O.G. Troyanskaya, Implications of big data for cell biology, Mol.Biol. Cell. 26 (2015) 2575–2578.
[136] V. Gligorijevic, N. Malod-Dognin, N. Przulj, Integrative methods for analyzingbig data in precision medicine, Proteomics 16 (2016) 741–758.
[137] J.D. Tenenbaum, S.-A. Sansone, M. Haendel, A sea of standards for omics data:sink or swim?, J Am. Med. Inf. Assoc. 21 (2014) 200–203.
[138] I. Anagnostopoulos, S. Zeadally, E. Exposito, Handling big data: researchchallenges and future directions, J. Supercomput. 72 (2016) 1494–1516.
[139] S.L. Robinette, F. Zhang, L. Bruschweiler-Li, R. Bruschweiler, Web server basedcomplex mixture analysis by NMR, Anal. Chem. 80 (2008) 3606–3611.
[140] H.E. Pence, A. Williams, ChemSpider: an online chemical informationresource, J. Chem. Educ. 87 (2010) 1123–1124.
[141] A.M.D. Livera, M. Sysi-Aho, L. Jacob, J.A. Gagnon-Bartsch, S. Castillo, J.A.Simpson, T.P. Speed, Statistical methods for handling unwanted variation inmetabolomics data, Anal. Chem. 87 (2015) 3606–3615.
[142] S. Wold, W. S., S. Hellbern, T. Lundstedt, M. Siostrom, PLS modeling withlatent variables in two or more dimensions, in: Proceedings PLS ModelBuilding, Theory and Applications Symposium Frankfurt am Main September23–25, 1987.
[143] A.K. Smilde, J.A. Westerhuis, S. de Jong, A framework for sequentialmultiblock component methods, J. Chemom. 17 (2003) 323–337.
[144] J.A. Westerhuis, T. Kourti, J.F. Macgregor, Analysis of multiblock andhierarchical PCA and PLS models, J. Chemom. 12 (1998) 301–321.
[145] D.E. Befroy, R.J. Perry, N. Jain, S. Dufour, G.W. Cline, J.K. Trimmer, J. Brosnan,D.L. Rothman, K.F. Petersen, G.I. Shulman, Direct assessment of hepaticmitochondrial oxidative and anaplerotic fluxes in humans using dynamic 13Cmagnetic resonance spectroscopy, Nat. Med. 20 (2014) 98–102.
Glossary of Abbreviations
1D: One-Dimensional2D: Two-Dimensional3D: Three-Dimensional6-OHDA: 6-hydroxydopamineANOVA: ANalysis Of VarianceBNMI: Bruker NMR-Mass Spectrometry InterfaceCE: Capillary ElectrophoresisCOLMAR: Complex Mixture Analysis by NMRCV-ANOVA: ANOVA of the Cross-Validated residualsddH2O: double-distilled waterDI-ESI-MS: Direct Infusion ElectroSpray Ionisation Mass SpectrometryESI: ElectroSpray IonisationGC: Gas ChromatographGPL: GlyceroPhosphoLipidsHMBC: Heteronuclear Multiple-Bond CorrelationHSQC: Heteronuclear Single Quantum Coherence spectroscopyFT-ICR-MS: Fourier Transform Ion Cyclotron Resonance Mass SpectrometryLC: Liquid ChromatographLysoPC (16:0): Lysophospholipid (16:0)MB-PCA: Multi-Block-Principal Component AnalysisMB-PLS: Multi-Block-Projections to Latent StructuresMetPA: METabolomics Pathway AnalysisMPP+: 1-methyl-4-phenylpyridiniumMS: Mass SpectrometryMSn: Multiple-stage mass spectrometry where n is the number of product ion
stages (n = 2,3, etc.)m/z: mass to charge ratioNADPH: Nicotinamide Adenine Dinucleotide PhosphateNMR: Nuclear Magnetic ResonanceOPLS: Orthogonal Projections to Latent StructuresOPLS-DA: Orthogonal Projections to Latent Structures- Discriminate AnalysisPC (34:1): PhosphatidylCholine 34:1PC: Principal ComponentPC1: first Principal ComponentPCA: Principal Component AnalysispKa: negative logarithm of an acid dissociation constantPLS: Projections to Latent StructuresPPP: Pentose Phosphate PathwayPRA: Pattern Recognition ApproachesROC: Receiver Operating CharacteristicRSD: Relative Standard DeviationSIRM: Stable Isotope-Resolved MetabolomicsTCA cycle: TriCarboxylic Acid cycleTMSP-d4: 3-(TriMethylSilyl)Propionic-2,2,3,3-d4
TOCSY: Total Correlation SpectroscopYXCMS: various forms (X) of Chromatography Mass Spectrometry