Embed Size (px)
Citation preview


Programme
Symposium: The Prospects of E-Mobility in Karachi
Arrival of guests : 0930
hrs
Guests to be seated : 0945
hrs
Recitation from the Holy Quran : 1000
hrs
Welcome Address by the President PAE : 1005
hrs
PRESENTATIONS
1. The Public & Private Transport System
in Karachi by Mr. Ijaz Hussain Khilji : 1015
hrs
Discussion by the Participants : 1045
hrs
2. The Cost of Traffic Congestion for Karachi
by Prof. Dr. Mir Shabbar Ali : 1100
hrs
Discussion by the Participants : 1115
hrs
3. International Scenario of Electric Road
Vehicles by Dr. Nasim A. Khan : 1120
hrs
Discussion by the Participants : 1150
hrs
4. The Ultimate Solution
by Dr.-Ing. Jameel Ahmad Khan : 1205
hrs
Discussion by the Participants : 1235
hrs
Concluding Observations : 1250
hrs
Lunch : 1300
hrs


PAKISTAN ACADEMY OF ENGINEERING
EDITOR. PROF DR NASIM A. KHAN
A REPORT
ON PAE
SYMPOSIUM
HELD ON
DECEMBER20, 2014
PROSPECTS OF
E-MOBILITY
IN KARACHI
ISLAMIC REPUBLIC OF
PAKISTAN

1
A REPORT
ON
PAKISTAN ACADEMY OF ENGINEERING
SYMPOSIUM
PROSPECTS OF E-MOBILITY IN KARACHI CITY,
ISLAMIC REPUBLIC OF PAKISTAN
held on December 20, 2014
The President; Pakistan Academy of Engineering is Ex Vice Chancellor of NED University of
Engineering & Technology, Karachi The Author-1 is an Ex- Managing Director, Karachi Urban Transport Corporation. Author-2 is Chairman of Department of Urban & transportation Engineering, NED University
of Engineering & Technology, Karachi Author-3 is Senior Executive Director at Osmani & Company (Pvt) Ltd, Ex Vice Chancellor of Hamdard University, Karachi and Ex Vice Chancellor of Nazeer Hussain University, Karachi Author-4 is The President Pakistan Academy of Engineering
Including
Address of President of Pakistan Academy of Engineering
Prof. Dr.-Ing. Jameel Ahmad Khan
Papers presented by
The Public & Private Transport System in Karachi by Ijaz Hussain Khilji The Cost of Traffic Congestion for Karachi by Prof Dr Mir Shabbar Ali
International Status of E- Mobility by Prof Brig. Dr. Nasim A. Khan
The Ultimate Solution by Prof. Dr.-Ing. Jameel Ahmad Khan
and
Recommendations of the Symposium

Pakistan Academy of Engineering
2
Address of the President, Dr. –Ing. Jameel Ahmad Khan
Honourable guests and my dear fellow engineers. Assalamo Alaikum 1. We are grateful that you very kindly agreed to grace this occasion. It is the first Symposium to address one of the Ten Grand Challenges that we have identified to be addressed by the engineering community. You may visit the subjects of our future symposia listed on our website (http://www.pacadengg.org). The Pakistan Academy of Engineering is a LEARNED SOCIETY and acts as a THINKING LABORATORY. 2. Ladies and gentlemen, I on behalf of the Pakistan Academy of Engineering heartily welcome you on this occasion and express my profound gratitude for your participation. Karachi with a population of almost 20 million is struggling to have a sustainable public and private transport system. This is the most pressing problem of the citizens, who are under extreme distress. Is there a solution, which the latest technologies can deliver? Let us examine the proposition. Mobility is one of human being’s fundamental desires, as well as necessity. It is likely to expand further in the future with the progress of the world economy. Transport consumes about one fourth of the total world energy. It has been recognized internationally that the future of humanity lies in de-carbonizing the transport system radically. According to the statistics released by the Government of Pakistan, the total Primary Energy Supplies amounted to 64.588 million tons of oil equivalent (TOE) in the year 2012-13 as shown in Figure-1 & Figure-2. The Transport Sector is supposed to have consumed 12.713 million TOE i.e. 19.68% of the total Primary Energy Supplies as shown in Figure-3. Petroleum products accounted for 10.368 million TOE and Gas 2.345 million TOE. Road transport alone shared 12.23 million TOE i.e. 18.94% of the total Primary Energy Supplies.

Pakistan Academy of Engineering
3
Figure-1: Energy Flow Chart 2012-13 [Source: Pakistan Energy Year Book 2013]
Figure-2: Primary Energy Supplies by Source [Source: Pakistan Energy Year Book 2013]
Pakistan Academy of Engineering
4
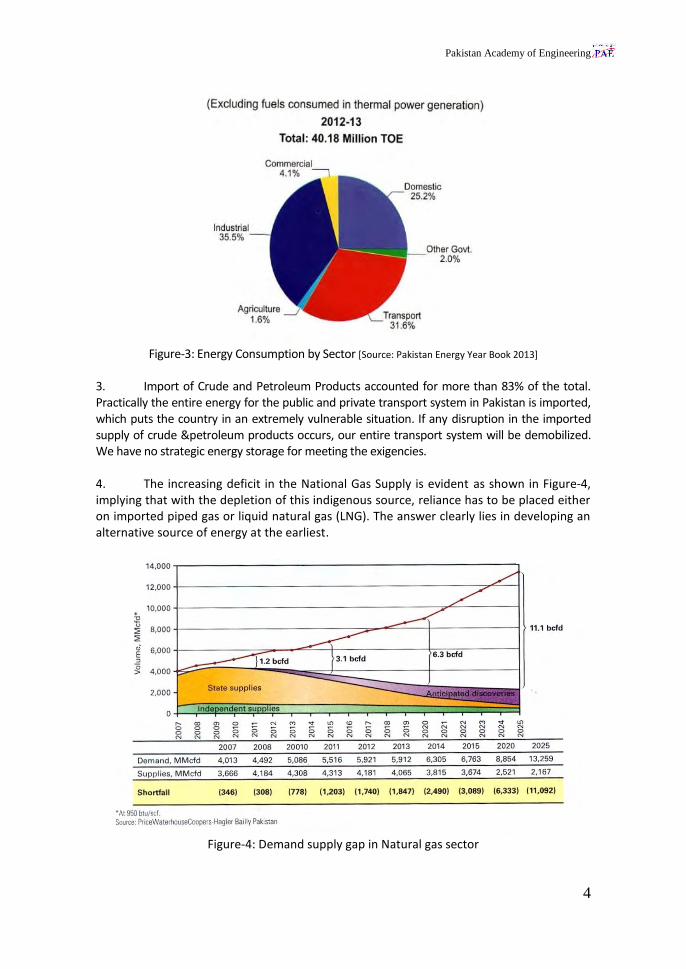
Figure-3: Energy Consumption by Sector [Source: Pakistan Energy Year Book 2013]
3. Import of Crude and Petroleum Products accounted for more than 83% of the total. Practically the entire energy for the public and private transport system in Pakistan is imported, which puts the country in an extremely vulnerable situation. If any disruption in the imported supply of crude &petroleum products occurs, our entire transport system will be demobilized. We have no strategic energy storage for meeting the exigencies. 4. The increasing deficit in the National Gas Supply is evident as shown in Figure-4, implying that with the depletion of this indigenous source, reliance has to be placed either on imported piped gas or liquid natural gas (LNG). The answer clearly lies in developing an alternative source of energy at the earliest.
Figure-4: Demand supply gap in Natural gas sector
Pakistan Academy of Engineering
5
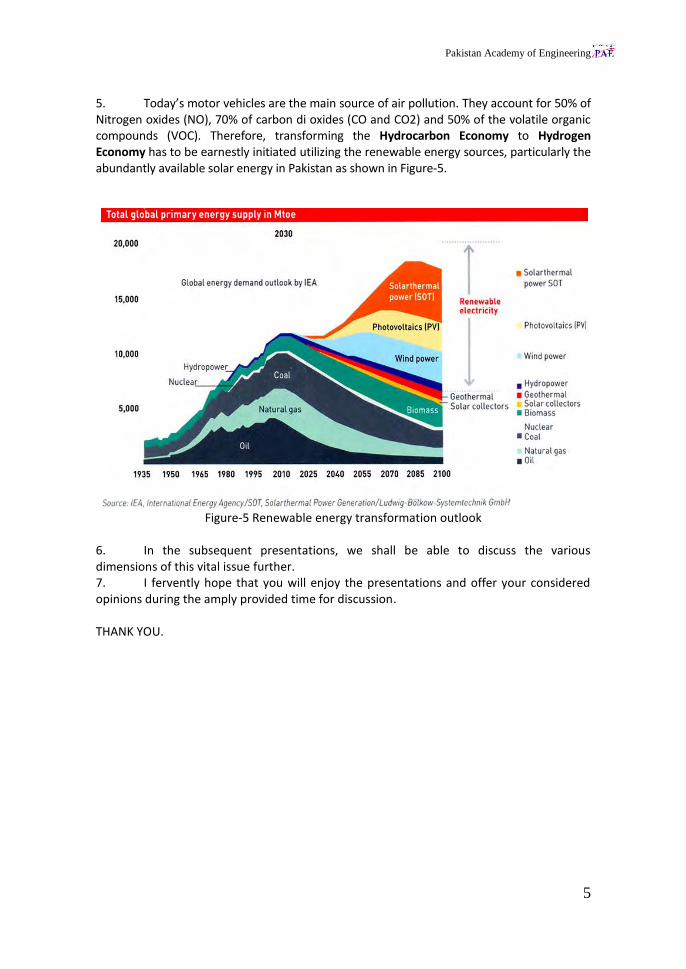
5. Today’s motor vehicles are the main source of air pollution. They account for 50% of Nitrogen oxides (NO), 70% of carbon di oxides (CO and CO2) and 50% of the volatile organic compounds (VOC). Therefore, transforming the Hydrocarbon Economy to Hydrogen Economy has to be earnestly initiated utilizing the renewable energy sources, particularly the abundantly available solar energy in Pakistan as shown in Figure-5.
Figure-5 Renewable energy transformation outlook
6. In the subsequent presentations, we shall be able to discuss the various dimensions of this vital issue further. 7. I fervently hope that you will enjoy the presentations and offer your considered opinions during the amply provided time for discussion. THANK YOU.
Pakistan Academy of Engineering
6
THE PUBLIC & PRIVATE TRANSPORT SYSTEM IN KARACHI Ijaz Hussain Khilji
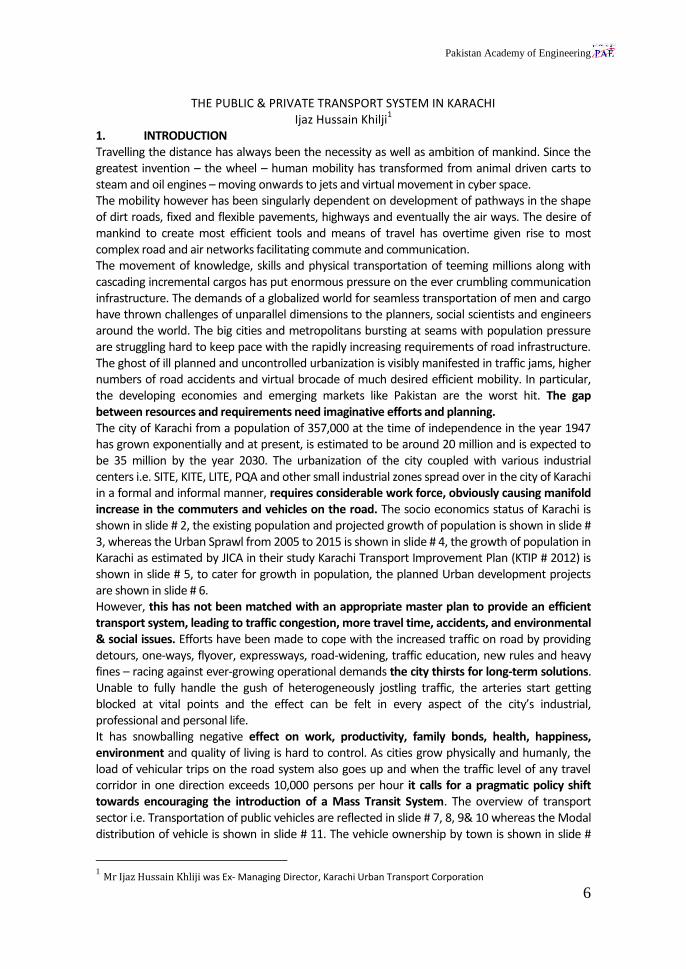
1 1. INTRODUCTION Travelling the distance has always been the necessity as well as ambition of mankind. Since the greatest invention – the wheel – human mobility has transformed from animal driven carts to steam and oil engines – moving onwards to jets and virtual movement in cyber space. The mobility however has been singularly dependent on development of pathways in the shape of dirt roads, fixed and flexible pavements, highways and eventually the air ways. The desire of mankind to create most efficient tools and means of travel has overtime given rise to most complex road and air networks facilitating commute and communication. The movement of knowledge, skills and physical transportation of teeming millions along with cascading incremental cargos has put enormous pressure on the ever crumbling communication infrastructure. The demands of a globalized world for seamless transportation of men and cargo have thrown challenges of unparallel dimensions to the planners, social scientists and engineers around the world. The big cities and metropolitans bursting at seams with population pressure are struggling hard to keep pace with the rapidly increasing requirements of road infrastructure. The ghost of ill planned and uncontrolled urbanization is visibly manifested in traffic jams, higher numbers of road accidents and virtual brocade of much desired efficient mobility. In particular, the developing economies and emerging markets like Pakistan are the worst hit. The gap between resources and requirements need imaginative efforts and planning. The city of Karachi from a population of 357,000 at the time of independence in the year 1947 has grown exponentially and at present, is estimated to be around 20 million and is expected to be 35 million by the year 2030. The urbanization of the city coupled with various industrial centers i.e. SITE, KITE, LITE, PQA and other small industrial zones spread over in the city of Karachi in a formal and informal manner, requires considerable work force, obviously causing manifold increase in the commuters and vehicles on the road. The socio economics status of Karachi is shown in slide # 2, the existing population and projected growth of population is shown in slide # 3, whereas the Urban Sprawl from 2005 to 2015 is shown in slide # 4, the growth of population in Karachi as estimated by JICA in their study Karachi Transport Improvement Plan (KTIP # 2012) is shown in slide # 5, to cater for growth in population, the planned Urban development projects are shown in slide # 6. However, this has not been matched with an appropriate master plan to provide an efficient transport system, leading to traffic congestion, more travel time, accidents, and environmental & social issues. Efforts have been made to cope with the increased traffic on road by providing detours, one-ways, flyover, expressways, road-widening, traffic education, new rules and heavy fines – racing against ever-growing operational demands the city thirsts for long-term solutions. Unable to fully handle the gush of heterogeneously jostling traffic, the arteries start getting blocked at vital points and the effect can be felt in every aspect of the city’s industrial, professional and personal life. It has snowballing negative effect on work, productivity, family bonds, health, happiness, environment and quality of living is hard to control. As cities grow physically and humanly, the load of vehicular trips on the road system also goes up and when the traffic level of any travel corridor in one direction exceeds 10,000 persons per hour it calls for a pragmatic policy shift towards encouraging the introduction of a Mass Transit System. The overview of transport sector i.e. Transportation of public vehicles are reflected in slide # 7, 8, 9& 10 whereas the Modal distribution of vehicle is shown in slide # 11. The vehicle ownership by town is shown in slide #
1 Mr Ijaz Hussain Khliji was Ex- Managing Director, Karachi Urban Transport Corporation

Pakistan Academy of Engineering
7
12, whereas the Nos. of vehicles registered and growth rate of same is shown in slide # 13.It can be seen that present percentage of ownership of public vehicles will increase to 16%,if Mass Transit Program is not implemented. Consequently the travel time will also increase and the pollution will also increase, as referred in slide # 14& 15. The aforesaid increase in population and vehicles are posing great threat and challenges which are reflected in slide # 16, 17 & 18.Therefore the immediate provision for a Mass Transit System i.e. vehicles with large carrying capacity, moving at higher speed, short intervals, and affordable fare level are shown pictorially in slide # 20. 2. HISTORY OF MASS TRANSIT The city of Karachi had a Mass transit System in the shape of Tramways, almost covering the old city of Karachi, in combination with an efficient bus operation. The Tramways were abandoned in the year 1975 due to increase in the vehicular traffic, leading to denial of accessibility of Right-of-Way to trams. The first master plan of the city of Karachi was prepared in the year 1952 by Swedish consultants MRVP who had recommended the provision of a mass transit in the shape of Karachi Circular Railway. In late 1950’s the planning and construction of KCR was undertaken by the railway management and KCR was commissioned in November 1964 and extended in 1970, having the route length of 43.1kmswith 14 stations and was highly patronized which is evident from the fact that in the year 1984, 104 trains were operating on the system. But due to lack of continued investment in KCR, the operating efficiency was marginalized resulting in long running time, frequent break downs, cancellation of trains leading to loss of ridership, thereby the number of Trains was gradually reduced and eventually KCR was closed for traffic in January 2000. The Karachi Mass Transit Study (KMTS) was commissioned under the World Bank funding in 1987. The study recommended an 87 km network of elevated and at grade transit ways to be initially used a bus ways and later to be converted to a light rail system around year 2000. The project could not be implemented due to financial constraints. 3. WHAT IS A METRO? Mass Transit System is normally synonymous with the word ‘Metro’. A ‘Metro’ can perhaps be best defined as a high-frequency, urban, Mass Rapid Transit System that operates totally independent from other modes of traffic. It can be underground, at-grade, elevated or a combination of any of the above. According to German Metro enthusiast Robert Schwandl, Steel Wheels, Rubber Tires, Double-rail, Monorail, Overhead Wire Electrification, Third Rail Power Supply, Narrow Gauge, Standard Gauge, Broad Gauge, Automatically-driven, Driver-driven… a ‘Metro’ can be based on a combination of any of the above systems. It doesn’t necessarily use heavy rail technology and that’s why some famous urban light rail systems that meet a metro’s generally accepted operating parameters are sometimes included in metro listings. SOME CHARACTERISTICS OF METRO: High acceleration Deceleration Close inter station distances Closed door High safety levels Pre boarding ticketing Intermodal connectivity Air conditioned Convenient access 4. STATUS OF PUBLIC AND PRIVATE TRANSPORT IN KARACHI In developed countries, the planning for a Mass Transit System generally starts when the city population crosses the one million mark. The system is in position by the time the city population

Pakistan Academy of Engineering
8
is two to three million and when the population exceeds four million or so, planned extensions to the Mass Rapid Transit Systems are vigorously initiated. Metro lines are not just for affluent countries. They are a necessity for any large city, to provide mobility to its people. Cities in Europe have an average 38-kms of metro rail per million populations. The corresponding figure in Asia and North America is 10 kms and 23 kms respectively, whereas world average is 19 kms. The demand analysis shows that road development in the master plan is not enough to reduce the projected traffic congestion in Karachi. In order to improve the traffic situation in the future, it is necessary to construct mass transit system. Karachi Circular Railway (KCR) will contribute to provide better transport in the center of the city, but it is proposed that the line should be extended to east because the future demand in Bin Qasim is expected to be very high. The demand analysis shows that the traffic demand will be high not only in radial directions including Tower – Super Highway, but also the corridor along Rashid Minhas Road. Railway systems are proposed for the two corridors. The growth of Karachi towards West and North East can be catered for by the provision of six BRT corridors as suggested in KTIP Plan prepared by JICA in 2012. 5. TRAVEL TIME COST 5.1 Revived KCR Project Provision of Mass Transit System reduces the travel time of the mobility of the commuters and results in saving of man-hours. In the case of revival of KCR Project the difference of travel time between road transport and revived KCR has been calculated on the basis of the speed of both the modes and the projected ridership of KCR. The annual saving will be PKR 5.110 Billion. As shown in slide # 14. 5.2 Provision of BRT The BRT project will bring about economic benefit such as travel time reduction for BRT passengers, vehicle operating cost reduction, and vehicle emission reduction. On the other hand, the project will cause negative impact on road traffic. Since existing bus passengers will use the BRT, and the system will reach its capacity by them, shift from car users to BRT system will not be large enough to compensate the reduction in the number of lanes. However, the project is economically feasible. The average travel time of minibuses is approximately 17km/h in Karachi. The travel speed of BRT is expected to be 33km/h on average. The benefits of time saving due to increase in speed are marginalized due to the following reasons: i. Lanes of carriage way for vehicular traffic will be reduced by BRT where the width of median is not wide enough for BRT lines, which will reduce the capacity of road and increase the travel time. ii. The average speed in peak hours along the BRT corridors is assumed as 33 km/h which will be reduced to 29.7 km/h [90%] iii. Delay at the Intersection of BRT. The BRT Project will change the signal free corridor to a signalized road for BRT operations, which will cause a delay at signalized intersection. Delay at intersection depends on the capacity and traffic volume. However, the average delay per vehicle at an intersection has been assumed as 40 seconds in the KTIP Study by JICA. 6. AIR & NOISE POLLUTION DUE TO INCREASE VEHICULAR EMISSIONS Karachi city’s air quality is one of the poorest in the world, with levels exceeding WHO guidelines. A major contributor to this pollution and generation of green-house gases (GHG) is the transportation sector, especially from an aging fleet of vehicles in poor mechanical condition and low levels of fuel efficiency. The high levels of sulphur in an automotive diesel (0.5% -1%) is seen as a major contributor to sulphur dioxide (SO2) and particulate matter (PM10) in ambient air. i. According to the Pakistan Environmental Protection Agency (PEPA), a major share of the emission load from motor vehicles in urban areas can be attributed to a relatively small

Pakistan Academy of Engineering
9
number of smoky diesel and 2-stroke (rickshaws) vehicles. Traffic congestion affects average speed of vehicles and consequently fuel consumption and greenhouse gases. ii. The environmental damage costs associated with urban air pollution are equivalent to 1% of GDP, as stated in one of the World Bank reports. iii. Particularly, at health risk are those living within a quarter of a mile of high-volume roads (those carrying 10,000 – 20,000 vehicles per day) and those living near roads with a large amount of truck traffic. iv. Noise pollution from vehicles, especially in residential areas, is above recommended levels. iv. Major contributors to the noise pollution are frequent and indiscriminate use of vehicle horns, removal of silencers on rickshaws and other 2-stroke vehicles, high volumes of traffic especially heavy vehicles. 6.1 Environmental Considerations in KCR The Revival of KCR Project is environment friendly as it is based on electric traction. It will result in estimated exhaust reduction of 44,584 ton / year for minibus and 1,342 ton per /year for bus and value of annual reduction is estimated at US$ 1.286 Billion per year as of 2023. 7. ISSUES AND CHALLENGES 7.1 Low Capacity of Bus Service Most mega-cities, like Karachi in developing countries suffer from a large number of small buses (minibus) which cause serious congestion in the center of these cities. Usually, introduction of a mass transit system can be justified from the huge demand in public transport in these cities. Karachi is an exception. The number of bus fleets is decreasing while the traffic demand is increasing with rapid population growth, city expansion,and economic growth. Rapid increase in private cars cannot explain the reason because car is still expensive in Pakistan and there still remains huge population who cannot afford to buy a private car. The number of minibuses and coaches are restricted while introduction of standard size buses has failed. Bus service in Karachi is having severe strain, due to increase in vehicle operating cost. The operators are therefore not bringing in new buses nor maintaining the existing fleet in a proper condition. 7.2 Improper Bus Routes The majority of the bus services concentrate on radial directions except the major circular route such as Rashid Minhas Road. Bus routes are designed to provide the service between major origin and destination through high demand routes, and the preferable routes for bus operators are busy while the bus service along non-popular routes is poor. There is no hierarchy of bus network, or trunk and feeder system. From this, passengers need to transfer their buses to reach their destination. Since there is no fare integration, passengers need to pay the fare for every transfer. 7.3 Poor Road Network Road network in Karachi has been significantly improved in recent years by construction of flyovers and underpasses. From this, traffic capacity problem is small at present. However, there are some network problems relating to urban structure. For example, the access, to and from Korangi Industrial Area is inconvenient because there are few access routes over Malir River. 7.4 Traffic Congestion Traffic congestion is one of the serious problems especially in the center of the city. A lot of traffic signals are installed at intersections in the down-town area compared to the suburban area. However, at very busy intersections, traffic is controlled by traffic police in peak hours due to the inefficacy of the signals provided therein.

Pakistan Academy of Engineering
10
7.5 Demand-Supply Gap of Parking Space The capacity of public parking is very small compared to the demand in roadside parking. This needs to be improved by the provision of parking plazas and restricted parking on the streets. 7.6 Lack of Proper Traffic Enforcement In Karachi, passenger riding on bus roof top is very popular and observed everywhere although it is prohibited. Double parking and other illegal parking are overlooked without proper enforcement. Due to lack of enough transport services; the violations occur and it is very difficult to fully regulate violations of traffic rules, problems in transport sector are complex and related to each other. 8. OPTIONS The aim for an efficient and effective Mass Transit System is to provide vehicles with large carrying capacity, operating at high frequency for the mobility of maximum number of passengers in shortest possible time. This can be achieved by providing a combination of Bus Rapid Transit (Metro-Bus), Trams, Metro-Rapid Transit (MRT), Subways, Suburban Rail System etc. 8.1 Underground Metro Rail This is an ideal system for providing mobility from the CBD’s Areas to the outskirts of the City and can be provided readily in combination with the circular connection depending upon the pattern of the commuters. In Karachi underground spine from Jehangir Park [Empress Market] to Tower via I.I. Chundrigar Road and M.A. Jinnah Road coupled with spine from Jahangir Park to NIPA would afford mobility from CBD areas to outskirts in shortest possible time. However, the cost of the Project imposes major constraints and is not doable in present condition. 8.2 Revival of Karachi Circular Railway (KCR) It has right of way available in almost all the districts of Karachi, and its revival does not involves any major traffic diversions and relocation of utility services. Karachi Circular Railway shall be revived as a modern commuter system with proper road connectivity and interface with the proposed BRT and MRT corridors. 8.3 MRT [Metro Rail Transit] at grade and elevated on high density corridors: i. Blue Line: Super Highway to Tower via Tin Hatti, M.A.Jinnah Road. ii. Brown Line: Korangi to North Karachi via Rashid Minhas Road 8.4 Bus Rapid Transit Bus Rapid Transit is a high quality bus system providing high speed, reliable, and comfortable services compared to traditional bus services. The concept of BRT is based on railway system, i.e. running along exclusive way, high speed, accurate travel time, and high capacity. KTIP study carried out by JICA, in 2009-12 as proposed the following BRT routes: i. Green Line: Surjani to Jamma Cloth Market via North Nazimabad, M.A. Jinnah Road ii. Red Line: Malir Cantt to Regal Chowk via University Road iii. Yellow Line: Dawood Chowrangi to Numaish/ Lucky Star via Korangi Road iv. Orange Line: Orangi Town to Matric Board Office v. Purple Line: Baldia to Sher Shah via Hub River Road vi. Aqua Line: Hawks Bay to Gulbai via Mauripur Road The option/solution in the shape of MRT/BRT and in short term/long term are presented in slide # 25, 26& 27,which will duly address the concerns of commuters as reflected in slide # 28. However the approved projects are listed at slide # 29 & 30 and the Policy and Strategy for the achievement of the same are given in 31, 32, 33 & 34. The proposed Mass Transit System are in line with the BRT system and LRT systems, operating in the world are reflected in the slide # 21, 22, & 23 and the underground Metro Rail Project are shown in slide # 24. There are a number of variations for BRT, and the boundary between BRT and conventional bus services is

Pakistan Academy of Engineering
11
not clear as far as the physical appearance is concerned. A typical BRT is the bus transit service on exclusive lanes in road spaces along the kerb line/centre of the road/dedicated lane. The maximum capacity of a standard BRT is approximately 13,000 passengers per hour per direction. BRT capacity depends on the service frequency and vehicle capacity. 8.5 BRT Type There are three levels of BRT system commonly used for the classification of BRT.
Level 1 Bus Lane Level 2 Bus way Level 3 BRT [dedicated lane]
Level-1 system usually provides a bus lane along kerb side. The bus lane is sometimes a priority lane which gives priority of using the lanes to buses but other vehicles can use the lanes when the bus traffic is not heavy, and other times an exclusive lane. In the urban street system where access demand along the road side exists and there are intersections with crossing streets, the bus lanes are easily interrupted by other vehicles. In Level-2 systems to avoid interweave of buses and other traffic, bus lanes are located in the center of roads. The Bus way system is usually a part of the network of general bus services. The improvement of bus services by introduction of this system would be insufficient in case that there are a number of operators (like Karachi) and it is allowed to use the bus way by many operators. The BRT systems in Seoul and Taipei are the examples of this system. Level-3 system is similar to railway system. In most cases, buses are only operated on the dedicated lanes controlled by a single operator along the lanes. Since the BRT buses need not run, in general traffic roads, advanced vehicle technologies can be used to increase the capacity and speed. In addition, pre-board fare collection reduces dwell time at bus stations. Metro bus (Istanbul) is the example of BRT of Level-3. Note that Level-3 does not necessarily mean high capacity system. For example, Trans-Jakarta (Jakarta) is categorized to Level-3 system but the capacity is very small. The service frequency depends on dwell time and clearance time. Additional stopping bays can increase the capacity.
9. APPROVED PROJECTS 9.1 Revival of Karachi Circular Railway

Pakistan Academy of Engineering
12
i. Approved by the Govt. of Pakistan at a cost of 1.558 Billion US$ (Sep 09) ii. Revised Cost 2.6 Billion US$ approved by the Govt. of Pakistan (Aug 12) iii. Feasibility Study completed (May 2009) iv. Feasibility Study, updated (November 2012) v. EIA Study conducted and approved by EPA GOS vi. Geotechnical investigations, hydrological & Geological studies done vii. Exemption of GST, Import Duty, Federal and Provincial taxes (March 2013) viii. JICA considering to fund the project 9.2 BRT Yellow Line Project [20.4 KM, estimated cost Rs.5.5 Billion] i. Project has been conceived under PPP Mode by PPP Unit GOS & Karachi Mass Transit Cell (KMTC) ii. Bidding is under process iii. The date of submission of financial bids by potential sponsors was December 18, 2014, which has been extended to Jan / Feb 2015. 9.3 BRT Green Line Project [21.1 KM, cost Rs.16 Billion for Infrastructure] i. The Prime Minister approved PKR 16.0 Billion for BRT Green Line ii. PC – I approved for Rs.16.0 Billion by Govt. of Pakistan (04-Dec-2014). iii. Ministry of Communications, GoP to provide funds. iv. Rolling Stock, ITS and other systems under PPP mode by GOS 9.4 BRT/MRT Blue Line Project i. PPP Policy Board approved the project & instructed PPP Unit, GOS for international bidding ii. The Public Hearing for EIA was conducted on Oct. 28, 2014 by EPA. iii. The PPP Unit GOS is preparing RFP for International Bidding 10. RECOMMENDATIONS In the present day scenario; the solution to the mobility problems in the city of Karachi can be as follows:-
Optimize traffic corridors Promote public transport Cleaner fuels Green vehicles
Short Term Implementation of:-
Revival of KCR Project BRT Projects
o Blue Line o Orange Line o Green Line o Yellow Line
Long Term Implementation of:-
KCR Extension to Airport KCR Extension to Steel Mill, Port Qasim BRT Corridors
o Red Line o Purple Line o Aqua Line
Provision of underground Metro to be explored.

Pakistan Academy of Engineering
13
OVERVIEW OF THE
SOCIOECONOMICS STATUS OF
KARACHI
1
Administrative Structure:• Total No. of Towns - 18• Total No. of Cantonments - 6• Total No. of UC’s - 178
Demographics:• Population (million) - 20• Households (millions) - 3.3• Annual Pop. Growth - 3.5%
BUILT-UP AREA [1,200 SQ. KM]
JURISDICTION [3,600 SQ. KM]
KARACHI AT A GLANCE
2

Pakistan Academy of Engineering
14
POPULATION GROWTH BY TOWN
Gadap
Town
Bin Qasim
Town
Kemari
Town
New Karachi
Town
Population in 20051,000,000500,000100,000
Population in 20201,000,000500,000100,000
Source: JICA KTIP 2030
3
New Built Up(2005⇒2010)
New Under Built Up(2005⇒2010)
Built Up Area (2005,2010)
URBAN SPRAWL AREA FROM 2005 TO 2015
DESCRIPTION 2005
(HA)
2015
(HA)
2015/2005
1. Built-up 33,088 35,931 1.1
2. Under Built-up 10,625 14,696 1.4
TOTAL 43,713 50,627 1.2
Built-up Area: About 50% or more of
the site is filled with buildings or houses.
Under Built-up Area: Less than 50% of
the site is filled.
Others (Non Built-up Area): Vacant
land or very few buildings or houses
4

Pakistan Academy of Engineering
15
GROWTH OF POPULATION IN KARACHI
31.9
29.7
15.1
18.9
23.1
27.6
32.7
38.9
36.1
31.6
10
15
20
25
30
35
40
2000 2005 2010 2015 2020 2025 2030 2035
(million)
Alternative A
Alternative B
Alternative C
KSDP2020
Year
Alternative
A
Alternative
B
Alternative
C
Rate in
2020
continues
Trend of
KSDP
2020
Half rate of
Alternative
B
2005 5.0%
2010 4.5%
2015 4.0%
2020 3.5%
2025 3.5% 3.0% 1.5%
2030 3.5% 2.5% 1.25%
NOTE:
AAGR from 2005 to 2020 are estimated in
KSDP 2020.
Annual Average Growth Rate (AAGR)
Source: JICA KTIP 2030
5
DHA City & Bahria Town Karachi
(25,000 ACRES)
Education City
(2,100 ACRES)
Textile City
(1,250 ACRES)Korangi Creek Industrial Park
(250 ACRES)
Bin Qasim Industrial Park
(930 ACRES)Waterfront
Development
Zulfiqarabad City Town
(Thatta Coastal Area)
New Nazimabad
LARGE-SCALE URBAN DEVELOPMENT PROJECTS
6
Pakistan Academy of Engineering
16
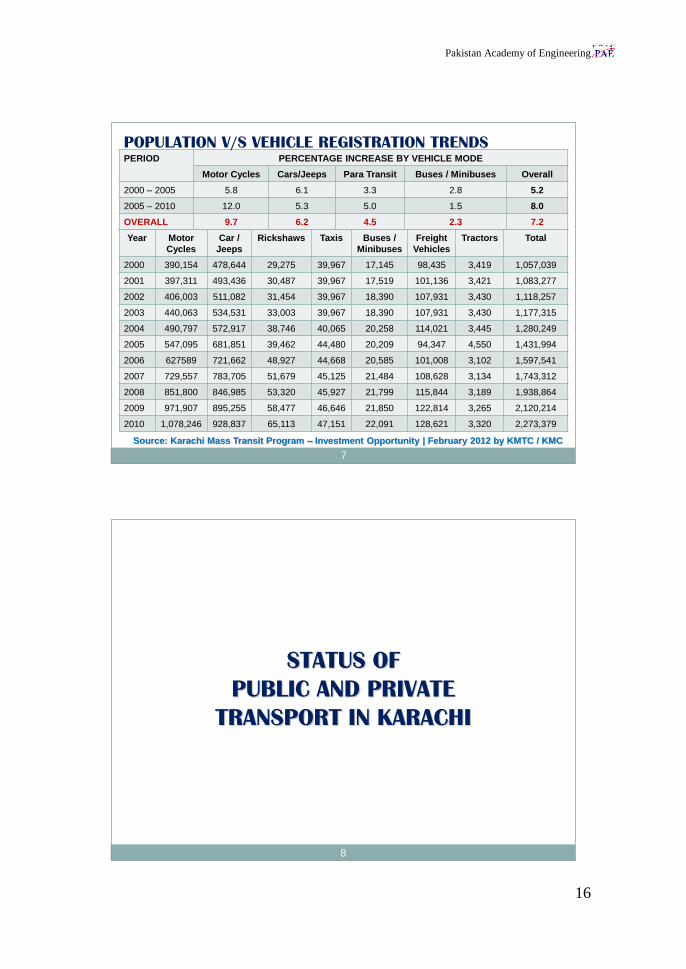
PERIOD PERCENTAGE INCREASE BY VEHICLE MODE
Motor Cycles Cars/Jeeps Para Transit Buses / Minibuses Overall
2000 – 2005 5.8 6.1 3.3 2.8 5.2
2005 – 2010 12.0 5.3 5.0 1.5 8.0
OVERALL 9.7 6.2 4.5 2.3 7.2
POPULATION V/S VEHICLE REGISTRATION TRENDS
Year Motor
Cycles
Car /
Jeeps
Rickshaws Taxis Buses /
Minibuses
Freight
Vehicles
Tractors Total
2000 390,154 478,644 29,275 39,967 17,145 98,435 3,419 1,057,039
2001 397,311 493,436 30,487 39,967 17,519 101,136 3,421 1,083,277
2002 406,003 511,082 31,454 39,967 18,390 107,931 3,430 1,118,257
2003 440,063 534,531 33,003 39,967 18,390 107,931 3,430 1,177,315
2004 490,797 572,917 38,746 40,065 20,258 114,021 3,445 1,280,249
2005 547,095 681,851 39,462 44,480 20,209 94,347 4,550 1,431,994
2006 627589 721,662 48,927 44,668 20,585 101,008 3,102 1,597,541
2007 729,557 783,705 51,679 45,125 21,484 108,628 3,134 1,743,312
2008 851,800 846,985 53,320 45,927 21,799 115,844 3,189 1,938,864
2009 971,907 895,255 58,477 46,646 21,850 122,814 3,265 2,120,214
2010 1,078,246 928,837 65,113 47,151 22,091 128,621 3,320 2,273,379
Source: Karachi Mass Transit Program – Investment Opportunity | February 2012 by KMTC / KMC
7
STATUS OF
PUBLIC AND PRIVATE
TRANSPORT IN KARACHI
8
Pakistan Academy of Engineering
17
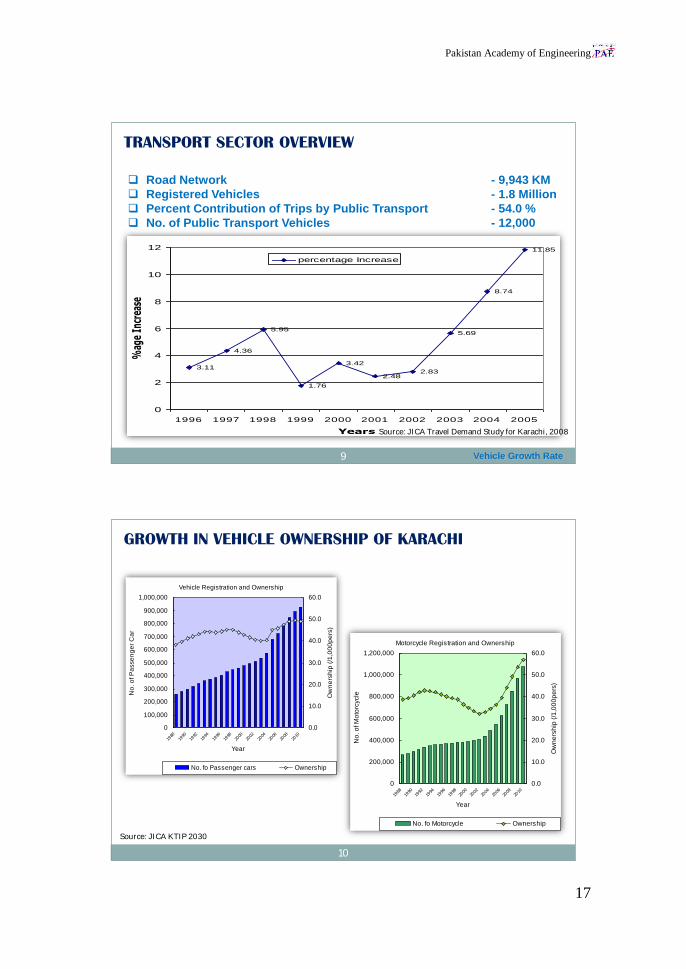
TRANSPORT SECTOR OVERVIEW
Road Network - 9,943 KM
Registered Vehicles - 1.8 Million
Percent Contribution of Trips by Public Transport - 54.0 %
No. of Public Transport Vehicles - 12,000
3.11
4.36
5.95
1.76
3.42
2.482.83
5.69
8.74
11.85
0
2
4
6
8
10
12
1996 1997 1998 1999 2000 2001 2002 2003 2004 2005
Years
%ag
e In
crea
se
percentage Increase
Vehicle Growth Rate
Source: JICA Travel Demand Study for Karachi, 2008
9
GROWTH IN VEHICLE OWNERSHIP OF KARACHI
Vehicle Registration and Ownership
0
100,000
200,000
300,000
400,000
500,000
600,000
700,000
800,000
900,000
1,000,000
1988
1990
1992
1994
1996
1998
2000
2002
2004
2006
2008
2010
Year
No
. o
f P
asse
ng
er
Ca
r
0.0
10.0
20.0
30.0
40.0
50.0
60.0
Ow
ne
rsh
ip (
/1,0
00
pe
rs)
No. fo Passenger cars Ownership
Motorcycle Registration and Ownership
0
200,000
400,000
600,000
800,000
1,000,000
1,200,000
1988
1990
1992
1994
1996
1998
2000
2002
2004
2006
2008
2010
Year
No
. o
f M
oto
rcycle
0.0
10.0
20.0
30.0
40.0
50.0
60.0
Ow
ne
rsh
ip (
/1,0
00
pe
rs)
No. fo Motorcycle Ownership
Source: JICA KTIP 2030
10

Pakistan Academy of Engineering
18
STATUS OF EXISTING PUBLIC TRANSPORT(VEHICLE COUNT V/S OCCUPANCY COMPARISON)
4.5% composition of Public Transport Vehicles carry
42% of Total Persons Traveling in the City.
Private Cars which is 36.5% of Total Vehicular Traffic
carries only 21% of Persons. Showing Lesser
Average Vehicle Occupancy.
The above leads to the conclusion that there is still
deficiency of Public Transport availability on all
Major Routes in the city.
Source: KTIP Study by JICA (2010-12)
11
VEHICLE OWNERSHIP BY TOWN
Source: JICA KTIP 2030
12

Pakistan Academy of Engineering
19
POPULATION V/S VEHICLE REGISTRATION TRENDS(COMPARISON)
NOTE:
No. of Vehicles projected based on an Annual
Growth Rate of 4.5% after 2014, without any
Mass Transit Project.
NOTE:
Present percentage of ownership of private
vehicles is about10%. This will increase to 16% if
Mass Transit Program is not implemented.
13
TIME SAVING BENEFITS
A Average pay per month 7,000/-
B Working days 30
C Working hours/Day 8
D Total working hours in a month [B*C] 240
E Average cost per hour [A/D] 29.166
F Average pay per minute 0.49
G Bus running time for 19.5 km @ 35 km/h speed 78 mins
H Train running time for 19.5 km @ 35 km/h speed 35 mins
I Time saving by KCR travel [F-G] 43 mins
J Time saving cost per day / per passenger [F*I] Rs. 21.07
K KCR passengers per day 698,955
L KCR passengers per year 242,537,385
M Time Cost saving per year [J*L] Rs 5,069,589,182
N Time cost saving per year [Rs. Million] 5,110.26
Say US$ Millions [US$ 1 = Rs.82.5] 61.94
14
14

Pakistan Academy of Engineering
20
99%
1%0%0%0%
CO2
Hydrocarbon
Sulphur dioxide
Nitrogen oxide
Particulate Matter
52%
2%
37%
9%
PETROL CONSUMPTION
CO2
Hydrocarbon
Sulphur dioxide
Nitrogen oxide
Particulate Matter
99%
7%
54%
32%
7%
DIESEL CONSUMPTION
VEHICULAR AIR POLLUTION EMISSIONS FROM
FUEL CONSUMPTION (KM PER DAY)
15
ISSUES AND CHALLENGES
1

Pakistan Academy of Engineering
21
20 m
22 m
MILLION
2.2 m
5.21 m5.43 m
0.58 m
VEHICLE POPULATION TRIPS
TRAVEL DEMAND
1987 2015
30
28
26
24
22
20
18
16
14
12
10
8
6
4
2
0
17
TRANSPORT CHALLENGES
Fast urbanization
Rapid Motorization
Increasing Traffic Congestion
Absence of an efficient Mass Transit System
Declining Road Safety, Air Quality and Growing Noise Pollution
In-Effective Traffic Police and Motor Vehicle Inspection System
Fragmentation of Authorities
18

Pakistan Academy of Engineering
22
OPTIONS AND SOLUTIONS
19
20
MASS
TRANSIT
SYSTEM
OPERATING
AT HIGH
FREQUENCY
MOBILITY OF
MAXIMUM
NUMBER OF
PASSENGERS
SHORTEST
POSSIBLE
TIME
VEHICLES
WITH LARGE
CARRYING
CAPACITY

Pakistan Academy of Engineering
23
BUS Rapid Transit (BRT) System
Bagota, Columbia (Center of Road) Guangzhou, China (Center of Road)
Santiago, Chile (On Kerb) Guangzhou, China (Center of Road)
21
Light Rapid Transit (LRT) In Bangkok
VARIOUS MASS TRANSIT MODES (LRT)
22
Pakistan Academy of Engineering
24
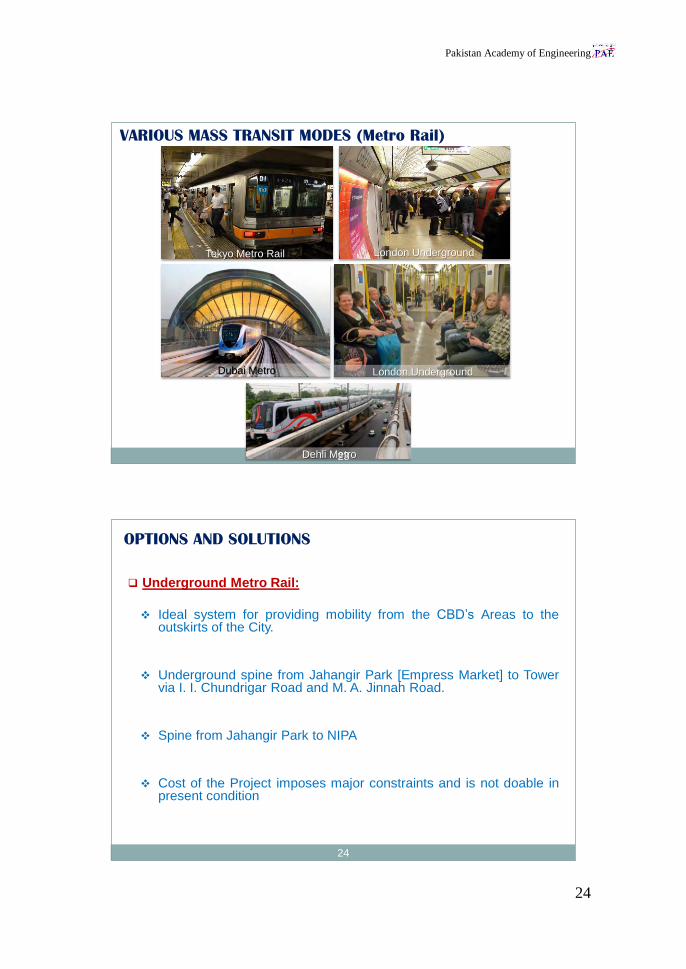
VARIOUS MASS TRANSIT MODES (Metro Rail)
Tokyo Metro Rail London Underground
Dubai Metro London Underground
Dehli Metro23
OPTIONS AND SOLUTIONS
Underground Metro Rail:
Ideal system for providing mobility from the CBD’s Areas to theoutskirts of the City.
Underground spine from Jahangir Park [Empress Market] to Towervia I. I. Chundrigar Road and M. A. Jinnah Road.
Spine from Jahangir Park to NIPA
Cost of the Project imposes major constraints and is not doable inpresent condition
24

Pakistan Academy of Engineering
25
Revival of Karachi Circular Railway
Land for Right of Way and Terminals available
No major Traffic Diversions: Relocation of Utility Services
Feasibility study completed
MRT [Metro Rail Transit] at grade and elevated on high density corridors
Bus Rapid Transit:
Level – 1: Bus Lane along kerb side
Level – 2: Bus Way in center of road
Level – 3: BRT on dedicated lane at grade / elevated
OPTIONS AND SOLUTIONS
25
SHORT TERM:
Implementation of Revival of KCR Project
BRT Projects
Blue Line
Red Line
Green Line
Yellow Line
LONG TERM:
KCR Extension to Airport
KCR Extension to Steel Mill, Port Qasim
Implementation of BRT Corridors
Orange Line
Purple Line
Aqua Line
Provision of underground Metro to be explored
OPTIONS AND SOLUTIONS
26
Pakistan Academy of Engineering
26
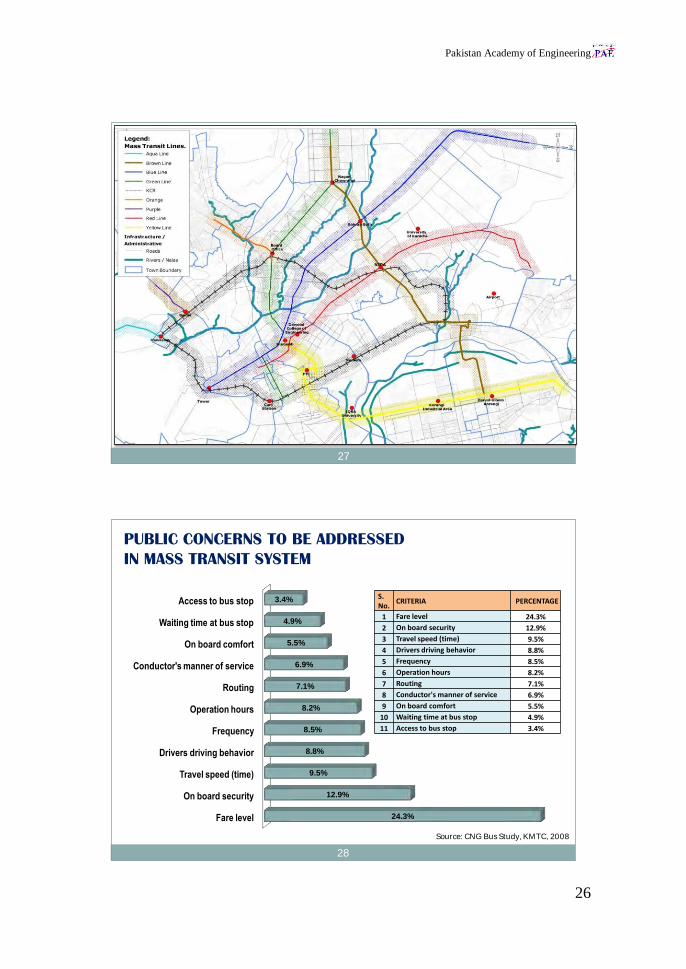
27
Fare level
On board security
Travel speed (time)
Drivers driving behavior
Frequency
Operation hours
Routing
Conductor's manner of service
On board comfort
Waiting time at bus stop
Access to bus stop
24.3%
12.9%
9.5%
8.8%
8.5%
8.2%
7.1%
6.9%
5.5%
4.9%
3.4% S. No.
CRITERIA PERCENTAGE
1 Fare level 24.3%
2 On board security 12.9%
3 Travel speed (time) 9.5%
4 Drivers driving behavior 8.8%
5 Frequency 8.5%
6 Operation hours 8.2%
7 Routing 7.1%
8 Conductor's manner of service 6.9%
9 On board comfort 5.5%
10 Waiting time at bus stop 4.9%
11 Access to bus stop 3.4%
PUBLIC CONCERNS TO BE ADDRESSED
IN MASS TRANSIT SYSTEM
Source: CNG Bus Study, KMTC, 2008
28

Pakistan Academy of Engineering
27
APPROVED PROJECTS
29
Sr.
No.
Mass Transit
Line
Length
in km
Estimated
Cost
(PKR Billion)
StatusSource of
Funding
1. BRT Blue Line 42 30.0 (tentative)RFP on PPP mode
under preparation
KMC under PPP
Arrangement
2. BRT Yellow Line 20.4 15.0
Financial BIDS
opening on
02-Jan-15
KMC Under PPP
Arrangement
3. BRT Green Line 21.1
16.0 (infrastructure)
Rolling Stock
under PPP Mode
PC-I approved by
GOP (04-Dec-14)
Financed by GoP
(Ministry of
Communications)
4. BRT Red Line 24.4To be
ascertainedUnder negotiations
Finance by Asian
Development Bank
5. KCR 43.1
US$ 1.558 Ml
(Sep 09)
US$ 2.609 Ml
(Aug 12)
Appraisal Mission
of JICA awaited
Japan International
Cooperation
Agency (JICA)
APPROVED PROJECTS
30

Pakistan Academy of Engineering
28
Policy and Strategy
31
POLICY STRUCTURE
Travel in Karachi is no longer stressful.
Transport capacity satisfies the demand.
Mass transit is operated.
Road traffic is safe.
Bus service is available in entire Karachi
Road supports economy with minimum environmental impact.
OBJECTIVES / VISION
RESOURCE COMMITMENT
PROJECTS / PROGRAMS
INSTITUTIONAL SETUP
Monitoring
Performance Evaluation
32
Pakistan Academy of Engineering
29
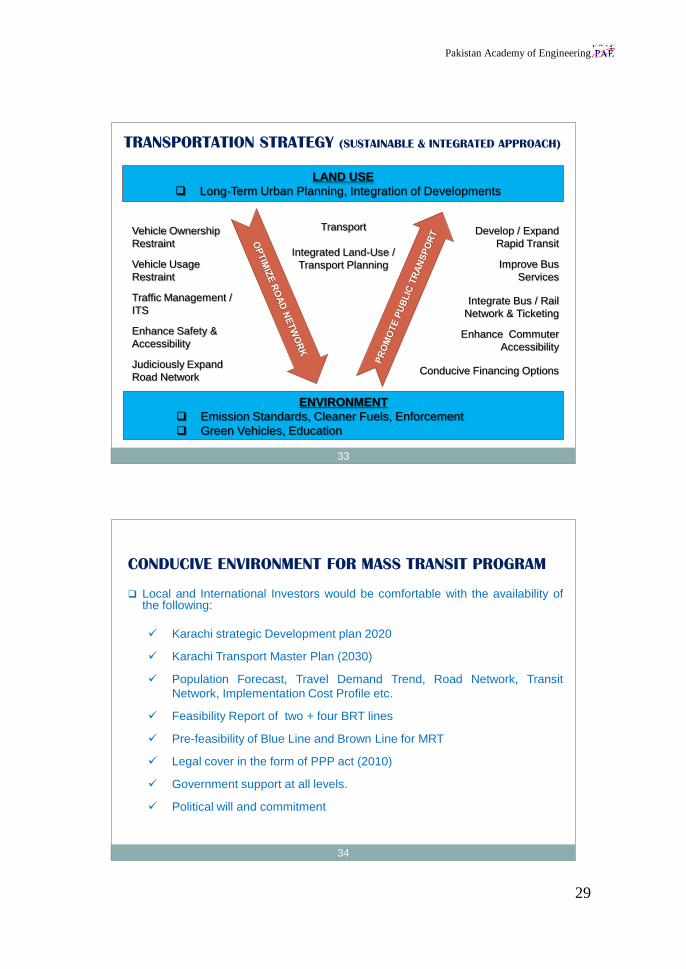
TRANSPORTATION STRATEGY (SUSTAINABLE & INTEGRATED APPROACH)
LAND USE
Long-Term Urban Planning, Integration of Developments
Vehicle Ownership
Restraint
Vehicle Usage
Restraint
Traffic Management /
ITS
Enhance Safety &
Accessibility
Judiciously Expand
Road Network
Develop / Expand
Rapid Transit
Improve Bus
Services
Integrate Bus / Rail
Network & Ticketing
Enhance Commuter
Accessibility
Conducive Financing Options
Transport
Integrated Land-Use /
Transport Planning
ENVIRONMENT
Emission Standards, Cleaner Fuels, Enforcement
Green Vehicles, Education
33
CONDUCIVE ENVIRONMENT FOR MASS TRANSIT PROGRAM
Local and International Investors would be comfortable with the availability ofthe following:
Karachi strategic Development plan 2020
Karachi Transport Master Plan (2030)
Population Forecast, Travel Demand Trend, Road Network, Transit
Network, Implementation Cost Profile etc.
Feasibility Report of two + four BRT lines
Pre-feasibility of Blue Line and Brown Line for MRT
Legal cover in the form of PPP act (2010)
Government support at all levels.
Political will and commitment
34

Pakistan Academy of Engineering
30
THE COST OF TRAFFIC CONGESTION FOR KARACHI Prof. Dr. Mir Shabbar Ali
2
1. INTRODUCTION In the last two decades, rapid growth and urbanization brings precarious issues to the under developing countries. Mainly all these issues are classified as public issues which leads towards drastic impact to the settlements. One of the eminent problems faced by all classes of population is road transportation. The inefficient transportation infrastructure has been the main restraint for the development [1]. The large cities of Pakistan face similar types of congestion problems, and there is no such effort present at the moment that quantifies the amount of monetary losses due to congestion. Although, there are a number of efforts made to accommodate and facilitate the increasing traffic in urban areas but congestion seems to be an unresolved issue. Karachi Metropolitan Corporation (KMC) formerly known as CDGK established a command and control system to monitor traffic flow but the data that has been generated, Lahore Mass Transportation System (BRT) initiated to tackle traffic congestion. Keeping this in view, this research was conducted to investigate the amount of congestion and then quantify it in terms of cost. For this purpose one of the busiest and significantly important road stretch of Karachi were selected which mainly serves the activities associated with an industries and port. The research was designed to ascertain the traffic congestion with a conventional approach. Numbers of traffic parameters were collected through field surveys. This paper contains the description about study area, type of data collected for this study and findings 2. LITERATURE REVIEW 2.1 The problem of traffic congestion in major cities of the world like Karachi is a frequent phenomenon. The traffic congestion tends to prolong and hinder a number of economic activities in the city. The studies on traffic associated issues and threats are examine under different domains such as environment and health. In contrast, economical loss due to traffic is also investigated in a number of ways. Arnott and Small [2] studied and described the undesirable effects of traffic to their environments, like air degradation due to vehicle emission and traffic noise pollution along with the congestion. McKinnon [3] studied the effect of traffic congestion on logistical operations. Goodwin [4] discussed about the transportation management issues for resolution of traffic congestion faced in Europe. Thomson and Bull [5] discussed about the concerns associated with traffic congestion.
2 Department of Urban and Infrastructure Engineering, NED University of Engineering and Technology,
Karachi, 75270, Pakistan

Pakistan Academy of Engineering
31
2.2 A recently released documents show that future commuters using the proposed US29 Western Bypass will save up to 22:30 minutes each day by utilizing the bypass. A comparison of travel times for the year 2040 with and without the Bypass was developed. Table below provides this data. The figure below provides 20 minutes time-speed data. Australian Government, Department of Transport and Regional Service,[6] estimated congestion cost for a year approximately USD 10 billion which comprises operating cost, private time cost and business time cost for all Australian cities. Another research was also conducted for Dhaka city; Bangladesh [7], estimated congestion cost for a year was USD 3.868 billion. This cost comprises environmental, vehicle operating cost, social cost, travel time cost etc. The methodology was based on collecting data regarding travel time, and number of vehicles. Goodwin [8] came up with the findings for UK that economic cost of traffic congestion was approximately USD 30 billion for a year in 2004 and predicted that this may increase up to USD50 billion in 2010. The method used was composed of collecting data for free flow speed, traffic volume, congestion delay and value of time. Congestion cost is also estimated through a simulation the study, Garrido [9] used micro simulation technique to estimate the traffic congestion cost of the Antofagasta, Chile having population of around 0.4 million inhabitants. The study described the simulation procedure and concluded that the average congestion cost of working day is approximately USD 1.02 Million.
DRIVING CYCLE ATTRIBUTES
Test schedule
City Highway High speed AC Cold temp
Trip type Low speeds in stop-and-go urban traffic
Free-flow traffic at highway speeds
Higher speeds; harder
acceleration & braking
AC use under hot ambient
conditions
City test w/colder outside
temperature
Top speed 56 mph 60 mph 80 mph 54.8 mph 56 mph
Average speed
20 mph 48 mph 48 mph 22 mph 20 mph
Max. acceleration
3.3 mph/sec 3.2 mph/sec 8.46 mph/sec 5.1
mph/sec 3.3
mph/sec
Simulated distance
11 mi. 10 mi. 8 mi. 3.6 mi. 11 mi.
Pakistan Academy of Engineering
32
Time 31 min. 12.5 min. 10 min. 9.9 min. 31 min.
Stops 23 None 4 5 23
Idling time 18% of time None 7% of time 19% of
time 18% of
time
Engine start up
a
Cold Warm Warm Warm Cold
Lab temperature
68-86oF 68-86
oF 68-86
oF 95
oF 20
oF
Vehicle air conditioning
Off Off Off On Off
Source: U.S. Department of Energy and U.S. Environmental Protection Agency
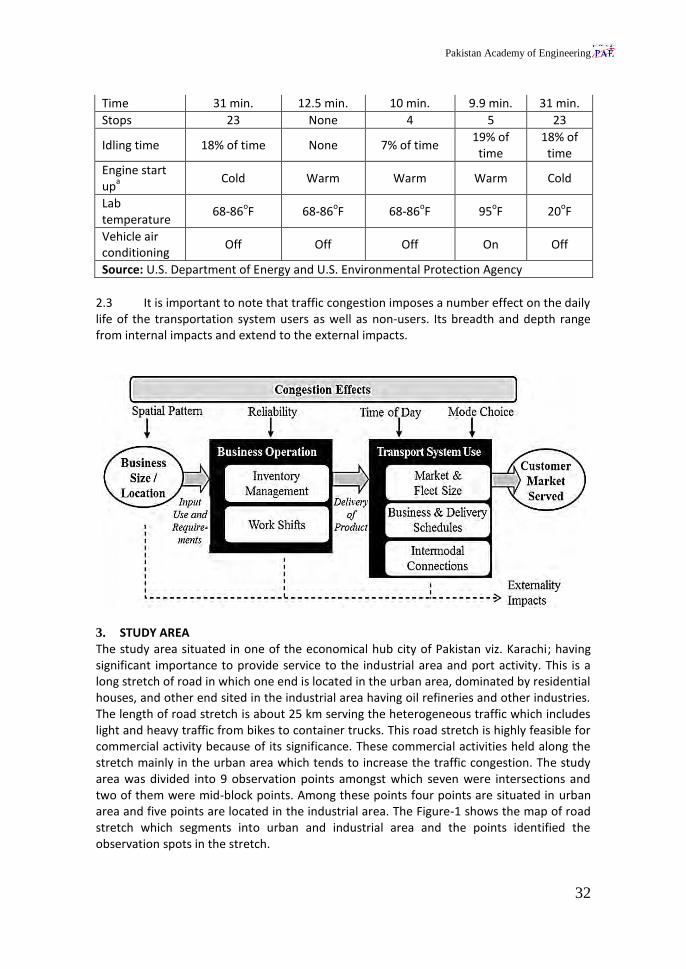
2.3 It is important to note that traffic congestion imposes a number effect on the daily life of the transportation system users as well as non-users. Its breadth and depth range from internal impacts and extend to the external impacts.
3. STUDY AREA The study area situated in one of the economical hub city of Pakistan viz. Karachi; having significant importance to provide service to the industrial area and port activity. This is a long stretch of road in which one end is located in the urban area, dominated by residential houses, and other end sited in the industrial area having oil refineries and other industries. The length of road stretch is about 25 km serving the heterogeneous traffic which includes light and heavy traffic from bikes to container trucks. This road stretch is highly feasible for commercial activity because of its significance. These commercial activities held along the stretch mainly in the urban area which tends to increase the traffic congestion. The study area was divided into 9 observation points amongst which seven were intersections and two of them were mid-block points. Among these points four points are situated in urban area and five points are located in the industrial area. The Figure-1 shows the map of road stretch which segments into urban and industrial area and the points identified the observation spots in the stretch.

Pakistan Academy of Engineering
33
Figure-1: Showing road stretch as Urban Area and Industrial Area
4. DATA COLLECTION AND PROCESSING 4.1 The project methodological framework encompassed the data collection, data processing, data analysis and the final step of congestion estimation and valuation, based on the collected data. For data collection, an instrumented vehicle which was indigenously developed by NED University having mounted video cameras and tracker system was used for traffic volume observations at 9 different locations mentioned above. The data was collected in two time phases, morning and evening, with time interval between 8:00am to 1:00pm and 3:00pm to 8:00pm respectively. The morning and evening data hours were considered so as to record the peak traffic hours. The data at each point was collected for two days in order to counter the effect of the variations. Among these survey points two control points were established. The purpose of these control points was to control the data variation of non-counted hours and to develop an urban and industrial average data throughout the link. The data at control points, Malir Kalaboard and Bin Qasim Intersection, was collected for longer durations with the strategy to extrapolate the data for supplementary intervals. Volume data was characterized into different travel modes such as: Cars, Motorcycles, Rickshaw, Pickup, Buses, Trucks and Trailers, Bicycles and Animal Carts for non-motorized modes of transport. The delay study conducted on the field with the help of same indigenous vehicle running on the road stretch (from Star Gate to Pakistan Steel) to quantify the delay and their reasons. The delay time was calculated based on the definition that total accumulated time of the vehicle for a trip at which the vehicle is travelling below the reference speed. Various reference speeds such as20, 40 and 60km/hr were used for calculation of delay time as literature does not provide any firm guideline regarding the choice of reference speed [8].Special emphasis was given on the accuracy of the delay data which was calculated manually (through average vehicle technique) as well as through Tracker data set. 4.2 Value of time (VOT) is estimated using a socio-economic survey data from the commuters of this road stretch. The socio-economic survey was based on the questionnaire which provides information about commuter’s mode choice and different

Pakistan Academy of Engineering
34
attributes of the travel modes such as travel cost, travel time and waiting time in case of Public and Para transit types of mode. The idea was to estimate VOT of the individuals travelling in different modes using an indirect technique which is based on estimating mode specific utility equations that includes travel time and travel cost parameters, as a part of multinomial logic model form [10].The estimated VOT values are utilized to measure opportunity cost component of traffic congestion. Fuel efficiency and fuel consumption data for different types of modes, prevailing along that road stretch, was gathered to estimate vehicle operating cost component of traffic congestion cost. Equation (1) and (2) represents the expressions utilized to compute opportunity and vehicle operating costs.
𝑂𝐶 = ∑ (𝑉𝑂𝑇𝑚 × 𝐷𝑒𝑙𝑎𝑦𝑚 × 𝑉𝑚 × 𝑉𝑜𝑐𝑐𝑚)𝑚
𝑚=1 Eq. (1)
Where, OC= Opportunity Cost of traffic congestion, 𝑉𝑂𝑇𝑚= Value of time for specific mode m, 𝐷𝑒𝑙𝑎𝑦𝑚=travel delay in time units observed for mode m (estimated at some reference speed),𝑉𝑚=number of vehicles of type m per day, 𝑉𝑜𝑐𝑐𝑚= Average vehicle occupancy for specific mode m.
𝑉𝑂𝐶 = 𝐿 ∗ ∑ (𝐹𝐶𝑚 × 𝐷𝑒𝑙𝑎𝑦𝑚 × 𝑉𝑚)𝑚
𝑚=1 Eq. (2)
Where, VOC= Vehicle operating Cost, 𝐹𝐶𝑚= Fuel cost in Rs/hr for specific mode m, 𝑉𝑚 and 𝐷𝑒𝑙𝑎𝑦𝑚 have the same meaning mentioned earlier and L= length of stretch in km. Where, 𝐹𝐶𝑚is calculated using equation (3).
𝐹𝐶𝑚 = ∑ (𝐹𝑐𝑞𝑚𝐹𝑡 × 𝐹𝑝𝐹𝑡 × 𝜇𝐹𝑡)3
𝐹𝑡=1
Eq.(3)
Where, 𝐹𝑐𝑞𝑚= Fuel consumption quantity in litres/km or kg/km of specific mode m, 𝐹𝑝𝐹𝑡= fuel price of specific fuel typesFt = 1, 2 and 3 such as CNG, Gasoline and Diesel, respectively in Rs. / liter or Rs/kg.𝜇𝐹𝑡=proportion of specific mode type m using a particular fuel type for travelling on that road stretch.
5. RESULTS AND DISCUSSION 5.1 The collected data was compiled according to the parameters described in equations (1), (2) and (3). The average values of the volume collected at 9 different locations are given in Table-1. As the survey data was gathered only for 16 hours of the day, these values are adjusted to represents values for a single average day. Some past studies results were utilized to derive those adjustment factors. In addition to this, Table-1 also provides observed values of vehicle occupancy for each different type of mode travelling on the stretch of the segment. The travel mode, bike (motorcycles) contributed largely to the traffic stream compared to all other vehicle types. The presence of significant amount of bikes is mainly due to the inconvenient public transport system prevailing in Karachi. There is also significant numbers of Trucks present in the traffic stream because of the type of land use in the neighborhood of this road stretch. Large numbers of industries are located nearby and also this road provides access to a major seaport in Karachi. Due to this fact significant number of office Vans (privately hired vehicle such as coasters and Hiace) are

Pakistan Academy of Engineering
35
also seen frequently during peak hours; which carries passengers from the residence to the industries and vice versa. It is interesting to note that the average vehicle occupancy of car obtained was low compared to its seating capacity. This is because most of the commuters which are using car for their own travel. Figure-2 further describes the percentage of different modes present in the stream.
Table-1: Classified volume and vehicle occupancy
Modes Volume(veh/ day) Vehicle Occupancy
Car 2970 2.2
Taxi 481 3.2
Office Van 978 13
Three Wheeler 432 2
Bike 3419 1.2
Public Transport 1334 38
Truck 1188 4
Figure- 2: Mode percentage share in the traffic stream
5.2 Table-2 describes the average speed of classified modes on that road stretch. The road is classified as major urban arterial road, which basically fulfills the purpose of mobility and the design speed is around 110 km/hr. The average speed of the road clearly depicting the prevailing condition of the arterial that is partly due to the deteriorated pavement structure and partly due to the increased demand, both of these factors in combination creating frequent traffic jams along the road stretch. Table-2 also shows estimated travel delays for each representative travel mode at two reference speeds (i.e. 20km/hr and 30km/hr). The table demonstrates that the delay of a particular mode is directly proportional but the increment of delay is not similar among the modes which describe the mobility characteristic of that mode. It may be clearly observed from that the table the bike has less delay and truck has the largest delay in both the reference speed, which in mainly due to their size.
Car 27%
Taxi 4%
Office Van 10% Three
Wheeler 4%
Bike 30%
Public Transport
13%
Truck 12%
PERCENTAGE SHARE OF MODE

Pakistan Academy of Engineering
36
Table-2: Average speed and average delay under reference speed
Modes Average Speed
(km/ hr) Avg. Delay (Min/ Veh)
at ref. speed 20kph Avg. Delay (Min/ Veh)
at ref. speed 30kph
Car 50 8 10
Taxi 45 8 11
Office Van 42 9.5 12.4
Three Wheeler 28 6.5 8.3
Bike 35 4 4.6
Public Transport
29 13.9 19.3
Truck 26 16.8 25
5.3 The value of time was also estimated in this study using an indirect approach, more details of this can be seen in Adnan et al [11], however, VOT values are shown with respect to mode users in Table-3. Average fuel consumption quantity of classified modes and their proportions (i.e.µ1,µ2, µ3)are also shown in same table. Fuel consumption quantities are estimated by running various test vehicles of same mode type on the road stretch. The proportions of vehicles using different fuel type is determined based on physical examination of various travel modes based on sample size of 300 vehicle of each mode type. 5.4 The results shown in the Table 1, 2 and 3 are utilized in quantifying the level of congestion and traffic congestion cost using equations (1), (2) and (3). As shown in the Table-2 above, time loss for average vehicle type is approximately 10minutes/trip using conservative definition of delay (i.e. 20km/hr reference speed) along with the volume of traffic which is 60,000 vehicles/day. On these bases, total delay was found out to be 600,000 minutes/day which is nearly 410 days/day. The Level of Service (LOS) for this stretch was fond out to be D. The free flow travel time for the stretch, was 17 minutes, but in actual circumstances average travel time per average vehicle is found to be 30minutesfor the complete stretch of road which is around 21km. The per trip additional time as associated to the free flow speed is approximately 175%of the free flow travel time, which provides travel time index value as 1.75. Furthermore, a very interesting fact is that the free flow speed is hardly achievable on this track at any time of the day.
Table-3. Vehicle classified VOT with µ-factor and fuel consumption quantity
Modes VOT (Rs/hr)
µ1 µ2 µ3 FcqCNG
(kg/km)
FcqGasoline
(lt/km)
FcqDiesel
(lt/km)
Car 87 0.56 0.44 - 17-19 10-12 -
Taxi 80 0.63 0.37 - 18-20 10-12 -
Office Van 75 0.57 0.43 - 10-11 7-8 -
Three Wheeler 60 0.79 0.21 - 28-30 25 -
Bike 44 - 1 - - 55-60 -
Public Transport
34 0.59 - 0.41 6-8 -
2-4
Truck 35 - - 1 - - 1-2
Pakistan Academy of Engineering
37
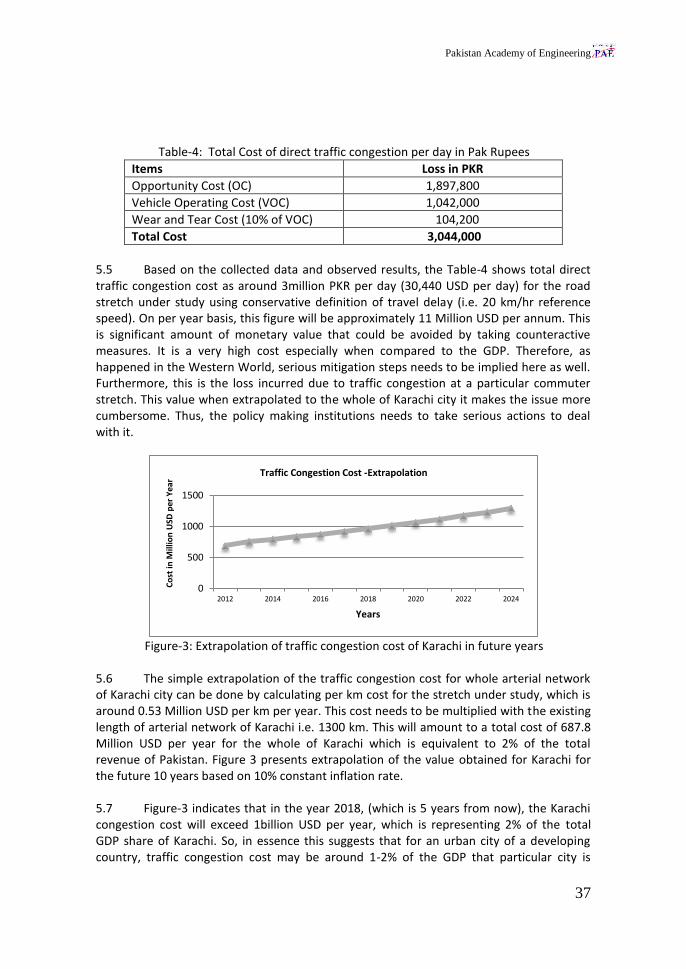
Table-4: Total Cost of direct traffic congestion per day in Pak Rupees
Items Loss in PKR
Opportunity Cost (OC) 1,897,800
Vehicle Operating Cost (VOC) 1,042,000
Wear and Tear Cost (10% of VOC) 104,200
Total Cost 3,044,000
5.5 Based on the collected data and observed results, the Table-4 shows total direct traffic congestion cost as around 3million PKR per day (30,440 USD per day) for the road stretch under study using conservative definition of travel delay (i.e. 20 km/hr reference speed). On per year basis, this figure will be approximately 11 Million USD per annum. This is significant amount of monetary value that could be avoided by taking counteractive measures. It is a very high cost especially when compared to the GDP. Therefore, as happened in the Western World, serious mitigation steps needs to be implied here as well. Furthermore, this is the loss incurred due to traffic congestion at a particular commuter stretch. This value when extrapolated to the whole of Karachi city it makes the issue more cumbersome. Thus, the policy making institutions needs to take serious actions to deal with it.
Figure-3: Extrapolation of traffic congestion cost of Karachi in future years
5.6 The simple extrapolation of the traffic congestion cost for whole arterial network of Karachi city can be done by calculating per km cost for the stretch under study, which is around 0.53 Million USD per km per year. This cost needs to be multiplied with the existing length of arterial network of Karachi i.e. 1300 km. This will amount to a total cost of 687.8 Million USD per year for the whole of Karachi which is equivalent to 2% of the total revenue of Pakistan. Figure 3 presents extrapolation of the value obtained for Karachi for the future 10 years based on 10% constant inflation rate. 5.7 Figure-3 indicates that in the year 2018, (which is 5 years from now), the Karachi congestion cost will exceed 1billion USD per year, which is representing 2% of the total GDP share of Karachi. So, in essence this suggests that for an urban city of a developing country, traffic congestion cost may be around 1-2% of the GDP that particular city is
0
500
1000
1500
2012 2014 2016 2018 2020 2022 2024
Co
st in
Mill
ion
USD
per
Yea
r
Years
Traffic Congestion Cost -Extrapolation
Pakistan Academy of Engineering
38
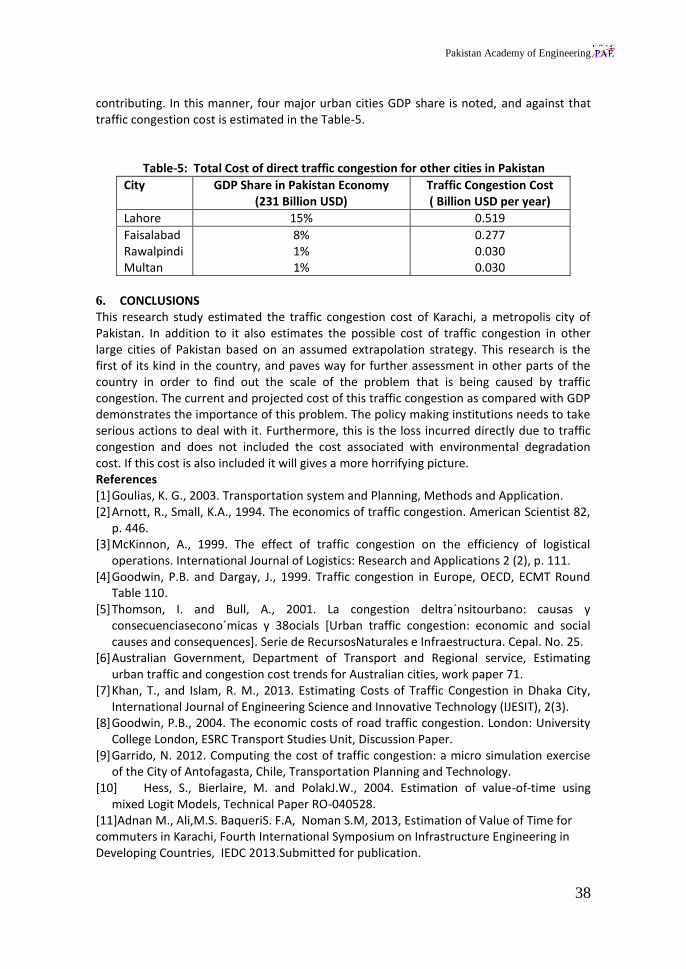
contributing. In this manner, four major urban cities GDP share is noted, and against that traffic congestion cost is estimated in the Table-5.
Table-5: Total Cost of direct traffic congestion for other cities in Pakistan
City GDP Share in Pakistan Economy (231 Billion USD)
Traffic Congestion Cost ( Billion USD per year)
Lahore 15% 0.519
Faisalabad Rawalpindi Multan
8% 1% 1%
0.277 0.030 0.030
6. CONCLUSIONS This research study estimated the traffic congestion cost of Karachi, a metropolis city of Pakistan. In addition to it also estimates the possible cost of traffic congestion in other large cities of Pakistan based on an assumed extrapolation strategy. This research is the first of its kind in the country, and paves way for further assessment in other parts of the country in order to find out the scale of the problem that is being caused by traffic congestion. The current and projected cost of this traffic congestion as compared with GDP demonstrates the importance of this problem. The policy making institutions needs to take serious actions to deal with it. Furthermore, this is the loss incurred directly due to traffic congestion and does not included the cost associated with environmental degradation cost. If this cost is also included it will gives a more horrifying picture. References [1] Goulias, K. G., 2003. Transportation system and Planning, Methods and Application. [2] Arnott, R., Small, K.A., 1994. The economics of traffic congestion. American Scientist 82,
p. 446. [3] McKinnon, A., 1999. The effect of traffic congestion on the efficiency of logistical
operations. International Journal of Logistics: Research and Applications 2 (2), p. 111. [4] Goodwin, P.B. and Dargay, J., 1999. Traffic congestion in Europe, OECD, ECMT Round
Table 110. [5] Thomson, I. and Bull, A., 2001. La congestion deltra´nsitourbano: causas y
consecuenciasecono´micas y 38ocials [Urban traffic congestion: economic and social causes and consequences]. Serie de RecursosNaturales e Infraestructura. Cepal. No. 25.
[6] Australian Government, Department of Transport and Regional service, Estimating urban traffic and congestion cost trends for Australian cities, work paper 71.
[7] Khan, T., and Islam, R. M., 2013. Estimating Costs of Traffic Congestion in Dhaka City, International Journal of Engineering Science and Innovative Technology (IJESIT), 2(3).
[8] Goodwin, P.B., 2004. The economic costs of road traffic congestion. London: University College London, ESRC Transport Studies Unit, Discussion Paper.
[9] Garrido, N. 2012. Computing the cost of traffic congestion: a micro simulation exercise of the City of Antofagasta, Chile, Transportation Planning and Technology.
[10] Hess, S., Bierlaire, M. and PolakJ.W., 2004. Estimation of value-of-time using mixed Logit Models, Technical Paper RO-040528.
[11]Adnan M., Ali,M.S. BaqueriS. F.A, Noman S.M, 2013, Estimation of Value of Time for commuters in Karachi, Fourth International Symposium on Infrastructure Engineering in Developing Countries, IEDC 2013.Submitted for publication.

Pakistan Academy of Engineering
39
PRESENTATION
Presentation Outlook
• Understanding the real issue
• Devising Methodology to gather information
• Data processing and results
• Macro scale results
• Conclusion and way forward
Department of Urban and Infrastructure
Engineering2
3
Department of Urban and Infrastructure Engineering
Significance of the issue
– How much these
frequent traffic jams
cost to society?
– Numbers required for
appropriate decision
making
– Realize cost impacts,
and consequences if
remedial measures are
not taken.

Pakistan Academy of Engineering
40
Economics of Traffic Congestion
• Urban traffic congestion imposes economic
costs which may expand outside metropolis
• business costs affects productivity and
output levels
• Industry sector is sensitive to traffic
congestion
• Transportation-based market area has
dependence on access to skilled labor,
access to specialized inputs.Department of Urban and Infrastructure Engineering 5

Pakistan Academy of Engineering
41
Traffic Congestion Cost
Beneficial for industries to ascertain
the role of traffic congestion in their
overall costing/budgeting
Effectiveness of congestion reduction
strategies can be identified.
Tax and Tariff rationalization
Urban development policy framework
Department of Urban and Infrastructure
Engineering6
DRIVING CYCLE ATTRIBUTESCity Highway High speed AC Cold temp
Trip typeLow speeds in stop-
and-go urban traffic
Free-flow
traffic at
highway
speeds
Higher
speeds;
harder
acceleration
& braking
AC use under
hot ambient
conditions
City test
w/colder
outside
temperature
Top speed 56 mph 60 mph 80 mph 54.8 mph 56 mph
Average speed 20 mph 48 mph 48 mph 22 mph 20 mph
Max.
acceleration3.3 mph/sec 3.2 mph/sec
8.46
mph/sec5.1 mph/sec
3.3
mph/sec
Simulated
distance11 mi. 10 mi. 8 mi. 3.6 mi. 11 mi.
Time 31 min. 12.5 min. 10 min. 9.9 min. 31 min.
Stops 23 None 4 5 23
Idling time 18% of time None 7% of time 19% of time18% of
time
Engine startupa Cold Warm Warm Warm Cold
Lab temperature 68-86oF 68-86 oF 68-86 oF 95 oF 20 oF
Vehicle air
conditioningOff Off Off On Off
Source: U.S. Department of Energy and U.S. Environmental Protection Agency

Pakistan Academy of Engineering
42
• Roadway Demand/Flow Level
• Roadway Geometric and Driver Characteristics
Traffic Congestion
•More than anticipated time for Journey
Travel Delays
• Opportunity Cost/ Lost Business
• Social CostEconomic
Cost
8
Department of Urban and Infrastructure Engineering
Research Methodology
JINNAH TERMINAL
MALIR HALT
MALIR
KALABOARDMALIR 15
QUAIDABAD
Y B CHORANGIFAST UNI STOP
BIN QASIM ROAD
PAKISTAN STEEL
9
Department of Urban and Infrastructure Engineering
Study Area
Sharea Faisal from Star gate intersection-Pakistan Steel intersection

Pakistan Academy of Engineering
43
7 INTERSECTIONS HOURS
STAR GATE 12
MALIR HALT 12
MALIR KALABOARD 16
MALIR 15 12
QUAIDABAD 12
MANZIL PUMP 12
FAST UNIVERSITY 12
PORT QASIM 16
PAKISTAN STEEL 12
9 SURVEY POINTS
2 MIDLINKS HOURS
QUAIDABAD 12
FAST UNIVERSITY 12
2 CONTROL POINTS
DATA WAS COILLECTED FOR 2
DAYS AT EACH POINT
Volume Data Collection
– Ascertaining the level of congestion
through key traffic parameters of a
selected road of Karachi
– Quantification of the cost of congestion
as a general estimate incorporating all
road users.
11
Department of Urban and Infrastructure Engineering
Key Deliverablesof the Research Project

Pakistan Academy of Engineering
44
Volume Data Collection
12
Method Used
-Instrumented Vehicle based video recording at
selected points
-2 control points are established where data
was collected for 16 hours (0800-2300hrs)
-10 hours data with the split of morning (0800-
1300hrs) and evening (1500-2000hrs)rush hours
at all locations except control points.
-Volume data were also collected during Ramadan at
control points.
-To capture effects of increased oil tanker movements,
this data was collected again at various spots of the
stretch.
Department of Urban and Infrastructure Engineering
INSTRUMENTED VEHILCE WAS USED FOR THIS PURPOSE
1. VOLUMETRIC COUNT
Volume Data Collection
Pakistan Academy of Engineering
45
14
Department of Urban and Infrastructure Engineering
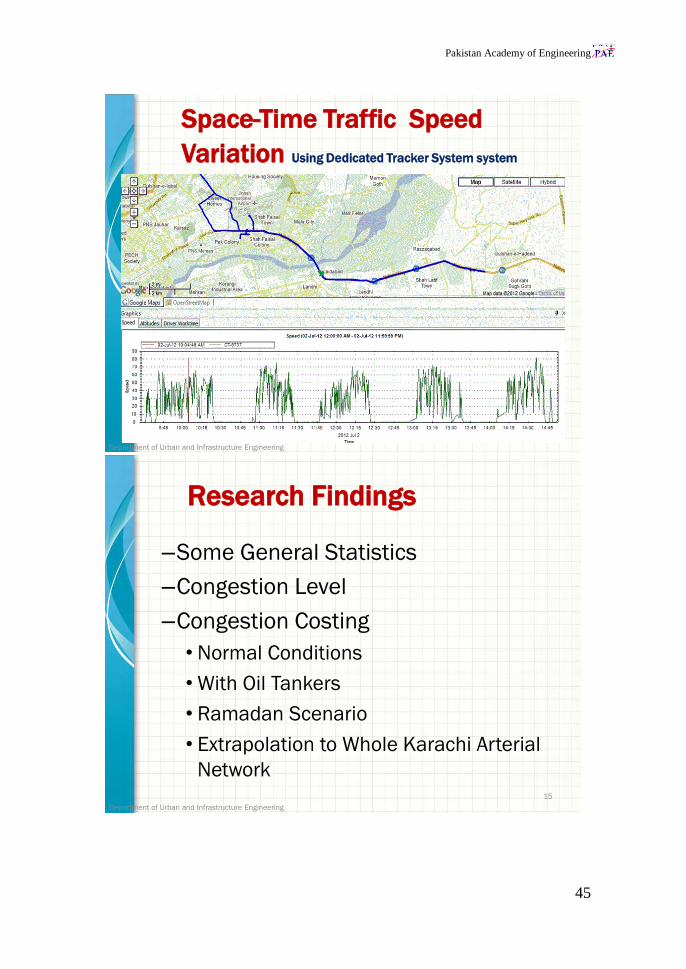
Space-Time Traffic Speed
Variation Using Dedicated Tracker System system
15
Department of Urban and Infrastructure Engineering
Research Findings
–Some General Statistics
–Congestion Level
–Congestion Costing
• Normal Conditions
• With Oil Tankers
• Ramadan Scenario
• Extrapolation to Whole Karachi Arterial
Network

Pakistan Academy of Engineering
46
Transport Modes Distribution
(Over the stretch length)
Department of Urban and Infrastructure Engineering 16
Car , 30%
Taxi, 8%
Office
Vans, 7%
Three –
Wheeler,
4%
Bike, 28%
Public
Transport
, 14%
Heavy
Vehicles
(Trucks),
8%
Car , 28%
Taxi,
5%
Office
Vans,
8%Three –
Wheeler,
1%
Bike,
7%
Public
Transport
, 12%
Heavy
Vehicles
(Trucks),
38%
ModesVolume
(veh/ day)
Vehicle
Occupancy
Car 2970 2.2
Taxi 481 3.2
Office Van 978 13
Three Wheeler 432 2
Motorcycle 3419 1.2
Public
Transport
1334 38
Truck 1188 4
Traffic Volume
and vehicle occupancy
Pakistan Academy of Engineering
47
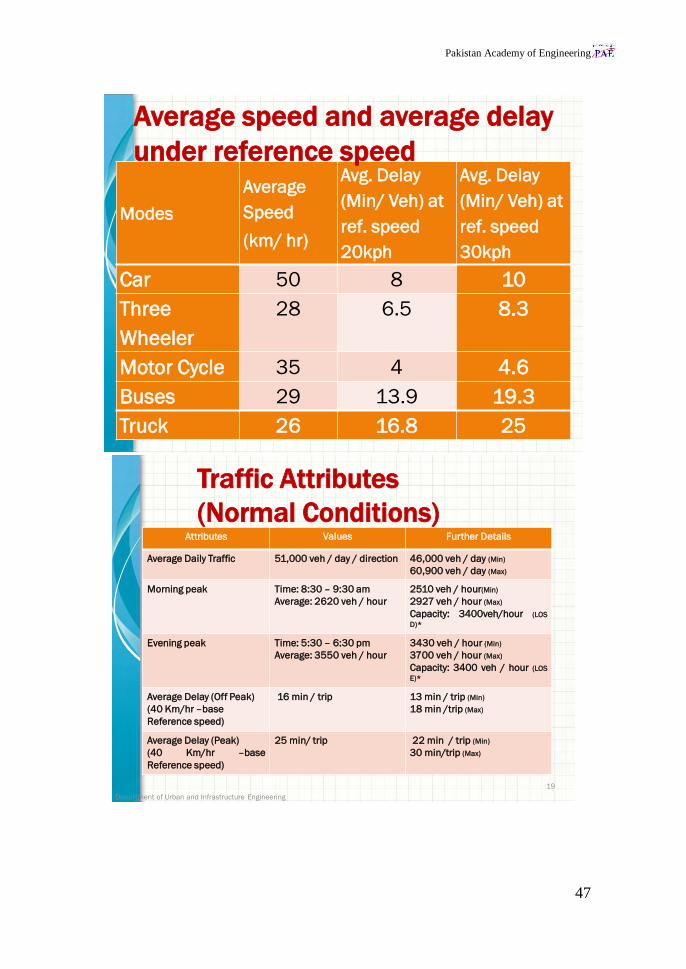
Modes
Average
Speed
(km/ hr)
Avg. Delay
(Min/ Veh) at
ref. speed
20kph
Avg. Delay
(Min/ Veh) at
ref. speed
30kph
Car 50 8 10
Three
Wheeler
28 6.5 8.3
Motor Cycle 35 4 4.6
Buses 29 13.9 19.3
Truck 26 16.8 25
Average speed and average delay
under reference speed
19
Traffic Attributes
(Normal Conditions)Attributes Values Further Details
Average Daily Traffic 51,000 veh / day / direction 46,000 veh / day (Min)
60,900 veh / day (Max)
Morning peak Time: 8:30 – 9:30 am
Average: 2620 veh / hour
2510 veh / hour(Min)
2927 veh / hour (Max)
Capacity: 3400veh/hour (LOS
D)*
Evening peak Time: 5:30 – 6:30 pm
Average: 3550 veh / hour
3430 veh / hour (Min)
3700 veh / hour (Max)
Capacity: 3400 veh / hour (LOS
E)*
Average Delay (Off Peak)
(40 Km/hr –base
Reference speed)
16 min / trip 13 min / trip (Min)
18 min /trip (Max)
Average Delay (Peak)
(40 Km/hr –base
Reference speed)
25 min/ trip 22 min / trip (Min)
30 min/trip (Max)
Department of Urban and Infrastructure Engineering

Pakistan Academy of Engineering
48
Congestion Level
• Free-Flow Travel Time of the stretch has been
found as 17 minutes, corresponding to 70 km/hr
travel speed. (Design speed of the stretch is more
than 100 km/hr).
• Travel Time Index (TTI) has been estimated as
around 1.75 ~ 1.95, corresponding to avg. travel
time of more than 30 minutes.
• Roadway Congestion Index (RCI) was found as
2.36 for overall stretch.
Department of Urban and Infrastructure Engineering 20
Congestion Cost
Estimation
Department of Urban and Infrastructure Engineering 21

Pakistan Academy of Engineering
49
ECONOMIC COST
ECONOMIC COST
DIRECT COST INDIRECT COST
Cost beared directly by
the user
• Opportunity Cost
• Vehicle Operating Cost
• Cost incurred to
industries (loss in
business)
• Social cost
• Noise pollution
Project Focus
Economic COST
Department of Urban and Infrastructure Engineering
Vehicle operating cost
Congestion cost estimation
framework
Fuel Consumption (liters/km)
Opportunity cost

Pakistan Academy of Engineering
50
Value of Time (VOT)
Department of Urban and Infrastructure Engineering 24
Transport Mode Average Income
Group
Rs.
Avg. Value of
time (VOT)
Rs./hr
% in Sample Size
Car 50,000 – 80,000 87 10%
Taxi 50,000 – 80,000 80 5%
Office Van 30,000 – 50,000 75 48%
Motor Cycle 10,000 – 30,000 44 10%
Public
Transport
< 10,00034
25%
Truck 10,000-15,000 35 1%
Average 70.1
(0.7 US$)Value of time for India = 0.75 US$
Value of time for Bangladesh = 0.72 US$
Vehicle Operating Cost
• VOC is considered only in terms of fuel consumption.
• Fuel consumption parameters were gathered for different modes in terms of the following: – Vehicle fuel consumption in terms of Kg/Km and
Liters/km
– Estimated proportion of vehicles using different types of fuels such as CNG, Gasoline (Patrol) and Deisel
– Fuel Prices (Rs. /kg) or (Rs. /liter)
Department of Urban and Infrastructure
Engineering25

Pakistan Academy of Engineering
51
Modes VOT
(Rs/hr)
Car 87
Taxi 80
Office Van 75
Three Wheeler 60
Bike 44
Public Transport 34
Truck 35
Vehicle classified Value of time
Items Loss in PKR
Opportunity Cost (OC) 1,897,800
Vehicle Operating Cost
(VOC)
1,042,000
Wear and Tear Cost
(10% of VOC)
104,200
Total Cost 3,044,000
Total Cost of traffic congestion per
day in Pak Rupees

Pakistan Academy of Engineering
52
Spot Contributions
S.
NoSpot Reason
Current
Contribution
(Million
PKR/Day)
Impact After
5 Years
(Million
PKR/Day)
1Malir 15
Intersection
Encroachment,
Improper Traffic
Management
2.51 3.35
2 Railway Crossing
Access point,
Manual Traffic
Management
0.68 1.02
3
Illegal Parking of
Oil Tanker near
Port Qasim
Encroachment,
Lane blocking3.09 20.6
4Encroachment at
Ganchi Market
Encroachment
Decrease in ROW0.26 0.65
Department of Urban and Infrastructure Engineering28
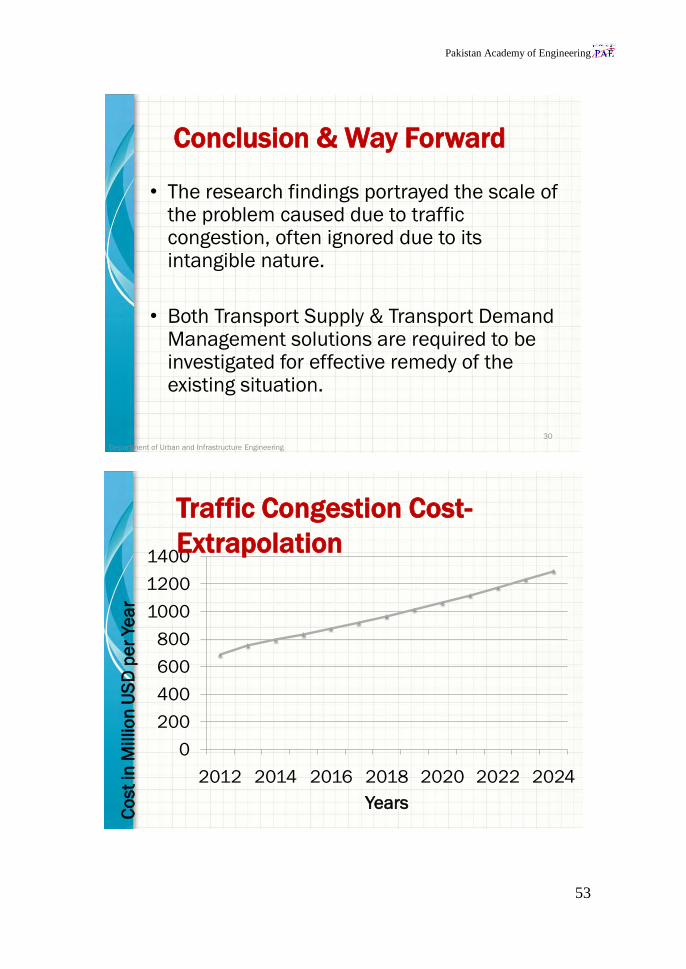
Karachi Congestion Cost-
Extrapolated• According to results obtained from this study, per km
cost of traffic congestion is around 0.51 million PKR /day, which is significantly high.
• If extrapolation is made for the whole Karachi metropolitan (for arterial stretch of around 1300 km) this will surpass the figure of 663 Million PKR per day (annually around 2.5 Billion US dollars).
• This suggests that authorities need to find feasible solutions to reduce this cost, which is in principle non-tangible cost and easily avoidable.
Department of Urban and Infrastructure Engineering
29
Pakistan Academy of Engineering
53
Conclusion & Way Forward
• The research findings portrayed the scale of the problem caused due to traffic congestion, often ignored due to its intangible nature.
• Both Transport Supply & Transport Demand Management solutions are required to be investigated for effective remedy of the existing situation.
Department of Urban and Infrastructure Engineering
30
0
200
400
600
800
1000
1200
1400
2012 2014 2016 2018 2020 2022 2024
Co
st
in M
illio
n U
SD
pe
r Ye
ar
Years
Traffic Congestion Cost-
Extrapolation
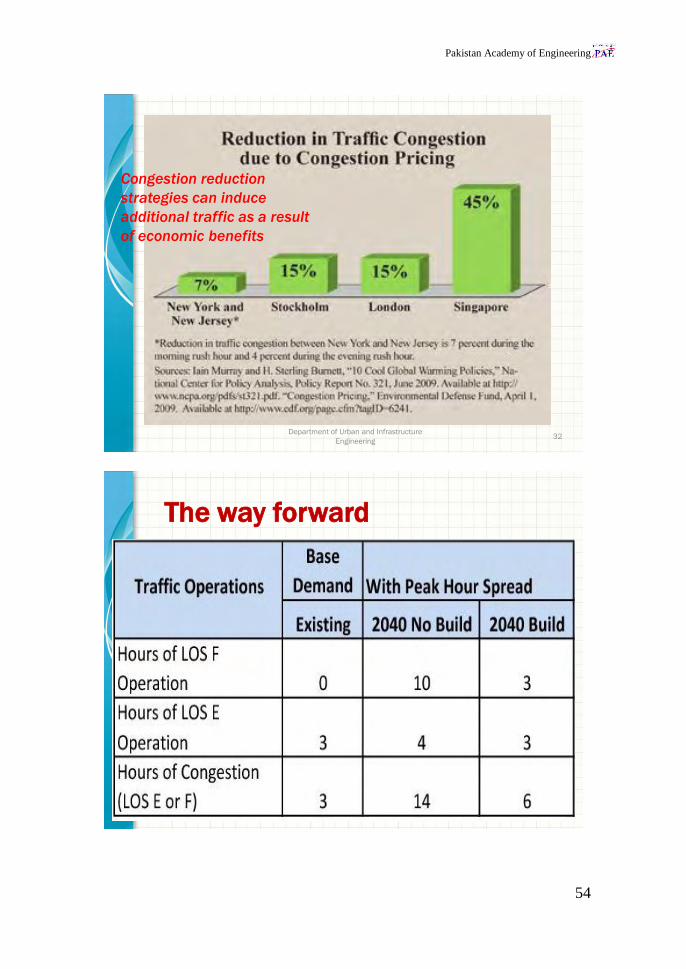
Pakistan Academy of Engineering
54
Department of Urban and Infrastructure
Engineering32
Congestion reduction
strategies can induce
additional traffic as a result
of economic benefits
The way forward
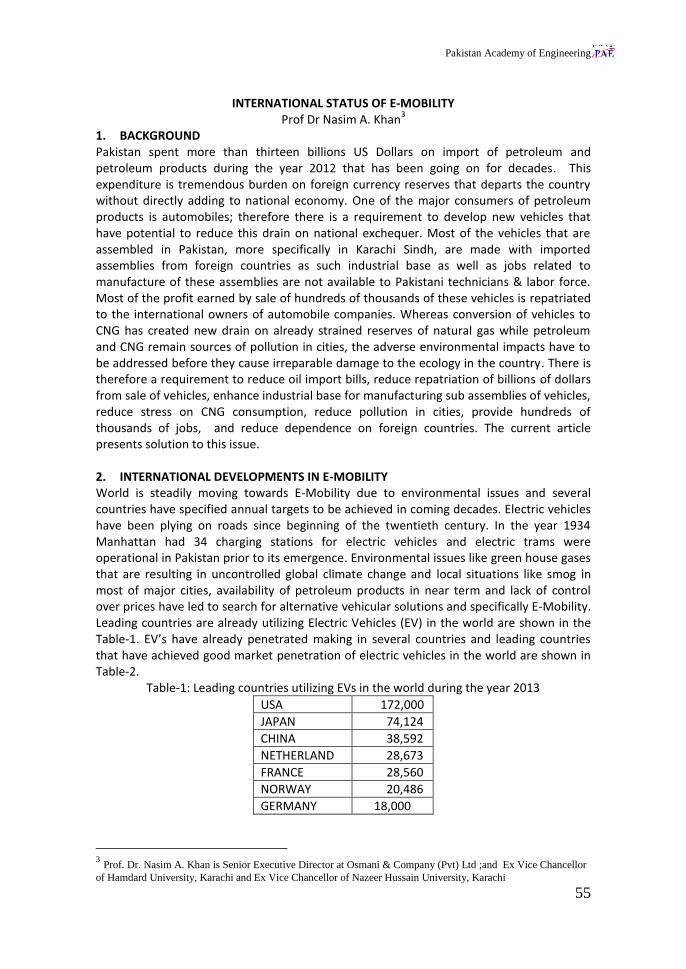
Pakistan Academy of Engineering
55
INTERNATIONAL STATUS OF E-MOBILITY Prof Dr Nasim A. Khan
3
1. BACKGROUND Pakistan spent more than thirteen billions US Dollars on import of petroleum and petroleum products during the year 2012 that has been going on for decades. This expenditure is tremendous burden on foreign currency reserves that departs the country without directly adding to national economy. One of the major consumers of petroleum products is automobiles; therefore there is a requirement to develop new vehicles that have potential to reduce this drain on national exchequer. Most of the vehicles that are assembled in Pakistan, more specifically in Karachi Sindh, are made with imported assemblies from foreign countries as such industrial base as well as jobs related to manufacture of these assemblies are not available to Pakistani technicians & labor force. Most of the profit earned by sale of hundreds of thousands of these vehicles is repatriated to the international owners of automobile companies. Whereas conversion of vehicles to CNG has created new drain on already strained reserves of natural gas while petroleum and CNG remain sources of pollution in cities, the adverse environmental impacts have to be addressed before they cause irreparable damage to the ecology in the country. There is therefore a requirement to reduce oil import bills, reduce repatriation of billions of dollars from sale of vehicles, enhance industrial base for manufacturing sub assemblies of vehicles, reduce stress on CNG consumption, reduce pollution in cities, provide hundreds of thousands of jobs, and reduce dependence on foreign countries. The current article presents solution to this issue. 2. INTERNATIONAL DEVELOPMENTS IN E-MOBILITY World is steadily moving towards E-Mobility due to environmental issues and several countries have specified annual targets to be achieved in coming decades. Electric vehicles have been plying on roads since beginning of the twentieth century. In the year 1934 Manhattan had 34 charging stations for electric vehicles and electric trams were operational in Pakistan prior to its emergence. Environmental issues like green house gases that are resulting in uncontrolled global climate change and local situations like smog in most of major cities, availability of petroleum products in near term and lack of control over prices have led to search for alternative vehicular solutions and specifically E-Mobility. Leading countries are already utilizing Electric Vehicles (EV) in the world are shown in the Table-1. EV’s have already penetrated making in several countries and leading countries that have achieved good market penetration of electric vehicles in the world are shown in Table-2.
Table-1: Leading countries utilizing EVs in the world during the year 2013
USA 172,000
JAPAN 74,124
CHINA 38,592
NETHERLAND 28,673
FRANCE 28,560
NORWAY 20,486
GERMANY 18,000
3 Prof. Dr. Nasim A. Khan is Senior Executive Director at Osmani & Company (Pvt) Ltd ;and Ex Vice Chancellor
of Hamdard University, Karachi and Ex Vice Chancellor of Nazeer Hussain University, Karachi

Pakistan Academy of Engineering
56
Table-2: Market penetration of Electric Vehicles in the first ten leading countries of the world during the year 2013
Ranking Country EV Market Share (%)
1 Norway 5.75%
2 Netherlands 0.83%
3 France 0.79%
4 Estonia 0.73%
5 Iceland 0.69%
6 Japan 0.51%
7 Switzerland 0.39%
8 Sweden 0.30%
9 Denmark 0.28%
10 USA 0.28%
3. NATIONAL STRATEGIES OF SOME COUNTRIES IN THE DEVELOPMENT OF E-MOBILITY 3.1 Most of the countries shown in the tables earlier have clearly defined national strategy to ensure reduction in Green House Gases and dependence on petroleum products. Some of the initiatives are highlighted in North America, Europe and Asia, which indicate that E-Mobility is going to dominate the international market in the next decade. In the year 2011 President of USA set the goal for the U.S. to become the first country to have 1 million electric vehicles on the road by 2015. In September 2014, the Charge Ahead California Initiative set the additional goal to have at least 1 million zero-emission vehicles and near-zero-emission vehicles in California by the year 2023. 3.2 Germany launched a campaign to put 1 million electric cars on the road by 2020, making battery research a priority as it tries to position the country as a market leader and reserving $705 million in stimulus package. The plan has been approved by the German Cabinet with a aim to make Germany into the market leader for electric mobility. One million EV is the target by 2020. 3.3 South Korean government plans to produce 1.2 million electric vehicles a year by 2015. The South Korean government’s Ministry of Environment is providing a $13,900 nationwide subsidy for EV purchases, and 10 major cities or provincial jurisdictions are providing additional subsidies ranging from $2,800 to $7,400. 4. TECHNOLOGIES INVOLVED The technologies involved in manufacturing in Electric Vehicles mainly include batteries, motors, drive transmission systems, brake system, steering system, vehicle lighting system, vehicle suspension system, wheels, tires and frame. Although efforts to assemble and manufacture vehicles locally were on since Pakistan’s emergence it picked up momentum after creation of Pakistan Automobile Corporation (PACO) a Government body. PACO was also tasked to ensure gradual deletion of components that resulted in large indigenous manufacturing base in the country. That clearly highlights Public Sector Intervention in development of technologies backed by proper legislation. The presence of a dedicated Public Sector organization also resulted in confidence in sub contractors to fabricate components required by PACO indirectly resulting in influx of finances essential for development of any technology stretch all over the country.

Pakistan Academy of Engineering
57
4. GRADUAL SHIFT TO E-MOBILITY E-Mobility is synonymous with several new words in the dictionary; Battery Electric Vehicle (BEV), Hybrid Electric Vehicle (HEV), Plug-in Hybrid Vehicle (PHV), Neighborhood Electric Vehicle (NEV) and Hydrogen Fuel Cell Vehicle (HFCV). The options available indicate whether the vehicle can be charged from stationary source like Charging Stations and most of the vehicles except NEV are designed for long travel distances with high performance. Whenever the issue of vehicle utilization arises the mind directly jumps to high performance vehicles basically meant to meet the requirements of those who can afford luxury. The MINDSET has to be changed at the first instance; shift to high performance vehicles should be deferred at this stage in comparison with low cost low performance NEV’s like auto rickshaw, black and yellow cabs, vans, pickups, etc. The number of taxis & rickshaws registered in Karachi are shown in Figure-1.
Figure-1. Taxis and Rickshaws registered in Karachi
Another potential electric vehicle is motorcycle. Figure-2 shows registered motor cycles. Conversion of gasoline motorcycles to battery/ electrically charged motorcycles is anticipated to follow very quickly as it makes tremendous economic sense.
Figure-2. Growth trend of Motor cycles registered in Karachi
5. UTILIZATION PATTERN OF AUTO-RICKSHAW IN THE CITIES The auto-rickshaw plying in a city typically has its own character and utilization pattern of Auto Rickshaws is shown in Table-3 that varies from location to location in the city and the data is based on interviews with Auto Rickshaw drivers. A large number of rickshaws are now using CNG and recharging CNG consumes 3-4 hours on each charge. The economic compulsions force them to continue using CNG till the time an alternative more economical is proposed.
020,00040,00060,00080,000
100,000120,000
RICKSHAWS TAXI'S
NU
MB
ER
TYPE OF VEHICLE
RICKSHAWS AND TAXI'S REGISTERED IN KARACHI
2010
2011
0
200000
400000
600000
800000
1000000
1200000
1400000
2001 2002 2003 2004 2005 2006 2007 2008 2009 2010 2011
M/CYCLES 629930 646419 656381 719882 731046 760822 798863 838612 887102 1029454 1,296,481
NU
MB
ER
M/CYCLES REGISTERED IN KARACHI
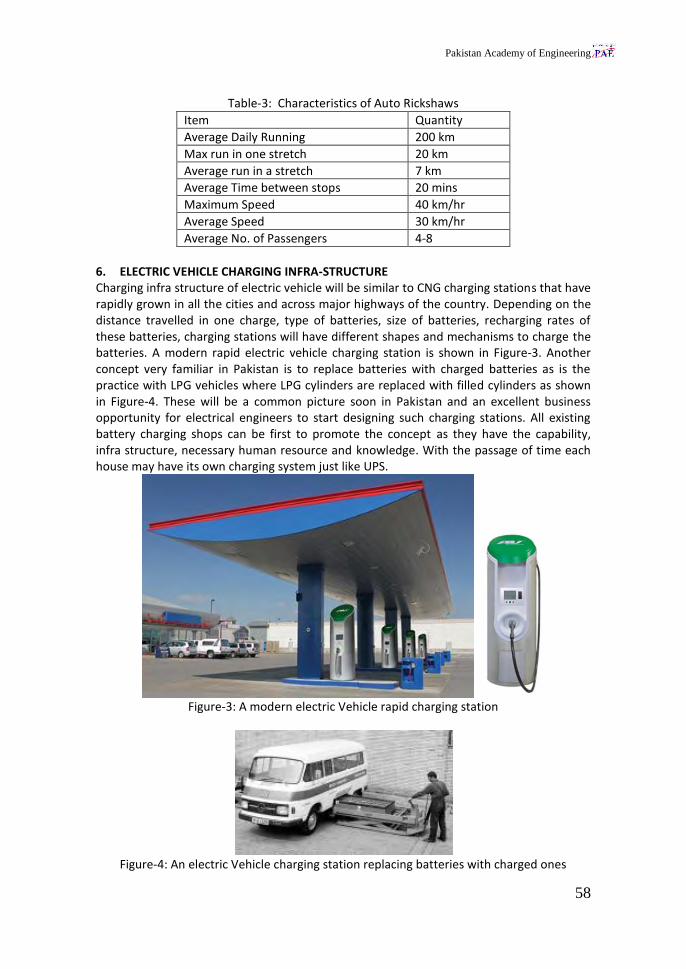
Pakistan Academy of Engineering
58
Table-3: Characteristics of Auto Rickshaws
Item Quantity
Average Daily Running 200 km
Max run in one stretch 20 km
Average run in a stretch 7 km
Average Time between stops 20 mins
Maximum Speed 40 km/hr
Average Speed 30 km/hr
Average No. of Passengers 4-8
6. ELECTRIC VEHICLE CHARGING INFRA-STRUCTURE Charging infra structure of electric vehicle will be similar to CNG charging stations that have rapidly grown in all the cities and across major highways of the country. Depending on the distance travelled in one charge, type of batteries, size of batteries, recharging rates of these batteries, charging stations will have different shapes and mechanisms to charge the batteries. A modern rapid electric vehicle charging station is shown in Figure-3. Another concept very familiar in Pakistan is to replace batteries with charged batteries as is the practice with LPG vehicles where LPG cylinders are replaced with filled cylinders as shown in Figure-4. These will be a common picture soon in Pakistan and an excellent business opportunity for electrical engineers to start designing such charging stations. All existing battery charging shops can be first to promote the concept as they have the capability, infra structure, necessary human resource and knowledge. With the passage of time each house may have its own charging system just like UPS.
Figure-3: A modern electric Vehicle rapid charging station
Figure-4: An electric Vehicle charging station replacing batteries with charged ones
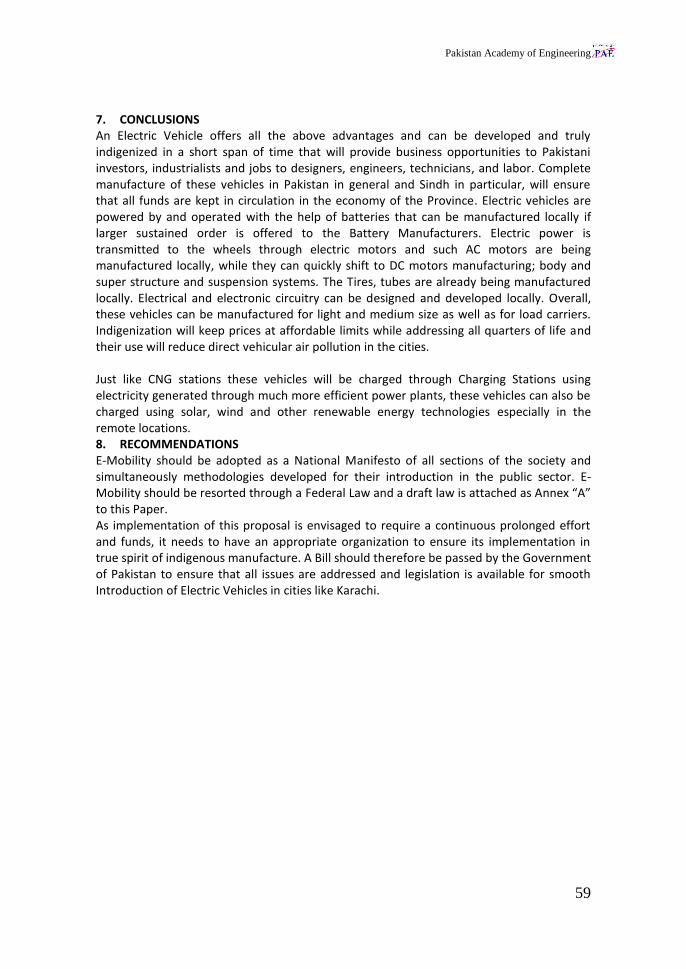
Pakistan Academy of Engineering
59
7. CONCLUSIONS An Electric Vehicle offers all the above advantages and can be developed and truly indigenized in a short span of time that will provide business opportunities to Pakistani investors, industrialists and jobs to designers, engineers, technicians, and labor. Complete manufacture of these vehicles in Pakistan in general and Sindh in particular, will ensure that all funds are kept in circulation in the economy of the Province. Electric vehicles are powered by and operated with the help of batteries that can be manufactured locally if larger sustained order is offered to the Battery Manufacturers. Electric power is transmitted to the wheels through electric motors and such AC motors are being manufactured locally, while they can quickly shift to DC motors manufacturing; body and super structure and suspension systems. The Tires, tubes are already being manufactured locally. Electrical and electronic circuitry can be designed and developed locally. Overall, these vehicles can be manufactured for light and medium size as well as for load carriers. Indigenization will keep prices at affordable limits while addressing all quarters of life and their use will reduce direct vehicular air pollution in the cities. Just like CNG stations these vehicles will be charged through Charging Stations using electricity generated through much more efficient power plants, these vehicles can also be charged using solar, wind and other renewable energy technologies especially in the remote locations. 8. RECOMMENDATIONS E-Mobility should be adopted as a National Manifesto of all sections of the society and simultaneously methodologies developed for their introduction in the public sector. E-Mobility should be resorted through a Federal Law and a draft law is attached as Annex “A” to this Paper. As implementation of this proposal is envisaged to require a continuous prolonged effort and funds, it needs to have an appropriate organization to ensure its implementation in true spirit of indigenous manufacture. A Bill should therefore be passed by the Government of Pakistan to ensure that all issues are addressed and legislation is available for smooth Introduction of Electric Vehicles in cities like Karachi.

Pakistan Academy of Engineering
60
1. Pakistan spent fourteen and half billion US Dollars
on import of petroleum products during the year
2011-12.
2. This expenditure is tremendous burden on foreign
currency reserves that departs the country without
directly adding to national economy.
3. Major consumer of petroleum products are vehicles;
therefore there is a requirement to develop new
vehicles that have potential to reduce this drain on
national exchequer.
IDENTIFICATION OF ISSUES/ MOTIVATION
4. Most of capital earned by sale of hundreds of
thousands of these vehicles are repatriated to the
international owners of automobile companies.
5. Whereas conversion of vehicles to CNG has created
new drain on already strained reserves of natural gas
while petroleum and CNG remain sources of pollution
in cities, the adverse environmental impacts have to
be addressed before they cause irreparable damage
to the ecology in the country.
IDENTIFICATION OF ISSUES/ MOTIVATION
Pakistan Academy of Engineering
61
6. There is therefore a requirement to reduce
oil import bills, reduce repatriation of billions of
dollars from sale of vehicles, enhance industrial
base for manufacturing sub assemblies of
vehicles, reduce stress on CNG consumption,
reduce pollution in cities, provide hundreds of
thousands of jobs, and reduce dependence on
West.
IDENTIFICATION OF ISSUES/ MOTIVATION CONTD..
International Development
ELECTRIC VEHICLES

Pakistan Academy of Engineering
62
EV’s inventory in world in 2013
USA 172,000
JAPAN 74,124
CHINA 38,592
NETHERLAND 28,673
FRANCE 28,560
NORWAY 20,486
GERMANY 18,000
USA had 260,000 EV’s by September 2014
Ranking CountryEV Market
Share (%)
1 Norway 5.75%
2 Netherlands 0.83%
3 France 0.79%
4 Estonia 0.73%
5 Iceland 0.69%
6 Japan 0.51%
7 Switzerland 0.39%
8 Sweden 0.30%
9 Denmark 0.28%
10 USA 0.28%

Pakistan Academy of Engineering
63
National Strategies of Selected
Countries in Development of
E-Mobiles
Most of the countries shown in the tables
earlier have clearly defined national strategy to
ensure reduction in Green House Gases and
dependence on petroleum products.
Some of the initiatives are highlighted from
North America, Europe and Asia, which
indicate that E-Mobility is going to dominate
international market in next decade.
USA
• In the year 2011 President of USA set the goal
for the U.S. to become the first country to have
1 million electric vehicles on the road by 2015.
In September 2014, the Charge Ahead
• California Initiative set the additional goal to
have at least 1 million zero-emission vehicles
and near-zero-emission vehicles in California
by the year 2023.

Pakistan Academy of Engineering
64
Germany
• Germany launched a campaign to put 1 million
electric cars on the road by 2020, making
battery research a priority as it tries to position
the country as a market leader and reserving
$705 million in stimulus package.
• The plan has been approved by German
Cabinet with a aim to make Germany into the
market leader for electric mobility. One (1)
million EV is the target by 2020.
South Korea
• South Korean government plans to produce 1.2
million electric vehicles a year by 2015 a
nationwide goal of one million registered
electric vehicles by the year 2020.
• The South Korean government’s Ministry of
Environment is providing a $13,900 nationwide
subsidy for EV purchases, and 10 major cities
or provincial jurisdictions are providing
additional subsidies ranging from $2,800 to
$7,400.
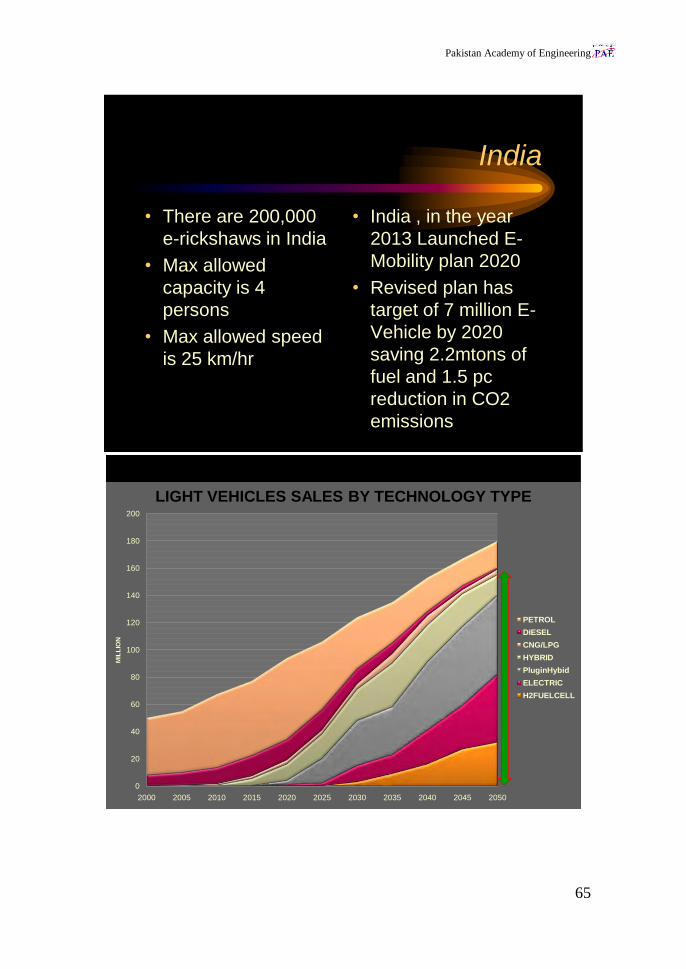
Pakistan Academy of Engineering
65
India
• There are 200,000
e-rickshaws in India
• Max allowed
capacity is 4
persons
• Max allowed speed
is 25 km/hr
• India , in the year
2013 Launched E-
Mobility plan 2020
• Revised plan has
target of 7 million E-
Vehicle by 2020
saving 2.2mtons of
fuel and 1.5 pc
reduction in CO2
emissions
0
20
40
60
80
100
120
140
160
180
200
2000 2005 2010 2015 2020 2025 2030 2035 2040 2045 2050
MIL
LIO
N
LIGHT VEHICLES SALES BY TECHNOLOGY TYPE
PETROL
DIESEL
CNG/LPG
HYBRID
PluginHybid
ELECTRIC
H2FUELCELL

Pakistan Academy of Engineering
66
Technologies involved
• The technologies involved in
manufacturing in Electric Vehicles mainly
include batteries, motors, drive
transmission systems, brake system,
steering system, vehicle lighting system,
vehicle suspension system, wheels, tires
and frame.

Pakistan Academy of Engineering
67

Pakistan Academy of Engineering
68
• Although efforts to assemble and manufacture
vehicles locally were on since Pakistan’s
emergence it picked up momentum after
creation of Pakistan Automobile Corporation
(PACO) a Government body.
• PACO was also tasked to ensure gradual
deletion of components that resulted in large
indigenous manufacturing base in the country.
That clearly highlights Public Sector
Intervention in development of technologies
backed by proper legislation.
Gradual Shift to E-Mobility
• E-Mobility is synonymous has introduced
several new words in dictionary; All Battery
Electric Vehicle (BEV), Hybrid Electric Vehicle
(HEV), Plug-in Hybrid Vehicle (PHV),
Neighborhood Electric Vehicle (NEV).

Pakistan Academy of Engineering
69
Change of Mindset
• The MINDSET has to be changed at the first
instance; shift to high performance vehicles
should be deferred at this stage in
comparison with low cost low performance
NEV’s like auto rickshaw, black and yellow
cabs, vans, pickups, and even second car for
short distances.
Local Market Assessment/

Pakistan Academy of Engineering
70
0
20,000
40,000
60,000
80,000
100,000
120,000
RICKSHAWS TAXI'S
NU
MB
ER
TYPE OF VEHICLE
RICKSHAWS AND TAXI'S REGISTERED IN KARACHI
2010
2011
A modern electric Vehicle rapid charging station

Pakistan Academy of Engineering
71
An Office Electric vehicles charging stations
An Office Electric vehicles charging stations

Pakistan Academy of Engineering
72
Electric vehicles charging station at each business building or in the parking lots.

Pakistan Academy of Engineering
73
Residential Electric Vehicle Charging station

Pakistan Academy of Engineering
74
-
500,000
1,000,000
1,500,000
2,000,000
2,500,000
3,000,000
3,500,000
4,000,000
2014 2015 2016 2017 2018 2019 2020 2021 2022 2023 2024 2025 2026 2027 2028
US
DO
LLA
RS
COMPARISON OF OPERATIONAL COST BETWEEN SPARK ELECTRIC CAR AND SPARK PETROL CAR
SPARK ELECTRIC CAR
SPARK PETROL CAR
non rebated Ecar cost
Pakistan is very experienced in missing
technology boats in time and repenting later, one
more very attractive opportunity can also slip
away unless;
we ENGINEERS
TAKE AN ADVANCE NOTICE AND REACT TO
CATCH THE TECHNOLOGY SHIP
IDENTIFICATION OF ISSUES/ MOTIVATION
Pakistan Academy of Engineering
75
THE ULTIMATE SOLUTION Dr.-Ing. Jameel Ahmad Khan
4
The Human Development Report issued by the United Nations (1998) makes very significant observation relevant to our context: “Developing countries face a fundamental choice. They can mimic the industrial countries, and go through a development phase that is dirty and wasteful and creates an enormous amount of pollution. Or they can leapfrog over some of the steps followed by industrial countries and incorporate modern efficient technologies” The developed countries are moving towards decarbonised transport systems. New technologies are emerging to transform the fossil driven systems through a sustainable shift. The demand for mobility is increasing, particularly in the developing countries. It is expected that in the next 10 years the auto industry will undergo a change not seen in the past 100 years. Currently the total world population of road vehicles exceeds one billion. The personal cars are around 800 million. It is estimated that by 2030 this population will be doubled. The European Commission’s programme HORIZON 2020 very elaborately defines the specific objective of the “Transport Challenge” in terms of smart, green and integrated transport, a transport system that is resource efficient, climate and environmentally friendly, safe and seamless for the benefit of all citizens, the economy and society The Human Development Report issued by the United Nations (1998) makes a very significant observation relevant to our context: “Developing countries face a fundamental choice. They can mimic the industrial countries, and go through a development phase that is dirty and wasteful and creates an enormous legacy of pollution. Or they can leapfrog over some of the steps followed by industrial countries and incorporate modern efficient technologies”. A key role will be played by electric road vehicles to design a new future for urban mobility, reduction in environmental pollution and decreasing dependence on fossil fuels. The auto industry is experiencing the convergence of factors that make Hydrogen Fuel Cell Cars more viable than the battery operated ones, and the former will soon gain ground on the latter in the race to develop zero-emission vehicles. There is a general consensus that in terms of durability, cold start, packaging, acceleration, refueling time and range the Hydrogen Fuel Cell Vehicles are performing to an extent that they could be brought to the market in 2015. The HFCVs are technically ready and the customer expectations will be satisfied. In the niche areas such as forklifts, mining machinery and backup power, significant commercial adoption of hydrogen fuel cell technology has been achieved. It has been recognized globally that the future is hydrogen based transport, because the fuel cell vehicles address two main short comings to today’s battery-powered cars successfully: short driving range and long charging times. In the industrialized countries transition from Hydrocarbon to Hydrogen Economy has already commenced. Let us examine the worldwide status of hydrogen fuel cell vehicle technology and prospects for its commercialization: It will be highly educative to survey the latest global efforts being made to commercialize the Hydrogen Fuel Cell Vehicles.
4 Dr. –Ing Jameel Ahmad Khan is the President, Pakistan Academy of Engineering and Ex- Vice Chancellor of
NED University of Engineering and Technology, Karachi

Pakistan Academy of Engineering
76
President of the US announced the famous Hydrogen Fuel Initiative in his 2003 State of the Union Address. It was aimed at developing commercially viable hydrogen fuel cell and infrastructure technologies by the year 2020. Subsequently, a National Vision of America’s Transition to a Hydrogen Economy to 2030 and Beyond was developed acknowledging that Hydrogen is America’s Clean Energy choice and that hydrogen is flexible, affordable, safe, domestically produced, used in all sectors of the economy and in all regions of the country. A key point to be noted is that the policies and programmes are essentially required to be strongly supported by appropriate legislative measures. The American Recovery and Reinvestment Act of 2009 (ARRA), the State Legislation of California (AB8) passed last year,“ The Open Fuel Standard Act of 2011” of USA directing the automakers to have half of the Cars by 2017 Model Year capable of operating on fuels other than gasoline, the European Union introduced the Renewable Energy Directive and its companion the Fuel Quality Directive in 2009 to from the use of non-fossil fuels in transport, and the most recent one “Electric Mobility Law (EMOG)” approved by the German Cabinet on September 4, 2014, are all aimed at ensuring that the early markets for the Hydrogen Fuel Cell Technology successfully cross the chasm that is so often coupled with early technology adoption. Recent Studies conducted by the NREL show a factor of 1.8 to 2.4 greater fuel economies on hydrogen fuel cell buses than that of the diesel and compressed natural gas. The US, Germany, Japan and South Korea all have elaborative plans for the early marketing of Hydrogen Fuel Cell Vehicles and development of hydrogen refueling infrastructure. International partnerships have been created viz. International Partnership for Hydrogen and Fuel Cells in the Economy (IPH), and the International Energy Agency Hydrogen and Fuel Cell Implementing Agreements (IEA). These organizations along with bilateral and multilateral hydrogen and fuel cell technology R & D cooperation and collaboration will serve as a cultural tool in advancing hydrogen and fuel cells. In December 2, 2012, European Electromobility Observatory (EEO) was launched to act as a European point of reference for electromobility, including Fuel Cell Vehicles. In response to the global economic crises of 2008, the Public Private Partnership European Green Cars Initiative (PPP) was created. Realizing they the auto industry is a key sector for employment with 12 million direct jobs and over € 500 billion / year in turnover, the European Union decided to continue the PPP under the programme Horizon 2020. On the private side European Green Vehicles Initiative Association (EGVIA) is striving to improve the transport energy system by 50% (2010-2030) covering 80% efficiency of urban vehicles and 40% efficiency of long distance freight transport. This can only be achieved through deployment of alternative power trains viz. electric and fuel cell technology. A 1,000 km Trans-European Network corridor from Gothenburg (Sweden) to Rotterdam (Netherlands) has been created to implement a synchronized implementation plan for hydrogen refueling stations. The UK’s first hydrogen vehicles refueling station opened at Honda’s manufacturing facility in Swinton and the first 700 bar hydrogen refueling station opened in Holslebro, Denmark. In Germany Opel announced that its Hydrogen 4 vehicle fleet has passed the 2.4 million mile mark as part of the global fleet test. Europe has been running highly systematic programmes like Electromobility Solutions for Cities and regions 2011-2014 (ELMOS) with the object to establish holistic mobility concepts including provision of infrastructure and incentives. Advanced Electric Vehicle Architecture (2010-2013), ELVA, was designed to focus on electric cars for city passengers and urban delivery. There are valuable other programmes floated like HCV, SAFEEV and

Pakistan Academy of Engineering
77
WIDE – MOB (2010 – 2013) after completion of CUTE (Hydrogen for Clean Urban Transport in Europe (2006 – 2009). In the European Union the project “Hydrogen Moves Scandinavia” was completed with approximately 20 FCEVs manufactured by Daimler, Hyundai, Honda and Toyota. Japan is extremely dependent on fossil fuels and with the shutdown of the Fukishima Nuclear Plant in 2011, its dependency on Fossil Fuels for power generation has further increased. Japan is seriously considering Hydrogen as a main energy source in future to power its transport system and to generate electricity. In Japan 13 companies announced plans to install 100 hydrogen fueling stations by 2015 as part of the previously announced commitment to introduce FCEVs to consumers by 2015. In Singapore the Inter-agency Electric Vehicle (EV) Taskforce has been created which is led by the Energy Market Authority (EMA) and Land Transport Authority (LTA)to establish infrastructure for hydrogen charging. In Australia Nissans real world EV trials for 5 years for zero – emission vehicles began on October 14, 2014. Honda demonstrated FCV at the Los Angeles International Auto Show (Nov, 2013) with more than 100 kW of power, reach upto 500 km and tanking in 3 minutes. It will bring the FC car in the market in 2015 first in USA, Japan and later in Europe in partnership with GM. At the same time (November 2013) Toyota exhibited its FCV concept at the Tokyo Motor Show with a 100 kW power train, minimum reach of 500 km, tanking of 3 minutes and high pressure hydrogen tank of 700 bar. In the US currently Toyota has 100 demonstration vehicles on the road, Honda 200, GM 115, Daimler 100, and Hyundai and others in the race. World’s largest single FCEV demo was accomplished with 183 FCEVs, 25 Fueling Stations and more than 3.6 million miles driven as part of the DOE, US, technology validation programme. In the US Ford Motor Co has put 1.3 million test miles on a fleet of 300 FCV over the last several years. Hyundai Motor Co unveiled a third generation FCEV with a 100 kW fuel cell, 700 bar storage, - 25
0C start capacity,
and a 400 mile range. 48 of these vehicles were added to the hydrogen test fleet. Mercedes began leasing its B-Class fuel cell vehicle to customers in the Orange Country and Los Angeles, CA. In conclusion our assessment is that hydrogen could be put into wide scale use as an automotive fuel to address problems of air pollution and most important security of energy supply. In the beginning HFCV fleet cars should be introduced for short range delivery systems like post office, emergency vehicles, law enforcing vehicles, health care vehicles, school buses and vans. A hydrogen rental car strategy could be introduced for transitioning from fleets to consumers particularly at the air ports. The hydrogen fueled rental car business combines profitably the logistical advantages of a fleet operation with outreach to many individual consumers.

Pakistan Academy of Engineering
78
CARMAKERS PREPARE TO SHIFT TO HYDROGEN FUEL CELLS
Hyundai started leasing a hydrogen fuel cell version of its Tucson SUV, above, this year. To the
right is a fuel cell stack on display at the 2013 L.A. Auto Show. (Christina House / For The Times)
TOYOTA HFCV
LA, USA: AUTOSHOW
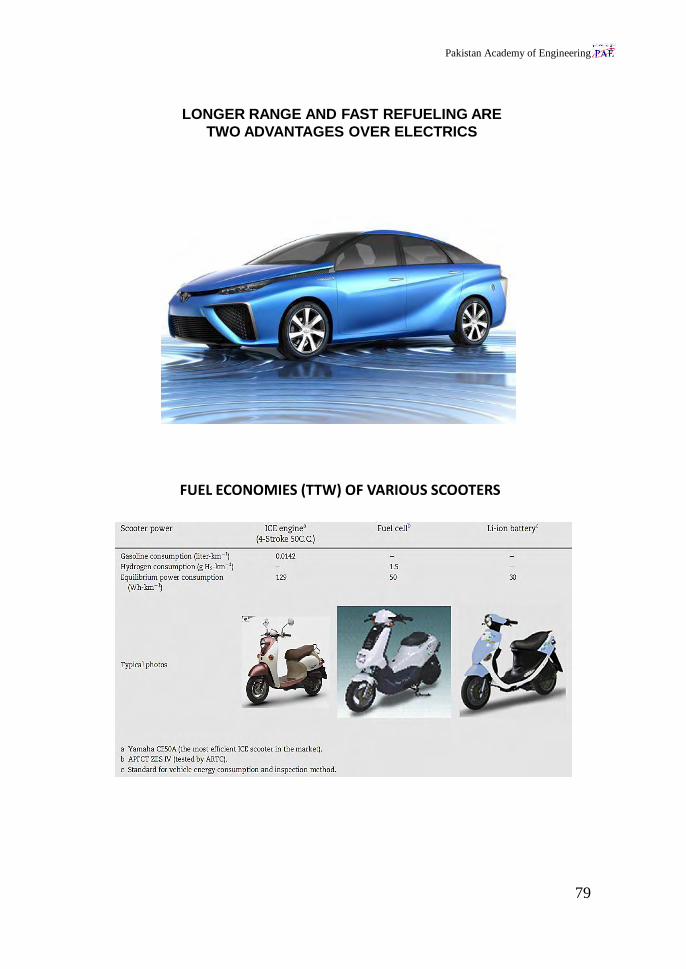
Pakistan Academy of Engineering
79
LONGER RANGE AND FAST REFUELING ARE
TWO ADVANTAGES OVER ELECTRICS
FUEL ECONOMIES (TTW) OF VARIOUS SCOOTERS

Pakistan Academy of Engineering
80
HONDA FUEL CELL VEHICLE FCX
VOLKSWAGEN IS READY FOR A HYDROGEN-POWERED
FUTURE WITH PASSAT AND GOLF SPORTWAGEN
HYMOTION

Pakistan Academy of Engineering
81
(a) INFRASTRUCTURES OF FUEL CELL SCOOTERS, AND(b) EXCHANGEABLE METAL HYDRIDE CANISTERS FOR FUEL CELL SCOOTERS
ONCE SEEN AS ENVIRONMENTAL VILLAINS,
CARS ARE BECOMING SQUEAKY CLEAN
Source: International Council on Clean Transportation

Pakistan Academy of Engineering
82
COMMERCIALIZATION OF FUEL CELL VEHICLES AND
HYDROGEN STATIONS TO COMMENCE IN 2015

Pakistan Academy of Engineering
83
IMPACT OF DIFFERENT SCENARIOS ON
URBAN VEHICLE OWNERSHIP

Pakistan Academy of Engineering
84
56
COMPARISON OF KEY PROPERTIES OF
HYDROGEN AND OTHER FUELS
Fuel Type
Liquid hydrogen
Gaseous hydrogen
Fuel oil
Gasoline
Jet fuel
LPG
LNG
Methanol
Ethanol
Bio diesel
Natural gas
Charcoal
Energy per unit
mass (MJ/kg)
141.90
141.90
45.50
47.40
46.50
48.80
50.00
22.30l
29.90
37.00
50.00
30.00
Energy per unit
volume (MJ/m³)
10.10
0.013
38.65
34.85
35.30
24.40
23.00
18.10
23.60
33.00
0.04
–
MotivityFactor
1.00
1.00
0.78
0.76
0.75
0.62
0.61
0.23
0.37
–
0.75
–
Specific carbon
emission
(kg C/kg fuel)
0.00
0.00
0.84
0.86
–
–
–
0.50
0.50
0.50
0.46
0.50
PROGRESS TOWARDS MEETING TECHNICAL TARGETS FOR
HYDROGEN PRODUCTION VIA DISTRIBUTED WATER ELECTROLYSIS

Pakistan Academy of Engineering
85

Pakistan Academy of Engineering
86
SAFETY RANKING OF FUELS
Fuel Characteristic
Toxicity of fuel
Toxicity of combustion
Density
Diffusion Coefficient
Specific heat
Ignition limit
Ignition energy
Ignition temperature
Flame temperature
Explosion energy
Flame emissivity
Total score
Safety factor
Gasoline
3
3
3
3
3
1
2
3
3
3
3
30
16/30
0.53
Methane
2
2
2
2
2
2
1
2
1
2
2
20
16/20
0.80
Hydrogen
1
1
1
1
1
3
3
1
2
1
1
16
16/16
1.00
Safest = 1; less safe = 2; least safe = 3.
HYDROGEN VISION
The Hydrogen Cycle: when generated from renewable source,
hydrogen production and use is part of a clean, cyclic proces.

Pakistan Academy of Engineering
87
Average Solar Hydrogen Production Efficiencies of Photovoltaic
Systems with a Range of V Directly Connected to a PEM Electrolyzer.mpp
Source: IAHE Volume 33, Issue 21 (November 2008)
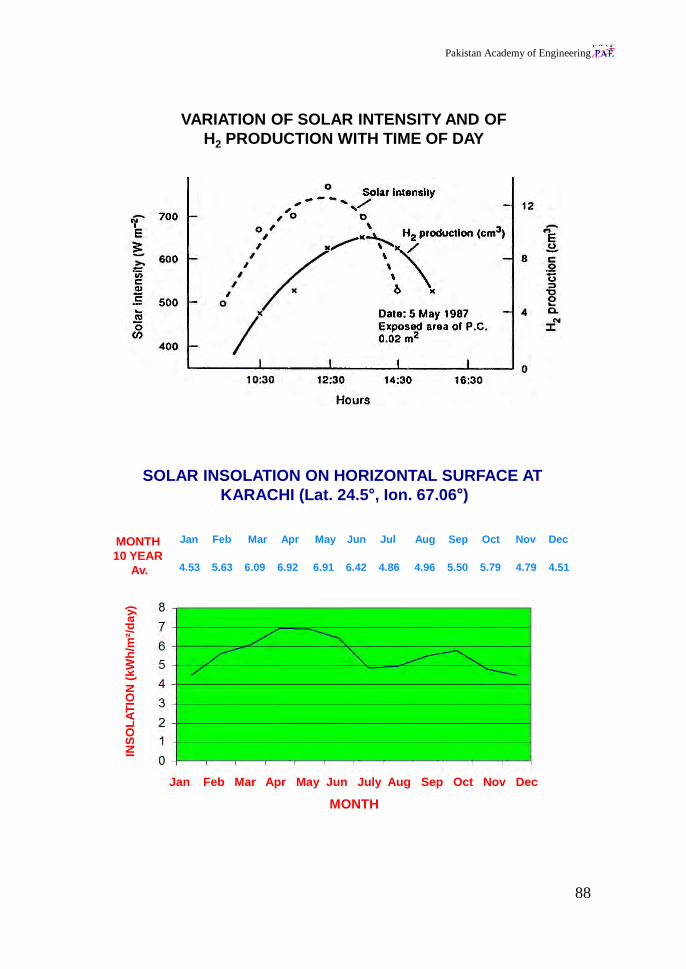
Pakistan Academy of Engineering
88
VARIATION OF SOLAR INTENSITY AND OF
H2 PRODUCTION WITH TIME OF DAY
SOLAR INSOLATION ON HORIZONTAL SURFACE AT
KARACHI (Lat. 24.5�, Ion. 67.06�)
INS
OL
AT
ION
(k
Wh
/m²/
da
y)
Jan Feb Mar Apr May Jun Jul Aug Sep Oct Nov Dec
4.53 5.63 6.09 6.92 6.91 6.42 4.86 4.96 5.50 5.79 4.79 4.51
MONTH
10 YEAR
Av.
MONTH
Jan Feb Mar Apr May Jun July Aug Sep Oct Nov Dec

Pakistan Academy of Engineering
89
TECHNICAL TARGETS: DISTRIBUTED FORECOURT
WATER ELECTROLYSIS HYDROGEN PRODUCTION a, b, c
TECHNICAL TARGETS FOR HYDROGEN STORAGE
Specific Energy: 1.5 kWh/kg
Energy Density: 0.9 kWh/L

Pakistan Academy of Engineering
90
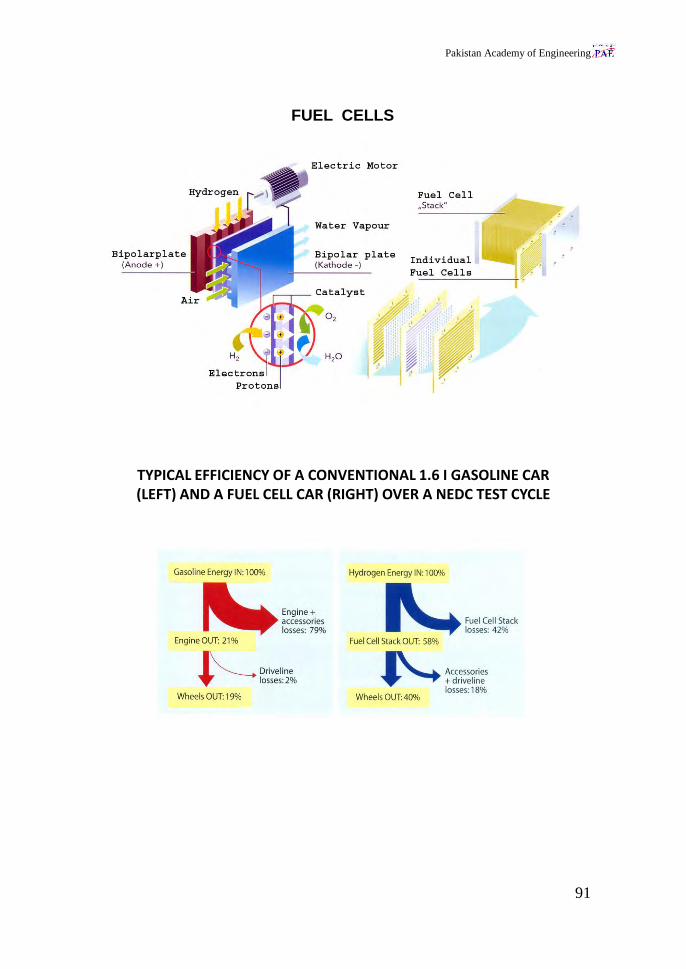
Pakistan Academy of Engineering
91
FUEL CELLS
TYPICAL EFFICIENCY OF A CONVENTIONAL 1.6 I GASOLINE CAR (LEFT) AND A FUEL CELL CAR (RIGHT) OVER A NEDC TEST CYCLE

Pakistan Academy of Engineering
92
THE THERMAL EFFICIENCY OF ICE AND FUEL
CELL VEHICLES BY LOAD FACTOR
Key point: The main FCV efficiency benefits occur at partial load
1. Energy Density (on LHV basis)
Gasoline 11.9 kWh/kg 10 kWh/l
Hydrogen 33.3 kWh/kg 3 kWh/m3@STP
2. Typical Efficiency of a 1.6 l Gasoline Car and Fuel Cell Car in accordance with the Test Cycle conducted by New Driving Cycle (NEDC)
Gasoline Car Fuel Cell Car
Engine and accessories losses 79% Fuel Stack losses 42%
Engine Output 21% Fuel Cell Output 58%
Driveline losses 2% Accessories & Driveline losses 18%
Wheel Output 19% Wheel Output 40%
3. Fuel Economy
Gasoline Hydrogen
Fuel Economy 24 miles / gall 57 miles / kg*
Fuel Price US $ 2.16 / gall US $ 2.85 / kg
Cost per Vehicle US 9 C / mile 5 C / mile
* 1 kg of H2 is equivalent to 1 gall of gasoline (gge) in terms of energy content.
4. Well-to-Wheels Greenhouse Gas Emissions
Power Unit Emissions (g of CO2-e / mile)
Gasoline Engine (Conventional ICE) 340
Diesel Engine (Conventional ICE) 220
Battery Operated 230 g Electric Vehicles (BEV)
Fuel Cell Electric Vehicles (FCEV) 42.97
Fuel Cell Vehicles with Ultra-low 0 Carbon Renewables for H2 – Production
-3- COMPARATIVE EFFICIENCY OF HFCEV

Pakistan Academy of Engineering
93
1. Energy Density (on LHV basis)
Gasoline 11.9 kWh/kg 10 kWh/l
Hydrogen 33.3 kWh/kg 3 kWh/m3@STP
2. Typical Efficiency of a 1.6 l Gasoline Car and Fuel Cell Car in accordance with the Test Cycle conducted by New Driving Cycle (NEDC)
Gasoline Car Fuel Cell Car
Engine and accessories losses 79% Fuel Stack losses 42%
Engine Output 21% Fuel Cell Output 58%
Driveline losses 2% Accessories & Driveline losses 18%
Wheel Output 19% Wheel Output 40%
3. Fuel Economy
Gasoline Hydrogen
Fuel Economy 24 miles / gall 57 miles / kg*
Fuel Price US $ 2.16 / gall US $ 2.85 / kg
Cost per Vehicle US 9 C / mile 5 C / mile
* 1 kg of H2 is equivalent to 1 gall of gasoline (gge) in terms of energy content.
4. Well-to-Wheels Greenhouse Gas Emissions
Power Unit Emissions (g of CO2-e / mile)
Gasoline Engine (Conventional ICE) 340
Diesel Engine (Conventional ICE) 220
Battery Operated 230 g Electric Vehicles (BEV)
Fuel Cell Electric Vehicles (FCEV) 42.97
Fuel Cell Vehicles with Ultra-low 0 Carbon Renewables for H2 – Production
-3-
COMPARATIVE EFFICIENCY OF HFCEV(CONTD.)
MODELED COST OF AN 80-kWnet PEM FUEL CELL SYSTEM BASED
ON PROJECTION TO HIGH-VOLUME MANUFACTURING
(500,000 UNITS/YEAR)

Pakistan Academy of Engineering
94
Overview Comparison of Gasoline Fueled Vehicles
and Hydrogen Vehicles
2013 FINAL AUTOMOTIVE FC COST ESTIMATE

Pakistan Academy of Engineering
95
TECHNICAL TARGETS FOR
FUEL CELL TRANSPORTATION COST
DOE Fuel Cell System Cost Target: $40/kWe in 2020
DOE Fuel Cell System Ultimate Cost Target: $30/kWe
Shanghai Analysis – 3km to Stations Beijing Analysis – 3km to Stations
• Shanghai – 300 hydrogen stations would provide fueling coverage for the entire municipality of
Shanghai (mainland), supporting over 450,000 FCEV (note: population is ~ 20 million).
• Beijing – 150 hydrogen stations would provide coverage for the municipality of Beijing, supporting
over 225,000 fuel cell vehicles (note: population ~ 14 million).
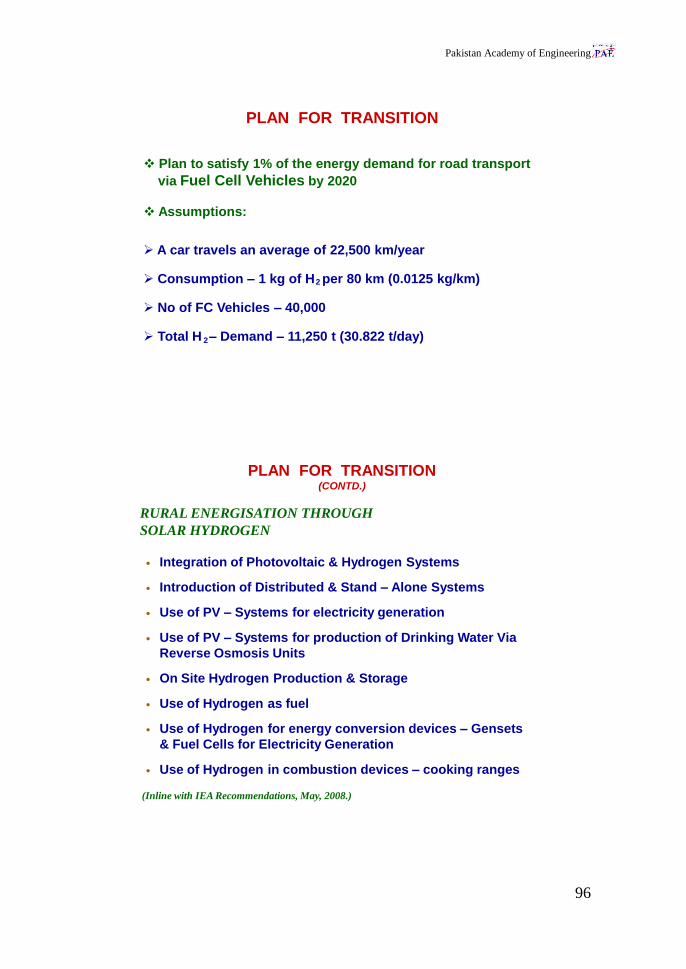
Pakistan Academy of Engineering
96
Plan to satisfy 1% of the energy demand for road transport
via Fuel Cell Vehicles by 2020
Assumptions:
A car travels an average of 22,500 km/year
Consumption – 1 kg of H per 80 km (0.0125 kg/km)
No of FC Vehicles – 40,000
Total H – Demand – 11,250 t (30.822 t/day)
PLAN FOR TRANSITION
2
2
RURAL ENERGISATION THROUGH
SOLAR HYDROGEN
(Inline with IEA Recommendations, May, 2008.)
PLAN FOR TRANSITION(CONTD.)
Integration of Photovoltaic & Hydrogen Systems
Introduction of Distributed & Stand – Alone Systems
Use of PV – Systems for electricity generation
Use of PV – Systems for production of Drinking Water Via
Reverse Osmosis Units
On Site Hydrogen Production & Storage
Use of Hydrogen as fuel
Use of Hydrogen for energy conversion devices – Gensets
& Fuel Cells for Electricity Generation
Use of Hydrogen in combustion devices – cooking ranges
•
•
•
•
•
•
•
•

Pakistan Academy of Engineering
97
CONCLUSIONS AND RECOMMENDATIONS OF THE SYMPOSIUM
1. It is high time that the transport system of the city of City of Karachi
is drastically restructured in line with the presentations made at the
symposium held on December 20, 2014.
2. New technology for introducing the concept of E-Mobility is now
commercially available. It will successfully resolve the problems of
congestion, pollution and sustainability in respect of the private and
public transport in the city of Karachi.
3. The global scenario demonstrates that the future road transport
fleets will convert to Hydrogen Fuel Cell Electric Vehicles, with a
transition phase comprising hybrid and pure electric vehicles. In
terms of Technological transformation leapfrogging for Pakistan will
provide the right answer.
4. Developing countries have a patent advantage in cashing the
opportunity and developing their own manufacturing infra-structure
for E-vehicles.
5. An economically viable solution will need a joint effort on the part of
Government of Sindh, consortium of local automotive industries,
banking and financing institutions, and entrepreneurs for launching
E-mobility projects with proper legislative support.
6. In the first instance electrification of the large population of tri-cycle
(auto-rickshaw) in the city could be an attractive market for
introduction of new technology.
7. In the first stage a presentation is to be immediately made to the
Chief Minister of Sindh in his office who had agreed to be the Chief
Guest of the Symposium. Relevant Ministers be specially invited in
this presentation.
8. This presentation should subsequently be made at all levels of
decision making in the city as well as international donor agencies
through courtesy of Government of Sindh.
9. A presentation of the same be prepared for the Prime Minister of
Pakistan with the leadership role of Government of Sindh