Embed Size (px)
Citation preview
Copyright DaPaaS Consortium 2013-2015
Small or medium-scale focused research project (STREP)
ICT SME-DCA Call 2013 FP7-ICT-2013-SME-DCA
Data Publishing through the Cloud: A Data- and Platform-as-a-Service Approach to Efficient
Open Data Publication and Consumption
DaPaaS
Deliverable 3.1
Analysis, requirements, design & architecture specification for the data access framework
Date: 31 January 2014
Author(s): Momchill Zarev, Dumitru Roman, and Brian Elvesæter
Dissemination level: PU
WP: 3
Version: 1.0
D3.1: Requirements, analysis & design of the UI layer of DaPaaS infrastructure
PU
Copyright DaPaaS Consortium 2013-2015 Page 2 / 33
Document metadata
Quality assurors and contributors
Quality assuror(s) Rick Moynihan, Alex Simov
Contributor(s) DaPaaS Consortium
Version history
Version Date Description
0.1 05.01.2014 Initial version – structure of document
0.2 10.01.2014 Added review of relevant tools
0.3 20.01.2014 Addressing initial comments on the document
0.4 21.01.2014 Revised Intro & State of the Art sections
0.5 22.01.2014 Addressing second review of document
0.6 32.01.2014 Added Appendix with reviewed frameworks
0.7 28.01.2014 Internal reviews
1.0 31.01.2014 Final draft
D3.1: Requirements, analysis & design of the UI layer of DaPaaS infrastructure
PU
Copyright DaPaaS Consortium 2013-2015 Page 3 / 33
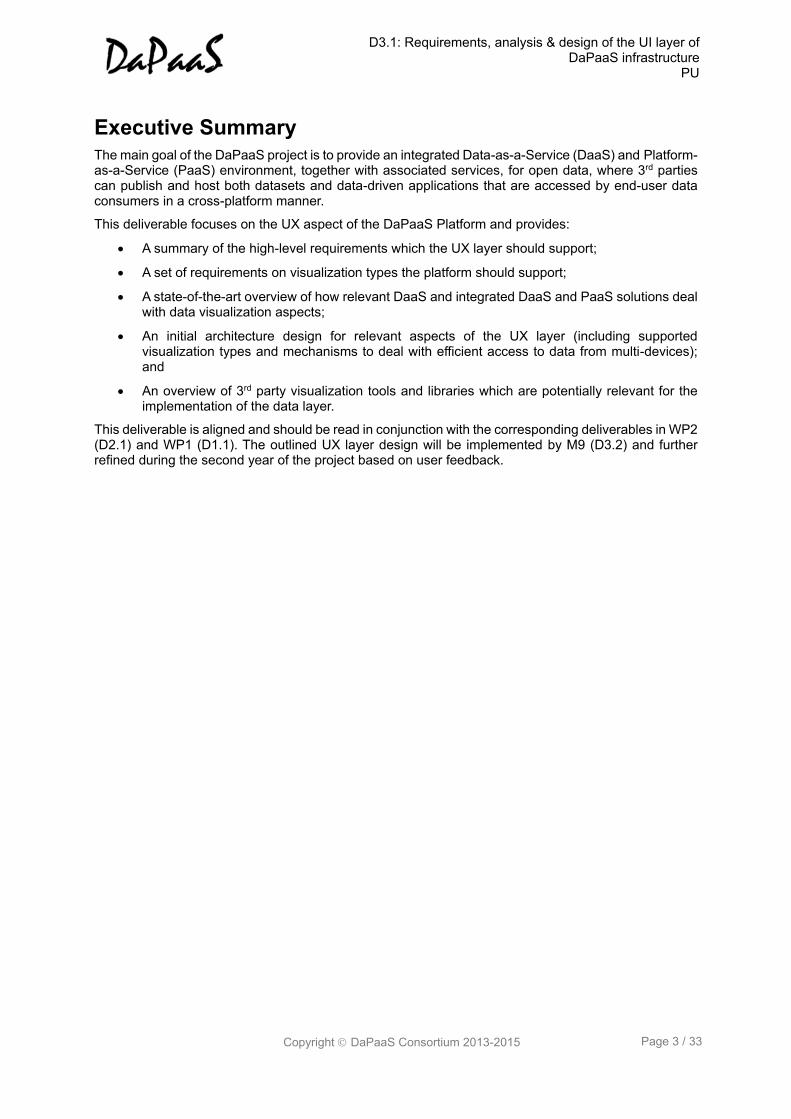
Executive Summary The main goal of the DaPaaS project is to provide an integrated Data-as-a-Service (DaaS) and Platform-as-a-Service (PaaS) environment, together with associated services, for open data, where 3rd parties can publish and host both datasets and data-driven applications that are accessed by end-user data consumers in a cross-platform manner.
This deliverable focuses on the UX aspect of the DaPaaS Platform and provides:
A summary of the high-level requirements which the UX layer should support;
A set of requirements on visualization types the platform should support;
A state-of-the-art overview of how relevant DaaS and integrated DaaS and PaaS solutions deal with data visualization aspects;
An initial architecture design for relevant aspects of the UX layer (including supported visualization types and mechanisms to deal with efficient access to data from multi-devices); and
An overview of 3rd party visualization tools and libraries which are potentially relevant for the implementation of the data layer.
This deliverable is aligned and should be read in conjunction with the corresponding deliverables in WP2 (D2.1) and WP1 (D1.1). The outlined UX layer design will be implemented by M9 (D3.2) and further refined during the second year of the project based on user feedback.
D3.1: Requirements, analysis & design of the UI layer of DaPaaS infrastructure
PU
Copyright DaPaaS Consortium 2013-2015 Page 4 / 33
Table of Contents EXECUTIVE SUMMARY ................................................................................................................................... 3
TABLE OF CONTENTS ...................................................................................................................................... 4
LIST OF FIGURES .............................................................................................................................................. 5
LIST OF TABLES ................................................................................................................................................ 6
1 INTRODUCTION ....................................................................................................................................... 7
2 REQUIREMENTS ANALYSIS FOR THE UX LAYER ......................................................................... 9
2.1 KEY ROLES IN DAPAAS ............................................................................................................................. 9 2.2 VISUALIZATION REQUIREMENTS FOR THE UX LAYER ............................................................................. 10
3 STATE OF THE ART OVERVIEW FOR DATA VISUALIZATION IN DAAS/PAAS
PLATFORMS ..................................................................................................................................................... 12
3.1 MICROSOFT AZURE MARKETPLACE ........................................................................................................ 12 3.2 DATAMARKET ......................................................................................................................................... 12 3.3 SOCRATA ................................................................................................................................................. 13 3.4 LOD2 ...................................................................................................................................................... 13 3.5 EUROPEAN UNION OPEN DATA PORTAL .................................................................................................. 14 3.6 DATAMEER .............................................................................................................................................. 14 3.7 SPLUNK ................................................................................................................................................... 15 3.8 TABLEAU SOFTWARE .............................................................................................................................. 16
4 UI LAYER ARCHITECTURE ................................................................................................................ 18
4.1 FUNCTIONAL ASPECTS ............................................................................................................................ 18 4.1.1 Graphical Widgets ......................................................................................................................... 18 4.1.2 Data Summarization ...................................................................................................................... 18 4.1.3 Caching ......................................................................................................................................... 18 4.1.4 Notifications .................................................................................................................................. 18
4.2 UI LAYER ARCHITECTURE & COMPONENTS ............................................................................................ 19
5 RELEVANT TOOLS ................................................................................................................................ 20
5.1 VISUALIZATION FRAMEWORKS ............................................................................................................... 20 5.1.1 D3 .................................................................................................................................................. 20 5.1.2 Flot ................................................................................................................................................ 21 5.1.3 jqPlot ............................................................................................................................................. 22
5.2 MOBILE UI FRAMEWORKS ....................................................................................................................... 23 5.2.1 jQuery ............................................................................................................................................ 23 5.2.2 Dojo ............................................................................................................................................... 23
6 SUMMARY AND OUTLOOK ................................................................................................................. 25
7 APPENDIX A: REVIEW OF DATA VISUALIZATION FRAMEWORKS ....................................... 26
7.1 FRAMEWORKS ......................................................................................................................................... 26 7.2 SUPPORTED CHART TYPES ...................................................................................................................... 27 7.3 ADDITIONAL CHART FEATURES .............................................................................................................. 29 7.4 BROWSER SUPPORT ................................................................................................................................. 31
D3.1: Requirements, analysis & design of the UI layer of DaPaaS infrastructure
PU
Copyright DaPaaS Consortium 2013-2015 Page 5 / 33
List of Figures Figure 1: High-level architecture of the DaPaaS Platform ...................................................................... 7 Figure 2: Key roles/actors in DaPaaS ..................................................................................................... 9 Figure 3: DataMarket – Stack area chart (left) and choropleth map (right) ........................................... 12 Figure 4: Socrata – Bar chart map (left) and point map (right) .............................................................. 13 Figure 5: Digital Agenda Scoreboard Web application .......................................................................... 14 Figure 6: Datameer – Business Infographics data visualization solution .............................................. 15 Figure 7: Splunk – Dashboard examples app ....................................................................................... 16 Figure 8: Tableau – Example of business dashboard ........................................................................... 17 Figure 9: Tableau Public ........................................................................................................................ 17 Figure 10: UI Layer Architecture ............................................................................................................ 19 Figure 11: D3 charting ........................................................................................................................... 20 Figure 12: Flot charting .......................................................................................................................... 21 Figure 13: jqPlot charting ....................................................................................................................... 22
D3.1: Requirements, analysis & design of the UI layer of DaPaaS infrastructure
PU
Copyright DaPaaS Consortium 2013-2015 Page 6 / 33
List of Tables Table 1: Description of visualization requirements for DaPaaS Key Roles ........................................... 10
Table 2: Description of requirements for Visualization Types ................................................................. 11
D3.1: Requirements, analysis & design of the UI layer of DaPaaS infrastructure
PU
Copyright DaPaaS Consortium 2013-2015 Page 7 / 33
1 Introduction This report represents Deliverable D3.1 "Analysis, requirements, design & architecture specification for the data access framework" of the DaPaaS project. This deliverable is a result of Task T3.1 "Requirements, analysis & design of the framework for data access ".
The goals of this deliverable are to provide:
A summary of the high-level requirements which the UX layer should support;
A set of requirements on visualization types the platform should support;
A state-of-the-art overview of how relevant DaaS and integrated DaaS and PaaS solutions deal with data visualization aspects;
An initial architecture design for relevant aspects of the UX layer (including supported visualization types and mechanisms to deal with efficient access to data from multi-devices);
An overview of 3rd party visualization tools and libraries which are potentially relevant for the implementation of the data layer;
Some recommendations for the use of visualization tools and libraries for the first prototype of the UX Layer.
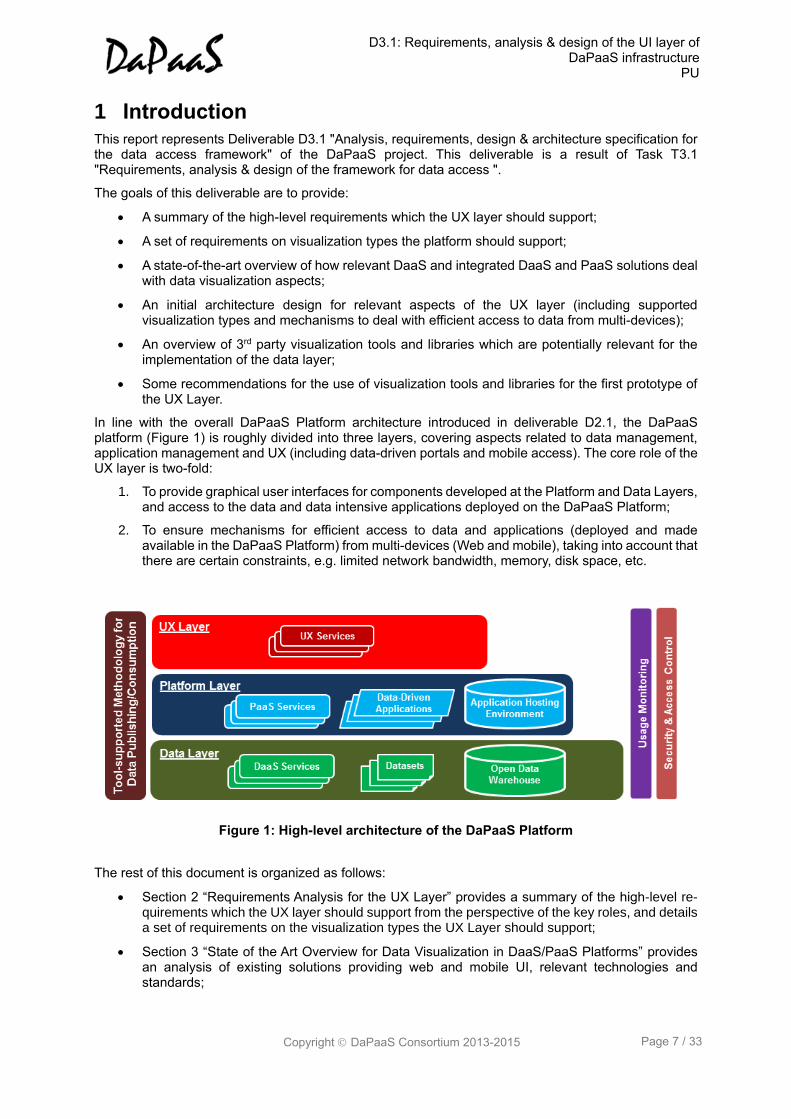
In line with the overall DaPaaS Platform architecture introduced in deliverable D2.1, the DaPaaS platform (Figure 1) is roughly divided into three layers, covering aspects related to data management, application management and UX (including data-driven portals and mobile access). The core role of the UX layer is two-fold:
1. To provide graphical user interfaces for components developed at the Platform and Data Layers, and access to the data and data intensive applications deployed on the DaPaaS Platform;
2. To ensure mechanisms for efficient access to data and applications (deployed and made available in the DaPaaS Platform) from multi-devices (Web and mobile), taking into account that there are certain constraints, e.g. limited network bandwidth, memory, disk space, etc.
Figure 1: High-level architecture of the DaPaaS Platform
The rest of this document is organized as follows:
Section 2 “Requirements Analysis for the UX Layer” provides a summary of the high-level re-quirements which the UX layer should support from the perspective of the key roles, and details a set of requirements on the visualization types the UX Layer should support;
Section 3 “State of the Art Overview for Data Visualization in DaaS/PaaS Platforms” provides an analysis of existing solutions providing web and mobile UI, relevant technologies and standards;
D3.1: Requirements, analysis & design of the UI layer of DaPaaS infrastructure
PU
Copyright DaPaaS Consortium 2013-2015 Page 8 / 33
Section 4 “UI Layer Architecture” introduces the core capabilities of the UX Layer and the high-level architecture of the UX Layer;
Section 5 "Relevant Visualization Tools and Libraries" provides an analysis of various 3rd party tools and libraries which may support the outlined technical architecture; and
Section 6 "Summary and Outlook" summarizes this document and outlines some recommendations for the implementation of the first UX Layer prototype.
D3.1: Requirements, analysis & design of the UI layer of DaPaaS infrastructure
PU
Copyright DaPaaS Consortium 2013-2015 Page 9 / 33
2 Requirements Analysis for the UX Layer Deliverable D2.1 (DaPaaS Project, 2014) provides the complete list of business requirements for the overall DaPaaS Platform, and the descriptions of the key roles (actors) that will interact with it.
For the sake of completeness this section summarizes the key roles and their respective requirements which are relevant to WP3 and the focus of this deliverable respectively. For further details on the roles, the overall requirements and architecture, the reader is referred to Deliverable D2.1.
2.1 Key Roles in DaPaaS
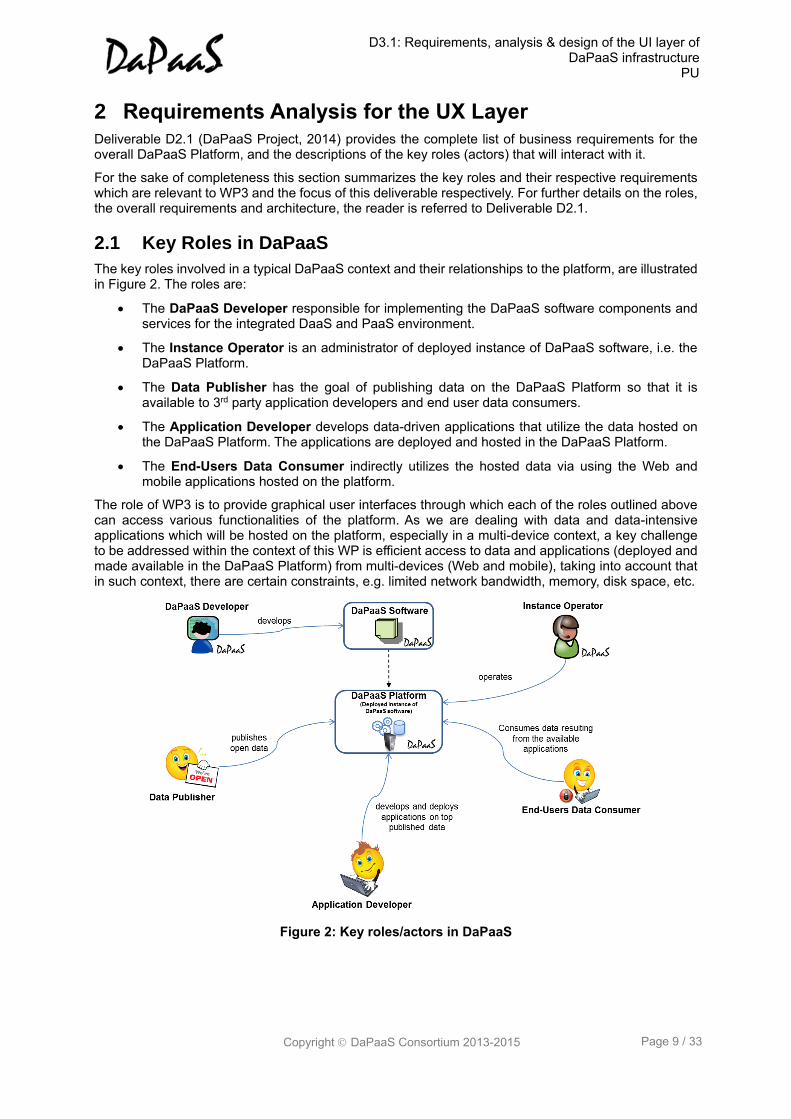
The key roles involved in a typical DaPaaS context and their relationships to the platform, are illustrated in Figure 2. The roles are:
The DaPaaS Developer responsible for implementing the DaPaaS software components and services for the integrated DaaS and PaaS environment.
The Instance Operator is an administrator of deployed instance of DaPaaS software, i.e. the DaPaaS Platform.
The Data Publisher has the goal of publishing data on the DaPaaS Platform so that it is available to 3rd party application developers and end user data consumers.
The Application Developer develops data-driven applications that utilize the data hosted on the DaPaaS Platform. The applications are deployed and hosted in the DaPaaS Platform.
The End-Users Data Consumer indirectly utilizes the hosted data via using the Web and mobile applications hosted on the platform.
The role of WP3 is to provide graphical user interfaces through which each of the roles outlined above can access various functionalities of the platform. As we are dealing with data and data-intensive applications which will be hosted on the platform, especially in a multi-device context, a key challenge to be addressed within the context of this WP is efficient access to data and applications (deployed and made available in the DaPaaS Platform) from multi-devices (Web and mobile), taking into account that in such context, there are certain constraints, e.g. limited network bandwidth, memory, disk space, etc.
Figure 2: Key roles/actors in DaPaaS
D3.1: Requirements, analysis & design of the UI layer of DaPaaS infrastructure
PU
Copyright DaPaaS Consortium 2013-2015 Page 10 / 33
2.2 Visualization Requirements for the UX Layer
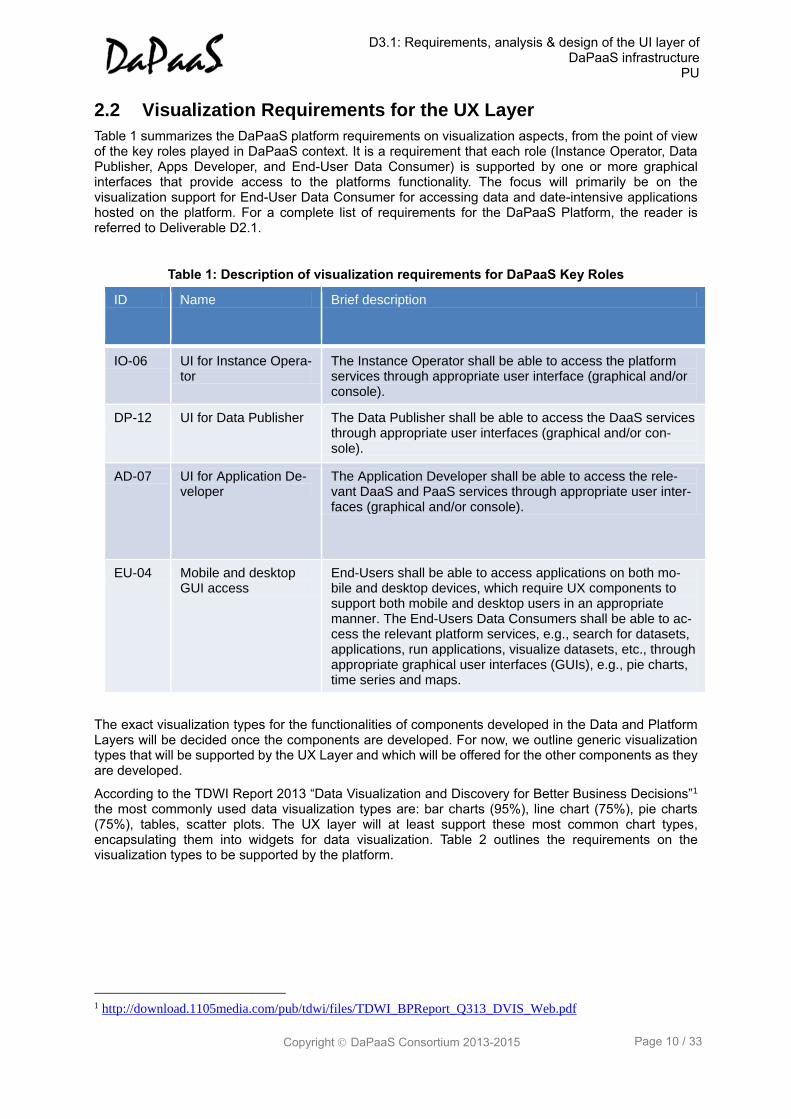
Table 1 summarizes the DaPaaS platform requirements on visualization aspects, from the point of view of the key roles played in DaPaaS context. It is a requirement that each role (Instance Operator, Data Publisher, Apps Developer, and End-User Data Consumer) is supported by one or more graphical interfaces that provide access to the platforms functionality. The focus will primarily be on the visualization support for End-User Data Consumer for accessing data and date-intensive applications hosted on the platform. For a complete list of requirements for the DaPaaS Platform, the reader is referred to Deliverable D2.1.
Table 1: Description of visualization requirements for DaPaaS Key Roles
ID Name Brief description
IO-06 UI for Instance Opera-tor
The Instance Operator shall be able to access the platform services through appropriate user interface (graphical and/or console).
DP-12 UI for Data Publisher The Data Publisher shall be able to access the DaaS services through appropriate user interfaces (graphical and/or con-sole).
AD-07 UI for Application De-veloper
The Application Developer shall be able to access the rele-vant DaaS and PaaS services through appropriate user inter-faces (graphical and/or console).
EU-04 Mobile and desktop GUI access
End-Users shall be able to access applications on both mo-bile and desktop devices, which require UX components to support both mobile and desktop users in an appropriate manner. The End-Users Data Consumers shall be able to ac-cess the relevant platform services, e.g., search for datasets, applications, run applications, visualize datasets, etc., through appropriate graphical user interfaces (GUIs), e.g., pie charts, time series and maps.
The exact visualization types for the functionalities of components developed in the Data and Platform Layers will be decided once the components are developed. For now, we outline generic visualization types that will be supported by the UX Layer and which will be offered for the other components as they are developed.
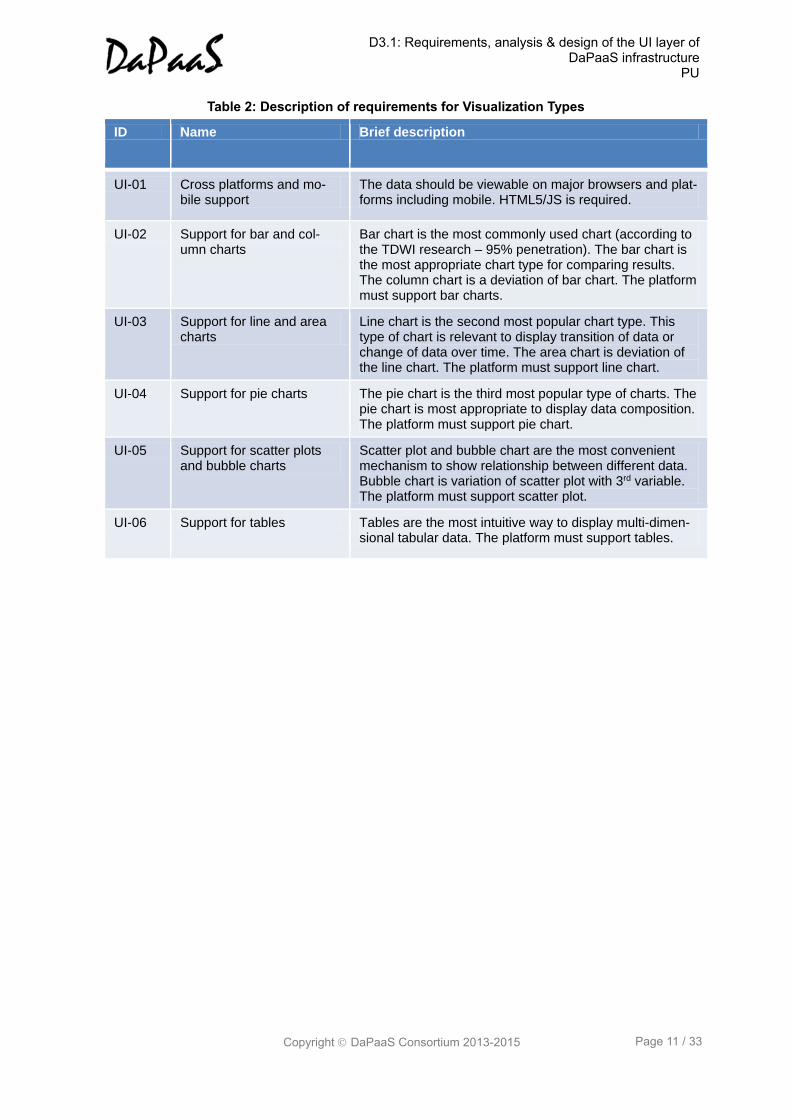
According to the TDWI Report 2013 “Data Visualization and Discovery for Better Business Decisions”1 the most commonly used data visualization types are: bar charts (95%), line chart (75%), pie charts (75%), tables, scatter plots. The UX layer will at least support these most common chart types, encapsulating them into widgets for data visualization. Table 2 outlines the requirements on the visualization types to be supported by the platform.
1 http://download.1105media.com/pub/tdwi/files/TDWI_BPReport_Q313_DVIS_Web.pdf
D3.1: Requirements, analysis & design of the UI layer of DaPaaS infrastructure
PU
Copyright DaPaaS Consortium 2013-2015 Page 11 / 33
Table 2: Description of requirements for Visualization Types
ID Name Brief description
UI-01 Cross platforms and mo-bile support
The data should be viewable on major browsers and plat-forms including mobile. HTML5/JS is required.
UI-02 Support for bar and col-umn charts
Bar chart is the most commonly used chart (according to the TDWI research – 95% penetration). The bar chart is the most appropriate chart type for comparing results. The column chart is a deviation of bar chart. The platform must support bar charts.
UI-03 Support for line and area charts
Line chart is the second most popular chart type. This type of chart is relevant to display transition of data or change of data over time. The area chart is deviation of the line chart. The platform must support line chart.
UI-04 Support for pie charts The pie chart is the third most popular type of charts. The pie chart is most appropriate to display data composition. The platform must support pie chart.
UI-05 Support for scatter plots and bubble charts
Scatter plot and bubble chart are the most convenient mechanism to show relationship between different data. Bubble chart is variation of scatter plot with 3rd variable. The platform must support scatter plot.
UI-06 Support for tables Tables are the most intuitive way to display multi-dimen-sional tabular data. The platform must support tables.
D3.1: Requirements, analysis & design of the UI layer of DaPaaS infrastructure
PU
Copyright DaPaaS Consortium 2013-2015 Page 12 / 33
3 State of the Art Overview for Data Visualization in DaaS/PaaS Platforms
In this section we review the relevant DaaS and integrated DaaS/PaaS platforms (that have been mentioned in deliverables D1.1 and D2.1) in terms of the visualization capabilities that they offer.
3.1 Microsoft Azure Marketplace
The Windows Azure platform provides a marketplace2 for applications and data. Currently there are hundreds of apps, components, widgets and dashboards focused on management and visualization of different kind of data on the marketplace.
The apps are developed by the third parties and published on the marketplace, which provide monetization model for the app developers.
Most of the components and apps focused on data visualization are developed on Silverlight (Microsoft’s preferred platforms for interactive UI), but some of the developers rely on HTML5 and support mobile devices.
According to the Azure development FAQ3 there does not seem to be much data visualization support provided by the Azure platform itself:
"Are there data visualization tools available for Azure resident data collections? Both Excel and Matlab running on the desktop can be used to visualize data stored on Windows Azure. More sophisticated local and remote visualization tools will be made available."
Application Developers are directed to e.g. Windows Azure Tools for Visual Studio4. There exists 3rd party development tools with data visualization components for Visual Studio, e.g. Infragistics Silverlight Controls5, that can be used to develop applications for Windows Azure.
3.2 DataMarket
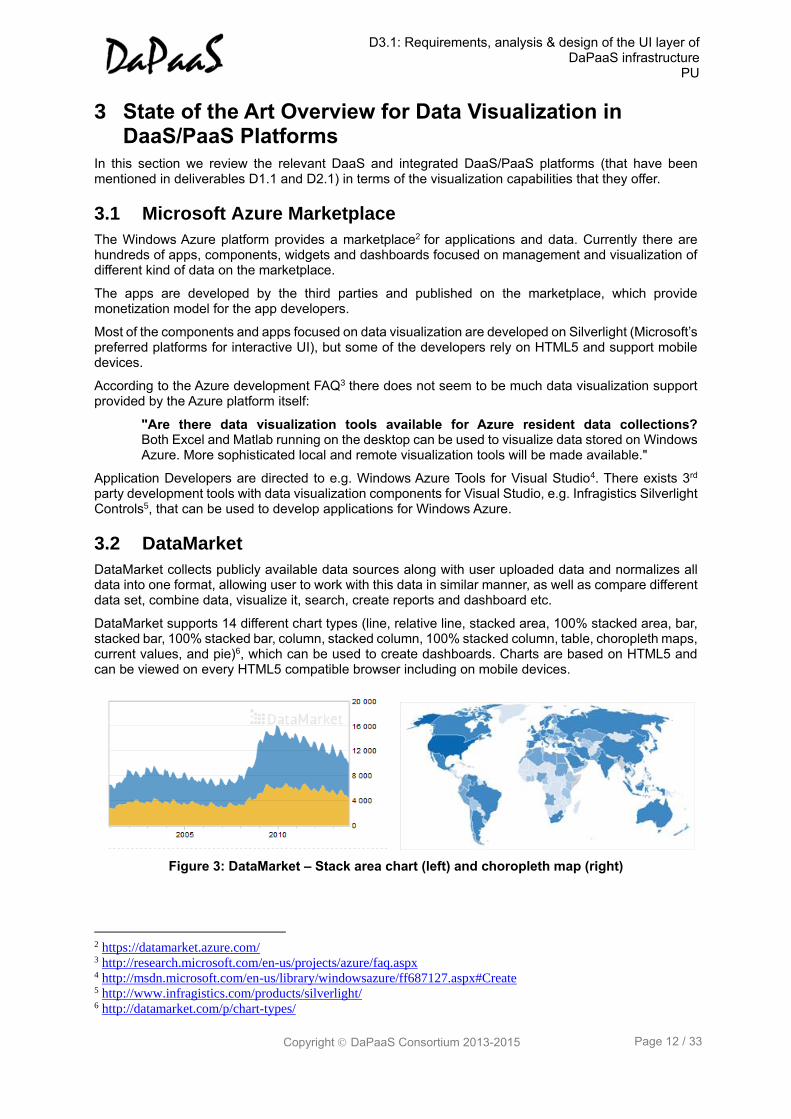
DataMarket collects publicly available data sources along with user uploaded data and normalizes all data into one format, allowing user to work with this data in similar manner, as well as compare different data set, combine data, visualize it, search, create reports and dashboard etc.
DataMarket supports 14 different chart types (line, relative line, stacked area, 100% stacked area, bar, stacked bar, 100% stacked bar, column, stacked column, 100% stacked column, table, choropleth maps, current values, and pie)6, which can be used to create dashboards. Charts are based on HTML5 and can be viewed on every HTML5 compatible browser including on mobile devices.
Figure 3: DataMarket – Stack area chart (left) and choropleth map (right)
2 https://datamarket.azure.com/ 3 http://research.microsoft.com/en-us/projects/azure/faq.aspx 4 http://msdn.microsoft.com/en-us/library/windowsazure/ff687127.aspx#Create 5 http://www.infragistics.com/products/silverlight/ 6 http://datamarket.com/p/chart-types/
D3.1: Requirements, analysis & design of the UI layer of DaPaaS infrastructure
PU
Copyright DaPaaS Consortium 2013-2015 Page 13 / 33
The DataMarket’s Data Hub provides free access for data consumers to the basic features of the system, including charting and visualization and premium paid features for publishing data and embed them into enterprise systems.
3.3 Socrata
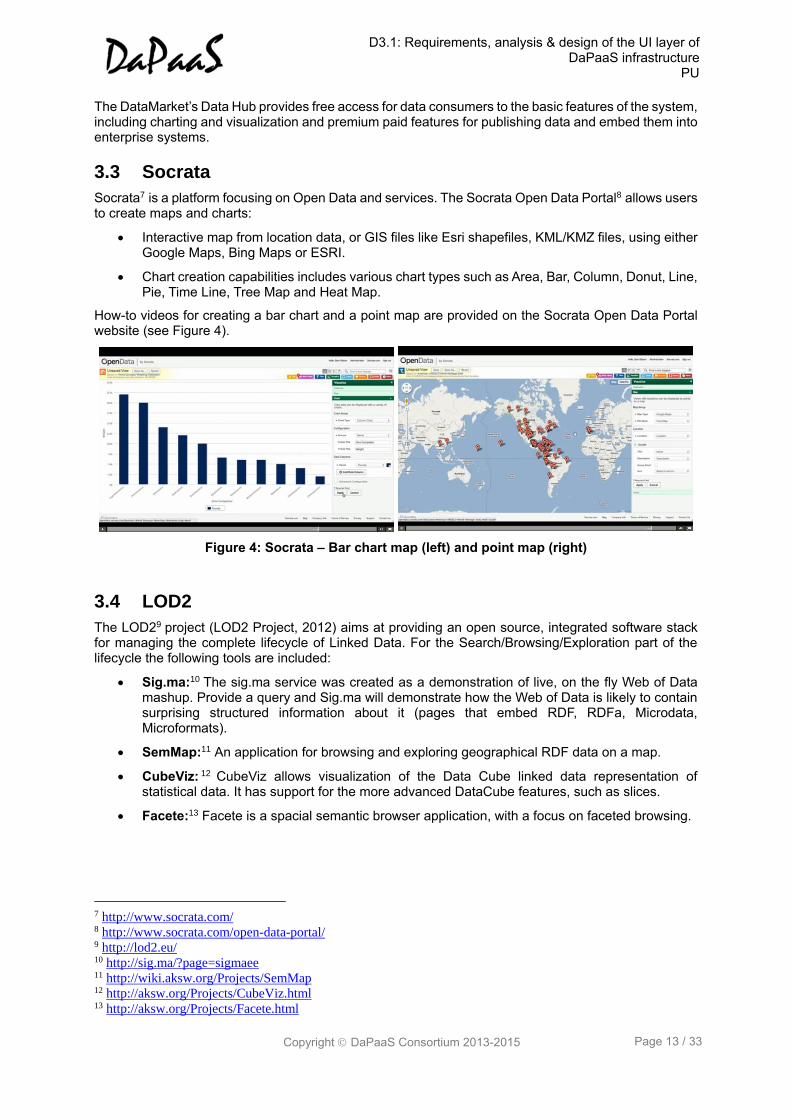
Socrata7 is a platform focusing on Open Data and services. The Socrata Open Data Portal8 allows users to create maps and charts:
Interactive map from location data, or GIS files like Esri shapefiles, KML/KMZ files, using either Google Maps, Bing Maps or ESRI.
Chart creation capabilities includes various chart types such as Area, Bar, Column, Donut, Line, Pie, Time Line, Tree Map and Heat Map.
How-to videos for creating a bar chart and a point map are provided on the Socrata Open Data Portal website (see Figure 4).
Figure 4: Socrata – Bar chart map (left) and point map (right)
3.4 LOD2
The LOD29 project (LOD2 Project, 2012) aims at providing an open source, integrated software stack for managing the complete lifecycle of Linked Data. For the Search/Browsing/Exploration part of the lifecycle the following tools are included:
Sig.ma:10 The sig.ma service was created as a demonstration of live, on the fly Web of Data mashup. Provide a query and Sig.ma will demonstrate how the Web of Data is likely to contain surprising structured information about it (pages that embed RDF, RDFa, Microdata, Microformats).
SemMap:11 An application for browsing and exploring geographical RDF data on a map.
CubeViz: 12 CubeViz allows visualization of the Data Cube linked data representation of statistical data. It has support for the more advanced DataCube features, such as slices.
Facete:13 Facete is a spacial semantic browser application, with a focus on faceted browsing.
7 http://www.socrata.com/ 8 http://www.socrata.com/open-data-portal/ 9 http://lod2.eu/ 10 http://sig.ma/?page=sigmaee 11 http://wiki.aksw.org/Projects/SemMap 12 http://aksw.org/Projects/CubeViz.html 13 http://aksw.org/Projects/Facete.html
D3.1: Requirements, analysis & design of the UI layer of DaPaaS infrastructure
PU
Copyright DaPaaS Consortium 2013-2015 Page 14 / 33
3.5 European Union Open Data Portal
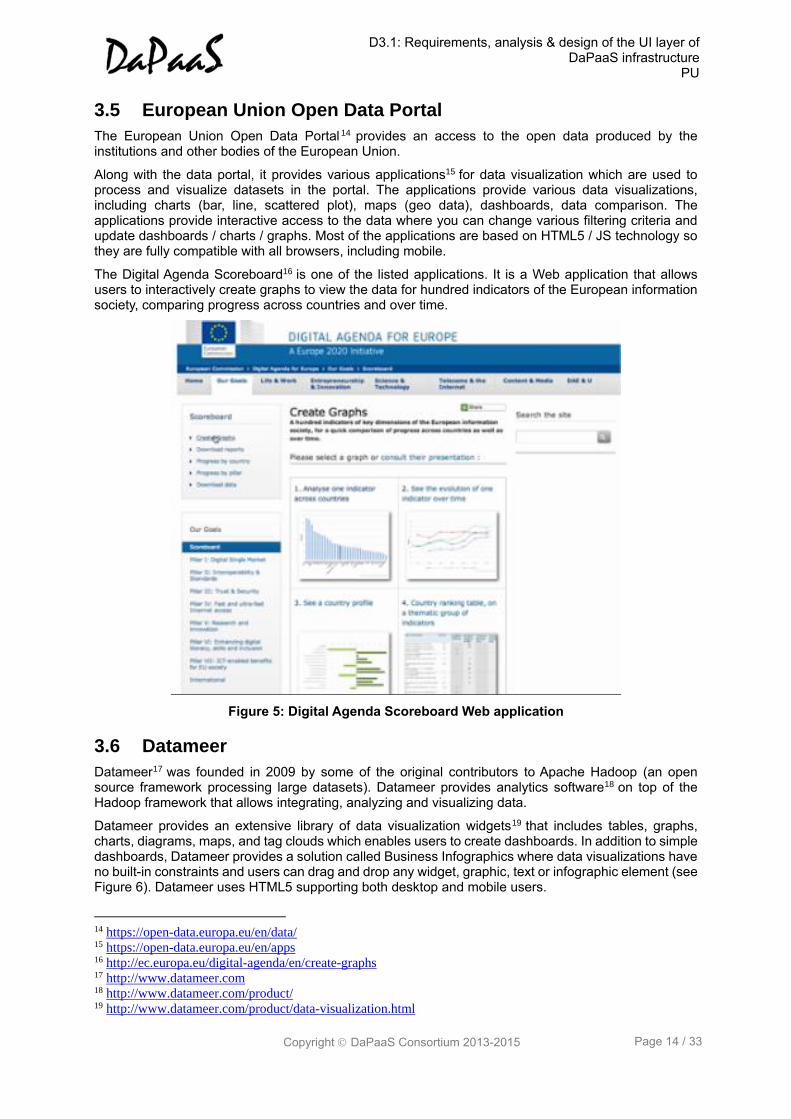
The European Union Open Data Portal 14 provides an access to the open data produced by the institutions and other bodies of the European Union.
Along with the data portal, it provides various applications15 for data visualization which are used to process and visualize datasets in the portal. The applications provide various data visualizations, including charts (bar, line, scattered plot), maps (geo data), dashboards, data comparison. The applications provide interactive access to the data where you can change various filtering criteria and update dashboards / charts / graphs. Most of the applications are based on HTML5 / JS technology so they are fully compatible with all browsers, including mobile.
The Digital Agenda Scoreboard16 is one of the listed applications. It is a Web application that allows users to interactively create graphs to view the data for hundred indicators of the European information society, comparing progress across countries and over time.
Figure 5: Digital Agenda Scoreboard Web application
3.6 Datameer
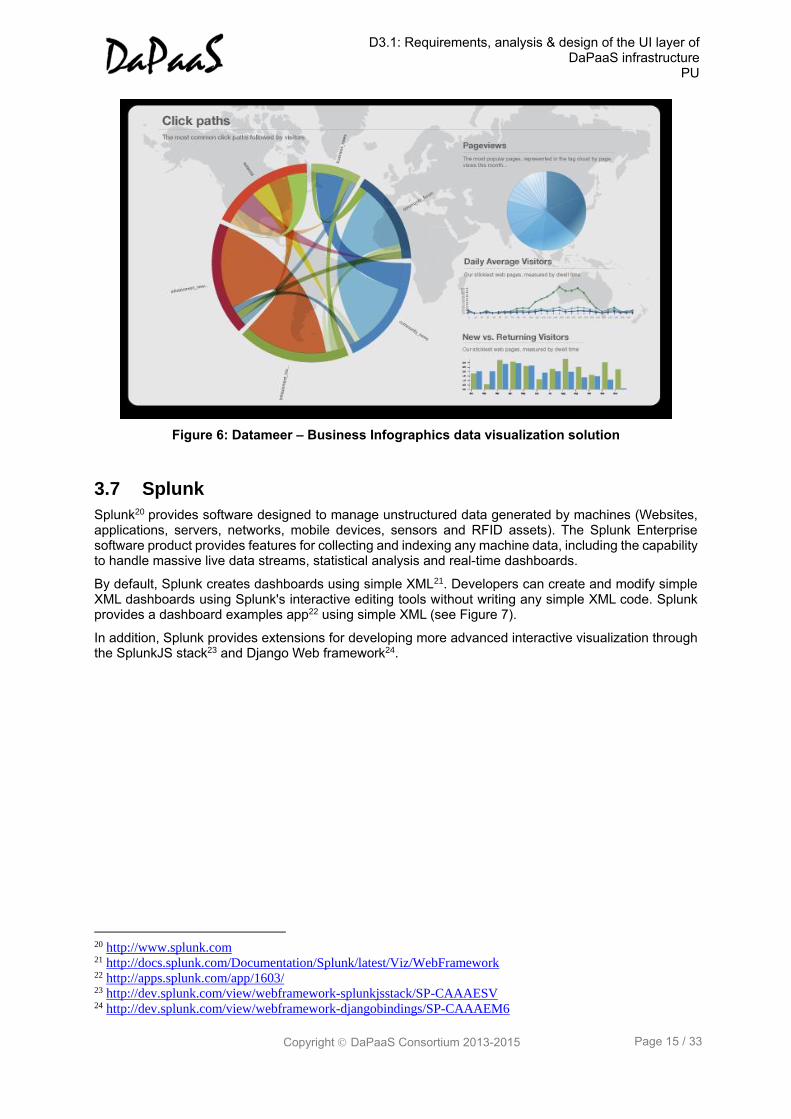
Datameer17 was founded in 2009 by some of the original contributors to Apache Hadoop (an open source framework processing large datasets). Datameer provides analytics software18 on top of the Hadoop framework that allows integrating, analyzing and visualizing data.
Datameer provides an extensive library of data visualization widgets19 that includes tables, graphs, charts, diagrams, maps, and tag clouds which enables users to create dashboards. In addition to simple dashboards, Datameer provides a solution called Business Infographics where data visualizations have no built-in constraints and users can drag and drop any widget, graphic, text or infographic element (see Figure 6). Datameer uses HTML5 supporting both desktop and mobile users.
14 https://open-data.europa.eu/en/data/ 15 https://open-data.europa.eu/en/apps 16 http://ec.europa.eu/digital-agenda/en/create-graphs 17 http://www.datameer.com 18 http://www.datameer.com/product/ 19 http://www.datameer.com/product/data-visualization.html
D3.1: Requirements, analysis & design of the UI layer of DaPaaS infrastructure
PU
Copyright DaPaaS Consortium 2013-2015 Page 15 / 33
Figure 6: Datameer – Business Infographics data visualization solution
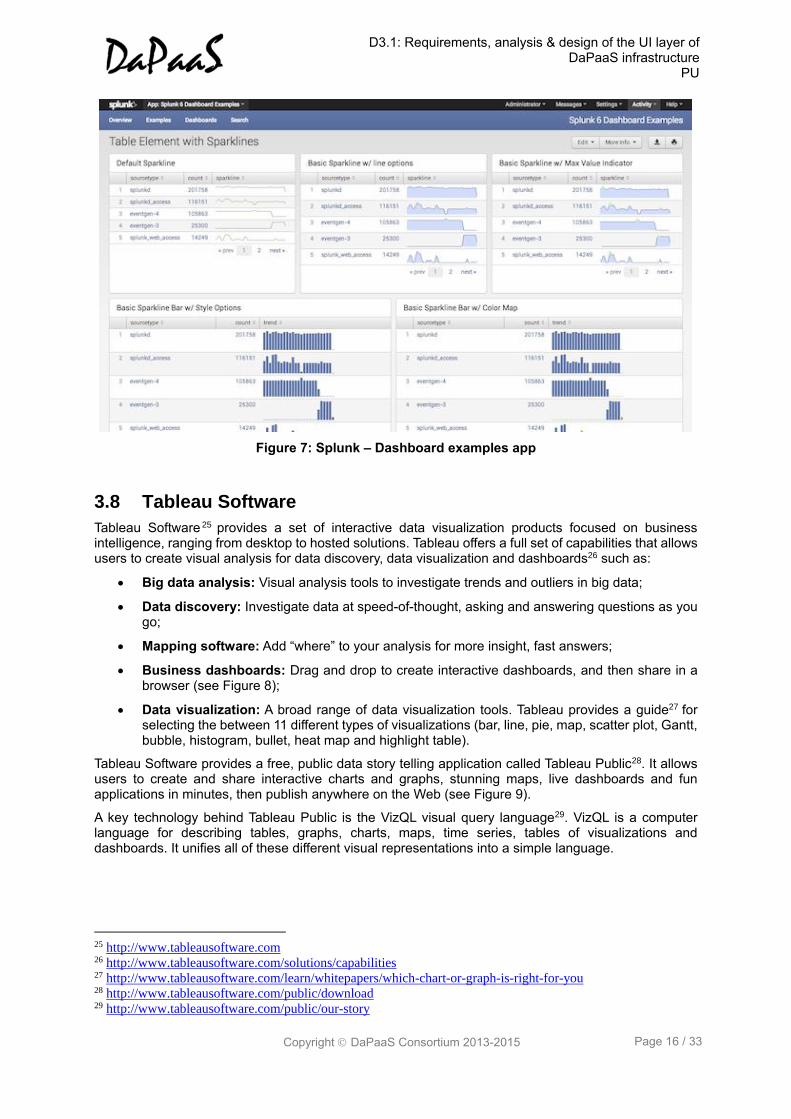
3.7 Splunk
Splunk20 provides software designed to manage unstructured data generated by machines (Websites, applications, servers, networks, mobile devices, sensors and RFID assets). The Splunk Enterprise software product provides features for collecting and indexing any machine data, including the capability to handle massive live data streams, statistical analysis and real-time dashboards.
By default, Splunk creates dashboards using simple XML21. Developers can create and modify simple XML dashboards using Splunk's interactive editing tools without writing any simple XML code. Splunk provides a dashboard examples app22 using simple XML (see Figure 7).
In addition, Splunk provides extensions for developing more advanced interactive visualization through the SplunkJS stack23 and Django Web framework24.
20 http://www.splunk.com 21 http://docs.splunk.com/Documentation/Splunk/latest/Viz/WebFramework 22 http://apps.splunk.com/app/1603/ 23 http://dev.splunk.com/view/webframework-splunkjsstack/SP-CAAAESV 24 http://dev.splunk.com/view/webframework-djangobindings/SP-CAAAEM6
D3.1: Requirements, analysis & design of the UI layer of DaPaaS infrastructure
PU
Copyright DaPaaS Consortium 2013-2015 Page 16 / 33
Figure 7: Splunk – Dashboard examples app
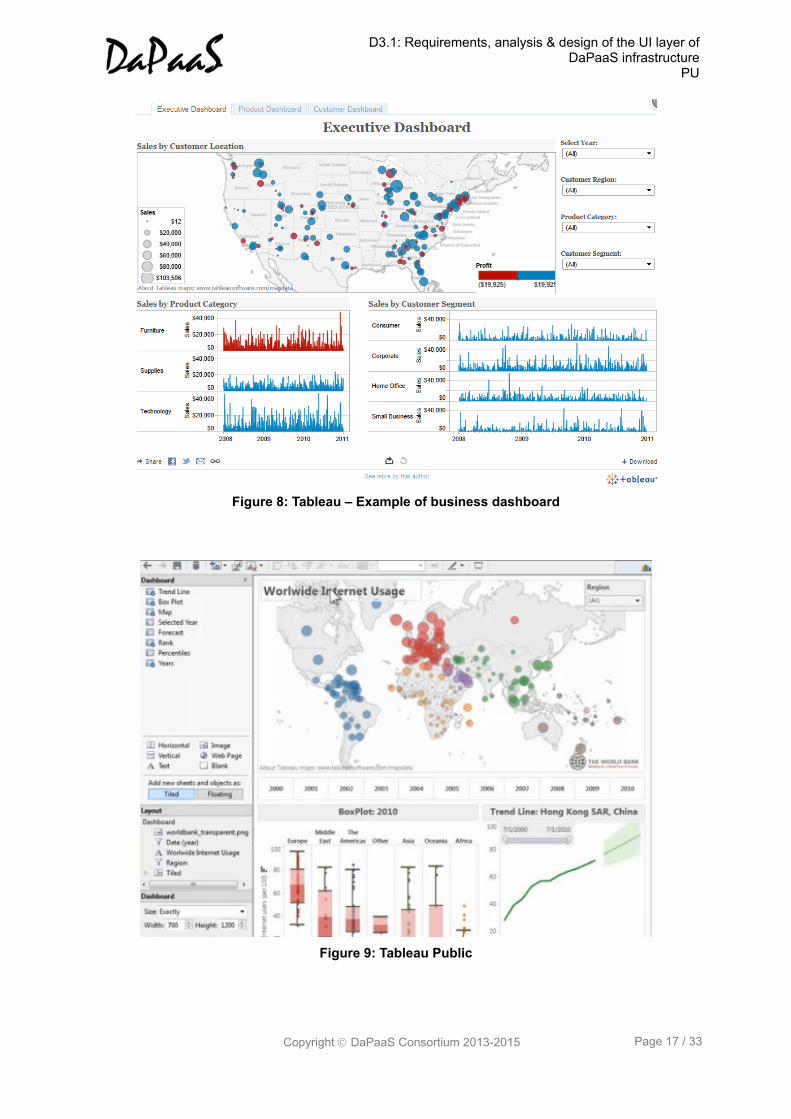
3.8 Tableau Software
Tableau Software 25 provides a set of interactive data visualization products focused on business intelligence, ranging from desktop to hosted solutions. Tableau offers a full set of capabilities that allows users to create visual analysis for data discovery, data visualization and dashboards26 such as:
Big data analysis: Visual analysis tools to investigate trends and outliers in big data;
Data discovery: Investigate data at speed-of-thought, asking and answering questions as you go;
Mapping software: Add “where” to your analysis for more insight, fast answers;
Business dashboards: Drag and drop to create interactive dashboards, and then share in a browser (see Figure 8);
Data visualization: A broad range of data visualization tools. Tableau provides a guide27 for selecting the between 11 different types of visualizations (bar, line, pie, map, scatter plot, Gantt, bubble, histogram, bullet, heat map and highlight table).
Tableau Software provides a free, public data story telling application called Tableau Public28. It allows users to create and share interactive charts and graphs, stunning maps, live dashboards and fun applications in minutes, then publish anywhere on the Web (see Figure 9).
A key technology behind Tableau Public is the VizQL visual query language29. VizQL is a computer language for describing tables, graphs, charts, maps, time series, tables of visualizations and dashboards. It unifies all of these different visual representations into a simple language.
25 http://www.tableausoftware.com 26 http://www.tableausoftware.com/solutions/capabilities 27 http://www.tableausoftware.com/learn/whitepapers/which-chart-or-graph-is-right-for-you 28 http://www.tableausoftware.com/public/download 29 http://www.tableausoftware.com/public/our-story
D3.1: Requirements, analysis & design of the UI layer of DaPaaS infrastructure
PU
Copyright DaPaaS Consortium 2013-2015 Page 17 / 33
Figure 8: Tableau – Example of business dashboard
Figure 9: Tableau Public
D3.1: Requirements, analysis & design of the UI layer of DaPaaS infrastructure
PU
Copyright DaPaaS Consortium 2013-2015 Page 18 / 33
4 UI Layer Architecture In Section 1 and 2 above we introduced the UX Layer of the DaPaaS platform, together with visualization requirements. Based on these high-level requirements, this section outlines the “technical view” of the DaPaaS UX Layer with concrete capabilities and components supporting the identified requirements.
4.1 Functional Aspects
As the UX Layer has to deal with graphical widgets for various types of data visualizations and ensure mechanisms for efficient access to data from the graphical interfaces, the architecture of this Layer will have to support integration of graphical components / widgets, and components related to efficient data access. In the following we briefly introduce the components necessary to address the visualization aspects of the platform.
4.1.1 Graphical Widgets
Graphical widgets are reusable components that display data as charts, tables, etc., and can be easily customized and used to create dashboards, infographics or embed in Web pages. The widgets should be accessible both from desktop and mobile devices. The UX Layer will support the following widgets:
Table widget – displays tabular data. This component is appropriate for use when multi-dimensional data need to be displayed.
Bar chart widget – displays comparison of two or more datasets.
Line chart widget – displays change of data over time.
Pie chart widget – displays structure of data.
Scatter plot – displays relation of elements.
4.1.2 Data Summarization
The UI interface, especially data consumer interfaces (including mobile), should provide means for easy data exploration and analysis, including dashboard and different data visualization techniques. The data consumer clients will not download entire datasets in order to display data on charts or dashboards. Data aggregation / summarization will be implemented on the server and only the minimal sets of required data for visualization will be transferred to the client.
4.1.3 Caching
Caching of query results is required in order to improve the UX Layer performance and scalability and reduce the overload of the back end components of the platform. Caching algorithms can be implemented on several levels:
Caching most frequently used data;
Caching API calls, eliminating need to make consequence call to the same API;
Caching UX Layer response to the graphical widget, eliminating need to process data from the backend.
4.1.4 Notifications
The notifications component is used internally as a message bus between other components, providing effective way to subscribe for certain events and get notified when event happened. Events can trigger synchronization actions between internal components, such as updating data, updating chart, show report, etc. This will complement the data summarization functionality and act as a mechanism for exchanging data between the clients and the platform.
D3.1: Requirements, analysis & design of the UI layer of DaPaaS infrastructure
PU
Copyright DaPaaS Consortium 2013-2015 Page 19 / 33
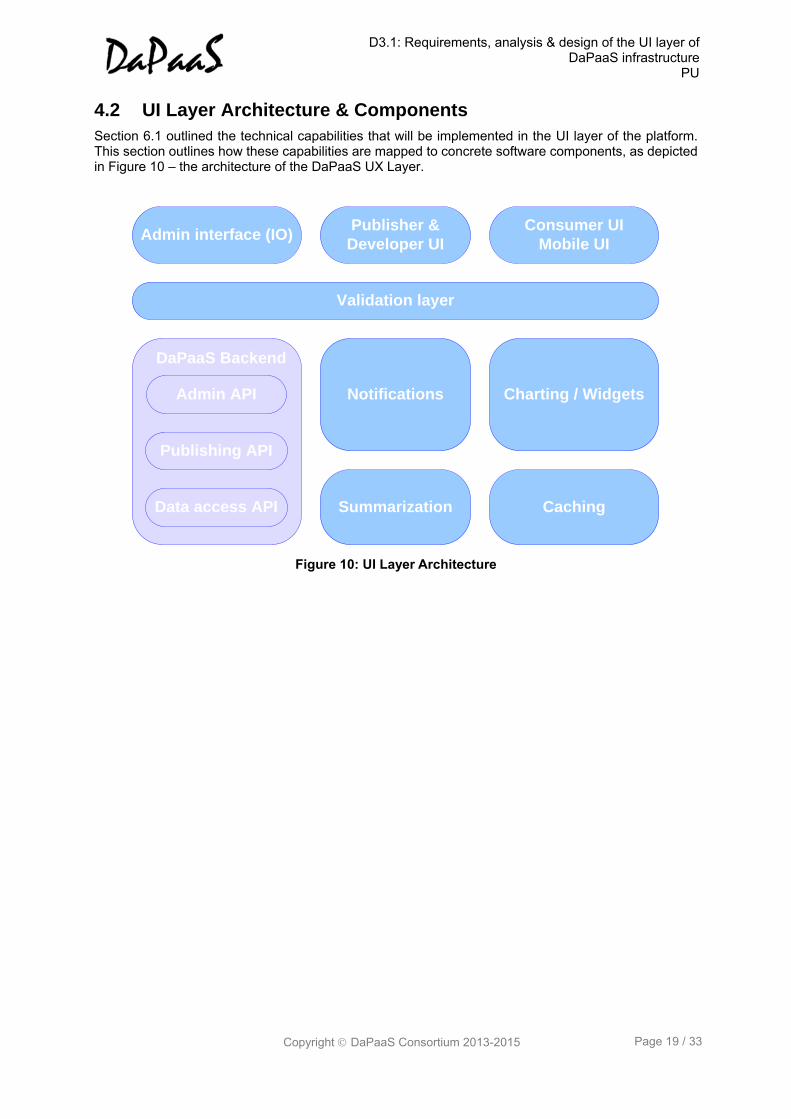
4.2 UI Layer Architecture & Components
Section 6.1 outlined the technical capabilities that will be implemented in the UI layer of the platform. This section outlines how these capabilities are mapped to concrete software components, as depicted in Figure 10 – the architecture of the DaPaaS UX Layer.
Figure 10: UI Layer Architecture
CachingSummarization
Admin interface (IO)Publisher &
Developer UI
Consumer UI
Mobile UI
Validation layer
DaPaaS Backend
Data access API
Publishing API
Admin API Charting / WidgetsNotifications
D3.1: Requirements, analysis & design of the UI layer of DaPaaS infrastructure
PU
Copyright DaPaaS Consortium 2013-2015 Page 20 / 33
5 Relevant Tools This section identifies tools that can be relevant to the development of UX Layer components. Due to specifics of some components we may need to develop them from scratch.
Summarization component requests data from the backend and aggregates it into small datasets that can be relevant to the selected visualization widget. Due to specifics of DaPaaS project this component needs to be developed from the scratch.
The Caching component is relevant for the data after summarization, and provides server-side caching capabilities for the processed data. Due to specifics of the implementation of caching, this component will be developed from scratch.
Widgets will display standard charts and can be implemented using support chart libraries which match the requirements for the UX Layer.
The rest of this section will review some of the visualization libraries and HTML5 libraries that can be used for UX Layer for DaPaaS Platform. With few exceptions, most of the frameworks that provide charting capabilities are focused only on visualization and does not provide any additional functionality. In order to provide reasonable comparison we have separated visualization frameworks from HTML5 frameworks.
5.1 Visualization Frameworks
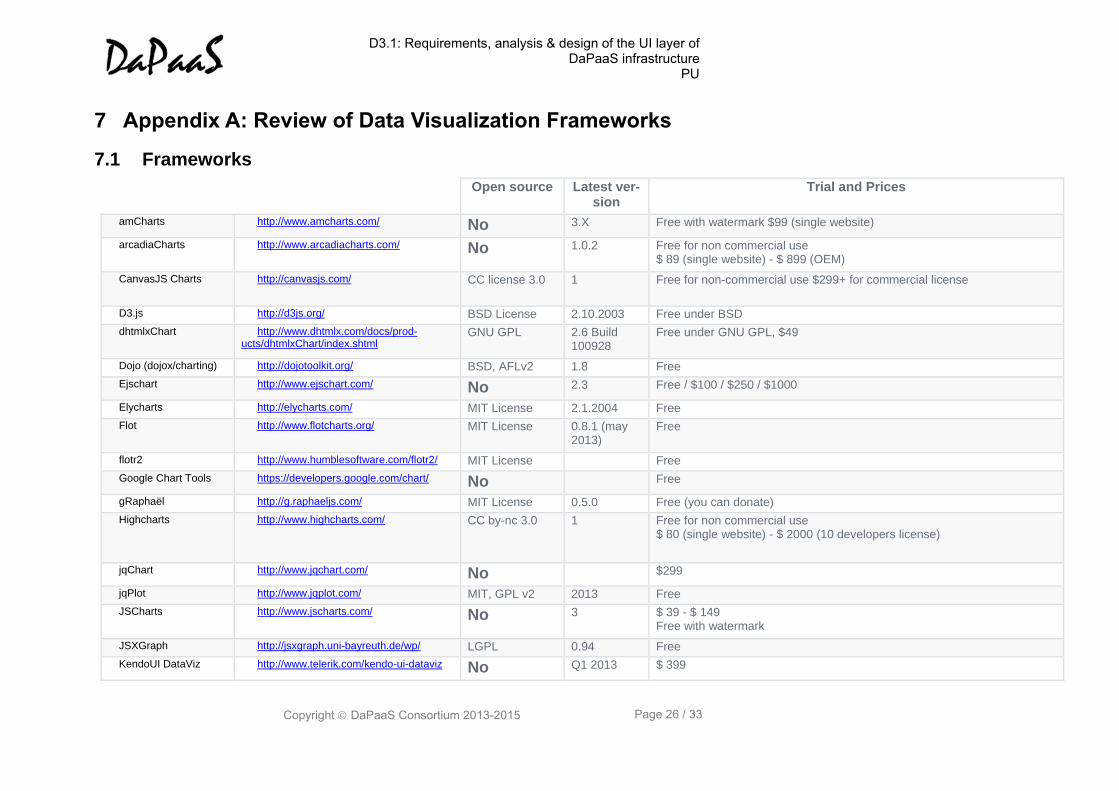
As a part of Task 3.1 more than 30 popular visualization frameworks have been reviewed. Appendix A shows a table of reviewed frameworks with their attributes: supported chart types, features, supported browsers, etc.
Based on this review, the most relevant frameworks for the DaPaaS Platform are included in this section. The selection process includes libraries that are open source, free, supporting desktop and mobile devices, matching requirements for the outlined visualization types, with reasonable documentation, examples and support community, and are regularly maintained.
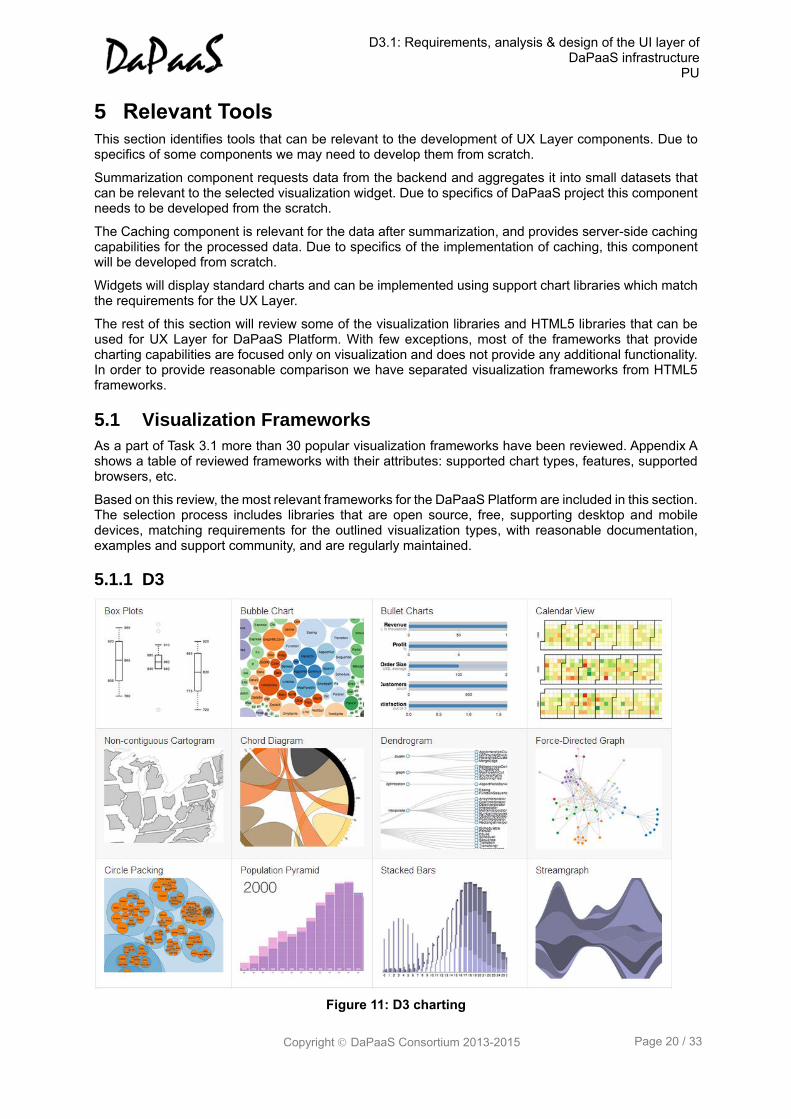
5.1.1 D3
Figure 11: D3 charting
D3.1: Requirements, analysis & design of the UI layer of DaPaaS infrastructure
PU
Copyright DaPaaS Consortium 2013-2015 Page 21 / 33
http://d3js.org
D3.js is a JavaScript library for manipulating documents based on data and data visualization library based on HTML, SVG and CSS. The framework provides quite extensive APIs not just for visualization but also for managing data driven documents and transforming them into HTML, XML or directly manipulate their content.
Maintenance
The D3 library is quite mature, with good community, documentation and examples.
https://github.com/mbostock/d3/wiki/Gallery
https://github.com/mbostock/d3/wiki
Licensing
D3 is free, open source JavaScript library, licensed under BSD.
Accessibility
The D3 framework is quite extensive with many feature, but with steep learning curve. The leading time to start using framework is longer than with other visualization frameworks.
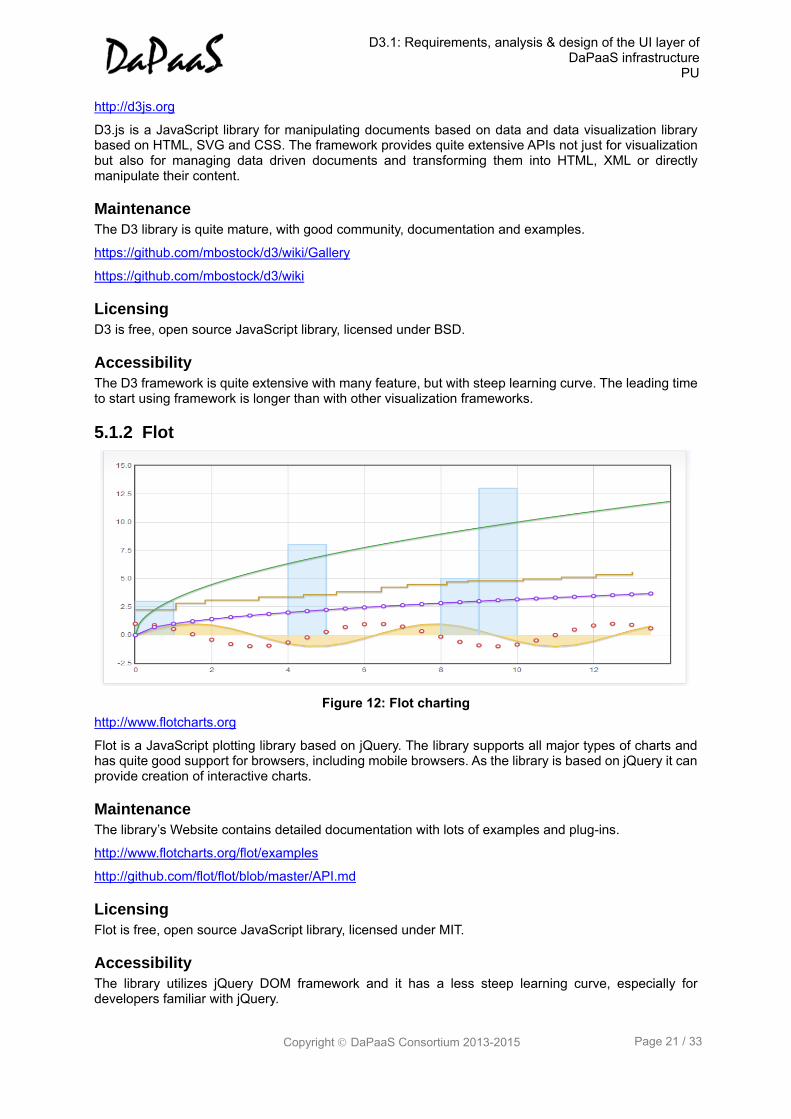
5.1.2 Flot
Figure 12: Flot charting
http://www.flotcharts.org
Flot is a JavaScript plotting library based on jQuery. The library supports all major types of charts and has quite good support for browsers, including mobile browsers. As the library is based on jQuery it can provide creation of interactive charts.
Maintenance
The library’s Website contains detailed documentation with lots of examples and plug-ins.
http://www.flotcharts.org/flot/examples
http://github.com/flot/flot/blob/master/API.md
Licensing
Flot is free, open source JavaScript library, licensed under MIT.
Accessibility
The library utilizes jQuery DOM framework and it has a less steep learning curve, especially for developers familiar with jQuery.
D3.1: Requirements, analysis & design of the UI layer of DaPaaS infrastructure
PU
Copyright DaPaaS Consortium 2013-2015 Page 22 / 33
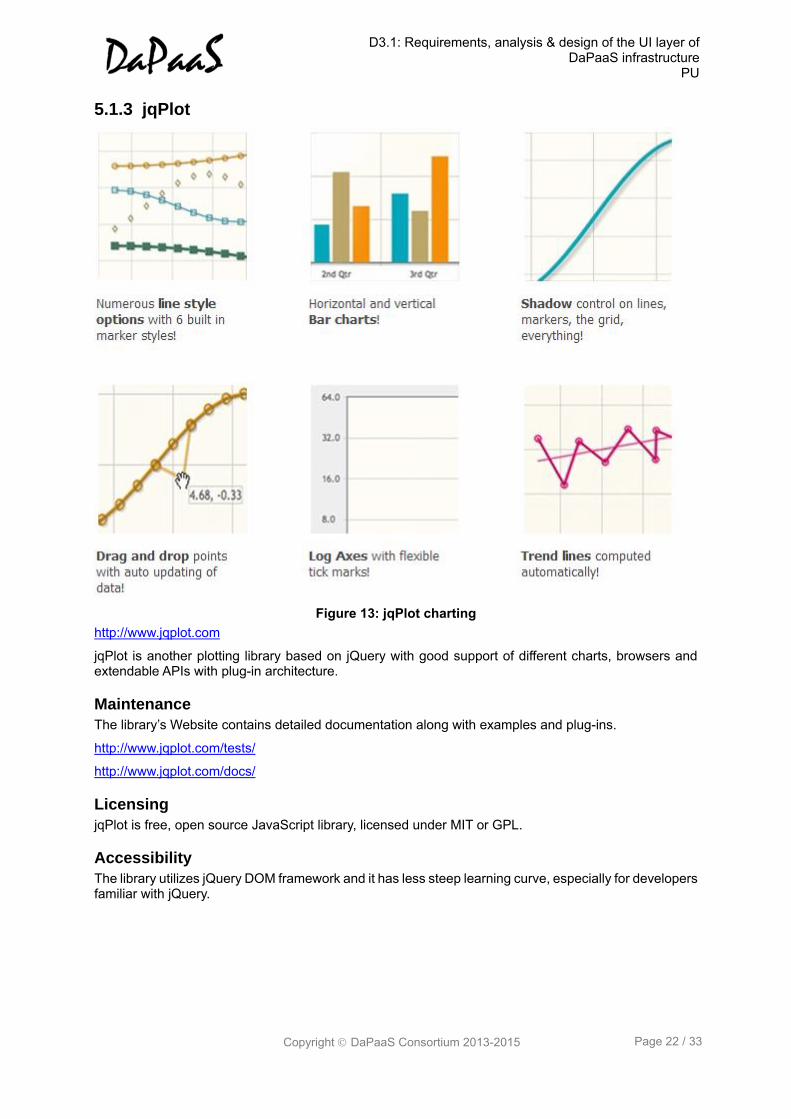
5.1.3 jqPlot
Figure 13: jqPlot charting
http://www.jqplot.com
jqPlot is another plotting library based on jQuery with good support of different charts, browsers and extendable APIs with plug-in architecture.
Maintenance
The library’s Website contains detailed documentation along with examples and plug-ins.
http://www.jqplot.com/tests/
http://www.jqplot.com/docs/
Licensing
jqPlot is free, open source JavaScript library, licensed under MIT or GPL.
Accessibility
The library utilizes jQuery DOM framework and it has less steep learning curve, especially for developers familiar with jQuery.
D3.1: Requirements, analysis & design of the UI layer of DaPaaS infrastructure
PU
Copyright DaPaaS Consortium 2013-2015 Page 23 / 33
5.2 Mobile UI Frameworks
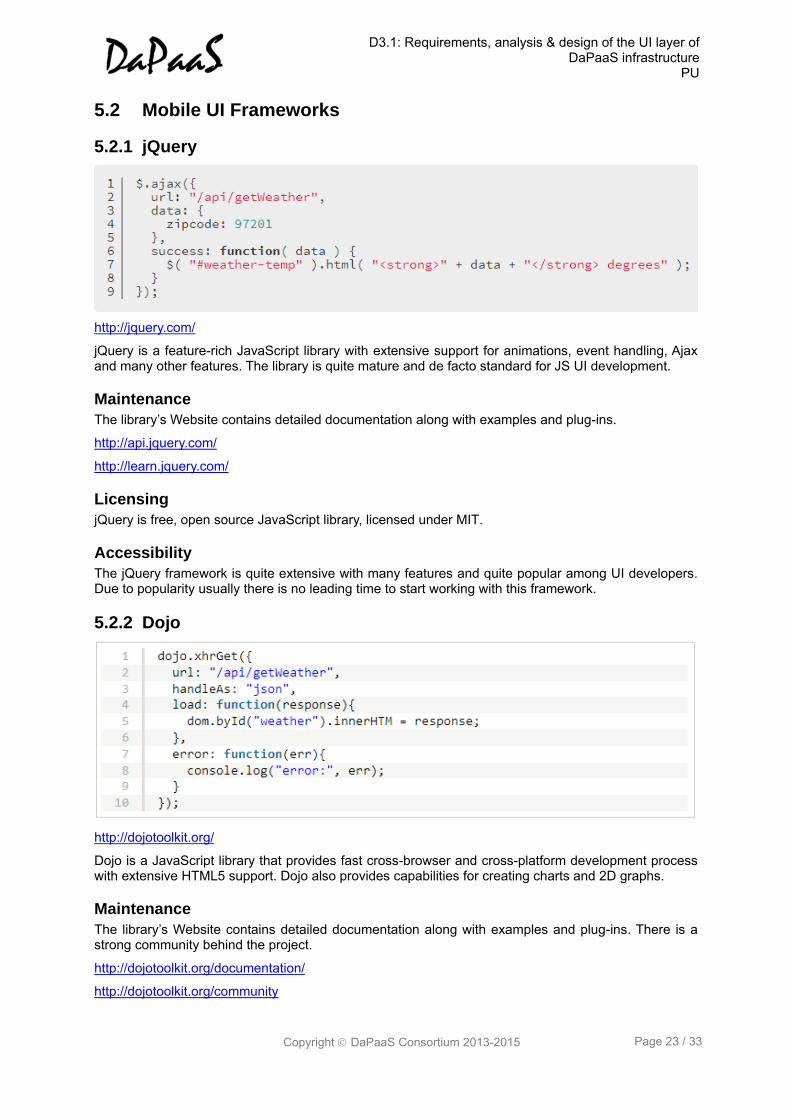
5.2.1 jQuery
http://jquery.com/
jQuery is a feature-rich JavaScript library with extensive support for animations, event handling, Ajax and many other features. The library is quite mature and de facto standard for JS UI development.
Maintenance
The library’s Website contains detailed documentation along with examples and plug-ins.
http://api.jquery.com/
http://learn.jquery.com/
Licensing
jQuery is free, open source JavaScript library, licensed under MIT.
Accessibility
The jQuery framework is quite extensive with many features and quite popular among UI developers. Due to popularity usually there is no leading time to start working with this framework.
5.2.2 Dojo
http://dojotoolkit.org/
Dojo is a JavaScript library that provides fast cross-browser and cross-platform development process with extensive HTML5 support. Dojo also provides capabilities for creating charts and 2D graphs.
Maintenance
The library’s Website contains detailed documentation along with examples and plug-ins. There is a strong community behind the project.
http://dojotoolkit.org/documentation/
http://dojotoolkit.org/community
D3.1: Requirements, analysis & design of the UI layer of DaPaaS infrastructure
PU
Copyright DaPaaS Consortium 2013-2015 Page 24 / 33
Licensing
Dojo is free, open source JavaScript library, licensed under BSD.
Accessibility
The Dojo framework is quite extensive with many feature, but with steep learning curve. The learning time to start using framework is longer than with other frameworks.
D3.1: Requirements, analysis & design of the UI layer of DaPaaS infrastructure
PU
Copyright DaPaaS Consortium 2013-2015 Page 25 / 33
6 Summary and Outlook This document provided an overview of the UX Layer of the DaPaaS platform, outlined a set of requirements for the UX Layer from the perspective of key roles, and the visualization types the platform should support. Furthermore, it provided an initial architecture design for the UX Layer and associated core components, provided a state-of-the-art overview of how relevant DaaS and integrated DaaS and PaaS solutions deal with data visualization, and surveyed relevant visualization frameworks relevant for the implementation of the UX Layer. Following the technology evaluation performed as part of this document, the following remarks are to be considered for the implementation phase of the UX Layer, with a particular focus on the Platform Layer:
jQuery is the one of the most widely used libraries for client side scripting used all around the Web and obvious choice for creating dynamic Web 2.0 sites. There are a lot of plugins available for jQuery covering different aspects such as tabs, accordions, dialog boxes, etc. This library is an obvious choice for creating Web interfaces for the DaPaaS platform.
Dojo is similar to the jQuery library with good support for creating different visual interface ele-ments, such as tabs, dialogs, etc. The library has strong community behind it and it is second most used client side scripting library for Web applications. This library is the second best choice for creating Web interfaces for the DaPaaS platform. Dojo has some advantages over jQuery regarding the support for charts – there is charting functionality implemented in the library. Un-fortunately the internal charting functionality is not as strong as other solutions mentioned in this document.
D3 is a quite sophisticated library with excellent support for charts, matching DaPaaS require-ments. It is open source, has good active community supporting it and lot of examples. The library is an excellent choice for generating dynamic charts. The main disadvantage of D3 is that the development effort needed to create widgets based on this library is significant com-pared to other alternatives.
jqPlot and Flot are excellent alternatives for D3. Even though these two frameworks provide less functionality than D3, they match the requirements outlined in this document and can im-plement all the required functionality related to visualization types.
We need further investigation concerning the choice of jqPlot/Flot vs D3 in order to select the best alternative for DaPaaS based on development efforts, project requirements, and future development of the project.
The Caching and Summarization components shall be developed from the scratch to meet pro-ject specifics.
D3.1: Requirements, analysis & design of the UI layer of DaPaaS infrastructure
PU
Copyright DaPaaS Consortium 2013-2015 Page 26 / 33
7 Appendix A: Review of Data Visualization Frameworks
7.1 Frameworks
Open source Latest ver-sion
Trial and Prices
amCharts http://www.amcharts.com/ No 3.X Free with watermark $99 (single website)
arcadiaCharts http://www.arcadiacharts.com/ No 1.0.2 Free for non commercial use $ 89 (single website) - $ 899 (OEM)
CanvasJS Charts http://canvasjs.com/ CC license 3.0 1 Free for non-commercial use $299+ for commercial license
D3.js http://d3js.org/ BSD License 2.10.2003 Free under BSD
dhtmlxChart http://www.dhtmlx.com/docs/prod-ucts/dhtmlxChart/index.shtml
GNU GPL 2.6 Build 100928
Free under GNU GPL, $49
Dojo (dojox/charting) http://dojotoolkit.org/ BSD, AFLv2 1.8 Free
Ejschart http://www.ejschart.com/ No 2.3 Free / $100 / $250 / $1000
Elycharts http://elycharts.com/ MIT License 2.1.2004 Free
Flot http://www.flotcharts.org/ MIT License 0.8.1 (may 2013)
Free
flotr2 http://www.humblesoftware.com/flotr2/ MIT License Free
Google Chart Tools https://developers.google.com/chart/ No Free
gRaphaël http://g.raphaeljs.com/ MIT License 0.5.0 Free (you can donate)
Highcharts http://www.highcharts.com/ CC by-nc 3.0 1 Free for non commercial use $ 80 (single website) - $ 2000 (10 developers license)
jqChart http://www.jqchart.com/ No $299
jqPlot http://www.jqplot.com/ MIT, GPL v2 2013 Free
JSCharts http://www.jscharts.com/ No 3 $ 39 - $ 149 Free with watermark
JSXGraph http://jsxgraph.uni-bayreuth.de/wp/ LGPL 0.94 Free
KendoUI DataViz http://www.telerik.com/kendo-ui-dataviz No Q1 2013 $ 399
D3.1: Requirements, analysis & design of the UI layer of DaPaaS infrastructure
PU
Copyright DaPaaS Consortium 2013-2015 Page 27 / 33
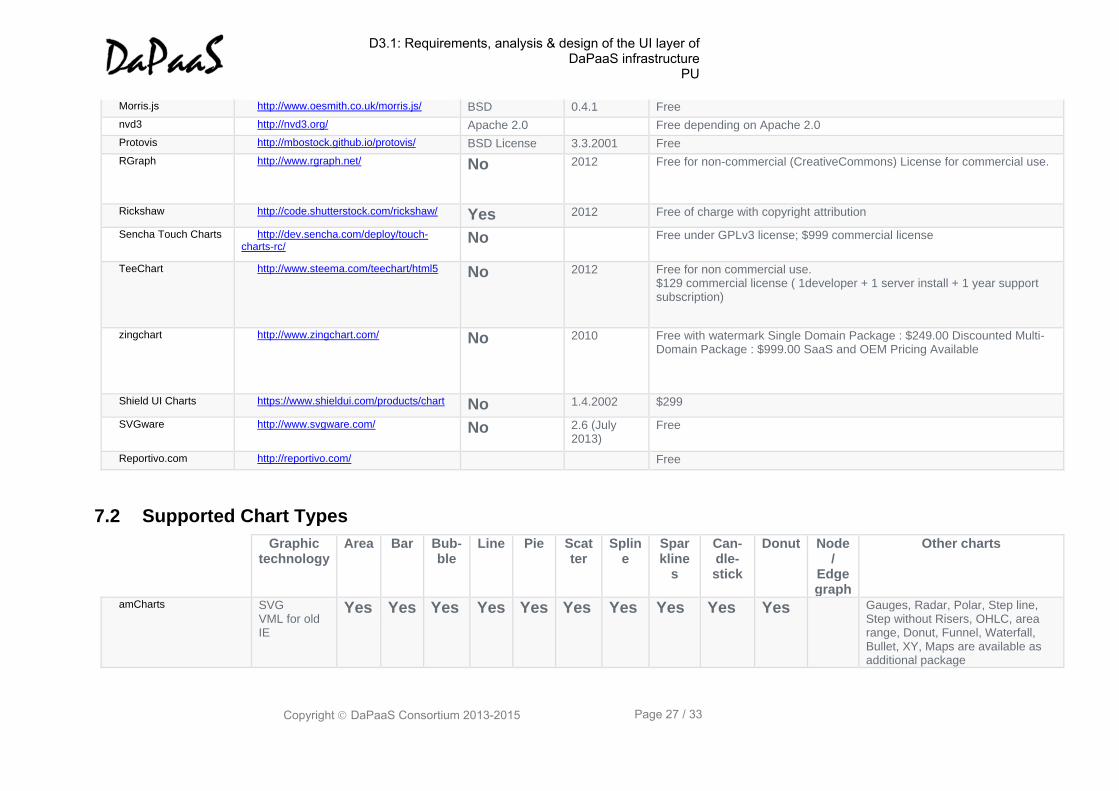
Morris.js http://www.oesmith.co.uk/morris.js/ BSD 0.4.1 Free
nvd3 http://nvd3.org/ Apache 2.0 Free depending on Apache 2.0
Protovis http://mbostock.github.io/protovis/ BSD License 3.3.2001 Free
RGraph http://www.rgraph.net/ No 2012 Free for non-commercial (CreativeCommons) License for commercial use.
Rickshaw http://code.shutterstock.com/rickshaw/ Yes 2012 Free of charge with copyright attribution
Sencha Touch Charts http://dev.sencha.com/deploy/touch-charts-rc/
No Free under GPLv3 license; $999 commercial license
TeeChart http://www.steema.com/teechart/html5 No 2012 Free for non commercial use. $129 commercial license ( 1developer + 1 server install + 1 year support subscription)
zingchart http://www.zingchart.com/ No 2010 Free with watermark Single Domain Package : $249.00 Discounted Multi-Domain Package : $999.00 SaaS and OEM Pricing Available
Shield UI Charts https://www.shieldui.com/products/chart No 1.4.2002 $299
SVGware http://www.svgware.com/ No 2.6 (July 2013)
Free
Reportivo.com http://reportivo.com/ Free
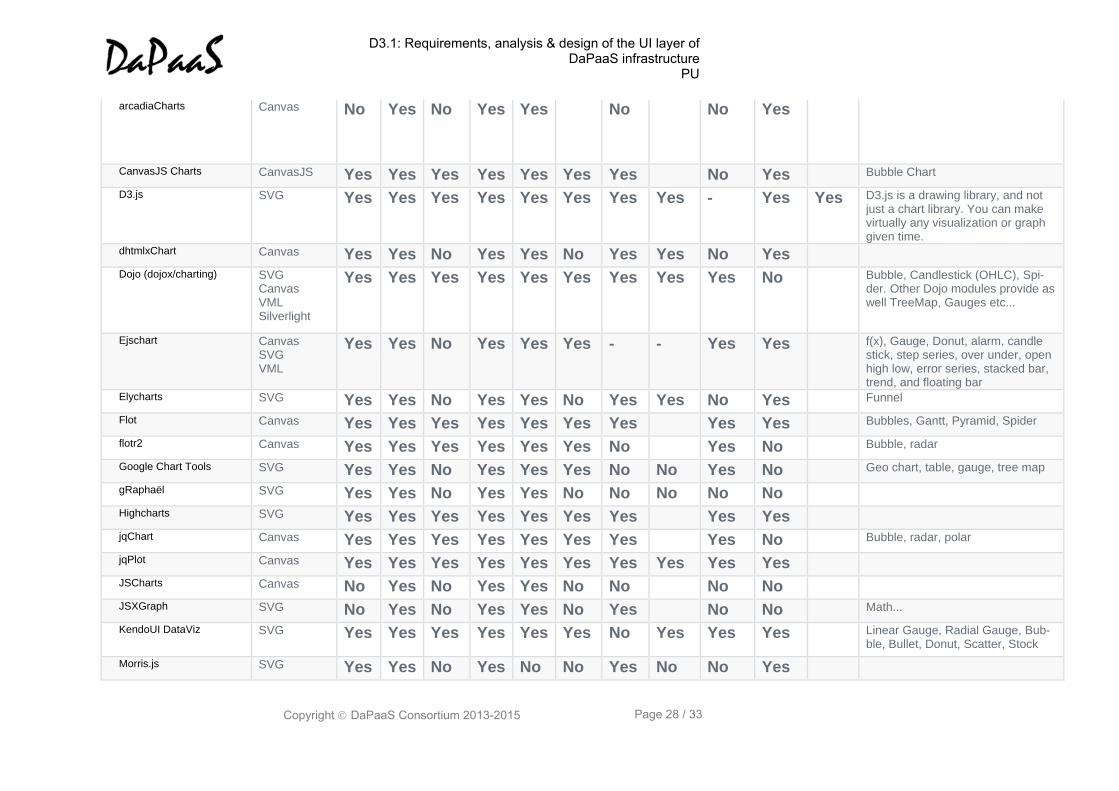
7.2 Supported Chart Types
Graphic technology
Area Bar Bub-ble
Line Pie Scatter
Spline
Sparkline
s
Can-dle-stick
Donut Node /
Edge graph
Other charts
amCharts SVG VML for old IE
Yes Yes Yes Yes Yes Yes Yes Yes Yes Yes Gauges, Radar, Polar, Step line, Step without Risers, OHLC, area range, Donut, Funnel, Waterfall, Bullet, XY, Maps are available as additional package
D3.1: Requirements, analysis & design of the UI layer of DaPaaS infrastructure
PU
Copyright DaPaaS Consortium 2013-2015 Page 28 / 33
arcadiaCharts Canvas No Yes No Yes Yes No No Yes
CanvasJS Charts CanvasJS Yes Yes Yes Yes Yes Yes Yes No Yes Bubble Chart
D3.js SVG Yes Yes Yes Yes Yes Yes Yes Yes - Yes Yes D3.js is a drawing library, and not just a chart library. You can make virtually any visualization or graph given time.
dhtmlxChart Canvas Yes Yes No Yes Yes No Yes Yes No Yes
Dojo (dojox/charting) SVG Canvas VML Silverlight
Yes Yes Yes Yes Yes Yes Yes Yes Yes No Bubble, Candlestick (OHLC), Spi-der. Other Dojo modules provide as well TreeMap, Gauges etc...
Ejschart Canvas SVG VML
Yes Yes No Yes Yes Yes - - Yes Yes f(x), Gauge, Donut, alarm, candle stick, step series, over under, open high low, error series, stacked bar, trend, and floating bar
Elycharts SVG Yes Yes No Yes Yes No Yes Yes No Yes Funnel
Flot Canvas Yes Yes Yes Yes Yes Yes Yes Yes Yes Bubbles, Gantt, Pyramid, Spider
flotr2 Canvas Yes Yes Yes Yes Yes Yes No Yes No Bubble, radar
Google Chart Tools SVG Yes Yes No Yes Yes Yes No No Yes No Geo chart, table, gauge, tree map
gRaphaël SVG Yes Yes No Yes Yes No No No No No
Highcharts SVG Yes Yes Yes Yes Yes Yes Yes Yes Yes
jqChart Canvas Yes Yes Yes Yes Yes Yes Yes Yes No Bubble, radar, polar
jqPlot Canvas Yes Yes Yes Yes Yes Yes Yes Yes Yes Yes
JSCharts Canvas No Yes No Yes Yes No No No No
JSXGraph SVG No Yes No Yes Yes No Yes No No Math...
KendoUI DataViz SVG Yes Yes Yes Yes Yes Yes No Yes Yes Yes Linear Gauge, Radial Gauge, Bub-ble, Bullet, Donut, Scatter, Stock
Morris.js SVG Yes Yes No Yes No No Yes No No Yes
D3.1: Requirements, analysis & design of the UI layer of DaPaaS infrastructure
PU
Copyright DaPaaS Consortium 2013-2015 Page 29 / 33
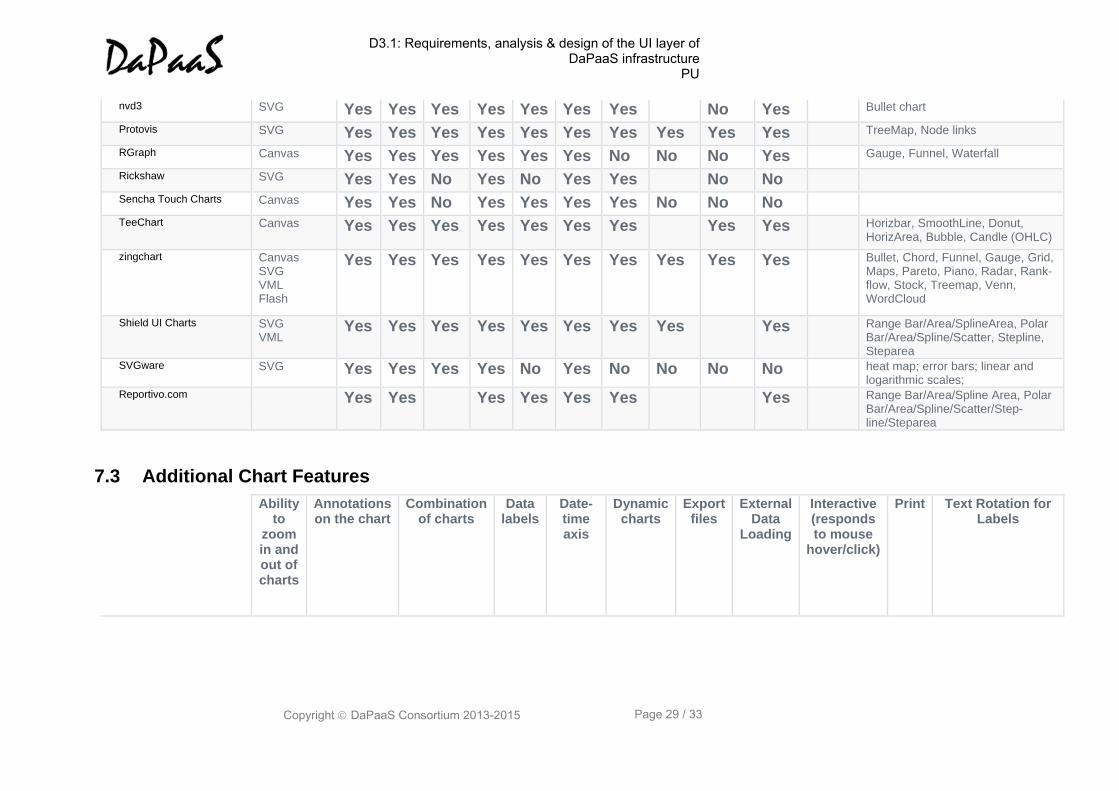
nvd3 SVG Yes Yes Yes Yes Yes Yes Yes No Yes Bullet chart
Protovis SVG Yes Yes Yes Yes Yes Yes Yes Yes Yes Yes TreeMap, Node links
RGraph Canvas Yes Yes Yes Yes Yes Yes No No No Yes Gauge, Funnel, Waterfall
Rickshaw SVG Yes Yes No Yes No Yes Yes No No
Sencha Touch Charts Canvas Yes Yes No Yes Yes Yes Yes No No No
TeeChart Canvas Yes Yes Yes Yes Yes Yes Yes Yes Yes Horizbar, SmoothLine, Donut, HorizArea, Bubble, Candle (OHLC)
zingchart Canvas SVG VML Flash
Yes Yes Yes Yes Yes Yes Yes Yes Yes Yes Bullet, Chord, Funnel, Gauge, Grid, Maps, Pareto, Piano, Radar, Rank-flow, Stock, Treemap, Venn, WordCloud
Shield UI Charts SVG VML
Yes Yes Yes Yes Yes Yes Yes Yes Yes Range Bar/Area/SplineArea, Polar Bar/Area/Spline/Scatter, Stepline, Steparea
SVGware SVG Yes Yes Yes Yes No Yes No No No No heat map; error bars; linear and logarithmic scales;
Reportivo.com Yes Yes Yes Yes Yes Yes Yes Range Bar/Area/Spline Area, Polar Bar/Area/Spline/Scatter/Step-line/Steparea
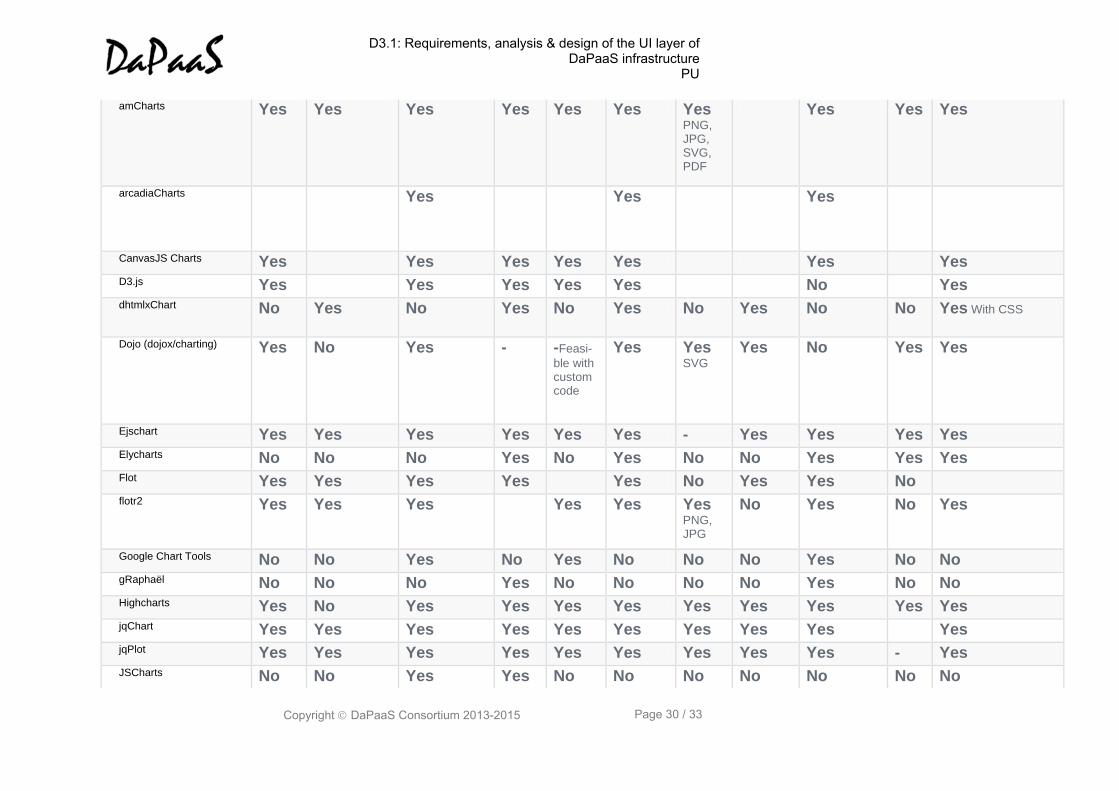
7.3 Additional Chart Features
Ability to
zoom in and out of charts
Annotations on the chart
Combination of charts
Data labels
Date-time axis
Dynamic charts
Export files
External Data
Loading
Interactive (responds to mouse
hover/click)
Print Text Rotation for Labels
D3.1: Requirements, analysis & design of the UI layer of DaPaaS infrastructure
PU
Copyright DaPaaS Consortium 2013-2015 Page 30 / 33
amCharts Yes Yes Yes Yes Yes Yes Yes PNG, JPG, SVG, PDF
Yes Yes Yes
arcadiaCharts Yes Yes Yes
CanvasJS Charts Yes Yes Yes Yes Yes Yes Yes D3.js Yes Yes Yes Yes Yes No Yes dhtmlxChart No Yes No Yes No Yes No Yes No No Yes With CSS
Dojo (dojox/charting) Yes No Yes - -Feasi-
ble with custom code
Yes Yes SVG
Yes No Yes Yes
Ejschart Yes Yes Yes Yes Yes Yes - Yes Yes Yes Yes Elycharts No No No Yes No Yes No No Yes Yes Yes Flot Yes Yes Yes Yes Yes No Yes Yes No
flotr2 Yes Yes Yes Yes Yes Yes PNG, JPG
No Yes No Yes
Google Chart Tools No No Yes No Yes No No No Yes No No gRaphaël No No No Yes No No No No Yes No No Highcharts Yes No Yes Yes Yes Yes Yes Yes Yes Yes Yes jqChart Yes Yes Yes Yes Yes Yes Yes Yes Yes Yes jqPlot Yes Yes Yes Yes Yes Yes Yes Yes Yes - Yes JSCharts No No Yes Yes No No No No No No No
D3.1: Requirements, analysis & design of the UI layer of DaPaaS infrastructure
PU
Copyright DaPaaS Consortium 2013-2015 Page 31 / 33
JSXGraph No Yes Yes Yes Yes Yes Yes No KendoUI DataViz Yes Yes Yes Yes Yes Yes Yes Yes Yes Yes Yes Morris.js No No No No Yes No No Yes No No nvd3 Yes Yes Yes Yes Yes Yes
Protovis Yes Yes Yes Yes Yes Yes No Yes No Yes RGraph No No No No No No - Yes Yes
Rickshaw Yes Yes Yes
Sencha Touch Charts Yes
TeeChart Yes Yes Yes Yes Yes Yes Yes Yes Yes Yes zingchart Yes Yes Yes Yes Yes Yes Yes Yes Yes Yes Yes Shield UI Charts Yes Yes Yes Yes Yes Yes Yes Yes Yes Yes Yes SVGware Yes Yes Yes Yes Yes Yes Yes - Yes Yes
Reportivo.com Yes Yes Yes Yes Yes Yes Yes Yes Yes
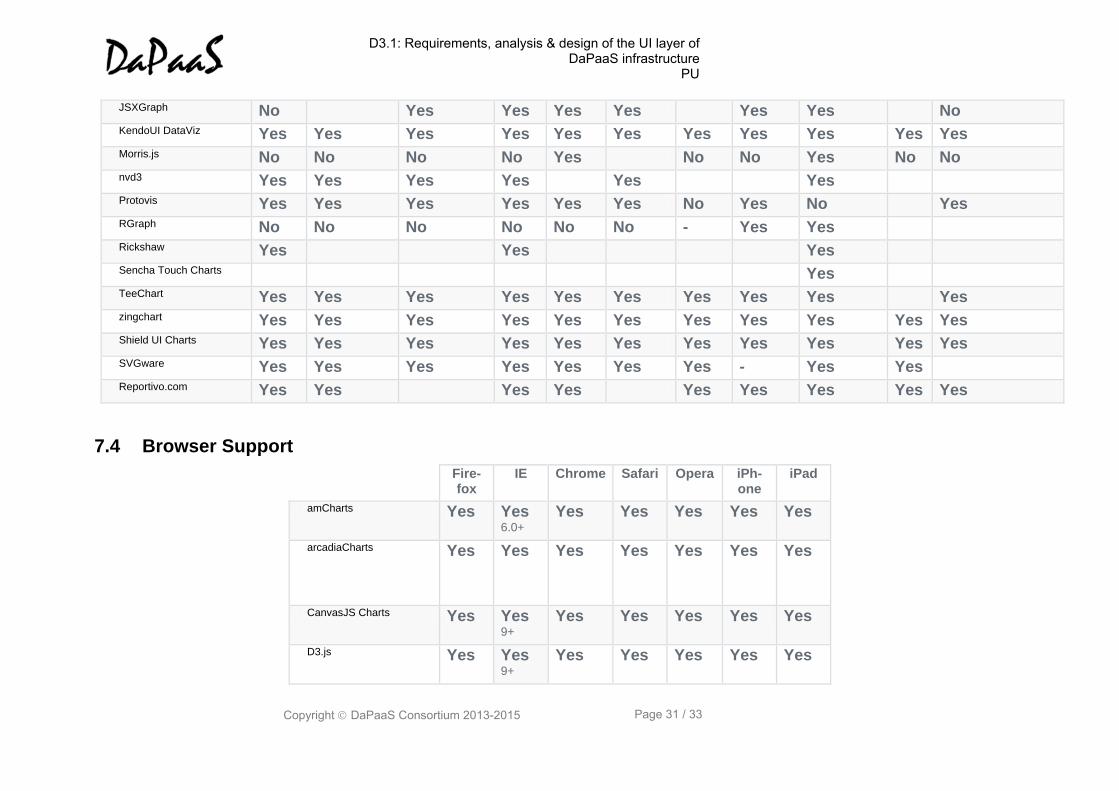
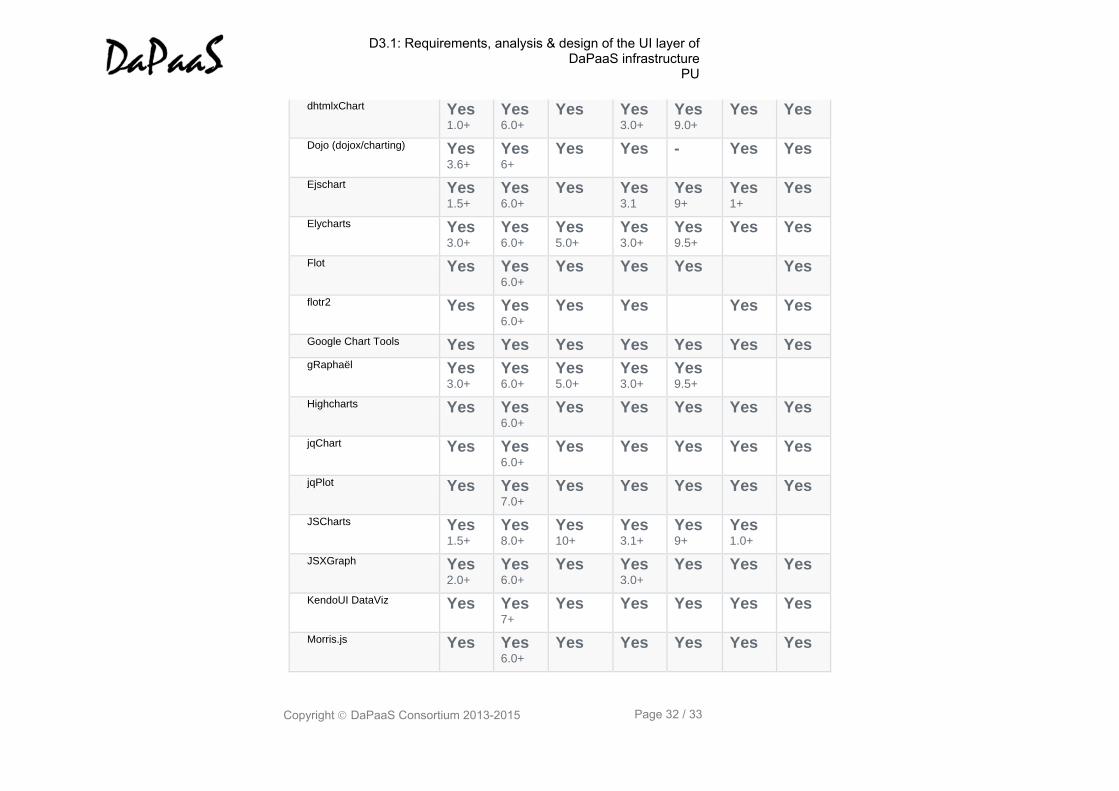
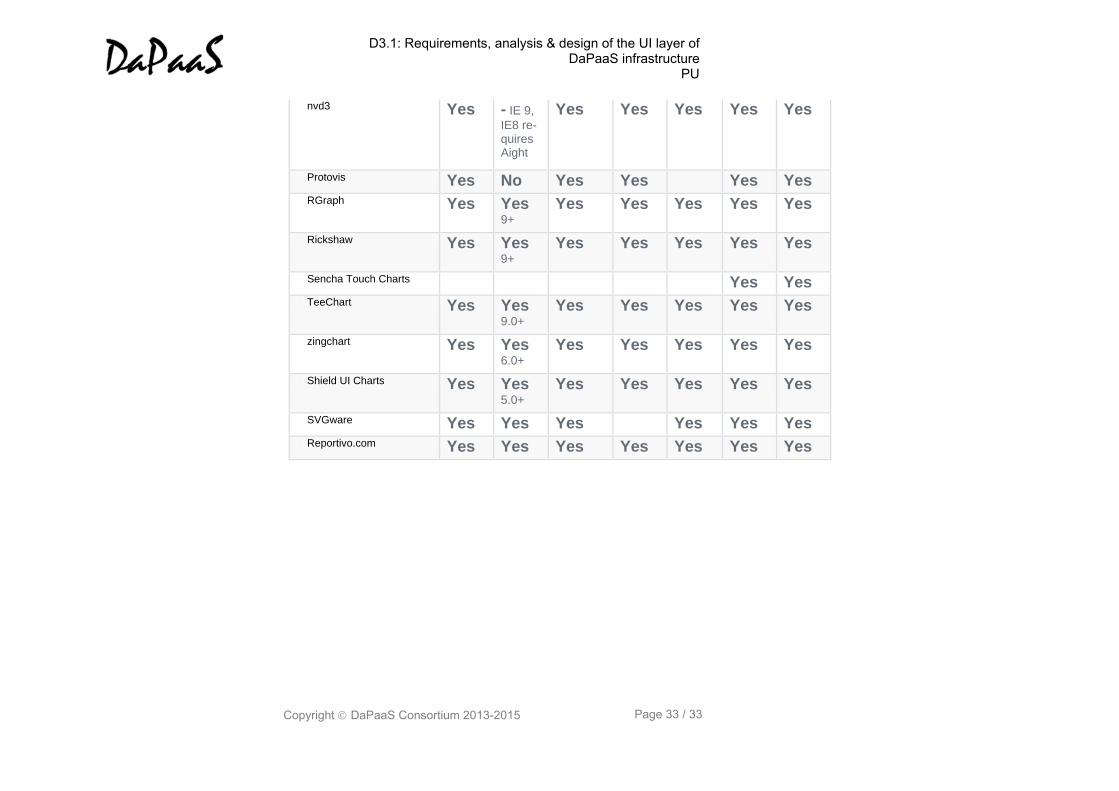
7.4 Browser Support
Fire-fox
IE Chrome Safari Opera iPh-one
iPad
amCharts Yes Yes 6.0+
Yes Yes Yes Yes Yes
arcadiaCharts Yes Yes Yes Yes Yes Yes Yes
CanvasJS Charts Yes Yes 9+
Yes Yes Yes Yes Yes
D3.js Yes Yes 9+
Yes Yes Yes Yes Yes
D3.1: Requirements, analysis & design of the UI layer of DaPaaS infrastructure
PU
Copyright DaPaaS Consortium 2013-2015 Page 32 / 33
dhtmlxChart Yes 1.0+
Yes 6.0+
Yes Yes 3.0+
Yes 9.0+
Yes Yes
Dojo (dojox/charting) Yes 3.6+
Yes 6+
Yes Yes - Yes Yes
Ejschart Yes 1.5+
Yes 6.0+
Yes Yes 3.1
Yes 9+
Yes 1+
Yes
Elycharts Yes 3.0+
Yes 6.0+
Yes 5.0+
Yes 3.0+
Yes 9.5+
Yes Yes
Flot Yes Yes 6.0+
Yes Yes Yes Yes
flotr2 Yes Yes 6.0+
Yes Yes Yes Yes
Google Chart Tools Yes Yes Yes Yes Yes Yes Yes gRaphaël Yes
3.0+ Yes 6.0+
Yes 5.0+
Yes 3.0+
Yes 9.5+
Highcharts Yes Yes 6.0+
Yes Yes Yes Yes Yes
jqChart Yes Yes 6.0+
Yes Yes Yes Yes Yes
jqPlot Yes Yes 7.0+
Yes Yes Yes Yes Yes
JSCharts Yes 1.5+
Yes 8.0+
Yes 10+
Yes 3.1+
Yes 9+
Yes 1.0+
JSXGraph Yes 2.0+
Yes 6.0+
Yes Yes 3.0+
Yes Yes Yes
KendoUI DataViz Yes Yes 7+
Yes Yes Yes Yes Yes
Morris.js Yes Yes 6.0+
Yes Yes Yes Yes Yes
D3.1: Requirements, analysis & design of the UI layer of DaPaaS infrastructure
PU
Copyright DaPaaS Consortium 2013-2015 Page 33 / 33
nvd3 Yes - IE 9,
IE8 re-quires Aight
Yes Yes Yes Yes Yes
Protovis Yes No Yes Yes Yes Yes RGraph Yes Yes
9+ Yes Yes Yes Yes Yes
Rickshaw Yes Yes 9+
Yes Yes Yes Yes Yes
Sencha Touch Charts Yes Yes TeeChart Yes Yes
9.0+ Yes Yes Yes Yes Yes
zingchart Yes Yes 6.0+
Yes Yes Yes Yes Yes
Shield UI Charts Yes Yes 5.0+
Yes Yes Yes Yes Yes
SVGware Yes Yes Yes Yes Yes Yes Reportivo.com Yes Yes Yes Yes Yes Yes Yes