Embed Size (px)
Citation preview
Programmable RNA microstructures for coordinated delivery of siRNAs
Jaimie Marie Stewart†, Mathias Viard‡, Hari K.K. Subramanian§, Brandon K. Roark∥
Kirill A. Afonin∥, and Elisa Franco§
†Department of Bioengineering, University of California, Riverside, Riverside, CA 92521, USA.
‡Basic Science Program, Leidos Biomedical Research, Frederick National Laboratory
for Cancer Research, Frederick, MD 21702, USA.
§Department of Mechanical Engineering, University of California, Riverside, Riverside, CA 92521, USA.
∥Nanoscale Science Program, Department of Chemistry University of North Carolina at Charlotte, Charlotte NC 28223, USA; The Center for Biomedical Engineering and
Science, University of North Carolina at Charlotte, Charlotte NC 28223, USA.
Electronic Supplementary Material (ESI) for Nanoscale.This journal is © The Royal Society of Chemistry 2016
Contents 1. Sequences 1.1 Genes 1.2 Genes for tiles with blunt ends 1.3 RNA sequences 2. Methods for preparation and analysis of RNA assemblies 2.1 Sample preparation 2.2 Atomic force Microscopy 2.3 Denaturing polyacrylamide gel electrophoresis
2.4 Non-denaturing polyacrylamide gel electrophoresis 2.5 RNA extraction
3. Tile and lattice purification 4. Structural analysis of tile and lattice assembly 5. Analysis of structural integrity with Lipofectamine ® 2000 6. Dynamic Light Scattering (DLS) experiments 7. Human blood serum stability assays 8. UV-melting experiments 9. Transfection experiments 10. Flow cytometry 11. Confocal microscopy of transfected cells 12. Gene silencing experiments 13. Viability assay 14. Effects of the presence of functional domains on assembly
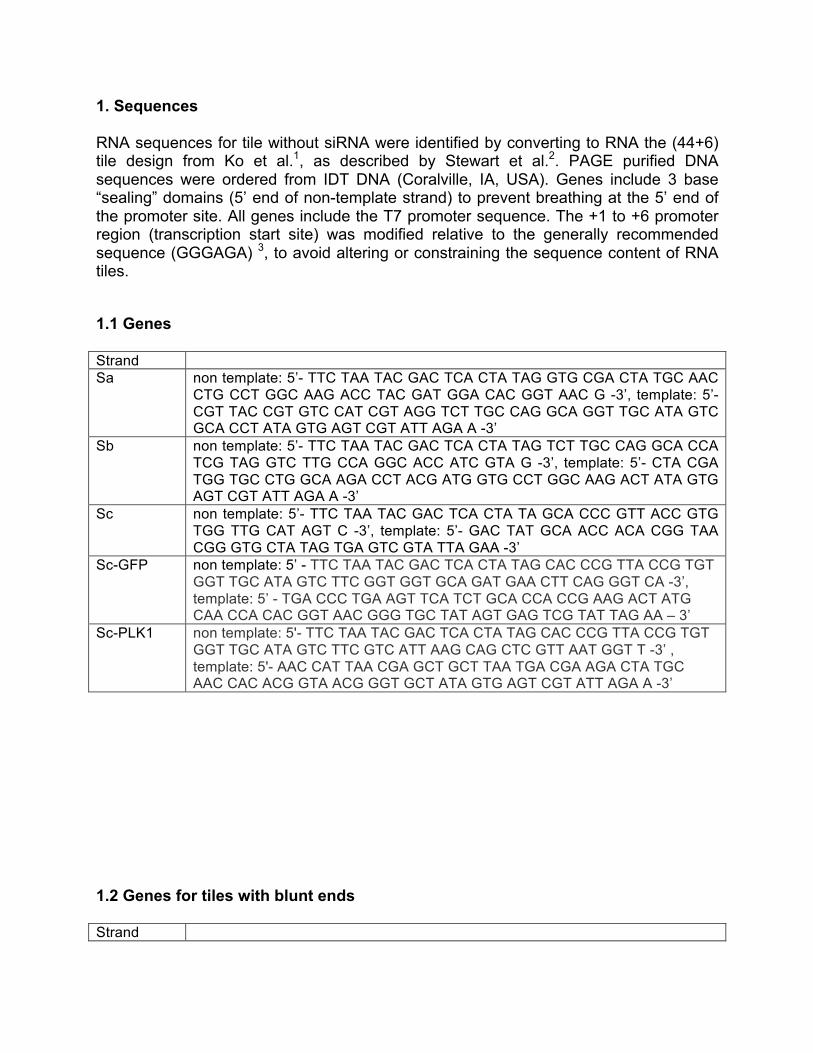
1. Sequences RNA sequences for tile without siRNA were identified by converting to RNA the (44+6) tile design from Ko et al.1, as described by Stewart et al.2. PAGE purified DNA sequences were ordered from IDT DNA (Coralville, IA, USA). Genes include 3 base “sealing” domains (5’ end of non-template strand) to prevent breathing at the 5’ end of the promoter site. All genes include the T7 promoter sequence. The +1 to +6 promoter region (transcription start site) was modified relative to the generally recommended sequence (GGGAGA) 3, to avoid altering or constraining the sequence content of RNA tiles.
1.1 Genes
Strand Sa non template: 5’- TTC TAA TAC GAC TCA CTA TAG GTG CGA CTA TGC AAC
CTG CCT GGC AAG ACC TAC GAT GGA CAC GGT AAC G -3’, template: 5’- CGT TAC CGT GTC CAT CGT AGG TCT TGC CAG GCA GGT TGC ATA GTC GCA CCT ATA GTG AGT CGT ATT AGA A -3’
Sb non template: 5’- TTC TAA TAC GAC TCA CTA TAG TCT TGC CAG GCA CCA TCG TAG GTC TTG CCA GGC ACC ATC GTA G -3’, template: 5’- CTA CGA TGG TGC CTG GCA AGA CCT ACG ATG GTG CCT GGC AAG ACT ATA GTG AGT CGT ATT AGA A -3’
Sc non template: 5’- TTC TAA TAC GAC TCA CTA TA GCA CCC GTT ACC GTG TGG TTG CAT AGT C -3’, template: 5’- GAC TAT GCA ACC ACA CGG TAA CGG GTG CTA TAG TGA GTC GTA TTA GAA -3’
Sc-GFP non template: 5’ - TTC TAA TAC GAC TCA CTA TAG CAC CCG TTA CCG TGT GGT TGC ATA GTC TTC GGT GGT GCA GAT GAA CTT CAG GGT CA -3’, template: 5’ - TGA CCC TGA AGT TCA TCT GCA CCA CCG AAG ACT ATG CAA CCA CAC GGT AAC GGG TGC TAT AGT GAG TCG TAT TAG AA – 3’
Sc-PLK1 non template: 5'- TTC TAA TAC GAC TCA CTA TAG CAC CCG TTA CCG TGT GGT TGC ATA GTC TTC GTC ATT AAG CAG CTC GTT AAT GGT T -3’ , template: 5'- AAC CAT TAA CGA GCT GCT TAA TGA CGA AGA CTA TGC AAC CAC ACG GTA ACG GGT GCT ATA GTG AGT CGT ATT AGA A -3’
1.2 Genes for tiles with blunt ends
Strand
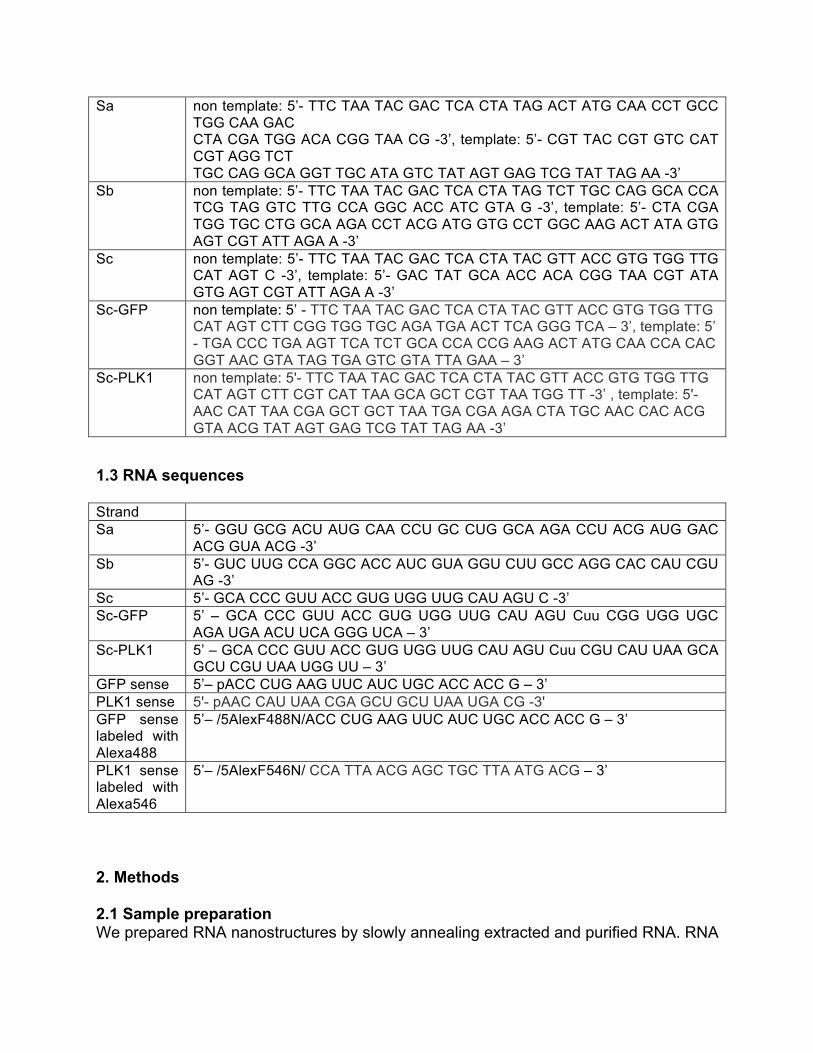
Sa non template: 5’- TTC TAA TAC GAC TCA CTA TAG ACT ATG CAA CCT GCC TGG CAA GAC CTA CGA TGG ACA CGG TAA CG -3’, template: 5’- CGT TAC CGT GTC CAT CGT AGG TCT TGC CAG GCA GGT TGC ATA GTC TAT AGT GAG TCG TAT TAG AA -3’
Sb non template: 5’- TTC TAA TAC GAC TCA CTA TAG TCT TGC CAG GCA CCA TCG TAG GTC TTG CCA GGC ACC ATC GTA G -3’, template: 5’- CTA CGA TGG TGC CTG GCA AGA CCT ACG ATG GTG CCT GGC AAG ACT ATA GTG AGT CGT ATT AGA A -3’
Sc non template: 5’- TTC TAA TAC GAC TCA CTA TAC GTT ACC GTG TGG TTG CAT AGT C -3’, template: 5’- GAC TAT GCA ACC ACA CGG TAA CGT ATA GTG AGT CGT ATT AGA A -3’
Sc-GFP non template: 5’ - TTC TAA TAC GAC TCA CTA TAC GTT ACC GTG TGG TTG CAT AGT CTT CGG TGG TGC AGA TGA ACT TCA GGG TCA – 3’, template: 5’ - TGA CCC TGA AGT TCA TCT GCA CCA CCG AAG ACT ATG CAA CCA CAC GGT AAC GTA TAG TGA GTC GTA TTA GAA – 3’
Sc-PLK1 non template: 5'- TTC TAA TAC GAC TCA CTA TAC GTT ACC GTG TGG TTG CAT AGT CTT CGT CAT TAA GCA GCT CGT TAA TGG TT -3’ , template: 5'- AAC CAT TAA CGA GCT GCT TAA TGA CGA AGA CTA TGC AAC CAC ACG GTA ACG TAT AGT GAG TCG TAT TAG AA -3’
1.3 RNA sequences
Strand Sa 5’- GGU GCG ACU AUG CAA CCU GC CUG GCA AGA CCU ACG AUG GAC
ACG GUA ACG -3’ Sb 5’- GUC UUG CCA GGC ACC AUC GUA GGU CUU GCC AGG CAC CAU CGU
AG -3’ Sc 5’- GCA CCC GUU ACC GUG UGG UUG CAU AGU C -3’ Sc-GFP 5’ – GCA CCC GUU ACC GUG UGG UUG CAU AGU Cuu CGG UGG UGC
AGA UGA ACU UCA GGG UCA – 3’ Sc-PLK1 5’ – GCA CCC GUU ACC GUG UGG UUG CAU AGU Cuu CGU CAU UAA GCA
GCU CGU UAA UGG UU – 3’ GFP sense 5’– pACC CUG AAG UUC AUC UGC ACC ACC G – 3’ PLK1 sense 5'- pAAC CAU UAA CGA GCU GCU UAA UGA CG -3' GFP sense labeled with Alexa488
5’– /5AlexF488N/ACC CUG AAG UUC AUC UGC ACC ACC G – 3’
PLK1 sense labeled with Alexa546
5’– /5AlexF546N/ CCA TTA ACG AGC TGC TTA ATG ACG – 3’
2. Methods 2.1 Sample preparation We prepared RNA nanostructures by slowly annealing extracted and purified RNA. RNA
strands were transcribed; gel extracted and purified using the RNA extraction protocol. Strands were added in a 2:1:2:2 ratio (Sa:Sb:Sc-antisense:Sense) (Figure S1) to a solution of 1X tris-acetate-EDTA (TAE) and 12.5 mM MgCl2. The solution was then annealed from 70°C to 22°C over 24 hours. 2.2 Atomic force microscopy AFM images were obtained in tapping mode using 1X TAE and 12.5 mM MgCl2 buffer with a Digital Instruments Multimode AFM, equipped with a Nanoscope III controller. Sharp Nitride Lever (SNL) tips from Bruker with a nominal spring constant of 0.24 N/m were used for imaging, with a drive frequency of 9-10 kHz. 2.3 Denaturing polyacrylamide gel electrophoresis Pre-mix was prepared by adding 42 g of urea to 25 mL of nanopure water (for a final volume of 100 mL), the mixture was then heated until the urea completely dissolved. This mixture was allowed to cool to room temperature, then a 40% (v/v) 19:1 acrylamide/bis-acrylamide solution was added in the appropriate volume for the desired percentage. The pre-mix was added in appropriate ratios with TBE and nanopure water, ammonium persulfate (APS), and tetramethylethylenediamine (TEMED) to start polymerization. Gels were cast in 10×10 cm, 1 mm thick disposable mini gel cassettes (Thermo Scientific, #NC2010) and allowed to polymerize for at least 2 hours before electrophoresis. Gels were run at room temperature at 100 V in 1X TBE unless otherwise noted. After electrophoresis the gels were stained in SYBR® Gold Nucleic Acid Gel Stain or ethidium bromide and then imaged using the Bio-Rad ChemiDoc MP system. 2.4 Non-denaturing polyacrylamide gel electrophoresis 40% solution of 19:1 acrylamide/bis-acrylamide, TAE, MgCl2 12.5 mM (final concentration), APS, and TEMED were added together at appropriate concentrations for the desired polyacrylamide percentage, then cast in 10×10 cm, 1 mm thick disposable mini gel cassettes (Thermo Scientific, #NC2010) and allowed to polymerize for at least 2 hours before electrophoresis. Gels were run at 4°C at 150 V in 1X TBE buffer. After electrophoresis gels were stained in SYBR® Gold Nucleic Acid Gel Stain or ethidium bromide and then imaged using the Bio-Rad ChemiDoc MP system. 2.5 RNA extraction Using the AmpliScribe-T7-Flash Transcription Kit the following components were mixed at room temperature: RNase-free water, 1-1.5 µg gene, AmpliScribe T7-Flash 1X Reaction Buffer (Epicentre, #ASF3507), 9 mM NTPs, 40 U/µL RiboGuard RNase Inhibitor (Epicentre, #RG90925), and 1 unit of AmpliScribe T7-Flash Enzyme Solution (Epicentre, #ASF3507). This mix was incubated at 37°C for 4 hours. After incubation, 20 µL of loading dye was added to the 20 µL transcription solution, and 8 µL of the transcription/dye mix was added to each of the middle 5 lanes of the gel. The gel was run at 100 V at room temperature in 1X TBE.
After electrophoresis the gel was stained in 80 mL 1X TBE and 1 µL SYBR® Gold Nucleic Acid Gel Stain (Thermo Scientific, # S-11494) for 20-30 minutes. The gel was then placed on a TLC silica gel 60 W F254S aluminum sheet (EMD Millipore, #
1055590001) covered in plastic wrap. The gel was illuminated with UV light and the desired RNA band was cut out and chopped into equal amounts and placed into 0.5 mL DNA Lobind tubes (Eppendorf, #022431005), then 200 µL of 0.3 M sodium acetate at pH 5.3 was added to the Lobind tubes. The samples were then incubated at 42°C for ~20 hours. After incubation, the sodium acetate was removed and placed into 1.7 mL RNase/DNase free tubes. The old Lobind tubes were rinsed with 100 µl of 0.3 M sodium acetate pH 5.3, which was added to the new samples. Then 1 mL of freezer cold 100% ETOH and 1 µL of glycogen were added into each tube and the sample was incubated at -20°C for 20 hours.
Next, the samples were spun at 13,500 rpm at 4°C for 15 minutes. The white precipitate pellet (RNA) at the bottom of the tube was located and the supernatant was carefully pipetted out of the tubes avoiding removal of the pellet. Then, 500 µl of 70% freezer cold ETOH was added to the tubes and spun at 13,500 rpm at 4°C for 5 minutes. The supernatant was carefully decanted again with a pipette. This washing procedure was repeated a third time. After the last wash, as much supernatant was removed as possible, then the samples were opened and placed in the vacuum concentrator and allowed to spin at room temperature for 15 minutes. The samples were then re-suspended in 10-15 µL of Ambion nuclease free water (Ambion, #AM9932). 3. Tile and lattice purification Structures were annealed in 1X TAE / 12.5 mM MgCl2 by adding strands in proper stoichiometry from 70°C to room temperature over 24 hours. Structures were then electrophoresed through 15% non-denaturing PAGE ran at 150 V, at 4°C in 1X TBE. For each sample the correct bands, which incorporated the sense strand into the tile or lattice was extracted. 3-4 bands were placed into one tube and covered in 90 µl of 1X TAE / 12.5 mM MgCl2 and allowed to incubate at 4°C for 24-48 hours.
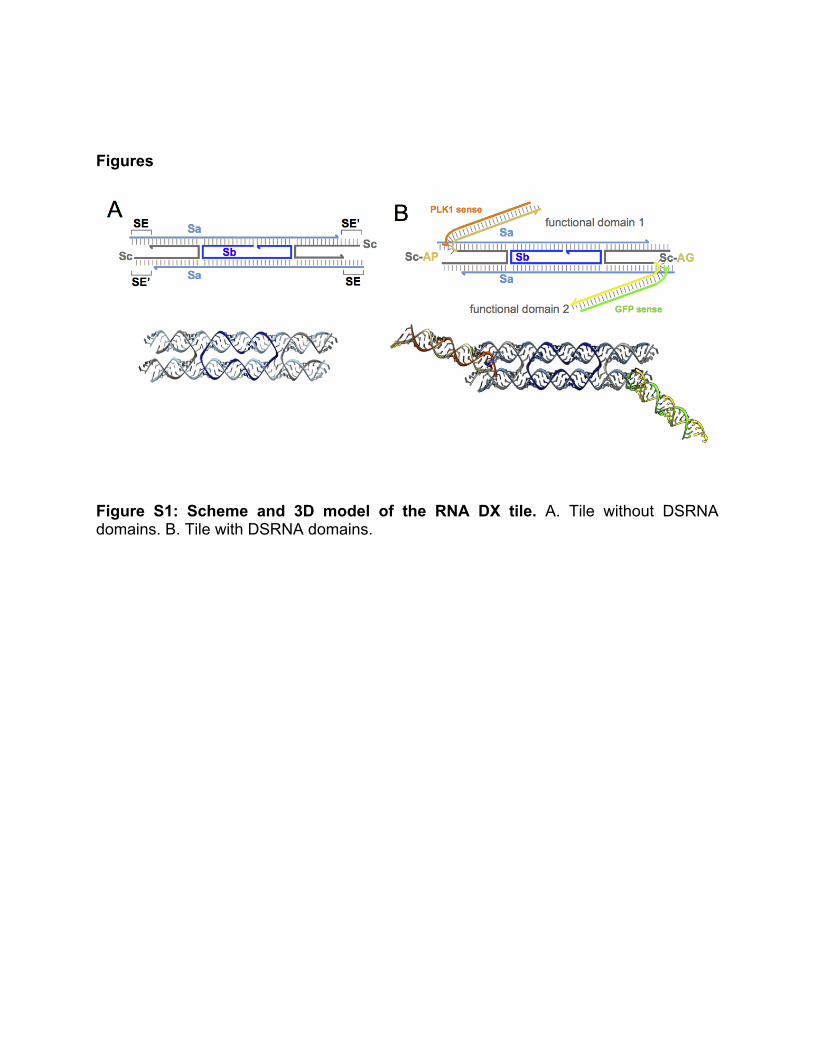
4. Structural analysis of tile and lattice assembly To verify the sense strand attachment to the tile, the sense strand for both GFP and PLK1 were labeled with Alexa 488 and Alexa 546, respectively at the 5’ ends. We annealed individual tiles without sticky ends and lattices and tubular structures with fluorescently labeled sense strands. The sense strand targeted against GFP was labeled with Alexa 488 and the sense strand targeted against PLK1 was labeled with Alexa 546. We performed non-denaturing PAGE studies on these structures and tracked the labeled sense strand to determine its location in the tile and lattice (Figure S2). Interestingly, for the individual tiles we observed three prominent bands, which incorporated all of the tile strands (Figure S2A, S2B). We hypothesize that the upper band has two sense strands attached, the next lower band has only one sense attached, and the third lowest band has no sense strands attached. For individual tile assembly with no sticky ends, there appears to be a small amount of tiles that polymerize at the top of the well, this could be due to the anti-sense strands interacting. For the lanes including annealed tiles, we observe a fairly prominent band at the bottom of the wells, which we expect is composed by tiles polymerized into lattices.
5. Analysis of structural integrity with Lipofectamine ® 2000 To ensure that our structures remain intact during transfection, we performed experiments to determine the integrity of our RNA structures in the presence of Lipofectamine® 2000 (L2K, Thermo Scientific #11668030) (Figure S3). Four samples were prepared: Sa+Sb (1:1), Sa+Sb (2:1), and Sa+Sb+Sc (2:1:2) were slowly annealed from 70°C to 22°C over 24 hr in 1X TAE and 12.5 mM MgCl2. 10 µL of sample was added to 1 µL of L2K and allowed to incubate at room temperature for 30 minutes, then non-denaturing PAGE was performed with 10% gel at 150 V at 4°C in 1X TBE (Figure S2B). Next 1 µL of Triton X100 (Sigma Aldrich #X100) was added to the sample to remove L2K, and allowed to incubate at room temperature for 30 minutes. Then, non-denaturing PAGE was performed with 10% gel at 150 V at 4°C in 1X TBE (Figure S3C).
Because L2K is positively charged, DNA associated with is unable to travel through the electrophoresis gel properly. However, when the detergent is introduced and L2K is removed, structures can migrate through the gel. Based on the consistent height of the band in lane 4 of the gels in Fig. 2A and 2C, we conclude that minimum to no damage occurs to our structures when associated to L2K. 6. Dynamic Light Scattering (DLS) experiments For DLS experiments, 100 µL of sample solutions (prepared in 0.2 µm filtered buffer) of assembled 1 µM tiles and lattices were used. The samples were measured at 25°C with a Nano-series Zetasizer ZS (Malvern Instruments Ltd) equipped with a red (633 nm) laser. Readings with polydispersity index (PdI) below 0.2 were used. Results are shown in Figure S4. 7. Human blood serum stability assays Freshly drawn human whole blood was spun down and serum was collected, aliquoted, frozen -80°C and later used for blood serum degradation experiments. Alexa-488 labeled tiles and lattices (1 µM final) were incubated with 10% (v/v) human blood serum at 37°C for various time points. Degradation time courses were quenched on dry ice and analyzed on native-PAGE, loaded in reverse order. The disappearance of fluorescent bands corresponding to the labeled tiles and lattices were quantified and analyzed. Results are shown in Figure S5. 8. UV-melting experiments. Experiments were carried out at 260 nm on an Agilent 8453 spectrophotometer coupled with the Agilent 89090 Peltier Temperature Controller. The temperature was gradually increased and the absorbance was recorded every 1°C with 10 seconds equilibration time. The assembled RNA tiles and lattices (70 µL of 250 nM) were analyzed using Starna Cells sub-micro quartz fluorometer cell cuvette. The data was processed by a Boltzmann sigmoidal curve fit using Origin® Pro 2016 Graphing and Analysis software. Results are shown in Figure S6. 9. Transfection experiments To evaluate the delivery of functionalized RNA tiles and lattices, the human breast cancer cell line MDA-MB-231 (with or without GFP) was grown in D-MEM medium
(Gibco BRL) supplemented with 10% FBS and penicillin-streptomycin (pen-strep) in a 5% CO2 incubator. All transfections were performed using Lipofectamine 2000 (L2K) purchased from Invitrogen. 100X transfection solutions were pre-incubated at room temperature with L2K. Prior to each transfection, the cell media was replaced with OPTI-MEM with added RNA/L2K complexes at a final concentration of 1X. The cells were incubated for 4 hours followed by the media change (D-MEM, 10%FCS, 1% pen-strep). Results are shown in Figure S7. 10. Flow cytometry For flow cytometry experiments, MDA-MB-231 cells (with or without GFP) grown in 24-well plates were transfected. The cells were lifted with cell dissociation buffer 24h later to assess their level of Alexa 488 (Alexa 546) fluorescence or 72h later to assess their GFP signal for uptake and silencing experiments respectively. The measurements were performed through fluorescence activated cell sorting on a FACSCalibur instrument (BD Biosciences, San Jose). At least 20,000 events were collected and analyzed with the CellQuest software to retrieve the geometric mean fluorescence intensity (gMFI) and the standard error of the mean. 11. Confocal microscopy of transfected cells All experiments were performed using a LSM 710 confocal microscope (Carl Zeiss, Oberkochen) and a Plan-Apochromat 63x/1.40 Oil lens. MDA-MB-231 cells plated in glass bottom dishes (Ibidi, Madison) were transfected with fluorescently labeled nanoconstructs. Upon 4 hour incubation at 37°C, the cells were washed three times with PBS and fixed with 4% paraformaldehyde for 20 minutes at room temperature. For Alexa 488 imaging, the 488 nm line of an argon laser was used as excitation and the emission was collected between 493 and 557 nm. For Alexa 546 imaging, a DPSS 561 laser was used for excitation and emission was collected between 566 and 680 nm. For silencing experiments, MDA-MB-231 eGFP cells were used and visualized 72 hours post transfection upon fixation. For GFP imaging, the 488 nm line of an argon laser was used as excitation and the emission was collected between 499 and 644 nm. 12. Gene silencing experiments To assess the function of siRNAs, we performed specific gene silencing experiments. GFP expressing breast cancer cells (MDA-MB-231/GFP) were transfected as mentioned in the Transfection experiments section with constructs carrying anti-GFP siRNAs and free DS RNAs. The GFP silencing was observed for 10 days with a faster fluorescence recovery for cells treated with functionalized lattices (Figure S8). 13. Viability assay The viability of cells upon transfection was assessed through the CellTiter Blue assay (Promega, Madison) following manufacturer’s protocol. Briefly, upon addition of the CellTiter blue reagents to the cells at a 1 to 6 ratio in DMEM, the fluorescence of the resorufin forming compound was measured (560 ex/590 em) after 1-2 hour incubation at 37°C.
14. Effects of the presence of functional domains on assembly In regards to structure formation we found that depending on the linked anti-sense and attached sense strand that the structures that form may either be lattices or tubular structures (Figure S9). We observed that when both Dicer substrate (DS) RNAs attached are targeted against GFP, tubular structures form. When both DS RNAs attached are targeted against PLK1, only lattices are observed. When DS RNAs attached are targeted against GFP and PLK1, lattices form. Tubular structures exhibit a left-handed chirality; however, the cause of this chirality is unknown.
References
1. Ko, S. H.; Su, M.; Zhang, C.; Ribbe, A. E.; Jiang, W.; Mao, C. Nature chemistry 2010, 2, (12), 1050-1055. 2. Stewart, J. M.; Subramanian, H. K.; Franco, E. Submitted. Manuscript can be downloaded here: http://www.engr.ucr.edu/~efranco/Stewartetal.html 2016. 3. Milligan, J. F.; Groebe, D. R.; Witherell, G. W.; Uhlenbeck, O. C. Nucleic acids research 1987, 15, (21), 8783-8798.
Figures
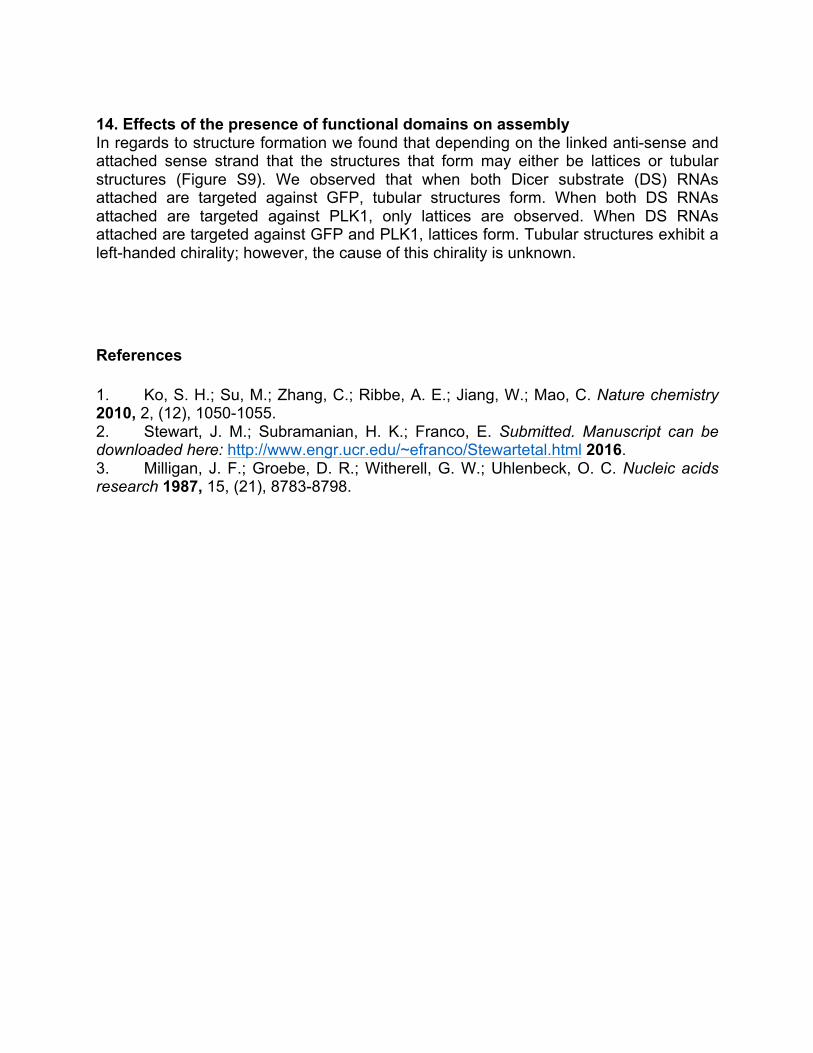
Figure S1: Scheme and 3D model of the RNA DX tile. A. Tile without DSRNA domains. B. Tile with DSRNA domains.
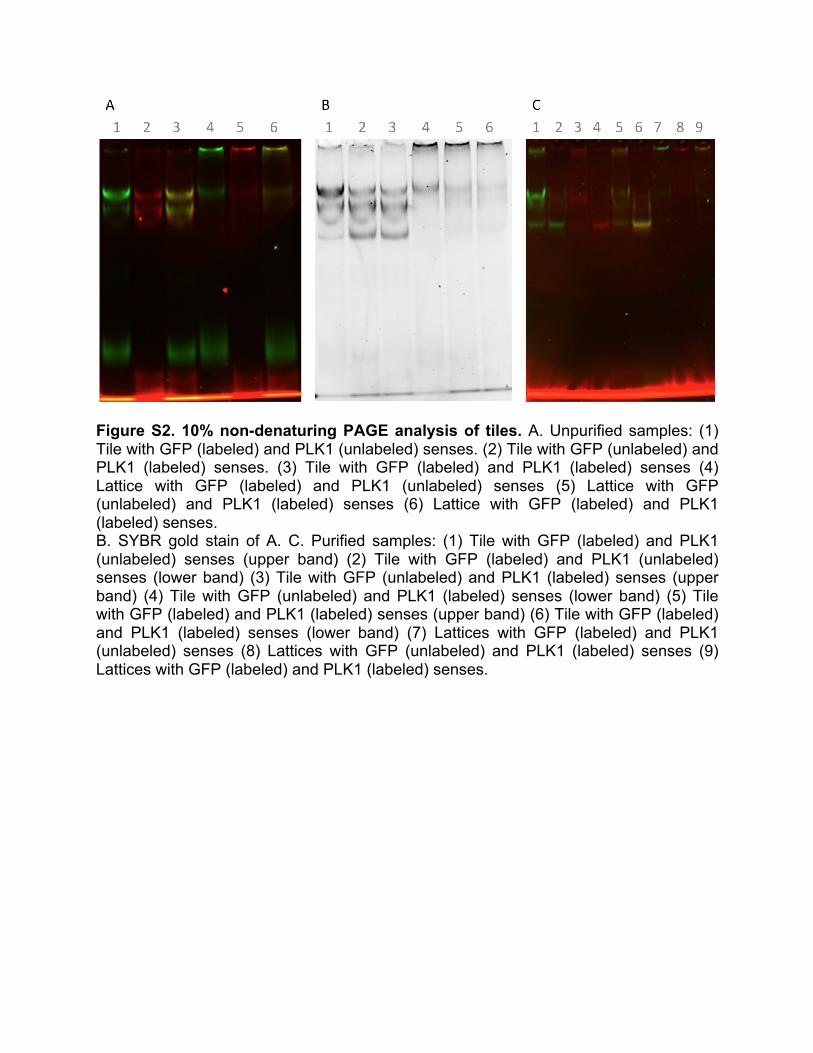
Figure S2. 10% non-denaturing PAGE analysis of tiles. A. Unpurified samples: (1) Tile with GFP (labeled) and PLK1 (unlabeled) senses. (2) Tile with GFP (unlabeled) and PLK1 (labeled) senses. (3) Tile with GFP (labeled) and PLK1 (labeled) senses (4) Lattice with GFP (labeled) and PLK1 (unlabeled) senses (5) Lattice with GFP (unlabeled) and PLK1 (labeled) senses (6) Lattice with GFP (labeled) and PLK1 (labeled) senses. B. SYBR gold stain of A. C. Purified samples: (1) Tile with GFP (labeled) and PLK1 (unlabeled) senses (upper band) (2) Tile with GFP (labeled) and PLK1 (unlabeled) senses (lower band) (3) Tile with GFP (unlabeled) and PLK1 (labeled) senses (upper band) (4) Tile with GFP (unlabeled) and PLK1 (labeled) senses (lower band) (5) Tile with GFP (labeled) and PLK1 (labeled) senses (upper band) (6) Tile with GFP (labeled) and PLK1 (labeled) senses (lower band) (7) Lattices with GFP (labeled) and PLK1 (unlabeled) senses (8) Lattices with GFP (unlabeled) and PLK1 (labeled) senses (9) Lattices with GFP (labeled) and PLK1 (labeled) senses.
Figure S3: 10% non-denaturing PAGE. A. Assembled structures. B. Assembled structures associated with Lipofectamine 2000. C. Assembled structures associated with Lipofectamine 2000 and subsequently ‘washed,’ with Trition X100.
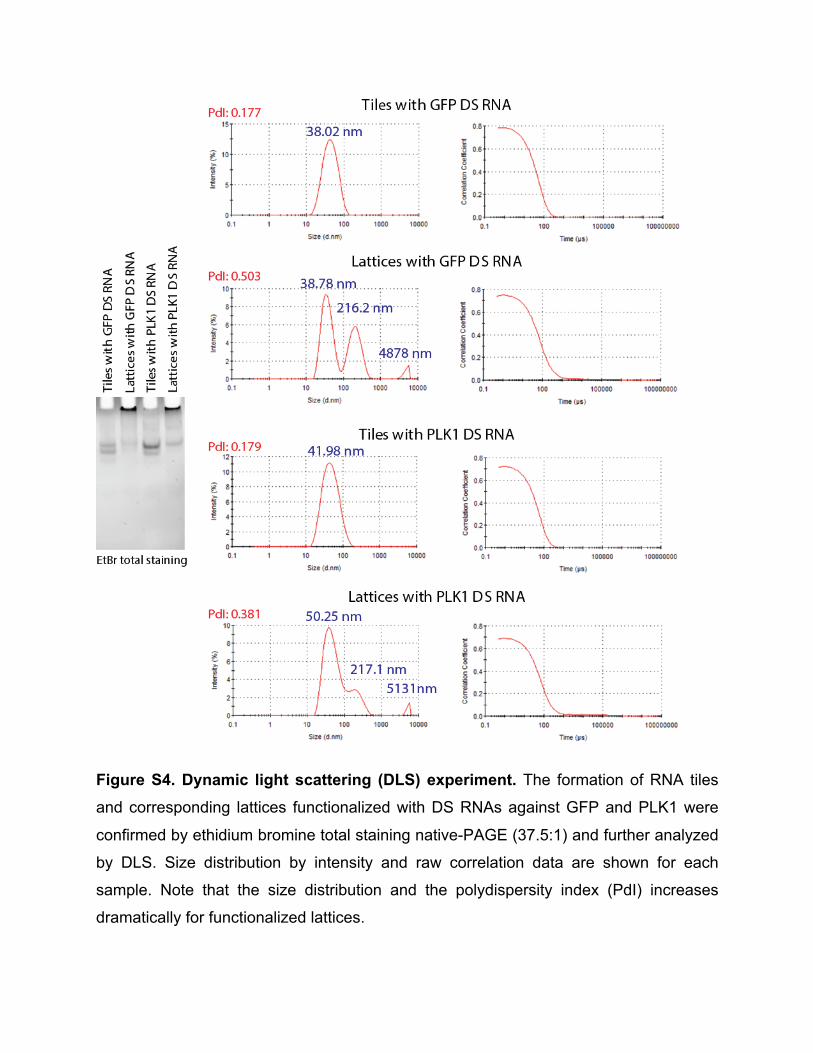
Figure S4. Dynamic light scattering (DLS) experiment. The formation of RNA tiles
and corresponding lattices functionalized with DS RNAs against GFP and PLK1 were
confirmed by ethidium bromine total staining native-PAGE (37.5:1) and further analyzed
by DLS. Size distribution by intensity and raw correlation data are shown for each
sample. Note that the size distribution and the polydispersity index (PdI) increases
dramatically for functionalized lattices.
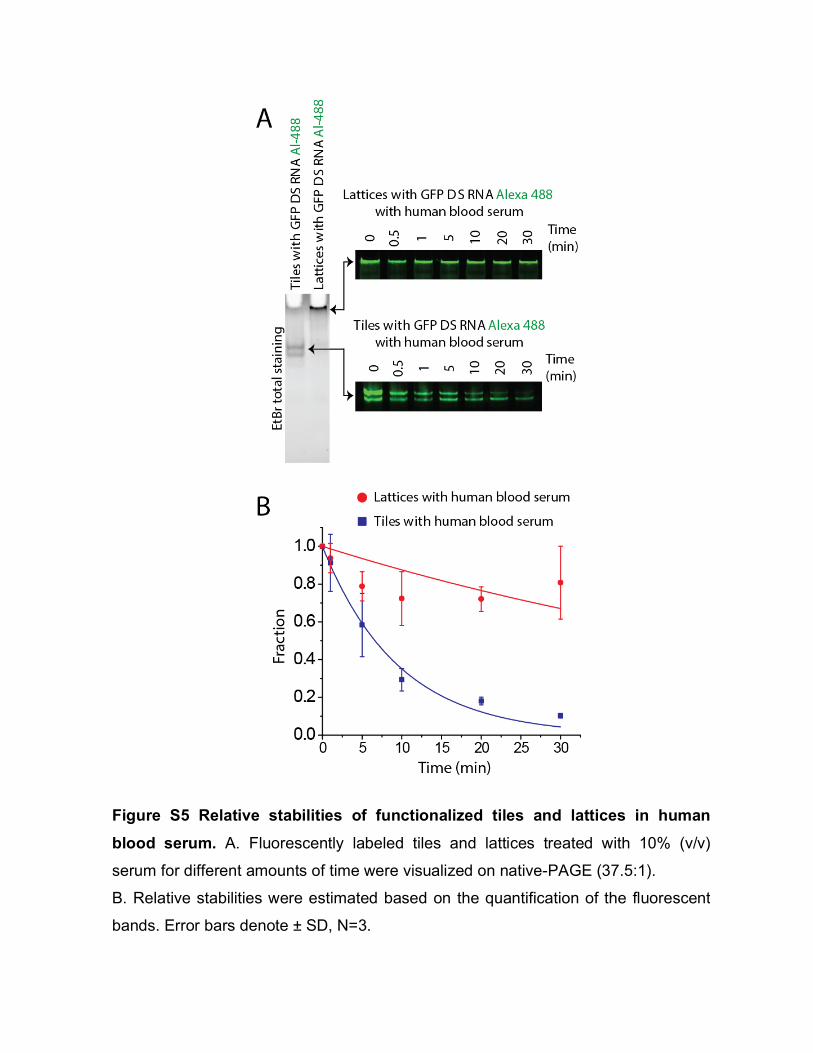
Figure S5 Relative stabilities of functionalized tiles and lattices in human
blood serum. A. Fluorescently labeled tiles and lattices treated with 10% (v/v)
serum for different amounts of time were visualized on native-PAGE (37.5:1).
B. Relative stabilities were estimated based on the quantification of the fluorescent
bands. Error bars denote ± SD, N=3.
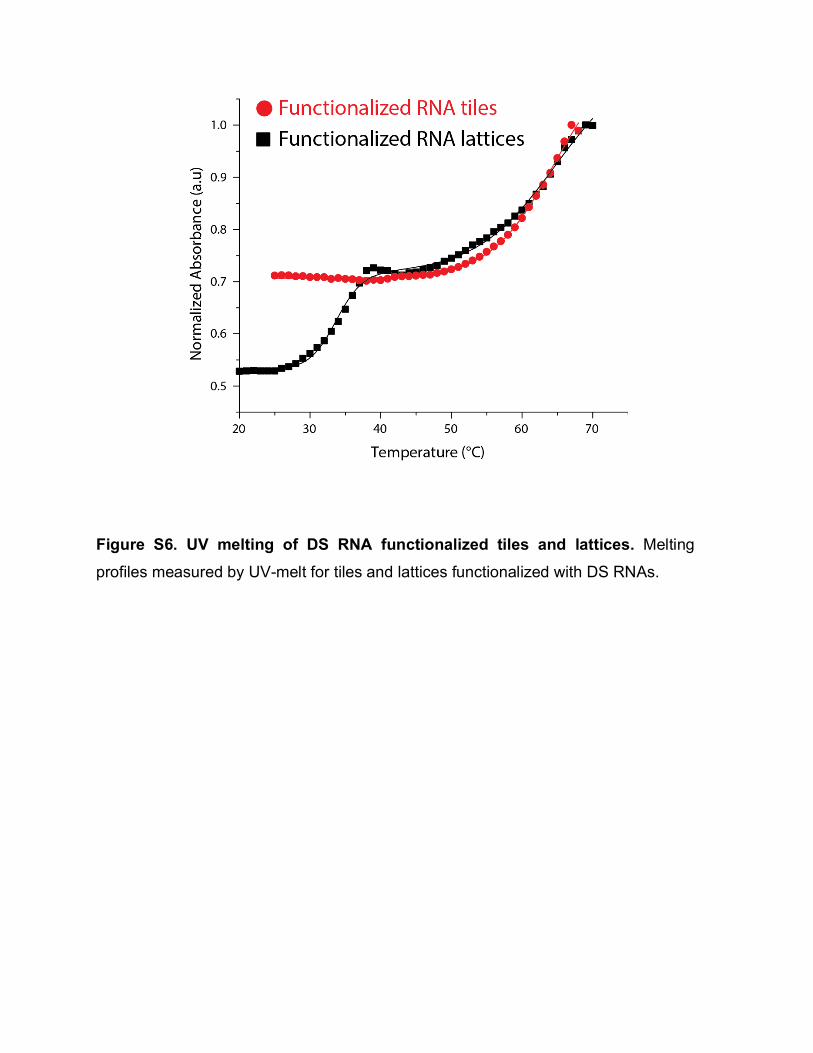
Figure S6. UV melting of DS RNA functionalized tiles and lattices. Melting
profiles measured by UV-melt for tiles and lattices functionalized with DS RNAs.
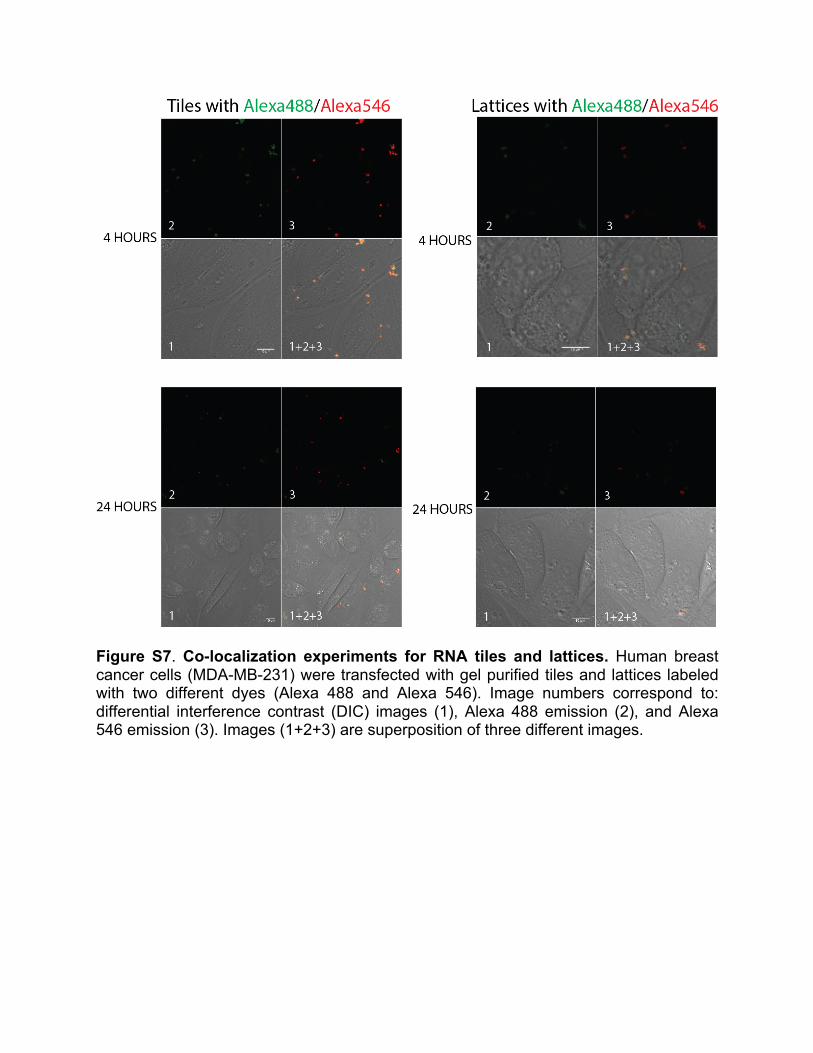
Figure S7. Co-localization experiments for RNA tiles and lattices. Human breast cancer cells (MDA-MB-231) were transfected with gel purified tiles and lattices labeled with two different dyes (Alexa 488 and Alexa 546). Image numbers correspond to: differential interference contrast (DIC) images (1), Alexa 488 emission (2), and Alexa 546 emission (3). Images (1+2+3) are superposition of three different images.
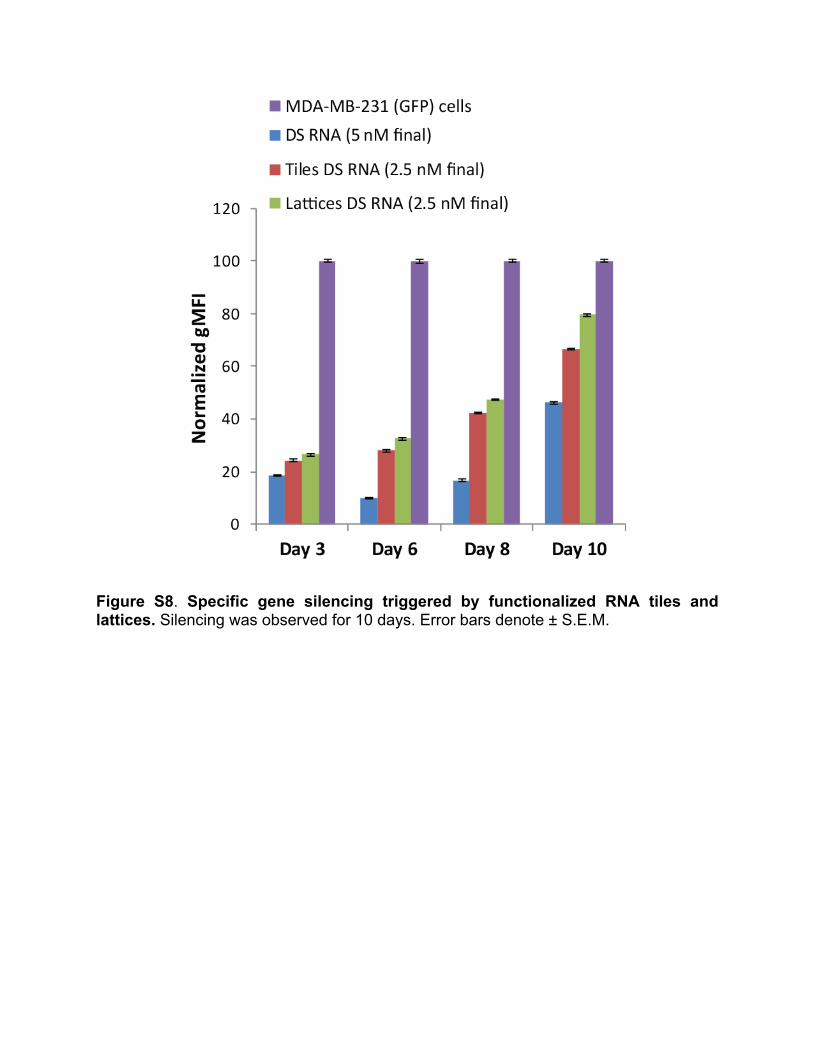
Figure S8. Specific gene silencing triggered by functionalized RNA tiles and lattices. Silencing was observed for 10 days. Error bars denote ± S.E.M.
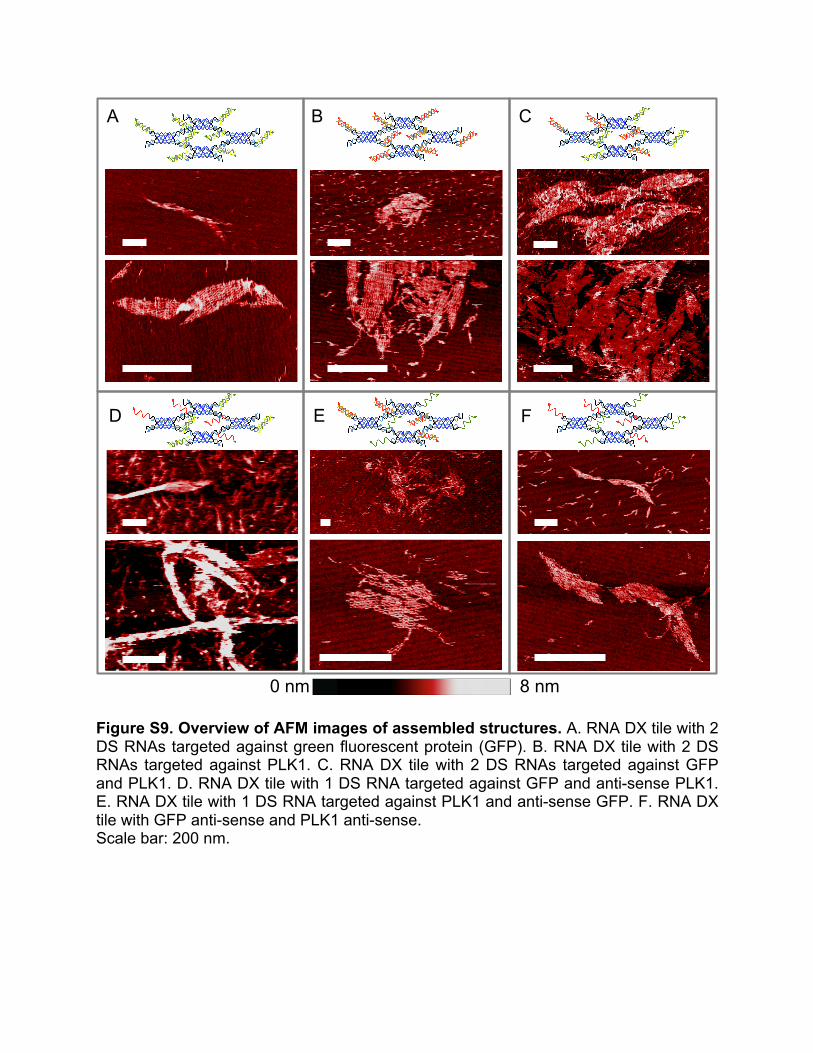
Figure S9. Overview of AFM images of assembled structures. A. RNA DX tile with 2 DS RNAs targeted against green fluorescent protein (GFP). B. RNA DX tile with 2 DS RNAs targeted against PLK1. C. RNA DX tile with 2 DS RNAs targeted against GFP and PLK1. D. RNA DX tile with 1 DS RNA targeted against GFP and anti-sense PLK1. E. RNA DX tile with 1 DS RNA targeted against PLK1 and anti-sense GFP. F. RNA DX tile with GFP anti-sense and PLK1 anti-sense. Scale bar: 200 nm.
A B C
D E F
8 nm 0 nm