Embed Size (px)
Citation preview

UNIVERSIDAD MIGUEL HERNÁNDEZ DE ELCHE
DEPARTAMENTO DE PSICOLOGÍA DE LA SALUD
Programa de Doctorado en Psicología de la Salud
Effects of the
Menstrual Cycle Phases
on Different Strength
Manifestations Doctoral thesis
A dissertation presented by
Alicia Martínez Cantó
Graduate in Physical Activity and Sports Science
Elche, 2017

El Dr. D. Juan Carlos Marzo Campos, director del Departamento de
Psicología de la Salud de la Universidad Miguel Hernández de Elche.
AUTORIZA:
Que el trabajo de investigación titulado: “EFFECTS OF THE MENSTRUAL
CYCLE PHASES ON DIFFERENT STRENGTH MANIFESTATIONS” realizado
por Dña. Alicia Martínez Cantó, bajo la dirección de Dr. D. Manuel Moya
Ramón y Dr. D. Diego Pastor Campos, sea depositado en el
departamento y posteriormente defendido como Tesis Doctoral en esta
Universidad ante el tribunal correspondiente.
Lo que firmo para los efectos oportunos en
Elche, a 5 de Junio de 2017
Fdo.: Juan Carlos Marzo Campos
Director del Departamento de Psicología de la Salud
Universidad Miguel Hernández de Elche


UNIVERSIDAD MIGUEL HERNÁNDEZ DE ELCHE
Departamento: Psicología de la Salud
Programa de Doctorado: Psicología de la Salud
Título de la Tesis:
Effects of the menstrual cycle phases on different strength
manifestations
Tesis Doctoral presentada por:
Dña. Alicia Martínez Cantó
Dirigida por los Dres. D. Manuel Moya Ramón y
D. Diego Pastor Campos
El Director El Director El Doctorando
Elche, a 5 de Junio de 2017

UNIVERSIDAD MIGUEL HERÁNDEZ DE
ELCHE
DEPARTAMENTO DE PSICOLOGÍA DE LA SALUD
PROGRAMA DE DOCTORADO EN PSICOLOGÍA DE LA SALUD
Effects of the
Menstrual Cycle Phases
on Different Strength
Manifestations Doctoral thesis
A dissertation presented by
Alicia Martínez Cantó
Directed by:
Manuel Moya Ramón, PhD
Diego Pastor Campos, PhD
Elche, 2017


“Ni el más sabio conoce el fin
de todos los caminos”
J.R.R. Tolkien


Dedicada a mi Enfermera y mi Bióloga.
Por allanarme el camino,
por hacerme aprender de vuestros errores
y seguir los pasos de vuestros éxitos.
A mi padre, “Pepito Grillo”, mi conciencia.
Por tu altruismo,
por enseñarme que el mundo es mejor con gente como tú.
A mi madre, fuerte y luchadora.
Por alentarme cada día (y cada noche) a seguir adelante,
porque si no me he rendido nunca, ha sido por ti.
A Javi, mi referencia.
Por haberme devuelto la sonrisa.
Gracias a todos.


Agradecimientos


Miro hacia la parte inferior izquierda de la pantalla y veo más de 160
páginas escritas. Más de 160 páginas y ahora no me salen las palabras.
En primer lugar, quiero volver a mencionar a mi familia, a mis padres y
mis hermanas, que me han apoyado durante todo este tiempo y
quienes han confiado en mí desde el principio. Mi tía y mi abuela que,
gracias a ellas, siento que es como si tuviera dos madres más. Y como
no, a Javi, María José y Eva, la otra parte de mi familia que también ha
sido imprescindible en este proceso. Gracias por vuestro apoyo, y lo
más importante, por entender siempre con una sonrisa que no haya
podido estar más tiempo a vuestro lado.
Gracias a mis pequeñas Lii Y Raq. Merecéis estas líneas porque habéis
sido mi gran apoyo todo este tiempo. Bueno, vosotras dos y Dan.
Gracias por preocuparos por mí, por apoyarme en las decisiones difíciles
que he tenido que tomar, y ayudarme a superarlas. Por seguir a mi lado
pase lo que pase, o estéis dónde estéis. Han pasado más de 5 años
desde que empezase nuestra andanza juntos, y hoy soy consciente de
que todos hemos ido creciendo en todos los aspectos de la vida y
seguimos ahí para ir celebrándolo juntos. Es un placer poder
compartirlo con vosotros, así que gracias de nuevo.
Por otro lado, quiero agradecer a Forus la oportunidad de formar parte
de su equipo. Esa experiencia comenzó como un método para ganarme
la vida y poder seguir viviendo en Elche para costearme esta tesis, y ha
acabado siendo el lugar dónde he encontrado a una de las personas más
importante de mi vida (tú sabes perfectamente que me refiero a ti), y a
un grupo que más que compañeros, son amigos. Álex, Dani, Isra, Julián,

Aroca, Ali C, Moni e Irene. Cada cual diferente al anterior, y sin embargo
cada pieza de este engranaje hace que seamos una máquina casi
perfecta. Todos me habéis enseñado muchas cosas, y sé que sois ese
tipo de gente de la que siempre se puede aprender. Siempre recordaré
nuestras formaciones, esos días en los que un grupo de desconocidos
tenía que pasar a ser familia; a Ángel haciendo Sh´Bam de resaca, y a
Sandra quejándose de todo. Nuestras risas con Cher, y esas cosas que
nos han hecho ser únicos. Gracias por apoyarme cuando llegaba a Forus
con ojeras, y por animarme en estos últimos meses entendiendo mi
estado de agobio. Sois increíbles.
Pero la parte principal de estos agradecimientos van destinadas al
grupo de investigadores del Centro de Investigación de Deporte. Por
partes. Tengo que empezar agradeciendo a los compañeros que han
vivido este proceso conmigo, los que hemos compartido los niveles de
estrés a contrarreloj. Ese equipo de risas en los Congresos, de tapas por
las noches, de días de KFC y Póker. En especial a Félix, Artur y Adri, mis
compañeros de Laboratorio, a los que más he visto “sufrir” estos años,
y con quienes más me identifico. Hemos sido las cuatro puntas de este
cuadrado, y os debo mucho de esta tesis. Gracias chicos. Pero no sois
los únicos. Gracias al resto de compañeros de otros laboratorios como
Álvaro, Marta, Belén, Iñaki, Miguel, Alejandro (Koreano) o Diego
(Biomecánica); gracias a aquellos que ya acabasteis con esta agonía
como Carla, María Campayo, Xoxe o Maripi, y a aquellos que todavía la
tendréis que sufrir unos años más como Alejandro Javaloyes o Iván.
Gracias a todos por las risas infinitas y por hacer que venir a trabajar se
convierta en algo que apetece y no en una obligación.

Y esto solo es la base de una gran pirámide. Gracias al Dr. Sarabia, quién
ha llevado las riendas de este laboratorio durante los años en los que
he formado parte de él, el antropometrista oficial de esta tesis, el que
ha resuelto mis dudas una y otra vez y con quien podía hablar de Juego
de Tronos y El Señor de los Anillos. Este laboratorio no sería lo mismo
sin ti. Eres nuestro referente. Y por supuesto, gracias a Fito, alguien que
confió en mi mucho antes de que todo esto empezase. Te debo mucho
más de lo que imaginas. Infinitamente gracias. Y desde ahí podría seguir
nombrando un sinfín de personas. Todos aquellos profesores que me
han formado, que me han hecho un poco más crítica, y quienes me han
transmitido el amor por esta profesión: Barbado (quien me recordará
como la Elfa), Tomás, Reina, Sabido, Jaime, Peláez, Ayala, David
González o Vicente (entre otros). Y, la gran punta del Iceberg, Eduardo
Cervelló, Francis Moreno y Fran Vera. Los que dirigís los tres
laboratorios restantes, y a los que os debemos que esta gran familia se
haya podido formar. Gracias.
Y como no, después de todo esto, gracias a las dos personas
imprescindibles para llevar a cabo este proyecto, mis directores. Gracias
Manolo. No se puede resumir en unas líneas todo lo que te agradezco.
El día que empezaron las clases de entrenamiento en cuarto de carrera
cambió mi vida. Cambió gracias a ti, gracias a tu “no hay café para
todos”. Me diste la oportunidad de lanzar un proyecto nuevo, confiaste
en mí, y espero haber podido cumplir las expectativas lo mejor posible.
Gracias por tu espíritu crítico, por tu exigencia, por guiarme en este
proceso, porque has sido más que un director, y porque este título te lo
debo a ti. Y, por último, y sé que estarás pensando: “me tenido que leer

toda esta chorrada para llegar al último párrafo que es el único en el
que me nombra” (y ahora vienen tus risas infinitas que se escuchan en
todo el CID). Como si te estuviera viendo. Gracias Diego. Sé que estas
palabras no han salido de tu boca, pero me las has inculcado tu: “No.
No lo intentes. Hazlo, o no lo hagas, pero no lo intentes”. Ojalá el
pequeño Padawan supere alguna vez al maestro. Aunque he de decir
que tarea fácil no es. Tienes una mente fascinante, ese punto de locura
que te hace llegar a la genialidad, que te hace buscar y encontrar dónde
no hay. Espero que después de tres años, algo de eso se me haya
pegado. Gracias por aguantarme con mis inquietudes este tiempo, por
el tiempo que has invertido, por los almuerzos con debates y, sobre
todo, porque en el fondo, sé que lo has hecho con cariño. Gracias y
siempre gracias.

Table of Contents List of Figures ........................................................................................ 21
List of Tables ......................................................................................... 23
List of Abbreviations ............................................................................. 25
Abstract ................................................................................................ 27
Chapter 1. General Introduction........................................................... 31
1.1. Definition of the menstrual cycle. ............................................. 33
1.1.1. Hormonal changes. ............................................................. 33
1.1.2. Determination of the menstrual cycle phases. ................... 35
1.1.3. Menstrual Cycle and Sport: The Hormones Effect. ............. 37
1.2. Performance across the menstrual cycle. ................................. 38
1.2.1. Aerobic endurance. ............................................................. 38
1.2.2. Anaerobic capacity. ............................................................. 39
1.2.3. Strength. .............................................................................. 41
1.3. The aim of the thesis and research hypotheses. ....................... 42
Chapter 2. Study 1 ................................................................................ 47
2.1. Introduction. .............................................................................. 49
2.2. Methods. ................................................................................... 51
2.2.1. Participants .......................................................................... 51
2.2.2. Procedures .......................................................................... 52
2.2.3. Statistical Analysis ............................................................... 61
2.3. Results. ....................................................................................... 61
2.4. Discussion and Conclusion. ........................................................ 67
Chapter 3. Study 2 ................................................................................ 73
3.1. Introduction ............................................................................... 75
3.2. Methods. .................................................................................... 78
3.2.1. Participants .......................................................................... 78
3.2.2. Procedures .......................................................................... 79

3.2.3. Statistical Analysis ............................................................... 88
3.3. Results. ....................................................................................... 89
3.4. Discussion and Conclusion. ...................................................... 102
Chapter 4. Study 3 .............................................................................. 109
4.1. Introduction. ............................................................................ 111
4.2. Methods. .................................................................................. 113
4.2.1. Participants ........................................................................ 113
4.2.2. Procedures ........................................................................ 114
3.2.3. Statistical Analysis ............................................................. 123
4.3 Results. ...................................................................................... 124
4.4 Discussion and Conclusion. ....................................................... 139
Chapter 5. Epilogue ............................................................................ 143
5.1. Major contributions. ................................................................ 145
5.2. Study limitations and future research. .................................... 146
Chapter 6. Bibliography ...................................................................... 151
Chapter 7. Annexes. ............................................................................ 173
Annex 1: Cuestionario De Dolor Menstrual .................................... 175
Annex 2: Karolinska Sleep Diary. .................................................... 178
Annex 3: POMS Reducido 29 Items. ............................................... 179
Annex 4: Escala De Percepción Del Esfuerzo CR-10. ...................... 180

List of Figures
Figure 1. Fluctuation of the most important hormones through the menstrual cycle. 35
Figure 2. Experimental design for Study 1. 54
Figure 3. Differences between menstruation and luteal phase in POMS. 64
Figure 4. Experimental design for Study 2. 81
Figure 5a. Inferences between the low back pain group and the non-low back pain group in MEN phase in parallel half-squat, 20 m and CMJ. 92
Figure 5b. Inferences between the low back pain group and the non-low back pain group in FP phase in parallel half-squat, 20 m and CMJ. 93
Figure 5c. Inferences between the low back pain group and the non-low back pain group in LP phase in parallel half-squat, 20 m and CMJ. 94
Figure 6a. Inferences between the breast pain group and the non-breast pain group in MEN phase in bench press throw. 95
Figure 6b. Inferences between the breast pain group and the non-breast pain group in LP phase in bench press throw. 95
Figure 6c. Inferences between the breast pain group and the non-breast pain group in FP phase in bench press throw. 96
Figure 7. Experimental design for Study 3. 117
Figure 8. Inferences between FP and LP in 1-RM and Maximal Power Output Tests. 128
Figure 9. Inferences between FP and LP in Maintenance of the Optimal Velocity and 20 sec-all out Tests. 128
Figure 10a. Inferences between Pain Group and No Pain Group in pre-test in FP. 130
Figure 10b. Inferences between Pain Group and No Pain Group in pre-test in LP. 131
Figure 11a. Inferences between Pain Group and No Pain Group in post-test in FP. 132
Figure 11b. Inferences between Pain Group and No Pain Group in post-test in LP. 133
Figure 12a. Inferences between Pain Group and No Pain Group in % Change in FP. 134
Figure 12b. Inferences between Pain Group and No Pain Group in % Change in LP. 135
Figure 13. Graphical representation of the aims of investigation in each study of the thesis. 145

List of Tables
Table 1. Participants descriptive data of Study 1. Data are shown as Mean ± SD. 52
Table 2. Load and power performance in parallel half squat and bench press throw during menstruation and luteal phase. Data are shown as Mean ± SD. 62
Table 3. Maintenance of the optimal velocity in parallel half squat and bench press throw during menstruation and luteal phase. Data are shown as Mean ± SD. 63
Table 4. 20 m sprint and CMJ performance during menstruation and luteal phase. Data are shown as Mean ± SD. 63
Table 5a. Differences due to menstrual pain in each phase of the menstrual cycle. Data are shown as Mean ± SD. 65
Table 5b. Differences due to low back pain in each phase of the menstrual cycle. Data are shown as Mean ± SD. 66
Table 6. Participants descriptive data of Study 2. Data are shown as Mean ± SD. 78
Table 7. Menstrual cycle descriptive data. Data are shown as Mean ± SD. 82
Table 8. Inferences between the 3 phases in the velocity variables of the maintenance of the optimal velocity test in all groups. 91
Table 9a. Inferences between the 3 phases in RPE in all groups. 97
Table 9b. Inferences between pain and no pain group across the menstrual cycle in RPE. 97
Table 10a. Correlations between performance variables of Bench Press Throw and questionnaire variables in MEN. 98
Table 10b. Correlations between performance variables of Bench Press Throw and questionnaire variables in FP. 99

Table 10c. Correlations between performance variables of Bench Press Throw and questionnaire variables in LP. 100
Table 11. Correlations between performance variables of Parallel Half Squat and questionnaire variables across the menstrual cycle. 101
Table 12. Correlations between performance variables of CMJ and questionnaire variables in FP. 101
Table 13. Participants descriptive data of Study 3. Data are shown as Means ± SD. 114
Table 14. Volume and Intensity in each intervention phase. Data are shown as Means ± SD. 123
Table 15. Changes in performance variables in 1-RM and Maximal Power Output test for FP and LP. 126
Table 16. Changes in performance variables in maintenance of the optimal velocity and 20 sec-all out test. 127
Table 17a. Correlations between performance and questionnaire variables in pre-test in FP. 136
Table 17b. Correlations between performance and questionnaire variables in post-test in FP. 137
Table 17c. Correlations between performance and questionnaire variables in pre-test in LP 138
Table 17d. Correlations between performance and questionnaire variables in post-test in LP. 138

List of Abbreviations
ATP Adenosin-Tri-Phosphate BMI Body Mass Index BBT Basal Body Temperature BP Breast Pain CHO Carbohydrate CK Creatine Kinase CL Confident Limits CMJ Counter-Movement Jump CSA Cross-Sectional Area CV Coefficient of Variation E2 Estradiol F Force Fdm Fibre Diameter FFA Free Fatty Acids FP Follicular Phase FSH Follicle Stimulating Hormone gFP Group that start measurements in FP GH Growth Hormone gLP Group that start measurements in LP gMEN Group that start measurements in MEN GnRH Gonadotrophin-releasing Hormone H Days with Headache per cycle ICC Intraclass Correlation Coefficient Kg-OP Kilograms for optimal load KSD Karolinska Sleep Diary LBM Lean Body Mass LBP Low Back Pain LH Luteinizing Hormone LP Luteal Phase m Meters in 20-sec-all out test M Days with menstruation per cycle MBI Magnitude Based Inferences Mdm Muscle Diameter MEN Menstruation MP Menstrual Pain MPP Mean Power during Propulsive Phase MPV Mean Velocity during Propulsive Phase

MVC Maximal Voluntary Contraction No BP No Breast Pain No LBP No Low Back Pain No MP No Menstrual Pain OCP Oral Contraceptive OV Ovulation p Statistical Signification P Power Pmax Maximal Power Pmean Mean Power in 20-sec-all-out test PMS Pre-menstrual Syndrome POMS Profile of Mood States P4 Progesterone r Pearson´s Correlation Coefficient Repts-OP Repetitions within optimal velocity RFD Ratio of Force Development RPE Reported Perception of Effort SD Standard Deviation SSC Stretch Shortening Cycle V Velocity VBRT Velocity-Based Resistance Training VLDL Very Low Density Lipoprotein Vmax Maximal Velocity VO2max Maximal Oxygen Consumption %RM Percentage of 1-RM %RM-OP Percentage of 1-RM in which Pmax was achieved 1-RM One Repetition Maximum 5 m Acceleration in the first five linear meters 20 m Twenty meters lineal sprint
Abstract
The purpose of this thesis was to investigate the effect of
menstrual cycle phases on strength training in both lower and upper
body exercises, on dynamic and kinematic responses and on the
adaptations produced after a training period using the velocity-based
resistance training (VBRT). It was also to analyze the impact of the
discomfort associated with menstruation on this type of training. The
main findings of this thesis include: (1) different performance tests
executed at maximum velocity to evaluate the power output, as well as
an indirect test to evaluate the 1-RM can be performed indistinctly at
any phase of the menstrual cycle; (2) the maximal velocity (Vmax) and
the mean velocity during the propulsive phase (MPV) are higher in the
follicular phase (in the moments prior to ovulation); (3) discomfort
associated with menstruation and premenstrual syndrome adversely
affect the performance test results; (4) the reported perception of
effort (RPE) by the participants is greater at the time of menstruation
and prior to it; (5) better results were obtained in the follicular phase in
all the applied tests after two-weeks of intervention in each phase of
the menstrual cycle; (6) the group reporting no discomfort associated
with menstruation, obtained greater improvements in all tests in the
follicular phase after two weeks of intervention, while both groups
improved equally in the luteal phase. The results of this thesis indicate
that the tests to evaluate strength and the power produced can be used
in any phase of the cycle without affecting the results, but when a
program of velocity-based resistance training is performed, it would be
more productive to concentrate training loads in the first two weeks of

the menstrual cycle. In addition, women who report suffering from
dysmenorrhea or pain associated with menstruation, obtain worse
results in the applied tests with and without an intervention program.
This implies that the use of oral contraceptives can be evaluated to
reduce this symptomatology and to increase the performance after
analyzing if the effect of exogenous hormonal load does not affect this
type of training.
Key Words: Menstrual Cycle, dysmenorrhea, strength training, velocity
training, power output.

Resumen
El propósito de esta tesis fue investigar el efecto de las fases del
ciclo menstrual sobre el entrenamiento de fuerza tanto en ejercicios de
tren inferior como de tren superior sobre respuestas dinámicas y
cinemáticas, y las adaptaciones producidas después un periodo de
entrenamiento de fuerza basado en la velocidad. También se analizó el
impacto que tiene sobre este tipo de entrenamiento las molestias
asociadas a la menstruación. Los principales hallazgos de esta tesis
incluyen: (1) diferentes test de rendimiento ejecutados a máxima
velocidad para evaluar la potencia producida y, así como un test
indirecto para evaluar el 1-RM pueden ser realizados indistintamente
en cualquier fase del ciclo menstrual; (2) la velocidad máxima y la
velocidad media durante la fase propulsiva son mayores en la fase
folicular (en los momentos previos a la ovulación); (3) las molestias
asociadas a la menstruación, y el síndrome pre-menstrual afectan
negativamente a los resultados de los test de rendimiento cuando se
aplicaron en diferentes fases del ciclo menstrual; (4) la percepción de
esfuerzo de los sujetos es mayor en los momentos de la menstruación
y previos a ella; (5) tras intervenir en cada una de las fases del ciclo
menstrual, se obtuvieron mejores resultados en la fase folicular en
todos los test aplicados; (6) el grupo que indicó no tener molestias
asociadas a la menstruación, obtuvo mayores mejoras en todos los test
en la fase folicular tras dos semanas de intervención, mientras que
ambos grupos mejoraron por igual en la fase lútea. Los resultados de
esta tesis indican que los test para evaluar la fuerza y la potencia
pueden ser utilizados en cualquier fase del ciclo sin que el resultado se

pueda ver afectado por él, pero a la hora de realizar un entrenamiento
de fuerza basado en la velocidad, sería más conveniente concentrar las
cargas de entrenamiento en las dos primeras semanas del ciclo
menstrual. Además, las mujeres que sufren dismenorrea o dolores
asociados a la menstruación, obtienen peores resultados en los test de
rendimiento con o sin la aplicación de un programa de fuerza. Esto
implica que se pueda valorar el uso de anticonceptivos orales para
disminuir esta sintomatología y aumentar el rendimiento tras analizar
si el efecto de la carga hormonal exógena no afecta a este tipo de
entrenamiento.
Palabras clave: Ciclo menstrual, dismenorrea, entrenamiento de fuerza,
entrenamiento de velocidad, potencia producida.
Chapter 1. General Introduction


1.1. Definition of the menstrual cycle.
The menstrual cycle is the result of the sexual maturation in the
woman, that promotes the transition from childhood to adulthood.
Sexual maturation is determined by an increase in ovarian hormonal
concentrations and a development of secondary sexual characteristics,
such as the growth of the breasts, genital organs and pubic hair (Isacco,
Duché, & Boisseau, 2012).
Regarding hormonal concentrations, it fluctuation leads to
menstrual cycle. This is characterized by two distinct phases lasting
approximately 14 days: the follicular phase (FP) and the luteal phase
(LP). The follicular phase begins with the onset of bleeding
(menstruation, MEN) and lasts until the ovulation (OV) process occurs.
The luteal phase begins after ovulation and lasts until the onset of the
next bleeding (Constantini, Dubnov, & Lebrun, 2005; Isacco, Thivel,
Pereira, Duclos, & Boisseau, 2014).
1.1.1. Hormonal changes.
There are several hormones involved in the regulation of the
menstrual cycle (Figure 1). The most important hormones are: follicle
stimulating hormone (FSH), luteinizing hormone (LH), estradiol (E2) and
progesterone (P4) (Oosthuyse & Bosch, 2010). These hormones are
divided into two groups:
- Pituitary Hormones (adenohypophysis or pituitary gland). Both
FSH and LH are gonadotropic hormones produced by the
anterior lobe of the pituitary gland and have effects on the
CHAPTER 1: GENERAL INTRODUCTION
34
gonads. FSH stimulates follicular cells and the secretion of
estrogens; LH favors the maturation of oocytes and the
secretion of estrogens and progesterone. During FP there is a
gradual increase in FSH, and around the 14th day of the cycle, a
peak of LH occurs giving rise to ovulation.
- Gonadal hormones (ovaries). Estrogens (such as 17β-estradiol or
E2, which is the most common estrogen in a woman's body), and
progestogens (such as progesterone or P4) are two types of
steroid hormones secreted by the ovaries. During FP, an
increase of E2 occurs, while P4 is kept at low levels. In LP, both
E2 and P4 remain high.
The hypothalamic-pituitary-ovarian axis connects both types of
hormones. Gonadotrophin-releasing hormones (GnRH) are secreted
from the hypothalamus, which in turn stimulate the gonadotropic cells
of the adenohypophysis, releasing FSH and LH. These are poured into
the bloodstream and perform their actions on the ovaries to stimulate
the production of P4 and E2.

EFFECTS OF THE MENSTRUAL CYCLE PHASES ON DIFFERENT STRENGTH MANIFESTATIONS
35
Figure 1. Fluctuation of the most important hormones through the menstrual cycle
(adapted from Oostehuyse & Bosch, 2010).
E2 = Estradiol; P4 = Progesterone; FSH = Follicle Stimulating Hormone; LH = Luteinizing
Hormone.
1.1.2. Determination of the menstrual cycle phases.
To investigate the effects of the menstrual cycle phases on
performance, it is fundamental to be able to establish those phases.
Janse de Jonge (2003) described four methods to establish the
menstrual cycle phases:
- The technique of counting days. It is assumed that the
participant has a regular ovulatory menstrual cycle. For this,
data from previous cycles are recorded, and days will be
counted from the day of onset of bleeding (day 1). The problem
0
5
10
15
20
25
0
50
100
150
200
250
1 2 3 4 5 6 7 8 9 10 11 12 13 14 15 16 17 18 19 20 21 22 23 24 25 26 27 28
P4
(ng/m
l)
FS
H (
mU
I/m
l)
LH
(m
UI/
ml)
E2
(p
g/m
l)
Days
Hormones across the mestrual cycle
E2 P4 FSH LH
CHAPTER 1: GENERAL INTRODUCTION
36
with this technique is that FP is much more variable than in the
luteal period, so we will certainly not know if ovulation has
occurred within 14 days of the start of the menstruation. What
is known is that the luteal phase is more stable, so if the next
menstruation is recorded, it can be confirmed that a
measurement has been performed in the LP if it has been within
the last 14 days of the cycle.
- Basal body temperature (BBT) record: The BBT increases
approximately 0.3º C after ovulation and is maintained during
the LP (Horvath & Drinkwater, 1982; Labour & Marshall, 1963).
Thus, by recording the body temperature at the time of rising, it
can be detected if ovulation has occurred, and therefore know
whether the participant is in the luteal phase.
- Urine LH concentration: It is possible to know the concentration
of LH in the urine through an ovulation predictor kit. If a peak of
LH is detected, it can be assumed with a confidence level of 95%
that ovulation will occur within the next 14-26 hours (Miller &
Soules, 1996).
- Progesterone and Estradiol concentrations: Knowing the
fluctuation of both hormones during the cycle, it can be known
in which phase the participant will be, based on the
concentration of these hormones. Concentrations can be
obtained by serum or saliva, and the metabolites of both
hormones can also be measured in urine.

EFFECTS OF THE MENSTRUAL CYCLE PHASES ON DIFFERENT STRENGTH MANIFESTATIONS
37
The determination method used must be kept in mind to
compare or interpret results in bibliography.
1.1.3. Menstrual Cycle and Sport: The Hormones Effect.
Estrogens regulate a lot of body functions that can affect
exercise tolerance. Some examples of these body functions are the
regulation of fat levels, blood glucose levels, insulin sensitivity, salt and
water balance, cell proliferation, vascular tone and oxygen levels in cells
(Kraemer, Francois, & Castracane, 2012). Estrogens have been shown
to increase lipolysis (Constantini et al., 2005; Lebrun, 1993; Oosthuyse
& Bosch, 2010) and the production of very low density lipoprotein
(VLDL) (Ellis, Lanza-Jacoby, Gow, & Kendrick, 1994; Godsland, 1996)
increasing lipid availability as an energy source (Braun & Horton, 2001).
In addition, through this enhanced lipid synthesis and improved lipolysis
in the muscle, estradiol promotes glycogen uptake and storage in the
liver (Constantini et al., 2005; Redman & Weatherby, 2004), tending to
save glycogen stores by driving more metabolism towards free fatty
acids (FFA) (Redman & Weatherby, 2004). Estradiol increases levels of
growth hormone (GH) inducing lipolysis, and progesterone decreases
glycogenolysis, which complements the effect of estradiol (Braun &
Horton, 2001; Ellis et al., 1994). The fact that less carbohydrate (CHO)
and higher lipid are used, was demonstrated during the phase when
estradiol and progesterone are high (LP), with an increased endurance
performance during this phase due to the availability of fat substrate,
which would explain why women have a greater relative ultra-
endurance performance compared to men (Constantini et al., 2005;
Lebrun, 1993).

CHAPTER 1: GENERAL INTRODUCTION
38
On the other hand, it has been demonstrated that estradiol has
an anabolic effect against the catabolic effect of progesterone
(Constantini et al., 2005; Ekenros, Hirschberg, Heijne, & Fridén, 2013;
Fridén, Hirschberg, & Saartok, 2003; McClung, Davis, & Carson, 2007;
McClung, Davis, Wilson, Goldsmith, & Carson, 2006; Sakamaki, Yasuda,
& Abe, 2012). Myoblasts of skeletal muscle, myotubes and mature
fibers express estrogen receptors, which implies that the skeletal
muscle is sensitive to estrogen signaling (Kahlert et al., 1997; McClung
et al., 2006). Estrogens can regulate the mass of the skeletal muscle in
rats (Kobori & Yamakuro, 1889; McClung et al., 2006) and have positive
effects on muscle contractile function (Carson & Manolagas, 2015;
Enns, Iqbal, & Tiidus, 2008; Enns & Tiidus, 2008)
Associated with muscle atrophy, estrogens can regulate various
processes of accumulation and regeneration of skeletal muscle mass
such as extracellular matrix remodeling, myofibre regeneration and
growth, inflammation or sarcolemma damage (McClung et al., 2006).
Based on all these ideas, it could mean that there may be a greater
strength gain when estradiol is high and progesterone is low (FP in
moments prior to ovulation).
1.2. Performance across the menstrual cycle.
1.2.1. Aerobic endurance.
Due to the metabolic action of estradiol and its interaction with
progesterone, we can expect a higher performance of aerobic capacity
during the LP. Different authors have corroborated these data, showing
an increase in muscle glycogen in this phase (Hackney, Muoio, & Meyer,
EFFECTS OF THE MENSTRUAL CYCLE PHASES ON DIFFERENT STRENGTH MANIFESTATIONS
39
2000), decreasing lactate in blood (Bemben, Salm, & Salm, 1995;
McCracken, Ainsworth, & Hackney, 1994), or increasing excess post-
exercise oxygen consumption (EPOC) and resting metabolic rate, as well
as a decrease in post-exercise respiratory exchange rate (RER),
suggesting a greater use of fats in LP with respect to FP (Matsuo, Saitoh,
& Suzuki, 1999). A recent study also showed a longer time to exhaustion
(Tenan, Hackney, & Griffin, 2016). However very few studies have
reported changes in maximal oxygen consumption (VO2max) between
the phases (Lebrun, McKenzie, C. Prior, & E. Taunton, 1994), compared
to a larger number of studies which found that VO2max does not vary
between phases (Beidleman et al., 1999; Bemben et al., 1995;
Dombovy, Bonekat, Williams, & Staats, 1987; Isacco et al., 2014;
Jurkowski, Jones, Toews, & Sutton, 1981). Although there may be
differences in different aerobic variables showing a higher performance
in LP, these changes do not imply an alteration of VO2max (Constantini et
al., 2005; Janse de Jonge, 2003).
1.2.2. Anaerobic capacity.
Among the parameters analysed there are variables such as the
mean or peak power output in different tests such as the Wingate test,
running test on treadmill or bicycle and jumps, or variables such as peak
torque in isokinetic protocols.
The anaerobic capacity is dependent on the anaerobic
metabolism, that is to say, the use of phosphagens, anaerobic glucose
consumption and the reserves of adenosine tri phosphate (ATP), with
an activation of type II fibres (Constantini et al., 2005). Taking into

CHAPTER 1: GENERAL INTRODUCTION
40
account that estradiol favors the metabolism of lipids, and
progesterone decreases glycogenolisis, it could be expected that there
would be an anaerobic performance increase when the E2 was low.
However, there is controversy regarding the analysis of the variables
used to assess anaerobic performance. Some studies have found no
differences in anaerobic power in a 20-second maximal cycling sprint
test (Wiecek, Szymura, Maciejczyk, Cempla, & Szygula, 2016), 30-
second maximum sprint on treadmill (Tsampoukos, Peckham, James, &
Nevill, 2010), time to exhaustion in intermittent exercise with sprints of
8 seconds (Giacomoni, Bernard, Gavarry, Altare, & Falgairette, 2000),
15 seconds (Miskec, Potteiger, Nau, & Zebas, 1997) or 20 seconds
(Lynch & Nimmo, 1998), neither in a jump test (Fridén, Hirschberg, &
Saartok, 2003; Giacomoni et al., 2000), in a Wingate test (Bushman,
Masterson, & Nelsen, 2006) or in peak torque in isokinetic muscle
strength of the knee flexors (Fridén, Hirschberg, & Saartok, 2003).
However, other studies have found better results in FP in anaerobic
power in rowers (10-seconds all-out effort) and in anaerobic capacity
(1000-m row) (Redman & Weatherby, 2004), and also in different jump
tests (Davies, Elford, & Jamieson, 1991; Sipavičiene, Daniusevičiute,
Kliziene, Kamandulis, & Skurvydas, 2013; Wikström-Frisén, Boraxbekk,
& Henriksson-Larsén, 2015) and in isokinetic peak torque (Wikström-
Frisén et al., 2015).
Summarizing, it does not seem clear whether the menstrual
cycle could affect the results of different tests to measure anaerobic
performance.

EFFECTS OF THE MENSTRUAL CYCLE PHASES ON DIFFERENT STRENGTH MANIFESTATIONS
41
1.2.3. Strength.
Estradiol has an anabolic effect (Carson & Manolagas, 2015), in
addition, it favors the synthesis of GH (Bernardes & Radomski, 1998;
Leung, Johannsson, Leong, & Ho, 2004). Progesterone, however, has
the opposite effect, being considered catabolic (Reis, Frick, &
Schmidtbleicher, 1995). Therefore, it could be expected that there
would be greater strength gains when estradiol is high and
progesterone is low.
Some articles support this assumption. A recent study
(Wikström-Frisén et al., 2015) found a significant height increase in
squat jump (SJ) and in counter-movement jump (CMJ), peak torque
values in hamstrings, and mean values of lean body mass (LBM) in legs
in the group that trained in FP with respect to LP. Sung et al., (2014)
found a greater maximal strength and muscle diameter (Mdm) after the
training intervention in FP with respect to LP. Pallavi, Souza, &
Shivaprakash (2017) found a greater handgrip strength and lower
fatigue rate percentage in FP with respect to MEN and LP. Other studies
have found better maximum voluntary contraction (MVC) in FP (Phillips,
Sanderson, Birch, Bruce, & Woledge, 1996; Sarwar, Niclos, &
Rutherford, 1996; Tenan et al., 2016), and increased overall strength
decrease and higher muscle damage parameters (such as Creatine
Kinase, CK) in the luteal group (Markofski & Braun, 2014).
However, different studies have found no differences between
the phases in the handgrip strength, in the isokinetic muscle leg
strength (Fridén, Hirschberg, & Saartok, 2003), in the cross-sectional

CHAPTER 1: GENERAL INTRODUCTION
42
area (CSA), in the one-repetition maximum (1-RM) and in the MVC of
brachial biceps (Sakamaki-Sunaga, Min, Kamemoto, & Okamoto, 2016).
In addition, beyond our assumption, Sakamaki et al., (2012) found
greater hypertrophy and muscle gain with a blood flow-restricted
training in the group that trained in LP. Therefore, the effects of
menstrual cycle phases on strength are unclear.
Relative to strength training, there is a new training
methodology called velocity-based resistance training (VBRT). This new
trend tries to look for the load (1-RM percentage) in which the Maximal
Power (Pmax) is generated in a specific movement (Cormie, Mccaulley,
Triplett, & Mcbride, 2007; Dugan, Doyle, Humphries, Hasson, &
Newton, 2004; Kawamori et al., 2005; Kawamori & Haff, 2004). This
%RM is used to train until the speed declines, trying to minimize the
processes of fatigue in the participants. Different methodologies have
been used in this type of training: more than 10% speed loss (Fry, 2004),
20% or 40% (Pareja-Blanco et al., 2016). This %RM is known as ‘optimal’
load, trying to find a balance between load and velocity to generate the
peak-power. Training with the 'optimal' load provides an effective
stimulus to generate improvements in Pmax for a specific movement
(McBide, Triplett-McBride, Davie, & Newton, 2002). There are no
studies that have analyzed the effect of menstrual cycle on this training
methodology.
1.3. The aim of the thesis and research hypotheses.
The menstrual cycle is divided into two phases. Many authors
have focused their study on the comparison of both FP and LP phases,

EFFECTS OF THE MENSTRUAL CYCLE PHASES ON DIFFERENT STRENGTH MANIFESTATIONS
43
but controversy exists when studying FP. A large majority of authors
focused their study on the FP without differentiating the moment of
menstruation (MEN) from the rest of the phase. We see that there are
authors who talk about "follicular phase" when they are actually
collecting their data at the moment of bleeding, and these results have
been compared with other studies that were performed in the follicular
phase (post-menstruation). For this reason, it is observed that several
studies compared FP (not including menstruation) versus LP, missing an
important moment of the cycle (in which the hormonal concentration
is low) to compare with the rest.
The aim of this thesis is to analyze the effects of menstrual cycle
(including MEN phase) in different exercises to evaluate power training
and strength.
Three studies were proposed to carry out this Project:
1. Effects of the menstrual cycle on the power output: a pilot
study.
2. Could the menstrual hormones affect strength and velocity?
3. The use of Velocity-Based Resistance Training in elite rowers at
different menstrual cycle phases affects performance
improvements.
The main objectives of each study, with their respective
hypothesis (H), were:
CHAPTER 1: GENERAL INTRODUCTION
44
1. The aim of the first study was to analyze different power tests
including executions at maximum speed in MEN compared to LP
using the technique of counting days to determine the phases
of the menstrual cycle and to check if the results can be affected
by the presence of discomfort associated with the
menstruation.
H1: According to Davies et al. (1991), Markofski & Braun (2014), and
Redman & Weatherby (2004), better results will be found at the
time of bleeding phase (MEN).
H2: Menstrual pain adversely affects test results. In addition, the
increase of pain in a specific area (due to dysmenorrhea) affects the
exercises in which this area intervenes (Constantini et al., 2005;
Fridén, Saartok, Bäckström, Leanderson, & Rendström, 2003).
2. The purpose of the second study was to analyze the action of
the MEN, FP and LP in different performance tests that include
actions at maximum speed, assuring that the phases are well
established through hormonal values, and the interaction of
pre-menstrual and menstrual syndrome with these results.
H3: According to Carson & Manolagas (2015), Gleeson & Shalet
(2005), Kraemer et al. (2012) and Reis et al. (1995), high
concentrations of estradiol and low concentrations of progesterone
in FP (moments prior to ovulation) produce a better performance in
velocity and strength.

EFFECTS OF THE MENSTRUAL CYCLE PHASES ON DIFFERENT STRENGTH MANIFESTATIONS
45
H4: In line with Constantini et al. (2005), Fridén, Saartok, Bäckström,
Leanderson, & Renström (2003), and Giacomoni et al. (2000),
dysmenorrhoea, bad sleep quality or negative states of moods
across de menstrual cycle, negatively affect the performance of
velocity and strength.
3. The main purpose of the third study was to analyze the effects
after an intervention with a velocity-based resistance training
program in FP and LP:
H5: Training in the first two weeks of the menstrual cycle (FP)
induces greater improvements in performance compared to
training in the last two weeks (LP) in high performance athletes
(Pallavi et al., 2017; Reis et al., 1995; Sung et al., 2014; Wikström-
Frisén et al., 2015).
H6: According with Pareja-Blanco et al. (2016), velocity-based
resistance training is a good method to improve power and strength
for female elite rowers, and it also has a transfer to specific
demands of the sport.

Chapter 2. Study 1 Effects of the menstrual cycle on the power output: a pilot study.

2.1. Introduction.
The menstrual cycle is divided into two major phases with
approximately 14 days of duration: the follicular phase (PF) and the
luteal phase (LP) (Constantini et al., 2005; Isacco et al., 2012).
Several studies have analyzed the response of different tests in
each phase of the menstrual cycle, trying to know if the performance
could change based on the phase. In some sports, like weightlifting,
training the maximum strength is essential, but in the majority of sports,
performance is strongly marked by the ability to carry out an action or
sporting movement in the shortest possible time (McBride, Triplett-
McBride, Davie, & Newton, 1999), so the power output is a very
important factor (Gabbet, Kelly, & Pezet, 2007). Several authors have
shown that the ability to generate higher power leads to an
improvement in performance (Baker, Nance, & Moore, 2001a, 2001b;
Wisløff, Castagna, Helgerud, Jones, & Hoff, 2004). Therefore, it is
important to know whether the phases of the menstrual cycle can affect
the power output.
In this line, most articles have focused their analysis on
anaerobic power, using different tests such as the Wingate test
(Bushman et al., 2006; Masterson, 1999), and several studies have also
used jump tests, sprints or isokinetic protocols (Fridén, Hirschberg, &
Saartok, 2003; Giacomoni et al., 2000; Lebrun et al., 1994; Redman &
Weatherby, 2004; Tsampoukos et al., 2010; Wikström-Frisén et al.,
2015). Davies et al (1991) found an increase in the handgrip during
bleeding and attributed it to low levels of progesterone (P4) and

CHAPTER 2: STUDY 1
50
estrogens (E2). Redman and Weatherby (2004) used two types of oral
contraceptives in rowers: one with low doses of E2 and P4, and another
with a high dose of both hormones. They found better results in 10-s all-
out test and in 1000 m in the group with low hormone concentration
(with similar concentrations to menstruation). In addition, Markofski
and Braun (2014) found that participants with lower E2 concentrations
during the menstrual phase would exhibit a less severe strength
decrease, although the opposite hypothesis was considered in that
study.
However, no research has been found about the use of the
velocity-based resistance training (VBRT) in the strength training
sessions close or in the bleeding phase of the menstrual cycle. This
concept about weight and the highest possible power output (Castillo
et al., 2012) tries to find a balance between the load (% RM) and
execution speed. In this way, mechanical power could be defined as the
force multiplied by the movement velocity (Knudson, 2009). Even
though there is no evidence that the velocity levels may vary acutely
depending on the hormonal concentration of each phase of the
menstrual cycle, this new training tendency could be a more specific
methodology to test the power output and the execution speed during
the menstrual cycle, and because of the evidence that there may be a
greater performance when the hormonal concentration is low, we
hypothesized that there may be better results in the bleeding phase of
the menstrual cycle.
EFFECTS OF THE MENSTRUAL CYCLE PHASES ON DIFFERENT STRENGTH MANIFESTATIONS
51
There are few articles on the aforementioned that also collect
the influence of other causes that could affect the performance, such
as the premenstrual syndrome (PMS) and dysmenorrhea. There are
many symptoms that encompass premenstrual syndrome (Constantini
et al., 2005). Although not all women suffer from it, in some cases their
overall performance capacity may be influenced, or even increase the
risk of injury (Fridén, Hirschberg, Saartok, & Renström, 2006; Möller-
Nielsen & Hammar, 1989). With respect to dysmenorrhea, it affects 45%
to 80% of the general female population (Warren & Shangold, 1997).
Therefore, it is necessary to know if factors such as sleep, or discomfort
associated with menstruation could influence performance.
Therefore, the aim of this study was to analyze different power
tests including executions at maximum speed during the phases of the
menstrual cycle, and determine whether these phases can contribute
to change the velocity levels, obtaining better results in the bleeding
phase, and if the results can be affected by the presence of discomfort
associated with the menstruation.
2.2. Methods.
2.2.1. Participants
Five women, all physically active and sport science students took
part in this study. The inclusion criteria were: they did not suffer from
injuries, they showed no hormonal irregularities, they had a regular
menstrual cycle, they were non-smokers and they had not used oral
contraceptives (OCP) during the last six months. The descriptive data of
the sample are shown in table 1.

CHAPTER 2: STUDY 1
52
The study was approved by the university ethical committee and
was implemented in accordance with the Declaration of Helsinki.
Written informed consent was completed by participants.
Table 1. Participants descriptive data. Data are shown as Means ± SD.
n
Age (y)
Body mass (kg)
Height (m)
B.M.I. Fat
mass (%)
Vo2max (ml/kg/min)
Menstrual cycle (days)
Total (n = 5)
20.33 ± 2.58
54.58 ± 6.19
1.69 ± 0.05
21.33 ± 2.75
22.57 ± 5.20
48.71 ± 7.38
31.20 ± 1.82
2.2.2. Procedures
Participants attended four laboratory sessions. The first day
included the anamnesis, the menstrual pain questionnaire (Larroy,
Crespo, & Meseg, 2001) and the familiarization session. In the
familiarization session, the participants carried out all performance
tests of the session two and three, in order to familiarize with the
protocol and to ensure they had no problems with the execution of the
exercises.
In the second and third day, two questionnaires were
performed: Karolinska Sleep Diary (SKD) (Torbjörn, Hume, Minors, &
Waterhouse, 1994) and Profile of Mood States (POMS) (Fuentes,
Balaguer, Meliá, & García-Merita, 1995). After the questionnaires, four
performance tests (20 m sprint, Counter Movement Jump (CMJ),
parallel half squat and bench press throw) were performed. Thirty
minutes after the end of session, the participants completed a Rating of
the Perceived Exertion (RPE) using the 12-point Borg scale (0 to 10)
(Borg, 1990). This can be seen in the annex 4. Before testing,

EFFECTS OF THE MENSTRUAL CYCLE PHASES ON DIFFERENT STRENGTH MANIFESTATIONS
53
participants performed a standardized warm up (15 min including
aerobic exercise, general mobilization and ballistic exercises).
In these two sessions, the sample was divided into two groups
for a counterbalance. The first day of testing was at the time of MEN (n
= 3) for one group, and in LP (n = 2) for the other group.
The fourth day included an anthropometry and a maximal
oxygen uptake test. The experimental design of the study is shown in
figure 2.

CHAPTER 2: STUDY 1
54
Fig
ure
2. E
xper
imen
tal d
esi
gn f
or
Stu
dy
1.

EFFECTS OF THE MENSTRUAL CYCLE PHASES ON DIFFERENT STRENGTH MANIFESTATIONS
55
Menstrual cycle determination.
Participants were monitored during the three months prior to
the experiment. Menstrual cycle was recorded to be sure it was regular
and ovulation was established by the technique of counting days (Janse
de Jonge, 2003).The measure in MEN was made 24-48 hours after the
onset of menses. The measure in LP was made 18-20 days after the first
day of the cycle, and it was confirmed monitoring that the date of the
next menstruation was in the next 14 days at most (Janse de Jonge,
2003).
Menstrual pain questionnaire.
This questionnaire about perception of pain during
menstruation (annex 1) asked about the most common symptoms
throughout the menstrual cycle (Larroy et al., 2001). It included
information about different variables grouped into six dimensions: 1)
factors that may influence menstrual pain (number of children, years
since first menstruation); 2) characterization of menstrual pain
(intensity and location of pain, number of painful menses, time of onset
of pain); 3) request for professional help due to menstrual pain; 4)
symptoms associated with menstrual pain; 5) strategies used to relieve
pain (medication and rest); 6) other symptoms and disorders.
The questionnaire consists of 19 questions, nine with two-six
options to choose from, depending on the question (discrete variables).
Three of these questions are composed of several items (each item
corresponds to one symptom), and the participant had to underline all

CHAPTER 2: STUDY 1
56
of those symptoms that appeared. For their subsequent analysis, a 0
was used if the symptom was not present, and 1 if it was. In the
remaining six questions, the participant had to choose a single possible
option. Four of these questions had 2 options (yes or no); one had 4
options (which were transcribed to the database as 0, 1, 2 and 3); and
the last one had six options (which were transcribed to the database as
0, 1, 2, 3, 4 and 5).
From the other 10 questions which are about continuous
variables, the first three were age, number of pregnancies and number
of children. Another of the ten questions was answered using a 0-10
scale, four using a 0-12 scale and the remaining 2 were answered in time
(years) since this variable was presented. This questionnaire showed an
α-Crombach of 0.99.
Karolinska Sleep Diary (SKD).
This questionnaire (annex 2) consists of 7 questions about the
sleep quality of the previous night (Torbjörn et al., 1994). Each question
had 5 options. The final score was obtained as the average of the 7
questions. Cervelló et al. (2014) showed an α-Crombach that ranged
between 0.66-0.85.
Profile of Mood States (POMS).
The reduced version of 29 items has been used (Fuentes et al.,
1995). Each item was answered by scoring 0-4. Those 29 items were
grouped into 5 dimensions or profiles (stress, depression, anger, vigour
and fatigue). The score for each profile was obtained by adding the

EFFECTS OF THE MENSTRUAL CYCLE PHASES ON DIFFERENT STRENGTH MANIFESTATIONS
57
scores of all items corresponding to each profile. A t-score for each
dimension was calculated using a conversion table. Finally, the profile
obtained for the participant is represented (annex 3). This
questionnaire showed an α-Crombach of 0.93.
20 m sprint test.
Time during a twenty metre (20 m) straight line sprint was
measured by photocell gates placed 1 m above the ground level
(Globus, Ergo Timer. Italy). Also, the acceleration during the first five
metre (5 m) was recorded. Each sprint was initiated from a standing
position, 50 cm behind the photocell gate, which started a digital timer.
Each participant performed two maximal 20 m sprints with one minute
of passive recovery, and the fastest time in both 5 m and 20 m were
registered for the analysis.
Fernandez-Fernandez, Sanz-Rivas, & Moya, (2016) checked the
validity and reliability of this test, showing a Intraclass Correlation
Coefficient (ICC) value of 0.91 (0.89-0.93) and Moir, Button, Glaister, &
Stone, (2004) showed a Coefficient of Variation (CV) value of 1.9%.
CMJ test.
Height, peak force, Ratio of Force Development (RFD), peak
power and take off speed was measured. The participant was placed on
a piezoelectric force platform (Kistler, Winterthur, Switzerland), in
akimbo position, and instructed to vertically jump as high as possible,
after a knee flexion to leverage the stretch shortening cycle (SSC). It was
recorded during 8 seconds at 1000 Hz. Each participant performed two
CHAPTER 2: STUDY 1
58
CMJ with one minute of passive recovery. This test showed a ICC = 0.95
(0.93-0.97) (Fernandez-Fernandez et al., 2016) and a CV = 2.4 % (Moir
et al., 2004).
1-RM for Parallel Half Squat and Bench Press.
Maximal dynamic strength was assessed through an indirect
protocol to estimate 1-RM using an isoinertial dynamometer (T-Force
Dynamic Measurement System; Ergotech; Murcia, Spain) (González-
Badillo & Sánchez-Medina, 2010) and comparing the results using the
Brzycki´s formula (Brzycki, 1993). The participants carried out a warm
up set of 12 repetitions with 50 % and 20 % of their body weight in
parallel half squat and bench press throw respectively. Then, three to
four sets (the weight was increased in each set) were performed until
the participant could not perform more than 4-6 reps. Between sets,
passive recoveries of three to five min. were used to ensure complete
recovery.
Both exercises were performed in a Smith machine (Technogym;
Cesena FC, Italia), and to standardize the movement, in the bench press
throw an anthropometric box (45x35x15 cm) was placed in front of the
bench so the participant could support his feet (to prevent lumbar
hyperlordosis). To confirm elbow flexion and shoulder abduction of 90
degrees, an elastic band was situated under the bench, and the
participant was instructed to touch it in each rep with his elbows. The
movement began with the participant holding a barbell with a total
extension of his elbows, and the barbell descended until the participant
touched the elastic band with the elbows. In the parallel half-squat, the

EFFECTS OF THE MENSTRUAL CYCLE PHASES ON DIFFERENT STRENGTH MANIFESTATIONS
59
participant was standing with the barbell placed on her shoulders. An
elastic band was placed behind the participant so she could touch it
with her gluteus during the eccentric phase to ensure a 90-degree knee
flexion in each rep.
Maximal Power output test.
Four different 1-RM percentages (30%, 40%, 50% and 60% for
supine bench press throw; 40%, 50%, 60% and 70% for parallel half
squat) were measured in the concentric portion actions of both
exercises using an isoinertial dynamometer (T-Force Dynamic
Measurement System; Ergotech; Murcia, Spain). The supine bench
press was performed by throwing the bar, and the half-squat was made
lifting the heel off the ground (on tip toe). Jumping was not allowed
because a high risk of knee injury after the jump cushion with high loads
was observed in the familiarization session.
One set of three repetitions was performed with each
percentage with a two a minute rest to find the peak-power in each
percentage. Instantaneous mechanical power output (P) was calculated
as the product of vertical force and barbell velocity (P = F · V). Peak-
power was taken as the maximum value of the power-time curve
(González-Badillo & Sánchez-Medina, 2010).
Maintenance of the optimal velocity test.
Once identified the percentage at which the highest peak-power
was obtained (%RM-OP), this load (Kg-OP) was used to perform a set of
as many repetitions as possible (Repts-OP) until peak velocity values
CHAPTER 2: STUDY 1
60
declined more than 10% for two consecutive repetitions (Fry, 2004).
The participants had a visual feed-back system on the laptop screen,
provided by the isoinertial dynamometer software (T-Force Dynamic
Measurement System; Ergotech; Murcia, Spain), for the velocity
achieved in each repetition, in which the green colour meant a correct
repetition and the red colour a wrong repetition.
Maximal oxygen uptake (VO2max) test.
VO2max was determined during an incremental treadmill
running test on a motorized treadmill (Technogym, Run Med). After a
three-minute warm-up at 6 km·h-1 and a 1% gradient, the treadmill
speed was set at 8 km·h-1 and increased by 1.5 km·h-1 every two minutes
while the gradient remained constant, until exhaustion. Gas exchange
was continuously measured during the test using a breath-by-breath
analyzer (Oxycom, MasterScreenCPX, Jaeger, Germany). The gas-
analysis system was calibrated before each test using the
manufacturer’s recommendations. During the incremental test, the
breath-by-breath gas samples were averaged every 15 s and heart rate
(HR) was monitored (Oxycom, MasterScreenECG, Jaeger, Germany). To
ensure the test was maximal, a plateau in VO2 (Astorino et al., 2005)
and a RER greater than 1.1 (Howley, Bassett, & Welch, 1995) were
established in all tests.
Anthropometric test.
Body Max Index (BMI), % Fat Mass, weight and height was
determined. Anthropometry was performed by an ISAK 2 technician,
EFFECTS OF THE MENSTRUAL CYCLE PHASES ON DIFFERENT STRENGTH MANIFESTATIONS
61
taking data of 4 diameters (humerus, wrist, femur and ankle), 12
perimeters (relaxed arm, contracted arm, forearm, wrist, neck,
minimum abdominal, hip, 1cm-thigh, mid-thigh, calf, ankle and
mesoesternal) and 10 skinfolds (triceps, subscapular, biceps, pectoral,
axillary, supracrestal, supraspinal, abdominal, anterior thigh and mid-
calf).
2.2.3. Statistical Analysis
Data is presented as mean ± standard deviation (SD). A paired t-test
was used to find differences between sessions two and three in all
variables. Relationships between the performance variables and
continuous variables of the questionnaires were calculated using a
Pearson´s correlation coefficient (r). The strength of the correlation
coefficient was determined on the basis of the classifications outlined
by Cohen (1988) in which r = trivial (0.0), small (0.1), moderate (0.3),
strong (0.5), very strong (0.7), nearly perfect (0.9), and perfect (1.0). For
the discrete variables, an independent t-test was done between groups,
using the discrete variable to divide the group and looking for a
difference between the means. Statistical signification was set at
p<0.05.
2.3. Results.
Performance variables.
Significant differences were found between parallel half-squat
1-RM and its calculated %RM, being higher in the session with
CHAPTER 2: STUDY 1
62
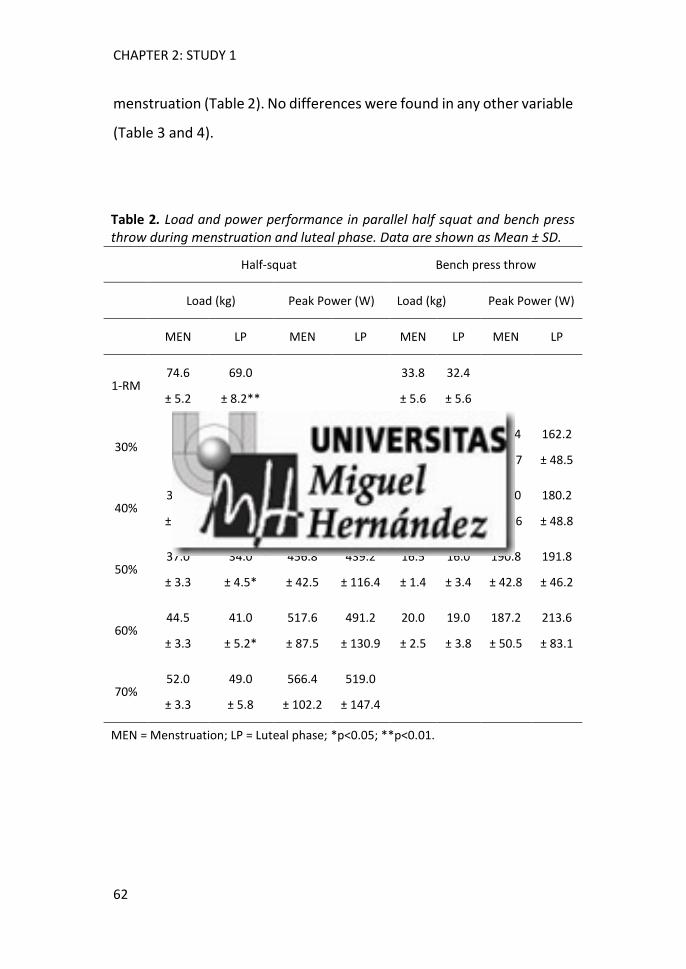
menstruation (Table 2). No differences were found in any other variable
(Table 3 and 4).
Table 2. Load and power performance in parallel half squat and bench press throw during menstruation and luteal phase. Data are shown as Mean ± SD.
Half-squat Bench press throw
Load (kg) Peak Power (W) Load (kg) Peak Power (W)
MEN LP MEN LP MEN LP MEN LP
1-RM 74.6
± 5.2
69.0
± 8.2**
33.8
± 5.6
32.4
± 5.6
30% 10.5
± 1.1
9.5
± 2.1
169.4
± 41.7
162.2
± 48.5
40% 30.7
± 2.4
27.5
± 2.5*
377.0
± 40.8
381.8
± 79.9
13.5
± 1.4
12.5
± 2.5
184.0
± 38.6
180.2
± 48.8
50% 37.0
± 3.3
34.0
± 4.5*
456.8
± 42.5
439.2
± 116.4
16.5
± 1.4
16.0
± 3.4
190.8
± 42.8
191.8
± 46.2
60% 44.5
± 3.3
41.0
± 5.2*
517.6
± 87.5
491.2
± 130.9
20.0
± 2.5
19.0
± 3.8
187.2
± 50.5
213.6
± 83.1
70% 52.0
± 3.3
49.0
± 5.8
566.4
± 102.2
519.0
± 147.4
MEN = Menstruation; LP = Luteal phase; *p<0.05; **p<0.01.

EFFECTS OF THE MENSTRUAL CYCLE PHASES ON DIFFERENT STRENGTH MANIFESTATIONS
63
Table 3. Maintenance of the optimal velocity in parallel half squat and bench press throw during menstruation and luteal phase. Data are shown as Mean ± SD.
Half-squat Bench press throw
MEN LP MEN LP
%RM-OP 69.73
± 0.61
68.78
± 5.09
53.58
± 5.74
53.20
± 4.30
Kg-OP 52.00
± 3.26
47.50
± 7.07
18.10
± 2.61
17.20
± 3.33
Repts-OP 7.40
± 1.67
6.40
± 2.19
2.60
± 0.89
5.00
± 2.45
MEN = Menstruation; LP = Luteal phase; %RM-OP = %RM of optimal velocity; Kg-OP = Kg of optimal load; Repts-OP = Repetitions within optimal velocity.
Table 4. 20 m sprint and CMJ performance during menstruation and luteal phase. Data are shown as Mean ± SD.
MEN LP
5 m (s) 1.360 ± 0.092 1.346 ± 0.078
20 m (s) 3.762 ± 0.223 3.722 ± 0.170
Height CMJ (m) 0.238 ± 0.049 0.245 ± 0.053
Peak force CMJ (BW) 2.262 ± 0.286 2.159 ± 0.307
RFDmax CMJ (BW/s) 23.737 ± 7.039 21.694 ± 4.604
Peak power CMJ (W/Kg) 40.463 ± 5.976 41.032 ± 7.212
Take-off speed CMJ (m/s) 2.150 ± 0.226 2.181 ± 0.238
MEN = Menstruation; LP = Luteal phase; CMJ = Counter-Movement Jump.
CHAPTER 2: STUDY 1
64
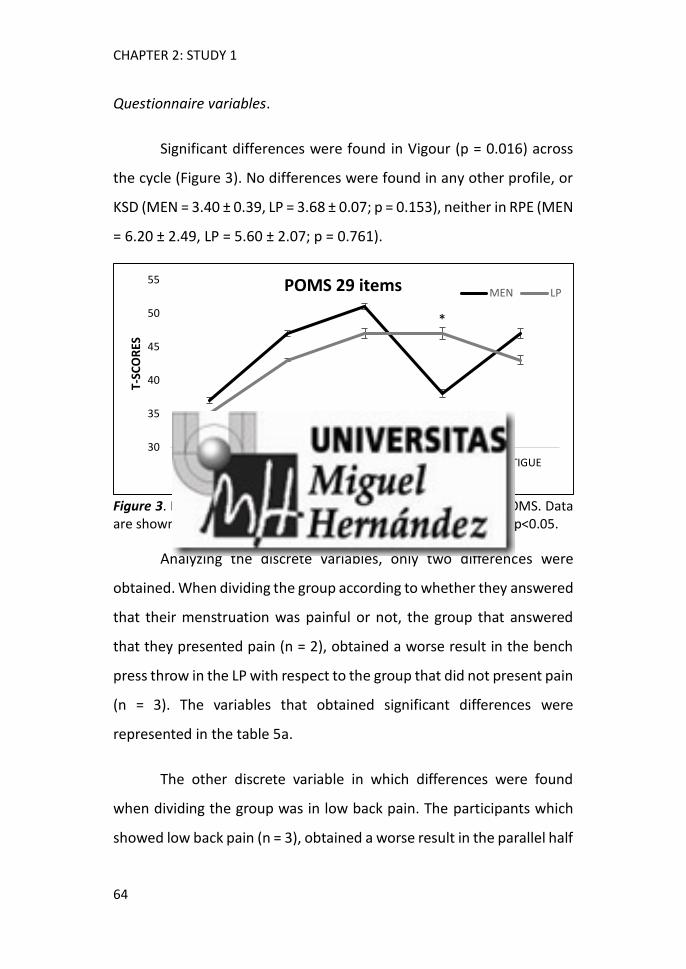
Questionnaire variables.
Significant differences were found in Vigour (p = 0.016) across
the cycle (Figure 3). No differences were found in any other profile, or
KSD (MEN = 3.40 ± 0.39, LP = 3.68 ± 0.07; p = 0.153), neither in RPE (MEN
= 6.20 ± 2.49, LP = 5.60 ± 2.07; p = 0.761).
Figure 3. Differences between menstruation and luteal phase in POMS. Data are shown as mean ± SD. MEN = Menstruation; LP = Luteal Phase; *p<0.05.
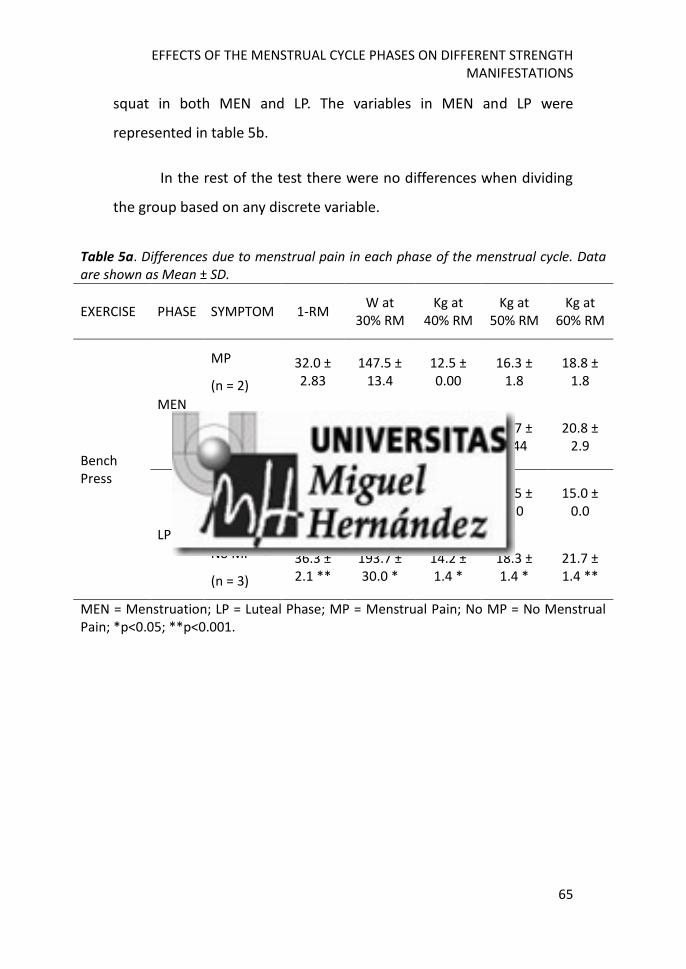
Analyzing the discrete variables, only two differences were
obtained. When dividing the group according to whether they answered
that their menstruation was painful or not, the group that answered
that they presented pain (n = 2), obtained a worse result in the bench
press throw in the LP with respect to the group that did not present pain
(n = 3). The variables that obtained significant differences were
represented in the table 5a.
The other discrete variable in which differences were found
when dividing the group was in low back pain. The participants which
showed low back pain (n = 3), obtained a worse result in the parallel half
30
35
40
45
50
55
STRESS DEPRESSION ANGER VIGOUR FATIGUE
T-SC
OR
ES
PROFILES
POMS 29 items MEN LP
*
EFFECTS OF THE MENSTRUAL CYCLE PHASES ON DIFFERENT STRENGTH MANIFESTATIONS
65
squat in both MEN and LP. The variables in MEN and LP were
represented in table 5b.
In the rest of the test there were no differences when dividing
the group based on any discrete variable.
Table 5a. Differences due to menstrual pain in each phase of the menstrual cycle. Data are shown as Mean ± SD.
EXERCISE PHASE SYMPTOM 1-RM W at
30% RM Kg at
40% RM Kg at
50% RM Kg at
60% RM
Bench Press
MEN
MP
(n = 2)
32.0 ± 2.83
147.5 ± 13.4
12.5 ± 0.00
16.3 ± 1.8
18.8 ± 1.8
No MP
(n = 3)
35.0 ± 3.46
184.0 ± 50.9
14.2 ± 1.4
16.7 ± 1.44
20.8 ± 2.9
LP
MP
(n = 2)
26.5 ± 0.7
115.0 ± 14.1
10.0 ± 0.0
12.5 ± 0.0
15.0 ± 0.0
No MP
(n = 3)
36.3 ± 2.1 **
193.7 ± 30.0 *
14.2 ± 1.4 *
18.3 ± 1.4 *
21.7 ± 1.4 **
MEN = Menstruation; LP = Luteal Phase; MP = Menstrual Pain; No MP = No Menstrual Pain; *p<0.05; **p<0.001.

CHAPTER 2: STUDY 1
66
Tab
le 5
b. D
iffe
ren
ces
du
e to
low
ba
ck p
ain
in e
ach
ph
ase
of
the
men
stru
al c
ycle
. Da
ta a
re s
ho
wn
as
Mea
n ±
SD
.
EXER
CIS
E P
HA
SE
SYM
PTO
M
1-R
M
W a
t 4
0% R
M
Kg
at
40%
R
M
W a
t 5
0% R
M
Kg
at
50
%
RM
Kg
at
60%
R
M
Kg
at
70%
R
M
Kg-
OP
Par
alel
l
Hal
f-Sq
uat
MEN
LBP
7
1.3
±
3.8
3
48
.3 ±
1
3.5
2
9.2
±
1.4
4
27
.0 ±
1
3.0
3
5.0
±
2.5
4
2.5
±
2.5
5
0.0
±
2.5
5
0.0
±
2.5
No
LB
P
79
.5 ±
0
.71
4
20.0
±
11
.3 *
* 3
3.0
±
0.7
*
501
.5 ±
1
4.9
**
40
.0 ±
0
.0
47
.5 ±
0
.0
55
.0 ±
0
.0
55
.0 ±
0
.0
LP
LBP
6
3.3
±
3.5
3
58.0
±
33
.5
25
.8 ±
1
.4
365
.0 ±
5
8.9
3
0.8
±
1.4
3
7.5
±
2.5
4
5.0
±
2.5
4
2.5
±
2.5
No
LB
P
77
.5 ±
0
.7 *
4
17.5
±
137
.9
30
.0 ±
0
.0 *
5
50.5
±
77
.1
38
.8 ±
1
.7 *
4
6.3
±
1.4
*
55
.0 ±
0
.0 *
5
5.0
±
0.0
**
MEN
= M
enst
ruat
ion
; LP
= L
ute
al P
has
e; L
BP
= L
ow
Bac
k P
ain
; No
LB
P =
No
Lo
w B
ack
Pai
n; *
p<0
.05;
**p
<0.0
01
.
EFFECTS OF THE MENSTRUAL CYCLE PHASES ON DIFFERENT STRENGTH MANIFESTATIONS
67
Regarding continuous variables, no correlations were found
with the bench press, nor in the 20 m sprint test. In parallel half squat,
Vigour in MEN was correlated with W at 60% RM in MEN (.892*); and
Vigour in LP was correlated with: 1-RM in LP (.899*), Kg at 50% RM in
LP (.944*), W at 50% RM in LP (.962**), Kg at 60% RM in LP (.934*), W
at 60% RM in LP (.956*) and W at 70% RM in LP (.919*). In CMJ,
correlations were found in vigour in LP with: height in LP (.913*), take-
off speed in LP (.899*), peak force in LP (.957*), and RFD in LP (.916*).
2.4. Discussion and Conclusion.
The main objective of this study was to analyze power and
strength throughout menstrual cycle. It is important to know if there
are variations during the menstrual cycle in those variables we use to
define training loads and competition calendar. 1-RM is essential to
establish percentages that determine manifestation of strength, and
therefore if 1-RM varies, relative loads must be adjusted. In our study,
according to our hypothesis we found an increase of 1-RM in parallel
half-squat in the MEN, and therefore in all percentages. 1-RM in bench
press was also higher during the MEN, but not significant, showing a
trend that can mobilize more kg during this phase. In the same line as
our results, different studies found better responses at the time of
menstruation (Davies et al., 1991; Markofski & Braun, 2014; Redman &
Weatherby, 2004).
However, different authors found that the MVC increases
during FP, right in the moments before ovulation, coinciding with high
levels of estradiol (Phillips et al., 1996; Sarwar et al., 1996) and several

CHAPTER 2: STUDY 1
68
authors have shown that estrogens had a positive effect on muscle
contractile function in rats (Enns et al., 2008; Enns & Tiidus, 2008).
Regarding maximal power test, we found that the Pmax was
within the established ranges (Castillo et al., 2012). These ranges were
60-70% RM for the half squat, and 50-60% RM for the bench press. In
our study, the ‘optimal load’ was acutely evaluated to know if the phase
of the menstrual cycle may affect the percentage of 1-RM in which the
Pmax was achieved and the number of repetitions performed within the
range of maximum velocity execution. Despite finding differences in 1-
RM, power data in each %RM was unchanged. This was probably
because the change in the 1-RM was very small, so the difference in the
load was not so great as to produce a significant power increase, so this
test could be performed at any time of the menstrual cycle.
Jump and sprint showed no differences either. These data were
in accordance with literature. Several studies have not found
differences in power tests as the Wingate (Bushman et al., 2006) or
tests to determine maximum power in cycle ergometer (Giacomoni et
al., 2000); neither in tests to determine different performance variables
collected during sprints, such as fatigue index, anaerobic power, peak
power, average power, peak speed, average speed or time to
exhaustion (Isacco et al., 2012; Lynch & Nimmo, 1998; Miskec et al.,
1997; Tsampoukos et al., 2010) nor variables as height, distance or
maximal jump power in multi-jump or jumping tests (Fridén,
Hirschberg, & Saartok, 2003; Giacomoni et al., 2000).

EFFECTS OF THE MENSTRUAL CYCLE PHASES ON DIFFERENT STRENGTH MANIFESTATIONS
69
In line with other studies (Miskec et al., 1997; Stephenson,
Kolka, & Wilkerson, 1982), RPE remained unchanged between sessions
of the different phases of the menstrual cycle. There were no changes
in KSD neither. The vigour (one of five dimensions of POMS) changed
between phases, decreasing during the menses. In a review, Lebrun
(1993) reported that many of the women studied associated
premenstrual and menstrual symptoms with a loss in performance. In
our study, the menstrual pain questionnaire asked the participants to
rate on a scale of 0 to 10 which was her pain in the last menstruation,
with a score of 4.5 ± 2.35 (coinciding with menstruation in which the
data were collected), and they reported that during the 12 periods of
the year, 4.17 ± 1.94 were painful. Probably the loss of vigour was due
to their feelings of discomfort, although curiously it occurred when 1-
RM was higher. It was possible that the participant's perception of pain
does not interfere with strength development, and the decrease in
concentration of hormones in the bleeding phase may lead to increased
performance.
Taking into account the discomfort or pain associated with
menstruation, in our study different correlations were found between
malaise variables and test results. In this line, Giacomoni et al. (2000)
suggested that the presence of pre-menstrual syndrome (PMS) and
menstrual symptoms could have a negative effect on performance, and
Möller-Nielsen and Hammar (1989) showed that women playing soccer
with PMS had an increased risk of injury. In addition, different authors
(Constantini et al., 2005; Möller-Nielsen & Hammar, 1989) suggested
that the use of oral contraceptives may exert a beneficial effect on

CHAPTER 2: STUDY 1
70
performance, since these reduce PMS and dysmenorrhea. Agreeing
with this, some questionnaire variables (such as painful menstruation
or low back pain) showed a negative correlation in the bench press and
in the parallel half squat respectively. Painful menstruation causes a
drop in performance in the bench press throw during LP. During MEN,
the results of the group with pain were also worse, although not
significant. It was observed that there was a difference between these
two groups, showing better results in the group that did not have pain.
But the most important thing was that when comparing the means of
both groups (pain and not pain) with their results in MEN, it was
observed that the group that did not have pain, presented a very similar
RM in both MEN and LP phase respectively (35.0 ± 3.46 VS 36.3 ± 2.08),
while the pain group decreased from 32.0 ± 2.83 kg to 26.5 ± 0.70 kg.
This difference was not significant, although it was probably due to the
fact that the sample was very small, but it could be said that the group
that had pain presented a decrease in performance, while the group
that did not present pain had stable results during the menstrual cycle
in bench press.
In addition, it was found that low back pain affected
performance in the parallel half squat, both in MEN and LP. One of the
main symptoms associated with dysmenorrhea is low back pain (Al-
Jefout et al., 2015; Constantini et al., 2005). The same trend as in the
bench press was found in this exercise it. The group that had low back
pain had worse results in MEN and LP, but also presented a decrease in
1-RM from 71.33 ± 3.75 to 63.33 ± 3.51, while the group that did not
have pain had a similar value in 1-RM (79.5 ± 0.71 VS 77.50 ± 0.71). It
EFFECTS OF THE MENSTRUAL CYCLE PHASES ON DIFFERENT STRENGTH MANIFESTATIONS
71
was observed that there was a fall in performance in the squat and in
the bench press when the group was analyzed as a whole, but when the
group was separated according to different painful variables, this
decrement was only observed in the pain group, so this tendency of
decrement in 1-RM in LP in both exercise, could be explained by greater
sensations of discomfort during this phase. In addition, vigour in LP
(which increased with respect to values in MEN) correlates with 1-RM,
Kg and watts in parallel half squat in LP. Even so, probably the negative
effects of the discomforts discussed above contributed more to the
decline in performance than the increase in vigour.
These data should be treated with caution because there were
two major limitations in our study. The sample was very small and there
were no hormonal data to confirm the cycle phases. Maybe the
differences found in the 1-RM were due to the intra-participant
variation or the feelings of discomfort commented, and not caused by
a difference in the concentration of hormones, since differences were
not found in any other test.
In conclusion, 1-RM varies through the menstrual cycle, but
there were no differences in power and velocity related variables. In
addition, our results support the idea that menstrual symptoms may
determine the subjective perception of the performance in women, and
in some cases these symptoms might adversely affect athletic
performance, or conversely, they feel discomfort but this discomfort
does not really affect their results.
CHAPTER 2: STUDY 1
72
For future research, it would be necessary to include
measurements at more times of the menstrual cycle and to corroborate
the phase of the menstrual cycle by hormonal data.

Chapter 3. Study 2 Could the menstrual hormones affect strength and velocity?

3.1. Introduction
During the menstrual cycle in eumenorrheic women, there is a
hormonal fluctuation. Progesterone (P4) and Estradiol (E2) are the most
important of these hormones, and their fluctuation determine two
phases: Follicular Phase (FP) which begins with menstruation (MEN),
and Luteal Phase (LP), both being separated by the time of ovulation
(OV) (Constantini et al., 2005; Isacco et al., 2012; Oosthuyse & Bosch,
2010).
Different studies have analysed the biological effects of these
hormones, showing that estrogen can influence the cardiovascular
system and substrate metabolism. Progesterone seems to affect
thermoregulation, ventilation and energy substrate. (Constantini et al.,
2005). Related with exercise, the menstrual cycle could affect the
maximum oxygen uptake (VO2max) since E2 and P4 cause effects in the
availability of fuel, oxygen transport system and ventilation (Janse de
Jonge, 2003), and therefore it produces a better performance in
endurance exercise during LP (Lebrun, 1993).
The effect of these hormones in different manifestations of
resistance training has also been studied. Some steroid hormones such
as testosterone, promote size, maintenance of muscle mass and exert
beneficial effects on metabolic function of skeletal muscles. In addition,
estrogens have a positive effect on muscle contractile function (Carson
& Manolagas, 2015), and affect the release of growth hormone (GH)
(Kraemer et al., 2012). Several authors (Gleeson & Shalet, 2005; Juul et
al., 1997) have shown a positive correlation between GH and E (just

CHAPTER 3: STUDY 2
76
prior to ovulation, and during the LP). That means estrogen could be an
anabolic influence for the muscle, while progesterone may have a
catabolic effect (Reis et al., 1995). Therefore, an increased performance
during the days prior to ovulation could be expected, due to high levels
of estradiol. In fact, maximum voluntary contraction (MVC) seemed to
be affected by hormonal cycle, increasing during FP (Phillips et al., 1996;
Sarwar et al., 1996). However, a recent study showed that muscle
hypertrophy was not strongly affected by hormonal variations that
occurred during the cycle (Sakamaki-Sunaga et al., 2016), so the effect
of menstrual cycle on strength is unclear.
In relation to other types of strength manifestations and their
relation to the menstrual cycle, there are some studies that have
focused on the analysis of power (Giacomoni et al., 2000; Wikström-
Frisén et al., 2015), although none of them focused on the analysis of
mechanical velocity maintenance and whether the phases of the
menstrual cycle could affect it. In most sports, performance is strongly
marked by the athlete's ability to perform movements in the shortest
possible time (Baker et al., 2001a; Sleivert & Taingahue, 2004;
Tonnessen, Shalfawi, Haugen, & Enoksen, 2011), hence power output is
a key element for training, and therefore new research trends arise
focusing on this term. Velocity-based resistance training (VBRT) is a new
training trend based on the ‘optimal load’, that is, the load with which
the participant is able to generate the Pmax, with an optimal number of
repetitions in each set so that velocity does not decline more than 5-
10%, and with a recovery that could maximize the training result, so that
optimal volume, intensity and density were controlled individually for

EFFECTS OF THE MENSTRUAL CYCLE PHASES ON DIFFERENT STRENGTH MANIFESTATIONS
77
each participant (Cormie, McGuigan, & Newton, 2011; Kawamori &
Haff, 2004). However, we did not find studies focusing on this method
of training and if it would be necessary to adjust it according to the
hormonal load of the menstrual cycle phases. Our research group
conducted a pilot study on this area (Study 1) analyzing only the
bleeding phase and the luteal phase in different tests that have to be
executed at maximum speed, but no differences were found.
In our previous study the phases were not detected by hormonal
analysis. However, the best way to corroborate the phases of the cycle
is through hormonal analysis (Janse de Jonge, 2003), and therefore to
be able to know exactly if there was a relationship between the
performance obtained in the test and the phase in which the
participants were performing them. Therefore, it is necessary to
measure performance at MEN, FP and LP, and to analyze the moments
in which both hormones E2 and P4 are low, E2 is higher than P4, and
finally the phase in which both are high.
Due to the action of estradiol on muscle contraction previously
mentioned, we think that better results will be found in moments in
which this hormone is high (FP). Therefore, the purpose of our study
was to analyze the acute action of the three most important phases of
the menstrual cycle in different performance tests that include actions
at maximum speed, assuring that the phases are well established
through hormonal values.
CHAPTER 3: STUDY 2
78
3.2. Methods.
3.2.1. Participants
Eighteen women, all physically active and involved in collective
sports, took part in this study. All trained 3 days per week, with a two-
hour length per training session. At the weekend, they carried out the
competition or an extra training.
For the inclusion, it was required that they did not suffer from
injury, they showed no hormonal irregularities, they had a regular
menstrual cycle, they were non-smokers and they had not used oral
contraceptives (OCP) during the last six months. It was indicated that
they continued their usual diet and did not take caffeine on the day of
the tests or on the day before. The descriptive data of the sample are
shown in table 6.
Written informed consent was obtained from the participants
before the investigation. The present study was approved by the
institutional research ethics committee of the University, and
conformed to the recommendations of the Declaration of Helsinki.
Table 6. Participants descriptive data. Data are shown as Mean ± SD.
n Age
(y)
Body mass (kg)
Height
(m) B.M.I.
Fat mass
(%)
Vo2máx (ml/kg/min)
Menstrual cycle (days)
Total
(n = 18)
22.78 ± 3.80
60.99 ± 8.97
1.64 ± 0.09
22.57 ± 1.33
17.95 ± 3.53
49.07 ± 5.74
29.14 ± 3.12

EFFECTS OF THE MENSTRUAL CYCLE PHASES ON DIFFERENT STRENGTH MANIFESTATIONS
79
3.2.2. Procedures
Each participant performed five laboratory sessions. The first
day, there was a questionnaire in which the participant had to answer
about her menstrual history (menstrual pain questionnaire), a general
anamnesis and the familiarization session, in which the participants
performed all the tests (the same test that they would do in session two,
three and four) in order to learn the protocol.
In the second, third and fourth sessions, two questionnaires
were made: Karolinska Sleep Diary (KSD) and Profile of Mood States
(POMS). After this, four performance tests (20 m sprint, Counter
Movement Jump (CMJ), parallel half squat and bench press throw) were
performed. Thirty minutes after the end of the session, the participants
answered a Rating of the Perceived Exertion (RPE), using the 0-10 Borg-
scale (Borg, 1990). This can be seen in the annex 4. Before the tests,
participants performed a standard warm-up (15 min including aerobic
exercise, general mobilization and ballistic exercises).
In these three sessions, the sample was counterbalanced into 3
groups. The first day of measurement was at a different time for each
group: group MEN (gMEN, n = 6) started during menstruation. Group FP
(gFP, n = 6) and group LP (gLP, n = 6) started during the follicular phase
and the luteal phase respectively. In order to control that the effects of
their usual training did not interfere with our results, the study was
performed at a time of the season in which they did not have to improve
the maximum strength, and their strength training was limited to train
the specific and preventive strength. In their training sessions, twenty
CHAPTER 3: STUDY 2
80
minutes were used for general warm-up, thirty minutes in preventive
training and specific strength, and one hour of strategic and tactical
skills that included general fitness. The remaining ten minutes were
used for the final stretching. Counterbalance also blocked the training
interference.
The fifth day included an anthropometry and a maximal oxygen
uptake. The experimental design is shown in figure 4.
Determination of the menstrual cycle.
Participants were monitored for three months before starting
the first measurement to ensure they had a regular menstrual cycle. To
confirm the phases, saliva samples were collected in order to establish
the concentration of progesterone in each phase, and it was analyzed
using an ELISA kit (Salivary Progesterone ELISA kit from Salimetrics
Assay (1-1502)). In addition, 3 days before ovulation was predicted
(according to data from previous cycles), the participants began to use
a luteinizing hormone (LH) KIT in urine every day, until the time of
ovulation was identified. The reagent sensibility was 20 mIU/ml.
Measurement in MEN was made within 1-4 days after the onset of
menses; the FP was made between 10-12 days after the first day of the
cycle (depending on whether the cycle was more or less long); and LP
was done 7-9 days after the ovulation. Descriptive data about the times
of the measurement in each phase and progesterone in each of them
are shown in Table 7.
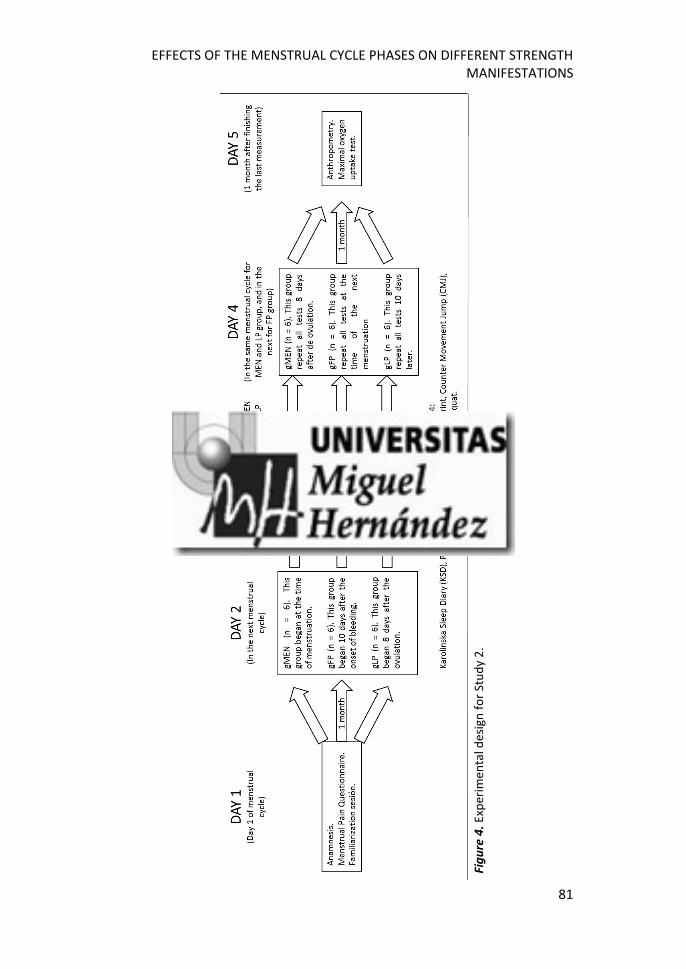
EFFECTS OF THE MENSTRUAL CYCLE PHASES ON DIFFERENT STRENGTH MANIFESTATIONS
81
Fig
ure
4. E
xper
imen
tal d
esi
gn f
or
Stu
dy
2.

CHAPTER 3: STUDY 2
82
Table 7. Menstrual cycle descriptive data. Data are shown as means ± SD.
n = 18 MEN FP OV LP
Time (days) 2.78 ±
1.26
11.33 ±
1.19
16.44 ± 3.36
24.89 ± 3.51
Progesterone (pg/ml)
92.81 ±
60.43*#
73.91 ±
46.52 ⱡ -
174.05 ± 115.72
Time was shown as days after bleeding appears. MEN = Menstruation; FP = Follicular Phase; OV = Ovulation; LP = Luteal Phase; * Significant difference between MEN and FP. # Significant difference between MEN and LP. ⱡ Significant difference between FP and LP.
Menstrual pain questionnaire (Larroy et al., 2001).
This questionnaire provides information of different feelings of
discomfort caused by menstruation (annex 1). It includes variables that
were grouped in 6 dimensions: 1. factors that may influence menstrual
pain (number of children, years since first menstruation); 2.
characterization of menstrual pain (intensity and location of pain,
number of painful menses, time of onset of pain); 3. request for
professional help due to menstrual pain; 4. symptoms associated with
menstrual pain; 5. strategies used to relieve pain (medication and rest);
6. other symptoms and disorders.
The questionnaire consists of 19 questions. Nine were discrete
variables with 2-6 options to choose from, depending on the question.
Three of these questions are composed of several options (each option
corresponds to one symptom), and the participant had to underline all
of those symptoms that were presented. For their subsequent analysis,
a 0 was used if the symptom was not present, and 1 if it was. In the
EFFECTS OF THE MENSTRUAL CYCLE PHASES ON DIFFERENT STRENGTH MANIFESTATIONS
83
remaining six questions, the participant had to choose a single possible
option. Four of these questions had 2 options (yes or no); one had 4
options (which were transcribed to the database as 0, 1, 2 and 3); and
the last one had six options (which were transcribed to the database as
0, 1, 2, 3, 4 and 5).
From the other 10 questions which are about continuous
variables, the first three were age, number of pregnancies and number
of children. Another of the ten questions was answered using a 0-10
scale, four using a 0-12 scale and the remaining 2 were answered in time
(years) since this variable was presented. This questionnaire showed an
α-Crombach of 0.99.
Karolinska Sleep Diary (KSD) (Torbjörn et al., 1994).
This questionnaire consists of 7 questions about the quality of
sleep the previous night. Each option had 5 answers, and the final score
was obtained by averaging the 7 questions (annex 2). Cervelló et al,
(2014) showed an α-Crombach that oscillated between 0.66-0.85.
Profile of Mood States (POMS) (Fuentes et al., 1995).
The reduced version of 29 items was used. All items were
grouped into five profiles (stress, depression, anger, vigour and fatigue).
The score for each profile was obtained by the addition of the scores of
each item that make up each profile, and then a t-score was calculated
using a conversion table. The abbreviated form of 29 items explains
92.9% of the total variance of the complete questionnaire (58 items),
reducing the number of items by half, making it easier for the
CHAPTER 3: STUDY 2
84
participants (annex 3). This questionnaire showed an α-Crombach of
0.93.
20 m sprint test.
Twenty meters (20 m) in straight line, and acceleration during
the first five meters (5 m) were measured by photocells (Globus, Ergo
Timer; Italy) placed on the ground. Each sprint was initiated with the
participant positioned 50 cm behind the photocell in the standing
position. Two maximal sprints were performed with one minute of
passive recovery, and the fastest time of both 5 m and 20 m were
collected. The validity and reliability of this test have been previously
established, with a Intraclass Correlation Coefficient (ICC) value of 0.91
(Fernandez-Fernandez et al., 2016) and a Coefficient of Variation (CV)
value of 1.9% (Moir et al., 2004).
CMJ test.
Height, peak force, RFD, peak power and take-off speed were
measured. The participant was placed on a piezoelectric forces platform
(Kistler, Winterthur, Switzerland) in akimbo position, and was
instructed to jump as high as possible after performing a knee flexion.
The jump was recorded for 8 seconds at 1000 Hz. Each participant
performed two CMJ with one minute of passive recovery. The best jump
data was collected. Moir et al (2004) showed a ICC = 0.93 and a CV = 2.4
% in this test.

EFFECTS OF THE MENSTRUAL CYCLE PHASES ON DIFFERENT STRENGTH MANIFESTATIONS
85
1-RM for Parallel Half Squat and Bench Press.
The maximum dynamic force was measured using an indirect
protocol to estimate 1-RM using an isoinertial dynamometer (T-Force
Dynamic Measurement System; Ergotech; Murcia, Spain). The
isoinertial dynamometer measures the velocity at which the bar was
being displaced. González-Badillo & Sánchez-Medina (2010) analyzed
the loads of 30-100% 1-RM with increments of 5%, showing that there
was a change between 0.07 and 0.09 m · s −1 in each relative load. That
is, when the participant increased the mean velocity of propulsive
phase (MVP) between 7 - 9 hundredths in a relative load, an
improvement of 5% in the value of the absolute load (1-RM) can be
estimated. According to this, 1-RM was estimated using the isoinertial
dynamometer, and then the result was compared with the Brzycki
formula (Brzycki, 1993).
The participants started the test with one warm-up series of
twelve repetitions with 50% and 20% of their body weight for the
parallel half squat and bench press respectively. Then, three to four sets
were carried out, increasing the weight mobilized in each series, until
the participant could not perform more than four to six repetitions. A
passive recovery of three to five minutes between sets was used.
Both exercises were performed on a Smith machine
(Technogym; Cesena FC, Italia). In the bench press, the movement was
standardized by placing an anthropometric box (45x35x15cm) in front
of the bench, so the participant could support his feet and avoid lumbar
hyperlordosis. In addition, an elastic band was placed under the bench,

CHAPTER 3: STUDY 2
86
and the participant was instructed to touch it with her elbows in each
repetition, ensuring a 90-degree of elbow flexion and shoulder
abduction. The movement began with the participant holding the
barbell with her elbows extended, and she lowered the barbell until she
touched the elastic band with her elbows. In the half squat, the
participant started standing with the barbell placed on her shoulders.
For this exercise, the elastic band was placed behind the participant in
order to touch it with her gluteus ensuring a 90-degree knee flexion.
The elastic band was placed individually for each participant depending
on her leg length.
Maximal Power output test.
Four percentages of the 1-RM (40%, 50%, 60% and 70% for
parallel half squat; and 30%, 40%, 50% and 60% for bench press throw)
were measured in the concentric phase of both exercises using an
isoinertial dynamometer in a Smith Machine. The bench press was
performed by throwing the barbell to achieve the highest possible
speed, and the parallel half squat was done lifting the heels of the floor
(until standing on tip toe). The parallel half squat was performed
without a jump since in the pilot study a great risk of knee injury after
cushioning the fall with high loads was observed.
One set of three repetitions was performed for each percentage
to find the peak-power (Baker et al., 2001a, 2001b). A two-minute
passive recovery between sets was made. Instantaneous mechanical
power output (P) was calculated as the product of vertical force and
barbell velocity (P = F · V). Peak-power was taken as the maximum value
EFFECTS OF THE MENSTRUAL CYCLE PHASES ON DIFFERENT STRENGTH MANIFESTATIONS
87
of the power-time curve. González-Badillo & Sánchez-Medina, (2010)
checked the validity and reliability of this system, showing ICC values
ranging from 0.81 to 0.91 and a CV < 3.6%.
Maintenance of the optimal velocity test.
Once the percentage in which a higher peak-power was found
(%RM-OP), a single set was performed with this load (Kg-OP) in order to
perform as many repetitions as possible (Repts-OP) until the velocity
dropped by 10% during two consecutive repetitions. The participants
had a visual feed-back system on the laptop screen, provided by the
isoinertial dynamometer software, for the power achieved in each
repetition, in which the green colour meant a correct repetition and the
red colour an incorrect repetition. Then, the repetition in which there
was a higher peak-power (Pmax) and peak-velocity (Vmax) was searched
for, and the average of the mean-power (MPP) and mean-velocity
(MPV) of the propulsive phase (in those repetitions that were within the
range of optimal speed) were calculated.
Maximal oxygen uptake (VO2max) test.
VO2max was determined during an incremental treadmill
running test on a motorized treadmill (Technogym, Run Med). After a
three-minute warm-up at 5 km·h-1 and 1% gradient, the treadmill speed
was set at 6 km·h-1 and increased by 1.5 km·h-1 every two minutes while
the gradient remained constant, until 15 km·h-1. From that point on, the
speed remained constant and the gradient was increased by 1.5
degrees every two minutes until exhaustion. Gas exchange was
CHAPTER 3: STUDY 2
88
continuously measured during the test using a breath-by-breath
analyzer (Oxycom, MasterScreenCPX, Jaeger, Germany). The gas-
analysis system was calibrated before each test using the
manufacturer’s recommendations. During the incremental test, the
breath-by-breath gas samples were averaged every 15 s and HR was
monitored (Oxycom, MasterScreenECG, Jaeger, Germany). To ensure
the test was maximal, a plateau in the VO2 (Astorino et al., 2005) and a
RER greater than 1.1 (Howley et al., 1995) were established in all tests.
Anthropometric test.
Body Max Index (BMI), % Fat Mass, weight and height were
determined. Anthropometry was performed by an ISAK 2 technician,
taking data of 4 diameters (humerus, wrist, femur and ankle), 12
perimeters (relaxed arm, contracted arm, forearm, wrist, neck,
minimum abdominal, hip, 1cm-thigh, mid-thigh, calf, ankle and
mesoesternal) and 10 skinfolds (triceps, subscapular, biceps, pectoral,
axillary, supracrestal, supraspinal, abdominal, anterior thigh, mid-calf).
3.2.3. Statistical Analysis
Data are presented as mean ± standard deviation (SD). Data
were analyzed to determine their practical significance using magnitude
bases inferences (MBI). This method contemplates a new trend of data
analysis based on the use of confidence intervals to calculate the
probability that a difference was significant. The threshold of inferences
was set at 0.35, which according to Rhea (2004), was the value assigned
for the analysis of strength data. Subsequently, the probability that any
change in performance was greater / similar / lower between menstrual

EFFECTS OF THE MENSTRUAL CYCLE PHASES ON DIFFERENT STRENGTH MANIFESTATIONS
89
cycle phases, and between groups divided according to discrete
variables of the questionnaires, was calculated with its 90% confidence
limits (CL). The qualitative probability was assigned by the following
quantitative chances: < 0.5%, most unlikely; 0.5% to 5%, very unlikely;
5% to 25%, unlikely; 25% to 75%, possibly; 75% to 95%, likely; 95% to
99.5%, very likely; and >99.5%, most likely. In addition, the clinical
inference was represented as unclear, trivial, beneficial or harmful
(Batterham & Hopkins, 2006). Beneficial or harmful are related with
change direction, and not necessarily with positive or negative effects.
Relationships between the performance variables and variables
of the questionnaires were calculated using a Pearson´s correlation
coefficient (r). The strength of the correlation coefficient was
determined on the basis of the classifications outlined by Cohen (1988)
in which r = trivial (0.0), small (0.1), moderate (0.3), strong (0.5), very
strong (0.7), nearly perfect (0.9), and perfect (1.0). Statistical
signification was set at p < 0.05.
3.3. Results.
Performance variables.
When the MBI was used analysing the whole group, only
differences in Vmax and MPV in the maintenance of the optimal velocity
test between the 3 moments of the menstrual cycle were found (Table
8).
However, when dividing the group according to the discrete
variables of the questionnaires, two major differences were found: the
CHAPTER 3: STUDY 2
90
group with low back pain (LBP; n = 7) presented worse results (Figure
5a, 5b and 5c) in almost all the variables of the parallel half squat, the
linear sprint and the CMJ regarding the group that did not have that
annoyance (No LBP; n = 11); and the group that showed breast pain (BP;
n = 6) had worse results (Figure 6a, 6b and 6c) in the bench press throw
variables, compared to the non-painful group (No BP; n = 12). Each
group showed no internal differences throughout the three
measurements of the menstrual cycle.
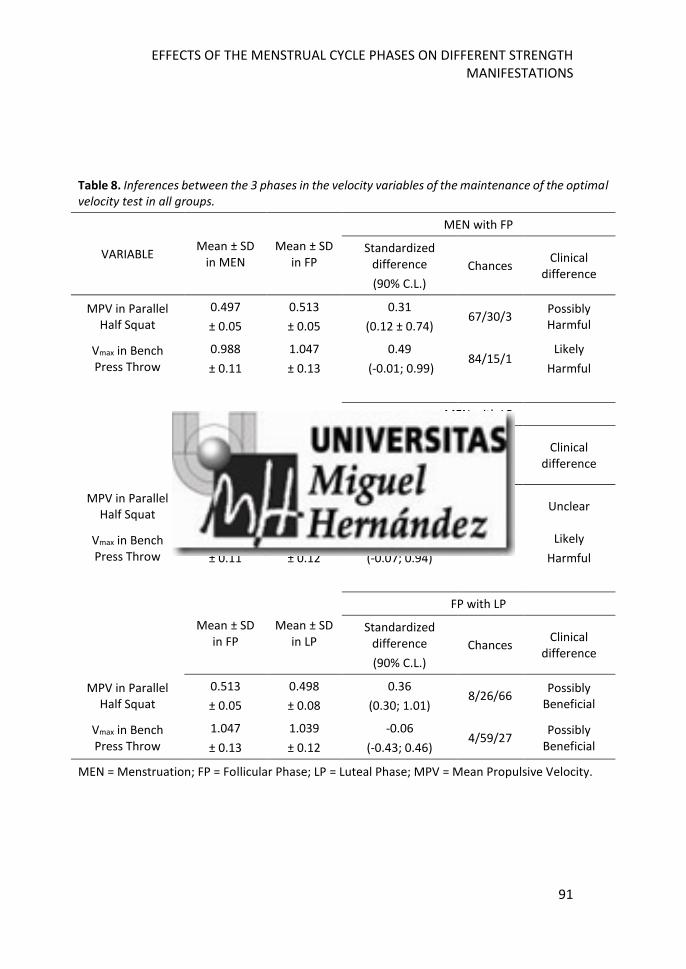
EFFECTS OF THE MENSTRUAL CYCLE PHASES ON DIFFERENT STRENGTH MANIFESTATIONS
91
Table 8. Inferences between the 3 phases in the velocity variables of the maintenance of the optimal velocity test in all groups.
VARIABLE Mean ± SD
in MEN Mean ± SD
in FP
MEN with FP
Standardized difference
(90% C.L.)
Chances Clinical
difference
MPV in Parallel Half Squat
0.497
± 0.05
0.513
± 0.05
0.31
(0.12 ± 0.74) 67/30/3
Possibly Harmful
Vmax in Bench Press Throw
0.988
± 0.11
1.047
± 0.13
0.49
(-0.01; 0.99) 84/15/1
Likely
Harmful
Mean ± SD
in MEN Mean ± SD
in LP
MEN with LP
Standardized difference
(90% C.L.)
Chances Clinical
difference
MPV in Parallel Half Squat
0.497
± 0.05
0.498
± 0.08
-0.03
(-0.72; 0.63) 27/39/35 Unclear
Vmax in Bench Press Throw
0.988
± 0.11
1.039
± 0.12
0.44
(-0.07; 0.94) 79/19/2
Likely
Harmful
Mean ± SD
in FP Mean ± SD
in LP
FP with LP
Standardized difference
(90% C.L.)
Chances Clinical
difference
MPV in Parallel Half Squat
0.513
± 0.05
0.498
± 0.08
0.36
(0.30; 1.01) 8/26/66
Possibly Beneficial
Vmax in Bench Press Throw
1.047
± 0.13
1.039
± 0.12
-0.06
(-0.43; 0.46) 4/59/27
Possibly Beneficial
MEN = Menstruation; FP = Follicular Phase; LP = Luteal Phase; MPV = Mean Propulsive Velocity.
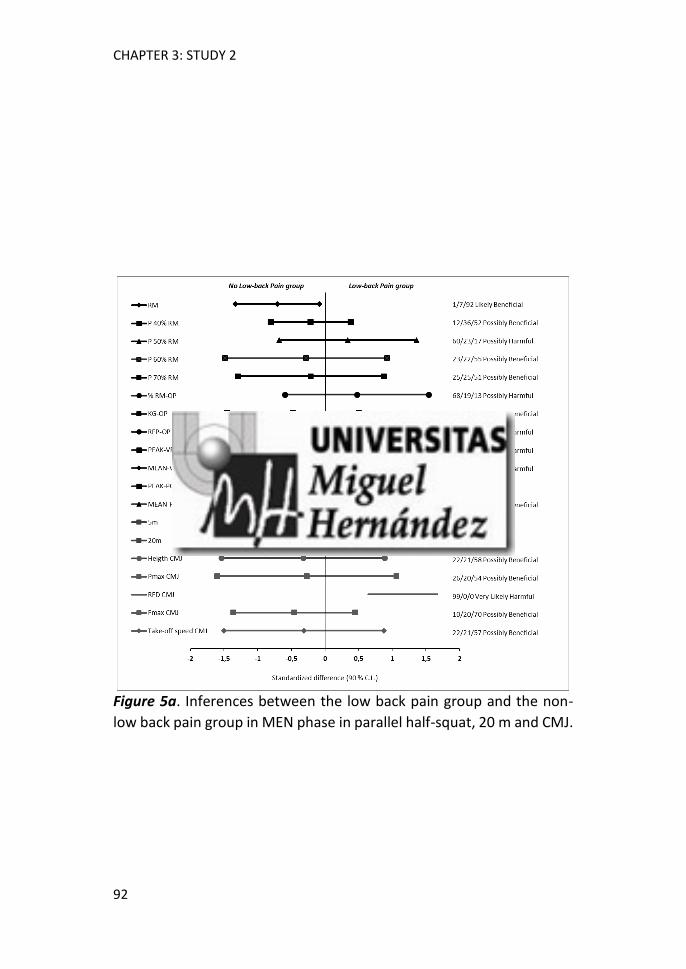
CHAPTER 3: STUDY 2
92
Figure 5a. Inferences between the low back pain group and the non-
low back pain group in MEN phase in parallel half-squat, 20 m and CMJ.
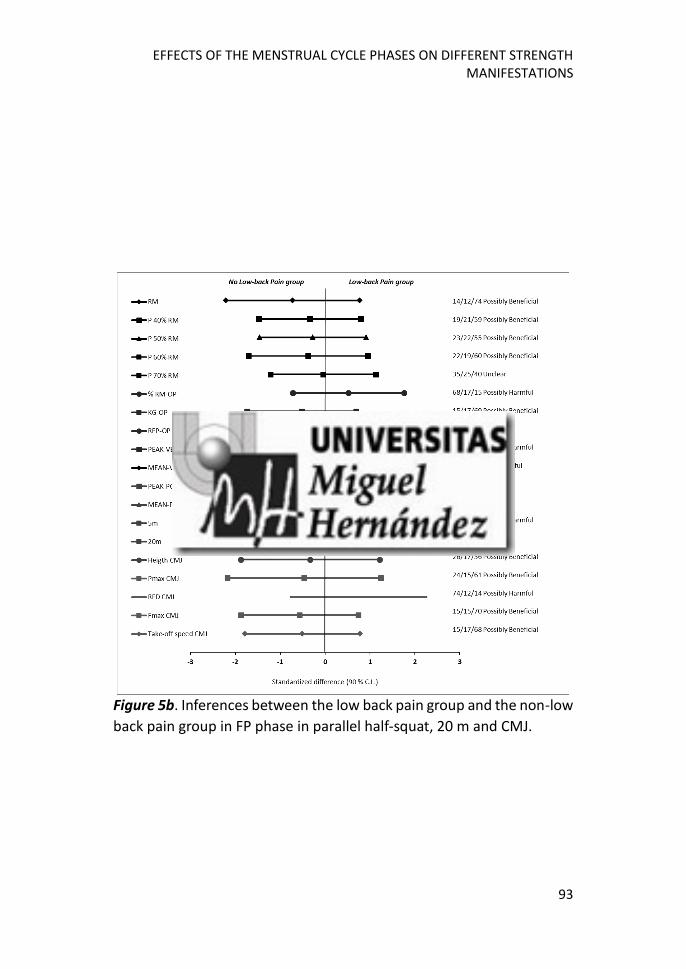
EFFECTS OF THE MENSTRUAL CYCLE PHASES ON DIFFERENT STRENGTH MANIFESTATIONS
93
Figure 5b. Inferences between the low back pain group and the non-low
back pain group in FP phase in parallel half-squat, 20 m and CMJ.
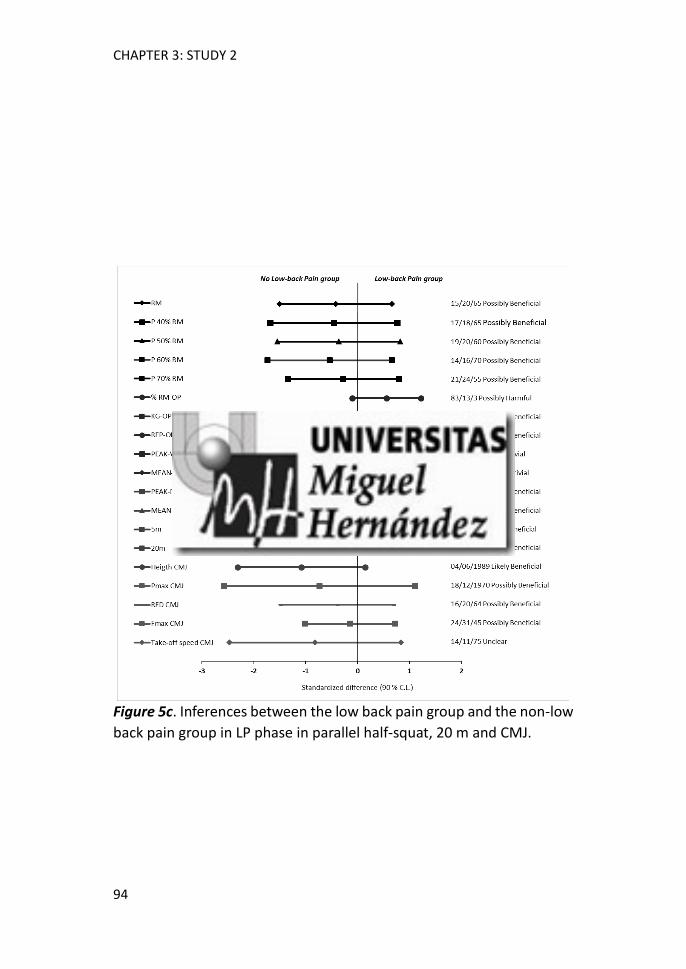
CHAPTER 3: STUDY 2
94
Figure 5c. Inferences between the low back pain group and the non-low
back pain group in LP phase in parallel half-squat, 20 m and CMJ.

EFFECTS OF THE MENSTRUAL CYCLE PHASES ON DIFFERENT STRENGTH MANIFESTATIONS
95
Figure 6a. Inferences between the breast pain group and the non-breast
pain group in MEN phase in bench press throw.
Figure 6b. Inferences between the breast pain group and the non-breast
pain group in FP phase in bench press throw.
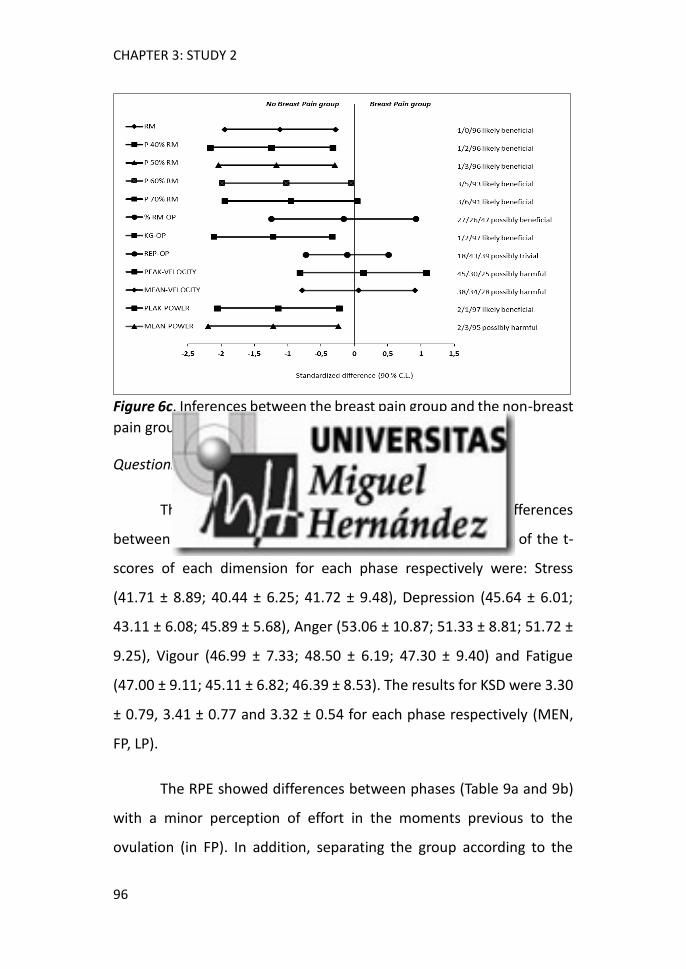
CHAPTER 3: STUDY 2
96
Figure 6c. Inferences between the breast pain group and the non-breast
pain group in LP phase in bench press throw.
Questionnaire variables.
The dimensions of POMS and KSD did not show differences
between the phases of the menstrual cycle. The means ± SD of the t-
scores of each dimension for each phase respectively were: Stress
(41.71 ± 8.89; 40.44 ± 6.25; 41.72 ± 9.48), Depression (45.64 ± 6.01;
43.11 ± 6.08; 45.89 ± 5.68), Anger (53.06 ± 10.87; 51.33 ± 8.81; 51.72 ±
9.25), Vigour (46.99 ± 7.33; 48.50 ± 6.19; 47.30 ± 9.40) and Fatigue
(47.00 ± 9.11; 45.11 ± 6.82; 46.39 ± 8.53). The results for KSD were 3.30
± 0.79, 3.41 ± 0.77 and 3.32 ± 0.54 for each phase respectively (MEN,
FP, LP).
The RPE showed differences between phases (Table 9a and 9b)
with a minor perception of effort in the moments previous to the
ovulation (in FP). In addition, separating the group according to the
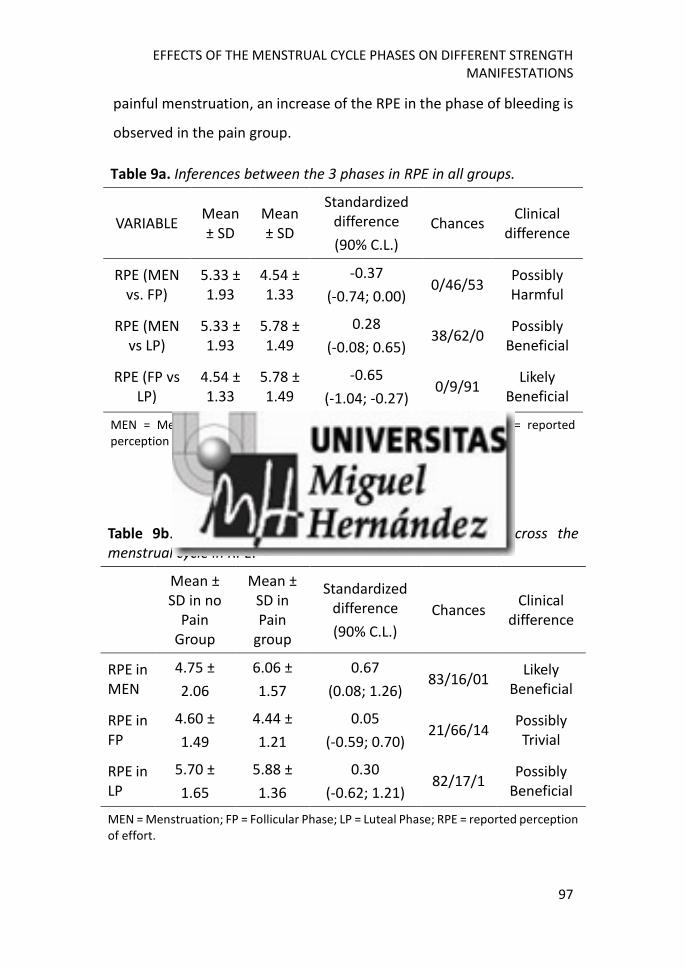
EFFECTS OF THE MENSTRUAL CYCLE PHASES ON DIFFERENT STRENGTH MANIFESTATIONS
97
painful menstruation, an increase of the RPE in the phase of bleeding is
observed in the pain group.
Table 9a. Inferences between the 3 phases in RPE in all groups.
VARIABLE Mean ± SD
Mean ± SD
Standardized difference
(90% C.L.)
Chances Clinical
difference
RPE (MEN vs. FP)
5.33 ± 1.93
4.54 ± 1.33
-0.37
(-0.74; 0.00) 0/46/53
Possibly Harmful
RPE (MEN vs LP)
5.33 ± 1.93
5.78 ± 1.49
0.28
(-0.08; 0.65) 38/62/0
Possibly Beneficial
RPE (FP vs LP)
4.54 ± 1.33
5.78 ± 1.49
-0.65
(-1.04; -0.27) 0/9/91
Likely Beneficial
MEN = Menstruation; FP = Follicular Phase; LP = Luteal Phase; RPE = reported perception of effort.
Table 9b. Inferences between pain and no pain group across the menstrual cycle in RPE.
Mean ± SD in no
Pain Group
Mean ± SD in Pain
group
Standardized difference
(90% C.L.)
Chances Clinical
difference
RPE in MEN
4.75 ±
2.06
6.06 ±
1.57
0.67
(0.08; 1.26) 83/16/01
Likely Beneficial
RPE in FP
4.60 ±
1.49
4.44 ±
1.21
0.05
(-0.59; 0.70) 21/66/14
Possibly Trivial
RPE in LP
5.70 ±
1.65
5.88 ±
1.36
0.30
(-0.62; 1.21) 82/17/1
Possibly Beneficial
MEN = Menstruation; FP = Follicular Phase; LP = Luteal Phase; RPE = reported perception of effort.
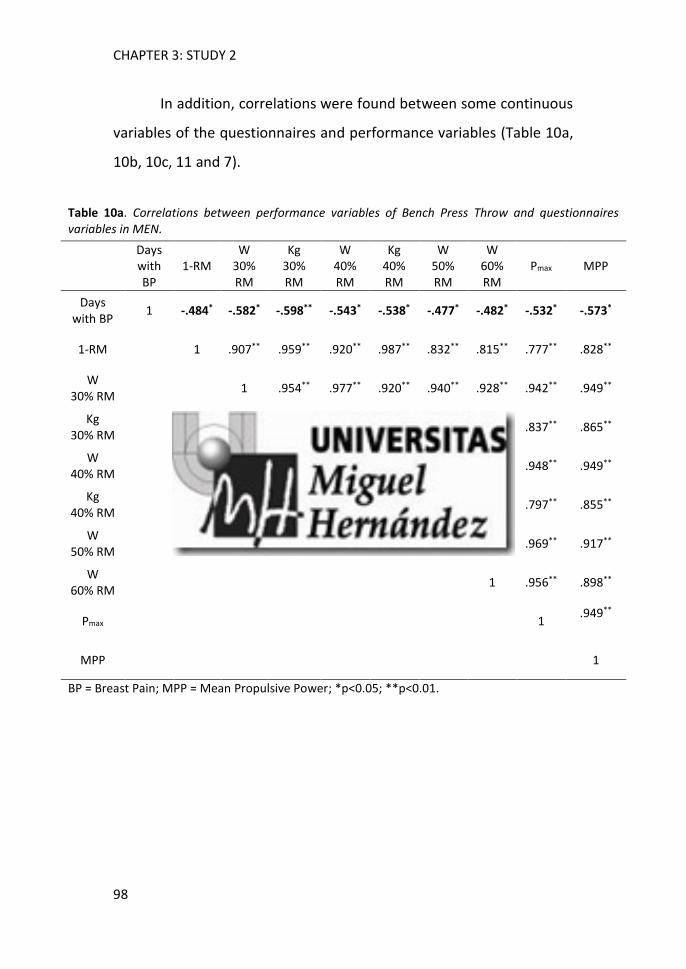
CHAPTER 3: STUDY 2
98
In addition, correlations were found between some continuous
variables of the questionnaires and performance variables (Table 10a,
10b, 10c, 11 and 7).
Table 10a. Correlations between performance variables of Bench Press Throw and questionnaires variables in MEN.
Days with BP
1-RM W
30% RM
Kg 30% RM
W 40% RM
Kg 40% RM
W 50% RM
W 60% RM
Pmax MPP
Days with BP
1 -.484* -.582* -.598** -.543* -.538* -.477* -.482* -.532* -.573*
1-RM 1 .907** .959** .920** .987** .832** .815** .777** .828**
W 30% RM
1 .954** .977** .920** .940** .928** .942** .949**
Kg 30% RM
1 .938** .958** .866** .846** .837** .865**
W 40% RM
1 .927** .970** .954** .948** .949**
Kg 40% RM
1 .833** .821** .797** .855**
W 50% RM
1 .982** .969** .917**
W 60% RM
1 .956** .898**
Pmax 1 .949**
MPP 1
BP = Breast Pain; MPP = Mean Propulsive Power; *p<0.05; **p<0.01.

EFFECTS OF THE MENSTRUAL CYCLE PHASES ON DIFFERENT STRENGTH MANIFESTATIONS
99
Table 10b. Correlations between performance variables of Bench Press Throw and questionnaires variables in FP.
A B C 1-RM W
30% RM
Kg 30% RM
W 40% RM
Kg 40% RM
W 50% RM
Kg 50% RM
W 60% RM
Kg 60% RM
% RM-OP
Kg-OP
Pmax MPP
A 1 -.002 -.044 -.533* -.584* -.568* -.524* -.541* -.520* -.469* -.434 -.539* .131 -.435 -.370 -.517*
B 1 -.459 .526* .431 .440 .407 .482* .505* .516* .570* .503* .395 .685** .540* .436
C 1 .011 .019 .051 .101 .019 -.003 .048 -.104 .027 -.705** -.358 -.036 -.146
1-RM
1 .908** .948** .908** .987** .884** .985** .824** .988** -.100 .852** .852** .847**
W 30% RM
1 .955** .950** .905** .961** .907** .907** .877** -.179 .714** .910** .871**
Kg 30% RM
1 .906** .947** .882** .949** .809** .912** -.255 .724** .824** .813**
W 40% RM
1 .896** .973** .890** .940** .904** -.180 .699** .937** .881**
Kg 40% RM
1 .870** .962** .809** .964** -.147 .822** .825** .820**
W 50% RM
1 .865** .980** .870** -.062 .744** .973** .908**
Kg 50% RM
1 .800** .972** -.115 .830** .845** .832**
W 60% RM
1 .809** .061 .747** .971** .908**
Kg 60% RM
1 -.060 .860** .837** .842**
% RM-OP
1 .425 .016 .139
Kg-OP
1 .751** .820**
Pmax 1 .919**
MPP 1
BP = Breast Pain; MPP = Mean Propulsive Power; A = Days with breast pain per month; B = Vigour; C = Fatigue; *p<0.05; **p<0.01.

CHAPTER 3: STUDY 2
100
Table 10c. Correlations between performance variables of Bench Press Throw and questionnaires variables in LP.
A 1-RM W
30% RM
Kg 30% RM
W 40% RM
Kg 40% RM
W 50% RM
Kg 50% RM
W 60% RM
Kg 60% RM
% RM-OP
Kg-OP Pmax MPP
A 1 -.588* -.596** -.625** -.506* -.588* -.503* -.524* -.478* -.599** .155 -.506* -.555* -.621**
1-RM 1 .947** .973** .924** .987** .907** .987** .896** .986** -.141 .884** .918** .867**
W 30% RM
1 .934** .976** .929** .976** .942** .957** .946** -.084 .863** .982** .964**
Kg 30% RM
1 .883** .957** .889** .961** .871** .944** -.194 .836** .903** .867**
W 40% RM
1 .916** .986** .915** .973** .924** -.070 .850** .962** .960**
Kg 40% RM
1 .897** .966** .887** .963** -.149 .873** .897** .851**
W 50% RM
1 .900** .987** .905** -.073 .829** .970** .978**
Kg 50% RM
1 .886** .972** -.151 .871** .912** .860**
W 60% RM
1 .908** .062 .884** .958** .973**
Kg 60% RM
1 -.045 .916** .924** .874**
% RM-OP
1 .294 -.036 .034
Kg-OP 1 .863** .839**
Pmax 1 .976**
MPP 1
BP = Breast Pain; MPP = Mean Propulsive Power; A = Days with Breast Pain per month; *p<0.05; **p<0.01.

EFFECTS OF THE MENSTRUAL CYCLE PHASES ON DIFFERENT STRENGTH MANIFESTATIONS
101
Table 11. Correlations between performance variabless of Parallel Half Squat and questionnaire variables across the menstrual cycle.
Stress Depression Vigour Fatigue Vmax MPV Pmax MPP % RM-
OP
Stress in MEN
1 .651**
-.111
.148
-.533*
-.533*
-.429
-.415
.260
Depression in MEN
1 .260
.615**
-.611**
-.509*
-.475*
-.414
-.103
Vigour in FP
1 -.459
.134
.126
.429
.488*
-.119
Fatigue in LP
1 -.105
.037
-.038
.095
-.187*
MPV = Mean Propulsive Velocity; MPP = Mean Propulsive Power. The correlations are shown as the value obtained between the questionnaire variable in the indicated phase and the performance variable in the same phase. *p<0.05; **p<0.01.
Table 12. Correlations between performance variables of CMJ and questionnaires variables in FP.
Vigour Height Pmax Take-off
speed
Vigour 1 .516* .487* .552*
Height 1 .916** .708**
Pmax 1 .760**
Take-off
speed 1
*p<0.05; **p<0.01.

CHAPTER 3: STUDY 2
102
3.4. Discussion and Conclusion.
The main objective of this study was to investigate if the
menstrual cycle phases could affect the performance of different
mechanical power tests, and to be able to plan the loads of this type of
training in the phase in which the best results were obtained. It was
essential that the phases were well defined by hormonal values. Our
values of progesterone and the detection of LH in urine confirming
ovulation, corroborated that the measurements were correctly made in
the proposed phases.
According to the action of estradiol, in moments prior to
ovulation in which the first peak of this hormone is obtained (FP), better
results could be obtained than in MEN, in which this hormone was low,
or in LP when this hormone is high, but its effect may be diminished
because the progesterone is also elevated (Carson & Manolagas, 2015;
Gleeson & Shalet, 2005; Kraemer et al., 2012).
However, we found no differences when comparing the majority
of the test results between the 3 phases. In the study 1 differences only
were found in the 1-RM of the parallel half squat, but the sample was
very small and no hormonal measurements were performed to
corroborate the phases. According to the results of this study, and in line
with our previous study, we verified that these tests can be performed
at any menstrual cycle phase. Other studies support our results, in
which no differences in the test used were found between the phases
(Bushman et al., 2006; Ekenros et al., 2013; Giacomoni et al., 2000;

EFFECTS OF THE MENSTRUAL CYCLE PHASES ON DIFFERENT STRENGTH MANIFESTATIONS
103
Lynch & Nimmo, 1998; Miskec et al., 1997; Sakamaki et al., 2012;
Tsampoukos et al., 2010).
With respect to performance variables, when all the sample was
analyzed as a single group, the MBI analysis only showed differences in
MPV and Vmax between the phases.
Maximal power output and maintenance of the optimal velocity
test: The %RM in which the Pmax was found was within the established
ranges by the literature for each exercise (Castillo et al., 2012; Izquierdo
et al., 2001; Izquierdo, Häkkinen, Gonzalez-Badillo, Ibáñez, &
Gorostiaga, 2002).
However, in maintenance of the optimal velocity test, we found
differences in the MPV in the parallel half-squat, obtaining its best result
in FP. The MBI analysis showed that MPV was “possibly harmful” in MEN
regarding FP, and “possibly beneficial” in FP in comparison with LP. FP
showed a greater MPV of 15-16 hundredths with respect to MEN and
LP. According to González-Badillo & Sánchez-Medina (2010), this could
amount to an increase of 10% 1-RM in absolute values.
In the bench press throw, best results in the Vmax also appear in
FP. Vmax was “likely harmful” in MEN with FP and in MEN in comparison
with LP. In addition, FP seemed to be better than LP, being “possibly
beneficial”. To ensure that the difference in velocity between the
phases was not due to a load change (%RM), a correlation between the
Kg moved and the Vmax was performed, without obtaining a significant
correlation. In the maintenance of the optimal velocity test, it was kept
in mind that the participants were able to mobilize the load until it

CHAPTER 3: STUDY 2
104
decreased more than 10% of velocity. This criterion was maintained in
all phases of the cycle, but we observed that this velocity was lower in
MEN than in FP and that it is not due to the change in the load, so we
could say that the hormonal change presented at that time may affect
the movement´s velocity.
The power generated in the optimal velocity test did not vary
during the phases. The power is the product of force (F) and velocity (V):
if the force increases (displaced mass) and the velocity decreases, the
power value obtained can be very similar. In this case, we can see that
the lowest speed value (MEN) coincides with a small increase in %RM-
OP in both parallel half-squat (MEN = 66.67 ± 5.23, FF = 65.92 ± 4.89, LP
= 65.06 ± 5.44) and bench press throw (MEN = 58.50 ± 4.42; FP = 56.60
± 6.22; LP = 55.12 ± 5.88), and therefore there was no change in the
power output between phases. However, in our study the difference in
%RM-OP between phases was not large enough to influence the
number of repetitions obtained in the parallel half-squat (MEN = 8.0 ±
3.82, FP = 7.67 ± 3.09; LP = 8.17 ± 4.46) or in the bench press (MEN =
4.28 ± 1.71; FP = 4.06 ± 1.43; LP = 4.22 ± 1.35) within the optimal velocity
range.
Jump and sprint variables: In line with other studies no
differences were found in any of the jump or sprint variables (Fridén,
Hirschberg, & Saartok, 2003; Giacomoni et al., 2000; Isacco et al., 2012;
Lynch & Nimmo, 1998; Miskec et al., 1997; Tsampoukos et al., 2010).
However, when the group was divided according to the discrete
variables of the questionnaires, the MBI analysis showed that in
EFFECTS OF THE MENSTRUAL CYCLE PHASES ON DIFFERENT STRENGTH MANIFESTATIONS
105
practically all variables, there was a better performance in those
participants who did not show menstrual pain.
Parallel Half Squat, 20 m sprint and CMJ: Looking at the MBI
analysis in these tests, some variables did not show a clear difference,
since we only found that the result was "possibly beneficial" in the
group that did not have pain. This meant that the trend of the data
showed that this group could have better results, but we would need a
larger sample to be able to corroborate it.
Bench Press Throw: The MBI results in the bench press throw
were more solid, most of the variables were conclusive showing better
results in the group that did not have breast pain, with a practical
interpretation of “likely and very likely beneficial” in favor of the no pain
group. There were no intra-group differences between the three
phases, but there were inter-group differences in each phase, so we
could say that each group kept its performance constant between the 3
phases.
In this line, different studies have highlighted the importance of
the presence of discomfort associated with menstruation with a drop in
performance, but none of these studies had performed tests in which
the optimum velocity was maintained (Constantini et al., 2005; Fridén
et al., 2003; Giacomoni et al., 2000; Möller-Nielsen & Hammar, 1989).
Warren & Shangold (1997) showed that 45-80% of the female
population suffered from dysmenorrhea. In our study, eight participants
(44.44%) reported that their menstruation is usually painful, showing
that of 12 menses a year, 7.25 ± 2.60 were painful, and they scored in
CHAPTER 3: STUDY 2
106
5.88 ± 1.95 the pain of their last menstruation (on a scale of 0-10), in
which the data were collected.
With respect to questionnaire variables, when the sample was
analyzed as a whole, MBI analysis only showed a difference between
phases in RPE.
Reported perception of effort (RPE): The results of this
questionnaire showed a lower value during FP, being “likely beneficial”
in comparison with LP. Symptoms of dysmenorrhea are known as
menstrual (as they appear in menstruation), and pre-menstrual (in LP)
(Constantini et al., 2005; Giacomoni et al., 2000). Probably these
symptoms caused an increase in the perception of effort in those
moments, showing the lowest value in the moments prior to ovulation,
when the symptoms decreased. In addition, when dividing the group
according to the participants which showed a painful menstruation, we
observed that RPE in MEN was much greater in the women with
menstrual pain regarding those who did not suffer pain, that is, it was
“likely beneficial” in the no pain group. We re-emphasized that at this
stage the symptoms of dysmenorrhea are higher, which could explain
the difference in the perception of effort between both groups. Other
studies have found the same results (Gamberale, Strindberg, &
Wahlberg, 1975; Higgs & Robertson, 1981; Pivarnik, Marichal, Spillman,
& Morrow, 1992).
Profile of Mood States (POMS): There were no differences in the
five dimensions between the phases. However, all dimensions of POMS
showed correlations at some point of the menstrual cycle. In line with
EFFECTS OF THE MENSTRUAL CYCLE PHASES ON DIFFERENT STRENGTH MANIFESTATIONS
107
Cockerill, Nevill, & Byrne, (1992), it was observed that the "negative"
dimensions of POMS (stress, depression, fatigue and anger), had
negative correlations with performance variables, while vigor showed a
positive correlation. This supported the results of the study, since
(besides the fact that the participants with pain obtained worse results)
the presence -or not- of this pain could explain the worse results with
other variables of the questionnaires. Therefore, participants with pain
and those who scored high the negative dimensions, obtained worse
performance test results.
Menstrual Pain Questionnaire: Days with breast-pain per month
(one of the variables in this questionnaire) also showed negative
correlations with the results of the bench press throw.
The days with breast pain can be considered a negative variable,
as well as the dimensions of POMS mentioned above. This means that
we have found worse results in the group with dysmenorrhea (Fridén et
al., 2003). These results can be refuted through the correlations found
between the negative variables of the questionnaires and the results of
the tests (Cockerill et al., 1992). In addition, it could be said that the pain
affected performance in a global way, and also that the discomfort in a
particular area affected the exercises that will be performed with the
musculature of this area, since the breast-pain showed worse results in
bench press throw, and the low back-pain had a tendency to show worse
results in the parallel half-squat, in the 20 m sprint and in the CMJ.
In conclusion, physically active young women seem to have a
higher MPV in FP, that is, they were faster in both upper and lower body
CHAPTER 3: STUDY 2
108
exercises, even though, the tests used to evaluate the power and
velocity could be used at any time of the menstrual cycle, since there
were no differences in the results of this test. We also found that
participants with discomfort associated with menstruation obtained
worse results, so their training sessions should be adjusted to the
moments in which there was no menstrual or pre-menstrual pain, trying
to increase performance.
As future lines of work, it would be necessary to check what
happens if we train at different phases of the menstrual cycle, that is,
the chronic adaptations of training at different menstrual cycle phases.
Chapter 4. Study 3 The use of Velocity-Based Resistance Training in elite rowers at
different menstrual cycle phases affect performance improvements.

4.1. Introduction.
In the last decades there has been a growing interest in the study
of women in sport due to their professionalization. The main problem
of researchers is to try to understand the response to different types of
training in relation to menstrual hormones and their fluctuation in the
two largest phases of the menstrual cycle, the Follicular Phase (FP) and
the Luteal phase (LP) (Constantini et al., 2005).
The two major hormones that vary along these phases are
estradiol, which has been categorized as an anabolic hormone, and
progesterone, which is considered catabolic (Ekenros et al., 2013;
Sakamaki et al., 2012). The highest values of estradiol are found in the
moments prior to ovulation, and in the middle of the LP, and
progesterone is only high in the middle of the LP (Oosthuyse & Bosch,
2010). Variations in the levels of these hormones have reported
changes in fluid retention, changes in body temperature and
metabolism of the substrates, so they can influence performance since
there is an affectation of numerous cardiovascular, respiratory,
thermoregulatory and metabolic parameters (Constantini et al., 2005).
Other important hormones in training are testosterone (also
considered anabolic) that reach their peak just before ovulation
(Salonia et al., 2008), and cortisol (catabolic) that is higher in the middle
of the LP (Genezzani et al., 1975). Estradiol has been shown to correlate
with growth hormone (GH) values (Gleeson & Shalet, 2005), and
together with the action of testosterone, it could be thought that there

CHAPTER 4: STUDY 3
112
is a greater predisposition to obtain strength gains in the follicular
phase.
Different studies have corroborated this hypothesis showing
better strength gains during the first two weeks of the menstrual cycle.
A recent study showed a greater maximum isometric force (Fmax) and a
higher increase in muscle diameter (Mdm) and in fiber diameter (Fdm)
of type II fiber (Sung et al., 2014). An increase in squat jump (SJ) and
counter-movement jump (CMJ), in peak torque values in hamstrings
and in lean body mass of the legs have also been found (Wikström-
Frisén et al., 2015). Reis et al. (1995) reported an increase in maximal
strength and in ratio of maximal strength/muscle cross sectional area.
Another recent study (Pallavi, Souza, & Shivaprakash, 2017) found a
greater handgrip strength and lower fatigue rate percentage.
Although some of these studies have been based on new trends
of training, none of them have used the method of velocity-based
resistance training (VBRT). This method attempts to seek improvements
in strength and power levels through the realization of a individualized
number of repetitions until the velocity begins to descend, using the
load at which the highest peak-power is generated (Pareja-Blanco et al.,
2016).
The main objective of this study is to verify if the first two weeks
of the menstrual cycle are more effective to perform this type of
training in comparison to the last two weeks and to check if there are
other factors associated with dysmenorrhea that may adversely affect
the results of this type of training.

EFFECTS OF THE MENSTRUAL CYCLE PHASES ON DIFFERENT STRENGTH MANIFESTATIONS
113
4.2. Methods.
4.2.1. Participants
Fourteen women, all physically active and elite rowers, took part
in this study. All trained 7 days per week, with approximately two hours
per training session. In general, each week was divided into two
resistance training sessions, two water training sessions and three
series training sessions on the row ergometer. Each session started with
ten minutes or two kilometer warm-up in the row ergometer (except
the water sessions where warm-up was done in the boat). The
resistance and series sessions were aimed at the general physical
preparation and its load depended on the moment of the season, and
in the water sessions, the work was focused on the technique.
For the inclusion, they were required not to have any injury, not
to suffer any hormonal irregularities, to have a regular menstrual cycle,
to not smoke and to not have taken oral contraceptives (OCP) during
the last six months. They were instructed to continue their usual diet
and not to take caffeine on the day of the tests or on the day before.
The descriptive data of the sample are shown in table 13.
Written informed consent was obtained from the participants
before the research. The present study was approved by the
institutional research ethics committee of the University, and
conformed to the recommendations of the Declaration of Helsinki.

CHAPTER 4: STUDY 3
114
Table 13. Participants descriptive data. Data are shown as means ± SD.
n Age
(y)
Body mass (kg)
Height
(m) B.M.I.
Fat mass
(%)
1-RM
Bench Press
Menstrual cycle (days)
Total
(n = 14)
19.71 ± 1.44
60.49 ± 6.13
1.63 ± 0.08
22.81 ± 1.91
16.6 ± 3.36
43.86 ± 7.92
28.04 ± 2.65
4.2.2. Procedures
Each participant performed six laboratory sessions. The first day
included a general anamnesis, a questionnaire in which the participant
had to answer about her menstrual history (menstrual pain
questionnaire) and the familiarization session, performing all tests (the
same tests that they would do during the intervention) in order to learn
the protocol.
The second, third, fourth and fifth sessions correspond with Pre-
test 1, Post-Test 1, Pre-test 2 and Post-Test 2 respectively, and between
each pre- and post-test the participants performed 6 training sessions
in their club, apart from their usual training. The first thing that was
done in pre- and post-test sessions were two questionnaires: Karolinska
Sleep Diary (KSD) and Profile of Mood States (POMS). After this, two
performance tests (20 sec all-out in a row ergometer and bench press
throw) were carried out. Thirty minutes after the end of the session, the
participants answered a Rating of the Perceived Exertion (RPE), using
the 0-10 Borg-scale (Borg, 1990). This can be seen in the annex 4. Before
the tests, participants performed a standard warm-up (15 min including
aerobic exercise in a row ergometer, general mobilization and ballistic
exercises).
EFFECTS OF THE MENSTRUAL CYCLE PHASES ON DIFFERENT STRENGTH MANIFESTATIONS
115
In these four sessions, the sample was counterbalanced into 2
groups. Pre-test 1 was carried out at different menstrual phase for each
group: the group that performed training during the first two weeks of
the menstrual cycle (gFP = 7) did the pre-test 1 at the beginning of
bleeding, and the group that started to train during the last two weeks
of the menstrual cycle (gLP, n = 7) did the pre-test 1 at the time of
ovulation. The 6 training sessions began the day after the pre-test 1.
Post-test 1 was performed one or two days after the last training
session. Then both groups continued with their usual training for a
month, and repeated the same protocol (Pre-test 2, the 6 training
sessions and Post-Test 2) in the other phase of their menstrual cycle.
In order to control that the effects of their usual training did not
interfere with our results, the study was performed at a time of the
season in which they did not have to improve the maximum strength,
and their strength training was limited at the specific and preventive
strength. Counterbalance also blocked the training interference.
The sixth day included an anthropometry to characterize the
sample. The experimental design is shown in figure 7.
Determination of the menstrual cycle.
Participants were monitored for three months before starting
the first measurement to ensure they had a regular menstrual cycle. To
confirm the phases, ovulation was detected using a luteinizing hormone
(LH) KIT in urine. The reagent sensibility was 20 mIU/ml. When training
was performed at FP, 3 days before ovulation was predicted (based on
data collected during the 3 months prior to the start of the study),

CHAPTER 4: STUDY 3
116
participants started using the LH reagent every day until the ovulation
was detected to ensure that the last training session was still in FP and
ovulation had not passed. When training was performed at LP, 3 days
before the predicted ovulation, participants began to use the LH
reagent every day until ovulation was detected, and the day after
ovulation the first day of training began, and the last training session
should have been performed before the next menstruation.
Only one participant was not able to perform the 6 training
sessions, since the time from ovulation to the next menstruation was
10 days. This participant was in gLP when pre-test 1 was performed,
that is, only 4 sessions could be completed in the luteal phase, but the
results in the follicular phase were not compromised. When the
measurements in this phase were repeated, four sessions were also
made, so the volume of training was matched in both phases. The
duration of FP was 14.64 ± 2.44 days, and the duration of LP was 13.93
± 2.87 days.
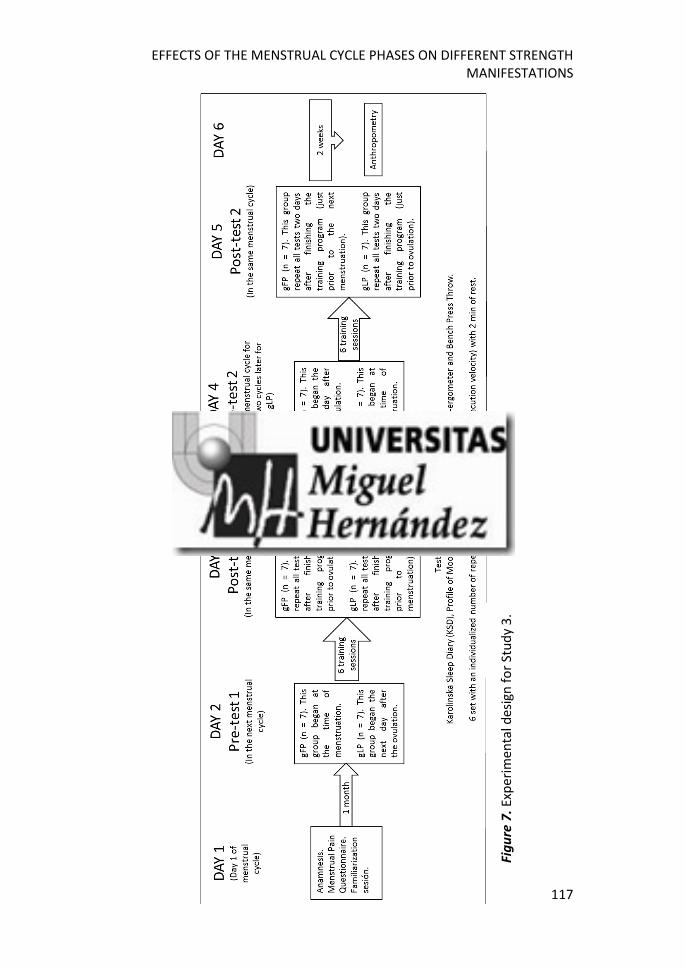
EFFECTS OF THE MENSTRUAL CYCLE PHASES ON DIFFERENT STRENGTH MANIFESTATIONS
117
Fig
ure
7. E
xper
imen
tal d
esig
n f
or
Stu
dy
3.
CHAPTER 4: STUDY 3
118
Menstrual pain questionnaire (Larroy et al., 2001).
This questionnaire provides information of different feelings of
discomfort caused by menstruation (annex 1). It includes variables that
were grouped in 6 dimensions: 1. factors that may influence menstrual
pain (number of children, years since first menstruation); 2.
characterization of menstrual pain (intensity and location of pain,
number of painful menses, time of onset of pain); 3. request for
professional help due to menstrual pain; 4. symptoms associated with
menstrual pain; 5. strategies used to relieve pain (medication and rest);
6. other symptoms and disorders.
The questionnaire consists of 19 questions Nine were discrete
variables with 2-6 options to choose from, depending on the question.
Three of these questions are composed of several options (each option
corresponds to one symptom), and the participant had to underline all
of those symptoms that appeared. For its subsequent analysis, a 0 was
used if the symptom was not present, and 1 if it was. In the remaining
six questions, the participant had to choose a single possible option.
Four of these questions had 2 options (yes or no); one had 4 options
(which were transcribed to the database as 0, 1, 2 and 3); and the last
one had six options (which were transcribed to the database as 0, 1, 2,
3, 4 and 5).
From the other 10 questions which were about continuous
variables, the first three were age, number of pregnancies and number
of children. Another of the ten questions was answered using a 0-10
scale, four using a 0-12 scale and the remaining 2 were answered in time

EFFECTS OF THE MENSTRUAL CYCLE PHASES ON DIFFERENT STRENGTH MANIFESTATIONS
119
(years) since this variable was presented. This questionnaire showed an
α -Crombach of 0.99.
Karolinska Sleep Diary (KSD) (Torbjörn et al., 1994).
This questionnaire about the quality of sleep the previous night,
consists of 7 questions (annex 2). Each option has 5 answers, and the
final score was obtained by averaging the 7 questions. Cervelló et al,
(2014) showed an α-Crombach that oscillated between 0.66-0.85.
Profile of Mood States (POMS) (Fuentes et al., 1995).
The reduced version of 29 items was used (annex 3). All items
were grouped into five profiles (stress, depression, anger, vigour and
fatigue). The score for each profile was obtained by the addition of the
scores of each item that makes up each profile, and then a t-score was
calculated using a conversion table. The abbreviated form of 29 items
explains 92.9% of the total variance of the complete questionnaire (58
items), reducing the number of items by half, making it easier for the
participants.
20 sec all-out row ergometer test.
The distance in meters (m) and the mean-power (Pmean)
generated were recorded. The participants were instructed to row as
fast and intensely as possible during 20 second in a row ergometer
(Concept2, Model 2 PM5; Vermont, USA). This test is an adaptation of
the 10 sec all-out test used by Redman & Weatherby (2004). In our
study 20 seconds was used because it was the minimum time for which

CHAPTER 4: STUDY 3
120
the row ergometer could program. A drag factor of 120 was placed on
the ergometer.
1-RM for Bench Press.
The maximum dynamic force was measured using an indirect
protocol to estimate 1-RM using an isoinertial dynamometer (T-Force
Dynamic Measurement System; Ergotech; Murcia, Spain). The
isoinertial dynamometer measures the velocity at which the barbell is
being displaced, and with the barbell´s velocity, the 1-RM can be
predicted (González-Badillo & Sánchez-Medina., 2010), and then the
result was compared with the Brzycki formula (Brzycki, 1993).
The participants started the test with a warm-up series of twelve
repetitions with 20% of their body weight. Then, three to four sets were
carried out, increasing the weight mobilized in each series, until the
participant could not perform more than four to six repetitions. A
passive recovery of three to five minutes between sets was used.
The exercise was performed on a Smith machine (Technogym;
Cesena FC, Italia). To standardize the movement, an anthropometric
box (45x35x15cm) was placed in front of the bench, so the participant
could support her feet and avoid hyperlordosis. In addition, an elastic
band was placed under the bench, so the participant could touch it with
her elbows in each repetition, ensuring a 90-degree of elbow flexion
and shoulder abduction. The movement began with the participant
holding the barbell with her elbows extended, and the barbell

EFFECTS OF THE MENSTRUAL CYCLE PHASES ON DIFFERENT STRENGTH MANIFESTATIONS
121
descended until the participant touched the elastic band with her
elbows.
Maximal Power output test.
Four percentages of the 1-RM (30%, 40%, 50% and 60%) were
measured in the concentric phase using an isoinertial dynamometer in
a Smith Machine. This ballistic exercise was performed by throwing the
bar to achieve the highest possible power and speed, that is, there was
no stopping in the change from the concentric to the eccentric phase.
We know that the ideal exercise to evaluate female rowers would have
been an exercise involving the latissimus dorsi, but then it would not
have been a ballistic exercise (since an oar or a pole can-not be thrown)
and maximum power values could not be obtained.
To find the peak-power, one set of three repetitions was
performed for each percentage (Baker et al., 2001a, 2001b). A two-
minute passive recovery between sets was made. Instantaneous
mechanical power output (P) was calculated as the product of vertical
force and barbell velocity (P = F · V). Peak-power was taken as the
maximum value of the power-time curve. González-Badillo & Sánchez-
Medina, (2010) checked the validity and reliability of this system,
showing ICC values ranging from 0.81 to 0.91 and a CV < 3.6%.
Maintenance of the optimal velocity test.
With the percentage in which a higher peak-power was found
(%RM-OP), a single set was performed with this load (Kg-OP) to perform
as many repetitions as possible (Repts-OP) until the velocity dropped by
CHAPTER 4: STUDY 3
122
10% during two consecutive repetitions. The participants had a visual
feed-back system on the laptop screen for the power achieved in each
repetition, provided by the isoinertial dynamometer software, in which
the green colour meant a correct repetition and the red colour an
incorrect repetition. The repetition in which there was a higher peak-
power (Pmax) and peak-velocity (Vmax) was searched, and the average of
the mean-power (MPP) and mean-velocity (MPV) of the propulsive
phase (in those repetitions that were within the range of optimal speed)
were calculated. Participants used this load and repetitions to train.
Training protocol.
The training sessions were performed before the participants'
usual training. The six training sessions were performed on Monday,
Wednesday and Friday for two consecutive weeks. If the beginning of
bleeding for gFP (Day 1 cycle) or ovulation day for gLP (approximately
day 15 of the cycle) corresponded to Monday or Tuesday, training
began on Wednesday, if it was Wednesday or Thursday, the training
started on Friday, and if it was Friday, Saturday or Sunday, training was
started on Monday of the following week. Each training session
consisted of 6 series of a bench press throw exercise, with a number of
repetitions individualized for each participant, performed at maximum
velocity, at the intensity (% RM) in which maximal power (Pmax) was
achieved, and with 2 minutes of recovery.
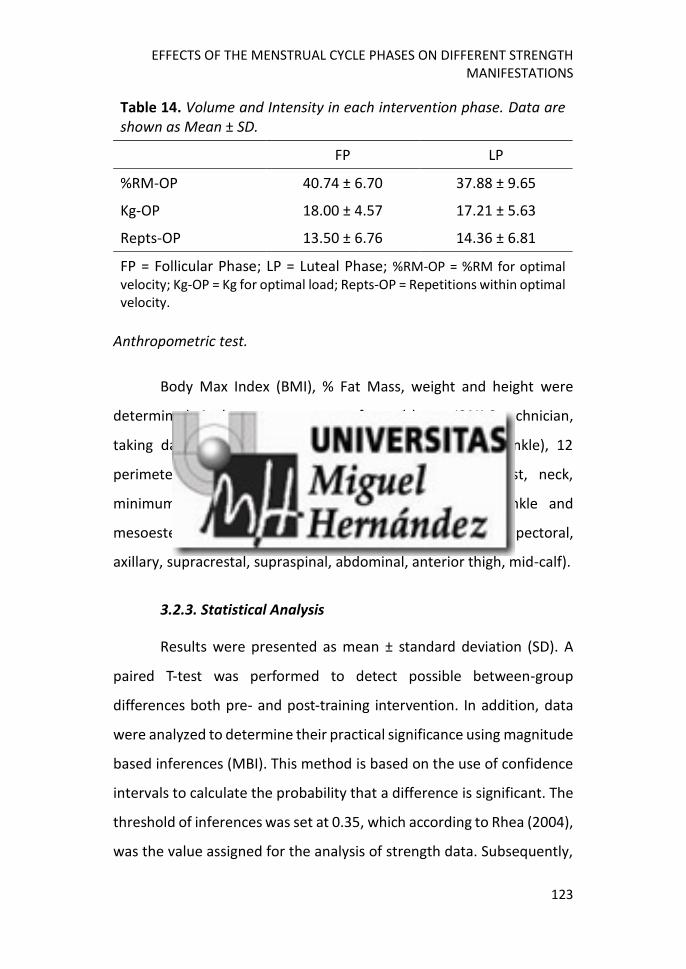
EFFECTS OF THE MENSTRUAL CYCLE PHASES ON DIFFERENT STRENGTH MANIFESTATIONS
123
Table 14. Volume and Intensity in each intervention phase. Data are shown as Mean ± SD.
FP LP
%RM-OP 40.74 ± 6.70 37.88 ± 9.65
Kg-OP 18.00 ± 4.57 17.21 ± 5.63
Repts-OP 13.50 ± 6.76 14.36 ± 6.81
FP = Follicular Phase; LP = Luteal Phase; %RM-OP = %RM for optimal velocity; Kg-OP = Kg for optimal load; Repts-OP = Repetitions within optimal velocity.
Anthropometric test.
Body Max Index (BMI), % Fat Mass, weight and height were
determined. Anthropometry was performed by an ISAK 2 technician,
taking data of 4 diameters (humerus, wrist, femur and ankle), 12
perimeters (relaxed arm, contracted arm, forearm, wrist, neck,
minimum abdominal, hip, 1cm-thigh, mid-thigh, calf, ankle and
mesoesternal) and 10 skinfolds (triceps, subscapular, biceps, pectoral,
axillary, supracrestal, supraspinal, abdominal, anterior thigh, mid-calf).
3.2.3. Statistical Analysis
Results were presented as mean ± standard deviation (SD). A
paired T-test was performed to detect possible between-group
differences both pre- and post-training intervention. In addition, data
were analyzed to determine their practical significance using magnitude
based inferences (MBI). This method is based on the use of confidence
intervals to calculate the probability that a difference is significant. The
threshold of inferences was set at 0.35, which according to Rhea (2004),
was the value assigned for the analysis of strength data. Subsequently,
CHAPTER 4: STUDY 3
124
the probability that any change in performance was greater / similar /
lower between menstrual cycle phases, and between groups divided
according to discrete variables of the questionnaires, was calculated
with its 90% confidence limits (CL). The qualitative probability was
assigned by the following quantitative chances: < 0.5%, most unlikely;
0.5% to 5%, very unlikely; 5% to 25%, unlikely; 25% to 75%, possibly;
75% to 95%, likely; 95% to 99.5%, very likely; and >99.5%, most likely.
In addition, the clinical inference was represented as unclear, trivial,
beneficial or harmful (Batterham & Hopkins, 2006). Depending of the
direction (positive or negative) of the change, not related with really
beneficial or harmful responses.
Relationships between the performance variables and variables
of the questionnaires were calculated using a Pearson´s correlation
coefficient (r). The strength of the correlation coefficient was
determined on the basis of the classifications outlined by Cohen (1988)
in which r = trivial (0.0), small (0.1), moderate (0.3), strong (0.5), very
strong (0.7), nearly perfect (0.9), and perfect (1.0). Statistical
signification was set at p<0.05.
4.3 Results.
Performance variables.
There were no differences between phases (between groups) in
the pre-test. The pre- and post-test (within group) differences in each
phase in the 1-RM test and in the Maximal Power Output test was
shown in Table 15. Both groups obtained an improvement after training
in 1-RM, and therefore in the relative loads (% 1-RM), and in the power
EFFECTS OF THE MENSTRUAL CYCLE PHASES ON DIFFERENT STRENGTH MANIFESTATIONS
125
generated in each one of those percentages. The differences between
groups are shown in figure 8.
Training in FP produced improvements in the power values both
in the Maintenance of the Optimal Velocity test and in the average
power (Pmean) of the 20 sec-all out test. Regarding the Maintenance of
Optimal Velocity Test, in FP the %RM-OP decreased and therefore there
were improvements in the Vmax and MPV. In LP, there was an increase
of the %RM-OP decreasing the velocity values, an increase of the MPP,
and there were no changes in any variable of the 20 sec-all-out (Table
16). The results between groups are shown in Figure 9.
Training at FP produced a higher gain of 1-RM. With low loads
(30% RM), training at FP also produces greater improvements in
velocity, with a consequent improvement in the power developed. The
results of power in the rest of percentages of 1-RM are not clear.
Improvements in the Pmax, and in values of the 20 sec-all-out test also
appear in training at FP in comparison with training at LP.
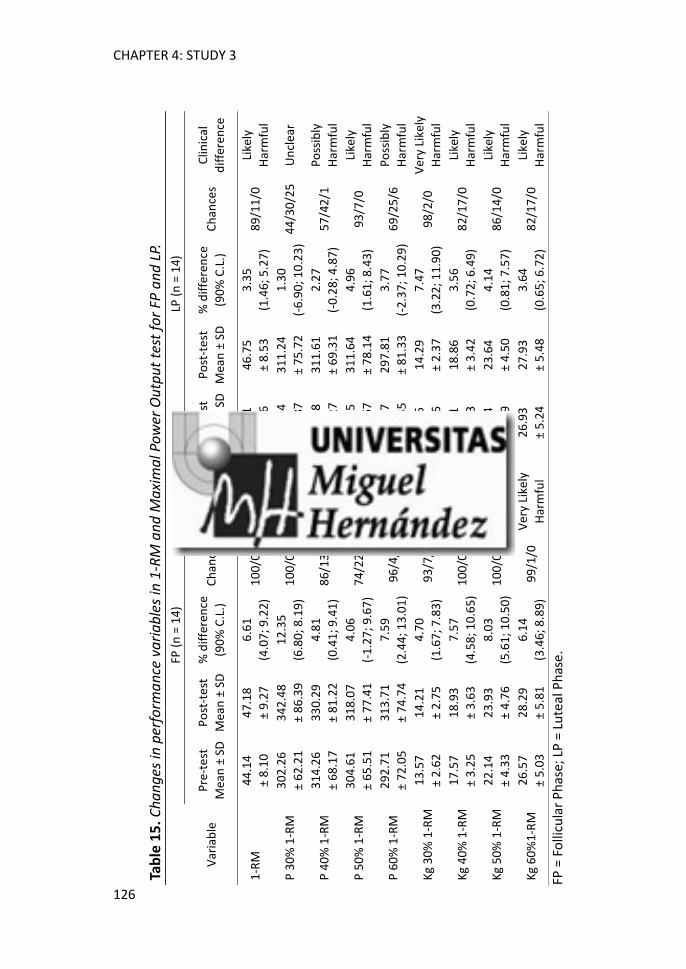
CHAPTER 4: STUDY 3
126
Tab
le 1
5. C
ha
ng
es in
per
form
an
ce v
ari
ab
les
in 1
-RM
an
d M
axi
ma
l Po
wer
Ou
tpu
t te
st f
or
FP a
nd
LP.
FP (
n =
14
)
LP (
n =
14
)
Var
iab
le
Pre
-te
st
Mea
n ±
SD
Po
st-t
est
Mea
n ±
SD
% d
iffe
ren
ce
(90
% C
.L.)
C
han
ces
Clin
ical
dif
fere
nce
P
re-t
est
Mea
n ±
SD
Po
st-t
est
Mea
n ±
SD
% d
iffe
ren
ce
(90
% C
.L.)
C
han
ces
Clin
ical
dif
fere
nce
1-R
M
44
.14
± 8
.10
47
.18
± 9
.27
6.6
1
(4.0
7; 9
.22
) 1
00
/0/0
M
ost
Lik
ely
Har
mfu
l
4
5.2
1
± 8
.16
46
.75
± 8
.53
3.3
5
(1.4
6; 5
.27
) 8
9/1
1/0
Li
kely
Har
mfu
l
P 3
0%
1-R
M
30
2.2
6
± 6
2.2
1
34
2.4
8
± 8
6.3
9
12
.35
(6.8
0; 8
.19
) 1
00
/0/0
M
ost
Lik
ely
Har
mfu
l
3
04
.04
± 6
5.8
7
31
1.2
4
± 7
5.7
2
1.3
0
(-6
.90
; 10
.23
) 4
4/3
0/2
5
Un
clea
r
P 4
0%
1-R
M
31
4.2
6
± 6
8.1
7
33
0.2
9
± 8
1.2
2
4.8
1
(0.4
1; 9
.41
) 8
6/1
3/1
Li
kely
Har
mfu
l
3
04
.48
± 6
7.2
7
31
1.6
1
± 6
9.3
1
2.2
7
(-0
.28
; 4.8
7)
57
/42
/1
Po
ssib
ly
Har
mfu
l
P 5
0%
1-R
M
30
4.6
1
± 6
5.5
1
31
8.0
7
± 7
7.4
1
4.0
6
(-1
.27
; 9.6
7)
74
/22
/3
Po
ssib
ly
Har
mfu
l
2
94
.35
± 6
1.6
7
31
1.6
4
± 7
8.1
4
4.9
6
(1.6
1; 8
.43
) 9
3/7
/0
Like
ly
Har
mfu
l
P 6
0%
1-R
M
29
2.7
1
± 7
2.0
5
31
3.7
1
± 7
4.7
4
7.5
9
(2.4
4; 1
3.0
1)
96
/4/0
V
ery
Like
ly
Har
mfu
l
2
83
.47
± 6
1.4
5
29
7.8
1
± 8
1.3
3
3.7
7
(-2
.37
; 10
.29
) 6
9/2
5/6
P
oss
ibly
Har
mfu
l
Kg
30
% 1
-RM
1
3.5
7
± 2
.62
14
.21
± 2
.75
4.7
0
(1.6
7; 7
.83
) 9
3/7
/0
Like
ly
Har
mfu
l
1
3.3
6
± 2
.65
14
.29
± 2
.37
7.4
7
(3.2
2; 1
1.9
0)
98
/2/0
V
ery
Like
ly
Har
mfu
l
Kg
40
% 1
-RM
1
7.5
7
± 3
.25
18
.93
± 3
.63
7.5
7
(4.5
8; 1
0.6
5)
10
0/0
/0
Mo
st L
ikel
y
Har
mfu
l
1
8.2
1
± 3
.33
18
.86
± 3
.42
3.5
6
(0.7
2; 6
.49
) 8
2/1
7/0
Li
kely
Har
mfu
l
Kg
50
% 1
-RM
2
2.1
4
± 4
.33
23
.93
± 4
.76
8.0
3
(5.6
1; 1
0.5
0)
10
0/0
/0
Mo
st L
ikel
y
Har
mfu
l
2
2.6
4
± 3
.99
23
.64
± 4
.50
4.1
4
(0.8
1; 7
.57
) 8
6/1
4/0
Li
kely
Har
mfu
l
Kg
60
%1
-RM
2
6.5
7
± 5
.03
28
.29
± 5
.81
6.1
4
(3.4
6; 8
.89
) 9
9/1
/0
Ver
y Li
kely
Har
mfu
l
2
6.9
3
± 5
.24
27
.93
± 5
.48
3.6
4
(0.6
5; 6
.72
) 8
2/1
7/0
Li
kely
Har
mfu
l
FP =
Fo
llicu
lar
Ph
ase;
LP
= L
ute
al P
has
e.

EFFECTS OF THE MENSTRUAL CYCLE PHASES ON DIFFERENT STRENGTH MANIFESTATIONS
127
Tab
le 1
6. C
ha
ng
es in
per
form
an
ce v
ari
ab
les
in M
ain
ten
an
ce o
f th
e o
pti
ma
l vel
oci
ty a
nd
20
sec
-all
out
tes
t.
FP
(n
= 1
4)
LP
(n
= 1
4)
Var
iab
le
Pre
-te
st
Mea
n ±
SD
Po
st-
test
Mea
n ±
SD
% d
iffe
ren
ce
(90
% C
.L.)
C
han
ces
Clin
ical
d
iffe
ren
ce
Pre
-te
st
Mea
n ±
SD
Po
st-t
est
Mea
n ±
SD
% d
iffe
ren
ce
(90
% C
.L.)
C
han
ces
Clin
ical
d
iffe
ren
ce
% R
M-O
P
40
.75
±
6.7
0
37
.51
±
8.6
2
-8.9
3
(-1
8.7
9; 2
.13
) 5
/9/8
6
Like
ly
Ben
efic
ial
3
7.8
8
± 9
.65
3
9.8
4
± 8
.80
5
.60
(-
8.1
8; 2
1.4
4)
67
/15
/18
P
oss
ibly
H
arm
ful
Kg-
OP
1
8.0
0
± 4
.57
1
7.7
1
± 5
.72
-2
.90
(-
13
.55
; 9.0
5)
23
/21
/56
U
ncl
ear
1
7.2
1
± 5
.63
1
8.9
3
± 6
.76
9
.12
(-
5.0
8; 2
5.4
5)
80
/10
/10
Li
kely
H
arm
ful
REP
-OP
1
3.5
0
± 6
.76
1
0.9
3
± 4
.38
-1
8.2
4
(-3
3.7
1; 0
.84
) 4
/3/9
3
Like
ly
Ben
efic
ial
1
4.3
6
± 6
.81
1
4.8
6
± 7
.03
1
.44
(-
20
.84
; 29
.99
) 4
8/1
1/4
1
Un
clea
r
Vm
ax
1.4
5
± 0
.21
1
.53
±
0.2
8
5.0
2
(-5
.01
; 16
.10
) 6
9/1
8/1
2
Po
ssib
ly
Har
mfu
l
1.4
9
± 0
.27
1
.42
±
0.2
8
-4.8
3
(-1
4.6
2; 6
.08
) 1
4/1
8/6
8
Un
clea
r
MP
V
1.0
0
± 0
.15
1
.04
±
0.2
1
3.5
8
(-6
.00
; 14
.15
) 6
1/2
2/1
7
Po
ssib
ly
Har
mfu
l
1.0
2
± 0
.19
0
.97
±
0.2
0
-5.2
9
(-1
5.5
8; 6
.25
) 1
4/1
6/7
0
Un
clea
r
Pm
ax
31
5.9
9
± 6
2.7
9
34
2.3
1
± 7
8.1
6
7.8
0
(1.9
0; 1
4.0
5)
95
/5/1
Li
kely
H
arm
ful
3
11
.90
±
61
.46
3
18
.79
±
71
.78
1
.52
(-
4.7
1; 8
.15
) 4
5/3
8/1
7
Po
ssib
ly
Har
mfu
l
MP
P
20
8.4
7
± 4
2.4
3
22
4.6
3
± 5
1.7
8
7.2
4
(1.4
1; 1
3.4
0)
93
/6/1
Li
kely
H
arm
ful
2
03
.12
±
42
.58
2
13
.20
±
48
.58
4
.51
(-
0.9
1; 1
0.2
3)
78
/19
/3
Like
ly
Har
mfu
l
m 2
0 s
ec
97
.63
±
5.6
8
99
.00
±
6.2
8
1.3
8
(0.3
4; 2
.43
) 1
5/8
5/0
Li
kely
Tr
ivia
l
98
.50
±
6.3
2
98
.25
±
6.0
9
-0.2
4
(-1
.32
; 0.8
4)
0/9
9/1
V
ery
Like
ly
Triv
ial
P 2
0 s
ec
33
2.1
3
± 5
5.8
8
34
6.1
3
± 6
8.5
9
3.7
7
(0.0
9; 7
.57
) 8
0/1
9/1
Li
kely
H
arm
ful
3
41
.63
±
65
.13
3
39
.00
±
60
.21
-0
.61
(-
3.7
7; 2
.65
) 9
/69
/22
P
oss
ibly
Tr
ivia
l
FP =
Fo
llicu
lar
Ph
ase;
LP
= L
ute
al P
has
e.

CHAPTER 4: STUDY 3
128
Figure 8. Inferences between FP and LP in 1-RM and Maximal Power
Output Tests.
Figure 9. Inferences between FP and LP in Maintenance of the Optimal
Velocity and 20 sec-all out Tests.
EFFECTS OF THE MENSTRUAL CYCLE PHASES ON DIFFERENT STRENGTH MANIFESTATIONS
129
Questionnaires Variables.
There were no differences in pre- and post-test in any
questionnaire in any phase. There were no differences between pre 1
and pre 2 either, nor between post 1 and post 2. The means of KSD were
3.23 ± 0.50, 3.49 ± 0.51, 3.38 ± 0.56 and 3.34 ± 0.71 (which are shown
as pre- and post-test in FP, and pre- and post-test in LP respectively for
all the questionnaires).
The means for POMS were: Stress 38.64 ± 6.61, 38.36 ± 6.74,
42.79 ± 11.27 and 37.29 ± 5.70; Depression 45.36 ± 6.03, 45.20 ± 4.30,
45.57 ± 4.54 and 45.57 ± 4.93; Anger 51.14 ± 11.03, 51.00 ± 11.60, 54.79
± 10.91 and 52.70 ± 11.23; Vigour 43.14 ± 4.94, 43.64 ± 5.64, 43.00 ±
6.34 and 45.50 ± 6.90; Fatigue 48.57 ± 6.82, 48.56 ± 5.97, 49.57 ± 7.91
and 46.36 ± 8.2. Data for RPE were 4.96 ± 1.85, 4.14 ± 1.35, 4.57 ± 1.69
and 4.32 ± 1.42.
The group was divided into two groups, one with dysmenorrhea
(pain group, n = 10), and one without pain (no pain group, n = 4). The
group without menstrual pain presented better results in the pre-test
of FP, showing values of likely, very likely and most likely beneficial
(Figure 10a). In LP, the results were not conclusive, since values were
possible beneficial, but the tendency was also to obtain better results
in the no pain group (Figure 10b). In both FP and LP post-tests, we also
found better results in the no pain group with likely, very likely and most
likely beneficial values in almost all variables (Figure 11a and 11b).
When the percentage change (% change) of both groups in each phase
was compared, we can see that the no pain group obtained greater

CHAPTER 4: STUDY 3
130
improvements in the FP (Figure 12a), while in LP both groups improved
in the same way (Figure 12b).
Figure 10a. Inferences between Pain Group and No Pain Group in pre-test in FP.

EFFECTS OF THE MENSTRUAL CYCLE PHASES ON DIFFERENT STRENGTH MANIFESTATIONS
131
Figure 10b. Inferences between Pain Group and No Pain Group in pre-test in LP.

CHAPTER 4: STUDY 3
132
Figure 11a. Inferences between Pain Group and No Pain Group in post-test in FP.

EFFECTS OF THE MENSTRUAL CYCLE PHASES ON DIFFERENT STRENGTH MANIFESTATIONS
133
Figure 11b. Inferences between Pain Group and No Pain Group in post-test in LP.

CHAPTER 4: STUDY 3
134
Figure 12a. Inferences between Pain Group and No Pain Group in %
Change in FP.
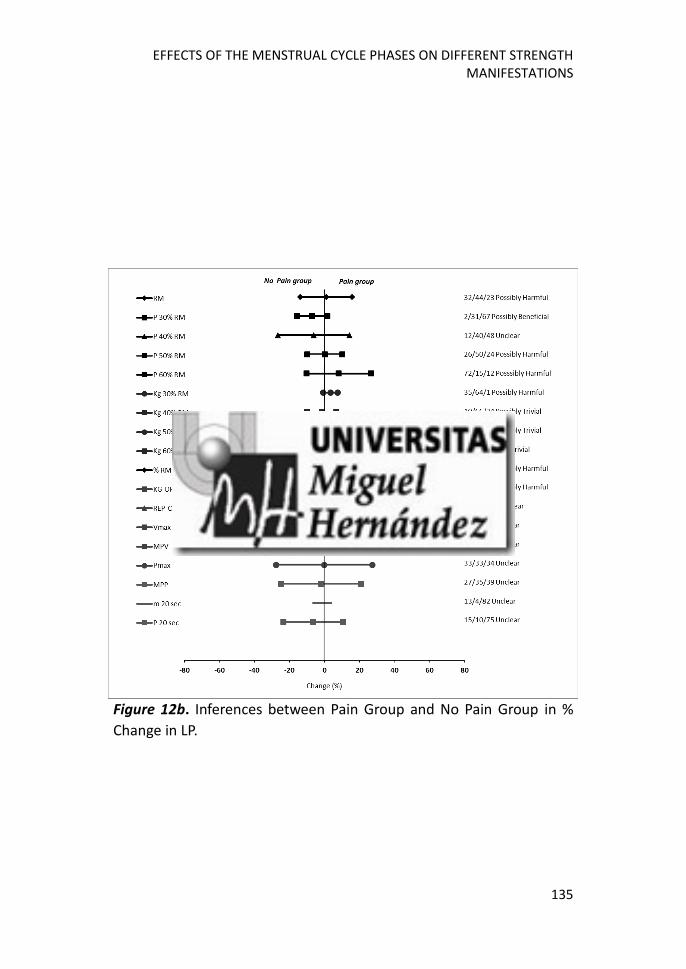
EFFECTS OF THE MENSTRUAL CYCLE PHASES ON DIFFERENT STRENGTH MANIFESTATIONS
135
Figure 12b. Inferences between Pain Group and No Pain Group in %
Change in LP.

CHAPTER 4: STUDY 3
136
Different correlations were found between performance and
questionnaire variables. The results are shown in Table 17a, 17b, 17c
and 17d.
Table 17a. Correlations between Performance and Questionnaire Variables in pre-test in FP.
M H 1-RM Kg
30% 1-RM
P 40%
1-RM
Kg 40%
1-RM
P 50%
1-RM
KG 50%
1-RM
Kg 60%
1-RM
M 1 -.079 -.589* -.582* -.307 -.607* -.380 -.659* -.640*
H 1 -.522 -.543* -.522* -486 -.580* -.459 -.473
1-RM 1 .982** .906** .988** .911** .989** .991**
Kg 30% 1-RM
1 .887** .967** .888** .988** .966**
P 40% 1-RM
1 .877** .963** .873** .880**
Kg 40% 1-RM
1 .885** .983** .983**
P 50% 1-RM
1 .871** .892**
Kg 50% 1-RM
1 .984**
Kg 60% 1-RM
1
M = days with menstruation in the cycle; H = days with headache in the cycle; *p<0.05; **p<0.001.
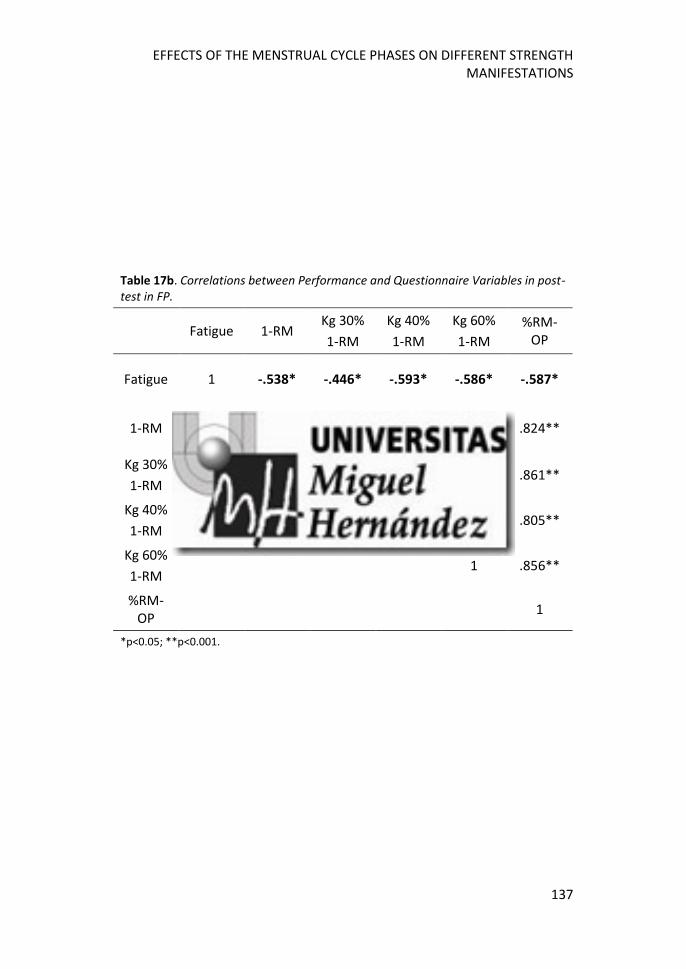
EFFECTS OF THE MENSTRUAL CYCLE PHASES ON DIFFERENT STRENGTH MANIFESTATIONS
137
Table 17b. Correlations between Performance and Questionnaire Variables in post-test in FP.
Fatigue 1-RM Kg 30%
1-RM
Kg 40%
1-RM
Kg 60%
1-RM
%RM-OP
Fatigue 1 -.538* -.446* -.593* -.586* -.587*
1-RM 1 .986** .992** .985** .824**
Kg 30%
1-RM 1 .976** .985** .861**
Kg 40%
1-RM 1 .964** .805**
Kg 60%
1-RM 1 .856**
%RM-OP
1
*p<0.05; **p<0.001.

CHAPTER 4: STUDY 3
138
Table 17d. Correlations between Performance and Questionnaire Variables in post-test in LP.
Fatigue Vmax MPV
Fatigue 1 -.746** -.738**
Vmax 1 .955**
MPV 1
MPV = Mean Propulsive Velocity; *p<0.05; **p<0.001.
Table 17c. Correlations between Performance and Questionnaire Variables in pre-test in LP.
H Kg 30% 1-RM
P 30% 1-RM
Kg 40%
1-RM
P 40% 1-RM
Kg 50%
1-RM
P 50% 1-RM
P 60% 1-RM
Pmax MPP
H 1 -.589* -.618* -.553* -.645* -.540* -.594* -.640* -.700** -.625*
Kg 30% 1-RM
1 .896** .951** .857** .954** .846** .854** .886** .889*
P 30% 1-RM
1 .877** .931** .926** .954** .926** .972** .946**
Kg 40% 1-RM
1 .868** .966** .852** .866** .855** .871**
P 40% 1-RM
1 .860** .937** .938** .952** .943**
Kg 50% 1-RM
1 .910** .903** .892** .859**
P 50% 1-RM
1 .978** .934** .880**
P 60% 1-RM
1 .918** .886**
Pmax 1 .953**
MPP 1
H = days with headache in the cycle; *p<0.05; **p<0.001.

EFFECTS OF THE MENSTRUAL CYCLE PHASES ON DIFFERENT STRENGTH MANIFESTATIONS
139
4.4 Discussion and Conclusion.
The main objective of this study was to analyze the differences
after a period of velocity-based resistance training (VBRT) in the two
great phases of the menstrual cycle. According to other studies, the
action of estradiol, an anabolic hormone which increases during the
follicular phase until reaching its peak before ovulation, suggests that
there will be better results in this phase, since the progesterone
(catabolic hormone) values are low and do not decrease the estradiol
effect, as happens in the luteal phase (Reis et al., 1995; Sung et al.,
2014). The results of our study corroborate this hypothesis.
In line with Pareja-Blanco et al. (2016), VBRT is an effective
method of training, since improvements in the 1-RM in both phases, as
well as in the peak-power values obtained in each % 1-RM have been
reported, showing a practical significance of likely, very likely and most
likely beneficial after training in both FP and LP. However, we can see
that the response after training in each phase is different. In the FP, the
participants were faster after training, since they obtained their peak-
power in a smaller %RM-OP (likely beneficial), and also increased power
at 30% RM, but they performed a smaller number of repetitions
maintaining the optimal velocity (likely beneficial). However, after the
intervention in LP there is an increase of %RM-OP (possibly harmful),
but the number of repetitions remained constant. The fact that the
%RM-OP varied through the phases, entailed a change in velocities.
González-Badillo & Sánchez-Medina (2010) reported that each % 1-RM
has a specific speed value associated to it. In our study, the% RM-OP
decreased in the FF and we found better values of Vmax and MPV after

CHAPTER 4: STUDY 3
140
the intervention (possibly after training). In LP %RM-OP also increased,
but we found worse values of Vmax and MPV, although practical
significance showed that it was unclear. However, the power values
(Pmax and MPP) improved in both phases (beneficial with training),
independently of whether the %RM-OP increased or decreased. This
means that in the FP participants were faster because they generated
higher powers levels with greater velocities, and in the LP participants
became stronger, since they generated their peak-power with higher
loads.
Regarding the 20 sec-all-out test, the average power produced
was likely beneficial after training, and although there was an
improvement in the rowing meters, it seems to be trivial.
However, the major contributions of this study were that when
comparing the change percentages between pre- and post-test in each
phase, we can see that the results showed a greater improvement in FP
in comparison with LP in elite rowers in 1-RM and their relative loads,
in the velocity and power values analyzed during the test of
maintenance of the optimal velocity and in the variables obtained from
the 20 sec-all-out test. The power improvement at 30% RM is also
interesting, which implies an important speed improvement with low
loads in FP training. These results are in line with other studies
(Markofski & Braun, 2014; Pallavi et al., 2017; Sarwar et al., 1996; Sung
et al., 2014; Wikström-Frisén et al., 2015).
According to other studies, no differences were found between
the phases in the POMS, KSD or RPE results (Julian, Hecksteden,

EFFECTS OF THE MENSTRUAL CYCLE PHASES ON DIFFERENT STRENGTH MANIFESTATIONS
141
Fullagar, & Meyer, 2017; Sakamaki-Sunaga, Min, Kamemoto, &
Okamoto, 2015).
When the group was separated depending on dysmenorrhea, it
can be observed that the no pain group obtained better values in pre-
and post-test in FP in comparison with the pain group, showing a clinical
difference of very likely and most likely beneficial. When comparing
pre-test results between groups in LP, the results were not so clear, but
the trends seemed to be show that the no pain group had better
performance. In post-test of LP, better results were found in the no pain
group. This means that both groups (pain and non-pain) are different at
baseline, but when the percentage of change in each group was
compared, we can see that the no pain group had a greater
improvement in FP, and there were no differences between both
groups in the LP. This can be explained by the fact that the pain group
did not improve so much in the FP because it is the moment at which
the menstrual syndrome is present. However, in LP, the discomfort
associated with menstruation decreased, which possibly entailed that
both groups improve equally (Constantini et al., 2005).
To support these results, negative correlations were found
between different continuous variables of the questionnaires (such as
headache, fatigue dimension of POMS or duration of menstruation)
with performance variables such as 1-RM, Kg and peak-power in their
relative loads, Vmax, MPV, Pmax and MPP. In line with other authors,
different symptoms associated with menstrual pain can lead to poorer
performance (Cockerill et al., 1992; Constantini et al., 2005; Fridén et
al., 2003; Giacomoni et al., 2000; Möller-Nielsen & Hammar, 1989).
CHAPTER 4: STUDY 3
142
In conclusion, VBRT is a good method to improve the values of
strength, power and velocity in elite rowers, but performing this type of
training in the first two weeks of the menstrual cycle (FP) produces
better results compared to training during the last two weeks (LP), so
the distribution of training loads should be adjusted during these two
weeks. In addition, the participants which reported menstrual pain
obtained worse results, so the option of incorporating oral
contraception (OCP) could be considered to alleviate the negative
effects of dysmenorrhea. For future research, the effects of OCPs
should be studied in this type of training.
Chapter 5. Epilogue


The three studies of this thesis are focused on researching what
happens throughout the menstrual cycle when new tendencies of the
strength training are applied. This design tries to look for greater
complexity as the studies progresses, analyzing in an acute way - at first
- the cycle divided in two phases, secondly in 3 phases, and thirdly
intervening on the two great moments of the menstrual cycle (Figure
13).
Figure 13. Graphical representation of the aims of investigation in each
study of the thesis.
5.1. Major contributions.
The major contributions of this thesis are summarized in the
following points:
Different performance tests to evaluate the power output and
executed at maximum velocity, as well as an indirect test to
evaluate the 1-RM can be performed indistinctly at any phase of
the menstrual cycle (Study 1 and 2).
STUDY 1• MEN vs LP
STUDY 2• MEN vs FP vs LP
STUDY 3• Performance improvements
CHAPTER 5: EPILOGUE
146
The maximal velocity (Vmax) and the mean velocity during the
propulsive phase (MPV) are higher in the follicular phase, just in
moments prior to ovulation (Study 2).
Discomfort associated with menstruation and premenstrual
syndrome adversely affect the performance test results (Study
1 and 2).
The reported perception of effort (RPE) by the participants is
greater at the time of menstruation and prior to it (Study 2).
After two-weeks of intervention in each phase of the menstrual
cycle, better results were obtained in the follicular phase in all
the applied tests (Study 3).
The group reporting no discomfort associated with
menstruation, obtained greater improvements in all tests in the
follicular phase after two weeks of intervention, although it did
not affect improvement in the luteal phase (Study 3).
5.2. Study limitations and future research.
During the development of this thesis we have encountered
different limitations that can be used as a starting point for new
research.
Check the menstrual cycle through hormonal values. In our first
study, the detection of the menstrual cycle was done through
the technique of counting days, which can lead to measurement
errors by not detecting the phase correctly.
Increase the sample. In the first study (although it was a pilot
study), the sample is very small. In the following studies,

EFFECTS OF THE MENSTRUAL CYCLE PHASES ON DIFFERENT STRENGTH MANIFESTATIONS
147
although it has been possible to increase the number of
participants, it may not be totally representative of this type of
population.
Analyze in other sports. The intervention of the last study was
carried out with rowers, but we can-not state that these results
are applicable to other sports.
Increase the number of consecutive menstrual cycles.
Performing the measurements in several consecutives cycles
could help to know the variability of the participants and give
greater consistency to the results.
Principales contribuciones
Las mayores aportaciones de esta tesis son resumidas en los
siguientes puntos:
Diferentes test de rendimiento para evaluar la potencia
producida y ejecutados a máxima velocidad, así como un test
indirecto para evaluar el 1-RM pueden ser realizados
indistintamente en cualquier fase del ciclo menstrual (Estudio 1
y 2)
La velocidad máxima (Vmax) y la velocidad media durante la fase
propulsiva (MPV) son mayores en la fase folicular, justo en los
momentos previos a la ovulación (Estudio 2).
Las molestias asociadas a la menstruación, y el síndrome pre-
menstrual afectan negativamente a los resultados de los test de
rendimiento cuando son aplicados en diferentes fases del ciclo
menstrual (Estudio 1 y 2).
CHAPTER 5: EPILOGUE
148
La percepción de esfuerzo de los sujetos es mayor en los
momentos de la menstruación y previos a ella (Estudio 2).
Tras intervenir en cada una de las fases del ciclo menstrual, se
obtuvieron mejores resultados en la fase folicular en todos los
test aplicados (estudio 3)
El grupo que indicó no tener molestias asociadas a la
menstruación, obtuvo mayores mejoras en todos los test en la
fase folicular tras dos semanas de intervención, mientras que
ambos grupos mejoraron por igual en la fase lútea (Estudio 3)
Limitaciones de los estudios y futuras líneas de trabajo.
Durante el desarrollo de esta tesis nos hemos encontrado con
diferentes limitaciones que pueden ser utilizadas como punto de
partida para nuevas investigaciones:
Verificar el ciclo menstrual a través de valores hormonales. En
nuestro primer estudio, la detección del ciclo menstrual se hizo
a través de la técnica de contar días, lo que puede conllevar a
errores de medición por no detectar correctamente la fase.
Aumentar la muestra. En el primer estudio (aunque era un
estudio piloto), la muestra es muy pequeña. En los siguientes
estudios, aunque se ha conseguido aumentar el número de
sujetos, puede no ser totalmente representativo en este tipo de
población.
Analizar en otro tipo de deportes. La intervención del último
estudio se llevó a cabo con remeras, pero no podemos afirmar
que los resultados sean aplicables a otro tipo de deportes.

EFFECTS OF THE MENSTRUAL CYCLE PHASES ON DIFFERENT STRENGTH MANIFESTATIONS
149
Aumentar el número de ciclos menstruales consecutivos.
Realizar las mediciones en varios ciclos seguidos puede servir
para conocer la variabilidad de los sujetos y poder dar mayor
consistencia a los resultados.


Chapter 6. Bibliography

Al-Jefout, M., Seham, A. F., Jameel, H., Randa, A. Q., Ola, A. M., Oday, A.
M., & Luscombe, G. (2015). Dysmenorrhea: prevalence and impact
on quality of life among young adult jordanian females. Journal of
Pediatric and Adolescent Gynecology, 28(3), 173–185.
https://doi.org/10.1016/j.jpag.2014.07.005
Astorino, T. A., Willey, J., Kinnahan, J., Larsson, S. M., Welch, H., &
Dalleck, L. C. (2005). Elucidating determinants of the plateau in
oxygen consumption at VO2max. British Journal of Sports Medicine,
39(9), 655–60; discussion 660.
https://doi.org/10.1136/bjsm.2004.016550
Baker, D., Nance, S., & Moore, M. (2001a). The load that maximizes the
average mechanical power output during jump squats in power-
trained athletes. The Journal of Strength and Conditioning Research,
15(1), 20–24. https://doi.org/10.1519/1533-
4287(2001)015<0092:TLTMTA>2.0.CO;2
Baker, D., Nance, S., & Moore, M. (2001b). The load that maximizes the
average mechanical power output during jump squats in power-
trained athletes. The Journal of Strength and Conditioning Research,
15(1), 92–97. https://doi.org/10.1519/1533-
4287(2001)015<0092:TLTMTA>2.0.CO;2
Batterham, A. M., & Hopkins, W. G. (2006). Making meaningful
inferences about magnitudes. International Journal of Sport
Physiology and Performance, 1(1), 50–57.

CHAPTER 6: BIBLIOGRAPHY
154
Beidleman, B. A., Rock, P. B., Muza, S. R., Fulco, C. S., Forte, V. A., &
Cymerman, A. (1999). Exercise VE and physical performance at
altitude are not affected by menstrual cycle phase. Journal of
Applied Physiology, 86(5), 1519–26.
Bemben, D. A., Salm, P. C., & Salm, A. J. (1995). Ventilatory and blood
lactate responses to maximal treadmill exercise during the
menstrual cycle. Journal of Sport Medicine and Physical Fitness,
35(4), 257–261.
Bernardes, R. P., & Radomski, M. W. (1998). Growth hormone responses
to continuous and intermittent exercise in females under oral
contraceptive therapy. European Journal of Applied Physiology and
Occupational Physiology, 79(1), 24–9.
https://doi.org/10.1007/s004210050468
Borg, G. (1990). Psychophysical scaling with applications in physical work
and the perception of exertion. Scandinavian Journal of Work,
Environment and Health, 16, 55–58.
https://doi.org/10.5271/sjweh.1815
Braun, B., & Horton, T. (2001). Endocrine regulation of exercise substrate
utilization in women compared to men. Exercise Os Sport Science,
29(4), 149–154.
Brzycki, M. (1993). Strength testing-predicting a one-rep max from reps-
to-fatigue. The Journal of Physical Education, Recreation and Dance,
64(1), 88–90. https://doi.org/10.1080/07303084.1993.10606684
EFFECTS OF THE MENSTRUAL CYCLE PHASES ON DIFFERENT STRENGTH MANIFESTATIONS
155
Bushman, B., Masterson, G., & Nelsen, J. (2006). Anaerobic power
performance and the menstrual cycle : eumenorrheic and oral
contraceptive users. Journal of Sport Medicine and Physical Fitness,
46(1), 132–137.
Carson, J. A., & Manolagas, S. C. (2015). Effects of sex steroids on bones
and muscles: Similarities, parallels, and putative interactions in
health and disease. Bone, 80, 67–78.
https://doi.org/10.1016/j.bone.2015.04.015
Castillo, F., Valverde, T., Morales, A., Pérez-Guerra, A., de León, F., &
García-Manso, J. M. (2012). Maximum power, optimal load and
optimal power spectrum for power training in upper-body (bench
press). Revista Andaluza de Medicina Del Deporte, 5(1), 18–27.
https://doi.org/10.1016/S1888-7546(12)70005-9
Cervelló, E., Peruyero, F., Montero, C., González-Cutre, D., Beltrán-
Carrillo, V. J., & Moreno-Murcia, J. A. (2014). Exercise, psychological
well-being, sleep quality and situational motivation in physical
education students. Cuadernos de Psicología Del Deporte, 14(3),
31–38.
Cockerill, I. M., Nevill, A. M., & Byrne, N. C. (1992). Mood, mileage and
the Menstrual Cycle. British Journal of Sports Medicine, 26(3), 145–
150. https://doi.org/10.1016/S0140-6736(49)91265-9
Cohen, J. (1988). The concepts pf power analysis. In Statistical power
analysis for the behavioral sciences. Hillsdale (NJ): Lawrence
Erlbaum Associates (pp. 1–18).
CHAPTER 6: BIBLIOGRAPHY
156
Constantini, N. W., Dubnov, G., & Lebrun, C. M. (2005). The menstrual
cycle and sport performance. Clinics in Sports Medicine, 24(2), e51–
e82. https://doi.org/10.1016/j.csm.2005.01.003
Cormie, P., Mccaulley, G. O., Triplett, N. T., & Mcbride, J. M. (2007).
Optimal loading for maximal power output during lower-body
resistance exercises. Medicine and Science in Sports and Exercise,
39(2), 340–349.
https://doi.org/10.1249/01.mss.0000246993.71599.bf
Cormie, P., McGuigan, M. R., & Newton, R. U. (2011). Developing
maximal neuromuscular power. Part 2-training considerations for
imporving maximal power production. Sports Medicine, 41(2), 125–
146. https://doi.org/10.2165/11536850-000000000-00000
Davies, B. N., Elford, J. C., & Jamieson, K. F. (1991). Variations in
performance in simple muscle tests at different phases of the
menstrual cycle. The Journal of Sports Medicine and Physical
Fitness, 31(4), 532–537.
Dombovy, M. L., Bonekat, H. W., Williams, T. J., & Staats, B. A. (1987).
Exercise performance and ventilatory response in the menstrual
cycle. Medicine and Science in Sports and Exercise, 19(2), 111–7.
EFFECTS OF THE MENSTRUAL CYCLE PHASES ON DIFFERENT STRENGTH MANIFESTATIONS
157
Dugan, E. L., Doyle, T. L. A., Humphries, B., Hasson, C. J., & Newton, R. U.
(2004). Determining the optimal load for jump squats: a review of
methods and calculations. Journal of Strength & Conditioning
Research (Allen Press Publishing Services Inc.), 18(3), 668–674.
https://doi.org/10.1519/1533-
4287(2004)18<668:DTOLFJ>2.0.CO;2
Ekenros, L., Hirschberg, A. L., Heijne, A., & Fridén, C. (2013). Oral
contraceptives do not affect muscle strength and hop performance
in active women. Clinical Journal of Sport Medicine : Official Journal
of the Canadian Academy of Sport Medicine, 23(3), 202–7.
https://doi.org/10.1097/JSM.0b013e3182625a51
Ellis, G. S., Lanza-Jacoby, S., Gow, A., & Kendrick, Z. V. (1994). Effects of
estradiol on lipoprotein lipase activity and lipid availability in
exercised male rats. Journal of Applied Physiology, 77(1).
Enns, D. L., Iqbal, S., & Tiidus, P. M. (2008). Oestrogen receptors mediate
oestrogen-induced increases in post-exercise rat skeletal muscle
satellite cells. Acta Physiologica, 194(1), 81–93.
https://doi.org/10.1111/j.1748-1716.2008.01861.x
Enns, D. L., & Tiidus, P. M. (2008). Estrogen influences satellite cell
activation and proliferation following downhill running in rats.
Journal of Applied Physiology (Bethesda, Md. : 1985), 104(2), 347–
353. https://doi.org/10.1152/japplphysiol.00128.2007
CHAPTER 6: BIBLIOGRAPHY
158
Fernandez-Fernandez, J., Sanz-Rivas, D., & Moya, M. (2016). The effects
of 8-week plyometric training on physical performance in young
tennis players. Pediatric Exercise Science, 28, 77–86.
Fridén, C., Hirschberg, A. L., & Saartok, T. (2003). Muscle strength and
endurance do not significantly vary across 3 phases of the
menstrual cycle in moderately active premenopausal women.
Clinical Journal of Sport Medicine : Official Journal of the Canadian
Academy of Sport Medicine, 13(4), 238–241.
https://doi.org/10.1097/00042752-200307000-00007
Fridén, C., Hirschberg, A. L., Saartok, T., & Renström, P. (2006). Knee joint
kinaesthesia and neuromuscular coordination during three phases
of the menstrual cycle in moderately active women. Knee Surgery,
Sports Traumatology, Arthroscopy : Official Journal of the ESSKA,
14(4), 383–389. https://doi.org/10.1007/s00167-005-0663-4
Fridén, C., Saartok, T., Bäckström, C., Leanderson, J., & Rendström, P.
(2003). The influence of premenstrual symptoms on postural
balance and kinesthesia during the menstrual cycle. Gynecological
Endocrinology, 17(6), 433–440.
https://doi.org/10.1080/09513590312331290358
Fry, A. C. (2004). The role of resistance exercise intensity on muscle fiber
adaptation. Sports Medicine., 34(10), 663–669.
https://doi.org/10.2165/00007256-200434100-00004

EFFECTS OF THE MENSTRUAL CYCLE PHASES ON DIFFERENT STRENGTH MANIFESTATIONS
159
Fuentes, I., Balaguer, I., Meliá, J. L., & García-Merita, M. (1995). Forma
abreviada del perfil de Estados de Ánimo (POMS). In V Congreso
Nacional de Psicología de la Actividad Física y el Deporte. Valencia:
Univerisdad de Valencia (pp. 19–26).
Gabbet, T., Kelly, J., & Pezet, T. (2007). Relationship between physical
fitness and playing ability in rugby league players. Journal of
Strength and Conditioning Research, 21(4), 1126–1133.
https://doi.org/10.1519/R-20936.1
Gamberale, F., Strindberg, L., & Wahlberg, I. (1975). Female work
capacity during the menstrual cycle: physiological and psychological
reactions. Scandinavian Journal of Work, Environment & Health,
1(2), 120–7. https://doi.org/10.5271/sjweh.2855
Genezzani, A. R., Lemarchand-Béraud, T., Aubert, M. L., Flber, J. P.,
Muller, A., Lavanchy, M., & Gomez, J. (1975). Pattern of plasma
ACTH, hGH, and cortisol during menstrual cycle. The Journal of
Clinical Endocrinology & Metabolism, 41(3), 431–437.
https://doi.org/10.1210/jcem-41-3-431
Giacomoni, M., Bernard, T., Gavarry, O., Altare, S., & Falgairette, G.
(2000). Influence of the menstrual cycle phase and menstrual
symptoms on maximal anaerobic performance. Medicine & Science
in Sports & Exercise, 32(2), 486–492.
https://doi.org/10.1097/00005768-200002000-00034
CHAPTER 6: BIBLIOGRAPHY
160
Gleeson, H. K., & Shalet, S. M. (2005). GH responsiveness varies during
the menstrual cycle. European Journal of Endocrinology / European
Federation of Endocrine Societies, 153(6), 775–779.
https://doi.org/10.1530/eje.1.02037
Godsland, I. F. (1996). The influence of female sex steroids on glucose
metabolism and insulin action. Journal of Internal Medicine.
Supplement, 738, 1–60.
González-Badillo, J. J., & Sánchez-Medina, L. (2010). Movement velocity
as a measure of loading intensity in resistance training.
International Journal of Sports Medicine, 31(5), 347–352.
https://doi.org/10.1055/s-0030-1248333
Hackney, A. C., Muoio, D., & Meyer, W. R. (2000). The Effect of sex
steroid hormones on substrate oxidation during prolonged
submaximal exercise in women. The Japanese Journal of Physiology,
50(5), 489–94.
Higgs, S. L., & Robertson, L. A. (1981). Cyclic variations in perceived
exertion and physical work capacity in females. Canadian Journal of
Applied Sport Sciences., 6(4), 191–196.
Horvath, S. M., & Drinkwater, B. L. (1982). Thermoregulation and the
menstrual cycle. Aviation, Space, and Environmental Medicine,
53(8), 790–794.
EFFECTS OF THE MENSTRUAL CYCLE PHASES ON DIFFERENT STRENGTH MANIFESTATIONS
161
Howley, E. T., Bassett, D. R., & Welch, H. G. (1995). Criteria for maximal
oxygen uptake: review and commentary. Medicine and Science in
Sports and Exercise, 27(9), 1292–301.
Isacco, L., Duché, P., & Boisseau, N. (2012). Influence of Hormonal Status
on Substrate Utilization at Rest and during Exercise in the Female
Population. Sports Medicine, 42(4), 327–342.
Isacco, L., Thivel, D., Pereira, B., Duclos, M., & Boisseau, N. (2014).
Maximal fat oxidation, but not aerobic capacity, is affected by oral
contraceptive use in young healthy women. European Journal of
Applied Physiology, 115, 937–945.
https://doi.org/10.1007/s00421-014-3075-7
Izquierdo, M., Häkkinen, K., Antón, A., Garrues, M., Ibañez, J., Ruesta, M.,
& Gorostiaga, E. M. (2001). Maximal strength and power,
endurance performance, and serum hormones in middle-aged and
elderly men. Medicine and Science in Sports and Exercise, 33(9),
1577–1587. https://doi.org/10.1097/00005768-200109000-00022
Izquierdo, M., Häkkinen, K., Gonzalez-Badillo, J. J., Ibáñez, J., &
Gorostiaga, E. M. (2002). Effects of long-term training specificity on
maximal strength and power of the upper and lower extremities in
athletes from different sports. European Journal of Applied
Physiology, 87(3), 264–271. https://doi.org/10.1007/s00421-002-
0628-y
CHAPTER 6: BIBLIOGRAPHY
162
Janse de Jonge, X. A. K. (2003). Effects of the menstrual cycle on exercise
performance. Sports Medicine, 33(11), 833–851.
https://doi.org/10.2165/00007256-200333110-00004
Julian, R., Hecksteden, A., Fullagar, H. H. K., & Meyer, T. (2017). The
effects of menstrual cycle phase on physical performance in female
soccer players. PLoS ONE, 12(13), 1–13.
https://doi.org/10.1371/journal.pone.0173951
Jurkowski, J. E., Jones, N. L., Toews, C. J., & Sutton, J. R. (1981). Effects of
menstrual cycle on blood lactate, O2 delivery, and performance
during exercise. Journal of Applied Physiology: Respiratory,
Environmental and Exercise Physiology, 51(6), 1493–9.
Juul, A., Scheike, T., Pedersen, A. T., Main, K. M., Andersson, A. M.,
Pedersen, L. M., & Skakkebaek, N. E. (1997). Changes in serum
concentrations of growth hormone, insulin, insulin-like growth
factor and insulin-like growth factor-binding proteins 1 and 3 and
urinary growth hormone excretion during the menstrual cycle.
Human.Reproduction., 12(10), 2123–2128.
Kahlert, S., Grohé, C., Karas, R. H., Löbbert, K., Neyses, L., & Vetter, H.
(1997). Effects of estrogen on skeletal myoblast growth.
Biochemical and Biophysical Research Communications, 232(2),
373–378. https://doi.org/10.1006/bbrc.1997.6223
EFFECTS OF THE MENSTRUAL CYCLE PHASES ON DIFFERENT STRENGTH MANIFESTATIONS
163
Kawamori, N., Crum, A. J., Blumert, P. A., Kulik, J. R., Childers, J. T., Wood,
J. A., … Haff, G. G. (2005). Influence of different relative intensities
on power output during the hang power clean: identification of the
optimal load. Journal of Strength and Conditioning Research, 19(3),
698–708.
Kawamori, N., & Haff, G. G. (2004). The optimal training load for the
development of muscular power. Journal of Strength and
Conditioning Research, 18(3), 675–684.
https://doi.org/10.1519/1533-4287(2004)18<675
Knudson, D. V. (2009). Correctiong the use of the term ‘Power’ in the
strength and conditioning literature. Journal of Strength and
Conditioning Research, 23(6), 1902–1908.
https://doi.org/10.1227/01.NEU.0000297070.90551.DF
Kobori, M. M. D., & Yamakuro, T. M. D. (1889). Effects of gonadectomy
and estrogen administration on rat skeletal muscle. Clinic
Orthopedic and Related Research, 243, 306–311.
Kraemer, R. R., Francois, M., & Castracane, V. D. (2012). Estrogen
mediation of hormone responses to exercise. Metabolism: Clinical
and Experimental, 61(10), 1337–1346.
https://doi.org/10.1016/j.metabol.2012.03.009
Labour, D., & Marshall, J. (1963). Thermal changes in the normal
menstrual cycle. British Medical Journal., 1(2), 102–104.

CHAPTER 6: BIBLIOGRAPHY
164
Larroy, C., Crespo, M., & Meseg, C. (2001). Dismenorrea funcional en la
Comunidad Autónoma de Madrid : estudio de la prevalencia en
función de la edad. Rev. Soc. Esp. Dolor, 8(1), 11–22.
Lebrun, C. M. (1993). Effect of the different phases of the menstrual
cycle and oral contraceptives on athletic performance. Sports
Medicine, 16(6), 400–430.
Lebrun, C. M., McKenzie, D., C. Prior, J., & E. Taunton, J. (1994). Effects
of menstrual cycle phase on athletic performance. Medicine &
Science in Sports & Exercise, 27(3), 437–444.
Leung, K.-C., Johannsson, G., Leong, G. M., & Ho, K. K. Y. (2004). Estrogen
regulation of growth hormone action. Endocrine Reviews, 25(5),
693–721. https://doi.org/10.1210/er.2003-0035
Lynch, N. J., & Nimmo, M. A. (1998). Effects of menstrual cycle phase and
oral contraceptive use on intermittent high-intensity exercise.
Medicine & Science in Sports & Exercise, 78, 565–572.
https://doi.org/10.1097/00005768-199805001-01462
Markofski, M. M., & Braun, W. A. (2014). Influence of menstrual cycle on
indices of contraction-induced muscle damage. Journal of Strength
and Conditioning Research, 28(9), 2649–2656.

EFFECTS OF THE MENSTRUAL CYCLE PHASES ON DIFFERENT STRENGTH MANIFESTATIONS
165
Masterson, G. (1999). The impact of menstrual phases on anaerobic
power performance in collegiate women. The Journal of Strength
and Conditioning Research, 13(4), 325–329.
https://doi.org/10.1519/1533-
4287(1999)013<0325:TIOMPO>2.0.CO;2
Matsuo, T., Saitoh, S., & Suzuki, M. (1999). Effects of the menstrual cycle
on excess postexercise oxygen consumption in healthy young
women. Metabolism: Clinical and Experimental, 48(3), 275–7.
McBide, J. M., Triplett-McBride, T., Davie, A., & Newton, R. U. (2002). The
effect of veavy- Vs. light-load jump squats on the development of
strength, power, and speed. The Journal of Strength and
Conditioning Research, 16(1), 75. https://doi.org/10.1519/1533-
4287(2002)016<0075:TEOHVL>2.0.CO;2
McBride, J. M., Triplett-McBride, T., Davie, A., & Newton, R. U. (1999). A
comparison of strength and power characteristics between power
lifters, olympic lifters, and sprinters. Journal of Strength and
Conditioning Research, 13(1), 58–66.
https://doi.org/10.1519/1533-
4287(1999)013<0058:ACOSAP>2.0.CO;2
McClung, J. M., Davis, J. M., & Carson, J. a. (2007). Ovarian hormone
status and skeletal muscle inflammation during recovery from
disuse in rats. Experimental Physiology, 92(1), 219–32.
https://doi.org/10.1113/expphysiol.2006.035071

CHAPTER 6: BIBLIOGRAPHY
166
McClung, J. M., Davis, J. M., Wilson, M. a, Goldsmith, E. C., & Carson, J.
a. (2006). Estrogen status and skeletal muscle recovery from disuse
atrophy. Journal of Applied Physiology (Bethesda, Md. : 1985),
100(6), 2012–23. https://doi.org/10.1152/japplphysiol.01583.2005
McCracken, M., Ainsworth, B., & Hackney, A. C. (1994). Effects of the
menstrual cycle phase on the blood lactate responses to exercise.
European Journal of Applied Physiology and Occupational
Physiology, 69(2), 174–5.
Miller, P., & Soules, M. (1996). The usefulness of a urinary LH Kit for
ovulation prediction during menstrual cycles of normal women.
Obstetrics & Gynecology, 87(1), 13–17.
https://doi.org/10.1016/0029-7844(95)00352-5
Miskec, C. M., Potteiger, J. A., Nau, K. L., & Zebas, C. J. (1997). Do varying
environmental and menstrual cycle conditions affect anaerobic
power output in female athletes? Journal of Strength and
Conditioning Research, 11(4), 219–223.
Moir, G., Button, C., Glaister, M., & STone, M. H. (2004). Influence of
familiarization on the reliability of vertical jump and acceleration
sprinting performance in physically active men. The Journal of
Strength and Conditioning Research, 18(2), 276–280.
Möller-Nielsen, J., & Hammar, M. (1989). Women’s soccer injuries in
relation to the menstrual cycle and oral contraceptive use.
Medicine and Science in Sports and Exercise, 21(2), 126–129.
EFFECTS OF THE MENSTRUAL CYCLE PHASES ON DIFFERENT STRENGTH MANIFESTATIONS
167
Oosthuyse, T., & Bosch, A. N. (2010). The effect of the menstrual cycle
on exercise metabolism: implications for exercise performance in
eumenorrhoeic women. Sports Medicine, 40(3), 207–227.
https://doi.org/10.2165/11317090-000000000-00000
Pallavi, L. C., Souza, U. J. D., & Shivaprakash, G. (2017). Assessment of
musculoskeletal strength and levels of fatigue during different
phases of menstrual cycle in young adults. Journal of Clinical and
Diagnostic Research, (September 2012), 11–13.
https://doi.org/10.7860/JCDR/2017/24316.9408
Pareja-Blanco, F., Rodríguez-Rosell, D., Sánchez-Medina, L., Sanchis-
Moysi, J., Dorado, C., Mora-Custodio, R., … González-Badillo, J. J.
(2016). Effects of velocity loss during resistance training on athletic
performance, strength gains and muscle adaptations. Scandinavian
Journal of Medicine and Science in Sports, 41(3), 431–437.
https://doi.org/10.1111/sms.12678
Phillips, S. K., Sanderson, a G., Birch, K., Bruce, S. a, & Woledge, R. C.
(1996). Changes in maximal voluntary force of human adductor
pollicis muscle during the menstrual cycle. The Journal of
Physiology, 496(2), 551–557.
https://doi.org/10.1113/jphysiol.1996.sp021706
Pivarnik, J. M., Marichal, C. J., Spillman, T., & Morrow, J. R. (1992).
Menstrual cycle phase affects temperature regulation during
endurance exercise. Journal of Applied Physiology, 72(2).

CHAPTER 6: BIBLIOGRAPHY
168
Redman, L. M., & Weatherby, R. P. (2004). Measuring performance
during the menstrual cycle: a model using oral contraceptives.
Medicine and Science in Sports and Exercise, 36(1), 130–136.
https://doi.org/10.1249/01.MSS.0000106181.52102.99
Reis, E., Frick, U., & Schmidtbleicher, D. (1995). Frequency variations of
strength training sessions triggered by the phases of the menstrual
cycle. International Journal of Sports Medicine, 16(8), 545–550.
https://doi.org/10.1055/s-2007-973052
Rhea, M. R. (2004). Determining the magnitude of treatment effects in
strength training research through the use of the effect size. The
Journal of Strength and Conditioning Research, 18(4), 918.
https://doi.org/10.1519/14403.1
Sakamaki-Sunaga, M., Min, S., Kamemoto, K., & Okamoto, T. (2015).
Effects of menstrual phase-dependent resistance training
frequency on muscular hypertrophy and strength. Journal of
Strength and Conditioning Research, 1.
https://doi.org/10.1519/JSC.0000000000001250
Sakamaki-Sunaga, M., Min, S., Kamemoto, K., & Okamoto, T. (2016).
Effects of menstrual phase-dependent resistance training
frequency on muscular hypertrophy and strength. Journal of
Strength and Conditioning Research, 30(6), 1727–1734.
https://doi.org/10.1519/JSC.0000000000001250
EFFECTS OF THE MENSTRUAL CYCLE PHASES ON DIFFERENT STRENGTH MANIFESTATIONS
169
Sakamaki, M., Yasuda, T., & Abe, T. (2012). Comparison of low-intensity
blood flow-restricted training-induced muscular hypertrophy in
eumenorrheic women in the follicular phase and luteal phase and
age-matched men. Clinical Physiology and Functional Imaging,
32(3), 185–191. https://doi.org/10.1111/j.1475-
097X.2011.01075.x
Salonia, A., Pontillo, M., Nappi, R. E., Zanni, G., Fabbri, F., Scavini, M., …
Montorsi, F. (2008). Menstrual cycle‐related changes in circulating
androgens in healthy women with self‐reported normal sexual
function. The Journal of Sexual Medicine, 5(4), 854–863.
https://doi.org/10.1111/j.1743-6109.2008.00791.x
Sarwar, R., Niclos, B. B., & Rutherford, O. M. (1996). Changes in muscle
strength, relaxation rate and fatiguability during the human
menstrual cycle. The Journal of Physiology, 493(1), 267–272.
Sipavičiene, S., Daniusevičiute, L., Kliziene, I., Kamandulis, S., &
Skurvydas, A. (2013). Effects of estrogen fluctuation during the
menstrual cycle on the response to stretch-shortening exercise in
females. BioMed Research International, 2013.
https://doi.org/10.1155/2013/243572
Sleivert, G., & Taingahue, M. (2004). The relationship between maximal
jump-squat power and sprint acceleration in athletes. European
Journal of Applied Physiology, 91(1), 46–52.
https://doi.org/10.1007/s00421-003-0941-0

CHAPTER 6: BIBLIOGRAPHY
170
Stephenson, L. A., Kolka, M. A., & Wilkerson, J. E. (1982). Perceived
exertion and anaerobic threshold during the menstrual cycle.
Medicine and Science in Sports and Exercise, 14(3), 218–222.
Sung, E., Han, A., Hinrichs, T., Vorgerd, M., Manchado, C., & Platen, P.
(2014). Effects of follicular versus luteal phase-based strength
training in young women. SpringerPlus, 3, 668.
https://doi.org/10.1186/2193-1801-3-668
Tenan, M. S., Hackney, A. C., & Griffin, L. (2016). Maximal force and
tremor changes across the menstrual cycle. European Journal of
Applied Physiology, 116(1), 153–160.
https://doi.org/10.1007/s00421-015-3258-x
Tonnessen, E., Shalfawi, S. A. I., Haugen, T., & Enoksen, E. (2011). The
effect of 40-m repeated sprint training on maximum sprinting
speed, repeated sprint speed endurance, vertical jump, and aerobic
capacity in young elite male soccer players. The Journal of Strength
and Conditioning Research Conditioning Research, 25(9), 2364–
2370.
Torbjörn, A., Hume, K., Minors, D., & Waterhouse, J. (1994). The
subjective meaninf of good sleep, an intraindividual approach using
the karolinska sleep diary. Perceptual and Motor Skills, 79, 287–296.
Tsampoukos, A., Peckham, E. A., James, R., & Nevill, M. E. (2010). Effect
of menstrual cycle phase on sprinting performance. European
Journal of Applied Physiology, 109(4), 659–667.
https://doi.org/10.1007/s00421-010-1384-z

EFFECTS OF THE MENSTRUAL CYCLE PHASES ON DIFFERENT STRENGTH MANIFESTATIONS
171
Warren, M. P., & Shangold, M. M. (1997). Sports gynecology: problems
and care of the athletic female. Blackwell Science.
Wiecek, M., Szymura, J., Maciejczyk, M., Cempla, J., & Szygula, Z. (2016).
Effect of sex and menstrual cycle in women on starting speed,
anaerobic endurance and muscle power. Acta Physiologica
Hungarica, 103(1), 127–32.
https://doi.org/10.1556/036.103.2016.1.13
Wikström-Frisén, L., Boraxbekk, C.-J., & Henriksson-Larsén, K. (2015).
Effects on power, strength and lean body mass of menstrual/oral
contraceptive cycle based resistance training. The Journal of Sports
Medicine and Physical Fitness, 57(1–2), 43–52.
Wisløff, U., Castagna, C., Helgerud, J., Jones, R., & Hoff, J. (2004). Strong
correlation of maximal squat strength with sprint performance and
vertical jump height in elite soccer players. British Journal of Sports
Medicine, 38(3), 285–288.
https://doi.org/10.1136/bjsm.2002.002071


Chapter 7. Annexes.

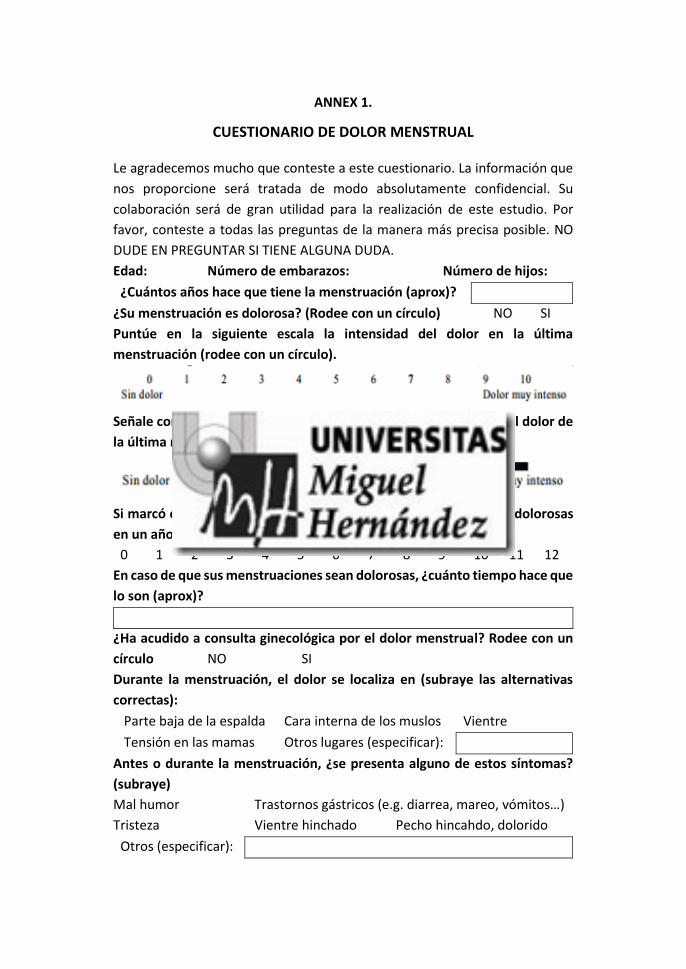
ANNEX 1.
CUESTIONARIO DE DOLOR MENSTRUAL
Le agradecemos mucho que conteste a este cuestionario. La información que
nos proporcione será tratada de modo absolutamente confidencial. Su
colaboración será de gran utilidad para la realización de este estudio. Por
favor, conteste a todas las preguntas de la manera más precisa posible. NO
DUDE EN PREGUNTAR SI TIENE ALGUNA DUDA.
Edad: Número de embarazos: Número de hijos:
¿Cuántos años hace que tiene la menstruación (aprox)?
¿Su menstruación es dolorosa? (Rodee con un círculo) NO SI
Puntúe en la siguiente escala la intensidad del dolor en la última
menstruación (rodee con un círculo).
Señale con una X en la línea siguiente cuál ha sido la intensidad del dolor de
la última menstruación.
Si marcó que su menstruación sí es dolorosa, calcule cuántas son dolorosas
en un año (rodee con un círculo el número).
0 1 2 3 4 5 6 7 8 9 10 11 12
En caso de que sus menstruaciones sean dolorosas, ¿cuánto tiempo hace que
lo son (aprox)?
¿Ha acudido a consulta ginecológica por el dolor menstrual? Rodee con un
círculo NO SI
Durante la menstruación, el dolor se localiza en (subraye las alternativas
correctas):
Antes o durante la menstruación, ¿se presenta alguno de estos síntomas?
(subraye)
Mal humor Trastornos gástricos (e.g. diarrea, mareo, vómitos…)
Tristeza Vientre hinchado Pecho hincahdo, dolorido
Otros (especificar):
Parte baja de la espalda Cara interna de los muslos Vientre
Tensión en las mamas Otros lugares (especificar):
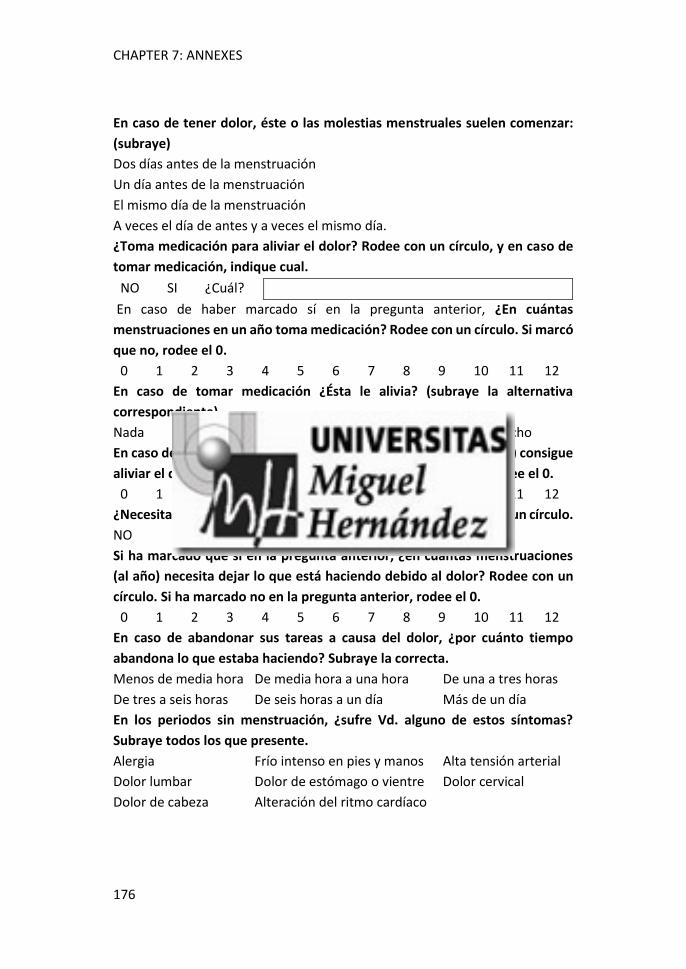
CHAPTER 7: ANNEXES
176
En caso de tener dolor, éste o las molestias menstruales suelen comenzar:
(subraye)
Dos días antes de la menstruación
Un día antes de la menstruación
El mismo día de la menstruación
A veces el día de antes y a veces el mismo día.
¿Toma medicación para aliviar el dolor? Rodee con un círculo, y en caso de
tomar medicación, indique cual.
NO SI ¿Cuál?
En caso de haber marcado sí en la pregunta anterior, ¿En cuántas
menstruaciones en un año toma medicación? Rodee con un círculo. Si marcó
que no, rodee el 0.
0 1 2 3 4 5 6 7 8 9 10 11 12
En caso de tomar medicación ¿Ésta le alivia? (subraye la alternativa
correspondiente).
Nada Un poco Bastante Mucho
En caso de tomar medicación, ¿En cuántas menstruaciones (al año) consigue
aliviar el dolor? Rodee con un círculo. Si no toma medicación, rodee el 0.
0 1 2 3 4 5 6 7 8 9 10 11 12
¿Necesita dejar lo que está haciendo a causa del dolor? Rodee con un círculo.
NO SI
Si ha marcado que sí en la pregunta anterior, ¿en cuántas menstruaciones
(al año) necesita dejar lo que está haciendo debido al dolor? Rodee con un
círculo. Si ha marcado no en la pregunta anterior, rodee el 0.
0 1 2 3 4 5 6 7 8 9 10 11 12
En caso de abandonar sus tareas a causa del dolor, ¿por cuánto tiempo
abandona lo que estaba haciendo? Subraye la correcta.
Menos de media hora De media hora a una hora De una a tres horas
De tres a seis horas De seis horas a un día Más de un día
En los periodos sin menstruación, ¿sufre Vd. alguno de estos síntomas?
Subraye todos los que presente.
Alergia Frío intenso en pies y manos Alta tensión arterial
Dolor lumbar Dolor de estómago o vientre Dolor cervical
Dolor de cabeza Alteración del ritmo cardíaco

EFFECTS OF THE MENSTRUAL CYCLE PHASES ON DIFFERENT STRENGTH MANIFESTATIONS
177
La siguiente tabla muestra los días de un mes. Por favor, señale con una M
en la tabla que día comenzó su última menstruación. Si no lo recuerda
exactamente, indique la fecha aproximada, y los días que duró. Señale
también los síntomas que Vd. sufre, utilizando para cada síntoma el símbolo
que se indica a continuación.
CAMBIOS DE HUMOR = H HINCHAZÓN EN EL VIENTRE = V
HINCHAZÓN EN EL PECHO = P IRRITABILIDAD (MAL HUMOR) = I
DEPRESIÓN = D DOLOR DE CABEZA = C
TRASTORNOS GÁSTRICOS = G
Así, si por ejemplo su menstruación comenzó el día 13, marcará con una x en
la fila de la M en el cuadro que corresponde a ese día, y los siguientes (tanto
como duró la menstruación); si sufrió hinchazón del pecho un día antes y el
mismo día de la menstruación, marcará una señal en los cuadros
correspondientes a los días 12 y 13, en las filas correspondientes al símbolo P;
si además, desde dos días antes hasta dos días después del comienzo de la
menstruación sufrió dolor de cabeza, pondrá una señal en los cuadros
correspondientes a los días 11, 12, 13, 14 y15 en la fila correspondiente al
símbolo C, y así con cualquier síntoma que se haya presentado.
Ahora, por favor, conteste en la tabla siguiente (marcando con una cruz) en
qué días aparecieron la menstruación y los síntomas (si los sufrió), durante el
último mes.
1 2 3 4 5 6 7 8 9 10 11 12 13 14 15 16 17 18 19 20 21 22 23 24 25 26 27 28 29 30 31
M
H
V
P
I
D
C
G

CHAPTER 7: ANNEXES
178
ANNEX 2.
KAROLINSKA SLEEP DIARY.
Con este cuestionario pretendemos conocer la calidad del sueño y que con
ello muestres como has dormido, por lo tanto, es necesario rellenar este
cuestionario justo al despertar para que indiques de forma clara tus
sensaciones. Lee con atención los enunciados y marca con una cruz la casilla
sombreada que corresponda en función de las 5 opciones que ofrece el
cuestionario, para cada una de las 7 preguntas.
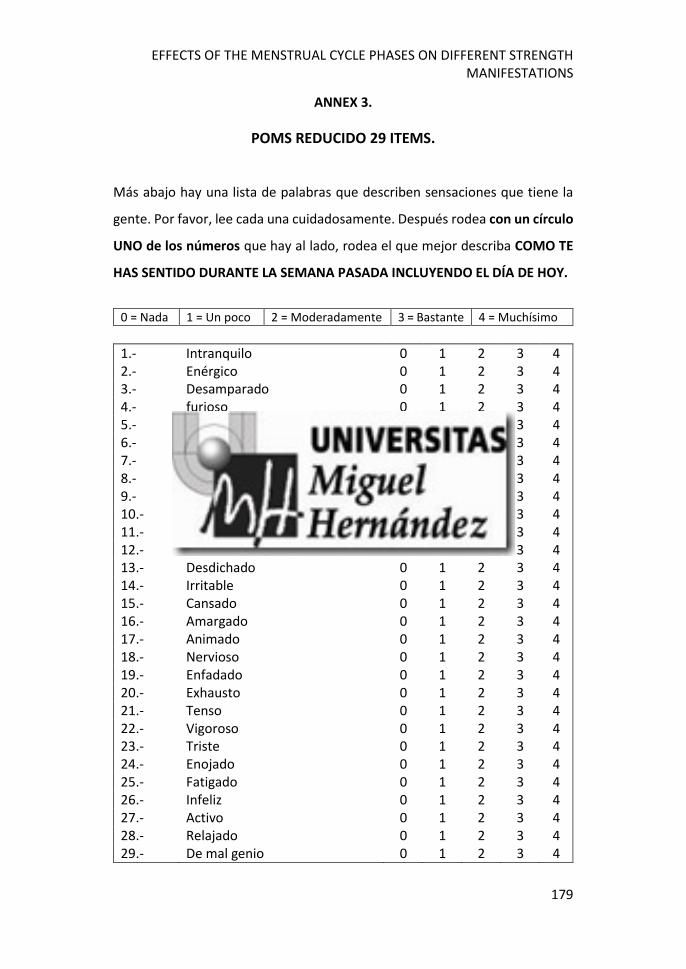
EFFECTS OF THE MENSTRUAL CYCLE PHASES ON DIFFERENT STRENGTH MANIFESTATIONS
179
ANNEX 3.
POMS REDUCIDO 29 ITEMS.
Más abajo hay una lista de palabras que describen sensaciones que tiene la
gente. Por favor, lee cada una cuidadosamente. Después rodea con un círculo
UNO de los números que hay al lado, rodea el que mejor describa COMO TE
HAS SENTIDO DURANTE LA SEMANA PASADA INCLUYENDO EL DÍA DE HOY.
0 = Nada 1 = Un poco 2 = Moderadamente 3 = Bastante 4 = Muchísimo
1.- Intranquilo 0 1 2 3 4 2.- Enérgico 0 1 2 3 4 3.- Desamparado 0 1 2 3 4 4.- furioso 0 1 2 3 4 5.- Sin fuerzas 0 1 2 3 4 6.- Deprimido 0 1 2 3 4 7.- Lleno de Energía 0 1 2 3 4 8.- Inquieto 0 1 2 3 4 9.- Molesto 0 1 2 3 4 10.- Agotado 0 1 2 3 4 11.- Agitado 0 1 2 3 4 12.- Luchador 0 1 2 3 4 13.- Desdichado 0 1 2 3 4 14.- Irritable 0 1 2 3 4 15.- Cansado 0 1 2 3 4 16.- Amargado 0 1 2 3 4 17.- Animado 0 1 2 3 4 18.- Nervioso 0 1 2 3 4 19.- Enfadado 0 1 2 3 4 20.- Exhausto 0 1 2 3 4 21.- Tenso 0 1 2 3 4 22.- Vigoroso 0 1 2 3 4 23.- Triste 0 1 2 3 4 24.- Enojado 0 1 2 3 4 25.- Fatigado 0 1 2 3 4 26.- Infeliz 0 1 2 3 4 27.- Activo 0 1 2 3 4 28.- Relajado 0 1 2 3 4 29.- De mal genio 0 1 2 3 4
CHAPTER 7: ANNEXES
180
ANNEX 4.
ESCALA DE PERCEPCIÓN DEL ESFUERZO CR-10.
0 Nada 0,5 Muy, muy
suave 1 Muy suave 2 Suave 3 Moderado 4 Algo duro 5 Duro 6 7 Muy duro 8 9 10 Muy, muy
duro