Embed Size (px)
Citation preview
AD-A239 036
Technical Document 2071April 1991
Tailoring ShipboardEnvironmentalSpecificationsA Guide for NavyProgram Managers
R. H. Chalmers
DTICbAUGO 8199 D
Approved for public release: dietrIbutlon Is unlimited.
91-06668I~//mllllllHlllllI/l91 7 0,9 o 2
NAVAL OCEAN SYSTEMS CENTERSan Diego, California 92152-5000
J. D. FONTANA, CAPT, USN R. T. SHEARER, ActingCommander Technical Director
ADMINISTRATIVE INFORMATION
This work was performed for the Office of Naval Technology, Arlington, VA22217, under program element 0602234N, accession number DN 306 243.
Released under authority ofR. E. Miller, HeadSupport Engineering Division
LH
CONTENTS
AUTHOR BIOGRAPHICAL DATA ....................................... iv
INTRODUCTION ....................................................... 1
PU RPO SE .......................................................... 1
PAST EFFORTS ..................................................... 1
TAILORING APPROACH OF ThI-HS DOCUMENT ........................ 2
VIBR ATIO N ........................................................... 4
SOURCES OF VIBRATION ........................................... 4
EFFECT OF VIBRATION ON SHIP'S CREW ............................ 5
EFFECT OF VIBRATION ON SHIP'S STRUCTURES .................... 11
EFFECT OF DISTANCE ON TRANSMISSION OF VIBRATIONS .......... 12
VIBRATION MEASUREMENT PROGRAM ............................. 13
Local Vibration Transmission ...................................... 13
M easurement Locations ........................................... 13
D ata Recording .................................................. 17
Additional Data Sources .......................................... 18
Gunboat and Carrier Variations .................................... 18
Hueristic Vibration-Level Formulae ................................. 23DETERMINATION OF VIBRATION REQUIREMENTS ................... 23
Equivalent Techniques ............................................ 24
Approaches to Accelerate Time .................................... 24
RANDOM VIBRATION .............................................. 25
VIBRATION SPECIFICATION ........................................ 34
EQUIPMENT CRITICALITY AND VIBRATION TOLERANCE ............. 34
TEMPERATURE AND HUMIDITY ....................................... 35
MECHANICAL SHOCK ................................................ 45
DISCUSSION AND CONCLUSIONS ..................................... 52
REFE REN CES ........................................................ 53
APPENDIX A: SHIPBOARD VIBRATIONS FOR RUGGEDIZEDEQ U IPM E NT ........................................................ A -1
FIGURES
1. Average peak accelerations at various frequencies at which subjectsperceive vibration .................................................... 6
2. Vibration exposure limits as a function of frequency and exposure time ...... 6
3. Longitudinal whole-body acceleration limits as function of daily exposure
time: fatigue-decreased proficiency boundary ............................. 7
4. Transverse whole-body acceleration limits: fatigue-decreased proficiency ...... 7
5. Transverse whole-body acceleration limits as a function of daily exposure
time: fatigue-decreased proficiency boundary ............................. 8
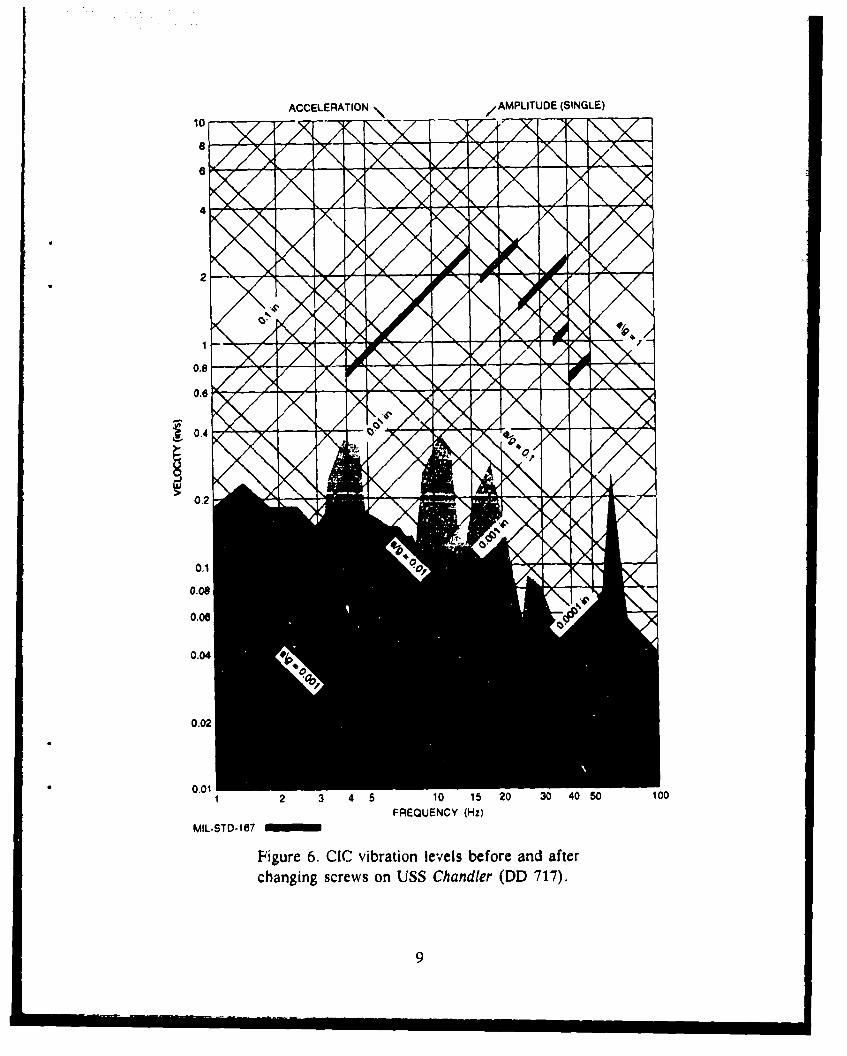
6. CIC vibration levels before and after changing screws on
U SS Chandler (DD 717) ............................................... 9
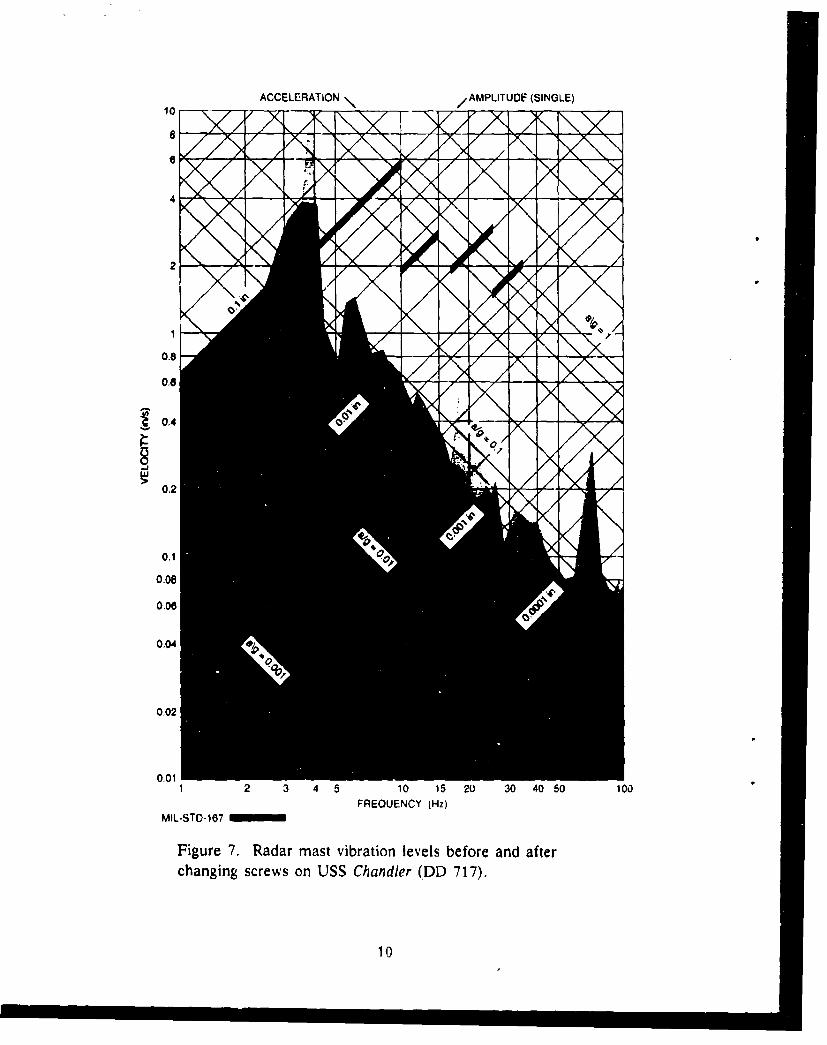
7. Radar mast vibration levels before and after changing screws on
U SS Chandler (DD 717) .............................................. 10
8. Fore and aft vibration levels .......................................... 14
9. Athwartships vibration levels .......................................... 15
10. V ertical vibration levels ............................................. 16
11. Ship categories and major vibration regions ............................ 17
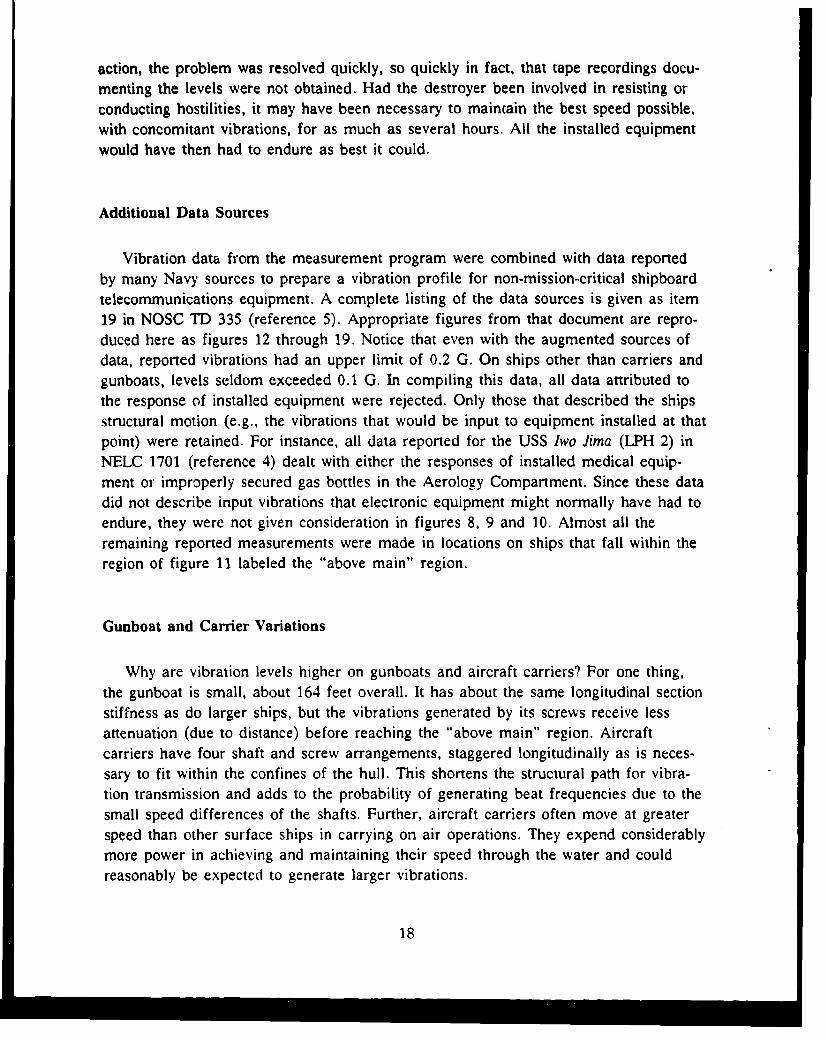
12. CVA-CVAN TELCAM vibration limits ................................. 19
13. DDG-DD TELCAM vibration limits ................................... 19
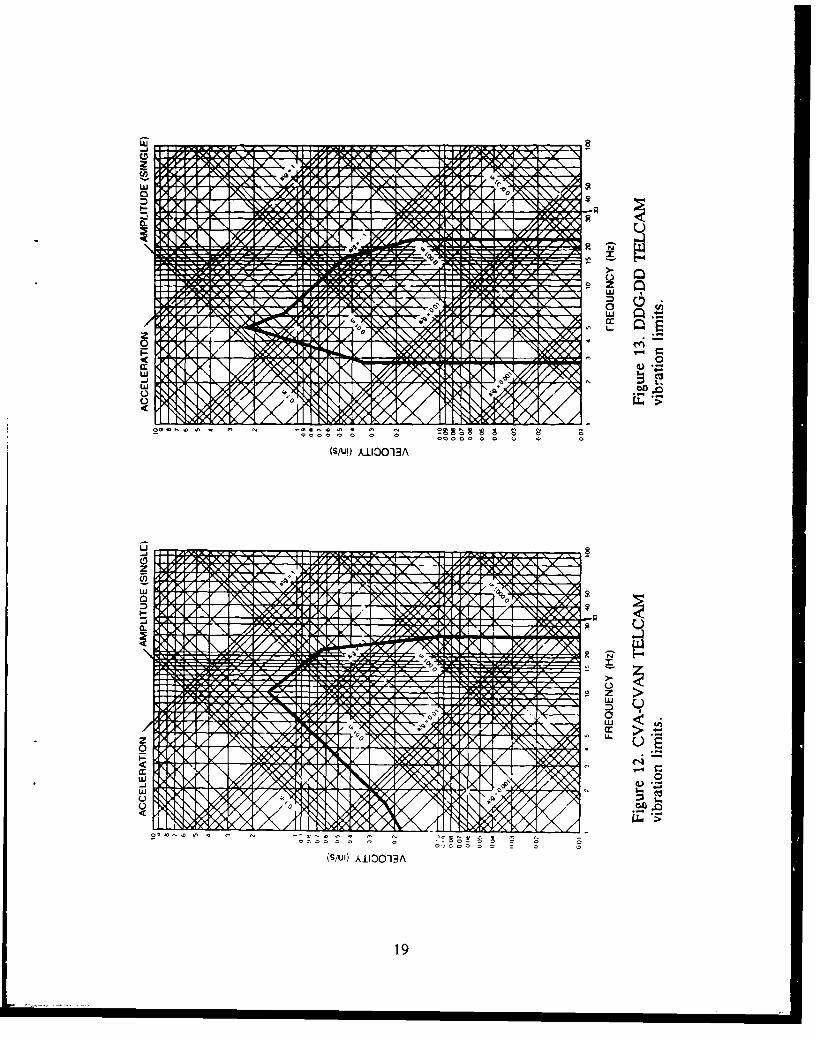
14. DEG-DE TELCAM vibration limits ................................... 20
15. DLG-DLGN TELCAM vibration limits ................................. 20
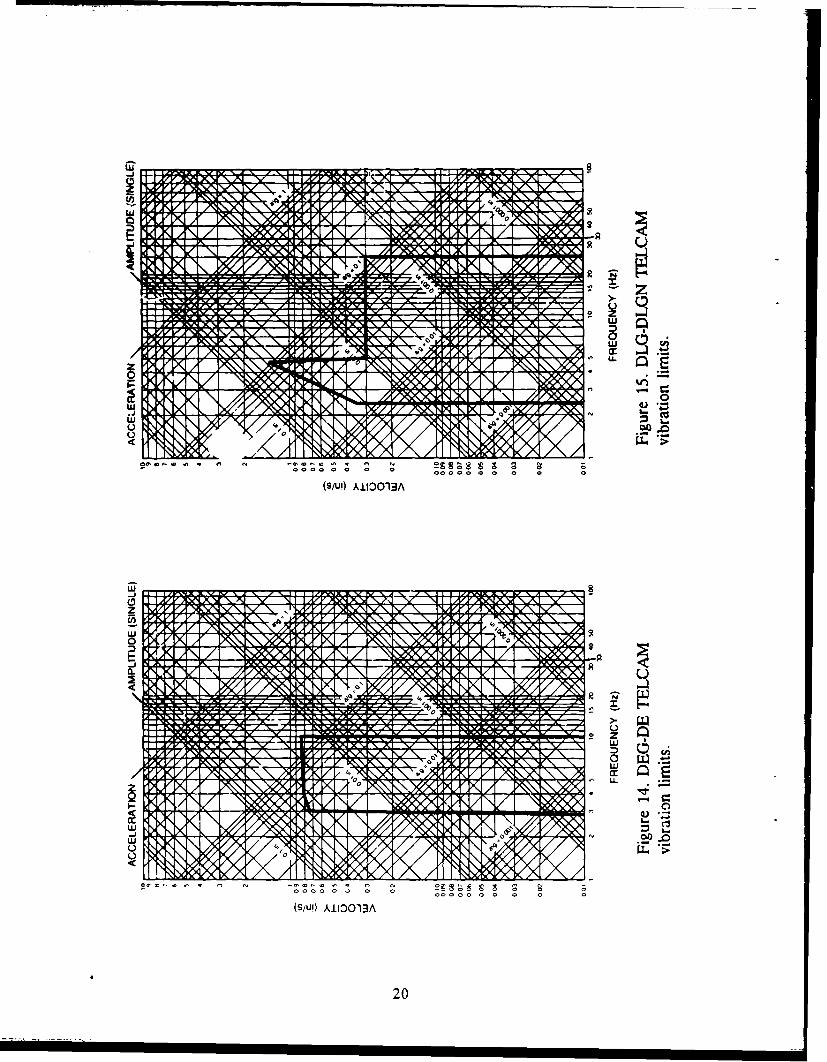
16. LPH TELCAM vibration limits ....................................... 21
17. LST TELCAM vibration limits ....................................... 21
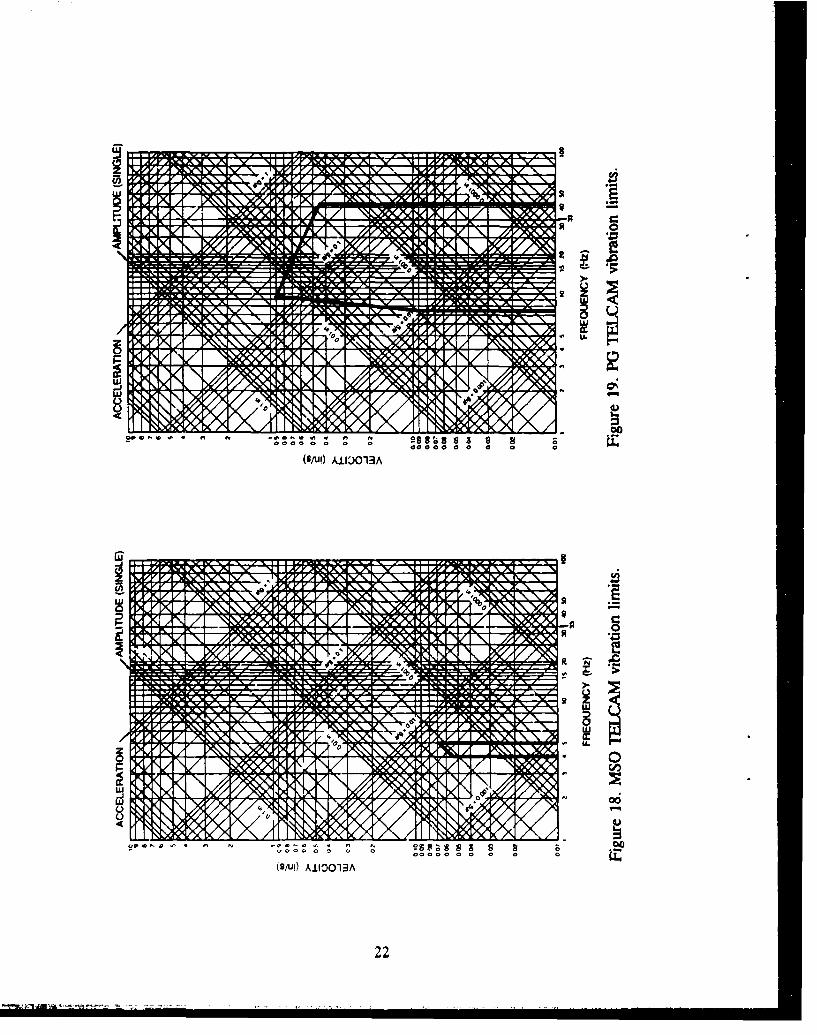
18. M SO TELCAM vibration limits ....................................... 22
19. PG TELCAM vibration limits ........................................ 22
20. Randomness of shipboard vibrations .................................. 27
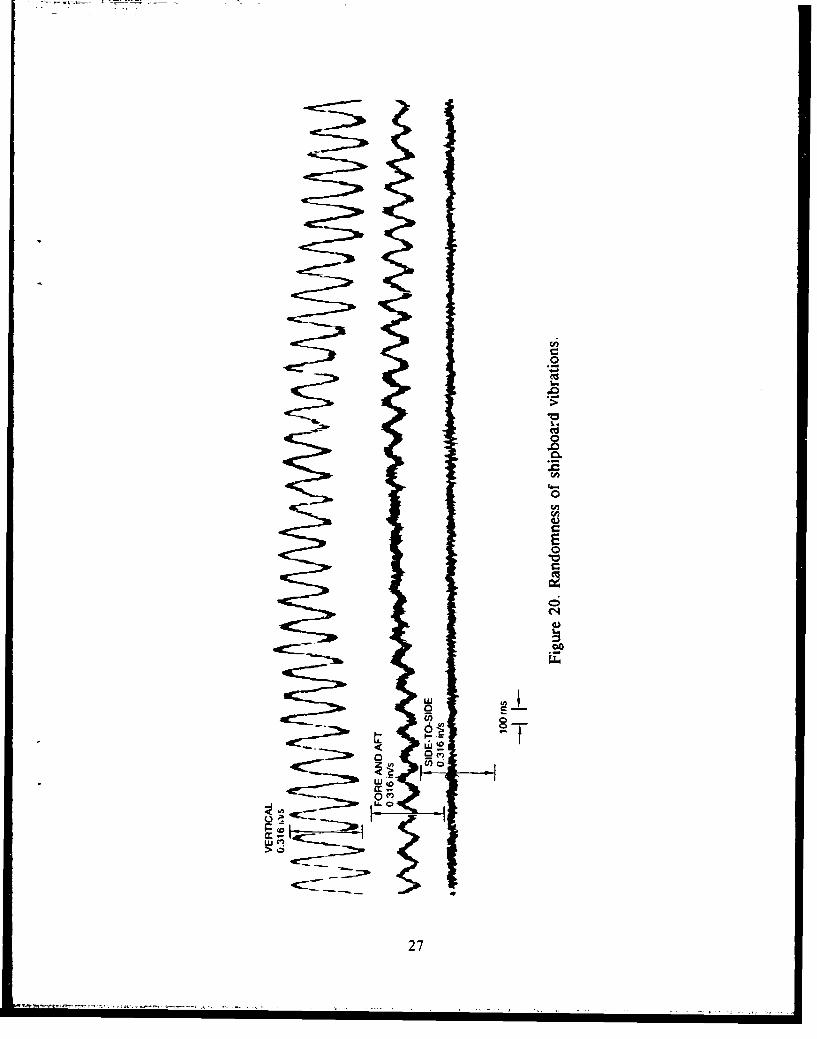
21. Representative acceleration spectral density analysis, PGH 2 .............. 28
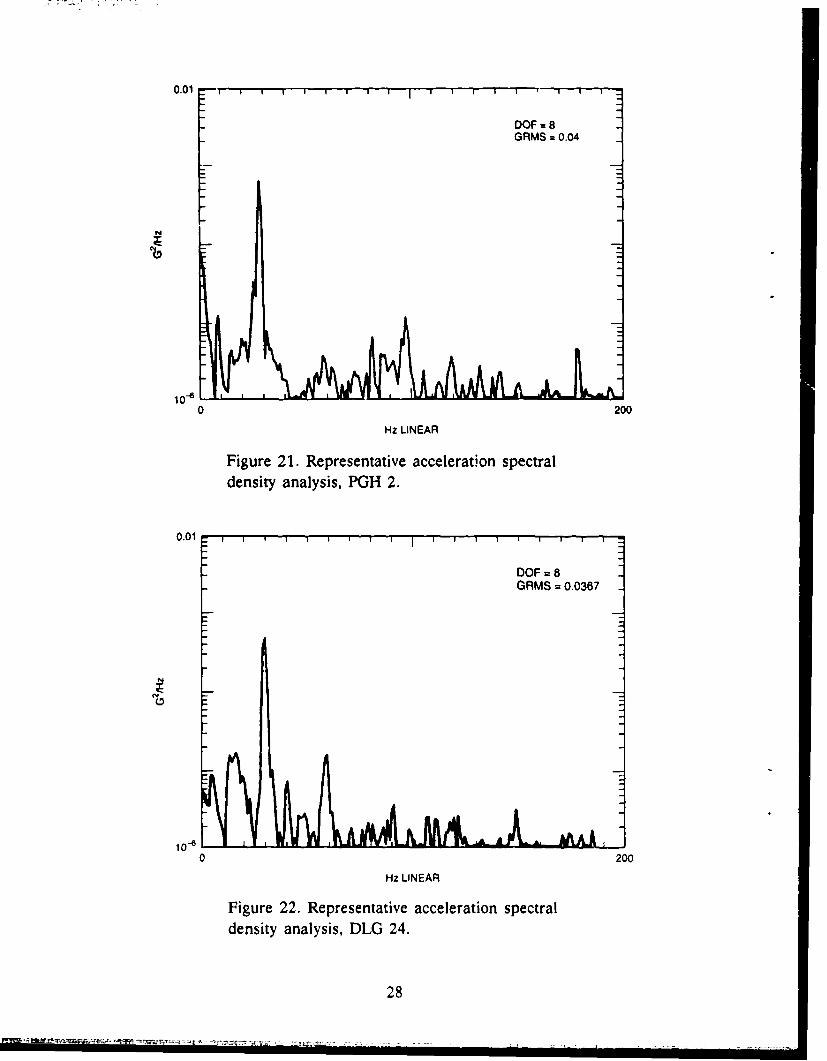
22. Representative acceleration spectral density analysis, DLG 24 ............. 28
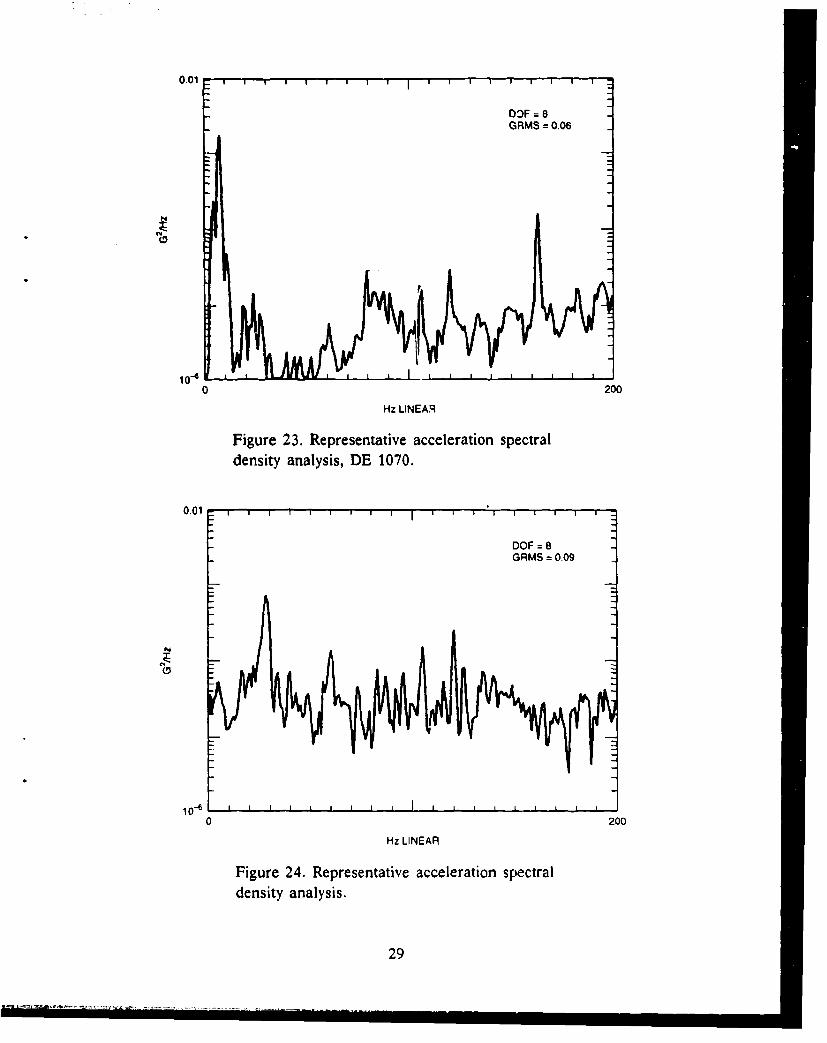
23. Representative acceleration spectral density analysis, DE 1070 ............ 29
24. Representative acceleration spectral density analysis ..................... 29
25. Representative composite spectrum ......................... ......... 31
26. Spectral density plot for Category lIM ships ............................. 33
27. Spectral density plot for Category I ships .............................. 33
ii
FIGURES-continued
28. Spectral density plot for Category U ships ............................. 33
29. Spectral density plot for Category V ships ............................ 33
30. Measured temperature and humidity occurrences ........................ 42
31. T&H Cycle I (internally mounted, temperature controlled) ................ 43
32. T&H Cycle U1 (internally mounted) .................................... 44
33. T&H Cycle m (externally mounted) ................................... 44
34. Velocity amplitudes versus time .............................. I .. ..... 49
35. Typical shock spectra ............................................... 50
36. Shock spectrum .................................................... 51
TABLES
1. High absolute hum idity .............................................. 38
2. High sustained absolute humidity ...................................... 39
3. High relative humidity combined with high temperature ................... 40
7-Aooession For
INTIS GRA&IDMIC TAP• '0UIarmounced 0
Just 1. f! c tloI
DistributiontA'an.1biity Codes
!Av-,.L &nd/oIQDistt Special
IAl
AUTHOR BIOGRAPHICAL DATA
NAME Chalmers, Richard H.
POSITION Head, Environmental Test Technology Office, NOSC Code 9502(retired).
EDUCATION BSME, California State University, San Luis Obispo, 1959, with 30units of post-graduate work in vibrations, thermodynamics, and mathe-matics at San Diego State University, 1962-1966.
EXPERIENCE Employed at NOSC in August 1959 (then known as the U. S. NavyElectronics Laboratory [NEL]) in the Mechanical Evaluation Branch.Worked at ever increasing levels of responsibility. Became supervisorof the Branch in March 1976. Held that position until formation of theEnvironmental Test Technology Office in July 1985. Served as head ofthat Office until retirement from the Civil Service in November 1990.Member of the Institute of Environmental Sciences since 1966, Ameri-can Society of Mechanical Engineers since 1970, and of the Society ofAutomotive Engineers since 1981.
PUBLICATIONS
Formal Technical Reports
a) "Technical Evaluation of Army Countermeasures Receiving Set AN/TLR-7,"NEL TR 931, 2 Oct 1959 (co-author, L. A. Fitzek).
b) "Engineering Evaluation of Radio Frequency Amplifier AM-1365/URT," NELTR 970, 26 April 1960 (co-author, R. E. Hopper).
c) "Engineering Evaluation of the AN/BLQ-2 (XN-1) Sonar Beacon," NEL TR987, 31 Aug 1960 (co-author, L. A. Fitzek).
d) "Evaluation of a 35-Foot Fiberglass Whip Antenna," NEL "?R 991, 23 Sept1960 (co-author, L. G. Robbins).
e) "Developmental Shock Test of the Panoramic Field Intensity EquipmentAN/JRM-126 (XN-1)," NEL TR 1015, 29 Nov 1960 (sole author).
"f) "Engineering Evaluation of Radio Calibrator Set AN/URM-114," NEL TR1028, 2 Jan 1961 (co-author, R. E. Hopper).
g) "Environmental Studies Aboard U.S. Navy Vessels in the South China andCaribbean Seas," NELC TR 1577, 16 Aug 1968 (co-author, D. L. Peterson).
iv
h) "Modal Velocity as a Criterion of Shock Severity," NELC TR 1682, 19 Jan1970 (co-author, H. A. Gaberson of NCEL, Port Hueneme). Also presented atthe Shock and Vibration Symposium and published in Shock and VibrationBulletin No. 40.
i) "Environmental Profiles for Reliability Testing," NOSC TR 558, 15 June 1980(sole author).
Magazines and Technical Journals
a) "Environmental Conditions for Shipboard Hardwarc," Journal of The Environ-mental Scienccs, 24:5 (Sep/Oct), pp. 13-22 (extracted from NOSC TR 558above)
b) "Climatic testing: can we be more effective?" an article publisned in theDecember/January 1990 issue of Test Engineering & Management.
c) "Fluid Immersion: Experimental ESS Technique" an article published in theDecember/January 1990 issue of Test Engineering & Management.
Technical Papers
a) "Flexure Stabilization of a Reaction Vibration Machine," Shock and VibrationBulletin No. 33, March 1964.
b) "Modal Velocity as a Criterion of Shock Severity," Shock and VibrationBulletin No. 40, January 1970. Also published as an NELC Technical Report(TR 1682).
c) "Bolt Torque and Vibration Resistance," Proceedings of the Institute of Envi-
ronmental Sciences, May 1984.
d) "Using Tuned Fixtures to Tailot MIL-S-901C," Shock and Vibration Bulletin
No. 59, May 1989.
e) "MIL-S-901C Tailored for the Masthead," Shock and Vibration Bulletin No.60, April 1990.
PATENTS "Fixtureless Environmental Stress Screening Apparatus," application
for letters patent made in November 1989, Navy Case No. 71672.
V
INTRODUCTION
PURPOSE
This document describes shipboard environmental conditions and environmentalrequirements to assist computer system acquisition managers in tailoring environmentalspecifications effectively in their procurement documents. Environmental conditionsconsidered in this document include natural and induced levels of vibration, tempera-ture, humidity, and shock. The environmental levels described are based on location ofthe installation site on the ship and on the degree of mission criticality associated withthe equipment bf ing procured. The philosophy and empirical data underlying the envi-ronmental levels required by military specifications are discussed, allowing acquisitionmanagers to select lower environmental levels should they choose to assume the addi-tional risk. Tailored testing methods and mechanical design approaches and trade-offsfor modifying fragile equipment to protect it from harsh environments are alsoaddressed.
PAST EFFORTS
In the mid-1970s, the Naval Electronics Laboratory Center (NELC) conducted theTelecommunications Equipment Low Cost Acquisition Method (TELCAM) program toexplore means of getting non-MIL-SPEC equipment on board Navy ships for non-mission-critical applications. Assuming only non-mission-critical applications were ofinterest, the results of that program would only need be updated to reflect the differ-ences in today's ship construction methods and to compartmentalize specifications.
Earlier U. S. Navy Electronics Laboratory (N'IEL) programs collected shipboard envi-ronmental data to determine what changes were needed in the environmental standardsof that time. Those data, when corrected for differences in ship construction, providedconsiderable information for this document. The information can be applied as appro-priate to all degrees of mission criticality.
In the iintervening years, the author worked with the Navy Printing Office to makeminimum modifications to various commercial electrostatic copiers and qualify themfor shipboard use. These items were purchased under reduced environmental specifica-tions with the understanding that they could be allowed to fail without seriously com-promising the mission of the ship.
Earlier environmental definition efforts were directed to areas on Navy ships whereelectronic equipment might be installed or where spare parts might be stored. Past andrecent efforts at tailoring environmental requirements have tended to assume, errone-ously, that computer equipment would be installed in only the most benign of suchareas. Actually, installation sites for today's computer systems range more widely
I i I I I n nn I in ,..1
about the ship than ever, due to the compactness of the equipment, the breadth of itsutility, and the relatively low cost of off-the-shelf and ruggedized equipment. Store-keepers are now using database programs on microcomputers, word processors arefound wherever typewriters used to be located, and computers are now found even inengine control spaces. Clearly, it cannot be safely assumed that a typical installationsite is a classical combat information center computer-room environment.
TAILORING APPROACH OF THIS DOCUMENT
Lessons learned from earlier tailoring approaches have demonstrated that the keysto effective tailoring are based on (1) understanding environmental conditions andrequirements, (2) accurate identification of the range of actual installation sites for aspecific equipment, and (3) definitive assessment of the criticality of its applications.With this information, an acquisition manager can make an informed assessment ofthe risks and benefits of specific reductions in environmental requirements. To providethis information, existing data were evaluated and extrapolated for its applicability topresent and future Navy ships. Areas where data are sparse or missing are highlighted.A few revolutionary new types of platforms, such as surface effect ships, have comeinto existence since earlier data were collected. These new types of platforms cannotbe covered accurately by the data available. However, the available published data aregenerally adequate to directly define the environmental characteristics of the greatmajority of present day and planned Navy combatant and combat support ships.
Much directly applicable vibration data are readily available. Many measurementprograms have been undertaken to ensure that vibration levels used in design andqualification of new systems are not exceeded in the actual working installation. Forexample, vibration measurements were made in the After VLS Compartment of theUSS Mobile Bay (CG 53), which was one of the first Vertical Launch System (VLS)equipped ships, to determine levels to be used in qualification testing of the VerticalLaunch ASROC (VLA). Many reports on similar activities provided data for the vibra-tion section of this document. Although some of these data may be old, they are stilldirectly applicable (with appropriate scaling when necessary) to modem ships withturbine-screw drive, since the screw drive is the primary source of ship vibration.
Shipboard temperature and humidity environments depend to a large extent on theconditions ambient to the ship. MIL-STD-210C provides good data on what can beencountered, even providing statistics so the risk in selecting a certain level can beassessed. In addition, the Navy measures temperature and humidity conditions in manyplaces about the world and maintains a computerized database that can be used tovalidate the requirements of Navy specifications. For example, in 1967 the computerdatabase was accessed for a particular Marsden Square in the South China Seas todetermine if MIL-E-16400 temperature requirements covered the conditions. NEL
2
personnel visited ships operating in the South China Sea and measured intake andexhaust air temperatures. Using these measurements, transfer functions were calculatedto allow predictions of the interior temperatures of ships operating in the worst-casehigh-temperature ambient environments.
Similar action could be taken for compartments that serve as installation sites forspecific computer equipments. Due to the increased power density of modem electron-ics and the increased dependence on air conditioning, it is advisable to visit operatingships in worst-case operational areas and gather updated transfer function information.Unless the computer system is sufficiently non-mission-essential so it can be shut downwhenever air conditioning fails, these data would have to be gathered both with andwithout operational air conditioning. This capability would provide the programmanager with adequate information for a realistic risk assessment.
Shock data are also readily available. Navy policy requires a shock trial of eachnew class of combatant ships entering the Fleet. This document draws upon theauthor's experience with the ship shock instrumentation team from the David TaylorResearch Center, Underwater Explosions Research Division. On recent shock trials withthe team, the author managed the installation and operation of the shock instrumenta-tion on the USS Kauffman (FFG 59) shock trials.
Direct involvement with shock measurement during ship shock trials brings aboutan understanding of the interaction of the ship structure and the movinig shock wave-front. To successfully set the scales on the shock recorders, it is necessary to estimatethe magnitude of the accelerations that will occur. Knowing the planned severity of theshocks makes estimating easy after the first shock has been recorded. But only thosewho have developed skill in assessing local ships structural resonance succeed inestimating levels for the first shock in the series. Along with the estimating capabilitycomes an improved appreciation for the damage that can be caused locally; it alsoreveals misconceptions common in laboratory shock testing. For example, the use of astiff fixture in attaching equipment to a shock test machine does not provide a conser-vative shock evaluation of the equipment. Presuming the equipment in service will bemounted in a location having a resonant frequency lower than the test fixture fre-quency (for example, about one-quarter of the test fixture frequency), the laboratorytest is both an undertest and an overtest at the same time. Knowing this, it is possibleto describe the shock environments for computer systems more accurately, and at thesame time, limit the higher frequency and higher G-level parts of the shock.
The remainder of this document provides program managers with detailed data onthe empirical basis for determining shipboard vibration, temperature, humidity, andshock requirements. The explanation and guidance required to use this data effectivelyis provided as an aid in tailoring environmental requirements to particular systems andinstallation sites.
3
VIBRATION
SOURCES OF VIBRATION
Vibration on Navy ships is ever-present. Amplitudes are small at times, such aswhen a ship is drydocked or is at pierside and taking its electrical power from shoresources.
As long as a crew is assigned and living and working on board, electrical powermust be routed throughout the ship. Transformers are used all about the ship to con-vert electrical power from the high voltage at which it is transmitted to the lower volt-age at which it is consumed. The hum that can be heard in the proximity of thesetransformers arises from mechanical vibrations of the laminations of the magnetic corematerial. In addition to creating an audible hum, mechanical vibrations of the magneticcore are coupled directly into the bulkheads and decks around the transformers. Thesemechanical vibrations in the ship's structure are at a level that can be measured forseveral feet around the transformers.
Fans, pumps, and compressors are constantly needed on ships for ventilation, airchilling, sanitary flushing, fire fighting, hydraulic pressurization, and many other pur-poses. To a large extent, these devices are driven by electrical motors that range insize from minuscule to motors that consume hundreds of kilowatts. All motors andtheir rotary loads are less than perfectly balanced, and they generate oscillatory forcesthat cause vibrationm, not only in the machines themselves, but in the nearby structureof the ship. Even "the air-borne sound created by these devices impinges on the nearbystructure of the ship and causes a vibratory response of the decks and bulkheads.These vibrations also radiate out from their source machinery and become part of theenvironment affecting equipment installed in the vicinity.
Vibration levels increase when the ship separates from shore utilities because theship's electrical power generators must be put into operation as must other pressurizingand pumping devices that provide utilities formerly taken from the shore. Vibrationlevels throughout the ship vary roughly in direct relationship to the amount of machin-ery in operation. When the ship is underway, and the main propulsion machinery is inoperation, the potential for high vibration levels is at its greatest because of the enor-mous power level inherent in propelling a ship.
Wh•en the ship is underway, the amount of machinery in operation will vary accord-ing to the ship type and its mission. Combat operations will not necessarily cause amaximum amount of the ship's machinery to be placed in operation. For example, adestroyer searching for submarines must operate quietly if it is to detect submarines,and submarines must operate quietly to avoid detection. In addition to the amount ofoperating machinery on a ship, the frequency content and the point of generation of
4
the vibrations have much to do with the vibration level that exists at a particular ship-board location. Finally, operation of the ship at high speeds or in rough seas createsthe highest vibration levels. This is because propulsive forces are greatest at highspeeds and because of the slamming and uneven screw loading when in rough seas.
EFFECT OF VIBRATION ON SHIP'S CREW
The sensitivity of the crew places a natural limit on vibration levels. Speeds ormaneuvers of the ship that create vibration levels beyond the comfort level of the creware normally avoided. Machines creating heavy vibrations or noise are operated onlywhen essential. Repairs are completed as soon as possible to bring the vibration levelsdown to tolerable levels. Since the crew lives on the ship, vibration levels allowed areconsiderably lower than is the case for aircraft or tank crews where exposure times aregenerally much shorter.
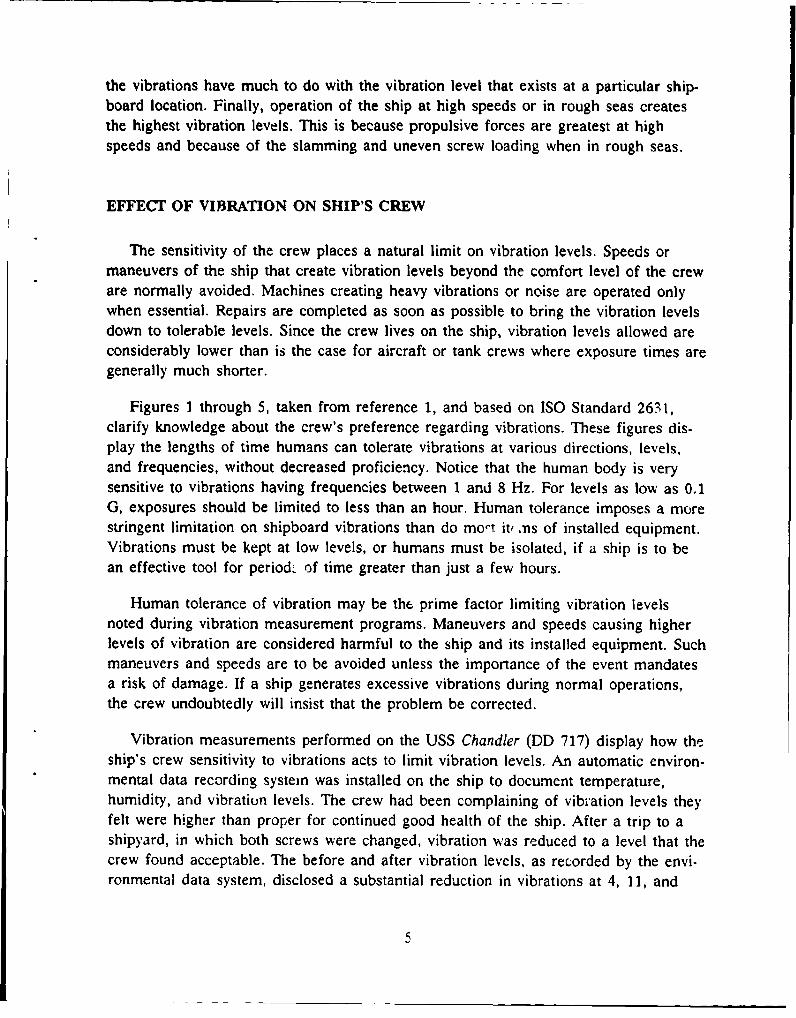
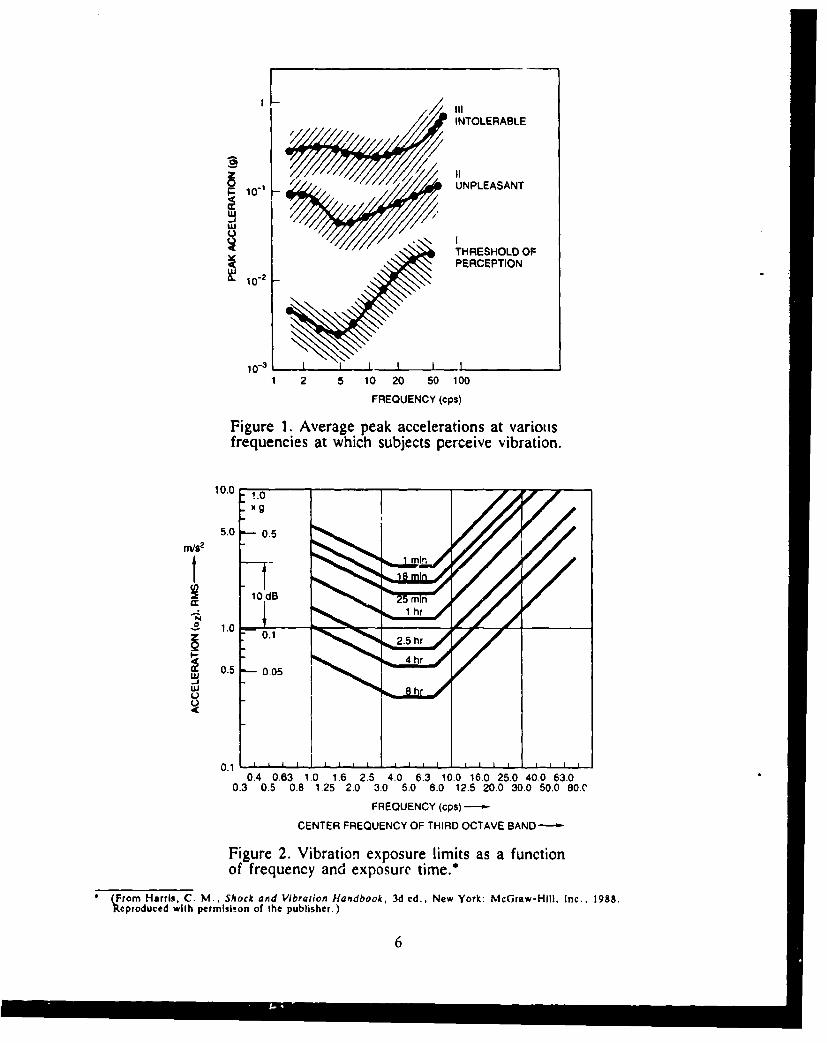
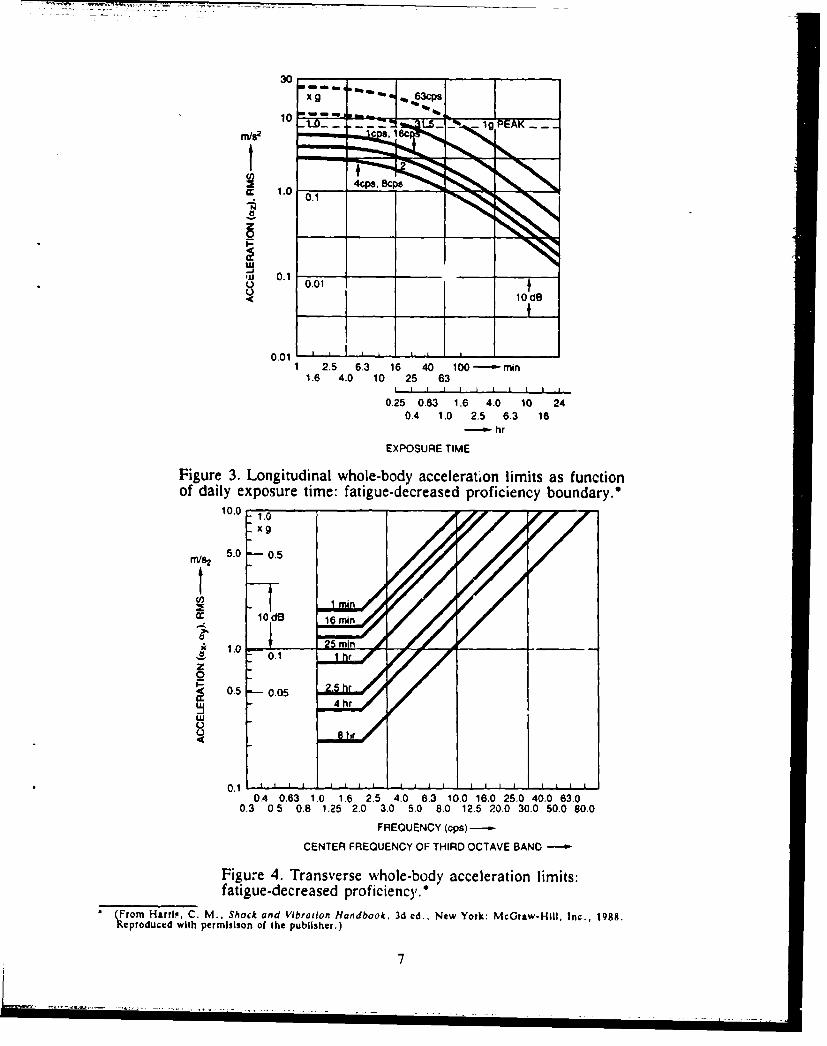
Figures 1 through 5, taken from reference 1, and based on ISO Standard 2631,clarify knowledge about the crew's preference regarding vibrations. These figures dis-play the lengths of time humans can tolerate vibrations at various directions, levels,and frequencies, without decreased proficiency. Notice that the human body is verysensitive to vibrations having frequencies between 1 and 8 Hz. For levels as low as 0.1G, exposures should be limited to less than an hour. Human tolerance imposes a morestringent limitation on shipboard vibrations than do mo-t it, .ns of installed equipment.Vibrations must be kept at low levels, or humans must be isolated, if a ship is to bean effective tool for period-, of time greater than just a few hours.
Human tolerance of vibration may be the prime factor limiting vibration levelsnoted during vibration measurement programs. Maneuvers and speeds causing higherlevels of vibration are considered harmful to the ship and its installed equipment. Suchmaneuvers and speeds are to be avoided unless the importance of the event mandatesa risk of damage. If a ship generates excessive vibrations during normal operations,the crew undoubtedly will insist that the problem be corrected.
Vibration measurements performed on the USS Chandler (DD 717) display how theship's crew sensitivity to vibrations acts to limit vibration levels. An automatic environ-mental data recording system was installed on the ship to document temperature,humidity, and vibration levels. The crew had been complaining of vibration levels theyfelt were higher than proper for continued good health of the ship. After a trip to ashipyard, in which both screws were changed, vibration was reduced to a level that thecrew found acceptable. The before and after vibration levels, as recorded by the envi-ronmental data system, disclosed a substantial reduction in vibrations at 4, 11, and
5
INTOLERABLE
UNPLEASANT
THRESHOLD OF
10-2 -PERCEPTION
1 2 5 10 20 s0 100
FREQUENCY (cps)
Figure 1. Average peak accelerations at variousfrequencies at which subjects perceive vibration.
10.0 1.0/0JXg
5.0 0.5
* 10 dmi
1.0.
0.4 0.63 1 0 1.6 2.5 4. h.r 00 1.02. 006.
0.3 0.o50.1.5203050801.2003.5000.FRUEC cs
CETRFEUNYO TIDOTV ADJ
Fiue2 irtoWepsuelmt safntooffeunc n xosr ie
*~ ~ ~ ~ Fgr 2Fo.ars . . hc n Vibration eaxpoo su3ded. Newit Yosk crawfunHionc. 98
Reproduced with permislson of the publisher.)
6
30
1 25 63 1 4 00-ri
1 6 40 10 25 6L5-I I Ig PEA
0.4 1.0 2.5 6.01
10.0 L1.0
5.0 0.51 2 6
0.4 .1.0 .3 1ah
EXOUETM
M/2 5 0 . 0.63 10 16 25 40 63 1. 60 2. 00 6.
10. d5 0. 1.2 2.m.i.0 80 1.n2. 00 008.
r RQEC (p).CETE min EC F HR CAV AD-Fiue4 rnses.hl-bd0ceeato iis
faiuedcrae p-Lrdofiiec(Fo ulC M.SokadVirto adoo,3 dNw ok crw0il n. 98
Re ~ ~ ~ 0 prdcdw-hprii onof 2.5 uliher.) .
47h
.........
100
rris2
S10
12.0 8.3 18 40 io0--""min16 40 10 25 63
I i i [i I i I I
0.25 0.63 1.6 4.0 10 24
0.4 1.0 2.5 8.3 18
- hr
EXPOSURE TIME
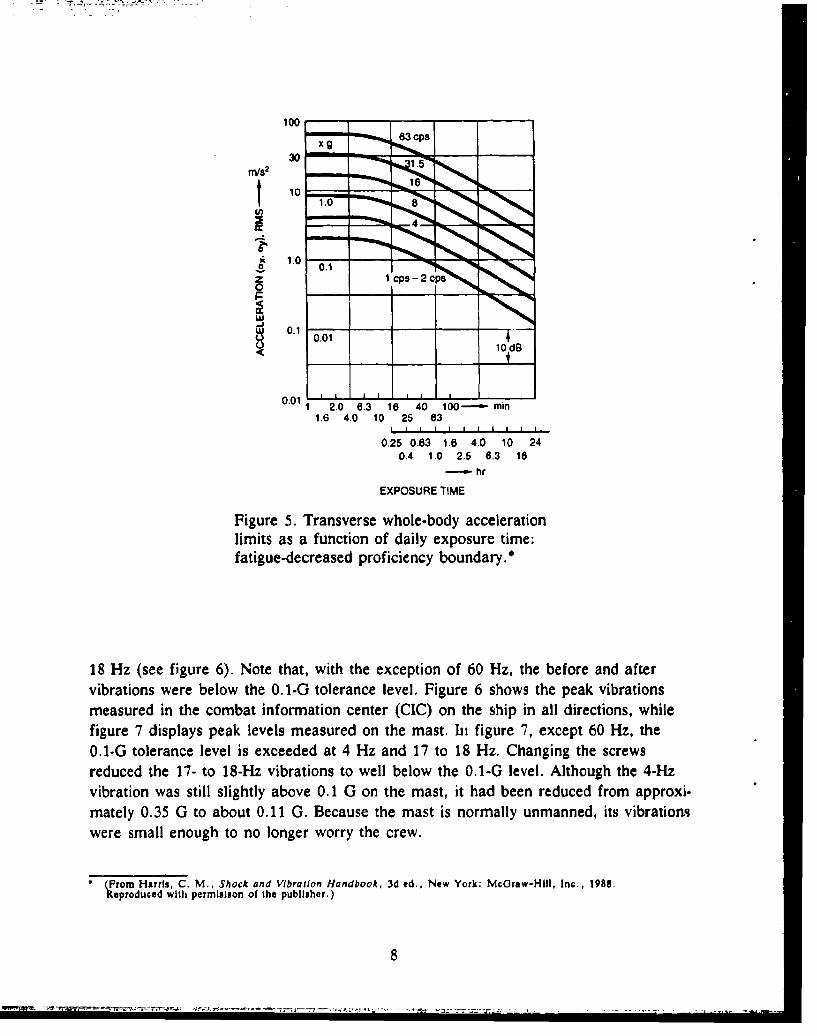
Figure 5. Transverse whole-body accelerationlimits as a function of daily exposure time:fatigue-decreased proficiency boundary.*
18 Hz (see figure 6). Note that, with the exception of 60 Hz, the before and aftervibrations were below the 0.1-G tolerance level. Figure 6 shows the peak vibrationsmeasured in the combat information center (CGC) on the ship in all directions, whilefigure 7 displays peak levels measured on the mast. hi figure 7, except 60 Hz, the
0.1-G tolerance level is exceeded at 4 Hz and 17 to 18 Hz. Changing the screwsreduced the 17- to 18-Hz vibrations to well below the 0.1-G level. Although the 4-Hzvibration was still slightly above 0.1 G on the mast, it had been reduced from approxi-mately 0.35 G to about 0.11 G. Because the mast is normally unmanned, its vibrationrwere small enough to no longer worry the crew.
* (From Harris, C. M., Shock and Vibration Handbook, 3d ed., New York: McGraw-Hill, Inc., 1988.Reproduced with permislson of the publisher.)
8
ACCELERATION\ /AMPLITUDE (SINGLE)
100
08 A
06
0.44
0.2
0.t0
0.02
0.01
0.04!
0.02
0.01 1 2 3 4 5 10 15 20 30 40 50 100
FREQUENCY (Hz)
MIL.STD-187
Figure 6. CIC vibration levels before and afterchanging screws on USS Chandler (DD 717).
9
ACCELERATION AMPLITUDE (SINGLE)10
8
6
4<
02
0.1
0.08
0,41
0.01
FREQUENCY (Hz)MIL-STD-167
Figure 7. Radar mast vibration levels before and afterchanging screws on USS Chandler (DD 717).
10

EFFECT OF VIBRATION ON SHIP'S STRUCTURES
Vibration engineers like to say "All the world is a spring!" Ihe expression is clearif one thinks about how the earth responds to earthquakes. As earth's tectonic platesattempt to move with respect to one another, stresses are built up. When the stressesreach a magnitude that the surrounding soil structure can no longer resist, sudden slip-page of one surface relative to thr other relaxes the stresses, and oscillatory motion ofthe area results. The tremors are coupled from one side of the earth to the otherdirectly through the liquid center, and laterally through the crust. Sensitive seismome-ters located about the world mnt only inform us that an earthquake has occurred some-where, but can pinpoint the origin and magnitude of the motion. These motions arepropagated by the "springiness" of the earth.
Even though made of stiffer materials than the earth, man-made structures such asbuildings, bridges, ships, and machines, respond to loadings similarly. Because man-made structures are stiffer, response frequencies are higher than those of the earthresponding to an earthquake. A transient force applied to a ship at a point, for exam-ple the thrust bearing on the main propulsion shaft, is propagated through the ship justas the earth responds to an earthquake force. Energy from an exciting force isabsorbed into the ship's structure as deformation of local structure and stored brieflyas potential energy. It is then released into surrounding structure at rates determinedby the spring characteristics of the structure. How far and at what magnitude the forceis transmitted depends on the mechanical impedance or mobility of the ship's structureand, if the force is repetitive, the repetition frequency.
The shape of a ship is dictated by many considerations other than its ability toresist vibrations. The structure must be strong enough to withstand the rigors of goingto sea, and the hull must be slender for minimal drag. Also, vertical stiffness must begreat eneugh to support all the machinery and structure directly above. One of themost common ways to avoid stresses in a ship is to incorporate maximum flexibility inthe design. Consequently, a ship often is stiff longitudinally but flexible when subjectedto vertical and side-to-side force couples. In fact, many ships have built-in expansionjoints that serve to relieve high stresses that would otherwise result from vertical andside-to-side force couples.
These natural and inrended flexibilities limit the magnitude and frequency of vibra-tions transmitted about the bhip. For example, the screws generate vibratory forces inall directioiis, but tlt; se acting in the longitudinal or fore and aft direction are theheaviest. Blades ,i the screws lose part of their bite momentarily as they pass the4tern post. As these forces are transmitted forward in the ship, the vertical and side-to.side flexibiiity of the ship's structure dissipate the forces more readily than does thefore and aft stiffness of the structure.
11
EFFECT OF DISTANCE ON TRANSMISSION OF VIBRATIONS
Even though longitudinal stiffness of the ship is greater than side-to-side or verticalstiffness, the large longitudinal dimensions of many ships limit the effective stiffness.This thereby limits the magnitude and frequency of vibrations that are transmitted.Vibration engineers sometimes use a factor termed "spring constant" to indicate how astructure will behave under vibration or shock conditions. High structural spring con-stants lead to high natural (resonant) frequencies and provide unamplified transmissionof vibration frequencies up to about 20 percent of the structural resonant frequency.Depending on the damping inherent in the structure, driving vibrations a3 frequenciesbetween 20 and 140 percent of the natural frequency will be amplified by as much as5 to 10 times the input. Above 140 percent of the natural frequency, the motion trans-mitted is attenuated with respect to the driving motion due to the relative flexibility ofthe structure.
An example of how the longitudinal natural frequency of a ship is affected bylength, consider a hypothetical, single degree-of-freedom model of a ship whose longi-tudinal cross-sectional area allows 0.01 millimeter of motion in a length of 10 metersunder a 5000-Newton force. Such a section of structure exhibits a spring constant of500,000,000 Newtons per meter and, assuming a mass of 1876 kilograms, wouldexhibit a natural frequency of about 70.7 Hz. Destroyers are often 100 meters or morein length and could be represented by 10 of the above sections arranged in series.When spring constants are loaded in series, the overall result is similar to loadj~g re-sistors in parallel; that is, 10 sections in series provide one tenth the spring constant.Therefore, if a 10-meter-long section exhibits a 70.7-Hz resonance, 10 of these sectionsarranged in series should exhibit a 22.4-Hz resonance since resonant frequency variesdirectly with the square root of the spring constant. Reducing the spring constant by afactor of 10 reduces the resonant frequency by the square root of 10, or 0.316 of itsoriginal value.
Aircraft carriers sometimes reach 335 meters in length. Using the same reasoningwe used for the destroyer above, we would arrive at a longitudinal naturil frequency of12.2 Hz for the carrier. It should be noted that the values used here represent no spe-cific ship or ship's structure. They were chosen only to demonstrate how length affectsthe magnitude and frequency content of transmitted vibratory forces. In fact, calcula-tions indicate that a solid bar of steel 10 meters in length with the same cross-sectionalarea but no mass loading would resonate at approximately 400 Hz. No practical shipwill have a structure that provides a resonant frequency nearly one-fifth that of solidsteel. Such a ship would have essentially no usable space inside, and it undoubtedlywould not provide sufficient buoyancy.
12
VIBRATION MEASUREMENT PROGRAM
The foregoing discussion should serve to explain how levels decrease with distancefrom the generation point of vibration. In most cases, where vibrations were measuredon board operating ships, the highest levels were generated by the ships screws. In thefew instances when data were taken near the screws, levels similar to those specifiedin MILSTD-167 (reference 2) existed. On most ships, in the areas where electronicequipment would likely be located, vibration levels seldom exceeded 0.1 G peak. Onlyon aircraft carriers and small gunboats were levels measured that were larger. Theselevels, though, seldom exceeded 0.2 G.
Local Vibration Transmission
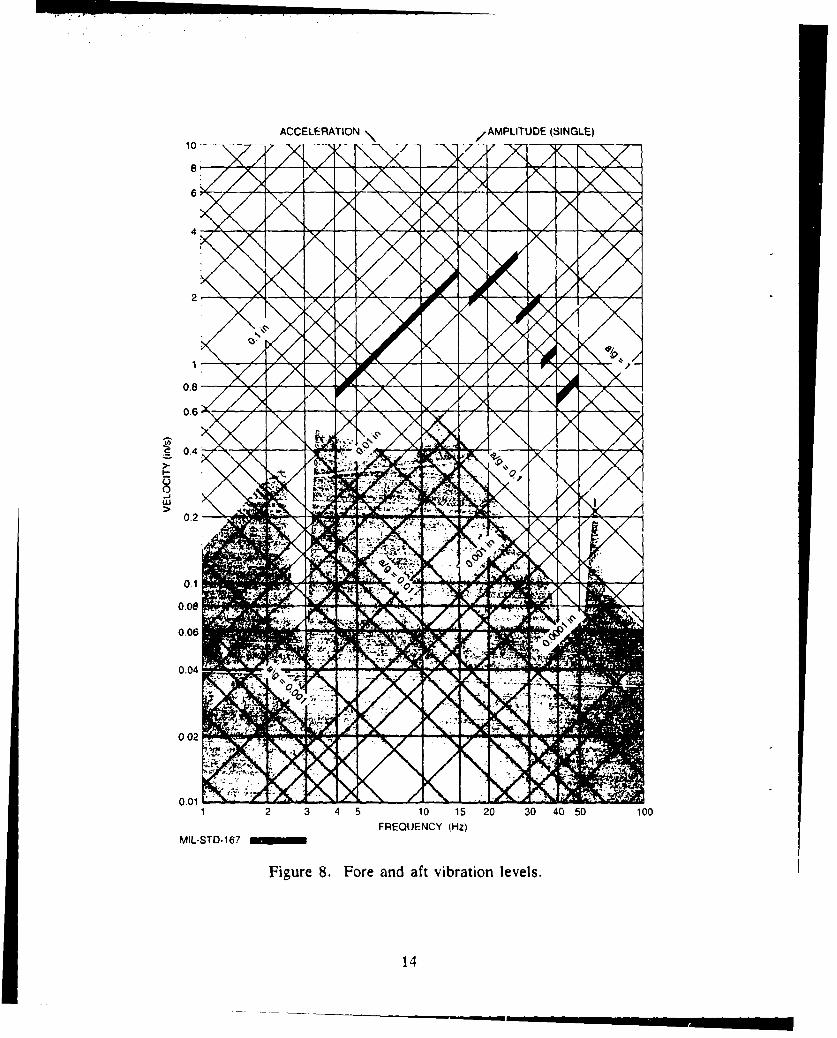
With regard to the 60-Hz vibrations shown in figures 6 through 10, it should benoted that figures 1 through 5 show that humans can tolerate 7 to 10 times the amountof vibration amplitude in bands centered at 63 Hz than they can in bands centered at 8Hz. In addition, based on the earlier discussion describing how shipboard structureaffects vibration transmission, it is clear that vibrations much above 30 Hz are gener-ated locally. Such vibrations will not be transmitted far from the point of generation.For these reasons, vibrations above 30 Hz are not of great concern unless they occurat amplitudes considerably greater than 0.1 G.
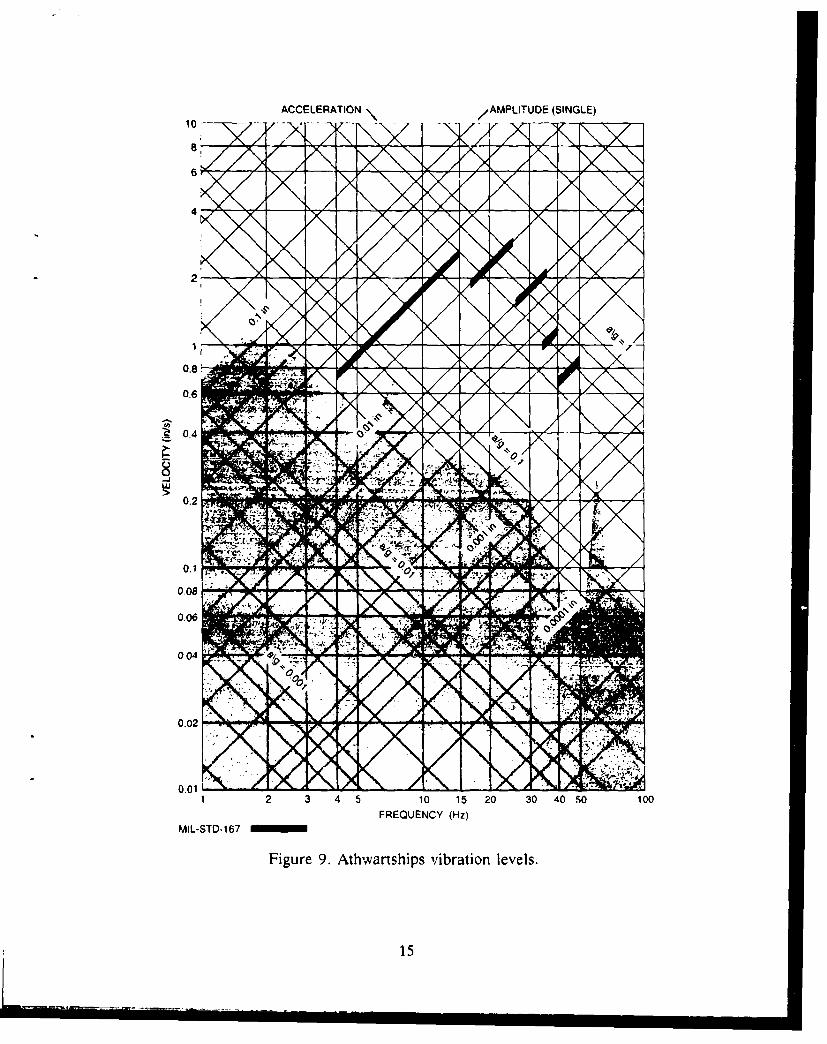
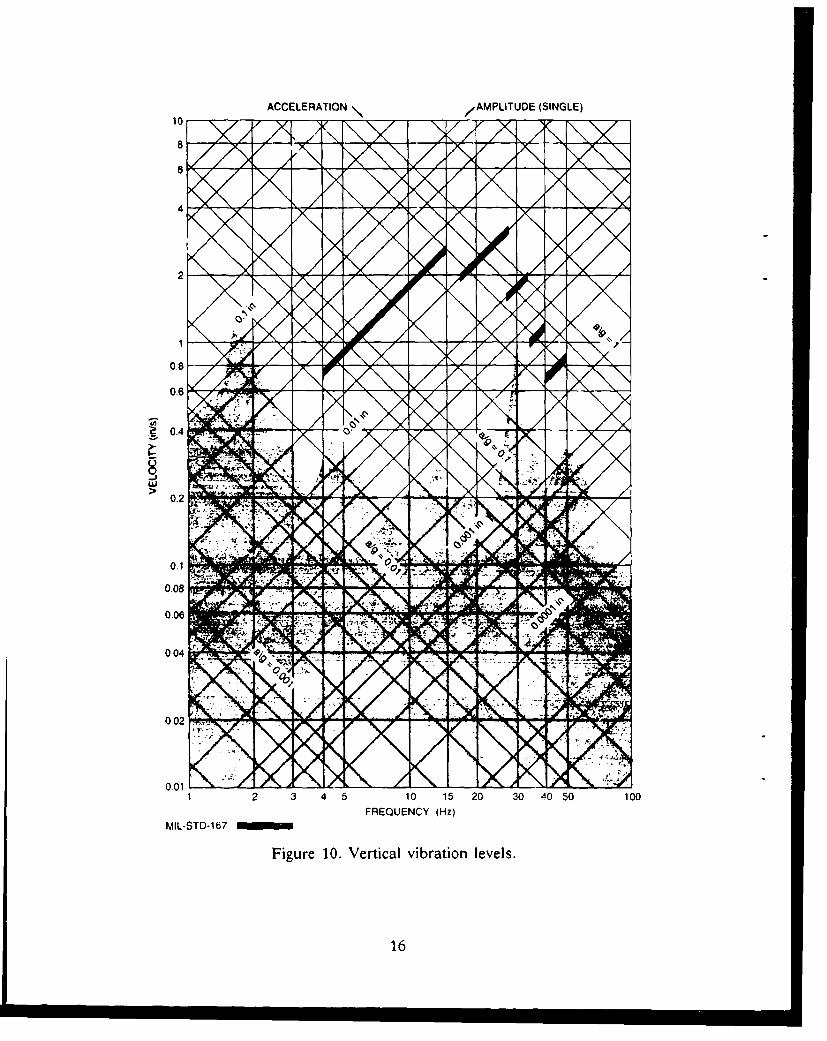
Measurement Locations
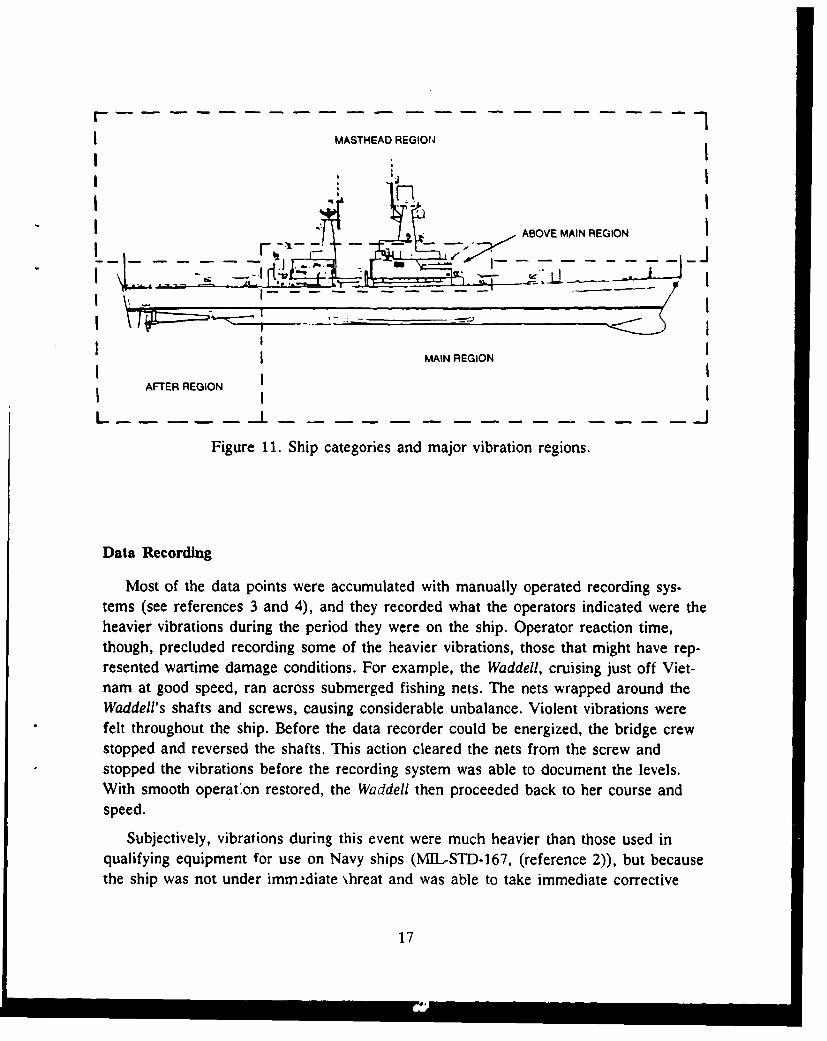
Figures 8, 9, and 10 show the peak fore and aft, athwartship, and vertical vibra-tions measured on approximately 20 ships representative of the Fleet during the Viet-nam operations. These levels were measured in spaces on the ships in which electronicequipment was located. Figure 11 shows vibration regions on the ship that were arbi-trarily established for use in reporting the vibration data at various locations. Vibra-tions were recorded on operating ships on a noninterference basis, and even thoughconsiderable electronic equipment is located in the "masthead AMon," mounting sen-sors on masts would have interfered too greatly with ships operations, so "mastheadregion" data are sparse. Sonar equipment is often located well forward in the "mainregion," but distance from the screws placed low priority on obtaining vibration meas-urements in these areas. "Main region" data are, therefore, also sparse. Seldom wasany electronic equipment installed in the "after region." Electronic spares, however,were found stored in the Steering Ram Room on the USS Waddell (DDG 24) directlybeneath the After Steering Compartment, and just above the screws. Consequently,vibrations were recorded in the room, and they proved to be some of the higher levelsof data recorded during the measurement program. But, by far, most of the measure-ment locations were in what is shown in figure 11 as the "above main region."
13
ACCELERATION /AMPLITUDE (SINGLE)
10/1
0.8
06
>
0.04
0.2 <,
1 2 3 4 5 10 15 20 30 40 50 100
FREQUENCY (Hz)MIL-STD-16'
Figure 8. Fore and aft vibration levels.
14
0 i i i ' l I I I I I
ACCELERATION /AMPLITUDE (SINGLE)
4
2
0.8
0 - -
0.4
0.2
0.1
008
0.04
0.01
1 2 3 4 5 10 15 20 30 40 50 100
FREQUENCY (Hz)MIL-STD-167
Figure 9. Athwartships vibration levels.
15
ACCELERATION AMPLITUDE (SINGLE)
08
06
Z C
'a 0.1
0.01
FREQUENC Y (z
"MIL"TD "6
Fiue1.Vetclvbato1ees
.066
0.80" / -'"
Figur 10. Vetia virto levels
16
MASTHEAD REGIONI
ABOVE MAIN REGIONJ
:71"* -- ~: ' . .. . .. . . . ii
I MAIN REGION
AFTER REGION
L
Figure 11. Ship categories and major vibration regions.
Data Recording
Most of the data points were accumulated with manually operated recording sys-tems (see references 3 and 4), and they recorded what the operators indicated were theheavier vibrations during the period they were on the ship. Operator reaction time,though, precluded recording some of the heavier vibrations, those that might have rep-resented wartime damage conditions. For example, the Waddell, cruising just off Viet-nam at good speed, ran across submerged fishing nets. The nets wrapped around theWaddell's shafts and screws, causing considerable unbalance. Violent vibrations werefelt throughout the ship. Before the data recorder could be energized, the bridge crewstopped and reversed the shafts. This action cleared the nets from the screw andstopped the vibrations before the recording system was able to document the levels.With smooth operaton restored, the Waddell then proceeded back to her course andspeed.
Subjectively, vibrations during this event were much heavier than those used inqualifying equipment for use on Navy ships (MIL-STD-167, (reference 2)), but becausethe ship was not under immediate \hreat and was able to take immediate corrective
17
action, the problem was resolved quickly, so quickly in fact, that tape recordings docu-menting the levels were not obtained. Had the destroyer been involved in resisting orconducting hostilities, it may have been necessary to maintain the best speed possible,with concomitant vibrations, for as much as several hours. All the installed equipmentwould have then had to endure as best it could.
Additional Data Sources
Vibration data from the measurement program were combined with data reportedby many Navy sources to prepare a vibration profile for non-mission-critical shipboardtelecommunications equipment. A complete listing of the data sources is given as item19 in NOSC TD 335 (reference 5). Appropriate figures from that document are repro-duced here as figures 12 through 19. Notice that even with the augmented sources ofdata, reported vibrations had an upper limit of 0.2 G. On ships other than carriers andgunboats, levels seldom exceeded 0.1 G. In compiling this data, all data attributed tothe response of installed equipment were rejected. Only those that described the shipsstructural motion (e.g., the vibrations that would be input to equipment installed at thatpoint) were retained. For instance, all data reported for the USS Iwo Jima (LPH 2) inNELC 1701 (reference 4) dealt with either the responses of installed medical equip-ment or improperly secured gas bottles in the Aerology Compartment. Since these datadid not describe input vibrations that electronic equipment might normally have had toendure, they were not given consideration in figures 8, 9 and 10. Almost all theremaining reported measurements were made in locations on ships that fall within theregion of figure 11 labeled the "above main" region.
Gunboat and Carrier Variations
Why are vibration levels higher on gunboats and aircraft carriers? For one thing,the gunboat is small, about 164 feet overall. It has about the same longitudinal sectionstiffness as do larger ships, but the vibrations generated by its screws receive lessattenuation (due to distance) before reaching the "above main" region. Aircraftcarriers have four shaft and screw arrangements, staggered longitudinally as is neces-sary to fit within the confines of the hull. This shortens the structural path for vibra-tion transmission and adds to the probability of generating beat frequencies due to thesmall speed differences of the shafts. Further, aircraft carriers often move at greaterspeed than other surface ships in carrying on air operations. They expend considerablymore power in achieving and maintaining their speed through the water and couldreasonably be expected to generate larger vibrations.
18
8
a Xr K
Z
cc
0
FI-
(Siu') AIIOO13A Ovc 000
u1
e z
0 W
w C,=.jv~
0000.. 0 0 S
(Stu!) AIIOl13A
20A' A ý
00
00
009l)A100013A~00 0
0 \~~11 Nl
v X.PU Ie 11 1 d 1 /M I 0
(0d a 0 000 e0
(99u0 AlIU013A
22ýNýN.OxvT
-~~ N~xr,ý /N -
Hueristlc Vibration-Level Formulae
The normal day-by-day vibration environment on most classes of surface ships canbe described in a simple mathematical relationship between peak vibration level andthe distance between installation location and the screws:
Vp. a 1.7 (1)
T(D- 30)'T(
where Vp - peak acceleration level at any frequency from 4 to 50 Hz, G
D - distance in feet from stem to the installation location
For aircraft carriers, a similar equation can be used:
1.5Vp- 1 (2)
(D -30)T-
These levels are admittedly low, amounting to roughly one-tenth to one-fifth of theusual shipboard vibration . iquirement as defined in MINLSTD-167 (reference 2). Anyequipment of practical value installed on the ship should operate without vibrationimpairment at these levels. The vibration tolerance of equipment should rise in directrelationship with the criticality of the equipment to the ship's mission. MI,-STD-167levels should be considered a generally accepted upper level. MIL-STD-167 does notnecessarily describe the highest levels that will ever occur. It merely describes anarbitrary level above which the Navy accepts responsibility for operation of all installedequipment. Unique applications often require vibration tolerance greatly exceedingMIh-STD-167 levels. Examples of these are electronic control circuitry mounted directlyon diesels, gas turbine generators, hydraulic power supplies, or any noise-producingmachinery.
DETERMINATION OF VIBRATION REQUIREMENTS
Equipped with descriptions of the peak vibration levels, we need to address thequestion of how long a period of time an item should be expected to endure a givenlevel of vibration. A well-designed piece of electronic equipment should certainly retainall capabilities for at least 10 years after installation, and with development costs ofnew systems what they are today, a 20-year service life is desirable. Of that 20-yearservice life, the ship on which the equipment is installed is underway about 50 percentof the time. That means that the equipment will experience the usual low-level vibra-tion described abovc for a total of 10 years. To make certain the equipment will not beimpaired or slowly degraded by long-term exposure to low-level vibration, it should beexposed to vibration testing during the process of qualifying the equipment for ship-board use. Obviously, it would be wise to have the vibration test match the service life
23
in length so that results bear a one-to-one time correlation on what could be expectedin service. Equally obvious is the fact the vibration qualification test must be somewhatshorter, even though it loses the confidence offered by a one-to-one time correlation.How can the test time be shortened without abrogating validity of the results?
Equivalent Techniques
Fackler (reference 6) defines a good vibration test as one that fails equipment des-tined to fail in service and will not fai! equipment that is satisfactory for service. Hefurther states that this definition was found to be deceptively simple:
Several weaknesses exist in our ability to perform a good test. Mostare unavoidable. However, it is necessary to discuss them so that theymay be avoided to the largest extent possible. The primary weaknessesresult from a lack of adequate field data, the use of motion-controltest practices which ignore the interaction between equipment andstructure, attempts to write general specifications, and approaches usedto accelerate time.
Thus, our approach is technically weak in that we lack adequate data and cannotproperly account for the interaction between equipment and structure. But, in a generalway, we can describe the vibration environment on surface ships, and we can feel con-fident that only great changes in propulsion methods or in vibration tolerance of thecrew members are likely to change our description appreciably. That leaves, then, onlythe "approaches to accelerate time" with which to deal.
Approaches to Accelerate Time
Fackler (reference 6) discusses several of the methods currently used to affect com-pression of the vibration test to the service life ratio. One way to abbreviate vibrationtest time is to look at possible modes of failure and then aggravate the aspects ofvibration testing that tend to reveal those modes. One category of vibration failureexhibited by many equipments is that of mechanical fatigue, either by breakage orgeneral loosening of major structural elements or nonstructural components such asswitch contacts or component lead wires. These failures are characterized by the factthat the failure remains after the vibration stimulus is removed. A second category offailure is one in which the failure disappears when the vibration stimulus is removed,or sometimes, when it is reduced. Failures of this second category are not caused byoverstressed conditions, but by insufficient stiffness or clearance in the design of theitem under test. Both failure categories are sensitive to the amplitude of the vibrationstimulus, though they differ in that failures of the second category may never occur atreduced vibration levels, while failures of the first category merely take longer toappear.
24
To explore the possibility of shortening test time for disclosing weaknesses relatedto fatigue failures, we can use the results of work done to determine how well alumi-num and steel endure reversed bending. From published endurance data, we can easilydetermine what amplitude of reversed bending stress is necessary to cause failure tooccur at 10,000 cycles rather than 500,000 (45,000 rather than 33,000 psi for mildsteel) Presuming fatigue failures in vibration are due mostly to reversed bendingstress, we have a method of shortening time available to us. We can raise the inputamplitude to the point where the item under test will receive in 2 hours the samefatigue it would receive at lower vibration levels in 10 years on the ship. A vibrationtest time and an amplitude can be specified that will bear a known relationship to theservice environment, and will, thereby, provide a known time compression. This isessentially what MIL-STD-167 intends to accomplish in its endurance tests.
Hastening failures of the second category cannot be handled as directly as fatiguefailures. Amplitude-sensitive failures indicate improper design, and though they maytend to occur at ever lower vibration amplitudes as fatigue is accumulated, they do notbear a direct relationship to fatigue. Normally, it is considered satisfactory to simplyapply for a short time a somewhat higher input amplitude, ranging from 2 to 10 timesgreater than is expected in the field, while watching for any undue response from theitem under test. The Variable Frequency Tests of ML-STD-167 are directed towarddisclosing these types of failures.
RANDOM VIBRATION
Discussions of vibration thus far have been mostly in terms of sinusoidal, single-frequency operations, both in describing the shipboard environment and the tests usedto qualify equipment for shipboard use. Now that random vibration measurementequipment and techniques have become available, and vibration testing equipment cangenerate controlled random vibrations, it is considered proper to specify and applyrandom vibrations whenever possible. Ail vibration environments, even those weattempt to make pure single-frequency environments, actually contain recognizableamounts of energy at many frequencies. Some failures, particularly those that go awaywhen vibration is stopped, result from an equipment's proclivity to respond at two ormore frequencies at the same time. This fact alone indicates the wisdom of requiring alevel of tolerance to random vibration and the use of a random vibration test in thequalification process.
A ship is a random vibration generator. Vibrations generated by the screw predomi-nate, but many other sources contribute to the vibrations existing at any location onthe ship. Motor-driven machines in the near vicinity provide vibrations near the funda-mental and submultiples of the power line frequency. Fans and blowers produce pulsa-tions at the passing frequency of their impellers. Gear trains (such as the massive
25
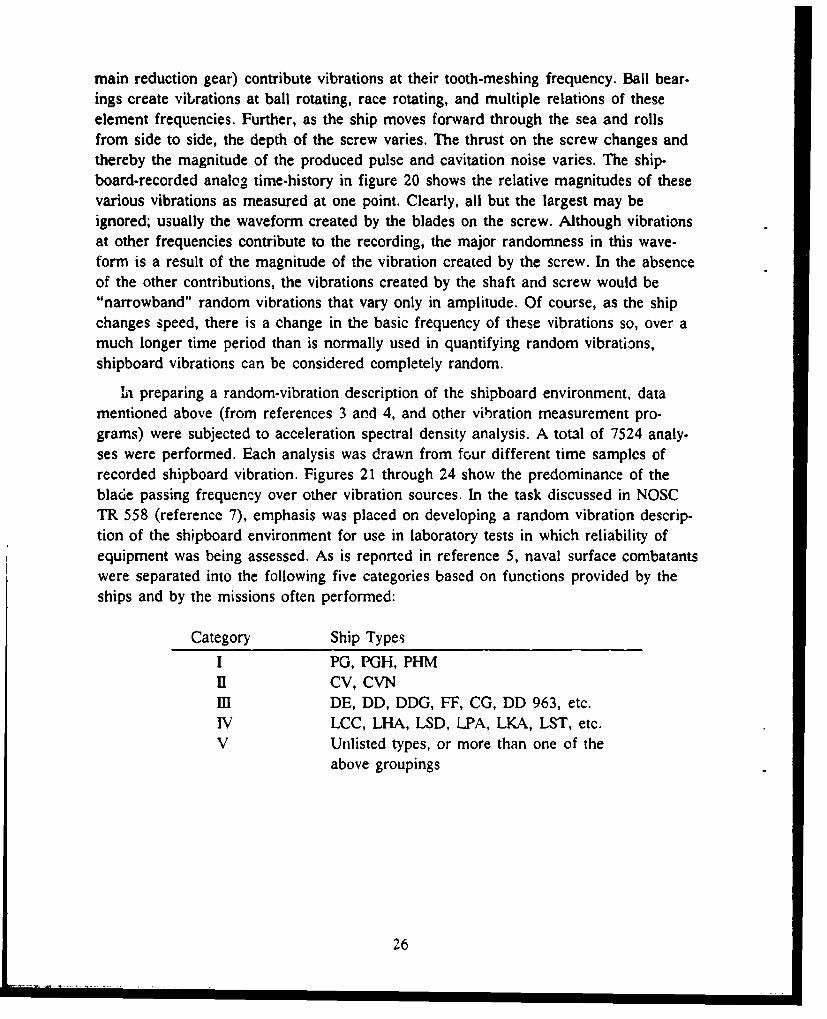
main reduction gear) contribute vibrations at their tooth-meshing frequency. Ball bear-ings create vibrations at ball rotating, race rotating, and multiple relations of theseelement frequencies. Further, as the ship moves forward through the sea and rollsfrom side to side, the depth of the screw varies. The thrust on the screw changes andthereby the magnitude of the produced pulse and cavitation noise varies. The ship-board-recorded analog time-history in figure 20 shows the relative magnitudes of thesevarious vibrations as measured at one point. Clearly, all but the largest may beignored; usually the waveform created by the blades on the screw. Although vibrationsat other frequencies contribute to the recording, the major randomness in this wave-form is a result of the magnitude of the vibration created by the screw. In the absenceof the other contributions, the vibrations created by the shaft and screw would be"narrowband" random vibrations that vary only in amplitude. Of course, as the shipchanges speed, there is a change in the basic frequency of these vibrations so, over amuch longer time period than is normally used in quantifying random vibrations,shipboard vibrations can be considered completely random.
MI preparing a random-vibration description of the shipboard environment, datamentioned above (from references 3 and 4, and other vibration measurement pro-grams) were subjected to acceleration spectral density analysis. A total of 7524 analy-ses were performed. Each analysis was drawn from four different time samples ofrecorded shipboard vibration. Figures 21 through 24 show the predominance of theblade passing frequency over other vibration sources. In the task discussed in NOSCTR 558 (reference 7), emphasis was placed on developing a random vibration descrip-tion of the shipboard environment for use in laboratory tests in which reliability ofequipment was being assessed. As is reported in reference 5, naval surface combatantswere separated into the following five categories based on functions provided by theships and by the missions often performed:
Category Ship Types
I PG, PGH, PHMI1 CV, CVNIf DE, DD, DDG, FF, CG, DD 963, etc.IV LCC, LHA, LSD, LPA, LKA, LST, etc.V Unlisted types, or more than one of the
above groupings
26
a:2
27
0.01
DOF =8GRMS 0.04
-- 1
10 •0 200
Hz LINEAR
Figure 21. Representative acceleration spectraldensity analysis, PGH 2.
0.01
DOF = 8GRMS = 0.0367
10-" A
0 200
Hz LINEAR
Figure 22. Representative acceleration spectraldensity analysis, DLG 24.
28
0.01
D:F 8GRMS= 0.06
104
0 200
Hz LINEA9
Figure 23. Representative acceleration spectraldensity analysis, DE 1070.
0.01 , T I
DOF =8GRMS - 0-09
10--.
0 200
Hz LINEAR
Figure 24. Representative acceleration spectraldensity analysis.
29
Development of the desired spectral densities for reliability testing is of interest but,because usual levels were desired, an averaging process was used. This resulted in lev-els considerably lower than those of interest in specifying what an item of shipboardequipment must endure. Statistical approaches must be used to describe random vibra-tion. The term "random vibration" indicates that magnitude varies randomly from oneperiod of time tu tht next. However, we can gather a number of samples of the vibra-tion, calculate statistics on magnitude and frequency, and give our description in statis-tical terms. The term considered most informative is "acceleration spectral density"(see figures 21 through 24) in which averages of vibration magnitudes at various fre-quencies are shown. As is discussed in reference 8, the mathematics used to calculateacceleration spectral density provides valid estimates so long as the following con-straints are observed: (1) the random process must be stationary; that is, the sameresults must be obtained if the same sampling period is used but with the time originchanged, and (2) the random process is ergodic; that is, each sample is representativeof the group. Obviously, a stationary condition is never totally present since machinesare not operated continuously. But we can limit our resulting description to that con-figuration existing when the samples were taken. Assuming these constraints are met,for our purposes, spectral density calculations are then valid for that configuration ofvibration generators. Confidence in the validity of the spectral density calculationincreases directly with the number of samples averaged. Each sample contributes twostatistical degrees of freedom (DOF) to the measurement of validity.
Acceleration spectral densities developed in reference 7 suffer from being averagedtoo many ways to be other than just a passing interest here. Some of the recorded datawere biased toward the higher vibration levels found on the various ships visited, butmost of the recorded passages, particularly those from the unattended recorders, weretaken on a timed basis. Recorded vibration levels were therefore often much lowerthan an operator would have seen fit to record (for example, when the ship wasanchored or tied up at a pier).
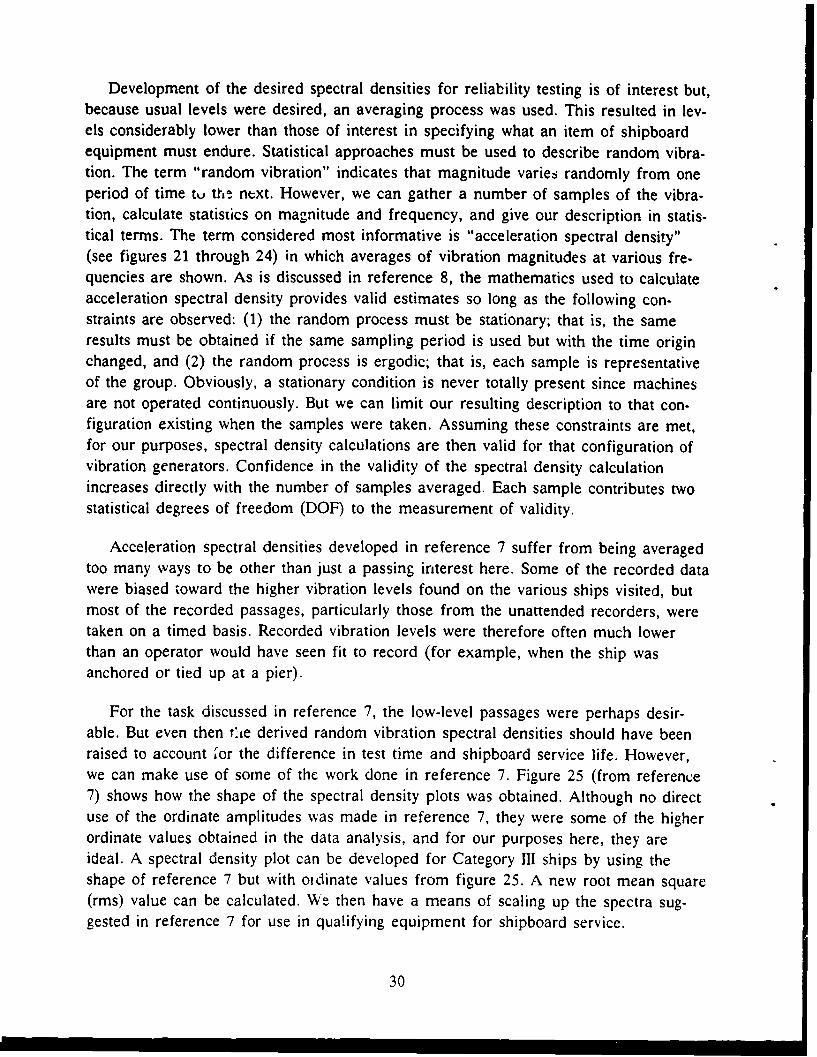
For the task discussed in reference 7, the low-level passages were perhaps desir-able. But even then tie derived random vibration spectral densities should have beenraised to account 'or the difference in test time and shipboard service life. However,we can make use of some of the work done in reference 7. Figure 25 (from reference7) shows how the shape of the spectral density plots was obtained. Although no directuse of the ordinate amplitudes was made in reference 7, they were some of the higherordinate values obtained in the data analysis, and for our purposes here, they areideal. A spectral density plot can be developed for Category Ill ships by using theshape of reference 7 but with oidinate values from figure 25. A new root mean square(rms) value can be calculated. W- then have a means of scaling up the spectra sug-gested in reference 7 for use in qualifying equipment for shipboard service.
30
0.01
N
10 -6 0 2 0 0
Hz LINEAR
Figure 25. Representative composite spectrum.
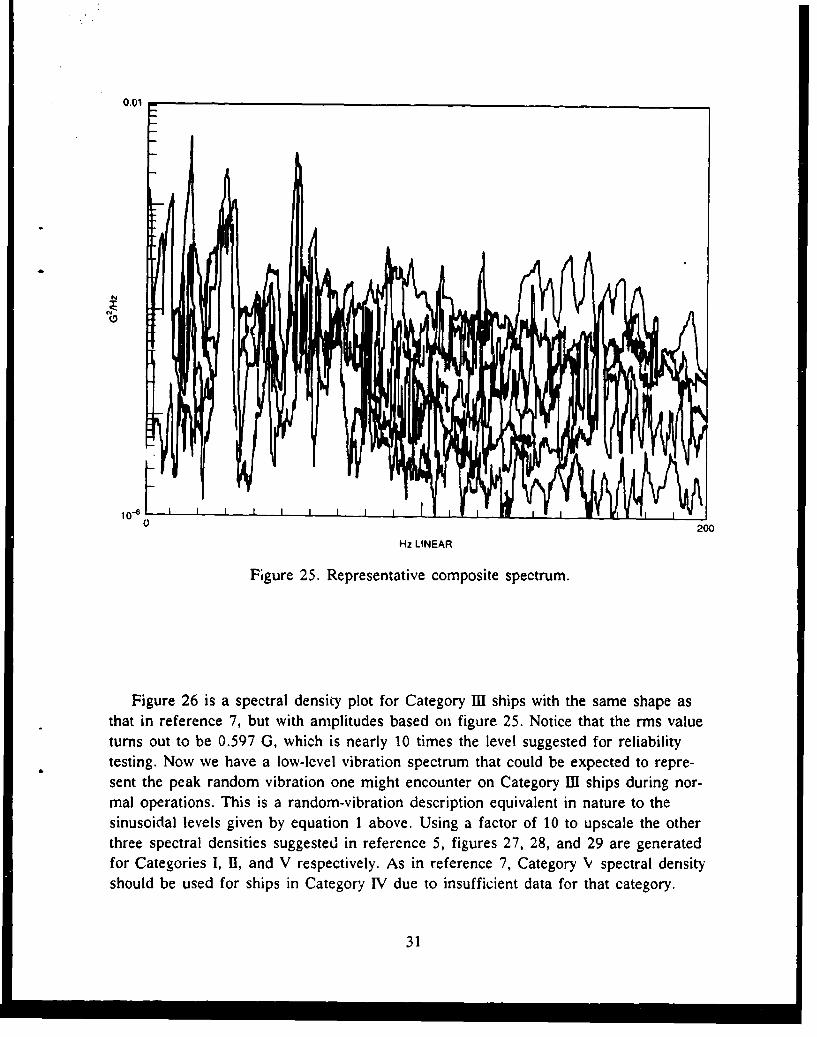
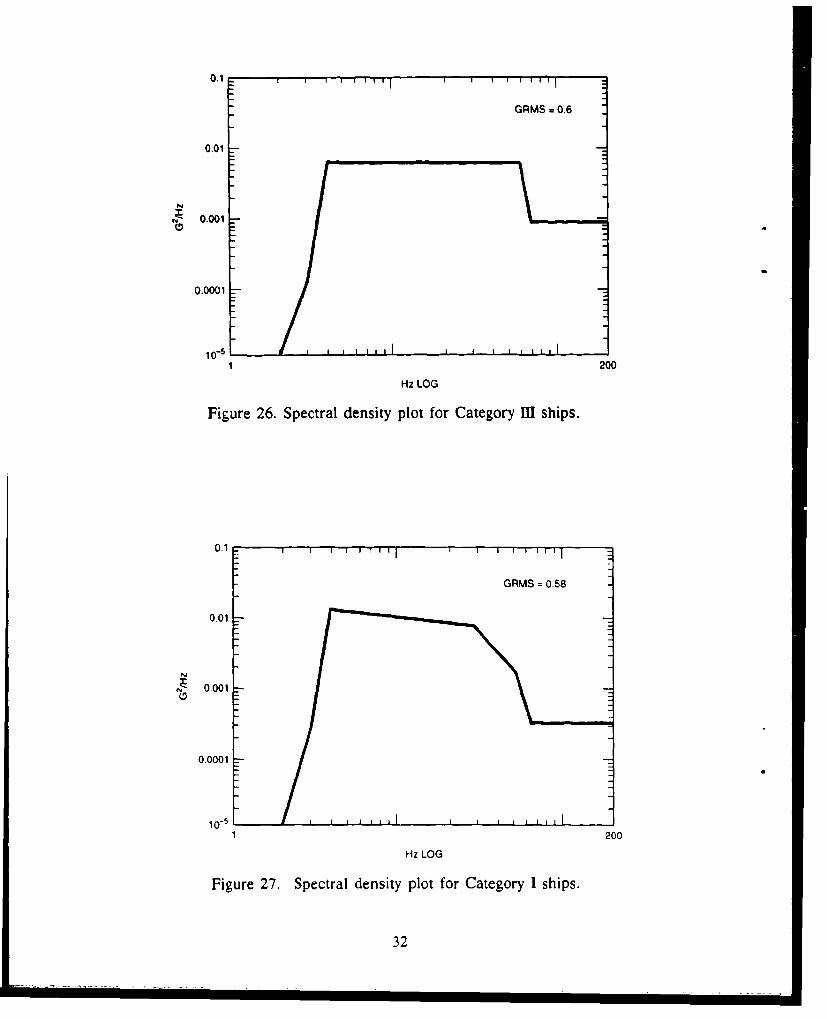
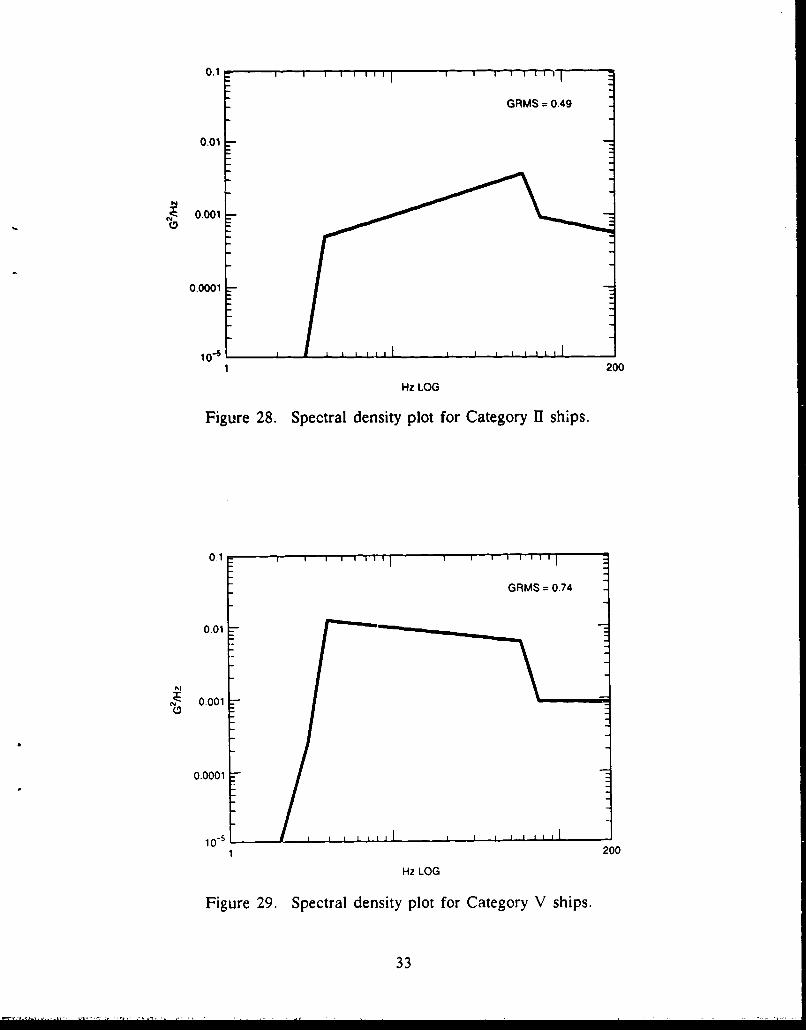
Figure 26 is a spectral density plot for Category 11 ships with the same shape asthat in reference 7, but with amplitudes based on figure 25. Notice that the rms valueturns out to be 0.597 G, which is nearly 10 times the level suggested for reliabilitytesting. Now we have a low-level vibration spectrum that could be expected to repre-sent the peak random vibration one might encounter on Category [] ships during nor-mal operations. This is a random-vibration description equivalent in nature to thesinusoidal levels given by equation 1 above. Using a factor of 10 to upscale the otherthree spectral densities suggested in reference 5, figures 27, 28, and 29 are generatedfor Categories I, II, and V respectively. As in reference 7, Category V spectral densityshould be used for ships in Category IV due to insufficient data for that category.
31
0.1 I ' ' 1 ' 1 1 I I ' '
GRMS =0.6
0.01
0.001
0.0001
10-"
1 200
Hz LOG
Figure 26. Spectral density plot for Category IU1 ships.
0 .1 1 1 1 1 , ,
GRMS = 0.58
0.01
0.001
0.0001
10-51 200
Hz LOG
Figure 27. Spectral density plot for Category I ships.
32
0.1 F I I 1 1 17 ý :
GRMS = 0.49
0.01
0.001
0.0001
10-1200
Hz LOG
Figure 28. Spectral density plot for Category 11 ships.
0.1
GRMS 0.74
0.01
0.001
0.0001
10-s 200
Hz LOG
Figure 29. Spectral density plot for Category V ships.
33
VIBRATION SPECIFICATION
We now have enough information to suggest vibration requirement packages forshipboard electronic equipments that are based on measured low levels. The equip-ments, when exposed to single-frequency vibration at levels described in equations 1and 2, or the random vibration shown in figures 26 through 29, should perform flaw-lessly. These kvels are much lower than might be the case when a ship has sufferedbattle damage or when urgency mandates maneuvers causing high-level vibrations.Because of this, users of these minimal-level requirements should be critical whenjudging acceptability of the equipment. The ability of the equipment to tolerate vibra-tion should be demonstrated under the testing regime given in appendix A (a separatebank of tests should be applied in each major operational state). The test descriptionin appendix A is patterned after MIL-STD-167. It may be included intact inprocurement documents or modified as necessary to accommodate the criticality of theequipment being procured.
EQUIPMENT CRITICALITY AND VIBRATION TOLERANCE
Appendix A can be used as a suggested vibration requirements package suitable fornon-mission-critical shipboard equipment. However, all equipment procured for ship-board use will not be minimal in criticality. What relationship should exist betweencriticality and vibration tolerance? We will assume vibration tolerance of the equipment(and thereby its cost to produce) should increase in direct proportion to the criticalityof the equipment, with lMILSTD-167 levels considered an upper bound except for cer-tain special cases.
We will not propose a method of judging relative criticality of various electronicequipment or its application, except to point out that the levels above represent roughlyone-tenth of what MIL-STD-167 requires. If criticality were judged on a numerical basisfrom 1 to 10, the numeric criticality descriptor could be used directly as a multiplierfor the single-frequency levels given above, and equipment with ruggedness roughlyequal to the criticality of the application should result. Notice that the square of thenumeric criticality descriptor (multiply by 25 to obtain 5 times test level for a criticalitydescriptor of 5) would have to be applied to the random vibration spectral values toobtain the same scaling of requirements and test and ruggedness.
34
TEMPERATURE AND HUMIDITY
Extreme temperature and humidity environments in which ships operate are reason-ably well described in MNL-STD-210 (reference 9). Anchorage, Alaska, was chosen inthe standard to represent the world's lowest temperature navigable port, while Adaban,Iran, was chosen to represent the flattest. Absolute humidity extremes (1 percent) asso-ciated with these are 133 and 30,000 parts per million (ppm), water vapor to dry air,respectively. Reference 9 further states that Belize City, Belize, experiences the highestconstant absolute humidity level, exceeding 25,000 ppm in excess of 20 percent of thetime. Dew points associated with these three absolute humidities are -35'C, 31"C, and28"C, respectively. (Dew point is the temperature at which t,-oisture condenses out ofa mass of air if a volume of that air is cooled while pressure is held constant). Whilethese values of absolute humidity are of impressively high and low extremes, they donot pose much of a problem.
Another commonly used measure of humidity, relative humidity (RH), may providea better assessment of possible difficulty. RH is a dimensionless parameter that relateshow much moisture a body of air contains compared to how much it could contain atthat same temperature and wressurc. With this parameter, the dew points mentionedabove are the temperatures at which air at those absolute humidities reaches 100percent RH, and condensation starts to occur.
Bc,. electronic equipment and humans thrive in environments ranging from 30- to90-percent RH. When local RH gets much below 30 percent, humans tend to growchilled in what ordinarily are considered comfortable temperatures. Humans developitchy skin, dry nasal membranes, and become distracted by the effects of static elec-tricity. Electronic equipment experien,:es problems with clinging paper, accumulatesmore dust than usual, and may have sensitive components destroyed by electrostaticdischarge. How, in the normally humid marine environment, can RH on a ship gobelow 30 percent? It can happen anytime external air with a temperature less then36°F (2.2°C) is brought into the ship and heated to the human comfort zone.
Low moisture content in the air makes the human body's evaporative cooling sys-tem more efficient and thereby causes the "chilled" feelings mentioned above. It islikely that temperature in a space will be raised to offset the "chill" perceived byhumans. Electronic equipment cooling systems do not feel a "chill" in response to lowRH as do humans. Low moisture content only slightly decreases efficiency of non-evaporative cooling processes, such as convective heat transfer oftetl used in electron-ics, but it exacerbates problems that electronics experience stemming from staticelectricity. Further, the temperature increase required by the human operators meansan upward shift in the operating temperature of the electronics, and a likely loss ofreliability.
35
Though problems exist at low RH, the high end of the RH range presents a consid-erably greater problem potential for both humans and electronic equipmen: Forhumans, the body's evaporative cooling system operates with decreased eff ciency. Atlow temperatures, decreased efficiency is not too noticeable. At high tempcrýtures,though, decreased evaporative cooling efficiency detracts from the body's ability toregulate its temperature. This places stringent limits on human activity and will leadhumans to insist on lowered space temperatures. At both high and low temperatures,fungal diseases thrive in the high humidity environment. They quickly become a factorin accounting for elements contributing to reduced human output.
In contrast to the human body, electronic equipment does not suffer from decreasedcooling system efficiency. In fact, the increased amount of moisture in the cooling airslightly increases cooling system efficiency. In addition, the lowered space temperaturesrequired by human occupants lowers the operating temperatures of the electronicequipment, a move that is generally known to enhance reliability of the electronics. Aslong as the electronic equipment contains no fungal nutrient or strongly hygroscopic(water absorbing) materials in its construction, a highly humid environment shouldpresent few problems for electronic equipment.
While discussing high RH environments, note that air chilling equioment is in useon most Navy ships. As with air conditioners used in many homes, shipboard airchillers make little or no attempt to control the relative humidity of the chilled air. Atsea, ambient air is often warm and humid and when chilled to the desired temperaturefor injection into a compartment, it is near saturation. Reference 7 discusses tempera-ture and humidity measurements made in temperature controlled shipboard compart-ments:
Human comfort requirements place a definite low limit on tempera-tures. By whatever means available, (unit heaters, shut down or modu-lation of chilled air supply), temperatures are kept to a range of 50 to770 F (10 to 25"C ..... relative humidity is always high in temperaturecontrolled spaces when ship's ambient air is hot and reasonably moist.It ranges from 48 to 95 percent depending on the mix of outside air torecirculated air, and on the proximity to the exhaust of the chiller.
It should be noted, though, that the temperature of 50*F did correspond with the95-percent RH, and that the condition existed only at the discharge from the chilled airduct. As the chilled air moved into the compartment and picked up some of the heatload, its temperature and humidity moved toward more normal values.
Many commercial test instruments claim the ability to operate in and survive a90-percent RH, noncondensing environment. That they can survive under those condi-tions is more readily understood when you determine that 70*F (21.1 0 C), 90-percentRI- air drawn into the instrument for cooling could become, with a sufficient heat
36
load, 80"F (26.7°C), 65-percent RH air. The waste heat actually improves the humidityenvironment. Note, though, the "noncondensing" qualifier used in their specifications.
Reference 9 provides hourly data for a high absolute humidity (1-percent value)condition near Abadan, Iran (table 1), in which moisture content varied between26,000 and 30,000 ppm while temperature varied between 88 and 105°F (31 to 41°C).RH, however, never rose above 88 percent. Hourly data presented for Belize City,Belize (table 2), describing the highest sustained humidity, discloses moisture contentvarying between 22,000 and 24,000 ppm, and temperature varying between 81 and86°F (27°C and 30°C). In this ';se, the RH ranged from 91 to 94 percent, but con-densation occurred in what reference 9 called the "High Relative Humidity with HighTemperature Daily Cycle" (provided in table 3). The conditions listed in this cycleoccur 1 percent of the time and can be expected in waters near Calcutta, Nanking,Kwajalein Atoll, Seno (Laos), Papua New Guinea, Guyana, Kampot (Cambodia),Paramaribo (Surinam), Vietnam, and similar tropical oceans. The range of moisturecontent in this listing is between 21,400 and 26,000 ppm, while temperature variedbetween 79 and 95°F (26 to 35°C). What is remarkable in this listing is that RH var-ied between 74 and 100 percent and held at 100 percent for 6 hours or more.
Condensation occurs whenever air is cooled to its dew point or below which, for80OF, 90-percent RH air, is only 770F (26.7°C and 25.0°C respectively). These condi-tions can happen readily on a ship. Presume the mechanical refrigeration, which hasbeen performing flawlessly, has kept the temperature in a compartment filled withelectronics at 70°F for several days. Every thing in the compartment that is notactively producing heat has stabilized at 70°F. Suddenly, the air chilling system fails,and temperatures begin to rise in the compartment. When temperatures reach the pointthat alarms are triggered in the installed equipment, doors will be opened, and moist,warm, marine air (say 800 F, 90-percent RH), will be introduced into the compartmentto bring temperatures back within bounds. When that air strikes any of the cooled sur-faces, condensation occurs immediately and continues until enough moisture haschilled out of the marine air to lower its dew point to the temperature of the compart-ment and the electronic equipment. Of course, as the temperature of the marine air islowered, the surfaces and items in the compartment rise in temperature until equilib-rium is again reached. Where does all the moisture go that has been chilled out? It'son all the formerly cool surfaces and inside the formerly cool electronics! What wereonce cool and reasonably dry are now a little warmer and extremely wet. The heat-generating items whose internal temperatures exceeded the dew point of the suddenlyintroduced marine air probably did not suffer internal condensation. Its a safe bet,though, that like everything else in the compartment, all its nonheated and externalsurfaces are wet.
37
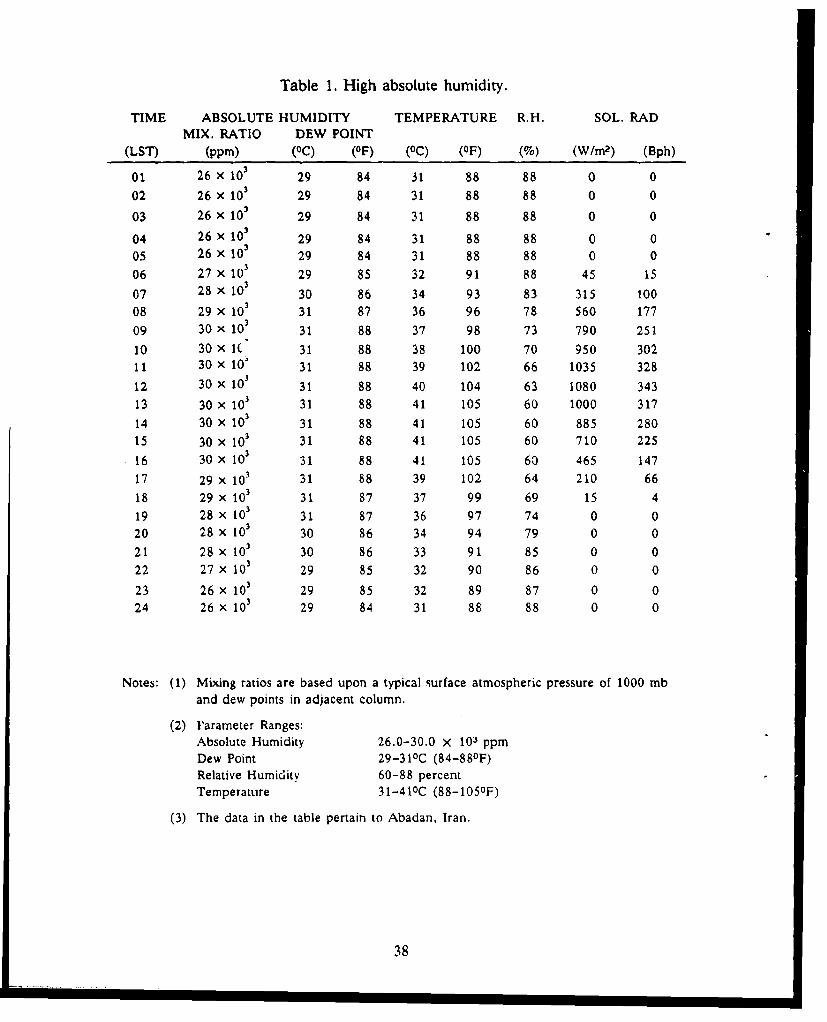
Table 1. High absolute humidity.
TIME ABSOLUTE HUMIDITY TEMPERATURE R.H. SOL. RADMIX. RATIO DEW POINT
(LST) (ppm) (OC) (OF) (oC) (OF) (%) (W/m 2) (Bph)
01 26 x 103 29 84 31 88 88 0 0
02 26 X 103 29 84 31 88 88 0 0
03 26 x 10' 29 84 31 88 88 0 0
04 26 x 103 29 84 31 88 88 0 005 26 x 103 29 84 31 88 88 0 0
06 27 x 103 29 85 32 91 88 45 15
07 28 x 103 30 86 34 93 83 315 too08 29 X 103 31 87 36 96 78 560 177
09 30 x 103 31 88 37 98 73 790 25110 30 x 1( 31 88 38 100 70 950 30211 30 x 10' 31 88 39 102 66 1035 328
12 30 x 103 31 88 40 104 63 1080 34313 30 x 103 31 88 41 105 60 1000 317
14 30 x 10' 31 88 41 105 60 885 28015 30 x 10' 31 88 41 105 60 710 225
16 30 x 103 31 88 41 105 60 465 14717 29 x 103 31 88 39 102 64 210 66
18 29 x 103 31 87 37 99 69 15 419 28 x 103 31 87 36 97 74 0 020 28 x 103 30 86 34 94 79 0 0
21 28 x 103 30 86 33 91 85 0 0
22 27 X 103 29 85 32 90 86 0 0
23 26 x 103 29 85 32 89 87 0 024 26 x 103 29 84 31 88 88 0 0
Notes: (1) Mixing ratios are based upon a typical surface atmospheric pressure of 1000 mband dew points in adjacent column.
(2) Parameter Ranges:Absolute Humidity 26.0-30.0 x 10³ ppmDew Point 29-310 C (84-880 F)Relative Humidity 60-88 percentTemperature 31-41oC (88-1050 F)
(3) The data in the table pertain to Abadan, Iran.
38
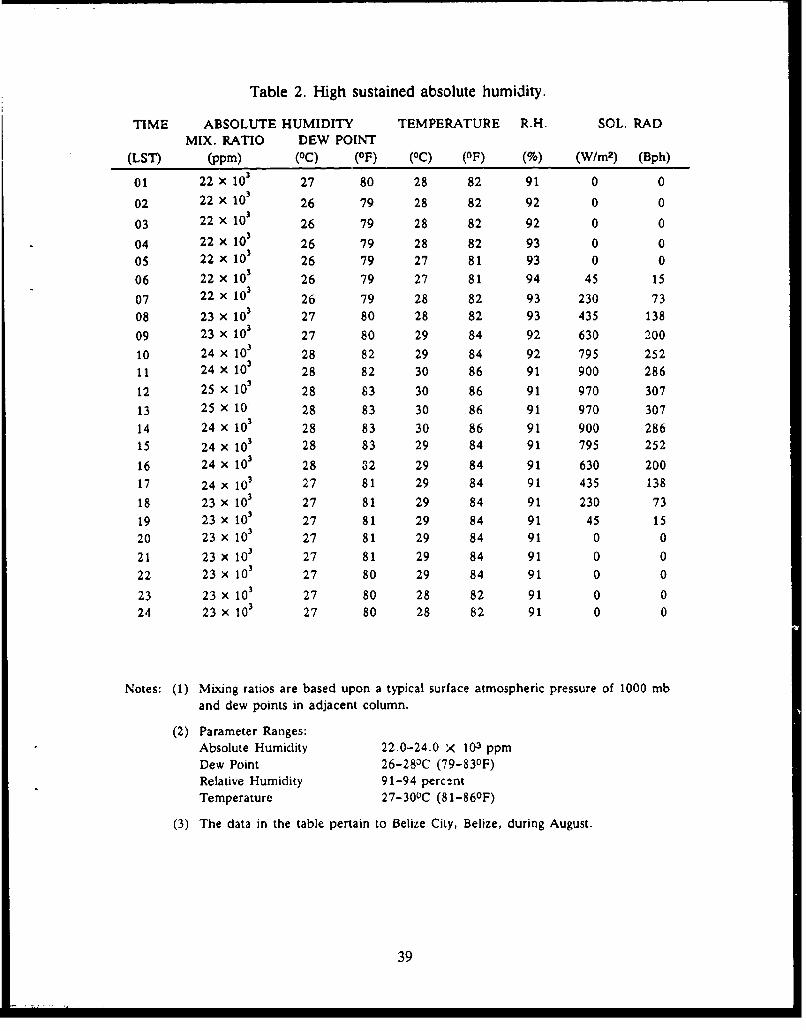
Table 2. High sustained absolute humidity.
TIME ABSOLUTE HUMIDITY TEMPERATURE R.H. SOL. RADMIX. RATIO DEW POINT
(LST) (ppm) (oC) (OF) (oC) (OF) (%) (W/m2) (Bph)
01 22 X 10' 27 80 28 82 91 0 0
02 22 X 103 26 79 28 82 92 0 0
03 22 X 10' 26 79 28 82 92 0 0
04 22 X 103 26 79 28 82 93 0 005 22 x 103 26 ?9 27 81 93 0 0
06 22 x 103 26 79 27 81 94 45 15
07 22 x 103 26 79 28 82 93 230 7308 23 X 103 27 80 28 82 93 435 138
09 23 x 103 27 80 29 84 92 630 200
10 24 X 103 28 82 29 84 92 795 25211 24 x 103 28 82 30 86 91 900 286
12 25 x 103 28 83 30 86 91 970 307
13 25 x 10 28 83 30 86 91 970 307
14 24 x 103 28 83 30 86 91 900 28615 24 X 103 28 83 29 84 91 795 252
16 24 x 103 28 32 29 84 91 630 200
17 24 x 103 27 81 29 84 91 435 138
18 23 x 103 27 81 29 84 91 230 73
19 23 x 103 27 81 29 84 91 45 15
20 23 X 103 27 81 29 84 91 0 0
21 23 X 103 27 81 29 84 91 0 0
22 23 X 103 27 80 29 84 91 0 0
23 23 x 103 27 80 28 82 91 0 0
24 23 X 103 27 80 28 82 91 0 0
Notes: (1) Mixing ratios are based upon a typical surface atmospheric pressure of 1000 mband dew points in adjacent column.
(2) Parameter Ranges:Absolute Humidity 22.0-24.0 X 10³ ppm
Dew Point 26-283C (79-830 F)Relative Humidity 91-94 percentTemperature 27--30OC (81-860 F)
(3) The data in the table pertain to Belize City, Belize, during August.
39
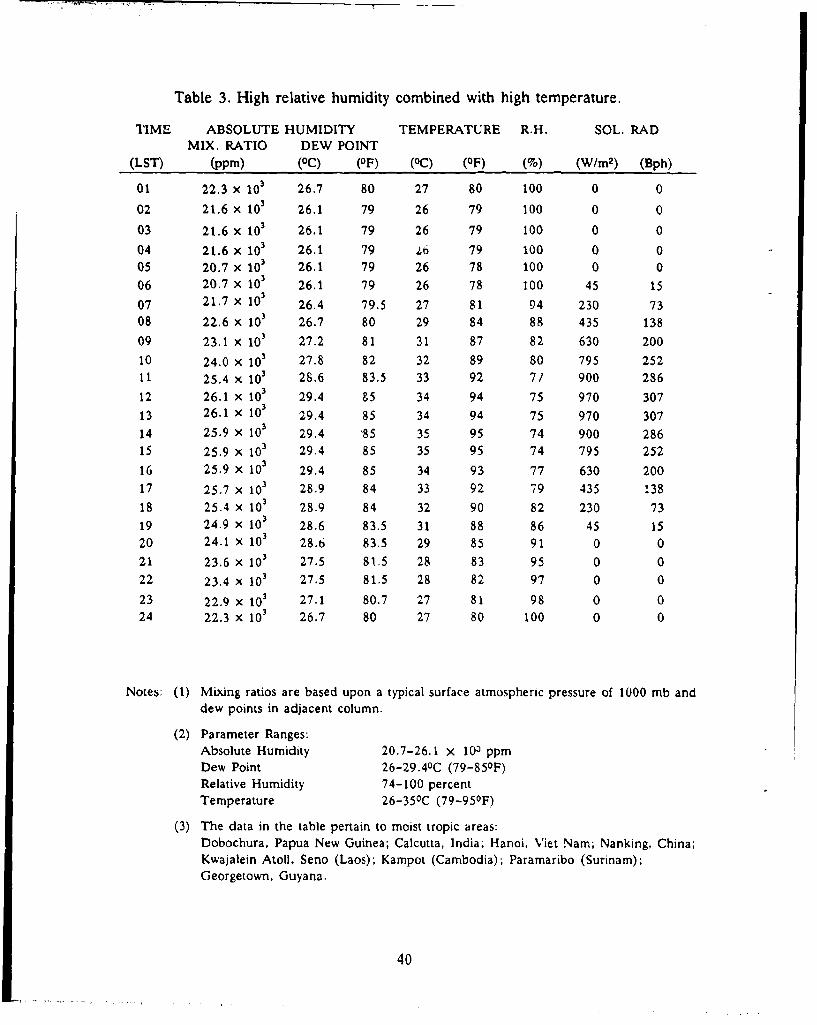
Table 3. High relative humidity combined with high temperature.
TIME ABSOLUTE HUMIDITY TEMPERATURE R.H. SOL. RADMIX. RATIO DEW POINT
(LST) (,ppm) (°C) (OF) (oc) (01F) M% (W/m2) (Bph)
01 22.3 x 10' 26.7 80 27 80 100 0 0
02 21.6 X 10' 26.1 79 26 79 100 0 0
03 21.6 x 10' 26.1 79 26 79 100 0 0
04 21.6 x 10³ 26.1 79 206 79 100 0 005 20.7 x 10³ 26.1 79 26 78 100 0 006 20.7 X 10³ 26.1 79 26 78 100 4 1
07 21.7 x 10³ 26.4 79.5 27 81 94 230 7308 22.6 x 10' 26.? 80 29 84 88 435 13809 23.1 x 101 27.2 81 31 87 82 630 200
10 24.0 x 10³ 27.8 82 32 89 80 795 25211 25.4 x 10³ 28.6 83.5 33 92 71 900 28612 26.1 x 10' 29.4 95 34 94 75 970 30713 26.1 x 10 3 29.4 85 34 94 75 970 30714 25.9 X 10³ 29.4 '85 35 95 74 900 286is 25.9 X 10³ 29.4 85 35 95 74 795 25216 25.9 x 10 3 29.4 85 34 93 77 630 200
17 25,7 x 10' 28.9 84 33 92 79 435 138is 25.4 x 10³ 28.9 84 32 90 82 230 7319 24.9 x 10 3 28.6 83.5 31 88 86 45 1520 24.1 X 10³ 28.6 83.5 29 85 91 0 021 23.6 X 10³ 27.5 81.5 28 83 95 0 022 23.4 x 10³ 27.5 81.5 28 82 97 0 0
23 22.9 X 10' 27.1 80.7 27 81 98 0 024 22.3 x 10' 26.7 80 27 80 100 0 0
Notes: (1) Mixing ratios are based upon a typical surface atmospheric pressure of 1000 mb andI dew points in adjacent column.
(2) Parameter Ranges:Absolute Humidity 20.7-26.1 x 10³ ppmnDew• Point 26-29.40C (79-850F)Relative Humidity 74-100 percentTemperature 26-350C (79-950F)
(3) The data in the table pertain to moist tropic areas:Dobochura, Papua New Guinea; Calcutta, India; Hanoi, Viet Nam; Nanking, China;Kwajalein Atoll, Seno (Laos); Kampot (Cambodia); Paramaribo (Surinam);Georgetown, Guyana.
40
Another way in which condensation may happen is through radiant heat transfer.For condensation to occur on a surface, the surface must be colder than the surround-ing air. For example, automobiles collect dew during the night through radiant heattransfer. One would think that the metal of an automobile, surrounded by natural airwould not have a chance to become colder than the air. A body of warm air might
cross the area after the automobile had stabilized at a lower temperature, but air tem-perature over large areas is generally constant and such an event is not likely. Horizon-tal surfaces are the first to become wet, and as time goes by, the wetting proceeds toless horizontal, and finally to nearly vertical surfaces. Also, dew seldom forms on sur-faces sheltered from a direct view of the outer sky (e.g., a carport, the branches of atree, or clouds) The cooling mechanism here is radiation. The surfaces with the mostdirect path (least resistance to radiant heat transfer) to the outer sky cool to the dewpoint first, and other surfaces follow along as time makes up for their longer path. Aslong as the path is not blocked, this process continues, sometimes reaching the pointwhere ice is formed even though the air temperature has not dropped to fret.zing. Thistype of condensation is not likely to occur on equipment located inside a ship, but if acool black surface exists near a planned interior mounting location, condensation onthe installed equipment due to radiant heat transfer is possible.
Temperaiture and humidity measurements were made during the shipboard environ-ment measurement program reported in reference 3. A high temperature of 122°F(50°C) was measured during the program in the AEW (Aircraft Early Warning) Roomon the USS Hancock (CVA 19), but as was discussed in references 3 and 7, that tem-perature was caused by inadequate air circulation in the compartment. The situationwas easy to correct and was one which an equipment design should not have to accom-modate as a usual environment. Because it was almost certain that the measurementprogram would not be performed with local area temperatures at extremes, sensorswere installed so as to document differences in temperature between air entering andexiting a particular compartment. With documented temperature rises, we could thendetermine what the compartment temperatures would probably be under whateverextreme ambient temperatures the ship might experience. Except for the AEW Roomon the Hancock, no temperature rises exceeding 22°F (12°C) were found. Using thePersian Gulf 20-percent high temperature of 109°F (430C) from reference 9 (a tem-perature that is exceeded 20-percent of the time), one could expect temperatures of131°F (5500) in the electronic spaces on ships with similar temperature rises.
While the temperature calculated above appears unusually high at first glance,remember that it represents the temperature of the air exiting an electronics compart-ment. This is air that has completed a cooling pass through the installed electronics.Good design requires precluding air of this temperature being drawn into other equip-ment for cooling. Also remember that the 22°F temperature rise was measured inelectronic compartments where no air chilling was employed. In an air-chilled
41
compartment, inlet temperatures were measured as low as 50°F (100C), and oftenwere found at around 65°F (180C). With these inlet temperatures, air leaving the com-partment would range from 72 to 87°F (22 to 31°C).
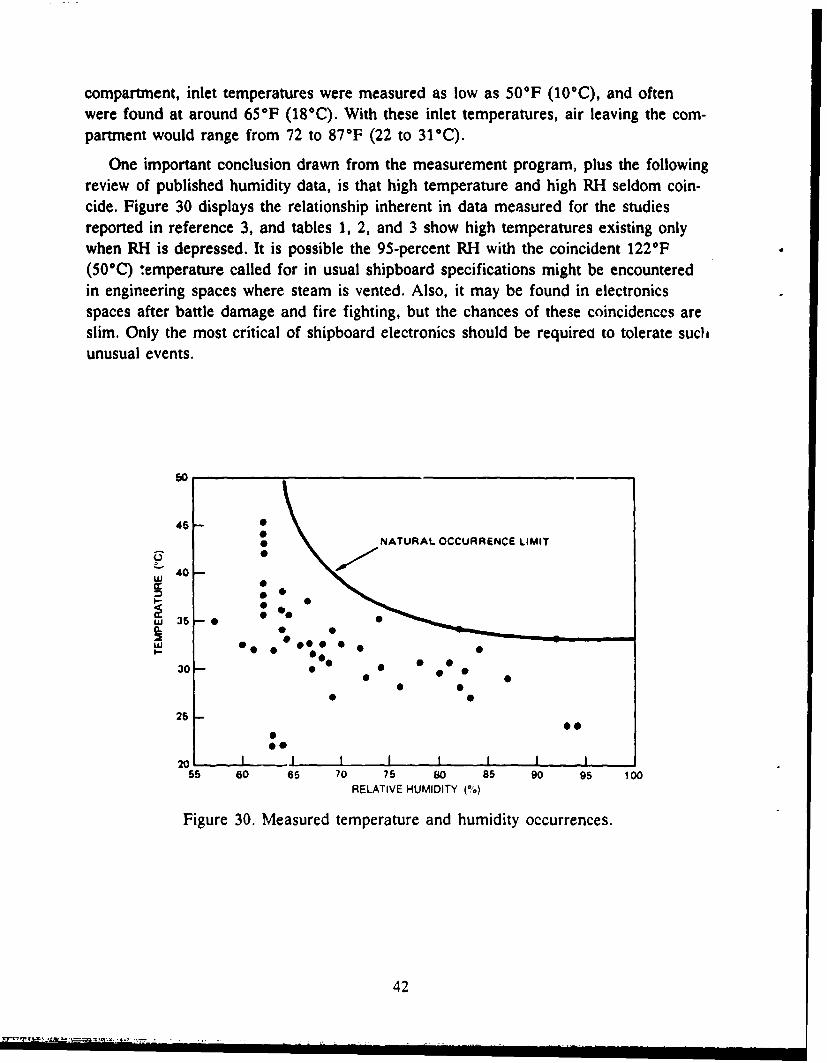
One important conclusion drawn from the measurement program, plus the followingreview of published humidity data, is that high temperature and high RH seldom coin-cide. Figure 30 displays the relationship inherent in data measured for the studiesreported in reference 3, and tables 1, 2, and 3 show high temperatures existing onlywhen RH is depressed. It is possible the 95-percent RH with the coincident 122 0 F(500C) temperature called for in usual shipboard specifications might be encounteredin engineering spaces where steam is vented. Also, it may be found in electronicsspaces after battle damage and fire fighting, but the chances of these coincidenccs areslim. Only the most critical of shipboard electronics should be required to tolerate suchunusual events.
50
4--NATURAL OCCURRENCE LIMIT
40
S35 - • 0 0 •C. 40
w 36 00030- : 0. 0 0
I- 0
0 0
25 -00
20 - I I I I I I I56 60 65 70 75 8o 85 90 95 100
RELATIVE HUMIDITY (%)
Figure 30. Measured temperature and humidity occurrences.
42
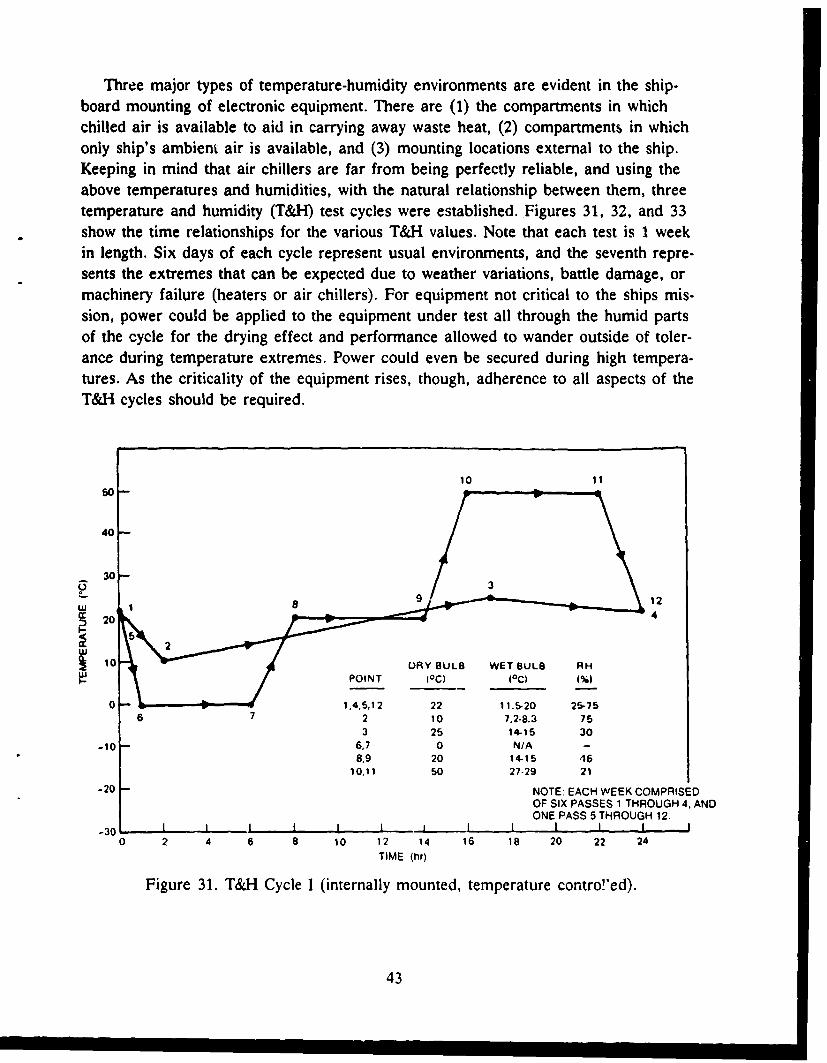
Three major types of temperature-humidity environments are evident in the ship-board mounting of electronic equipment. There are (1) the compartments in whichchilled air is available to aid in carrying away waste heat, (2) compartments in whichonly ship's ambient air is available, and (3) mounting locations external to the ship.Keeping in mind that air chillers are far from being perfectly reliable, and using theabove temperatures and humidities, with the natural relationship between them, threetemperature and humidity (T&H) test cycles were established. Figures 31, 32, and 33show the time relationships for the various T&H values. Note that each test is 1 weekin length. Six days of each cycle represent usual environments, and the seventh repre-sents the extremes that can be expected due to weather variations, battle damage, ormachinery failure (heaters or air chillers). For equipment not critical to the ships mis-sion, power could be applied to the equipment under test all through the humid partsof the cycle for the drying effect and performance allowed to wander outside of toler-ance during temperature extremes. Power could even be secured during high tempera-tures. As the criticality of the equipment rises, though, adherence to all aspects of theT&H cycles should be required.
10 1150
40-
. 30
212
W4
M
-2 10 NRY BULB WETOBULB RHSPOINT 10c) 40C)()
0 -- 1,41,15,12 22 11.5-20 25-75
O SI2 10 712-8.3 753 25 1TR15 30
-10 -- 6,7 0 N/A8,9 20 14-15 46
10,11 50 27-29 211
-20 -NOTE: EACH WEEK COMPRISEDOF SIX PASSES 1 THROUGH 4, ANDONE PASS 5 THROUGH 12,
-30 1 1 1 ,.1 III . I
0 2 4 6 8 10 12 14 16 18 20 22 24
TIME (hr)
Figure 31. T&H Cycle I (internally mounted, temperature contro!'ed).
43
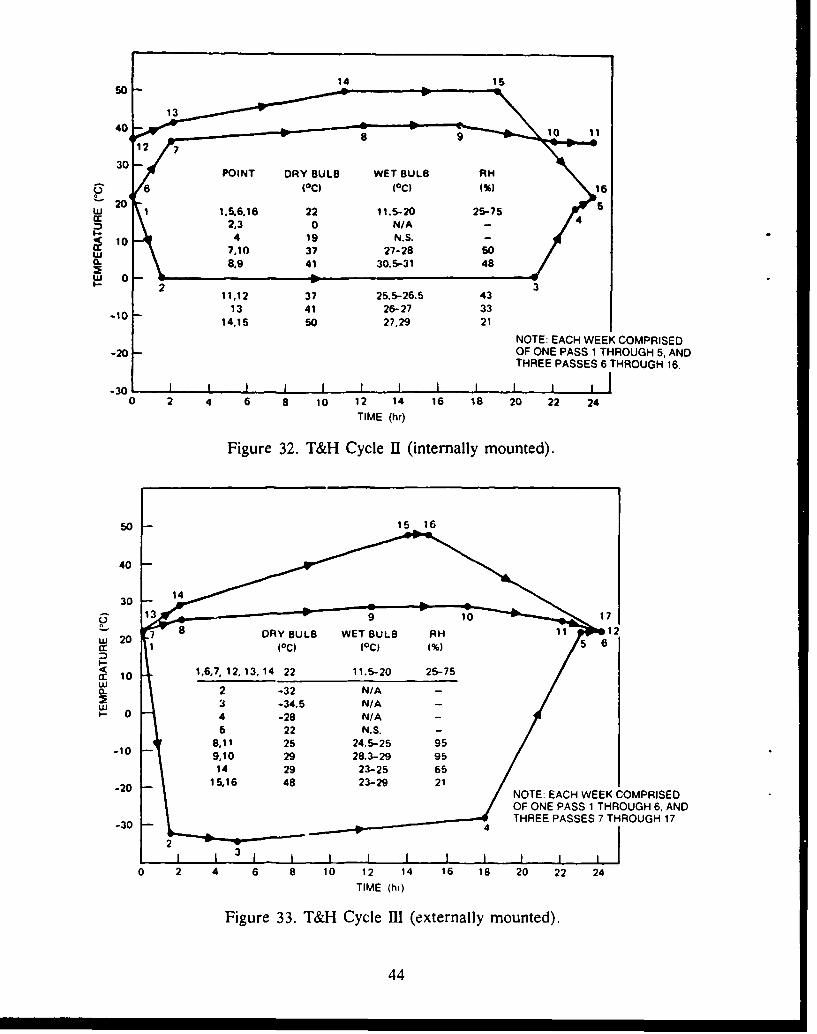
so-14 Is
13
710 37 27-28 50
8.9 41 30.6-31 48
11612 37 25.7-26.5 4313 41 26-27 33
-10 4-9NS
14.15 50 27,29 21
NOTE: EACH WEEK COMPRISED-20 OF ONE PASS 1 THROUGH 5, AND
THREE PASSES 6 THROUGH 16.-30 I 4 3 48
0 2 4 6 8 10 12 14 16 18 20 22 24
TIME (hr)
Figure 32. T&H Cycle 11 (internally mounted).
5015 6
40 -
30 1
°•8DRY BULB WET BULB RH 1
Lu 20 6c(C
I- 2 10 1,6,7, 12, 13, 14 22 11.5-20 26-75
0.2 -32 N/A --
w~u 3 -34.5 N/A -
6 22 N.S. -8,11 25 24.6-25 95
-10 9.10 29 28.3-29 95
-2092325 6NOTE: EACH WEEK COMPRISEDOF ONE PASS 1 THROUGH 6, ANDTHREE PASSES 7 THROUGH 17
-301
0 2 4 6 B 10 12 14 16 18 20 22 24
TIME (hi)
Figure 33. T&H Cycle m (externally mounted).
44
MECHANICAL SHOCK
Mechanical shock is a dynamic disturbance that is short relative to the natural fre-quency of the system being excited. Under that definition, Navy ships have a highprobability of being rich shock sources for installed electronic equipment.
Shock on a ship can result from many sources. Some of the apparent sources arenot of great concern, due to the magnitude or length of time, of the energy release.Collisions, traumatic as they are, and in spite of the severe resulting damage, actuallycause negligible levels of shock due to the relatively long rise time of the generatedforces. The handling of cargo, such as provisions, boats, military vehicles and so on,sets up situations that can readily result in mechanical shock. But energy released inrough handling (even dropped items) of cargo is relatively small. As is the case forcollisions, cargo handling does not often cause sudden transient motions to be gener-ated and propagated throughout the ship.
On the other hand, the firing of the ships weapons (chaff launchers, guns, and mis-siles) and operation of the catapults and arresting gear on carriers, cause sudden tran-sient motion (shock) levels that pose potential problems for installed electronics. Theseare discussed in the following subparagraphs:
a. Recoil forces from large guns present little or no difficulty due to excellentdesign of the recoil systems. In the task reported in reference 3, problems werereported with shipboard equipment dealing with ownship gunfire shock, but mostof the troubled equipment (none of it electronic) suffered from the effects ofmuzzle blast, rather than recoil shock. All of the troubled equipment wasmounted external to the superstructure or on the inside of bulkheads or theundersides of decks exposed directly to muzzle blast. Measured shock levelsfrom gun recoil on decks and internal bulkheads were all less than 1 G.
b. Chaff launchers were not installed on ships on which measurements were made,so hard data are not available here. Subjectively, response of the ship's structureto the firing of the launchers is much less than that of a low-level underwaternear-miss explosion. If electronic equipment being procured must be mountedwithin 30 feet of a chaff launcher, it would be prudent to establish the shock
environment created by the launcher and require appropriate tolerance of theequipment.
c. Like recoil mechanisms, arresting gear on carriers is well designed and createsno appreciable general shock environment. Catapults, however, are not as wellbehaved. Water brakes at the forward end of each catapult bring the movingmass of the catapult to rest in a very short distance. A radar repeater mountedin Secondary Conn on the Hancock, a compartment located just below the flightdeck and between the two forward catapult;, experienced difficulty with the
45
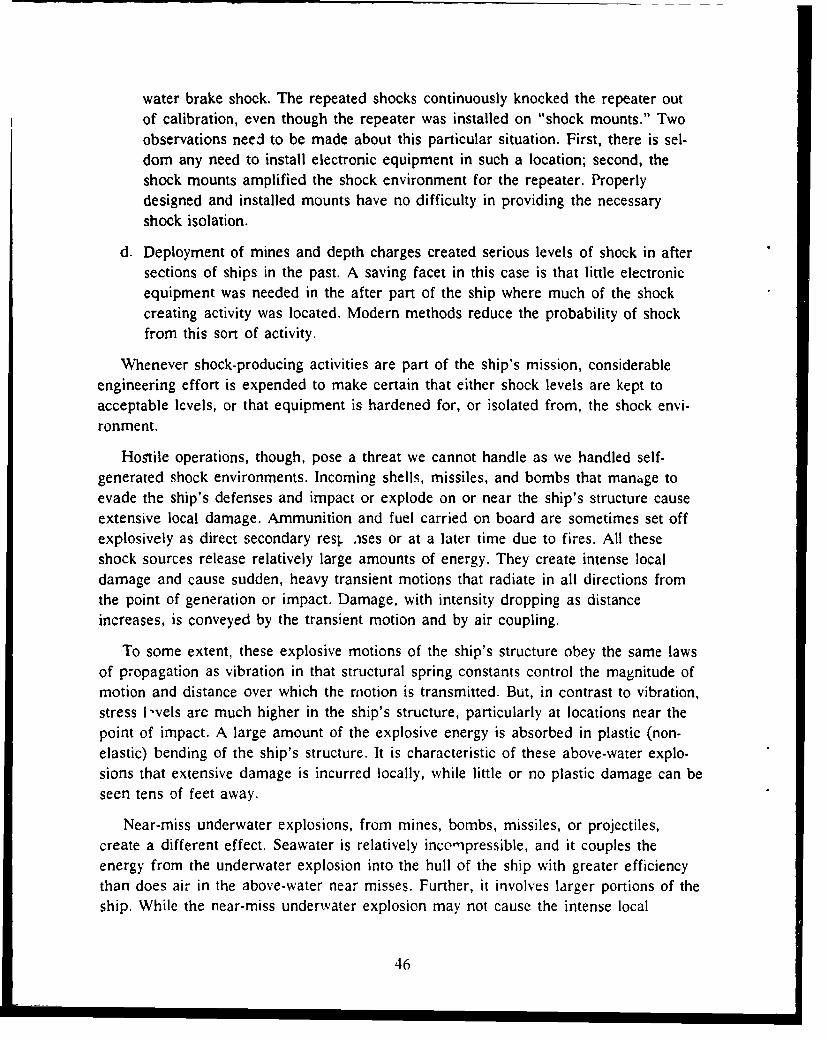
water brake shock. The repeated shocks continuously knocked the repeater outof calibration, even though the repeater was installed on "shock mounts." Twoobservations need to be made about this particular situation. First, there is sel-dom any need to install electronic equipment in such a location; second, theshock mounts amplified the shock environment for the repeater. Properlydesigned and installed mounts have no difficulty in providing the necessaryshock isolation.
d. Deployment of mines and depth charges created serious levels of shock in aftersections of ships in the past. A saving facet in this case is that little electronicequipment was needed in the after part of the ship where much of the shockcreating activity was located. Modern methods reduce the probability of shockfrom this sort of activity.
Whenever shock-producing activities are part of the ship's mission, considerableengineering effort is expended to make certain that either shock levels are kept toacceptable levels, or that equipment is hardened for, or isolated from, the shock envi-ronment.
Hostile operations, though, pose a threat we cannot handle as we handled self-generated shock environments. Incoming shells, missiles, and bombs that manage toevade the ship's defenses and impact or explode on or near the ship's structure causeextensive local damage. Ammunition and fuel carried on board are sometimes set offexplosively as direct secondary rest. ases or at a later time due to fires. All theseshock sources release relatively large amounts of energy. They create intense localdamage and cause sudden, heavy transient motions that radiate in all directions fromthe point of generation or impact. Damage, with intensity dropping as distanceincreases, is conveyed by the transient motion and by air coupling.
To some extent, these explosive motions of the ship's structure obey the same laws
of propagation as vibration in that structural spring constants control the magnitude ofmotion and distance over which the motion is transmitted. But, in contrast to vibration,stress i-vels are much higher in the ship's structure, particularly at locations near thepoint of impact. A large amount of the explosive energy is absorbed in plastic (non-elastic) bending of the ship's structure. It is characteristic of these above-water explo-sions that extensive damage is incurred locally, while little or no plastic damage can beseen tens of feet away.
Near-miss underwater explosions, from mines, bombs, missiles, or projectiles,create a different effect. Seawater is relatively inc-i pressible, and it couples theenergy from the underwater explosion into the hull of the ship with greater efficiencythan does air in the above-water near misses. Further, it involves larger portions of theship. While the near-miss underwater explosion may not cause the intense local
46
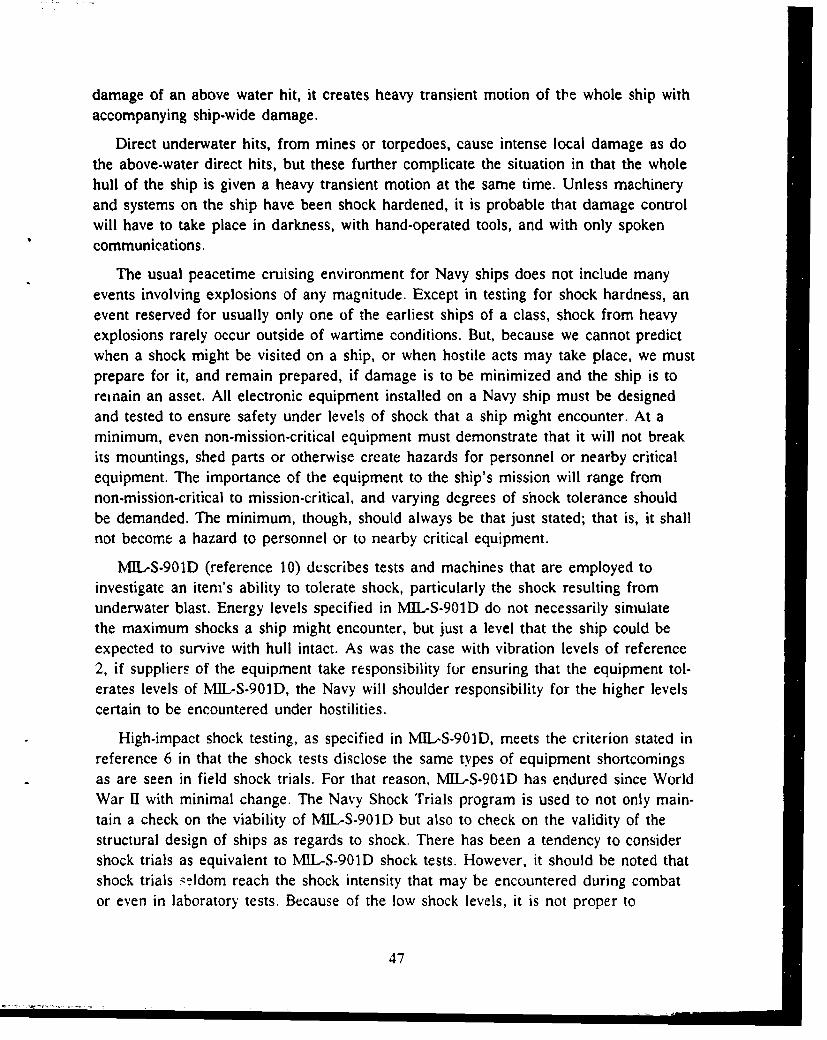
damage of an above water hit, it creates heavy transient motion of tl'e whole ship withaccompanying ship-wide damage.
Direct underwater hits, from mines or torpedoes, cause intense local damage as dothe above-water direct hits, but these further complicate the situation in that the wholehull of the ship is given a heavy transient motion at the same time. Unless machineryand systems on the ship have been shock hardened, it is probable that damage controlwill have to take place in darkness, with hand-operated tools, and with only spokencommunications.
The usual peacetime cruising environment for Navy ships does not include manyevents involving explosions of any magnitude. Except in testing for shock hardness, anevent reserved for usually only one of the earliest ships of a class, shock from heavyexplosions rarely occur outside of wartime conditions. But, because we cannot predictwhen a shock might be visited on a ship, or when hostile acts may take place, we mustprepare for it, and remain prepared, if damage is to be minimized and the ship is toremnain an asset. All electronic equipment installed on a Navy ship must be designedand tested to ensure safety under levels of shock that a ship might encounter. At aminimum, even non-mission-critical equipment must demonstrate that it will not breakits mountings, shed parts or otherwise create hazards for personnel or nearby criticalequipment. The importance of the equipment to the ship's mission will range fromnon-mission-critical to mission-critical, and varying degrees of shock tolerance shouldbe demanded. The minimum, though, should always be that just stated; that is, it shallnot become a hazard to personnel or to nearby critical equipment.
MIL-S-901D (reference 10) describes tests and machines that are employed toinvestigate an item's ability to tolerate shock, particularly the shock resulting fromunderwater blast. Energy levels specified in IvL-S-901D do not necessarily simulatethe maximum shocks a ship might encounter, but just a level that the ship could beexpected to survive with hull intact. As was the case with vibration levels of reference2, if suppliers of the equipment take responsibility for ensuring that the equipment tol-erates levels of MIL-S-901D, the Navy will shoulder responsibility for the higher levelscertain to be encountered under hostilities.
High-impact shock testing, as specified in MIL-S-901D, meets the criterion stated inreference 6 in that the shock tests disclose the same types of equipment shortcomingsas are seen in field shock trials. For that reason, MIL-S-901D has endured since WorldWar 11 with minimal change. The Navy Shock Trials program is used to not only main-tain a check on the viability of MIL-S-901D but also to check on the validity of thestructural design of ships as regards to shock. There has been a tendency to considershock trials as equivalent to MIL-S-901D shock tests. However, it should be noted thatshock trials 'eldom reach the shock intensity that may be encountered during combator even in laboratory tests. Because of the low shock levels, it is not proper to
47
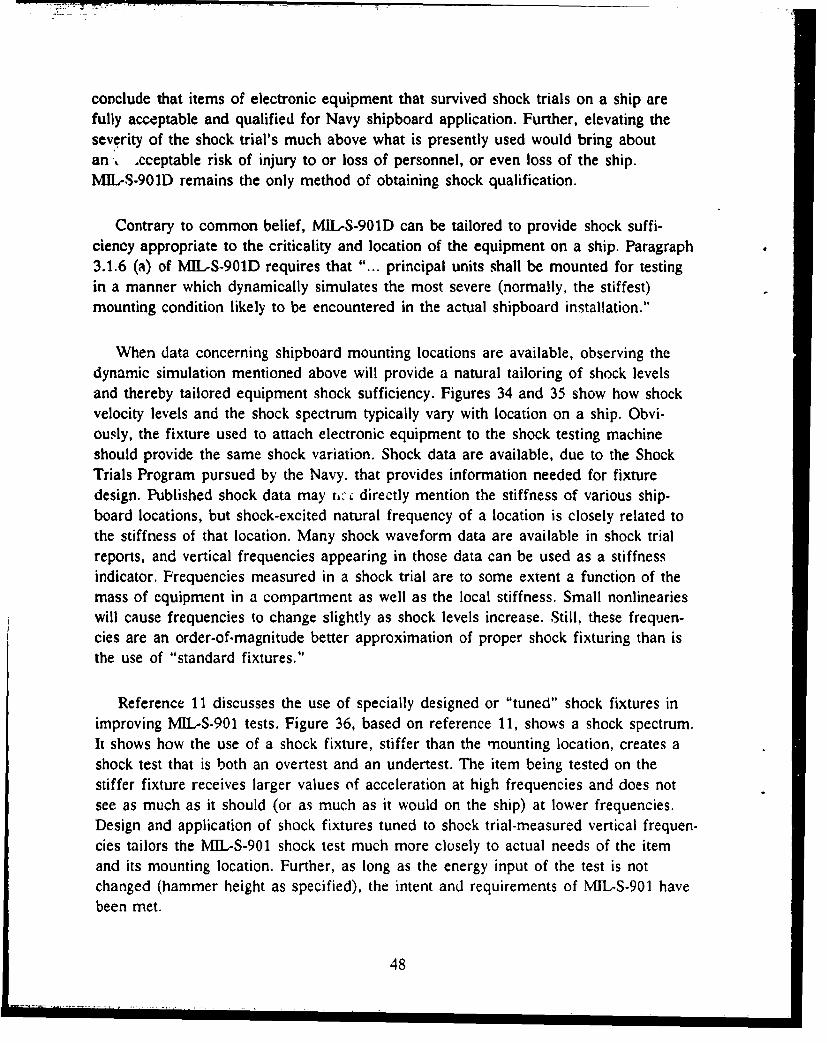
conclude that items of electronic equipment that survived shock trials on a ship arefully acceptable and qualified for Navy shipboard application. Further, elevating theseverity of the shock trial's much above what is presently used would bring aboutan. .cceptable risk of injury to or loss of personnel, or even loss of the ship.MIL-S-901D remains the only method of obtaining shock qualification.
Contrary to common belief, MIL-S-901D can be tailored to provide shock suffi-ciency appropriate to the criticality and location of the equipment on a ship. Paragraph3.1.6 (a) of MIL-S-901D requires that "... principal units shall be mounted for testingin a manner which dynamically simulates the most severe (normally, the stiffest)mounting condition likely to be encountered in the actual shipboard installation."
When data concerning shipboard mounting locations are available, observing thedynamic simulation mentioned above will provide a natural tailoring of shock levelsand thereby tailored equipment shock sufficiency. Figures 34 and 35 show how shockvelocity levels and the shock spectrum typically vary with location on a ship. Obvi-ously, the fixture used to attach electronic equipment to the shock testing machineshould provide the same shock variation. Shock data are available, due to the ShockTrials Program pursued by the Navy. that provides information needed for fixturedesign. Published shock data may ti, . directly mention the stiffness of various ship.board locations, but shock-excited natural frequency of a location is closely related tothe stiffness of that location. Many shock waveform data are available in shock trialreports, and vertical frequencies appearing in those data can be used as a stiffnessindicator. Frequencies measured in a shock trial are to some extent a function of themass of equipment in a compartment as well as the local stiffness. Small nonlinearieswill cause frequencies to change slightly as shock levels increase. Still, these frequen-cies are an order-of-magnitude better approximation of proper shock fixturing than isthe use of "standard fixtures."
Reference 11 discusses the use of specially designed or "tuned" shock fixtures inimproving MIL-S.901 tests. Figure 36, based on reference 11, shows a shock spectrum.It shows how the use of a shock fixture, stiffer than the mounting location, creates ashock test that is both an overtest and an undertest. The item being tested on thestiffer fixture receives larger values of acceleration at high frequencies and does notsee as much as it should (or as much as it would on the ship) at lower frequencies.Design and application of shock fixtures tuned to shock trial-measured vertical frequen-cies tailors the M1L-S-901 shock test much more closely to actual needs of the itemand its mounting location. Further, as long as the energy input of the test is notchanged (hammer height as specified), the intent and requirements of MJL-.S-901 havebeen met.
48
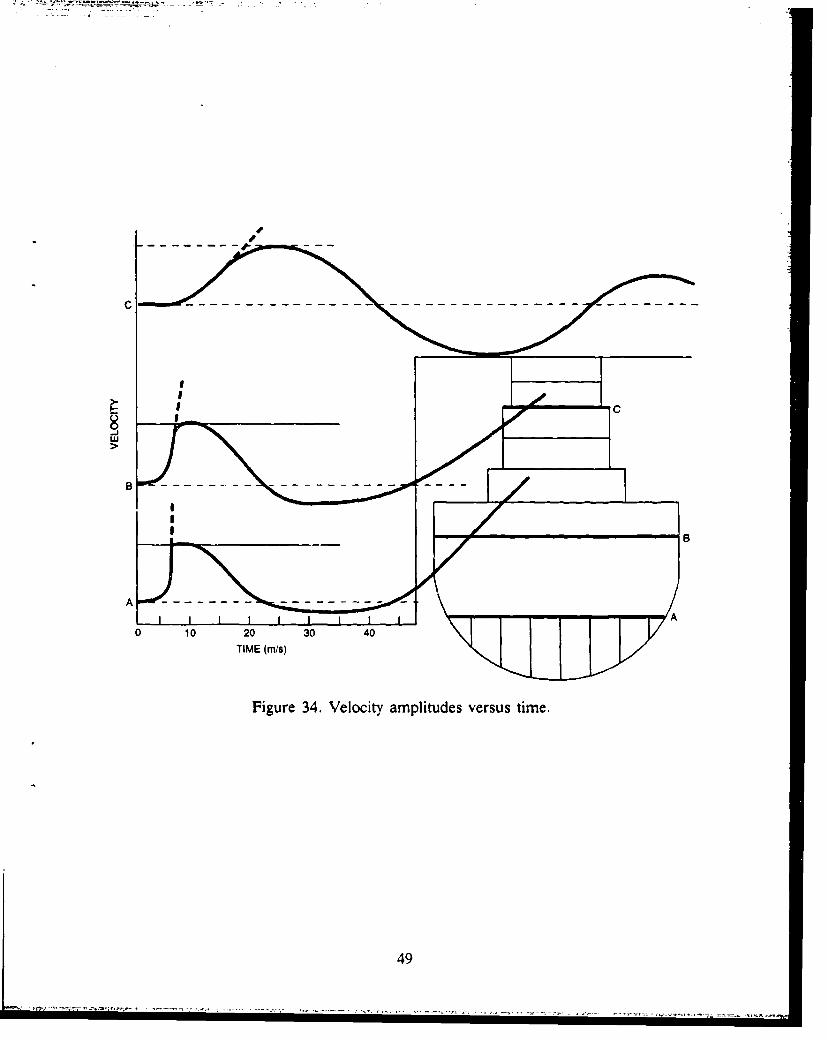
C-C
UJU
0 10 20 30 40
TIME (m/s)
Figure 34. Velocity amplitudes versus time.
49
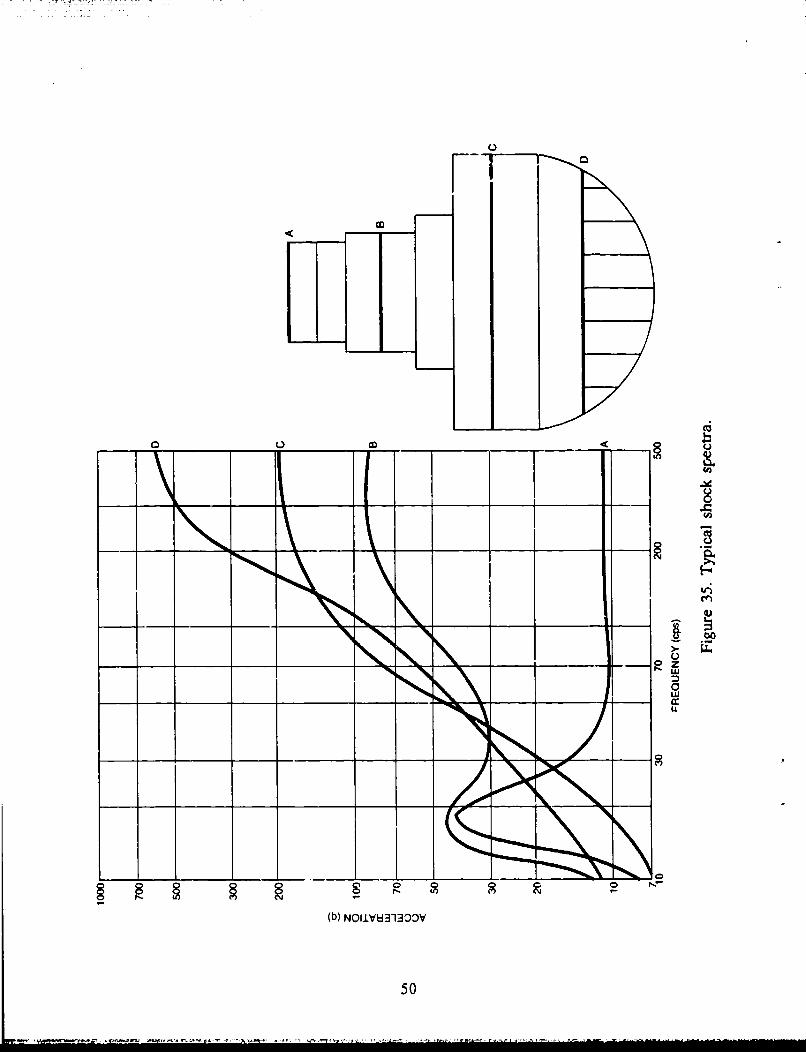
0
___ o___ ___
I ~cc
(b) N0liV31300V
50
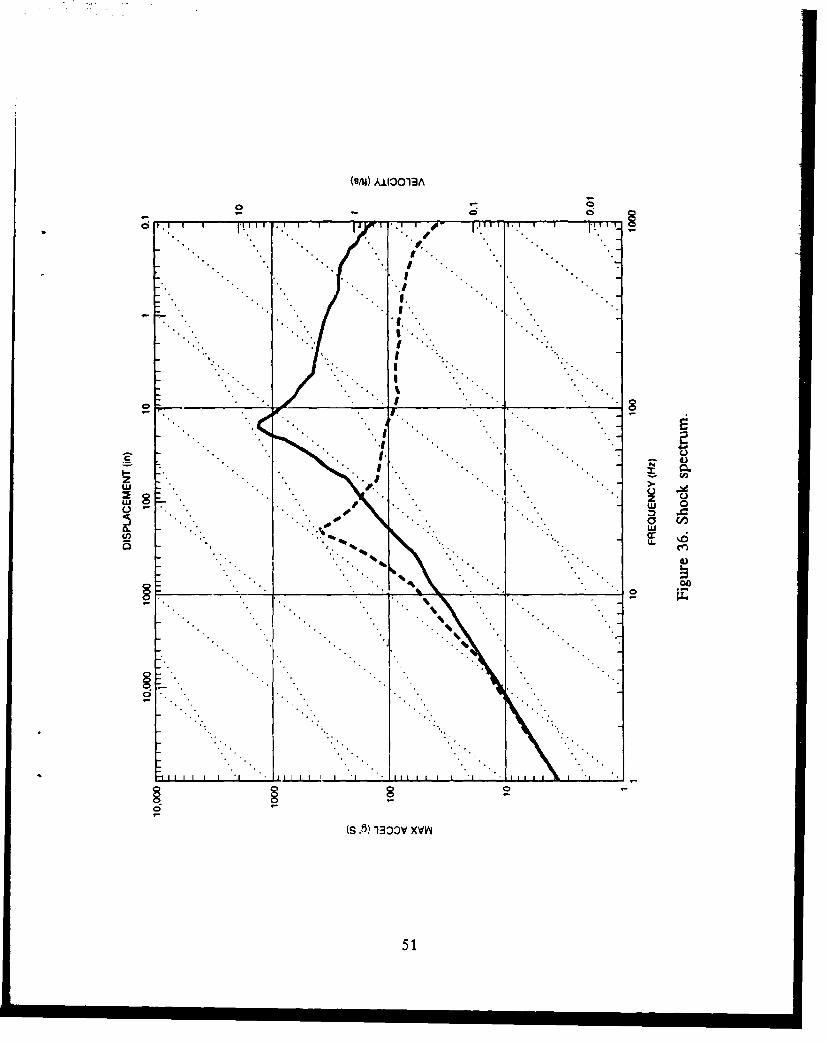
(S/U) A113O13A
Q -7
( .1) 13 V *.V
.51
DISCUSSION AND CONCLUSIONS
Information provided in this report allows selection of off-the-shelf equipment thatis capable of serving on board Navy surface ships. Where the equipment falls short ofwhat is required, techniques, algorithms, and data are supplied that will allow minimalmodification in order to meet ship environment and equipment criticality needs. A sug-gested approach follows:
a. Determine the worst-case installation location with regard to vibration. Gener-ally, that is a location having the shortest vector distance to the stem of theships on which the equipment is to be installed. Consider the criticality of theapplication and calculate the single-frequency vibration amplitude to be used inthe procurement specifications.
b. Review temperature and humidity data provided in this report, decide thecriticality of the application, and select appropriate temperature and humidityranges for the procurement specifications.
c. Review shock trials data to determine typical vertical natural frequencies ofintended installation locations. Specify that the equipment is to meet theMIL-901D shock test while mounted on a fixture providing the lowest naturalfrequency. NOTE: If natural frequencies of possible mountings differ by morethan 25 percent of the lower frequency, use two or more shock fixtures.
d. Ensure that procurement specifications insist that the equipment's ability to meetall environmental requirements be demonstrated by test.
Use of the approach summarized above will result in equipment tailored moreclosely to actual environmental needs than is the case in the usual "MIL-SPEC"method. Be aware, though, that equipment procured under an environmentally tailoredapproach cannot be relocated on a ship or installed in new classes without seriousreconsideration. To prevent misapplication, a detailed environmental reqLirements andtesting report will have to accompany each item of tailored equipment. There may wellbe several different levels of tailoring for an equipment and modifications appropriatefor the different levels may not be apparent to casual observers. The costs of suchconfusion in the supply system, or the possibility of serious error, may completely out-weigh any savings derived from the tailoring approach. Thus, the "one item, any loca-tion" aspect of the "MIL-SPEC" approach has many advantages.
But certain types of electronic equipment can benefit from environmental tailoringdue to the criticality or nature of their application. The material covered here isdirected to those types of equipment. The user of these tailoring approaches is urgedto always consider being a little conservative in reducing environmental requirements.Often, a slightly elevated requirement will greatly enhance possible applications withlittle increase in development costs.
52
REFERENCES
1. Harris, C.M. 1988. Shock and Vibration Handbook, 3rd ed. pp. 44-41 through44-43, McGraw-Hill, New York, NY.
2. Naval Ship Engineering Center, Military Standard, MIL-STD-167-1. 1 May 1974.Mechanical Vibrations of Shipboard Equipment.
3. Chalmers, R. H. and D. L. Peterson. "Environmental Studies Aboard U.S. NavyVessels in the South China and the Caribbean Seas," 1986. NELC Report 1577,Aug. AD No. 843890, Naval Electronics Laboratory Center, San Diego, CA.
4. Peterson, D. L. "Summary of NELC-Recorded Shipboard Vibration Data." 1970.NELC Technical Report 1701, (April). Naval Electronics Laboratory Center, SanDiego, CA.
5. Leffler, R. "Telecom nunications Equipment Low-Cost Acquisition Method(TELCAM)." 1974. NELC Technical Document 335, (July), AD No. A001713.Naval Electronics Laboratory Center, San Diego, CA.
6. Fackler, W.C. 1972. Equivalence Techniques for Vibration Testing. Shock and
Vibration Information Center. Washington, DC.
7. Chalmers, R. H. "Environmental Profiles for Reliability Testing," NOSC TR 558,15 June 1980, AD No. B051425. Naval Ocean Systems Center, San Diego, CA.
8. Crandall, S.H. 1959. Random Vibration, pp. 43-46, Technology Press of the Mas-sachusetts Institute of Technology, Cambridge, MA.
9. MIL-STD-210C. 9 January 1989. Climatic Information to Determine Design and TestRequirements for Military Systems and Equipment.
10. Naval Ship Engineering Center, Military Specification, MIL-S-901D. 17 March1989. Shock Tests, H.I. (High-Impact); Shipboard Machinery, Equipment and Systems,Requirements For.
11. Chalmers, R.H. and R.C. Shaw. 1988. "Using Tuned Fixtures to TailorMIL-S-901C." Proceedings of the 59th Shock and Vibration Symposium. vol. V,pp. 129-162.
53
APPENDIX A
SHIPBOARD VIBRATIONS FORRUGGEDIZED EQUIPMENT
SCOPE. All non-mission-critical electronic equipment intended for shipboard useshall demonstrate the capability to perform satisfactorily under the vibration testsdescribed herein. Magnitudes of input motions and associated frequencies are chosento represent usual conditions aboard ship and do not cover the vibration environmentthat may exist when a ship has sustained damage and must continue to operate. Usersof this test are therefore encouraged to be critical in judging acceptability of the equip-ment under test.
BASIS OF ACCEPTABILITY. Acceptability is contingent upon the ability of theequipment to perform its function during and after the tests specified in VIBRATIONTESTS below. Minor damage or distortion will be permitted during the test providingsuch damage or distortion does not in any way impair the ability of the equipment toperform its principal functions or promise to shorten its service life. Because of thenumerous types of equipment covered by this document, a definite demarcationbetween major and minor failures cannot be specified. Therefore, such decisions mustnecessarily be left to the judgment of the test engineer.
In general, a major failure is one which would cause malfunction of the equipmentfor a long period, or behavior which suggests early equipment failure in the field. Non-repetitive failures that can be repaired or reset quickly and easily are generally consid-ered minor. As such, a repair could be made and the test continued without penalty.Sometimes, the shipboard application of the equipment will determine the category ofthe failure; for example, a momentary loss of memory in a computer used in trackingspare parts may be considered minor, while the same failure in a fire control computerwould be major. Thus, it is the test engineer, command, or agency concerned that shallbe responsible for judging major or minor failures.
INTENT OF TESTS. Vibration tests specified herein are intended to assess howwell an item might withstand exposure to usual levels of surface ship vibration. This is
done by identifying frequencies at which the equipment under consideration exhibitsamplified response and imposing a 2-hour endurance test at those frequencies. Further,2-hour exposures to random vibrations indicate if the item under test is likely torespond unfavorably due to multifrequency excitation during its service life.
TESTING MACHINES. Any vibration testing machine capable of providing thespecified motions to the attachment points of the equipment under test may be used.Means shall be provided for controlling the direction of vibration and for keeping the
A-1
frequencies and amplitudes within prescribed limits. If the lower frequency limit of 4Hz cannot be reached, any available machine may be used upon the approval of thecommand or agency concerned. This applies, also, if natural frequencies of the equip-ment under test in translation and rocking modes do not lie below the lowest frequencyof the testing machine. In no case shall a testing machine be used that has a minimumfrequency greater than 10 Hz.
METHODS OF ATTACHMENT. For all vibration tests, the equipment shall besecured to the vibration machine in the same manner in which it will be secured in itsshipboard mounting. If alternative mountings of the equipment are possible, completevibration tests shall be conducted in each alternative mounting configuration.
FIXTURES. Fixtures used in attaching equipment to the vibration machine shall besufficiently rigid to ensure that motion at all points of attachment of the equipment isessentially the same as the main machine platform. For large items that require over-head or bulkhead support, or when appreciable interaction with ships structure is prob-able, the attaching fixture should be designed to approximate the mechanicalimpedance of the ships structure as seen at the equipment mounting points. When thisfixturing approach is used, complete documentation of the installation site assessment,fixture design, and fixture testing shall be included in the test report. Also, the docu-mentation of command or agency approval of the fixture and its use (see TESTREPORT below) shall be included.
PORTABLE EQUIPMENT. Equipment not intended for permanent attachment on aship shall be attached to the testing machine in a manner representative of that inwhich it will be stored on the ship. In many cases, this will mean the item will besecured to the vibration machine by small woven straps or a line.
ORIENTATION FOR VIBRATION TESTING. Equipment shall be installed on vibra-tion testing machines in such a manner that the direction of vibration will be, in turn,along each of three orthogonal axes of the equipment as installed on the ship, that is,vertical, athwartship, and fore and aft. On a horizontal vibration testing machine, theequipment can be rotated 90 degrees about a vertical axis in order to vibrate it in eachof the two horizontal orientations. At no time shall the equipment be installed in anyother than its normal orientation (on its side or upside down, for example). Becauseno particular orientation of portable equipment can be considered normal, orientationof portable equipment for vibration testing shall be left to the discretion of the testengineer.
RESILIENT MOUNTINGS. Equipment, which is to be installed on resilient mountson board ship, shall be installed on those mounts for vibration testing. Resilientmounts integral to the equipment (intended to protect sensitive devices within theequipment) shall be left in place and operational
A-2
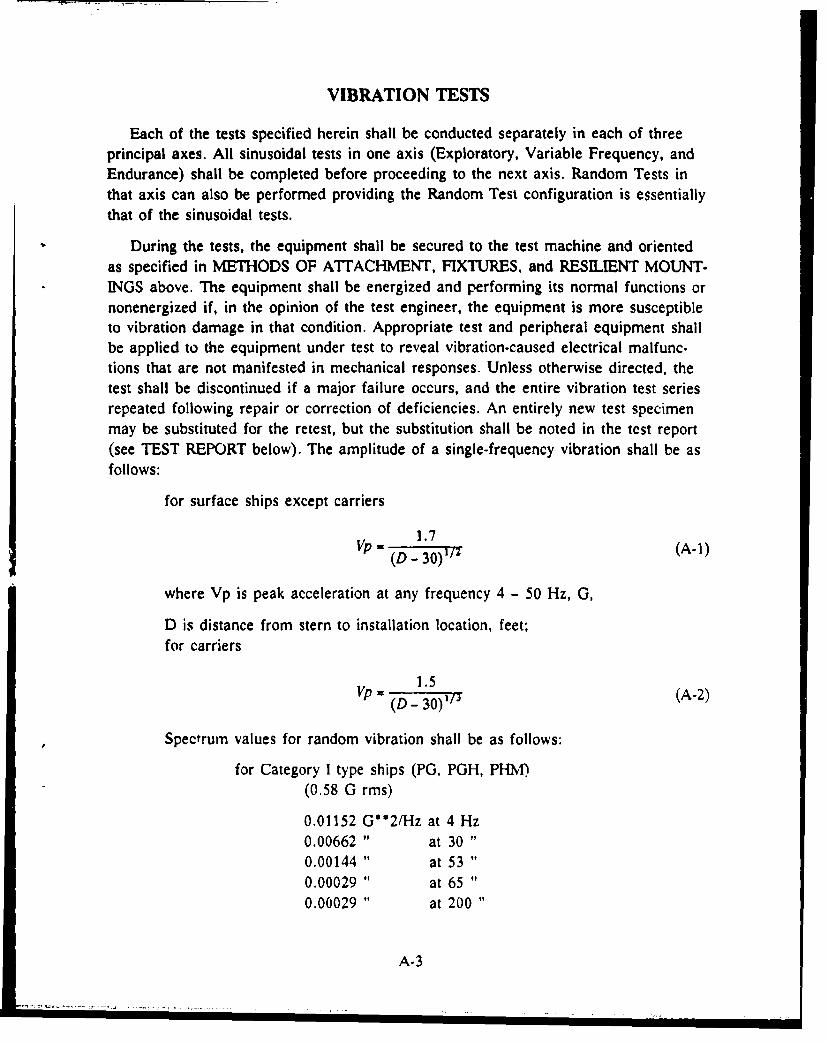
VIBRATION TESTS
Each of the tests specified herein shall be conducted separately in each of threeprincipal axes. All sinusoidal tests in one axis (Exploratory, Variable Frequency, andEndurance) shall be completed before proceeding to the next axis. Random Tests inthat axis can also be performed providing the Random Test configuration is essentiallythat of the sinusoidal tests.
During the tests, the equipment shall be secured to the test machine and orientedas specified in METHODS OF ATITACHMENT, FIXTURES. and RESILIENT MOUNT.INGS above. The equipment shall be energized and performing its normal functions ornonenergized if, in the opinion of the test engineer, the equipment is more susceptibleto vibration damage in that condition. Appropriate test and peripheral equipment shallbe applied to the equipment under test to reveal vibration-caused electrical malfunc-tions that are not manifested in mechanical responses. Unless otherwise directed, thetest shall be discontinued if a major failure occurs, and the entire vibration test seriesrepeated following repair or correction of deficiencies. An entirely new test specimenmay be substituted for the retest, but the substitution shall be noted in the test report(see TEST REPORT below). The amplitude of a single-frequency vibration shall be asfollows:
for surface ships except carriersS~1.7
Vp - 17(A-1)S Vp = ~(D -30) i/2 (-1
where Vp is peak acceleration at any frequency 4 - 50 Hz, G,
D is distance from stern to installation location, feet;for carriers
1.5Vp = 1. (A-2)
(D - 30_1
Spectrum values for random vibration shall be as follows:
for Category I type ships (PG, PGH, PHM)(0.58 G rms)
0.01152 G**2fHz at 4 Hz
0.00662 " at 30 "0.00144 " at 53 "0.00029 " at 65 "0.00029 " at 200
A-3
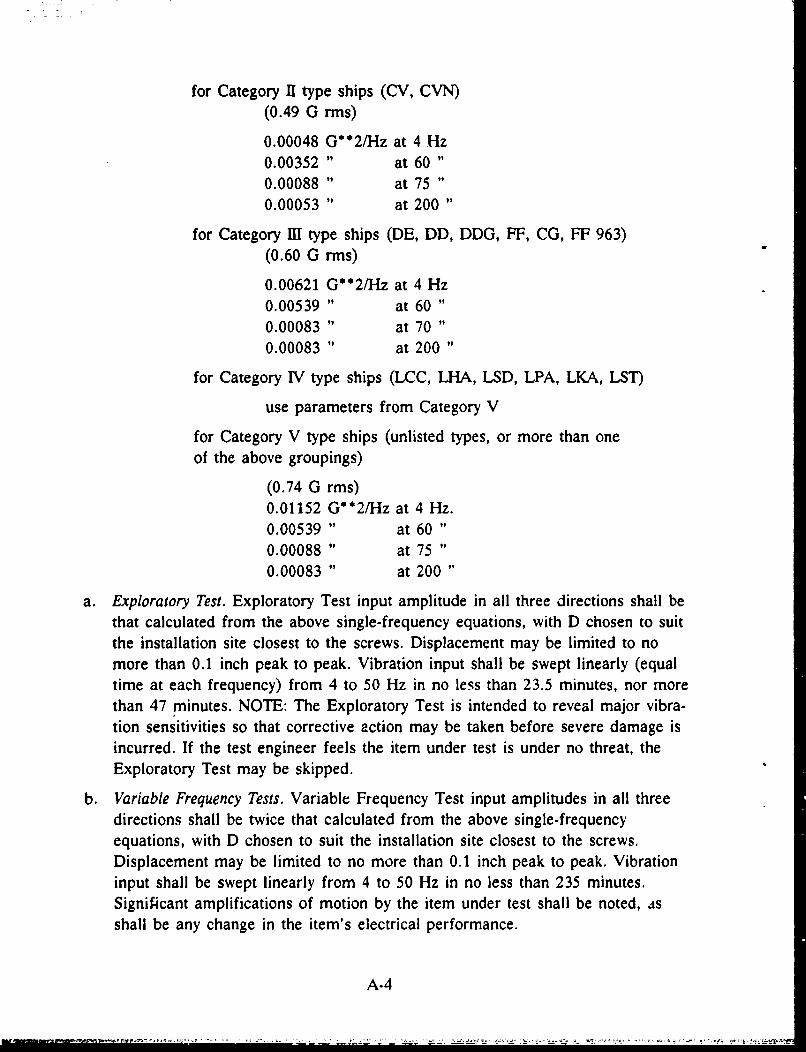
for Category II type ships (CV, CVN)(0.49 G rms)
0.00048 G"2/Hz at 4 Hz0.00352 " at 600.00088 " at 750.00053 " at 200
for Category HI type ships (DE, DD, DDG, FF, CG, FF 963)(0.60 G rms)
0.00621 G*2/Hz at 4 Hz0.00539 " at 60 "0.00083 " at 70 "0.00083 " at 200
for Category IV type ships (LCC, LHA, LSD, LPA, LKA, LST)
use parameters from Category V
for Category V type ships (unlisted types, or more than oneof the above groupings)
(0.74 G rms)0.01152 G**2/Hz at 4 Hz.0.00539 " at 600.00088 " at 750.00083 " at 200
a. Exploratory Test. Exploratory Test input amplitude in all three directions shall bethat calculated from the above single-frequency equations, with D chosen to suitthe installation site closest to the screws. Displacement may be limited to nomore than 0.1 inch peak to peak. Vibration input shall be swept linearly (equaltime at each frequency) from 4 to 50 Hz in no less than 23.5 minutes, nor morethan 47 minutes. NOTE: The Exploratory Test is intended to reveal major vibra-tion sensitivities so that corrective action may be taken before severe damage isincurred. If the test engineer feels the item under test is under no threat, theExploratory Test may be skipped.
b. Variable Frequency Tests. Variable Frequency Test input amplitudes in all threedirections shall be twice that calculated from the above single-frequencyequations, with D chosen to suit the installation site closest to the screws.Displacement may be limited to no more than 0.1 inch peak to peak. Vibrationinput shall be swept linearly from 4 to 50 Hz in no less than 235 minutes.Significant amplifications of motion by the item under test shall be noted, isshall be any change in the item's electrical performance.
A-4
c. Endurance Tests. Endurance Test input amplitude in all three directions shall betwice that calculated from single-frequency equations A-1 and A-2 above, with Dchosen to suit the installation site closest to the screws. Displacement may belimited to no more than 0.1 inch peak to peak. Vibration shall be input at eachpeak response frequency noted in the Variable Frequency Test for 2 hours. Inthe event no peak responses were noted during the Variable Frequency Test, a2-hour dwell at 50 Hz shall be applied. During the 2-hour dwell, input frequencyshall be varied as is necessary to keep response of the item under test peaked(heating and wear generally lower peak response frequencies). Magnitude of thechange of peak response frequency and final motion magnification shall benoted.
d. Random Vibration Test. Random vibration, with spectral density as appropriatefor the ship type, shall be applied for 2 hours in each of three orthogonal axes.In the case of large equipment with complex, multiplaned fixtures, vibrationmay be applied at one attachment point or more at a time, until all are covered,with the time of exposure kept at 2 hours in each of three orthogonal axes ateach attachment point.
TEST REPORTING. The Test Report to be furnished to the applicable command oragency by the testing laboratory shall include a physical description of the item beingtested. As a minimum, information supplied shall include dimensions, weight, center ofgravity, how the item was attached to the testing machine, and photographs of thK. test-ing setup. The report shall list all peak response frequencies and their approximateamplification factors. Detailed descriptions or photographs of any damage or malfunc-tioning incurred shall be included along with any indications of impending degradationor failure and at what stage of testing it was noted. Recommendations for correctivemeasures are desired.
A-5
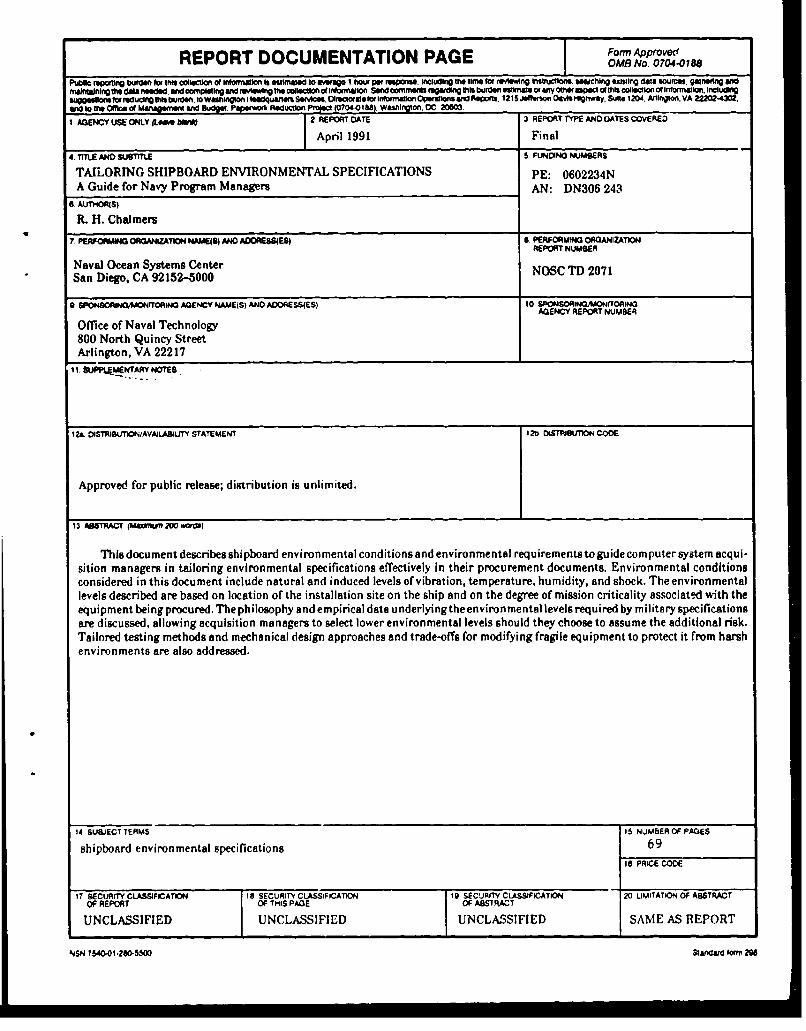
TAI RIN RSHPBO RD ENIONMETAM SECIFIATIONS PE:E 062o.2704018
1. AGENY USE NLY (loe W&W REPORTDATE 3REPORT TPANUM ATSBEVRE
Navpri Ocean SyinmaClte
4. TT-EAND USTTILAGENCYN RUMEORTSUME
Offuice for Naval Techra MaagrsA: N364
I1~jPREPNORT NOMBES
92. DSP IJAW41ON/AVAJ AGENCfY STATMEfSJAN ADASIS 10 SONSTRISQ/1ON 00CCN
13AGNC REPTRRT NUMBER~d
equpmoent bein prlcureles;d. Theph tiosoh asndlempirialdat. nelighev netllvl eurdb iiayseiiain
ar icsealwn cusition managers to seletolowe environmental lpcfctosefetvlntevel shouldmetheyochooento. Ensirumenthe aditonaliriosk
Tailored testing methods and mechanical design approaches and trade-offs for modifying fragile equipment to protect it from harshenvironments are also addressed.
14 SUBJECT TERMS IS NUMBER OF PAGES
shipboard environmental specifications 69IS PRICE CODE
17 SECURITY CLASSIFICATION IS SECURITY CLASSIFICATION 19 SECURITY CLASSIFICATION 20 LIMITATION OF ABSTRATOF REPORT OF THIS PAGE OF AWWRAT
UNCLASSIFIED UNCLASSIFIED UNCLASSIFIED SAME AS REPORT
NSN TS4.I .280-55M2 Staldaid form 290

UNCLASSIFED
R1& NAIE OFP ESPOt4UE DNMOU21 Rb. TELEPVN Mki*A~- GXW. 21C OFCE~ SYMBOM
M. L. Crowley (619) 653-=55 Code 41
NSN 764&01*280-W50 Stardaid kfm 2W8
U NCLASSIFIED
INITIAL DISTRIBUTION
Code 0012 Patent Counsel (1)Code 401 R. A. Wasilausky (1)Code 41 M. L. Crowley (30)Code 41 A. G. Justice (1)Code 412 L. J. Core (1)(odc 412 P. N. Pham (1)Code 4., D. F. Romig (1)%ode 41l D. G. Sheriff (1)(oda 412 V. D. Tran (1)Coci 412 D. R. Wilcox (1)Code 41' L. C. Anderson (1)Code 423 S. Brenneman (1)Code 4306 R. J. Jaffee (1)Code 6201 R. Eyres (1)Code 821 F. Duffy (1)Code 821 E. A. Howard (1)Code 90 I. E. Lemaire (1)Code 93 C. L. Ward, Jr. (1)Code 95 R. E. Miller (10)Code 9502 R. H. Chalmers (10)Code 951 .. A. Danielson (1)Code 951 ix. K. Fergin (1)Code 951 -. L. Walker (1)Code 951 W. R. Webster (1)Code 952 J. Puleo (1)Code 961 Archive/Stock (6)Code 964B Library (3)
Defense Technical Information Center NOSC Liaison OfficeAlexandria, VA 22304-6145 (4) Washington, DC 20363-5100
Center for Naval Analyses Office of Naval TechnologyAlexandria, VA 22302-0268 Arlington, VA 22217-5000 (10)
Space & Naval Warfare Systems Command Naval Air Development CenterWashington, DC 20363-5100 (5) Warminster, PA 18974-5000 (3)
Naval Surface Warfare Center Naval Surface Warfare CenterSilver Spring, MD 20903-5000 Dahlgren, VA 22448-5000 (2)
Naval Sea Systems Command Naval Underwater Systems CenterWashington, DC 20362-5101 (2) Newport, RI 02841-5047
Naval Weapons Support Center Naval Surface Warfare CenterCrane, IN 47522-5060 (2) Silver Spring, MD 20903-5000 (2)
Naval Underwater Systems CenterNew London, CT 06320-5594

DATE:>