Embed Size (px)
Citation preview

GEOTHERMALOPERATIONS
253

254 DIVISION OF OIL, GAS, AND GEOTHERMAL RESOURCES
GEOTHERMAL DISTRICT BOUNDARIES AND OFFICESof the
Division of Oil, Gas, and Geothermal Resources
Headquarters & 801 K Street, 20th Floor, MS 21, Sacramento, CA 95814-3530District No. G1 Phone: (916) 323-1788
Telefax: (916) 323-0424
District No. G2 1699 West Main Street, Suite E, El Centro, CA 92243-2235Phone: (760) 353-9900Telefax: (760) 353-9594
District No. G3 50 D Street, Room 300, Santa Rosa, CA 95404Phone: (707) 576-2385Telefax: (707) 576-2611

1997 ANNUAL REPORT 255
Richard P. Thomas, Geothermal Officer, Sacramento
SUMMARY OF GEOTHERMAL OPERATIONS
PROGRAM HIGHLIGHTS:
UNIT 15 WELLS In 1997, 22 geothermal wells wereplugged and abandoned on the Unit 15 leasehold atThe Geysers Geothermal field (see photos). The wellswere operated by Geo Operator Corporation, whichfiled for bankruptcy in 1989. Neither Unit 15, a 62-megawatt power plant owned by Pacific Gas &Electric Company on the leasehold, nor the wells hadbeen operated since 1989. However, the wells hadbeen monitored through succeeding years by Depart-ment of Conservation engineers, who found some tobe corroded and leaking hydrogen sulfide.
The U.S. Environmental Protection Agency (EPA),plugged and abandoned the seven most hazardouswells in Unit 15 when hydrogen sulfide gas wasfound to be leaking in potentially dangerous quanti-ties. After repairing roadways, the EPA moved in arig and the seven wells were plugged and abandonedby the end of July, at a cost of $1.4 million.
Meanwhile, the department, with the cooperation ofthe County of Sonoma, applied for and received $1.5million from the California Energy Commission tocomplete work on the remaining wells. A contractorwas hired in August 1997 and staff from the SantaRosa geothermal office directed well-plugging opera-tions. From the beginning of the project, the contractorfaced a severe shortage of water for well mudding andcementing operations, and costs rose quickly as waterwas hauled from the Russian River. Fifteen wells wereplugged and abandoned by the department, at a totalcost of $1.5 million.
LASSEN VOLCANIC NATIONAL PARK�WALKER O� WELL The Mining and MineralsBranch of the National Park Service, assisted by theBureau of Land Management, plugged and aban-doned geothermal well �Walker O� 1 in LassenVolcanic National Park (see photos). In 1969, the wellwas drilled to a depth of 1,258 feet and deepened in1978 to a depth of 4,008 feet. Terminal Geyser, alarge fumarole and tourist attraction, is about 100 feetfrom the well. Department personnel worked closelywith the Park Service on this project.
Well �Rorabaugh� A-1, after it was plugged and abandonedon Unit 15. The wellhead was later cut off at the base, near thelevel of the plank, and buried. Photo by E. Johnson.
The EPA plugged and abandoned seven hazardous wells onUnit 15 at The Geysers Geothermal field. One was well�Rorabaugh� A-7, pictured here. Photo by E. Johnson.
Elizabeth A. Johnson, District Engineer, Sacramento
DISTRICT NO. G1

256 DIVISION OF OIL, GAS, AND GEOTHERMAL RESOURCES
Originally, well �Walker 0� was drilled on privatelyheld land. In the early 1980s, the National ParkService acquired both the land and the well incondemnation proceedings.
Plugging and abandonment operations at well �Walker 0.�Steam from Terminal Geyser is in the background. Photo byR. Estabrook, Bureau of Land Management.
The �Walker 0� well in Lassen Volcanic National Park, as itwas plugged and abandoned. Photo by R. Estabrook.
GEOTHERMAL POWER PLANTS PROPOSED ATMEDICINE LAKE Two geothermal power plantshave been proposed for the Medicine Lake area ofeastern Siskiyou County near Glass Mountain. Bothproposed plant sites are in the Modoc NationalForest. A draft EIR/EIS is being prepared for Califor-nia Energy General Corporation�s Telephone FlatPower Plant. The second power plant, proposed byCalpine Corporation, is in the Fourmile Hill area. Afinal EIR/EIS for the Telephone Flat project will bereleased in 1998 and the department will comment onissues relating to geothermal wells.
MINERAL EXTRACTION PLANNED In 1997,after the Salton Sea Mineral Recovery Pilot Demon-stration Plant proved successful, California EnergyOperating Company proposed a full scale mineral-recovery project for its entire operation in the SaltonSea Geothermal field. Under the plan, after geother-mal brines pass through a power plant, they areprocessed for minerals extraction before they areinjected into the reservoir. Although brines in theSalton Sea Geothermal field contain mostly commonsalts, they also hold minute amounts of nearly everyelement on the periodic table, from arsenic to zinc.
The extraction process involves an ion-exchange unitwith resin beads similar to those used to softenwater. The exchange unit strips away zinc when thebeads are washed with water, yielding an elementthat is 99.9 percent pure.
In addition, the company is proposing a 49 mega-watt, net, geothermal power plant expansion in theSalton Sea Geothermal field. The expansion willprovide energy for the mineral extraction process,and the excess power will be sold.
California Energy Operating Company is the soleoperator of geothermal power plants in the Salton SeaGeothermal field, where the company has eightpower plants with a capacity of 276 megawatts, net.
THE GEYSERS GEOTHERMAL FIELD October 16,1997, saw the official start of the Southeast Geysers
DISTRICT NO. G2Timothy S. Boardman, District Engineer, El Centro
DISTRICT NO. G3Kenneth F. Stelling, District Engineer, Santa Rosa

1997 ANNUAL REPORT 257
Effluent Pipeline Project, where treated wastewatereffluent and fresh makeup water from Clear Lakewere injected into The Geysers Geothermal field. Theeffluent is from Lake County Sanitation Districttreatment plants at Clearlake and Middletown.
The water is injected into the steam reservoir at TheGeysers in wells owned by Calpine Corporation, the
View of power plant Units 5 and 6, the oldest active geothermal power plants in California, generating electricity at TheGeysers Geothermal field. Photo by E. Johnson.
Northern California Power Agency, and UnocalCorporation. Initial indications are that the waterhelps maintain field pressure in the injection area.
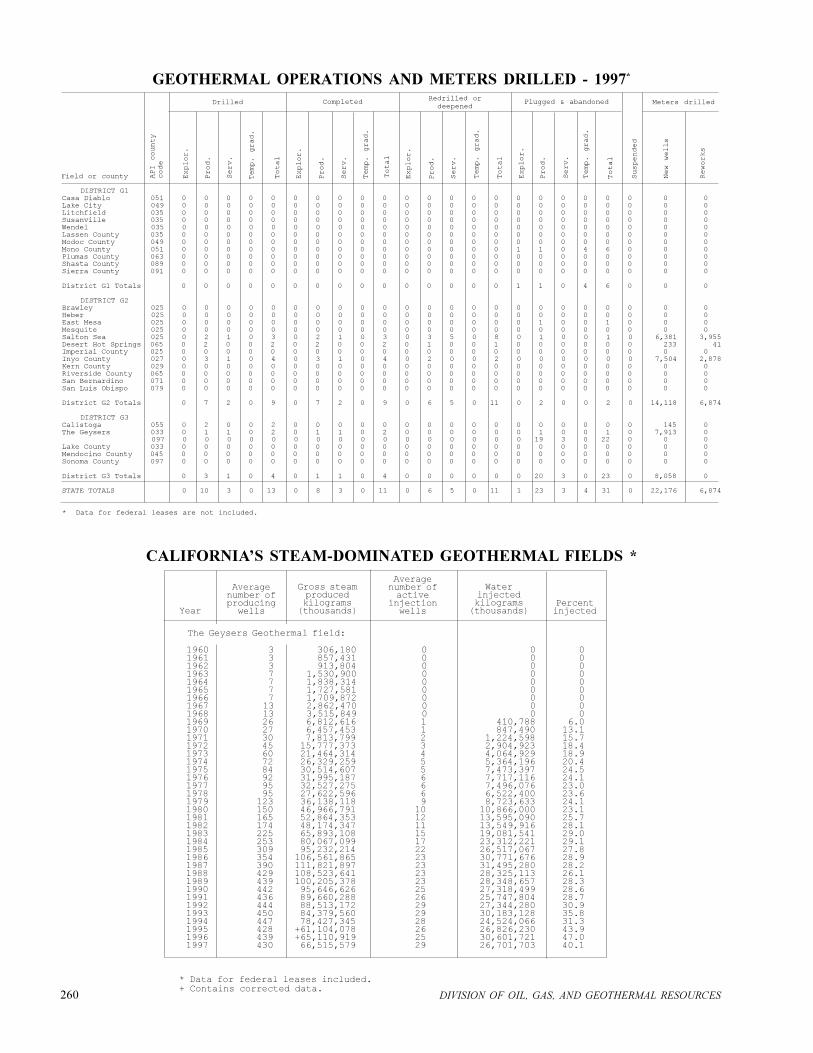
Production at The Geysers Geothermal field increasedby 2 percent, rising from 65.1 billion kilograms in 1996to 66.5 billion kilograms in 1997 (see photo).


259
GEOTHERMALSTATISTICS
260 DIVISION OF OIL, GAS, AND GEOTHERMAL RESOURCES
1960 3 306,180 0 0 0 1961 3 857,431 0 0 0 1962 3 913,804 0 0 0 1963 7 1,530,900 0 0 0 1964 7 1,838,314 0 0 0 1965 7 1,727,581 0 0 0 1966 7 1,709,872 0 0 0 1967 13 2,862,470 0 0 0 1968 13 3,515,849 0 0 0 1969 26 6,812,616 1 410,788 6.0 1970 27 6,457,453 1 847,490 13.1 1971 30 7,813,799 2 1,224,598 15.7 1972 45 15,777,373 3 2,904,923 18.4 1973 60 21,464,314 4 4,064,929 18.9 1974 72 26,329,259 5 5,364,196 20.4 1975 84 30,514,607 5 7,473,397 24.5 1976 92 31,995,187 6 7,717,116 24.1 1977 95 32,527,275 6 7,496,076 23.0 1978 95 27,622,596 6 6,522,400 23.6 1979 123 36,138,118 9 8,723,633 24.1 1980 150 46,966,791 10 10,866,000 23.1 1981 165 52,864,353 12 13,595,090 25.7 1982 174 48,174,347 11 13,549,916 28.1 1983 225 65,893,108 15 19,081,541 29.0 1984 253 80,067,099 17 23,312,221 29.1 1985 309 95,232,214 22 26,517,067 27.8 1986 354 106,561,865 23 30,771,676 28.9 1987 390 111,821,897 23 31,495,280 28.2 1988 429 108,523,641 23 28,325,113 26.1 1989 439 100,205,378 23 28,348,657 28.3 1990 442 95,646,626 25 27,318,499 28.6 1991 436 89,660,288 26 25,747,804 28.7 1992 444 88,513,172 29 27,344,280 30.9 1993 450 84,379,560 29 30,183,128 35.8 1994 447 78,427,345 28 24,524,066 31.3 1995 428 +61,104,078 26 26,826,230 43.9 1996 439 +65,110,919 25 30,601,721 47.0 1997 430 66,515,579 29 26,701,703 40.1
* Data for federal leases included. + Contains corrected data.
Year
Averagenumber ofproducingwells
Gross steamproducedkilograms(thousands)
Averagenumber ofactive
injectionwells
Waterinjectedkilograms(thousands)
Percentinjected
CALIFORNIA�S STEAM-DOMINATED GEOTHERMAL FIELDS *
The Geysers Geothermal field:
Field or county Prod.
Explor.
API county
code
Drilled
Temp. grad.
Serv.
Total
Explor.
Prod.
Serv.
Temp. grad
.
Total
Completed
Explor.
Prod.
Serv.
Temp. grad
.
Total
Explor.
Prod.
Serv.
Total
Plugged & abandoned Meters drilled
Suspended
New wells
Reworks
Redrilled ordeepened
GEOTHERMAL OPERATIONS AND METERS DRILLED - 1997*
Temp. grad.
DISTRICT G1Casa Diablo 051 0 0 0 0 0 0 0 0 0 0 0 0 0 0 0 0 0 0 0 0 0 0 0Lake City 049 0 0 0 0 0 0 0 0 0 0 0 0 0 0 0 0 0 0 0 0 0 0 0Litchfield 035 0 0 0 0 0 0 0 0 0 0 0 0 0 0 0 0 0 0 0 0 0 0 0Susanville 035 0 0 0 0 0 0 0 0 0 0 0 0 0 0 0 0 0 0 0 0 0 0 0Wendel 035 0 0 0 0 0 0 0 0 0 0 0 0 0 0 0 0 0 0 0 0 0 0 0Lassen County 035 0 0 0 0 0 0 0 0 0 0 0 0 0 0 0 0 0 0 0 0 0 0 0Modoc County 049 0 0 0 0 0 0 0 0 0 0 0 0 0 0 0 0 0 0 0 0 0 0 0Mono County 051 0 0 0 0 0 0 0 0 0 0 0 0 0 0 0 1 1 0 4 6 0 0 0Plumas County 063 0 0 0 0 0 0 0 0 0 0 0 0 0 0 0 0 0 0 0 0 0 0 0Shasta County 089 0 0 0 0 0 0 0 0 0 0 0 0 0 0 0 0 0 0 0 0 0 0 0Sierra County 091 0 0 0 0 0 0 0 0 0 0 0 0 0 0 0 0 0 0 0 0 0 0 0
District G1 Totals 0 0 0 0 0 0 0 0 0 0 0 0 0 0 0 1 1 0 4 6 0 0 0
DISTRICT G2Brawley 025 0 0 0 0 0 0 0 0 0 0 0 0 0 0 0 0 0 0 0 0 0 0 0Heber 025 0 0 0 0 0 0 0 0 0 0 0 0 0 0 0 0 0 0 0 0 0 0 0East Mesa 025 0 0 0 0 0 0 0 0 0 0 0 0 0 0 0 0 1 0 0 1 0 0 0Mesquite 025 0 0 0 0 0 0 0 0 0 0 0 0 0 0 0 0 0 0 0 0 0 0 0Salton Sea 025 0 2 1 0 3 0 2 1 0 3 0 3 5 0 8 0 1 0 0 1 0 6,381 3,955Desert Hot Springs 065 0 2 0 0 2 0 2 0 0 2 0 1 0 0 1 0 0 0 0 0 0 233 41Imperial County 025 0 0 0 0 0 0 0 0 0 0 0 0 0 0 0 0 0 0 0 0 0 0 0Inyo County 027 0 3 1 0 4 0 3 1 0 4 0 2 0 0 2 0 0 0 0 0 0 7,504 2,878Kern County 029 0 0 0 0 0 0 0 0 0 0 0 0 0 0 0 0 0 0 0 0 0 0 0Riverside County 065 0 0 0 0 0 0 0 0 0 0 0 0 0 0 0 0 0 0 0 0 0 0 0San Bernardino 071 0 0 0 0 0 0 0 0 0 0 0 0 0 0 0 0 0 0 0 0 0 0 0San Luis Obispo 079 0 0 0 0 0 0 0 0 0 0 0 0 0 0 0 0 0 0 0 0 0 0 0
District G2 Totals 0 7 2 0 9 0 7 2 0 9 0 6 5 0 11 0 2 0 0 2 0 14,118 6,874
DISTRICT G3Calistoga 055 0 2 0 0 2 0 0 0 0 0 0 0 0 0 0 0 0 0 0 0 0 145 0The Geysers 033 0 1 1 0 2 0 1 1 0 2 0 0 0 0 0 0 1 0 0 1 0 7,913 0 097 0 0 0 0 0 0 0 0 0 0 0 0 0 0 0 0 19 3 0 22 0 0 0Lake County 033 0 0 0 0 0 0 0 0 0 0 0 0 0 0 0 0 0 0 0 0 0 0 0Mendocino County 045 0 0 0 0 0 0 0 0 0 0 0 0 0 0 0 0 0 0 0 0 0 0 0Sonoma County 097 0 0 0 0 0 0 0 0 0 0 0 0 0 0 0 0 0 0 0 0 0 0 0
District G3 Totals 0 3 1 0 4 0 1 1 0 4 0 0 0 0 0 0 20 3 0 23 0 8,058 0
STATE TOTALS 0 10 3 0 13 0 8 3 0 11 0 6 5 0 11 1 23 3 4 31 0 22,176 6,874
* Data for federal leases are not included.

1997 ANNUAL REPORT 261
* Data for federal leases included.
** The first year that production data were reported to the Division of Oil, Gas, and Geothermal Resources.
*** Data are only available for the city�s space-heating project.+ Contains corrected data.
CALIFORNIA'S WATER - DOMINATED GEOTHERMAL FIELDS*
Year
Averagenumber ofproducingwells
Averagenumber ofinjectionwells
Waterinjectedkilograms
(thousands)Geothermal
field
Gross waterproducedkilograms
(thousands) Year
Waterinjectedkilograms(thousands)
Geothermalfield
Gross waterproducedkilograms
(thousands)
Averagenumber ofproducing
wells
Averagenumber ofinjection
wells
Amedee 1988** 2 1,283,871 NO INJECTION 1989 2 4,778,856 1990 2 5,443,317 1991 2 5,778,129 1992 2 5,946,618 1993 2 5,535,367 1994 2 4,970,443
1995 2 5,357,7341996 2 5,670,982
1997 2 5,374,700
Brawley 1982** 2 1,833,217 2 1,578,510 1983 2 2,397,722 4 2,342,862 1984 1 1,122,414 3 994,175 1985 1 555,731 1 529,041 1986 PROJECT TERMINATED
Casa Diablo 1984** 1 1,317,788 1 1,317,788 1985 3 3,840,401 3 3,840,401 1986 3 6,076,840 3 6,076,840 1987 4 6,754,790 3 6,754,790 1988 4 6,723,808 3 6,723,808 1989 3 6,871,002 3 6,871,002 1990 4 6,971,231 3 6,971,231 1991 10 24,538,220 5 24,538,220 1992 10 24,604,335 4 24,604,335 1993 10 23,544,466 4 23,544,466 1994 10 23,637,236 5 23,637,236
1995 9 22,498,589 5 22,498,5891996 9 22,500,565 5 22,500,565
1997 9 22,229,408 5 22,229,408
Coso 1987** 5 4,125,630 3 3,547,813 1988 15 13,965,143 6 9,233,591 1989 32 44,187,631 12 34,841,883 1990 47 55,936,765 14 40,390,044 1991 57 46,624,874 14 28,479,346 1992 63 41,198,639 16 27,342,886 1993 68 +47,726,990 18 26,693,236 1994 +72 +43,261,502 19 24,412,831
1995 +75 +40,317,057 20 24,483,807 1996 +79 +39,732,984 20 22,416,692
1997 82 36,611,570 20 19,485,632
East Mesa 1983** 5 3,196,215 3 3,190,219 1984 6 4,050,175 2 3,963,468 1985 6 3,659,938 2 3,385,793 1986 6 4,725,162 3 4,399,114 1987 15 14,187,024 6 13,734,959 1988 25 40,952,496 12 35,950,366 1989 32 67,990,914 23 57,796,766 1990 39 79,221,063 33 75,465,209 1991 42 91,984,758 36 89,406,945 1992 42 97,750,781 39 94,370,772 1993 43 97,849,346 40 96,029,637 1994 43 90,589,304 40 87,198,495
1995 43 90,488,703 41 86,970,7051996 43 92,604,479 42 89,674,536
1997 42 92,797,342 43 89,231,453
Heber 1985** 9 13,584,658 8 13,214,051 1986 13 32,263,682 12 29,716,492 1987 16 34,472,259 13 31,300,084 1988 12 29,769,219 10 26,031,068 1989 11 29,384,658 10 24,976,751 1990 10 29,487,574 9 25,085,848 1991 10 29,215,287 9 25,252,223 1992 10 29,478,685 9 26,816,804 1993 17 41,674,826 17 38,101,717 1994 22 53,988,169 22 +49,640,276
1995 22 56,645,248 23 52,587,7981996 22 58,358,658 23 54,637,130
1997 22 60,145,589 20 56,449,799
Litchfield 1984** 1 945,419 NO INJECTION 1985 1 987,427 1986 1 852,801 1987 1 712,709 1988 1 765,384 1989 1 1,061,360 1990 1 891,708 1991 1 760,304 1992 1 621,690 1993 1 885,045 1994 1 701,006
1995 1 822,7901996 1 729,777
1997 1 988,284
Salton Sea 1982** 2 2,383,365 2 2,071,770 1983 3 3,735,455 2 3,260,076 1984 2 4,208,900 2 3,211,456 1985 2 4,167,497 2 3,193,912 1986 9 13,433,795 7 10,851,579 1987 9 14,272,783 8 11,911,933 1988 11 19,572,266 10 17,087,924 1989 23 56,570,756 18 47,581,465 1990 32 75,745,346 23 62,991,977 1991 33 77,687,699 23 68,884,579 1992 35 78,034,671 22 69,247,157 1993 34 77,792,273 25 +66,406,019 1994 31 77,764,065 24 69,917,900
1995 32 80,974,333 24 71,139,9691996 32 96,779,351 26 +83,152,296
1997 30 102,380,076 29 104,693,078
Susanville*** 1982** 1 21,228 1 21,228 1983 1 174,352 1 174,352 1984 1 134,832 1 134,832 1985 1 339,792 1 171,360 1986 1 345,600 1 199,104 1987 1 436,751 1 276,196 1988 1 262,878 1 230,307 1989 1 448,792 1 300,972 1990 1 518,471 1 297,840 1991 1 525,490 1 297,840 1992 1 482,574 1 298,656 1993 1 589,658 1 297,840 1994 1 551,406 1 297,840
1995 1 565,345 1 297,0241996 1 489,327 1 297,840
1997 1 415,313 1 297,840
Wendel 1985** 1 833,989 0 1986 1 1,808,949 0 1987 1 1,773,907 0 1988 1 1,763,722 0 1989 2 2,542,910 1 428,745 1990 2 2,618,618 1 978,066 1991 2 2,440,737 1 1,717,291 1992 2 2,503,719 1 1,017,408 1993 2 2,370,861 1 1,043,371 1994 2 2,309,924 1 1,145,622
1995 2 2,153,224 1 956,7701996 2 +2,032,435 1 749,124
1997 2 1,772,335 1 605,987

262 DIVISION OF OIL, GAS, AND GEOTHERMAL RESOURCES
DISTRICT G1Casa Diablo 0 0 0 0 0 0 0 0 0 0 0 0 0 0 0Lake City 0 0 0 0 0 0 0 0 0 0 0 0 0 0 0Litchfield 0 0 0 0 0 0 0 0 0 0 0 0 0 0 0Wendel 0 0 0 0 0 0 0 0 0 0 0 0 0 0 0Susanville 0 0 0 0 0 0 0 0 0 0 0 0 0 0 0Lassen County 0 0 0 0 0 0 0 0 0 0 0 0 0 0 0Modoc County 0 0 0 0 0 0 0 0 0 0 0 0 0 0 0Mono County 0 0 0 0 0 0 0 0 0 0 1 1 0 4 6Plumas County 0 0 0 0 0 0 0 0 0 0 0 0 0 0 0Shasta County 0 0 0 0 0 0 0 0 0 0 0 0 0 0 0Sierra County 0 0 0 0 0 0 0 0 0 0 0 0 0 0 0
District G1 Totals 0 0 0 0 0 0 0 0 0 0 1 1 0 4 6 272
DISTRICT G2Brawley 0 0 0 0 0 0 0 0 0 0 0 0 0 0 0Heber 0 0 0 0 0 0 0 1 0 1 0 0 0 0 0East Mesa 1 0 0 0 1 0 0 0 0 0 0 0 0 0 0Mesquite 0 0 0 0 0 0 0 0 0 0 0 0 0 0 0Salton Sea 0 2 1 0 3 0 12 9 2 23 0 1 0 0 1Desert Hot Springs 0 2 0 0 2 0 0 0 0 0 0 0 0 0 0Imperial County 1 0 0 0 1 0 0 0 0 0 0 0 0 0 0Inyo County 0 0 0 0 0 0 0 0 0 0 0 0 0 0 0Los Angeles County 0 0 0 0 0 0 0 0 0 0 0 0 0 0 0Riverside County 0 0 0 0 0 0 0 0 0 0 0 0 0 0 0San Bernardino 0 0 0 0 0 0 0 0 0 0 0 0 0 0 0San Luis Obispo 0 0 0 0 0 0 0 0 0 0 0 0 0 0 0
District G2 Totals 2 4 1 0 7 0 12 10 2 24 0 1 0 0 1 320
DISTRICT G3Calistoga 0 2 0 0 2 0 0 0 0 0 0 0 0 0 0The Geysers 0 2 2 0 4 0 5 2 0 7 0 22 2 0 24Lake County 0 0 0 0 0 0 0 0 0 0 0 0 0 0 0Mendocino County 0 0 0 0 0 0 0 0 0 0 1 0 0 0 1Napa County 0 0 0 0 0 0 0 0 0 0 0 0 0 0 0Sonoma County 0 0 0 0 0 0 0 0 0 0 0 0 0 0 0
District G3 Totals 0 4 2 0 6 0 5 2 0 7 1 22 2 0 25 1,496
STATE TOTALS 2 8 3 0 13 0 17 12 2 31 2 24 2 4 32 2,088
*Data for federal leases not included. The number of drilling permits issued by the Bureau of Land Management(BLM) for geothermal development on federal lands in California stayed the same in 1997. According to the BLM,1 well was permitted during federal fiscal year 1997 (October 1996-September 1997)and 1 well was permitted the yearbefore.
County Operator
B.&M.Sec.T. R.
Elev.(meters)
Totaldepth
(meters)
Stratigraphic units penetrated and/ortime-stratigraphic units at total depth
(depth in meters)Well designation and API number
Monthdrillingcompleted
GEOTHERMAL EXPLORATORY WELLS DRILLED TO TOTAL DEPTH IN 1997
Field or county Explor
.
Prod.
Serv.
Temp. grad.
Total
Explor.
Prod.
Serv.
Temp. grad.
Total
Explor.
Prod.
Serv.
Temp. grad.
Total
Total
inspections
by district
Notices toplug & abandon
GEOTHERMAL NOTICES FILED AND INSPECTIONS - 1997*
Notices to reworkNotices to drill
200000111300241100
Ne
ga
tive
de
cla
ratio
n
24122455000000020000
198019811982198319841985198619871988198919901991199219931994199519961997
676733351223221100
000000000000100000
30198
1188351223341100
9155412000000020000
20153675231123020100
665253111120220000
To
tal
353613121310342243260100
332101110100220100
431252000000000000
422242000000000000
To
tal
1185595110100220100
Ge
ne
ral
9112540040023641100
11112540151323882200
Projects filed Notices issued Reports
GEOTHERMAL CEQA APPLICATIONS AND SITE VISITSSite
inspections
To
tal
Sp
eci
fic
Fin
al E
IR
Dra
ft E
IR
De
term
ina
tion
Exe
mp
tion
Pre
pa
ratio
n
To
tal
Oth
er
Exp
lora
tory
Te
mp
era
ture
gra
die
nt
Year
NONE TO REPORT

1997 ANNUAL REPORT 263
DISTRICT NO. G1
DISTRICT NO. G2
FLUID PRODUCED AND INJECTED, AND POWER PLANTCAPACITY FOR CALIFORNIA GEOTHERMAL FIELDS
AMEDEE GEOTHERMAL FIELD CASA DIABLO GEOTHERMAL FIELD
WENDEL GEOTHERMAL FIELD
BRAWLEY GEOTHERMAL FIELD COSO GEOTHERMAL FIELD

264 DIVISION OF OIL, GAS, AND GEOTHERMAL RESOURCES
DISTRICT NO. G3
EAST MESA GEOTHERMAL FIELD HEBER GEOTHERMAL FIELD
SALTON SEA GEOTHERMAL FIELD
THE GEYSERS GEOTHERMAL FIELD

265
FINANCIALREPORT

266 DIVISION OF OIL, GAS, AND GEOTHERMAL RESOURCES
Beginning Resource �����������������������.��������... $ 352,000.00Balance Available from Prior Year �������������������������... $ 26,000.00Revenue Applicable to Oil, Gas, and Geothermal Operations ��������������. $ 10,117,000.00Total Resources ���������������������������������� $ 10,495,000.00Total Expenditures ��������������������������������.. $ 10,288,000.00Ending Resources ��������������������������������� $ 207,000.00
Hazardous and Idle � deserted Well Abandonment Expenditures1996-97 Fiscal Year
No. of Wells46 ��... Hazardous and Idle-deserted Wells Plugged and Abandoned �������.. $ 660,711.93 0 ��... Section 3237 PRC Wells Plugged and Abandoned ������������... $ 0 7 ��... Orphaned Wells Plugged and Abandoned (HIDWAF) ����������.. $ 51,307.2253 ��... Total Wells Plugged and Abandoned ������������������. $ 712,019.15
Remedial Action Taken ������������������������. $ 27,614.88Gross Expenditure ��������������������������. $ 739,634.03Reimbursement ���������������������������.. $ -419,580.95Net Expenditure ���������������������������. $ 320,053.08
Geothermal
Remedial Action Taken ������������������������. $ 21,654.98Reimbursement ���������������������������.. $ -22,879.98Net Expenditure ���������������������������. $ - 1,225.00
Underground Injection Control Program Expenditures(Oct. 1, 1996 � Sept. 30, 1997 Federal Fiscal Year)
Beginning Resource �������������������������������.� $ 427,500.00Balance Available from Prior Year �����������������������.��.. $ 2,197.00Total Resources ���������������������������������� $ 429,697.00Total Expenditures��������������������������������... $ 380,810.00Ending Resources ��������������������������������� $ 48,887.00
Financial Statement1996-97 Fiscal Year
The following report is made in accordance withSection 3108, Division 3, Public Resources Code, whichreads as follows: ''On or before the first day of October ofeach year the supervisor shall make public for the benefitof all interested persons, a report in writing showing:
(a) The total amounts of oil and gas produced in eachcounty in the state during the previous calendar year.(Figures for 1996 are published in the 82nd Annual Reportof the State Oil and Gas Supervisor.)
(b) The total cost of the division for the previous fiscalyear.
(c) The total amount delinquent and uncollected fromany assessments or charges levied pursuant to the chap-ter.
The report shall also include such other informationas the supervisor deems advisable.''
Collection of Funds by AssessmentFunds for the support of the Department of
Conservation's Division of Oil, Gas, and GeothermalResources are raised by an assessment on oil and gasproduction as provided for in Article 7 of Division 3, PublicResources Code.
The assessment is based on the projected expendi-tures of the division, taking into account any previoussurpluses or deficiencies, and the prior year�s produc-tion. For the 1997-98 fiscal year, the rate of assessmentwas established at $0.0355296 per barrel of oil or tenthousand cubic feet of gas.
As provided for in Chapter 4, Division 3, Section3724.5 of the Public Resources Code, the division is alsopartly funded by an annual assessment levied on opera-tors of high-temperature geothermal resource wells andby drilling fees charged to geothermal operators fordrilling new wells or redrilling abandoned wells.
For the 1997-98 fiscal year, the fee-assessment was estab-lished at $1,680.00 per high-temperature geothermal well.
FINANCIAL REPORT

1997 ANNUAL REPORT 267
List of Delinquent Assessments and Penalties:Oil, Gas, and Geothermal Operations as of June 30, 1998
PR06 (8/98/OSP/2M)
_____________________________________________________| | | || OPERATOR | YEAR | ASSESSMENT ||____________________________________________________|| | | || OIL AND GAS OPERATORS | | |
_____________________________________________________| | | || OPERATOR | YEAR | ASSESSMENT ||____________________________________________________|| | | || OIL AND GAS OPERATORS | | || | | || Alanmar Energy | 1997 | $1,270.29 || Allied Energy Corp. | 1996 | $91.50 || | 1997 | $34.48 || Amerada Hess Corp. | 1997 | $2,488.47 || American Barter Petro., Inc. | 1993 | $4,454.98 || | 1994 | $3,487.97 || American Titan Oil Co. | 1996 | $266.34 || | | || Baker Oil and Gas Co. | 1990 | $1,036.74 || Blackhawk Oil Co. | 1994 | $7,266.45 || | 1995 | $2,509.94 || Brea Oil Co. Inc. | 1997 | $587.19 || Brindle/Thomas | 1996 | $793.85 || | 1997 | $165.95 || E. H. Brogdon | 1996 | $70.53 || | | || Weldon Bruce | 1989 | $634.65 || Calif. Oil Independents, Inc. | 1995 | $364.60 || | 1996 | $311.16 || Cemco-Edison #1 Fr Prtnrshp | 1997 | $64.03 || Central Lease Inc. | 1991 | $1,580.38 || | 1992 | $1,115.79 || | 1993 | $819.57 || | 1995 | $82.64 || Deuel Petroleum Co., Inc. | 1987 | $123.76 || | 1988 | $210.01 || | | || Dynametrics | 1996 | $192.46 || | 1997 | $97.57 || Eastern Pacific Oil Co. | 1996 | $65.43 || Henry & Jane Fong | 1997 | $137.45 || Fortune Petroleum Corp. | 1996 | $236.50 || | 1997 | $696.71 || GENY Operations | 1995 | $1,446.17 || | | || GEO Petroleum, Inc. | 1996 | $1,424.22 || | 1997 | $1,837.88 || Graham Royalty, LTD. | 1994 | $8,028.70 || Grayson Service, Inc. | 1996 | $107.41 || | 1997 | $137.42 || Hillcrest Beverly Oil Corp. | 1997 | $373.91 || Hilliard Oil & Gas Inc. | 1986 | $550.54 || | | || Joro Inc. | 1996 | $96.83 || Kalco Development Corp. | 1988 | $3,053.66 || | 1989 | $2,342.64 || | 1990 | $480.92 || | 1991 | $326.83 || Killingsworth Oil Co. | 1994 | $173.71 || Ted Koble, Opr. | 1994 | $222.82 || Lobodo Inc. | 1994 | $202.59 || | 1995 | $64.52 || | 1996 | $67.09 || | 1997 | $50.49 || | | || Marlin Pacific Oil & Gas | 1996 | $370.05 || | 1997 | $89.46 || Mitchell Oil Co. | 1989 | $279.61 || | 1990 | $339.53 || | 1991 | $262.33 || | 1992 | $136.47 || | 1994 | $266.28 || Nahama & Weagant Energy Co. | 1994 | $1,650.28 || | 1996 | $5,364.00 || Nahama & Weagant 1984 LP | 1997 | $3,524.58 || The National Oil Co. | 1987 | $67.91 || | 1990 | $202.76 || | 1991 | $104.79 || | | || Nugget Oil Co. | 1996 | $383.72 || | 1997 | $603.21 || Oilfield Pet. & Energy Co. | 1995 | $125.35 || | 1996 | $208.27 || Oro Negro, Inc. | 1997 | $868.25 || Pacific Inland Oper. Corp. | 1996 | $2,972.46 || Pan American Energy Corp. | 1993 | $145.76 || | 1994 | $41.15 || | 1994 | $128.60 || | | || Pangea Inc. | 1997 | $691.65 || Petro Nova | 1989 | $520.95 || | 1990 | $208.10 || Pine Meadows Ranch Inc. | 1996 | $1,073.37 || | 1997 | $643.80 || Polaris Prod. Co. | 1997 | $69.50 || Prado Petroleum | 1988 | $1,261.86 || | 1989 | $697.96 || | 1990 | $1,291.45 || | 1991 | $908.08 || | 1992 | $486.85 || | 1993 | $491.36 || | | || Pueblo Oil & Gas | 1992 | $437.46 || | 1993 | $394.56 |
| Razar Resources | 1996 | $413.48 || | 1997 | $108.60 || Saba Petroleum Inc. | 1997 | $1,527.50 || Sam Enterprises, Inc. | 1996 | $127.32 || South Coast Oil Corp. | 1996 | $470.64 || | | || St. Regis Resources Corp. | 1995 | $380.52 || Sunwest Petroleum Inc. | 1996 | $915.23 || | 1997 | $526.41 || Supreme Oil & Gas Corp. | 1994 | $109.77 || TRV Minerals Corp. | 1987 | $396.39 || Target Drilling | 1997 | $374.46 || | | || Zachary T. Tatum | 1995 | $95.48 || | 1996 | $207.84 || | 1997 | $183.16 || Temblor Petroleum Co., LLC | 1997 | $92.20 || Terra Expl. & Prod. Co. Inc. | 1997 | $900.17 || Terra Oil Co. | 1997 | $302.10 || John A. Thomas | 1996 | $184.29 || | | || Thomas Oil Co. | 1987 | $341.98 || | 1988 | $455.02 || | 1989 | $277.31 || | 1990 | $247.85 || | 1993 | $360.95 || | 1994 | $418.95 || Tri Kern Resources | 1988 | $562.30 || | 1989 | $265.43 || Troy Resources Corp. | 1988 | $213.48 || | 1989 | $447.62 || Turco Products Division | 1994 | $134.74 || United Energy, Inc. | 1996 | $548.25 || | 1997 | $1,441.14 || | | || XL Operating Co. | 1997 | $2,005.07 || |___________________ || | | || TOTALS | 1986 | $550.54 || | 1987 | $930.04 || | 1988 | $5,756.33 || | 1989 | $5,466.17 || | 1990 | $3,807.35 || | 1991 | $3,182.41 || | 1992 | $2,176.57 || | 1993 | $6,667.19 || | 1994 | $22,132.01 || | 1995 | $5,069.22 || | 1996 | $16,962.24 || | 1997 | $21,893.10 || |___________________ || | | || | | $94,593.17 ||___________________________________________________ || | | || GEOTHERMAL OPERATORS | | || | | || GEO Operator Corp. | 1988 | $21,197.44 || | 1989 | $159,872.80 || | 1990 | $92,791.50 || | 1991 | $83,282.82 || | 1992 | $7,516.80 || | 1996 | $6,605.22 || | 1997 | $5,770.80 || Geysers Power, Inc. | 1992 | $48,488.00 || | 1993 | $55,702.20 || | 1994 | $58,575.00 || | 1995 | $46,195.50 || | 1996 | $46,236.54 || | 1997 | $40,395.60 || Imperial Energy Corp. | 1985 | $2,956.93 || MSR Power Agency | 1994 | $5,857.50 || | | || |___________________ || | | || TOTALS | 1985 | $2,956.93 || | 1986 | $0.00 || | 1987 | $0.00 || | 1988 | $21,197.44 || | 1989 | $159,872.80 || | 1990 | $92,791.50 || | 1991 | $83,282.82 || | 1992 | $56,004.80 || | 1993 | $55,702.20 || | 1994 | $64,432.50 || | 1995 | $46,195.50 || | 1996 | $52,841.76 || | 1997 | $46,166.40 || | |_____________|| | | || | | $681,444.65 || | | || GRAND TOTAL | | $776,037.82 ||____________________________________________________|