Embed Size (px)
Citation preview
Volume 52, Number 5, 1998 APPLIED SPECTROSCOPY 6430003-7028 / 98 / 5205-0643$2.00 / 0q 1998 Society for Applied Spectroscopy
Program Considerations for Simplex Optimization of IonLenses in ICP-MS
CHRISTINE SARTOROS, DOUGLAS M. GOLTZ, and ERIC D. SALIN*Department of Chemistry, McGill University, 801 Sherbrooke St. W., Montreal, QC, Canada, H3A 2K6 (C.S., E.D.S.); andDepartment of Chemistry, University of Winnipeg, 515 Portage Ave., Winnipeg, MB, Canada, R3B 2E9 (D.M.G.)
The performance of an inductively coupled plasma mass spectrom-eter (ICP-MS) is dependent on the ion optic bias potentials. A dis-cussion of the multielemen t optimization of the ICP-MS ion opticsbias potentials using a Simplex algorithm is presented. Three ob-jective functions were tested: a function developed by Leary; thecombined ratio method (CRM); and the Euclidean distance frommulticriteria target vector optimization. Both the Leary and thetarget vector optimization’s performances were comparable, where-as the CRM optimizations placed an emphasis on obtaining similarsignal intensities. Experiments determined that an initial Simplexstarting size of 20% of the parameter space was optimal. A methodfor the selection of an appropriate target vector by predicting an-alyte signal intensity was also investigated . Signal intensities for allelements could be predicted with an acceptable margin of error (10±30%), provided that the same conditions were used. Comparisonsof optimizations using a single mid-mass element vs. multielemen toptimizations revealed that the multielemen t approach is onlyslightly better. If the analyst wished to optimize lens settings tofavor heavy or light elements, then an average mass was better thana mid-mass optimization.
Index Headings: ICP-MS; Ion optics; Optimization; Simplex; Ob-jective functions.
INTRODUCTION
In the inductively coupled plasma mass spectrometer(ICP-MS), ions produced in the plasma are extractedthrough a sampling interface region by the use of samplerand skimmer cones. The extracted ions are focused intoa narrow beam by the use of one or more ion lensesbefore entering the quadrupole mass ® lter. The Elan 250-5000 series of ICP-MS instruments use a number of ionlenses including Einzel (E1), Photon Stop (S2), Plate (P),and Bessel Box (B) lenses. Optimization of the voltagesettings of the ion lenses is critical for optimal perfor-mance of this type of ICP-MS.
An earlier study by Schmit and Chtaib1 demonstratedthat analyte signals of an Elan 250 ICP-MS were depen-dent on the applied bias potentials of the input ion optics.The transmission ef® ciency of the ion optics is dependenton the mass of the analyte and can vary signi® cantly forwidely different masses (e.g., B and T1). This character-istic is due to the higher kinetic energy of the higher masselements, which results in lower sensitivity to changes inthe ion lens voltage. For example, if one optimizes theion lenses using a low-mass element, the sensitivity ofthe high-mass elements is negatively affected and viceversa. In general, if one optimizes lens voltages at somecompromise for both light and heavy elements, then the
Received 25 June 1997; accepted 15 December 1997.* Author to whom correspondence should be sent.
response signals for both light and heavy elements willbe compromised.
Optimization studies of the plasma operating parame-ters and ion lens voltages have appeared in the literaturefor most, if not all, commercially available systems. Inmost routine laboratories, optimization of ion lenses us-ing the Elan 250-5000 series of ICP-MS instruments iscarried out manually by using a univariate optimizationprocedure, with one or two elements. The process is te-dious and can be quite subjective, depending on the op-erator’s choice of elements. Frequent ion lens optimiza-tion is generally not required for single-operator, routineanalysis; however, in laboratories with many operatorsand with many applications using different settings, tun-ing of the ion lenses may be required. Univariate opti-mization techniques become time consuming and inef® -cient when one is dealing with many variables that re-quire a large number of measurements to cover a widerange of instrument settings. The range of instrument set-tings can be considered a multidimensional surface forthe optimization. Univariate optimizations do not coverthe whole surface (parameter space), making it possiblefor the operator to miss the maximum. If the variablesbeing optimized are dependent on each other, then achange in one variable affects other variables. A uni-variate optimization would not perform well in such asituation, since this approach assumes that the variablesare independent. Relatively few studies in optimizationof the ICP-MS have made use of the Simplex technique,which is simple, rapid, and ef® cient in such a system.2± 5
Evans and Caruso3 used Simplex optimization of ionlenses for reducing matrix-induced signal suppression bytuning the ion lenses in the presence of the matrix.Schmit and Chauvette4 used the Ar2
1 (m/z 5 76) signalintensity to test their Simplex optimization of the ion lensvoltages. They also compared the signals obtained by us-ing their Simplex approach to the manual optimization ofion lenses by a skilled operator and found improvementsin ion transmissions of 33% for Li and up to 380% forU. Evans and Ebdon5 and van der Velde-Koerts and deBoer2 demonstrated the use of the Simplex technique inthe optimization of the plasma operating parameters. Fordet al.6 used the Simplex technique for the multielementoptimization of the plasma parameters and the ion optics,although their study was focused on signal-to-back-ground ratios (SBRs) of the analytes. This Simplex ap-proach was used to optimize operating conditions acrossthe elemental mass range for argon and mixed-gas plas-mas.
The objective of this study was to investigate the bestapproach to ICP-MS optimization using a Simplex al-
644 Volume 52, Number 5, 1998
TABLE I. Instrumental operating and data acquisition parametersof ICP-MS.
ICP mass spectrometer
RF power 1000 WCoolant Ar ¯ ow 15.0 L min2 1
Auxiliary Ar ¯ ow 1.4 L min2 1
Nebulizer Ar ¯ ow 1.0 L min2 1
Sample introduction 1.0 mL min2 1
Data acquisition
Dwell time 20 msScan mode Peak hoppingNumber of masses (m/z) moni-
tored 2± 7Number of replicates 25Signal measurement Counts s 2 1
Resolution 0.7 a.m.u. at 10% peak height
Lens voltages
Einzel E1 2 0.1 to 2 20.3 VPhoton stop S2 2 0.01 to 2 20.2 VPlate P 2 0.2 to 2 60.1 VBessel box B 1 0.1 to 1 10.1 V
gorithm. Another goal of this study was the developmentof a practical procedure for the optimization of ion lenses.The procedure should be at least as fast as the time itwould take an expert operator to determine the best set-tings manually. Aspects of the multielement optimizationalgorithm such as the selection of the initial search sizeand the selection and application of objective functionsbased on analyte response were examined.
EXPERIMENTAL
A Perkin-Elmer Sciex Elan 500 ICP-MS was usedthroughout with the operating conditions found in TableI. Sample was introduced into the ICP-MS at a ¯ ow rateof 1 mL min2 1 with a peristaltic pump. The operatingconditions shown in Table I were chosen, because theyare typical for routine ICP-MS analysis. The uncertaintyof analyte signal intensity presented in all the tables and® gures was determined by using 25 replicate measure-ments with a typical relative standard deviation of ap-proximately 5%. Each of the four lenses of the ion opticsin the ICP-MS has its own voltage range (Table I), whichis individually controlled and scaled from 0 to 99 on theinstrument control panel. Adjustment of the ion lens volt-ages was carried out manually. The Simplex program wasrun on a separate personal computer. Standards and blanksolutions were prepared in 0.2% HNO3. Standards con-taining 100 ng mL2 1 of analyte were prepared by serialdilution from stock solutions (1000 m g mL2 1).
Simplex Optimization. The optimization algorithmused in this study was the modi® ed Simplex describedby Morgan and Deming.7 Optimization techniques gen-erally require a single value representing the response ata set of operating conditions, but multiple response val-ues (one for each element) are actually obtained. For sin-gle-element optimization in ICP-MS, the objective func-tion is the analyte signal intensity. For multielement anal-yses, an objective function was used to convert the mul-tiple response values into a single value. There areseveral types of objective functions for multielement re-sponses that may be used.8 Two will be considered forthis study. In the ® rst, response values for m analyte sig-
nals ( y1, . . . , ym) are united to form a new arti® cial one,y* 5 f( y1, . . . , ym). The optimization technique woulduse y* as a multiple compromise value, and the optimalconditions would result in the best compromise for all manalyte signals. Such an objective function for optimizingthe ICP-MS could take the same form as an objectivefunction developed for inductively coupled plasma atom-ic emission spectrometry (ICP-AES) using SBRs byLeary et al.9 The objective function was
ny* 5 (1)n
2 1(SBR)O ii
where n is the number of analytes, and SBRi is the SBRof the ith analyte. The purpose of this function is to ® ndthe best compromise by maximizing the lower SBRs atthe expense of the larger SBRs. For the optimization ofthe ICP-MS the objective function studied was
ny* 5 (2)n
2 1(S)O ii
where n is the number of analytes, and (S)i is the responseof the ith analyte.
Another objective function of this type was investi-gated. It was originally developed in our laboratory foroptimizing ICP-AES, and it can also be applied to ICP-MS. This objective function was called the combined ra-tio method10 (CRM) and takes the form
n
(S)O i1CRM 5 (3)k
RO jj
where n is the number of analytes; (S)i is the response ofthe ith analyte; k is (n 2 1) 1 (n 2 2) 1 . . . 1 1; andRj is the ratio of two given analytes ( jth combination)where the maximum response of the two is in the nu-merator, so that Rj $ 1. The CRM performs a weightedaverage on the sum of the analyte responses. For theseobjective functions, the Simplex algorithm tries to max-imize the y* or CRM value.
The second type of objective functions is based onmulticriteria target vector optimization.8 This optimiza-tion requires that the operator select `̀ optimal’ ’ values forthe signals for the analytes. The algorithm then tries to® nd settings that would produce analyte signals that areclosest to the `̀ optimal’’ . The actual response value vec-tor for the m analytes will be de® ned as (y1(a), . . . , ym(a)),where (a) stands for actual and y(a) is the experimentallyobtained response value for an analyte. The goal of thisapproach is to achieve a desired response target vector(y1(t), . . . , ym(t)), where (t) stands for target and y(t) isthe target response value set by the operator. The objec-tive function then becomes the Euclidean distance, dE(t2 a), between the target and the actual response vectors
1/2m
2d (t 2 a) 5 [ y (t) 2 y (a)] . (4)OE i i1 2i
In the optimization of the ICP-MS, yi(a) will be the
APPLIED SPECTROSCOPY 645
TABLE II. Best settings obtained from the optimizations of Al andPb, and B and Tl.
Func-tion Steps
Lens voltages (V)
B E1 P S2
Intensity(counts s 2 1)
Al Pb
Leary 15 5.3 2 10.7 2 30.5 2 10.6 58400 27000CRM 20 5.4 2 10.5 2 25.0 2 9.6 37910 39790Target 20 4.1 2 15.0 2 28.1 2 11.7 60050 33350
B Tl
Leary 34 4.9 2 18.0 2 31.7 2 12.1 9735 15440CRM 24 5.7 2 15.0 2 31.1 2 9.6 11050 12270Target 33 5.6 2 15.2 2 29.9 2 9.8 10630 17480
TABLE III. Selection of initial starting size.
Startingsize(%) Steps
Lens voltages (V)
B E1 P S2
Intensity(counts s2 1)
Cu Tb
20 16 3.2 2 10.5 2 25.0 2 8.4 13680 10360050 31 2.9 2 7.2 2 15.4 2 5.7 17230 7521070 37 2.8 2 5.6 2 14.7 2 5.5 14070 83680
signal intensity counts obtained for the ith analyte, andyi(t) will be the desired signal intensity counts for thatanalyte. The Euclidean distance was not calculated byusing the above equation, since changes in smaller valueswould not be weighted as much as changes in larger val-ues; the normalized Euclidean distance was used instead.
1/22m y (t) 2 y (a)i id (t 2 a) 5 . (5)OE 1 2[ ]y (t)i 5 1 i
The Simplex algorithm’s goal is to minimize the dis-tance between the actual and target vector. Prior to per-forming a multicriteria target vector optimization, onemust select an appropriate target. The values in the targetvector must always be greater than the maximum obtain-able responses. If the responses are greater than the targetvalues, then the values in the target have been underes-timated. Because of the nature of the calculation of theEuclidean distance ( Ï (distance2)), this case would resultin a distance that may not be considered as a good re-sponse even though it is better than the target vector. Thevalue of each element in the target vector plays an im-portant role in how well the optimization will perform.Consider two elements, Al and Pb, whose maximum ob-tainable signals are, for example, 50000 and 100 000counts, respectively, and which will be denoted by thevector [50 000, 100000]. If an arbitrary target vector waschosen to be [60000, 20 0000] then changes in Al areweighted move heavily than those of Pb. This is becausethe values in the target vector for Al and Pb are 120 and200%, respectively, of the maximum obtainable signals.A good target vector would be [60000, 120 000] sinceboth values would be 120% of the maximum obtainablesignals. In general, to obtain a good target vector, oneshould set all the values of the analytes in the target vec-tor at the same percentage level with respect to the max-imum obtainable signals. This approach may be dif® cultin practice since the maximum possible signals may beunknown.
The initial settings for the lenses for the optimizationwere set to cover 20% of the parameter space unless in-dicated otherwise. The optimization was terminated whenthe search space was reduced by the Simplex to 5% ofthe total parameter space.
RESULTS AND DISCUSSION
Comparison of Objective Functions. In simultaneousmultielement optimizations, the objective function deter-
mines the best compromise for all the elements. Threeobjective functions were tested: Leary’s function, theCRM, and the multicriteria target vector optimizationfunction. Two sets of optimizations were performed tocover the mass range of the periodic table. One set ofoptimizations included Al and Pb and the other set in-cluded B and Tl. The best compromise lens voltagesfound by the Simplex for both sets of optimizations arelisted in Table II. The lens voltages obtained are similarfor all three objective functions within each set of opti-mizations. Both Leary’s function’s and the multicriteriatarget vector optimization function’s performances arecomparable. In terms of total counts, the multicriteria tar-get vector optimization function does slightly better( ; 10%) than Leary’s function. The CRM’s compromiseplaces more emphasis on obtaining similar and maximalintensities. The number of steps taken by the Simplex didnot differ signi® cantly among objective functions.
Initial Simplex Starting Sizes. The selection of aninitial starting size of the search space for the Simplexalgorithm is not an obvious one. Three starting sizes ofthe search space were examined on an optimization oftwo elements, Cu and Tb (Table III), using a multicriteriatarget vector optimization. The three starting sizes studiedwere 20, 50, and 70% around the center of the parameterspace. All three initial starting sizes resulted in relativelysimilar compromise values for the two elements, althoughthe Simplex did not necessarily ® nd the same lens set-tings since the response surface has many local minima.4
The number of steps and therefore the time required forthe Simplex optimization was the deciding factor in theselection of the initial starting size. A Simplex startingwith 20% of the parameter space required approximatelyhalf the number of steps to completion in comparison tostarting sizes of 50 and 70% of the parameter space. Interms of signal intensity, a starting size of 20% was suf-® cient. Therefore, for the remainder of the experimentsin this study, a starting size of 20% was used.
Presence of Drift. A potential limitation in this typeof optimization study is the presence of instrumental drift,which we observed and which has been reported in otherstudies.3,6 Drift is a common problem with older elec-tronics and instruments such as the Elan 500. The ® rst3± 5 steps of the optimizations, independent of the objec-tive function used, were the same, and therefore theycould be used as indicators of drift since they werelooked at three different times. To verify the presence (orlack) of drift, we calculated the ratio of the two elementsstudied, one heavy and one light, since heavier elementstend to drift more than lighter ones on our spectrometer.For each step taken by the Simplex, the ratios did notexhibit signi® cant variation, so it was concluded that theline intensities were not drifting signi® cantly within thetime period of these optimizations. It is also worth noting
646 Volume 52, Number 5, 1998
TABLE IV. Predicted and experimentally obtained signal intensi-ties for selected elements.
Element
Kineticenergy(eV)
Degreeof ioni-zation
Predictedsignal(counts
s 2 1)
Experi-mentalsignal
(counts s 2 1)Error(%)
103Rh (100%) 4.68 0.96 ´́ ´ 58770 ´́ ´111Cd (13%) 4.89 0.85 7113 6444 10140Ce (88%) 5.64 0.98 65361 66980 2 2159Tb (100%) 6.13 0.99 81161 121800 2 33208Pb (52%) 7.41 0.98 50228 61560 2 1845Sc (100%) 3.17 1.00 42244 37800 1263Cu (69%) 3.64 0.92 30233 18190 66
TABLE V. Best settings obtained in the multielement (Al and Pb)optimization and the mid-mass (Sn) optimization .
Elementsoptimized Steps
Lens voltages (V)
B E1 P S2
Analytes
Al Pb
Al-Pb(27-208) 20 4.1 2 15.0 2 28.1 2 11.7 52810 30660
Sn (118) 19 5.4 2 9.5 2 29.9 2 10.8 40960 33290
TABLE VI. Best settings obtained in the multielemen t (B and Tl)optimization and the mid-mass (Ag) optimization.
Elementsoptimized Steps
Lens voltages (V)
B E1 P S2
Analytes
B Tl
B-Tl(11-203) 21 4.8 12.5 2 26.2 2 10.6 20570 24030
Ag (107) 15 6.1 2 8.2 2 24.4 2 8.2 12800 25980
that the experimental drift may have been observed insome previous studies because their Simplex optimiza-tions required 2± 5 h, where 10± 15 min was usually re-quired in this study.
Determination of a Target Vector. The approachused for determining a good target for all of the elementsin the periodic table required the optimization of the ionlenses for a single reference element, which could beused to predict optimum signal intensities of all of theelements in the periodic table. By knowing the optimumsignal intensity of one element, it should possible to cal-culate the optimum signal intensities for any single ele-ment using the same Simplex and instrumental settings[radio-frequency (rf) power and carrier ¯ ow]. It is pos-sible to estimate the optimum signal intensity of any el-ement relative to another provided that the atomic mass,kinetic energy, natural abundance, and degree of ioniza-tion are known. The kinetic energy of the ions11 providesinformation about the transmission ef® ciency of ionsthrough the sampler and skimmer cones as well asthrough the ion lenses.12 In general, heavier ions, withhigher momentum, should have high transmission ef® -ciencies as they are less prone to problems such as space-charge effects. For a given atomic mass m, the kineticenergy11 can be calculated by using
KE 5 a*m 1 b eV. (6)
In our system, the values for a and b were 0.026 and2.0, respectively. Parameters such as natural abundanceand degree of ionization13 provide information about thepopulations of ions in the plasma, and therefore signalintensities should be proportional. The assumptions madewere that (1) identical analyte concentrations are used,(2) the analytes are in the same matrix, and (3) identicalconditions are used. With the use of the signal intensityfrom a reference element (e.g., 103Rh), the relative signalintensity counts of each element in the test sample couldbe predicted by using
Ab *Ion *KEA A APred. Signal 5 Signal * (7)A Ref Ab *Ion *KERef Ref Ref
where A is the element of interest; Ref is the referenceelement, Pred. SignalA is the signal predicted for elementA; SignalRef is the signal obtained for the reference ele-ment; Ab is the percent abundance; Ion is the degree ofionization13; and KE is the kinetic energy. 103Rh was se-lected as the reference element because its mass lies inthe middle of the mass range. A Simplex was performedwith 103Rh to obtain its maximum signal for use as a
reference point. The predicted signal was then calculatedfor seven elements (Table IV). Simplex optimizationswere performed for each of the seven elements to acquirethe maximum obtainable (or close to it) signal. A com-parison of the predicted signal and the maximum exper-imentally obtained signal intensities is summarized in Ta-ble IV. For most of the elements, the prediction signalwas within 20% of the maximum signal intensity ob-tained by experiment. Copper was the only elementwhose signal intensity was not predicted accurately. Thisapproach was then used to predict appropriate values forthe target vector by setting the values in the target vectorto 120% of the predicted signal for each analyte. Overall,this approach for selecting a target vector was successful;however, it must be kept in mind that the purpose of thisstudy is not to accurately predict the signals of elementsbut to ® nd a good target vector.
Approaches to Mass Selection for Optimization. Itis more time consuming to optimize the ion lenses foreach of the analytes present in a sample. Optimizing fora single element takes less time, and ® nding an objectivefunction is not necessary. One of the goals of these ex-periments was to compare optimizations using a mid-mass element and a multielement response function. Amid-mass element is routinely used for operating param-eter adjustments prior to the analysis of samples. To sim-plify this study, we performed the multielement optimi-zations using only two elements. The middle of the atom-ic mass range of the elements is calculated by
Mass 1 Masshigh lowmid-mass 5 (8)
2
where Masshigh is the atomic mass of the heaviest element,and Masslow is the atomic mass of the lightest element inthe analysis. The element that has an atomic mass closestto the calculated mid-mass is used as the mid-mass ele-ment. Optimizations using mid-mass elements (Tables Vand VI) provided higher signal intensities ( ; 8 and 9%)for the heavier elements than the multielement optimi-zations. Multielement optimizations performed signi® -cantly better ( ; 29 and 61%) for the lighter elements ascompared to mid-mass optimizations. The number ofsteps taken by the Simplex to perform each optimizationdid not vary considerably and was not a factor. Overall,
APPLIED SPECTROSCOPY 647
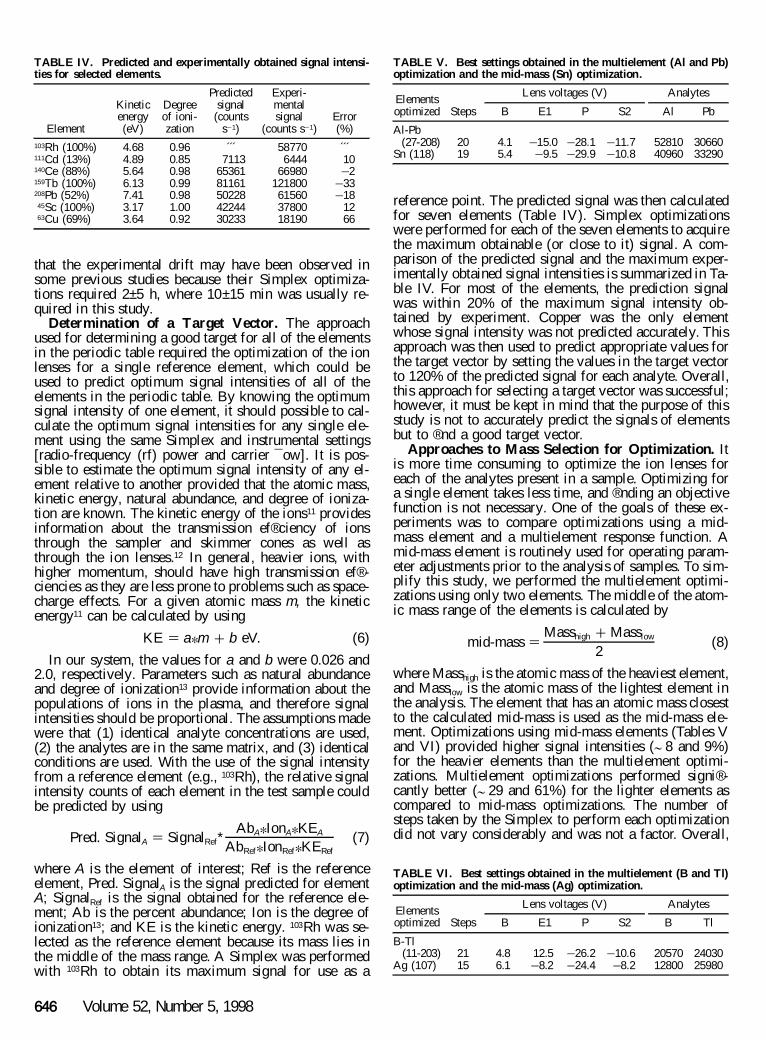
FIG. 1. Optimization for a solution containing the elements 7Li, 138Ba,140Ce, 203Tl, 208Pb, and 209Bi. Optimizations were done with a mid-masselement (107Ag) and an average mass element (151Eu).
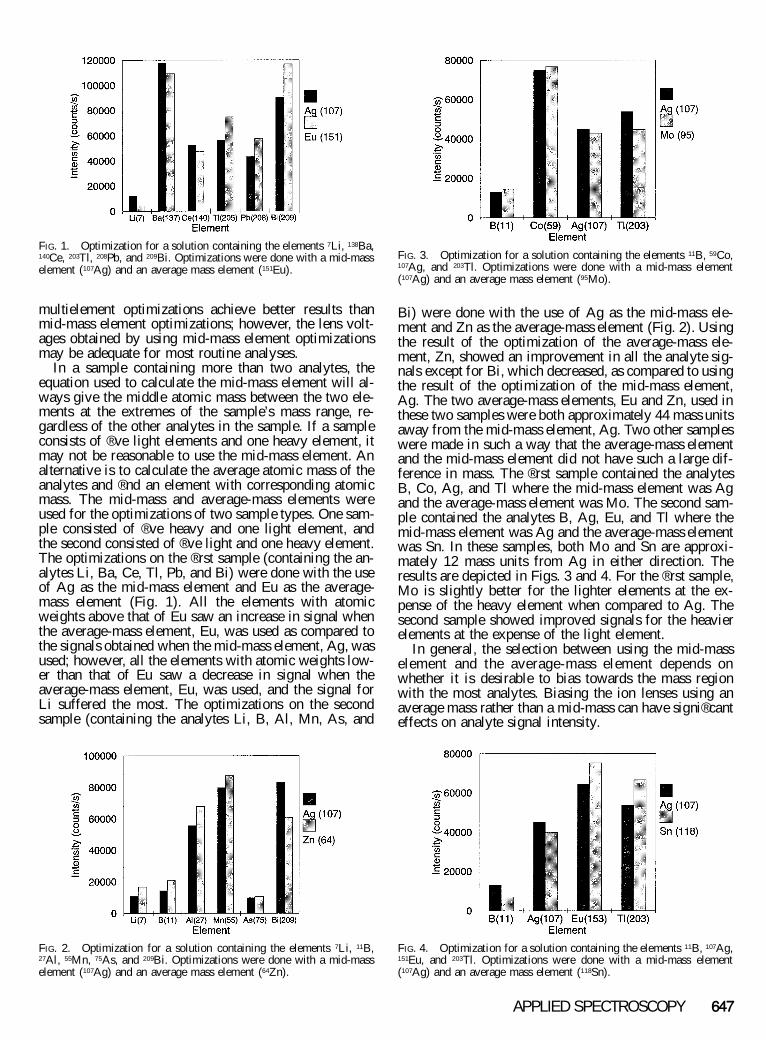
FIG. 3. Optimization for a solution containing the elements 11B, 59Co,107Ag, and 203Tl. Optimizations were done with a mid-mass element(107Ag) and an average mass element (95Mo).
FIG. 4. Optimization for a solution containing the elements 11B, 107Ag,151Eu, and 203Tl. Optimizations were done with a mid-mass element(107Ag) and an average mass element (118Sn).
FIG. 2. Optimization for a solution containing the elements 7Li, 11B,27Al, 55Mn, 75As, and 209Bi. Optimizations were done with a mid-masselement (107Ag) and an average mass element (64Zn).
multielement optimizations achieve better results thanmid-mass element optimizations; however, the lens volt-ages obtained by using mid-mass element optimizationsmay be adequate for most routine analyses.
In a sample containing more than two analytes, theequation used to calculate the mid-mass element will al-ways give the middle atomic mass between the two ele-ments at the extremes of the sample’s mass range, re-gardless of the other analytes in the sample. If a sampleconsists of ® ve light elements and one heavy element, itmay not be reasonable to use the mid-mass element. Analternative is to calculate the average atomic mass of theanalytes and ® nd an element with corresponding atomicmass. The mid-mass and average-mass elements wereused for the optimizations of two sample types. One sam-ple consisted of ® ve heavy and one light element, andthe second consisted of ® ve light and one heavy element.The optimizations on the ® rst sample (containing the an-alytes Li, Ba, Ce, Tl, Pb, and Bi) were done with the useof Ag as the mid-mass element and Eu as the average-mass element (Fig. 1). All the elements with atomicweights above that of Eu saw an increase in signal whenthe average-mass element, Eu, was used as compared tothe signals obtained when the mid-mass element, Ag, wasused; however, all the elements with atomic weights low-er than that of Eu saw a decrease in signal when theaverage-mass element, Eu, was used, and the signal forLi suffered the most. The optimizations on the secondsample (containing the analytes Li, B, Al, Mn, As, and
Bi) were done with the use of Ag as the mid-mass ele-ment and Zn as the average-mass element (Fig. 2). Usingthe result of the optimization of the average-mass ele-ment, Zn, showed an improvement in all the analyte sig-nals except for Bi, which decreased, as compared to usingthe result of the optimization of the mid-mass element,Ag. The two average-mass elements, Eu and Zn, used inthese two samples were both approximately 44 mass unitsaway from the mid-mass element, Ag. Two other sampleswere made in such a way that the average-mass elementand the mid-mass element did not have such a large dif-ference in mass. The ® rst sample contained the analytesB, Co, Ag, and Tl where the mid-mass element was Agand the average-mass element was Mo. The second sam-ple contained the analytes B, Ag, Eu, and Tl where themid-mass element was Ag and the average-mass elementwas Sn. In these samples, both Mo and Sn are approxi-mately 12 mass units from Ag in either direction. Theresults are depicted in Figs. 3 and 4. For the ® rst sample,Mo is slightly better for the lighter elements at the ex-pense of the heavy element when compared to Ag. Thesecond sample showed improved signals for the heavierelements at the expense of the light element.
In general, the selection between using the mid-masselement and the average-mass element depends onwhether it is desirable to bias towards the mass regionwith the most analytes. Biasing the ion lenses using anaverage mass rather than a mid-mass can have signi® canteffects on analyte signal intensity.

648 Volume 52, Number 5, 1998
ACKNOWLEDGMENTS
The authors would like to acknowledge Dr. D. Conrad Gregoire forhis collegial support and instrumental expertise. D.G. thanks the NaturalSciences and Engineering Research Council of Canada (NSERC) forscholarship support. C.S. gratefully acknowledges support by FCAR ofthe Province of Quebec. The authors wish to acknowledge the generalsupport of NSERC.
1. J. P. Schmit and M. Chtaib, Can. J. Spectrosc. 32, 56 (1987).2. T. van der Velde-Koerts and J. L. M. de Boer, J. Anal. At. Spectrom.
9, 1093 (1994).3. E. H. Evans and J. A. Caruso, Spectrochim. Acta 47B, 1001 (1992).
4. J. P. Schmit and A. Chauvette, J. Anal. At. Spectrom. 4, 755 (1989).5. E. H. Evans and L. Ebdon, J. Anal. At. Spectrom 6, 421 (1991).6. M. J. Ford, L. Ebdon, R. C. Hutton, and S. J. Hill, Anal. Chim.
Acta 285, 23 (1994).7. S. L. Morgan and S. N. Deming, Anal. Chem. 46, 1170 (1974).8. D. Wienke, C. Lucasius, and G. Kateman, Anal. Chim. Acta 265,
211 (1992).9. J. J. Leary, A. E. Brokes, A. F. Dorrzapf, Jr., and D. W. Golightly,
Appl. Spectrosc. 36, 37 (1982).10. C. Sartoros and E. D. Salin, J. Anal. At. Spectrom. 12, 13 (1997).11. J. E. Fulford and D. J. Douglas, Appl. Spectrosc. 40, 971 (1986).12. H. Niu and R. S. Houk, Spectrochim. Acta 51B, 779 (1996).13. R. S. Houk, Anal. Chem. 58, 97A (1996).