Embed Size (px)
Citation preview
Prognostic Value of the
ISUP 2015 Gleason Grade
Groupings
Yasin Folkvaljon
Department of Statistics
Uppsala University
Supervisors: Lisbeth Hansson and Hans Garmo
2015
Abstract
Background: New prognostic grade groupings were recently
proposed for prostate cancer. They are based on Gleason grading of
either biopsy or prostatectomy specimen. Former Gleason 6
corresponds to group 1, Gleason 7=3+4 corresponds to group 2,
Gleason 7=4+3 corresponds to group 3, Gleason 8 corresponds to
group 4, and Gleason 9-10 correspond to group 5.
Objective: To assess the prognostic value of Gleason grade groups in
men with prostate cancer from a nationwide population-based cohort.
Design, Setting and Participants: From the National Prostate Cancer
Register of Sweden, we identified 5,880 men diagnosed with prostate
cancer from 2005 to 2007, including 4,325 who had radical
prostatectomy and 1,555 treated by radiotherapy.
Outcome Measurements and Statistical Analysis: Kaplan-Meier
survival analysis was used to calculate the cumulative 4-year
biochemical recurrence-free survival. Cox proportional hazards
regression models were used to examine the relationship between
prognostic Gleason grade groups and biochemical recurrence after
radical prostatectomy and radiotherapy. The 4-year biochemical
progression-free survival was compared for groups based on biopsy
and prostatectomy Gleason grade groups.
Results and Limitations: Among men undergoing surgery, the 4-year
biochemical progression-free survival was 89%, 82%, 74%, 77%, and
49% for prognostic Gleason grade groups 1-5 on biopsy. The
corresponding 4-year biochemical progression-free survival based on
prostatectomy prognostic Gleason grade groups was 92%, 85%, 73%,
63%, and 51% for prognostic Gleason grade groups 1-5. For men
undergoing radiotherapy, biopsy prognostic Gleason grade groups 1-5
had 4-year biochemical progression-free survival of 95%, 91%, 85%,
78%, and 70%. After adjusting for preoperative serum prostate
specific antigen and clinical stage, biopsy prognostic Gleason grade
groups were significant independent predictors of biochemical
progression after radical prostatectomy and radiotherapy. There was
no central review of pathology.
Conclusions: These results confirm the prognostic value of the newly
proposed prognostic Gleason grade groups in men undergoing radical
prostatectomy and radiotherapy in a population-based setting.
Patient Summary: The new prognostic Gleason grade groups,
ranging from 1-5, predict recurrence after curative treatment for
prostate cancer, both with surgery and radiotherapy.
Take Home Message: The new prognostic Gleason grade groups 1-5
stratify the risk of biochemical recurrence after radical prostatectomy
and radiotherapy.

Keywords: neoplasms, adenocarcinoma, cancer, prostate, biopsy,
histopathology, prostatectomy, radiotherapy, recurrence, PCBaSe
Contents
1 Introduction ........................................................................................... 1
2 Patients and methods ............................................................................. 6
3 Results ................................................................................................. 14
4 Discussion ............................................................................................ 18
5 Conclusions ......................................................................................... 23
References ..................................................................................................... 24
Tables and figures ......................................................................................... 28
Abbreviations
GS = Gleason score, GGG = Gleason grade group,
ISUP = International Society of Urological Pathology,
PCa = prostate cancer, NPCR = National Prostate Cancer Register,
PCBaSe = prostate cancer database Sweden,
PSA = prostate specific antigen, RP = radical prostatectomy,
RT = radiotherapy, CCI = Charlson Comorbidity Index,
BCR = biochemical recurrence, IQR = interquartile range,
HR = hazard ratio, CI = confidence interval

Acknowledgements
This project was made possible by the continuous work of the
National Prostate Cancer Register of Sweden (NPCR) steering group:
Pär Stattin (chairman), Anders Widmark, Camilla Thellenberg, Ove
Andrén, Anna Bill-Axelson, Ann-Sofi Fransson, Magnus Törnblom,
Stefan Carlsson, Marie Hjälm-Eriksson, Bodil Westman, Bill
Pettersson, David Robinson, Mats Andén, Jan-Erik Damber, Jonas
Hugosson, Ingela Franck-Lissbrant, Maria Nyberg, Göran Ahlgren,
Ola Bratt, René Blom, Lars Egevad, Calle Waller, Olof Akre, Per
Fransson, Eva Johansson, Fredrik Sandin, Hans Garmo, Mats Lambe,
Karin Hellström, Annette Wigertz and Erik Holmberg.
1
1 Introduction
A new tumor grading scheme for prostate cancer (PCa) was
recently proposed [1]. The objective of this new system is to better
reflect biological aggressiveness, assist in guiding clinical
management and thus help reduce overtreatment. The most widely
used grading scheme for PCa is currently the Gleason grading system.
This system ranges from 2 to 10, with the vast majority of tumors
falling in the range 6 to 10. The newly proposed grading scheme for
PCa ranges from 1 to 5.
The Gleason grading system [2] [3] was developed by
pathologist Donald Gleason and colleagues at the Minneapolis
Veterans Affairs Hospital in 1966. This system is a powerful tool used
by urologists to grade and help assess the prognosis of PCa. The initial
grading is done by first taking biopsies from the prostate, usually from
pre-determined areas of the prostate where the cancer is most likely to
be found. The number of biopsies taken varies between countries and
different hospitals. In Sweden, a trend towards higher numbers of
biopsies per session has been observed. The norm up to 2007 was
6-9 biopsies, whereas 10-12 is rapidly becoming the most common
biopsy scheme [4]. Each pattern found in the biopsy specimen is then
assigned a grade by a pathologist. The grades range from 1 to 5, with
higher grades indicating patterns associated with more aggressive
tumors. The primary grade is given to the dominant pattern found in
2
the biopsy (>50%). Subsequently, the second most common pattern
found is graded 1 to 5, this is the secondary grade. If the secondary
grade is lower than the primary, it needs to cover at least 5% of the
sample. The primary and secondary grades are then summed up to
form the final Gleason score (GS), which lies between 2 and 10 [5].
This is done for each biopsy taken. The final GS is the highest among
all graded biopsies. The GS is used to determine the stage of the
cancer, along with other clinical characteristics. These other
characteristics consist of serum levels of prostate specific antigen
(PSA), which is measured with blood tests [6] and the TNM staging
system. TNM is a system used for many cancer diagnoses in order to
describes the primary tumor (T stage), the involvement of regional
lymph nodes (N stage) and distant metastases (M stage) [7]. Lower
PSA and TNM stage, imply better prognosis in terms of disease
progression and mortality. The PSA and TNM are used to define
clinically localized PCa [4]. These factors have also been shown to be
correlated with progression and mortality [8] [9] [10] [11] [12].
The Gleason grading system has not been immune to the
passage of time and extensive revisions have been made over the last
decade [5] [13]. Furthermore, attempts have been made to standardize
grade reporting among urological pathologists in Sweden [14]. At the
2014 International Society of Urological Pathology (ISUP) consensus
conference, new groupings of Gleason grades were discussed [15].
This new grouping is intended to better distinguish between
intermediate grade cancers. It is also meant to label the favorable low
risk features of cancers with lower Gleason grades more appropriately
as “Group 1”, instead of the currently used “Gleason 6”, thereby
3
hoping to reduce what is commonly referred to as overtreatment of
men with low risk PCa [4] [6] [16]. There are still details to be worked
out, such as the nomenclature and acronyms, but for the purposes of
the current study the newly proposed grade groups will be referred to
as Gleason grade group (GGG) 1 through 5. What was formerly
known as GS 6 corresponds to GGG 1, GS 7=3+4 corresponds to
GGG 2, GS 7=4+3 corresponds to GGG 3, GS 8 corresponds to GGG
4 and GS 9-10 correspond to GGG 5.
If the GGG is to be incorporated into clinical practice, its
prognostic value needs to be assessed. The importance of the newly
introduced categories, separating Gleason 7=3+4 and 7=4+3, also
needs to be evaluated. Furthermore, combining Gleason 9 and 10
shouldn’t depreciate the prognostic value of the groups. Since there is
no question of causality to be investigated, this situation is one
instance where a randomized study may be needlessly costly and
intricate. Instead, a retrospective cohort study is a suitable design for
investigating the prognostic value of the GGG. To date, only one such
study has been published, a single-institution study with a median
follow-up of two years which only included men undergoing surgery.
One curative treatment option for men diagnosed with PCa
is radical prostatectomy (RP). In an RP, the entire prostate is
surgically removed. After surgery, tissue slices from the entire
prostate are examined by a pathologist to assign a Gleason score based
on the prostatectomy specimen. The definitions are similar to those
followed when grading the biopsy specimen, but they are not exactly
the same [7]. The initial GS, based on biopsy specimens, is sometimes
referred to as the biopsy Gleason score to differentiate between it and
4
the prostatectomy GS. The prostatectomy GS is naturally a more
robust score than the biopsy GS, since it has the advantage of being
based on the entire prostate. The biopsies needles are very small
compared to the size of the entire prostate, which is about the size of a
walnut. But of course, the prostatectomy GS is only available for
patients who have undergone an RP and not for patients who receive
non-curative therapy or other curative treatment options than RP. The
two groupings based different tissue samples will hereafter be referred
to as biopsy GGG and RP GGG, respectively. Hopefully, this
avoids confusion when differentiating between GGG based on biopsy
and RP specimen.
Men with clinically localized PCa are a group for whom
curative treatment is highly recommended [17]. There are curative
treatment options other than RP. The other most commonly used
treatment option is radiotherapy (RT), where the tumor is destroyed
by use of radiation. Side effects of these two treatment options are
quite different and can be very severe [18]. The number of men with
clinically localized PCa receiving curative primary treatment with
either RP or RT has increased in Sweden over the past decades [4].
Meanwhile, a number of incitements for an increased utilization of
active surveillance have been implemented in Sweden.
Active surveillance is a deferral or delay of curative treatment. It is
intended for men with low risk tumors, in the sense that the tumor has
a low risk of growing outside of the prostate. It comes down to
weighing the risks of delayed treatment against the possible side-
effects of curative therapy. The incitements for increased utilization of
5
active surveillance are primarily meant to reduce overtreatment of
low risk PCa [19].
The objective of the current study is to evaluate the
prognostic value of the GGG, in a nationwide population-based
setting. The GGG is also to be compared to the standard GS in terms
of prognostic value. The primary hypothesis was that men with
different GGG have different recurrence-free survival. The secondary
hypothesis was that the newly introduced categories have different
prognoses. In other words, that GGG 3 (Gleason 7=4+3) has a lower
4-year BCR-free survival than GGG 2 (Gleason 7=3+4).
Whether the GGG will be more readily understood by
patients will not be investigated in the current study. This is due to the
need for a survey directed at the patient themselves, something which
is not possible within PCBaSe. Nevertheless, communicability is a
key motivation behind the new groupings [20]. This is because being
informed that one has a very low grade cancer which is still graded 6
on a scale ranging from 2 to 10 may be an unknowingly misleading
depiction of reality. It is important to note that almost all PCa which is
found to date, even very low risk disease, has a grade of 6 at the
lowest [4]. In a worst-case scenario, it could lead to overtreatment
initiated by the patient. This is also mentioned in the Swedish national
guidelines for prostate cancer care [21].
6
2 Patients and methods
The National Prostate Cancer Register (NPCR)
prospectively collects data on men with prostate cancer diagnosed in
Sweden since the early 1990s. From 1998 to 2012, the NPCR had
nationwide coverage, with a capture rate of nearly 98% of all newly
diagnosed men in Sweden [4] [22] [23]. Unlike the Swedish Cancer
Register, to which reporting is mandated by law, the NPCR contains
tumor characteristics such as preoperative serum PSA and GS. The
NPCR also encompasses a follow-up study including men diagnosed
2003-2007 at age 70 years or younger with clinically localized
[4] PCa. There is also an added limitation of PSA <20 ng/ml in the
follow-up study, in order to identify men eligible for active
surveillance [19]. The follow-up study is not to be confused with a
single study per se, but is a dataset used for many studies. The
advantage of this, smaller, dataset is that it also includes data on
biochemical recurrence (BCR) after curative treatment. The follow-up
time in the dataset also extends up to five years after diagnosis,
whereas the NPCR only contains data known at or shortly after the
date of diagnosis. BCR is determined with the use of regular blood
tests after curative treatment and is not registered elsewhere in the
NPCR. The definition of BCR in the follow-up study is two PSA
measurements over 0.2 ng/ml after RP and two PSA measurements
2 ng/ml or more over the PSA nadir after RT. The PSA nadir is the
7
lowest recorded level after treatment. The date of BCR is defined as
the date of the earliest measurement used in the definition for each of
the two treatment modalities.
Data from the NPCR have been linked to other national
demographic and health care databases using individual personal
identity numbers. The linked dataset is known as Prostate Cancer data
Base Sweden (PCBaSe) and has been previously described [24].
Through the extensive cross-linkage, PCBaSe also contains data on
patient characteristics and primary treatment, both planned and
delivered. It also includes data on comorbid conditions and important
demographic factors such as county of residence, marital status,
educational level and disposable income. Furthermore, PCBaSe
contains a matched comparison cohort of PCa-free men allowing for
different study designs, e.g. case-control studies.
Comorbidity was assessed with the Charlson comorbidity
index (CCI) [25]. The CCI assigns weights to medical conditions
in 17 categories, including hypertension, diabetes and cancer. The
weights are 1, 2, 3 or 6. Higher weights imply higher morbidity, in
other words a greater concomitant disease burden. The final score,
CCI, is calculated for each individual by summing all of their weights.
When evaluating the prognostic properties of a tumor
grading system, the ideal scenario is to investigate the association
between grades and cause-specific survival. Fortunately, the 10-year
cause-specific mortality for low and intermediate risk PCa, especially
in men selected for curative treatment, is very low [26]. Therefore, an
intermediate endpoint such as BCR is commonly used [27]. The use of
BCR as an endpoint restricted the current study to men in the
8
follow-up study within the NPCR, where BCR is recorded for up to
five years after diagnosis. Furthermore, as BCR is defined after
curative treatment, only men who underwent primary RP or RT were
included in the current study. Due to the differences in the definition
of BCR after RP and RT, all statistical analyses were stratified on type
of primary treatment.
The Gleason grading system was modified at the 2005 ISUP
meeting [5]. These modifications, along with other changes made to
the system prior to the 2005 meeting, have been shown to affect the
grading of tumors in Sweden [13]. To maintain comparability, the
current study was limited to men in the follow-up study within the
NPCR, diagnosed with complete data after the change. In other words,
men diagnosed 2005-2007 with follow-up, complete biopsy Gleason
grades and complete prostatectomy Gleason grades for men
undergoing RP.
The significance threshold in all tests was set to 𝑝 < 0.05
and all tests were two-sided. In all time-to-event analyses, date of
primary treatment was used as 𝑡 = 0 and the exact method of handling
ties [28] was always employed. Despite the follow-up study recording
BCR for up to five years after diagnosis, there is a varying lag time
between diagnosis and treatment initiation which needs to be taken
into account. In order to handle this lag, all analyses were limited to
four years after primary treatment initiation as most patients receiving
curative treatment do so within the first year after diagnosis [4].
Patients were followed from the date of primary treatment to the date
of BCR, death, four years from date of treatment or loss to follow-up,
whichever occurred first.
9
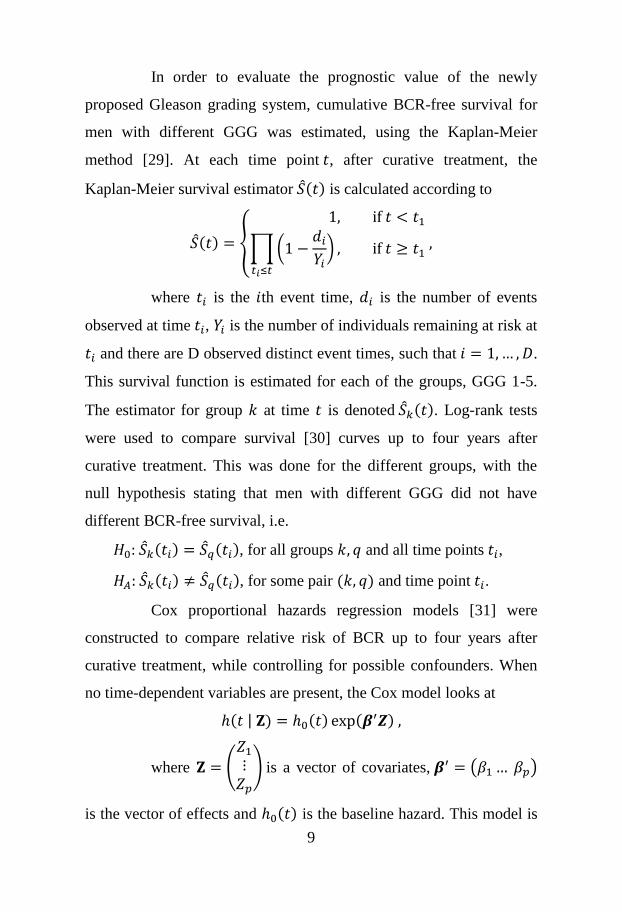
In order to evaluate the prognostic value of the newly
proposed Gleason grading system, cumulative BCR-free survival for
men with different GGG was estimated, using the Kaplan-Meier
method [29]. At each time point 𝑡, after curative treatment, the
Kaplan-Meier survival estimator �̂�(𝑡) is calculated according to
�̂�(𝑡) = {
1, if 𝑡 < 𝑡1
∏ (1 −𝑑𝑖
𝑌𝑖)
𝑡𝑖≤𝑡
, if 𝑡 ≥ 𝑡1 ,
where 𝑡𝑖 is the 𝑖th event time, 𝑑𝑖 is the number of events
observed at time 𝑡𝑖, 𝑌𝑖 is the number of individuals remaining at risk at
𝑡𝑖 and there are D observed distinct event times, such that 𝑖 = 1, … , 𝐷.
This survival function is estimated for each of the groups, GGG 1-5.
The estimator for group 𝑘 at time 𝑡 is denoted �̂�𝑘(𝑡). Log-rank tests
were used to compare survival [30] curves up to four years after
curative treatment. This was done for the different groups, with the
null hypothesis stating that men with different GGG did not have
different BCR-free survival, i.e.
𝐻0: �̂�𝑘(𝑡𝑖) = �̂�𝑞(𝑡𝑖), for all groups 𝑘, 𝑞 and all time points 𝑡𝑖,
𝐻𝐴: �̂�𝑘(𝑡𝑖) ≠ �̂�𝑞(𝑡𝑖), for some pair (𝑘, 𝑞) and time point 𝑡𝑖.
Cox proportional hazards regression models [31] were
constructed to compare relative risk of BCR up to four years after
curative treatment, while controlling for possible confounders. When
no time-dependent variables are present, the Cox model looks at
ℎ(𝑡 | 𝐙) = ℎ0(𝑡) exp(𝜷′𝒁) ,
where 𝐙 = (
𝑍1
⋮𝑍𝑝
) is a vector of covariates, 𝜷′ = (𝛽1 … 𝛽𝑝)
is the vector of effects and ℎ0(𝑡) is the baseline hazard. This model is
10
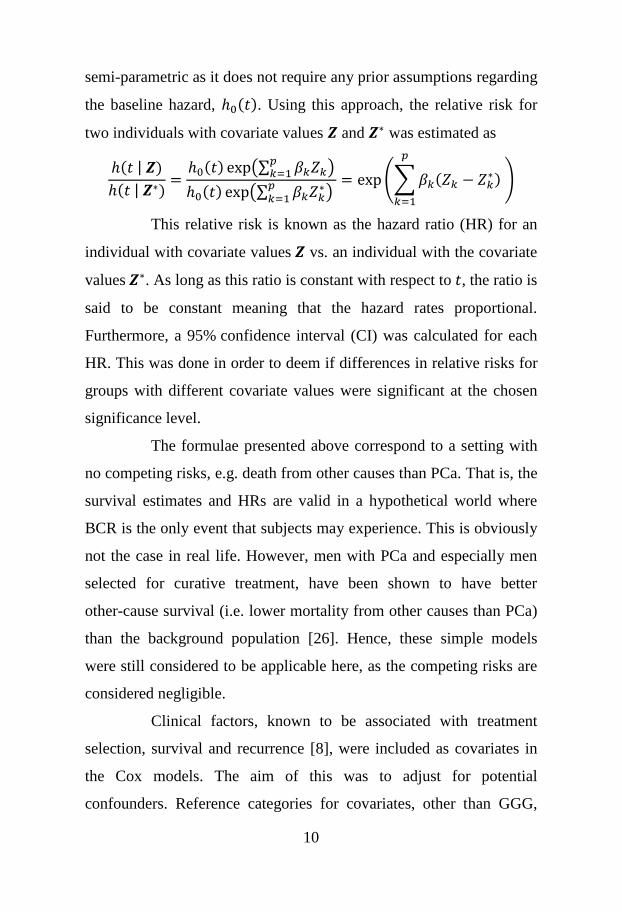
semi-parametric as it does not require any prior assumptions regarding
the baseline hazard, ℎ0(𝑡). Using this approach, the relative risk for
two individuals with covariate values 𝒁 and 𝒁∗ was estimated as
ℎ(𝑡 | 𝒁)
ℎ(𝑡 | 𝒁∗)=
ℎ0(𝑡) exp(∑ 𝛽𝑘𝑍𝑘𝑝𝑘=1 )
ℎ0(𝑡) exp(∑ 𝛽𝑘𝑍𝑘∗𝑝
𝑘=1 ) = exp (∑ 𝛽𝑘(𝑍𝑘 − 𝑍𝑘
∗)
𝑝
𝑘=1
)
This relative risk is known as the hazard ratio (HR) for an
individual with covariate values 𝒁 vs. an individual with the covariate
values 𝒁∗. As long as this ratio is constant with respect to 𝑡, the ratio is
said to be constant meaning that the hazard rates proportional.
Furthermore, a 95% confidence interval (CI) was calculated for each
HR. This was done in order to deem if differences in relative risks for
groups with different covariate values were significant at the chosen
significance level.
The formulae presented above correspond to a setting with
no competing risks, e.g. death from other causes than PCa. That is, the
survival estimates and HRs are valid in a hypothetical world where
BCR is the only event that subjects may experience. This is obviously
not the case in real life. However, men with PCa and especially men
selected for curative treatment, have been shown to have better
other-cause survival (i.e. lower mortality from other causes than PCa)
than the background population [26]. Hence, these simple models
were still considered to be applicable here, as the competing risks are
considered negligible.
Clinical factors, known to be associated with treatment
selection, survival and recurrence [8], were included as covariates in
the Cox models. The aim of this was to adjust for potential
confounders. Reference categories for covariates, other than GGG,
11
were decided after discussions with urologists. For simplicity,
GGG 1 is the reference category for GGG in all tables. In order to
make comparisons with groups other than GGG 1 as the reference, the
following calculations were employed.
Let 𝐻�̂�2 denote the estimated HR for GGG 2, with GGG 1
as the reference category. Define 𝐻�̂�3 in the same manner, for GGG
3. Say we want to compare GGG 3 to GGG 2. The estimated HR for
GGG 3 compared to GGG 2, is given by
𝐻�̂�3
𝐻�̂�2
=𝑒�̂�3
𝑒�̂�2= 𝑒�̂�3−�̂�2 ,
where �̂�2 is the estimate of the coefficient 𝛽2, corresponding
to GGG 2 and the �̂�3 corresponds to 𝛽3. To find the corresponding
CI for 𝑒𝛽3−𝛽2, the variance component of this estimate is required.
This variance component is given by
𝑉(𝛽3 − 𝛽2) = 𝑉(𝛽3) + 𝑉(𝛽2) − 2 𝐶𝑜𝑣(𝛽2, 𝛽3),
where 𝑉(𝛽𝑖) and 𝐶𝑜𝑣(𝛽𝑖, 𝛽𝑗) correspond to the variance of
𝛽𝑖 and covariance of (𝛽𝑖, 𝛽𝑗), respectively, 𝑖, 𝑗 = 2, 3.
Confidence intervals were then constructed using Wald’s
method, as the samples were deemed sufficiently large. Hence, the
95% CI for 𝑒𝛽3−𝛽2 is estimated by
𝑒�̂�3−�̂�2±𝑧0.025√𝑉(�̂�3−�̂�2)
,
where 𝑧 is the corresponding quantile of the standard
normal distribution. For the sake of completeness, the estimated CIs
were always compared to those calculated with the profile likelihood
method with the survival package in R.
12
In order to adjust for differences in the distribution of age at
treatment, age was used as time scale in the Cox models, a method
which has been previously described [32]. The basic idea is that
instead of comparing event times of subjects still at risk at each event
time 𝑡, the comparison is made with subjects who had attained the
same age at each 𝑡. This method can also be used when calculating
cumulative survival. The survival curves were however estimated
using the standard time on study as time scale. The reasoning here was
that the graphical representation or survival curves becomes arguably
less intuitive with age as time scale.
Assumptions regarding independence of censoring were
examined using scatter plots of the censoring pattern in different
groups. The proportional hazards assumption underlying the
Cox models was examined using interaction terms and Arjas plots
[33]. The assumption of non-informative censoring was discussed
with clinicians and epidemiologists who were involved in the
prospective gathering of follow-up data within the NPCR. The final
conclusion was that no known circumstances were suspected to
seriously jeopardize the assumption of non-informative censoring.
Subset and sensitivity analyses were performed in an
attempt to further investigate how changes incorporated into the new
system affected the prognostic value. In the sensitivity analyses,
comorbidity and socioeconomic factors were added to the models.
This was done to investigate whether any differences between men
with different GGG remained after adjusting for these factors. In other
words, an attempt was made to investigate the sensitivity to residual
confounding in the estimates. The same was done with pathology
13
features, but only for men who underwent RP as they were the only
ones with data on pathology. The subset analyses focused on the
newly introduced groups (GGG 2-3, i.e. GS 7) and investigated
whether these were different in terms of BCR-free survival. That is,
these analyses focused on the subset of men with GGG 2-3. The
subset analyses were performed in the same manner as the main
analyses. It was also of interest to examine whether the combining of
GS 9 and 10 was appropriate, with regards to BCR-free survival. That
is, whether any significant differences were ignored as a consequence
of combining GS 9-10. However, the number of men with GS 9-10
was deemed too small for any inference to be made in this matter and
so this query was not investigated further.
All data management was carried out using SAS 9.4.
Copyright, SAS Institute Inc., Cary, NC. Assumption examination
was undertaken with SAS 9.4 and was only to be presented if and
when assumptions were found to be violated. All other statistical
analyses were performed using R 3.1.1. R Foundation for Statistical
Computing, Vienna, Austria. The study was approved by the research
ethics board at Umeå University Hospital.
14
3 Results
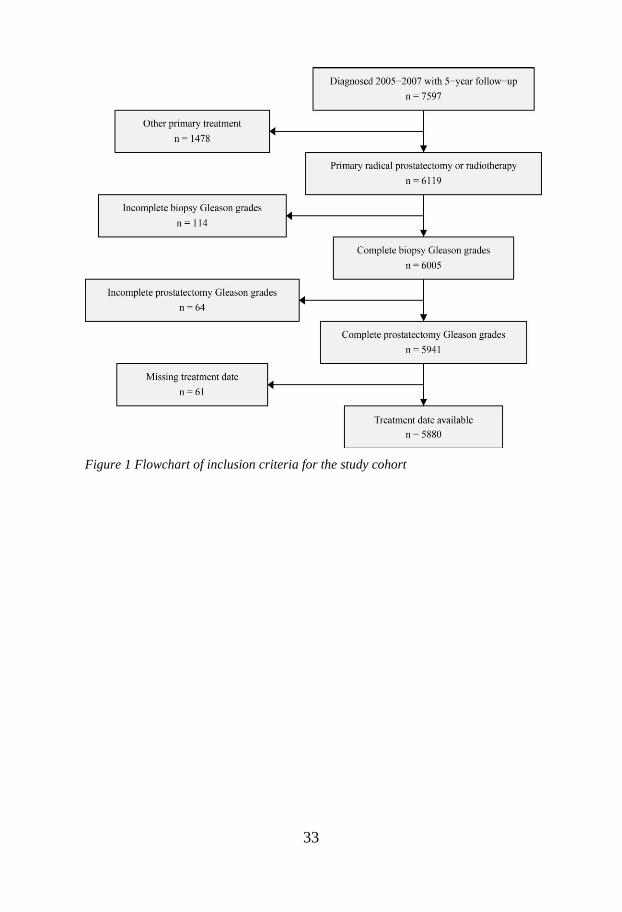
In total, 5,880 men with clinically localized PCa were
included in the study. Of these men, 4,325 (76%) men received RP
and 1,555 (24%) men received RT. Figure 1 shows a flowchart of the
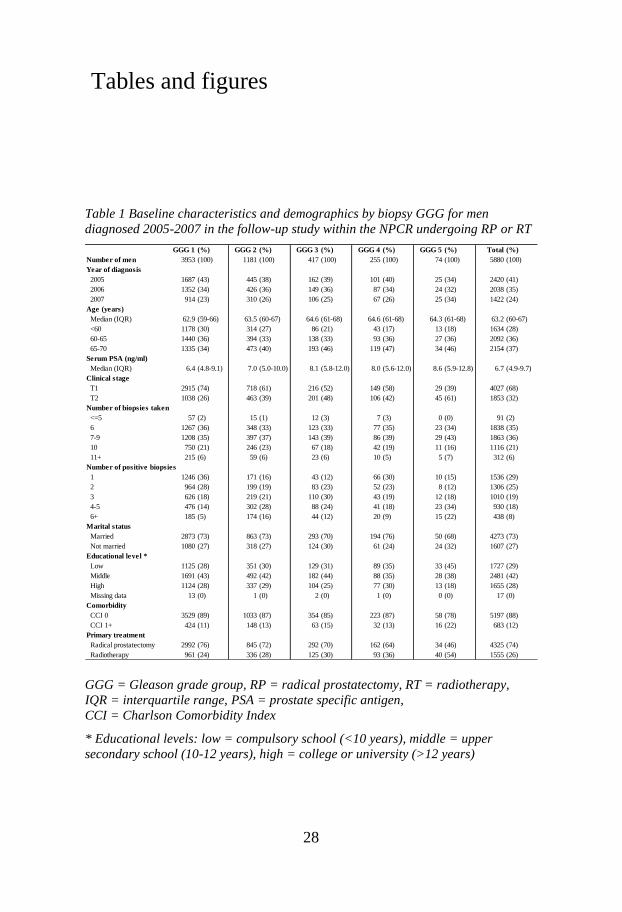
study inclusion criteria. Baseline characteristics and demographics can
be found in table 1, stratified by biopsy GGG. Men with GGG 5 were
the smallest group by far, constituting only 1% of the entire cohort.
The median follow-up time for RP and RT after treatment was
4.6 years (IQR 4.2-4.8 years) and 4.4 years (IQR 4.0-4.6 years).
As can be seen in table 1, patients with lower GGG were
younger, had lower PSA-levels and were more often clinically T1.
Men with GGG 1-3 were also more likely to undergo RP.
Furthermore, patients with lower GGG has fewer positive biopsy
cores, i.e. cores in which cancerous tissue was identified. This was
true for all groups with the exception of GGG 4. The total number of
biopsy cores taken was similar between the two treatment groups,
with a median of 8 cores and an interquartile range of 6-8 cores for
both RP and RT.
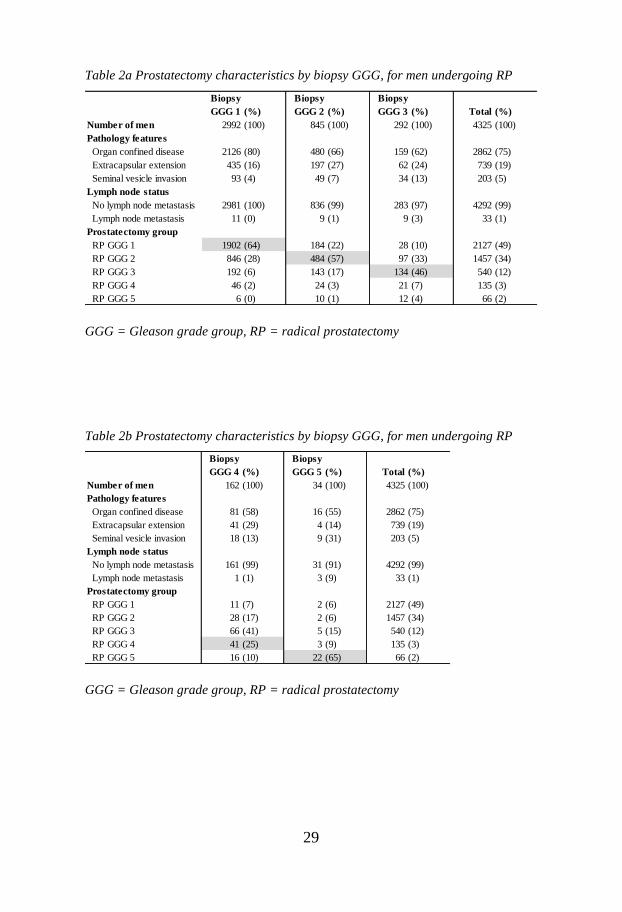
Table 2a-b shows the pathology of 4,325 men who
underwent RP. Men with lower GGG had better pathology features
(more often organ confined disease) and a higher concordance
between biopsy GGG and RP GGG. The highest concordance between
biopsy and RP GGG was observed for GGG 1 (64%) and 5 (65%),
15
whereas the lowest concordance was observed for the group with
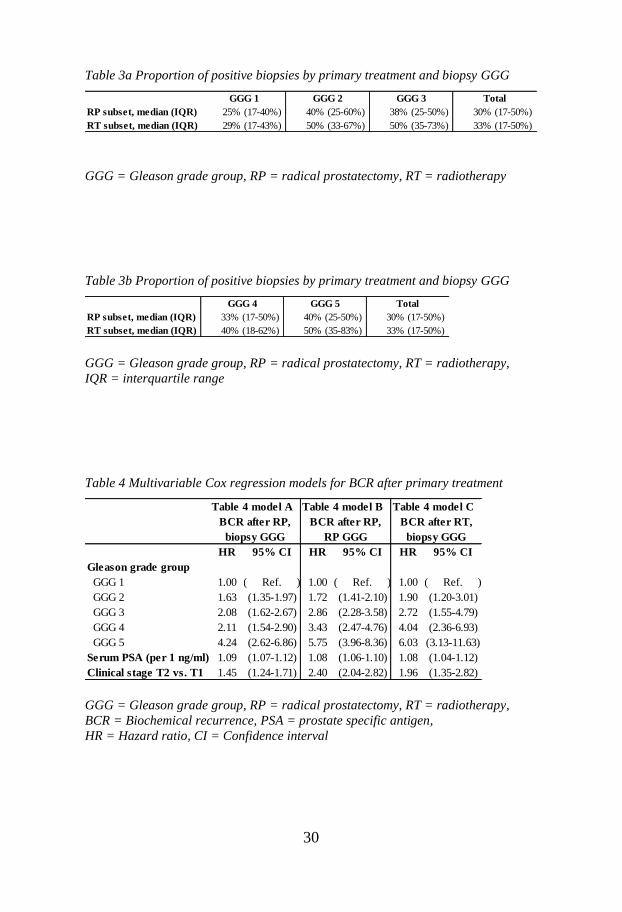
biopsy GGG 4 (25%). In table 3a-b, a trend towards a higher
proportion of positive biopsies with increasing biopsy GGG is
observed, with the exception of GGG 4.
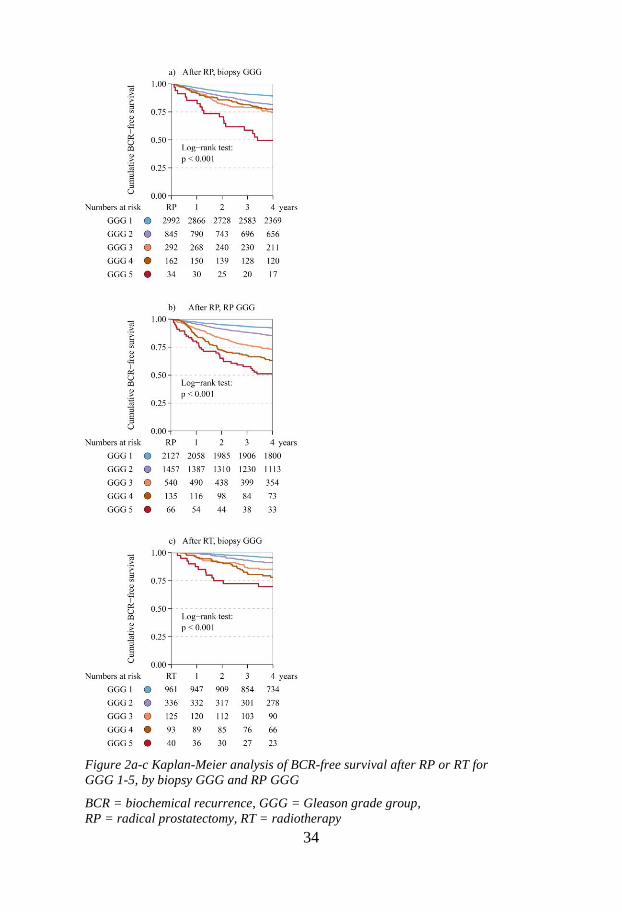
Cumulative BCR-free survival, stratified by treatment and
type of GGG, is shown in figure 2a-c. Men with biopsy GGG 5 had a
median BCR-free survival of 3.4 years after RP (figure 2a).
Follow-up time was not long enough to estimate median BCR-free
survival for any other groups. Cumulative BCR-free survival after RP
for biopsy GGG 1-5 was 89%, 82%, 74%, 77% and 49% and they
were significantly different (𝑝 < 0.001 in a log-rank test). Men who
underwent an RP with biopsy GGG 3 and 4 were the most similar in
terms of recurrence-free survival (74% and 77% respectively), as
GGG 4 actually had better 4-year BCR-free survival. The BCR-free
survival after treatment decreased with increasing GGG for all other
groups. When using RP GGG, the 4-year BCR-free survival was 92%,
85%, 73%, 63%, and 51% for GGG 1-5, significantly different
(𝑝 < 0.001) and decreasing with increasing GGG. The BCR-free
survival after RT was 95%, 91%, 85%, 78% and 70% for biopsy
GGG 1-5 respectively. The groups were found to be significantly
different (𝑝 < 0.001).
Table 4 shows the results of the multivariable Cox
regression for the outcome BCR, stratified by type of primary
treatment. Model A and B correspond to BCR after RP, whereas
model C corresponds to BCR after RT. Prior to evaluating the
estimates, an interaction term with time and outcome (BCR) was
included in each model. Since this interaction term was not found to
16
be significantly associated with BCR, no severe violation of the
proportionality assumptions was considered to be present.
Furthermore, the Arjas plot for each categorical covariate did not
indicate any deviation from the proportionality assumption (results not
shown). PSA and clinical stage were significant predictors of BCR in
all three models. Biopsy GGG 2 or higher had a significantly
increased relative risk of BCR after RP compared to biopsy GGG 1
(model A). The smallest increase was observed for biopsy GGG 2,
which still had a 63% increase in relative risk compared to biopsy
GGG 1 (HR 1.63, 95% CI 1.35-1.97). The estimates for biopsy GGG
5 (HR 4.24, 95% CI 2.62-6.86) was significantly higher than all lower
groups. For RP GGG (model B) all groups were significantly
different, when compared to each other, except for RP GGG 3 and 4.
In all three models, higher GGG was associated with a higher relative
risk of BCR.
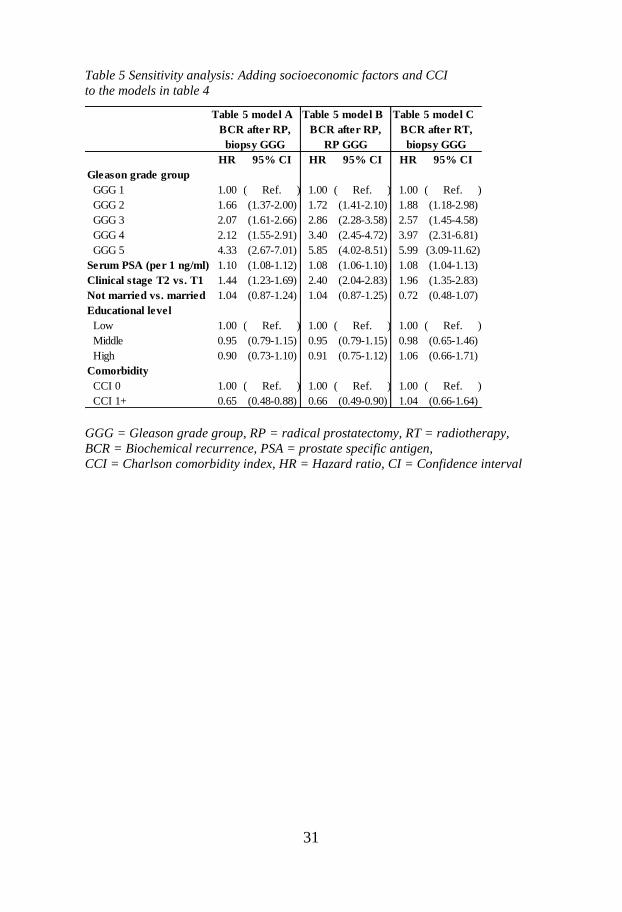
In table 5 comorbidity and socioeconomic factors, marital
status and educational level, were added to the models in table 4. Men
with high comorbidity (CCI 2+) had a significantly lower risk of BCR
after RP in the model with biopsy GGG (model A, in table 5). Marital
status and educational level were not associated with BCR in any of
the models. Even after adjusting for comorbidity and socioeconomic
status, increasing GGG was associated with higher relative risk of
BCR in all three models.
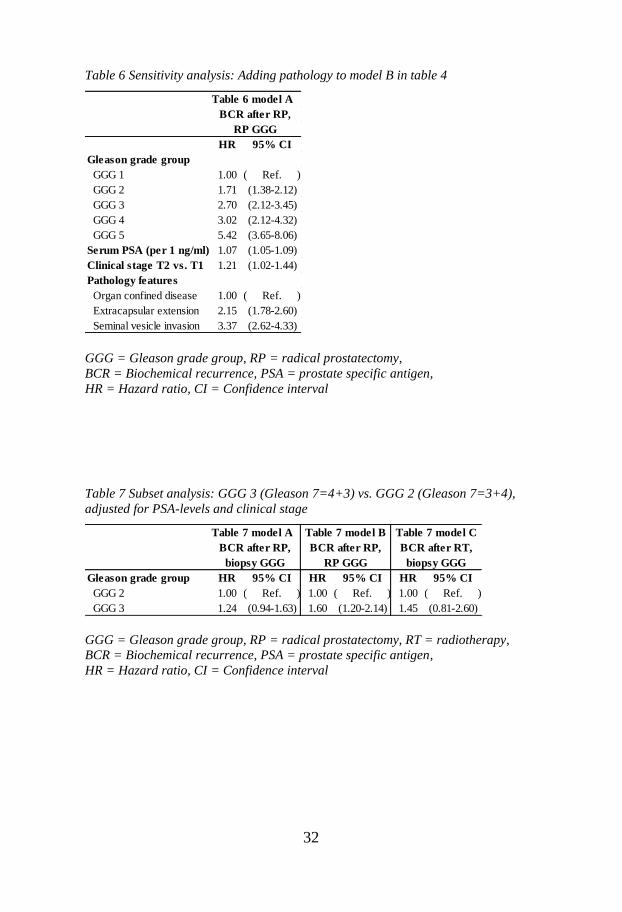
Table 6 shows the Cox model for RP GGG after RP in
table 4, with pathology features added as a covariate. Naturally, these
models were only constructed for BCR after RP, as only men who
underwent an RP have pathology features. Extracapsular extension
17
was associated with a higher relative risk of BCR, compared to having
organ confined disease (HR 2.15, 95% CI 1.78-2.60). Seminal vesicle
invasion discovered upon RP was also associated with BCR, with a
three-fold relative risk compared to men with organ confined
disease (HR 3.37, 95% CI 2.62-4.33).
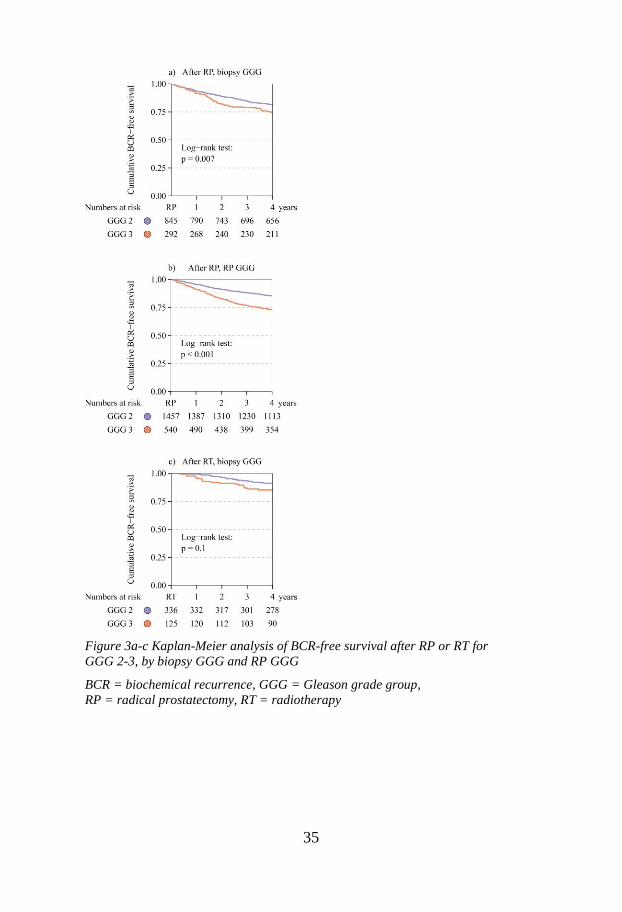
The subset analyses displayed in figure 3a-c show
BCR-free survival after RP and RT, for GGG 2 and 3 on biopsy and
RP. Men with GGG 3 had lower 4-year BCR-free survival. The
differences were significant after RP (𝑝 < 0.01 in log-rank tests) but
not after RT. Table 7 show relative risks of BCR after curative
treatment for GGG 3 vs. GGG 2, estimated with Cox regression
models adjusted for PSA-levels and clinical stage. After adjusting for
baseline factors, the increase in relative risk of BCR was only
significant for RP GGG 3 vs. 2 (HR 1.60, 95% CI 1.20-2.14).
18
4 Discussion
A higher proportion of men with clinically localized PCa
underwent radical prostatectomy (RP), compared to radiotherapy
(RT). This is not surprising and further supports earlier findings that
men with low risk tumors, part of the inclusion criteria in the
follow-up study within the NPCR, are selected for surgery [4].
The proportion of men with GGG 5, which is equivalent to GS 9-10,
in our cohort was not consistent with that of the background
population of Swedish men with clinically localized PCa diagnosed
2005-2007 [4]. This is partly due to men with lower risk features
within each of the low, intermediate and localized high risk categories
being selected for curative treatment. The main reason for this
discrepancy, however, is the limitation of PSA <20 ng/ml in the
follow-up study within the NPCR. This excludes localized high risk
patients with PSA 20-49.9 ng/ml who receive curative treatment [17].
Men with lower GGG were younger, more often clinical T1 and had
lower PSA (table 1). This is also not surprising as both clinical T
stage and PSA relate to tumor aggressiveness, as does Gleason score.
The number of positive cores found in men with GGG 4
was more similar to that of men with GGG 1. One explanation for this
may lie in the revised definitions of the Gleason grading system.
Suppose only a small amount of cancerous tissue is found in a single
biopsy and the tumor cells in this specimen have Gleason grade 4.
19
In this situation, the primary and secondary grades would both be 4
and thus the patient would receive a GS of 8=4+4. Patients with
biopsy GGG 4 were the least likely to have a corroborating grade on
prostatectomy specimen, RP GGG, in table 2a-b, further supporting
this. In fact, a majority of these patients (65%) were subsequently
downgraded, i.e. had a lower grade, in the RP specimen. This is likely
misclassification as in the example presented above, as such a
misclassification would most often be “corrected” in the more
comprehensive RP specimen. In figure 2a, a similar anomaly can be
observed. Biopsy GGG 4 has a better prognosis than biopsy GGG 3
and is actually almost as good as biopsy GGG 2. On the other
hand, BCR-free survival decreases as could be expected for
RP GGG 4 vs. 3, as these groups are admittedly more robust. This
finding supports the theory of misclassification among men with
biopsy GGG 4, or equivalently, GS 8. Even with this accounted for,
GGG 1-5 were significantly different in terms of BCR-free survival in
all three models in figure 2a-c (𝑝 < 0.001 in a log-rank test).
The most important grade group is naturally the grade
attained from the biopsy specimen, as this is available to clinician and
patient when deciding upon a treatment plan. Practically, the RP
specimen can only aid in deciding upon adjuvant or secondary
treatment. For the grouping to have prognostic value the biopsy
groups must differ in terms of survival, or in this case
BCR-free survival. This should also be true after adjusting
for confounders and other characteristics. In other words, the
grades need to be associated with prognosis, which is of vital
importance in any tumor grading system.
20
An association between increasing GGG and risk of BCR
was observed in table 4. GGG 3 and 4 are the most similar in terms of
relative risk. This is likely due to the reasons stated above as GGG 3
and GGG 4 are not as similar in model B, using RP GGG. The models
were all multivariable, i.e. the estimates are adjusted. Hence, the
estimates for GGG are to be interpreted as relative risks when the
other factors are fixed. These other factors being, for instance, PSA
and clinical stage in table 4. This is important, as all three of these
variables are used to define tumor aggressiveness in clinical practice.
After further adjustments are made for comorbidity and
socioeconomic status, GGG was still associated with BCR (table 5).
This was also the case when taking pathology features of the tumor
into account (table 6). There was no significant association between
comorbidity and BCR after RT. Mild comorbidity (CCI 1+) vs.
no comorbidity (CCI 0) was only a significant predictor of BCR after
RP. This may be an example of statistical significance without clinical
relevance. On the other hand, men with comorbidities may also be
prone to less frequent PSA testing which is needed to determine BCR.
Men with concomitant disease may have a harder time attending these
regular tests after curative treatment. This could also explain why the
relationship was only observed in the RP subset, as the definition for
BCR after RP tends to require more measurements. On the other hand,
if this was the complete explanation, a similar relationship might have
been expected between higher age and BCR as older men might have
the same difficulties. This was however not the case when time on
study was used in the Cox regression models and age was included as
a covariate (results not shown).
21
The comparisons of GGG 2 and 3 showed that GGG 3 has
worse cumulative BCR-free survival (figure 3a-c) and this was
significant after RP (𝑝 = 0.007 and 𝑝 < 0.001 for biopsy and RP
GGG respectively) but not after RT (𝑝 = 0.1). However, these
differences did not remain significant for any of the models using
biopsy GGG after adjusting for PSA-levels and clinical stage (models
A and B, in table 7).
One limitation of this study is that the follow-up study
within the NPCR focuses on low and intermediate risk tumors
(PSA <20 ng/ml). This means that for clinically localized high risk
tumors, where there is a real danger of undertreatment [17], the
prognostic value of GGG may require further studies. The proportion
of high risk PCa men with GGG 5, or equivalently GS 9-10, is
roughly four times as large in the Swedish population, without the
constraint PSA <20 ng/ml [4]. Another weakness is that all radical
surgery was grouped together, regardless of technique. The same was
done for radiation. Although RT is centralized to about a dozen
locations in Sweden, surgery is performed at over 50 hospitals [4].
There are also three techniques with which RP is performed;
retropubic, laparoscopic and robot-assisted RP. Laparoscopic RPs, due
to their inherently intricate nature and steep learning curve, are
performed at a select number of locations and constitute a minority of
all RPs. Retropubic RP was the dominating standard prior to 2005,
with robot-assisted RPs becoming increasingly popular in later years
as more and more hospitals acquire robots. Robot-assisted RP is
currently the most commonly used prostatectomy technique in
Sweden. There are also many different techniques for RT, with
22
external beam RT being most common in Sweden [4]. Furthermore,
there is no way to know with certainty if the recent ISUP 2005
guidelines had been incorporated by all urological pathologists in
Sweden by 2005. Another important drawback of this study is that
there was no central review of pathology.
The strengths of this study include the population-based
dataset with the nationwide setting. Another strength is the
comparatively large cohort, prospectively gathered data and extensive
follow-up in relation to earlier studies [20]. Furthermore, PCBaSe
originates in the NPCR, which has a completeness of 98% [22] [23]
compared to the Cancer Register to which reporting is mandated by
law. For this study, there were also complete data on comorbidity and
socioeconomic factors available in PCBaSe, which is rare for
population-based data. Finally, this study included both men
undergoing RP and RT, adding important original findings to the
research topic.
23
5 Conclusions
New prognostic Gleason grade groups were recently
proposed, in which Gleason score 6 corresponds to group 1,
Gleason 7=3+4 corresponds to group 2, Gleason 7=4+3 corresponds
to group 3, Gleason 8 corresponds to group 4 and Gleason 9-10
corresponds to group 5. This nationwide, population-based cohort
study confirms the ability of the new classification scheme to predict
biochemical recurrence after radical prostatectomy and provides the
first evidence that the newly proposed grade groups also predict
prognosis after radiotherapy.
24
References
[
1]
A. Freeman, "Prognostic Gleason grade grouping:
data based on the modified Gleason scoring system," BJU Int., pp.
691-692, May 2013.
[
2]
D. Gleason, "Classification of prostatic carcinomas,"
Cancer Chemother Rep., pp. 125-128, March 1966.
[
3]
D. F. Gleason and G. Mellinger, "Prediction of
prognosis for prostatic adenocarcinoma by combined histological
grading and clinical staging," J Urol., pp. 58-64, January 1974.
[
4]
Regionala cancercentrum i samverkan, "National
Prostate Cancer Register, annual report," September 2013.
[Online]. Available: http://npcr.se/wp-
content/uploads/2013/04/20140926-NPCR-Rapport-2013-FINAL-
ENG.pdf. [Accessed 21 March 2015].
[
5]
J. I. Epstein, "The 2005 International Society of
Urological Pathology (ISUP) Consensus Conference on Gleason
Grading of Prostatic Carcinoma," Am J Surg Pathol., vol. 29, pp.
1228-1242, September 2005.
[
6]
K. Duskova and S. Vesely, "Prostate Specific
Antigen. Current clinical application and future prospects,"
Biomedical Papers, pp. 18-26, March 2015.
[
7]
S. Edge, D. R. Byrd, C. C. Compton, A. G. Fritz, F. L.
Greene and A. Trotti, AJCC Cancer Staging Manual, Chicago:
Springer-Verlag, 2010.
[
8]
P. Stattin, E. Holmberg, J.-E. Johansson, L.
Holmberg, J. Adolfsson and J. Hugosson, "Outcomes in Localized
Prostate Cancer: National Prostate Cancer Register of Sweden
Follow-up Study," J Natl Cancer Inst, pp. 950-958, June 2010.
[
9]
J. Y. Lee, "A Competing Risk Analysis of Cancer-
Specific Mortality of Initial Treatment with Radical Prostatectomy
versus Radiation Therapy in Clinically Localized High-Risk
Prostate Cancer," Ann Surg Oncol., pp. 4026-4033, Nov 2014.
25
[
1
0]
J. R. Rider, F. Sandin, O. Andrén, P. Wiklund, J.
Hugosson and P. Stattin, "Long-term Outcomes Among
Noncuratively Treated Men According to Prostate Cancer Risk
Category in a Nationwide, Population-based Study," European
Urology, pp. 88-96, January 2013.
[
1
1]
M. E. Shukla, "Evaluation of the Current Prostate
Cancer Staging System Based on Cancer-Specific Mortality in the
Surveillance, Epidemiology, and End Results Database," Clin
Genitourin Cancer, pp. 17-21, February 2015.
[
1
2]
G. Gandaglia, P. Karakiewicz, F. Abdollah, A.
Becker, F. Roghmann, J. Sammon, S. Kim, P. Perrotte, A. Briganti,
F. Montorsi, Q. Trinh and M. Sun, "The effect of age at diagnosis
on prostate cancer mortality: A grade-for-grade and stage-for-stage
analysis," Eur J Surg Oncol., pp. 1706-1715, December 2014.
[
1
3]
D. Danneman, L. Drevin, D. Robinson, P. Stattin and
L. Egevad, "Gleason inflation 1998-2011: a registry study of
97,168 men," BJU Int, pp. 248-255, February 2015.
[
1
4]
L. Egevad, "Standardization of Gleason grading
among 337 European pathologists," Histopathology, vol. 62, pp.
247-256, January 2013.
[
1
5]
S. Loeb, F. Montorsi and J. W. Catto, "Future-
proofing Gleason Grading: What to Call Gleason 6 Prostate
Cancer?," Eur Urol., 11 March 2015.
[
1
6]
H. Carter, A. Partin, P. Walsh, B. Trock, R. Veltri, W.
Nelson, D. Coffey, E. Singer and J. Epstein, "Gleason score 6
adenocarcinoma: should it be labeled as cancer?," J Clin Oncol.,
pp. 4294-4296, 10 December 2012.
[
1
7]
O. Bratt, Y. Folkvaljon, M. Hjälm Eriksson, O. Akre,
S. Carlsson, L. Drevin, I. Franck Lissbrant, D. Makarov, S. Loeb
and P. Stattin, "Undertreatment of Men in Their Seventies with
High-risk Nonmetastatic Prostate Cancer.," Eur Urol, 2 March
2015.
[
1
8]
R. Nam, P. Cheung, S. Herschorn, R. Saskin, J. Su, L.
Klotz, M. Chang, G. Kulkarni, Y. Lee, R. Kodama and S. Narod,
"Incidence of complications other than urinary incontinence or
erectile dysfunction after radical prostatectomy or radiotherapy for
prostate cancer: a population-based cohort study," Lancet Oncol.,
pp. 223-231, 15 February 2014.
[ S. Loeb, Y. Folkvaljon, D. Makarov, O. Bratt, A. Bill-
26
1
9]
Axelson and P. Stattin, "Five-year Nationwide Follow-up Study of
Active Surveillance for Prostate Cancer," Eur Urol, pp. 233-238,
February 2015.
[
2
0]
P. M. Pierorazio, P. C. Walsh, A. W. Partin and J. I.
Epstein, "Prognostic Gleason grade grouping: data based on the
modified Gleason scoring system," BJU Int, pp. 753-760, May
2013.
[
2
1]
Regionala cancercentrum i samverkan,
"Cancercentrum," May 2015. [Online]. Available:
http://www.cancercentrum.se/Global/RCC%20Samverkan/Dokume
nt/V%C3%A5rdprogram/nyhetsbrev_NVP_PrCa_26maj2015.pdf.
[Accessed 6 June 2015].
[
2
2]
K. Tomic, A. Berglund, D. Robinson, M. Hjälm-
Eriksson, S. Carlsson, S. Lambe and P. Stattin, "Capture rate and
representativity of The National Prostate Cancer Register of
Sweden," Acta Oncol., pp. 158-163, February 2015.
[
2
3]
K. Tomic, F. Sandin, A. Wigertz, D. Robinson, M.
Lambe and P. Stattin, "Evaluation of data quality in the National
Prostate Cancer Register of Sweden," Eur Urol., pp. 101-111,
January 2015.
[
2
4]
M. Van Hemelrijck, A. Wigertz, F. Sandin, H.
Garmo, K. Hellström, P. Fransson, A. Widmark, M. Lambe, J.
Adolfsson, E. Varenhorst, J. Johansson and P. Stattin, "Cohort
Profile: the National Prostate Cancer Register of Sweden and
Prostate Cancer data Base Sweden 2.0," Int J Epidemiol., pp. 956-
967, August 2013.
[
2
5]
M. E. Charlson, P. Pompei, K. L. Ales and C. R.
MacKenzie, "A new method of classifying prognostic comorbidity
in longitudinal studies: development and validation.," J Chronic
Dis, pp. 373-383, 1987.
[
2
6]
M. Van Hemelrijck, Y. Folkvaljon, J. Adolfsson, O.
Akre, L. Holmberg, H. Garmo and P. Stattin, "Causes of death in
men with localised prostate cancer: a nationwide, population-based
study," BJU Int., 21 January 2015.
[
2
7]
K. Ahmed, B. Davis, L. Mynderse, J. Slezak, E.
Bergstralh, T. Wilson and C. Choo, "Comparison of biochemical
failure rates between permanent prostate brachytherapy and radical
retropubic prostatectomy as a function of posttherapy PSA nadir
plus ‘X’," Radiat Oncol., 29 July 2014.
27
[
2
8]
P. K. Andersen and R. D. Gill, "Cox's regression
model for counting processes, a large sample study.," Ann. Stat, pp.
1100-1120, December 1982.
[
2
9]
E. Kaplan and P. Meier, "Nonparametric estimation
from incomplete observations," J Am Stat Assoc., pp. 457-481, June
1958.
[
3
0]
N. Mantel, "Evaluation of survival data and two new
rank order statistics arising in its consideration," Cancer Chemother
Rep., pp. 163-170, 1966.
[
3
1]
D. Cox, "Regression Models and Life Tables," J R
Stat Soc., pp. 187-220, 1972.
[
3
2]
A. Thiébaut and J. Bénichou, "Choice of time-scale in
Cox's model analysis of epidemiologic cohort data: a simulation
study," Stat Med., pp. 3803-3820, 30 December 2004.
[
3
3]
E. Arjas, "A Graphical Method for Assessing
Goodness of Fit in Cox’s proportional hazards model," J Am Stat
Assoc., pp. 204-212, 1 March 1988.
28
Tables and figures
Table 1 Baseline characteristics and demographics by biopsy GGG for men
diagnosed 2005-2007 in the follow-up study within the NPCR undergoing RP or RT
GGG = Gleason grade group, RP = radical prostatectomy, RT = radiotherapy,
IQR = interquartile range, PSA = prostate specific antigen,
CCI = Charlson Comorbidity Index
* Educational levels: low = compulsory school (<10 years), middle = upper
secondary school (10-12 years), high = college or university (>12 years)
GGG 1 (%) GGG 2 (%) GGG 3 (%) GGG 4 (%) GGG 5 (%) Total (%)
Number of men 3953 (100) 1181 (100) 417 (100) 255 (100) 74 (100) 5880 (100)
Year of diagnosis
2005 1687 (43) 445 (38) 162 (39) 101 (40) 25 (34) 2420 (41)
2006 1352 (34) 426 (36) 149 (36) 87 (34) 24 (32) 2038 (35)
2007 914 (23) 310 (26) 106 (25) 67 (26) 25 (34) 1422 (24)
Age (years)
Median (IQR) 62.9 (59-66) 63.5 (60-67) 64.6 (61-68) 64.6 (61-68) 64.3 (61-68) 63.2 (60-67)
<60 1178 (30) 314 (27) 86 (21) 43 (17) 13 (18) 1634 (28)
60-65 1440 (36) 394 (33) 138 (33) 93 (36) 27 (36) 2092 (36)
65-70 1335 (34) 473 (40) 193 (46) 119 (47) 34 (46) 2154 (37)
Serum PSA (ng/ml)
Median (IQR) 6.4 (4.8-9.1) 7.0 (5.0-10.0) 8.1 (5.8-12.0) 8.0 (5.6-12.0) 8.6 (5.9-12.8) 6.7 (4.9-9.7)
Clinical stage
T1 2915 (74) 718 (61) 216 (52) 149 (58) 29 (39) 4027 (68)
T2 1038 (26) 463 (39) 201 (48) 106 (42) 45 (61) 1853 (32)
Number of biopsies taken
<=5 57 (2) 15 (1) 12 (3) 7 (3) 0 (0) 91 (2)
6 1267 (36) 348 (33) 123 (33) 77 (35) 23 (34) 1838 (35)
7-9 1208 (35) 397 (37) 143 (39) 86 (39) 29 (43) 1863 (36)
10 750 (21) 246 (23) 67 (18) 42 (19) 11 (16) 1116 (21)
11+ 215 (6) 59 (6) 23 (6) 10 (5) 5 (7) 312 (6)
Number of positive biopsies
1 1246 (36) 171 (16) 43 (12) 66 (30) 10 (15) 1536 (29)
2 964 (28) 199 (19) 83 (23) 52 (23) 8 (12) 1306 (25)
3 626 (18) 219 (21) 110 (30) 43 (19) 12 (18) 1010 (19)
4-5 476 (14) 302 (28) 88 (24) 41 (18) 23 (34) 930 (18)
6+ 185 (5) 174 (16) 44 (12) 20 (9) 15 (22) 438 (8)
Marital status
Married 2873 (73) 863 (73) 293 (70) 194 (76) 50 (68) 4273 (73)
Not married 1080 (27) 318 (27) 124 (30) 61 (24) 24 (32) 1607 (27)
Educational level *
Low 1125 (28) 351 (30) 129 (31) 89 (35) 33 (45) 1727 (29)
Middle 1691 (43) 492 (42) 182 (44) 88 (35) 28 (38) 2481 (42)
High 1124 (28) 337 (29) 104 (25) 77 (30) 13 (18) 1655 (28)
Missing data 13 (0) 1 (0) 2 (0) 1 (0) 0 (0) 17 (0)
Comorbidity
CCI 0 3529 (89) 1033 (87) 354 (85) 223 (87) 58 (78) 5197 (88)
CCI 1+ 424 (11) 148 (13) 63 (15) 32 (13) 16 (22) 683 (12)
Primary treatment
Radical prostatectomy 2992 (76) 845 (72) 292 (70) 162 (64) 34 (46) 4325 (74)
Radiotherapy 961 (24) 336 (28) 125 (30) 93 (36) 40 (54) 1555 (26)
29
Table 2a Prostatectomy characteristics by biopsy GGG, for men undergoing RP
GGG = Gleason grade group, RP = radical prostatectomy
Table 2b Prostatectomy characteristics by biopsy GGG, for men undergoing RP
GGG = Gleason grade group, RP = radical prostatectomy
Biopsy Biopsy Biopsy
GGG 1 (%) GGG 2 (%) GGG 3 (%) Total (%)
Number of men 2992 (100) 845 (100) 292 (100) 4325 (100)
Pathology features
Organ confined disease 2126 (80) 480 (66) 159 (62) 2862 (75)
Extracapsular extension 435 (16) 197 (27) 62 (24) 739 (19)
Seminal vesicle invasion 93 (4) 49 (7) 34 (13) 203 (5)
Lymph node status
No lymph node metastasis 2981 (100) 836 (99) 283 (97) 4292 (99)
Lymph node metastasis 11 (0) 9 (1) 9 (3) 33 (1)
Prostatectomy group
RP GGG 1 1902 (64) 184 (22) 28 (10) 2127 (49)
RP GGG 2 846 (28) 484 (57) 97 (33) 1457 (34)
RP GGG 3 192 (6) 143 (17) 134 (46) 540 (12)
RP GGG 4 46 (2) 24 (3) 21 (7) 135 (3)
RP GGG 5 6 (0) 10 (1) 12 (4) 66 (2)
Biopsy Biopsy
GGG 4 (%) GGG 5 (%) Total (%)
Number of men 162 (100) 34 (100) 4325 (100)
Pathology features
Organ confined disease 81 (58) 16 (55) 2862 (75)
Extracapsular extension 41 (29) 4 (14) 739 (19)
Seminal vesicle invasion 18 (13) 9 (31) 203 (5)
Lymph node status
No lymph node metastasis 161 (99) 31 (91) 4292 (99)
Lymph node metastasis 1 (1) 3 (9) 33 (1)
Prostatectomy group
RP GGG 1 11 (7) 2 (6) 2127 (49)
RP GGG 2 28 (17) 2 (6) 1457 (34)
RP GGG 3 66 (41) 5 (15) 540 (12)
RP GGG 4 41 (25) 3 (9) 135 (3)
RP GGG 5 16 (10) 22 (65) 66 (2)
30
Table 3a Proportion of positive biopsies by primary treatment and biopsy GGG
GGG = Gleason grade group, RP = radical prostatectomy, RT = radiotherapy
Table 3b Proportion of positive biopsies by primary treatment and biopsy GGG
GGG = Gleason grade group, RP = radical prostatectomy, RT = radiotherapy,
IQR = interquartile range
Table 4 Multivariable Cox regression models for BCR after primary treatment
GGG = Gleason grade group, RP = radical prostatectomy, RT = radiotherapy,
BCR = Biochemical recurrence, PSA = prostate specific antigen,
HR = Hazard ratio, CI = Confidence interval
RP subset, median (IQR) 25% (17-40%) 40% (25-60%) 38% (25-50%) 30% (17-50%)
RT subset, median (IQR) 29% (17-43%) 50% (33-67%) 50% (35-73%) 33% (17-50%)
GGG 1 GGG 2 GGG 3 Total
RP subset, median (IQR) 33% (17-50%) 40% (25-50%) 30% (17-50%)
RT subset, median (IQR) 40% (18-62%) 50% (35-83%) 33% (17-50%)
GGG 4 GGG 5 Total
HR 95% CI HR 95% CI HR 95% CI
Gleason grade group
GGG 1 1.00 ( Ref. ) 1.00 ( Ref. ) 1.00 ( Ref. )
GGG 2 1.63 (1.35-1.97) 1.72 (1.41-2.10) 1.90 (1.20-3.01)
GGG 3 2.08 (1.62-2.67) 2.86 (2.28-3.58) 2.72 (1.55-4.79)
GGG 4 2.11 (1.54-2.90) 3.43 (2.47-4.76) 4.04 (2.36-6.93)
GGG 5 4.24 (2.62-6.86) 5.75 (3.96-8.36) 6.03 (3.13-11.63)
Serum PSA (per 1 ng/ml) 1.09 (1.07-1.12) 1.08 (1.06-1.10) 1.08 (1.04-1.12)
Clinical stage T2 vs. T1 1.45 (1.24-1.71) 2.40 (2.04-2.82) 1.96 (1.35-2.82)
Table 4 model A Table 4 model B Table 4 model C
BCR after RP,
biopsy GGG biopsy GGG
BCR after RT,BCR after RP,
RP GGG
31
Table 5 Sensitivity analysis: Adding socioeconomic factors and CCI
to the models in table 4
GGG = Gleason grade group, RP = radical prostatectomy, RT = radiotherapy,
BCR = Biochemical recurrence, PSA = prostate specific antigen,
CCI = Charlson comorbidity index, HR = Hazard ratio, CI = Confidence interval
HR 95% CI HR 95% CI HR 95% CI
Gleason grade group
GGG 1 1.00 ( Ref. ) 1.00 ( Ref. ) 1.00 ( Ref. )
GGG 2 1.66 (1.37-2.00) 1.72 (1.41-2.10) 1.88 (1.18-2.98)
GGG 3 2.07 (1.61-2.66) 2.86 (2.28-3.58) 2.57 (1.45-4.58)
GGG 4 2.12 (1.55-2.91) 3.40 (2.45-4.72) 3.97 (2.31-6.81)
GGG 5 4.33 (2.67-7.01) 5.85 (4.02-8.51) 5.99 (3.09-11.62)
Serum PSA (per 1 ng/ml) 1.10 (1.08-1.12) 1.08 (1.06-1.10) 1.08 (1.04-1.13)
Clinical stage T2 vs. T1 1.44 (1.23-1.69) 2.40 (2.04-2.83) 1.96 (1.35-2.83)
Not married vs. married 1.04 (0.87-1.24) 1.04 (0.87-1.25) 0.72 (0.48-1.07)
Educational level
Low 1.00 ( Ref. ) 1.00 ( Ref. ) 1.00 ( Ref. )
Middle 0.95 (0.79-1.15) 0.95 (0.79-1.15) 0.98 (0.65-1.46)
High 0.90 (0.73-1.10) 0.91 (0.75-1.12) 1.06 (0.66-1.71)
Comorbidity
CCI 0 1.00 ( Ref. ) 1.00 ( Ref. ) 1.00 ( Ref. )
CCI 1+ 0.65 (0.48-0.88) 0.66 (0.49-0.90) 1.04 (0.66-1.64)
Table 5 model A Table 5 model B
biopsy GGG
BCR after RT,BCR after RP,
biopsy GGG
BCR after RP,
RP GGG
Table 5 model C
32
Table 6 Sensitivity analysis: Adding pathology to model B in table 4
GGG = Gleason grade group, RP = radical prostatectomy,
BCR = Biochemical recurrence, PSA = prostate specific antigen,
HR = Hazard ratio, CI = Confidence interval
Table 7 Subset analysis: GGG 3 (Gleason 7=4+3) vs. GGG 2 (Gleason 7=3+4),
adjusted for PSA-levels and clinical stage
GGG = Gleason grade group, RP = radical prostatectomy, RT = radiotherapy,
BCR = Biochemical recurrence, PSA = prostate specific antigen,
HR = Hazard ratio, CI = Confidence interval
HR 95% CI
Gleason grade group
GGG 1 1.00 ( Ref. )
GGG 2 1.71 (1.38-2.12)
GGG 3 2.70 (2.12-3.45)
GGG 4 3.02 (2.12-4.32)
GGG 5 5.42 (3.65-8.06)
Serum PSA (per 1 ng/ml) 1.07 (1.05-1.09)
Clinical stage T2 vs. T1 1.21 (1.02-1.44)
Pathology features
Organ confined disease 1.00 ( Ref. )
Extracapsular extension 2.15 (1.78-2.60)
Seminal vesicle invasion 3.37 (2.62-4.33)
BCR after RP,
RP GGG
Table 6 model A
Gleason grade group HR 95% CI HR 95% CI HR 95% CI
GGG 2 1.00 ( Ref. ) 1.00 ( Ref. ) 1.00 ( Ref. )
GGG 3 1.24 (0.94-1.63) 1.60 (1.20-2.14) 1.45 (0.81-2.60)
biopsy GGG RP GGG biopsy GGG
Table 7 model A Table 7 model B Table 7 model C
BCR after RP, BCR after RP, BCR after RT,
33
Figure 1 Flowchart of inclusion criteria for the study cohort
34
Figure 2a-c Kaplan-Meier analysis of BCR-free survival after RP or RT for
GGG 1-5, by biopsy GGG and RP GGG
BCR = biochemical recurrence, GGG = Gleason grade group,
RP = radical prostatectomy, RT = radiotherapy
35
Figure 3a-c Kaplan-Meier analysis of BCR-free survival after RP or RT for
GGG 2-3, by biopsy GGG and RP GGG
BCR = biochemical recurrence, GGG = Gleason grade group,
RP = radical prostatectomy, RT = radiotherapy