Embed Size (px)
Citation preview
ww.sciencedirect.com
i n d i a n h e a r t j o u rn a l 6 5 ( 2 0 1 3 ) 6 7 1e6 7 7
Available online at w
ScienceDirect
journal homepage: www.elsevier .com/locate/ ih j
Original Article
Prognostic significance of the distortion of terminalportion of QRS complex on admissionelectrocardiogram in ST segment elevationmyocardial infarction
Dnyaneshwar V. Mulay*, Sachin M. Mukhedkar
Department of Medicine, Government Medical College, Aurangabad 431001, Maharashtra, India
a r t i c l e i n f o
Article history:
Received 22 December 2012
Accepted 9 October 2013
Available online 1 November 2013
Keywords:
AMI
ECG changes
Prognosis
* Corresponding author. 9, Dhanwantari Nagþ91 (0) 240 2325539.
E-mail address: [email protected] (D.0019-4832/$ e see front matter Copyright ªhttp://dx.doi.org/10.1016/j.ihj.2013.10.012
a b s t r a c t
Background: ECG on admission has been used in predicting prognosis and risk stratification
in ST segment elevation acute myocardial infarction (STEMI).
Objective: To analyze the admission ECG in STEMI based on abnormality observed in ter-
minal portion of QRS and its correlation to hospital mortality.
Method: 160 consecutive patients of STEMI were classified into subjects without (Group I)
and with distortion of terminal QRS (Group II), Pattern A e Emergence of J point at �50% of
the R wave amplitude in leads with qR configuration or Pattern B e Absence of the S waves,
in leads with Rs configuration in two consecutive leads.
Results: Out of 160 patients of STEMI, 69 (43.1%) had distortion of QRS. There were 13 deaths
(8.1%). Hospital mortality was found to be significantly more in subjects with distortion than
those without (15.9% V/S 2.1%, p < 0.001). Patients with QRS distortion tended to have larger
infarction as assessed by Killip class on admission (p < 0.05), anterior location of MI (p < 0.01)
and presence of significant Q waves in leads with ST segment elevation (p < 0.0001).
With multiple logistic regression analysis using hospital mortality as a dependent
variable and all studied risk factors as independent variables, QRS distortion on admission
ECG was the only variable found to be statistically significant (Adjusted OR ¼ 7.161,
p < 0.05).
Conclusion: ECG on admission is a simple, cheap, universally available investigation that
can predict the short term prognosis in STEMI and would help in deciding which patients
should go for other myocardial revascularization procedures.
Copyright ª 2013, Cardiological Society of India. All rights reserved.
1. Introduction
Early risk stratification of patients presenting with STEMI is
commonly done using various risk scores based primarily on
ar, Opp. Kohinoor Garden
V. Mulay).2013, Cardiological Societ
the clinical presentation and evidence of left ventricular fail-
ure. Risk assessment needs to be done shortly after admis-
sion, when only the history, physical examination and the
ECG are available.1 The role of ECG in diagnosis and
, New Osmanpura, Aurangabad 431005, Maharashtra, India. Tel.:
y of India. All rights reserved.
i n d i a n h e a r t j o u r n a l 6 5 ( 2 0 1 3 ) 6 7 1e6 7 7672
prognostication of AMI is well established.2 In the early 1970s,
it was found by epicardial and precordial mapping that the
magnitude of ST segment elevation is a reflection of the extent
of myocardial injury.3e6 As a result, ST segment elevation was
used to define subsets of patients who can benefit most from
early thrombolysis2,7,8 and even monitor the effects of reper-
fusion therapy.9e11 However, the magnitude of ST elevation is
influenced not only by the extent and severity of the ischemia,
but also by variation of the shape and size of the chest and by
localization of infarction.12 Birnbaum et al.13,14 observed that,
on admission ECG distortion of the terminal portion of the
QRS complex was associated with larger infarct size and
increased mortality.
The purpose of this study was to analyze admission ECG in
patients of STEMI based on terminal portion of QRS and its
correlation to hospital mortality.
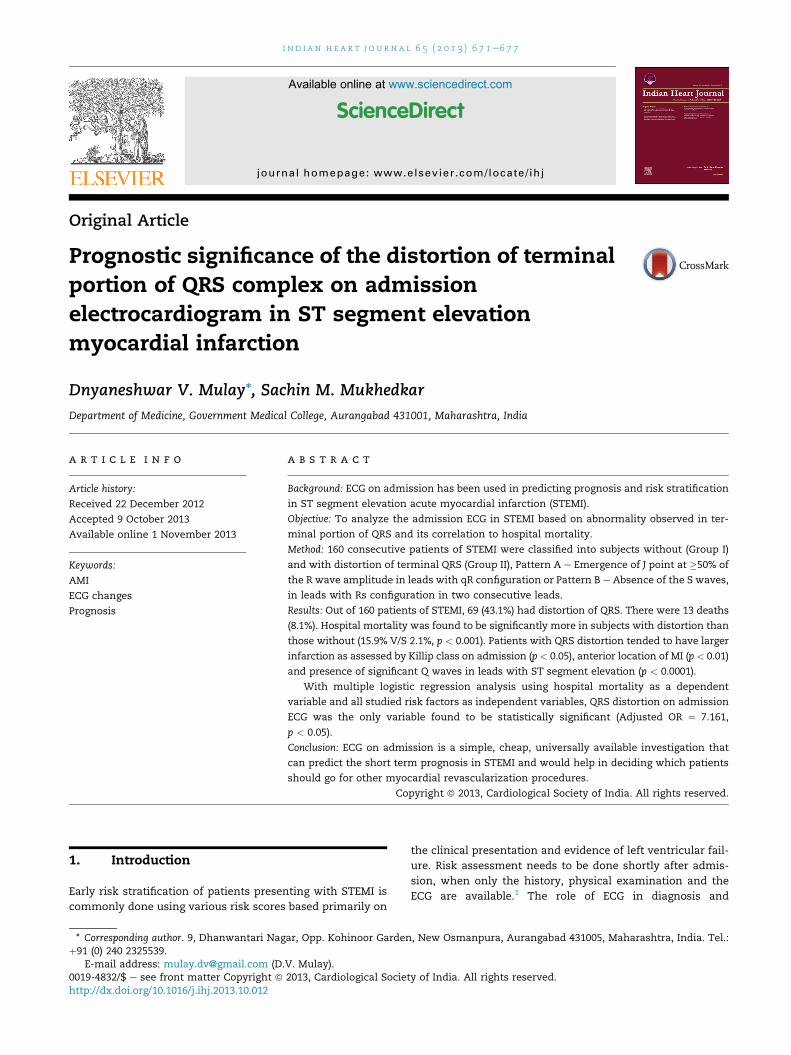
Fig. 1 e Group I: No QRS distortion. J point emerges below
50% of the R wave amplitude. Group II: Terminal QRS
distortion. Pattern A e emergence of J point ‡50% of the R
wave amplitude in lead with qR configuration or Pattern
B e absence of the S wave in lead with Rs configuration.
2. Methods
In this prospective study, we studied 160 consecutive patients
of STEMI eligible for thrombolysis, admitted in intensive cor-
onary care unit within 12 h of onset of chest pain which lasted
for at least 20 min. STEMI was diagnosed when ECG showed
ST elevation of 0.1 mv in two or more limb leads or 0.2 mv in
two or more consecutive chest leads with positive T waves in
leads with ST segment elevation with increase in cardiac en-
zymes. Patients with left bundle branch block (LBBB), ven-
tricular rhythm, ventricular pacing or negative T waves in
leads demonstrating ST segment elevation were excluded.14
Clinical assessment was done and various risk factors were
noted. All patients received streptokinase 1.5 million units
infusion over a period of 1 h and standard medications like
beta blockers, ACEI/ARBS, statins and antiplatelets as per the
discretion of the treating physician. Time from onset of chest
pain and administration of thrombolytic therapy was recor-
ded. The use of medications was not analyzed.
2.1. Electrocardiographic evaluation
All admission ECGs were analyzed by three experienced
physicians. In case of uncertain ECG classification, two other
physicians were consulted. The investigators analyzing ECGs
were blinded to clinical data of the patient. The number of
leads in the admission ECG with ST segment elevation and
the presence of abnormal Q wave in leads showing ST
elevation were recorded. The site of infarction was deter-
mined. Abnormal Q waves were defined as follows8,14: 1) a Q
wave >25% of the R wave or with a width 0.04 s in limb leads,
2) a QR complex in lead V1 (an isolated QS complex in lead V1
was considered), 3) any Qwave in lead V2 or V3, 4) a Q wave in
lead V4 with a duration 0.02 s and 0.1mv or deeper than the Q
wave in lead V5, 5) a Q wave in lead V5 or V6 25% of the R wave
with a duration of 0.04 s. The patients were classified into
two electrocardiographic patterns based on terminal portion
of the QRSeST pattern.14 Group Ie Those with tall symmetric
T waves and ST elevation in two or more adjacent leads
without major changes in the configuration of the terminal
portion of the QRS complex. Group II e Those with tall
symmetric T waves and ST elevation and distortion of the
terminal portion of the QRS complex in two or more
consecutive leads. Pattern A e Emergence of the J point at a
level above the lower half of the R wave (at �50% of the R
wave amplitude as measured from isoelectric line) in
leads with qR configuration. Pattern B e Absence of S waves
in leads with Rs configuration (leads without Q waves)
(Fig. 1).
2.2. Endpoint
Hospital mortality was recorded in the two groups.
2.3. Statistical analysis
The data was recorded and analyzed using statistical package
for social sciences (SPSS) version 12. Mean values � SE were
calculated for continuous variables and absolute and relative
frequencies were measured for discrete variables. For
continuous variables difference between groupswas analyzed
for statistical significance by two-tailed student’s ‘t’ test. The
chi-square test was used to compare difference between
discrete variables. Logistic regression analysis included hos-
pital mortality as the dependent variable and age, gender,
history of diabetes mellitus, hypertension, prior coronary ar-
tery disease, smoking status, time from onset of symptoms to
thrombolytic therapy, heart rate, Killip class on admission,
location of AMI, number of leads with ST segment elevation,
presence of Q waves on admission and initial QRS pattern on
ECG as dependent variables. Odds ratio (OR) and 95% confi-
dence intervals (CI) were calculated. A p value <0.05 was
considered statistically significant.
3. Results
Out of 160 patients of STEMI studied 123 (76.7%) were males
and 37 (23.3%) were females with an M:F ratio of 3.3:1. Age of
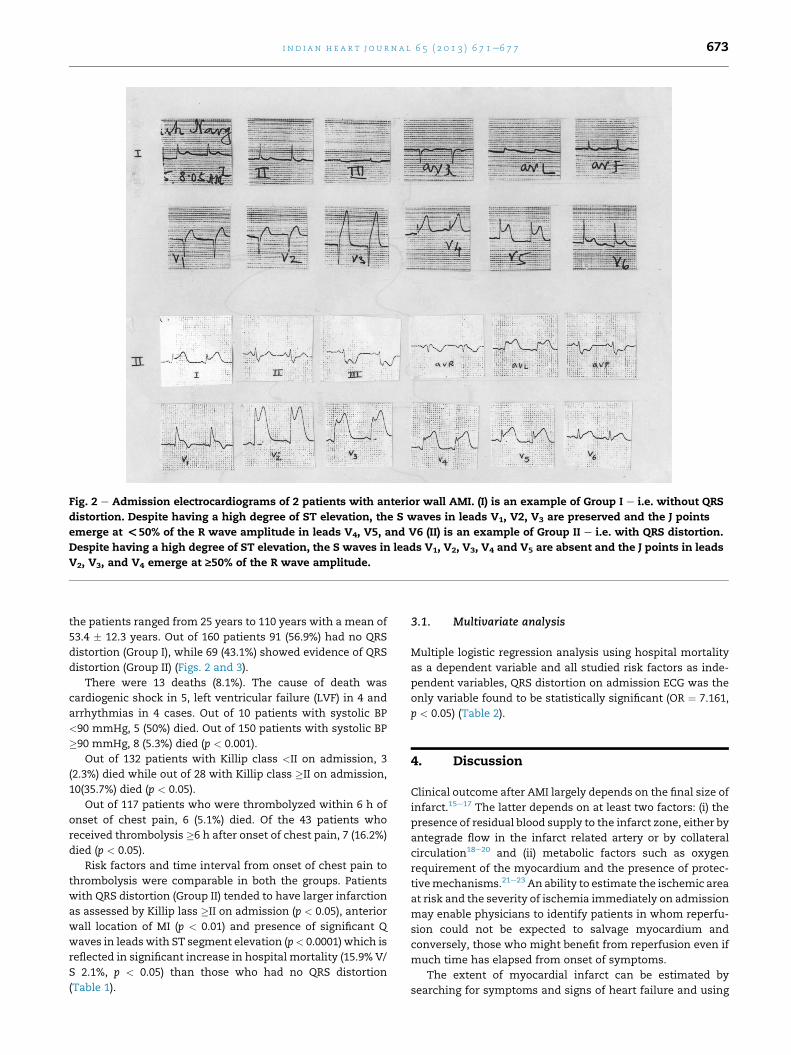
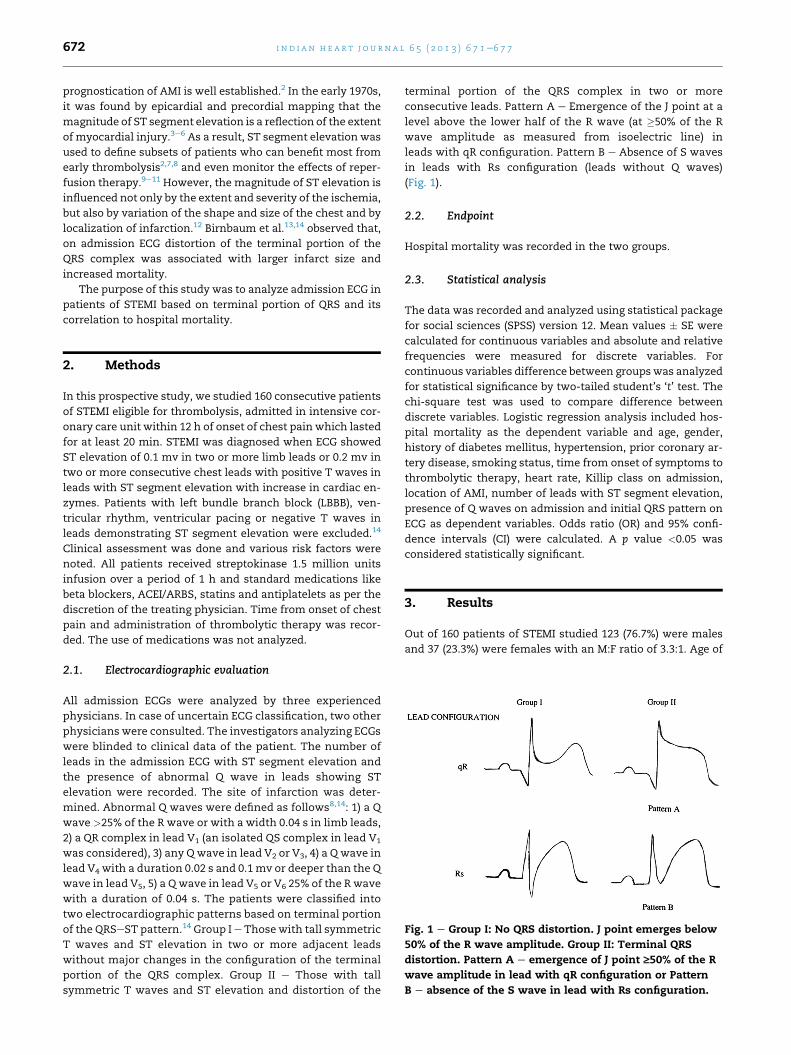
Fig. 2 e Admission electrocardiograms of 2 patients with anterior wall AMI. (I) is an example of Group I e i.e. without QRS
distortion. Despite having a high degree of ST elevation, the S waves in leads V1, V2, V3 are preserved and the J points
emerge at <50% of the R wave amplitude in leads V4, V5, and V6 (II) is an example of Group II e i.e. with QRS distortion.
Despite having a high degree of ST elevation, the S waves in leads V1, V2, V3, V4 and V5 are absent and the J points in leads
V2, V3, and V4 emerge at ‡50% of the R wave amplitude.
i n d i a n h e a r t j o u rn a l 6 5 ( 2 0 1 3 ) 6 7 1e6 7 7 673
the patients ranged from 25 years to 110 years with a mean of
53.4 � 12.3 years. Out of 160 patients 91 (56.9%) had no QRS
distortion (Group I), while 69 (43.1%) showed evidence of QRS
distortion (Group II) (Figs. 2 and 3).
There were 13 deaths (8.1%). The cause of death was
cardiogenic shock in 5, left ventricular failure (LVF) in 4 and
arrhythmias in 4 cases. Out of 10 patients with systolic BP
<90 mmHg, 5 (50%) died. Out of 150 patients with systolic BP
�90 mmHg, 8 (5.3%) died (p < 0.001).
Out of 132 patients with Killip class <II on admission, 3
(2.3%) died while out of 28 with Killip class �II on admission,
10(35.7%) died (p < 0.05).
Out of 117 patients who were thrombolyzed within 6 h of
onset of chest pain, 6 (5.1%) died. Of the 43 patients who
received thrombolysis �6 h after onset of chest pain, 7 (16.2%)
died (p < 0.05).
Risk factors and time interval from onset of chest pain to
thrombolysis were comparable in both the groups. Patients
with QRS distortion (Group II) tended to have larger infarction
as assessed by Killip lass �II on admission (p < 0.05), anterior
wall location of MI (p < 0.01) and presence of significant Q
waves in leads with ST segment elevation (p< 0.0001) which is
reflected in significant increase in hospital mortality (15.9% V/
S 2.1%, p < 0.05) than those who had no QRS distortion
(Table 1).
3.1. Multivariate analysis
Multiple logistic regression analysis using hospital mortality
as a dependent variable and all studied risk factors as inde-
pendent variables, QRS distortion on admission ECG was the
only variable found to be statistically significant (OR ¼ 7.161,
p < 0.05) (Table 2).
4. Discussion
Clinical outcome after AMI largely depends on the final size of
infarct.15e17 The latter depends on at least two factors: (i) the
presence of residual blood supply to the infarct zone, either by
antegrade flow in the infarct related artery or by collateral
circulation18e20 and (ii) metabolic factors such as oxygen
requirement of the myocardium and the presence of protec-
tivemechanisms.21e23 An ability to estimate the ischemic area
at risk and the severity of ischemia immediately on admission
may enable physicians to identify patients in whom reperfu-
sion could not be expected to salvage myocardium and
conversely, those who might benefit from reperfusion even if
much time has elapsed from onset of symptoms.
The extent of myocardial infarct can be estimated by
searching for symptoms and signs of heart failure and using
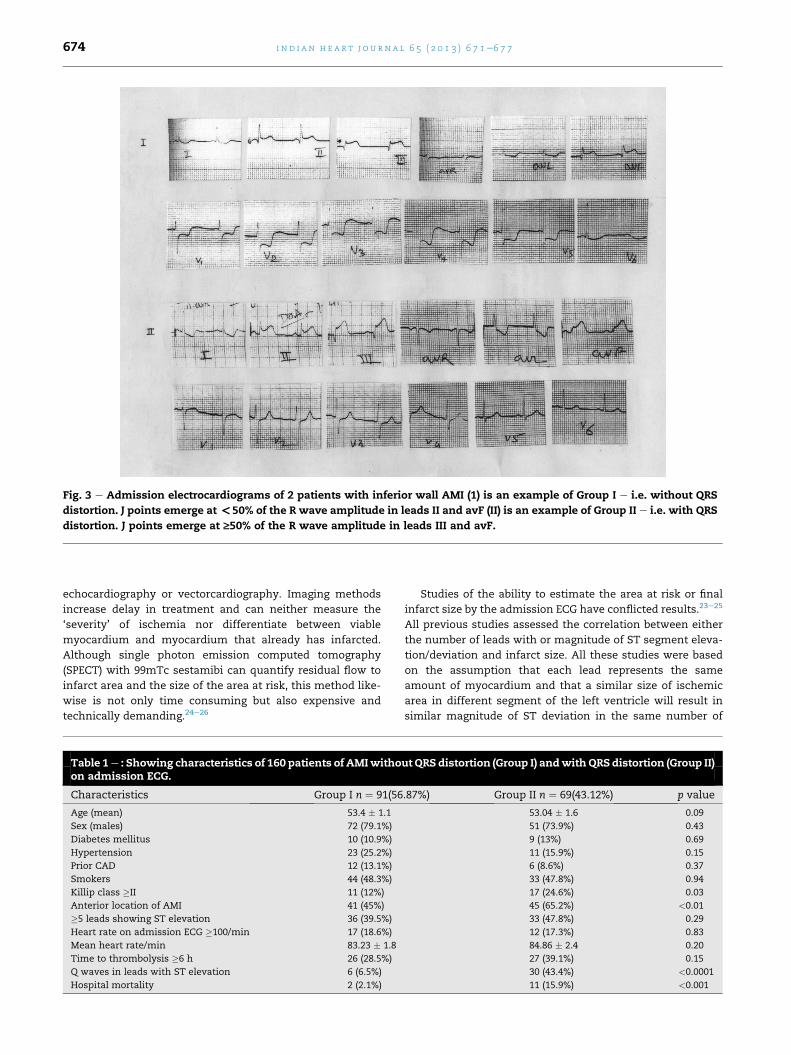
Fig. 3 e Admission electrocardiograms of 2 patients with inferior wall AMI (1) is an example of Group I e i.e. without QRS
distortion. J points emerge at <50% of the R wave amplitude in leads II and avF (II) is an example of Group II e i.e. with QRS
distortion. J points emerge at ‡50% of the R wave amplitude in leads III and avF.
i n d i a n h e a r t j o u r n a l 6 5 ( 2 0 1 3 ) 6 7 1e6 7 7674
echocardiography or vectorcardiography. Imaging methods
increase delay in treatment and can neither measure the
‘severity’ of ischemia nor differentiate between viable
myocardium and myocardium that already has infarcted.
Although single photon emission computed tomography
(SPECT) with 99mTc sestamibi can quantify residual flow to
infarct area and the size of the area at risk, this method like-
wise is not only time consuming but also expensive and
technically demanding.24e26
Table 1e : Showing characteristics of 160 patients of AMIwithoon admission ECG.
Characteristics Group I n ¼ 91(56
Age (mean) 53.4 � 1.1
Sex (males) 72 (79.1%)
Diabetes mellitus 10 (10.9%)
Hypertension 23 (25.2%)
Prior CAD 12 (13.1%)
Smokers 44 (48.3%)
Killip class �II 11 (12%)
Anterior location of AMI 41 (45%)
�5 leads showing ST elevation 36 (39.5%)
Heart rate on admission ECG �100/min 17 (18.6%)
Mean heart rate/min 83.23 � 1.8
Time to thrombolysis �6 h 26 (28.5%)
Q waves in leads with ST elevation 6 (6.5%)
Hospital mortality 2 (2.1%)
Studies of the ability to estimate the area at risk or final
infarct size by the admission ECG have conflicted results.23e25
All previous studies assessed the correlation between either
the number of leads with or magnitude of ST segment eleva-
tion/deviation and infarct size. All these studies were based
on the assumption that each lead represents the same
amount of myocardium and that a similar size of ischemic
area in different segment of the left ventricle will result in
similar magnitude of ST deviation in the same number of
ut QRS distortion (Group I) andwithQRS distortion (Group II)
.87%) Group II n ¼ 69(43.12%) p value
53.04 � 1.6 0.09
51 (73.9%) 0.43
9 (13%) 0.69
11 (15.9%) 0.15
6 (8.6%) 0.37
33 (47.8%) 0.94
17 (24.6%) 0.03
45 (65.2%) <0.01
33 (47.8%) 0.29
12 (17.3%) 0.83
84.86 � 2.4 0.20
27 (39.1%) 0.15
30 (43.4%) <0.0001
11 (15.9%) <0.001
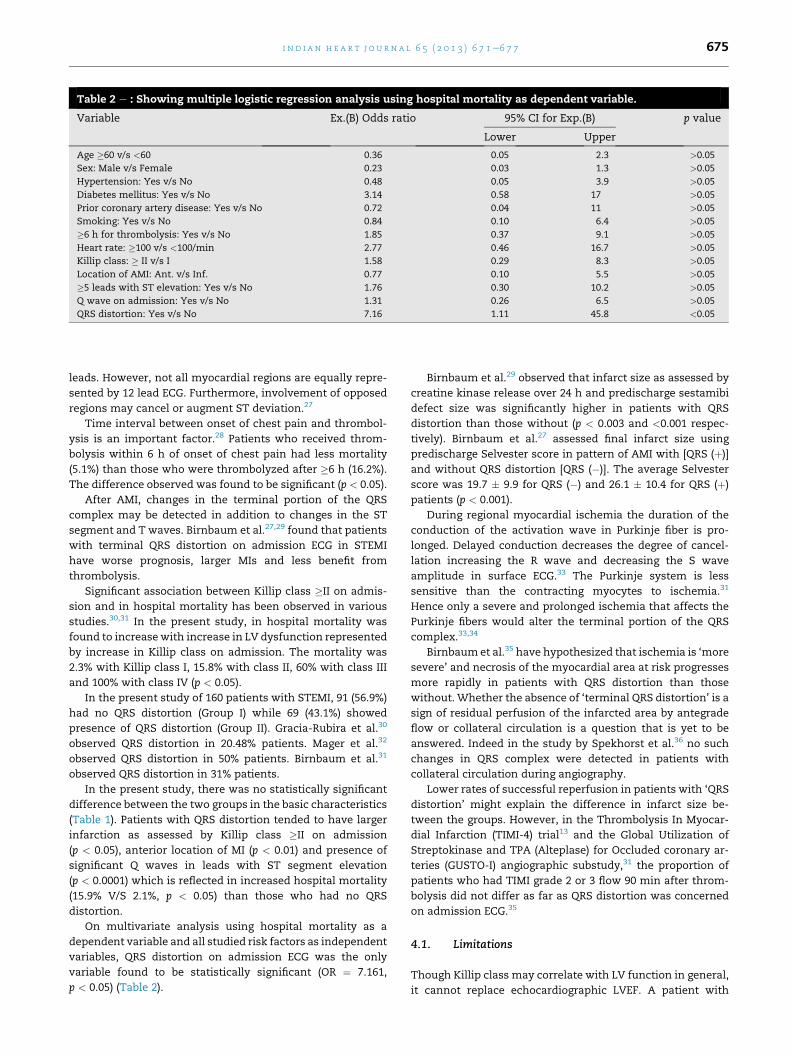
Table 2 e : Showing multiple logistic regression analysis using hospital mortality as dependent variable.
Variable Ex.(B) Odds ratio 95% CI for Exp.(B) p value
Lower Upper
Age �60 v/s <60 0.36 0.05 2.3 >0.05
Sex: Male v/s Female 0.23 0.03 1.3 >0.05
Hypertension: Yes v/s No 0.48 0.05 3.9 >0.05
Diabetes mellitus: Yes v/s No 3.14 0.58 17 >0.05
Prior coronary artery disease: Yes v/s No 0.72 0.04 11 >0.05
Smoking: Yes v/s No 0.84 0.10 6.4 >0.05
�6 h for thrombolysis: Yes v/s No 1.85 0.37 9.1 >0.05
Heart rate: �100 v/s <100/min 2.77 0.46 16.7 >0.05
Killip class: � II v/s I 1.58 0.29 8.3 >0.05
Location of AMI: Ant. v/s Inf. 0.77 0.10 5.5 >0.05
�5 leads with ST elevation: Yes v/s No 1.76 0.30 10.2 >0.05
Q wave on admission: Yes v/s No 1.31 0.26 6.5 >0.05
QRS distortion: Yes v/s No 7.16 1.11 45.8 <0.05
i n d i a n h e a r t j o u rn a l 6 5 ( 2 0 1 3 ) 6 7 1e6 7 7 675
leads. However, not all myocardial regions are equally repre-
sented by 12 lead ECG. Furthermore, involvement of opposed
regions may cancel or augment ST deviation.27
Time interval between onset of chest pain and thrombol-
ysis is an important factor.28 Patients who received throm-
bolysis within 6 h of onset of chest pain had less mortality
(5.1%) than those who were thrombolyzed after �6 h (16.2%).
The difference observed was found to be significant (p < 0.05).
After AMI, changes in the terminal portion of the QRS
complex may be detected in addition to changes in the ST
segment and T waves. Birnbaum et al.27,29 found that patients
with terminal QRS distortion on admission ECG in STEMI
have worse prognosis, larger MIs and less benefit from
thrombolysis.
Significant association between Killip class �II on admis-
sion and in hospital mortality has been observed in various
studies.30,31 In the present study, in hospital mortality was
found to increasewith increase in LV dysfunction represented
by increase in Killip class on admission. The mortality was
2.3% with Killip class I, 15.8% with class II, 60% with class III
and 100% with class IV (p < 0.05).
In the present study of 160 patients with STEMI, 91 (56.9%)
had no QRS distortion (Group I) while 69 (43.1%) showed
presence of QRS distortion (Group II). Gracia-Rubira et al.30
observed QRS distortion in 20.48% patients. Mager et al.32
observed QRS distortion in 50% patients. Birnbaum et al.31
observed QRS distortion in 31% patients.
In the present study, there was no statistically significant
difference between the two groups in the basic characteristics
(Table 1). Patients with QRS distortion tended to have larger
infarction as assessed by Killip class �II on admission
(p < 0.05), anterior location of MI (p < 0.01) and presence of
significant Q waves in leads with ST segment elevation
(p < 0.0001) which is reflected in increased hospital mortality
(15.9% V/S 2.1%, p < 0.05) than those who had no QRS
distortion.
On multivariate analysis using hospital mortality as a
dependent variable and all studied risk factors as independent
variables, QRS distortion on admission ECG was the only
variable found to be statistically significant (OR ¼ 7.161,
p < 0.05) (Table 2).
Birnbaum et al.29 observed that infarct size as assessed by
creatine kinase release over 24 h and predischarge sestamibi
defect size was significantly higher in patients with QRS
distortion than those without (p < 0.003 and <0.001 respec-
tively). Birnbaum et al.27 assessed final infarct size using
predischarge Selvester score in pattern of AMI with [QRS (þ)]
and without QRS distortion [QRS (�)]. The average Selvester
score was 19.7 � 9.9 for QRS (�) and 26.1 � 10.4 for QRS (þ)
patients (p < 0.001).
During regional myocardial ischemia the duration of the
conduction of the activation wave in Purkinje fiber is pro-
longed. Delayed conduction decreases the degree of cancel-
lation increasing the R wave and decreasing the S wave
amplitude in surface ECG.33 The Purkinje system is less
sensitive than the contracting myocytes to ischemia.31
Hence only a severe and prolonged ischemia that affects the
Purkinje fibers would alter the terminal portion of the QRS
complex.33,34
Birnbaumet al.35 have hypothesized that ischemia is ‘more
severe’ and necrosis of the myocardial area at risk progresses
more rapidly in patients with QRS distortion than those
without. Whether the absence of ‘terminal QRS distortion’ is a
sign of residual perfusion of the infarcted area by antegrade
flow or collateral circulation is a question that is yet to be
answered. Indeed in the study by Spekhorst et al.36 no such
changes in QRS complex were detected in patients with
collateral circulation during angiography.
Lower rates of successful reperfusion in patients with ‘QRS
distortion’ might explain the difference in infarct size be-
tween the groups. However, in the Thrombolysis In Myocar-
dial Infarction (TIMI-4) trial13 and the Global Utilization of
Streptokinase and TPA (Alteplase) for Occluded coronary ar-
teries (GUSTO-I) angiographic substudy,31 the proportion of
patients who had TIMI grade 2 or 3 flow 90 min after throm-
bolysis did not differ as far as QRS distortion was concerned
on admission ECG.35
4.1. Limitations
Though Killip class may correlate with LV function in general,
it cannot replace echocardiographic LVEF. A patient with
i n d i a n h e a r t j o u r n a l 6 5 ( 2 0 1 3 ) 6 7 1e6 7 7676
STEMI with large infarct may present with low systolic BP due
to forward failure and still no pulmonary congestion and a low
Killip class. Due to non-availability of round the clock exper-
tise services for echocardiographic evaluation, LV function
assessment was based on clinical assessment.
5. Conclusion
ECG on admission in STEMI is a simple, cheap, universally
available investigation which can predict short term prog-
nosis and would help in deciding which patients should go for
myocardial revascularization procedures to higher centers
after initial stabilization. Further study with large number of
patients is advocated to ascertain this assumption.
Conflicts of interest
All authors have none to declare.
r e f e r e n c e s
1. Birnbaum Y, Sclarovsky S, Blum A, Mager A, Gabbay U.Prognostic significance of the initial electrocardiographicpattern in a first acute anterior wall myocardial infarction.Chest. 1993;103:1681e1687.
2. Bren GB, Wasserman AG, Ross AM. The electrocardiogram inpatients undergoing thrombolysis for myocardial infarction.Circulation. 1987;76:II18eII24.
3. Maroko PR, Libby P, Covell JW, Sobel BE, Ross Jr J, Braunwald E.Precordial S-T segment elevation mapping: an atraumaticmethod for assessing alterations in the extent of myocardialischemic injury. The effects of pharmacologic andhemodynamic interventions. Am J Cardiol. 1972;29:223e230.
4. Muller JE, Maroko PR, Braunwald E. Evaluation of precordialelectrocardiographic mapping as a means of assessingchanges in myocardial ischemic injury. Circulation.1975;52:16e27.
5. Madias JE, Venkataraman K, Hodd Jr WB. Precordial ST-segment mapping 1. Clinical studies in the coronary care unit.Circulation. 1975;52:799e809.
6. Muller JE, Maroko PR, Braunwald E. Precordialelectrocardiographic mapping. A technique to assess theefficacy of interventions designed to limit infarct size.Circulation. 1978;57:1e18.
7. Vermeer F, Simoons ML, Bar FW, et al. Which patients benefitmost from early thrombolytic therapy with intracoronarystreptokinase? Circulation. 1986;74:1379e1389.
8. Bar FW, Vermeer F, de Zwaan C, et al. Value of admissionelectrocardiogram in predicting outcome of thrombolytictherapy in acute myocardial infarction. A randomized trialconducted by The Netherlands Interuniversity CardiologyInstitute. Am J Cardiol. 1987;59:6e13.
9. Aldrich HR, Wagner NB, Boswick J, et al. Use of initialST-segment deviation for prediction of finalelectrocardiographic size of acute myocardial infarcts. Am JCardiol. 1988;61:749e753.
10. Krucoff MW, Green CE, Satler LF, et al. Noninvasive detectionof coronary artery patency using continuous ST-segmentmonitoring. Am J Cardiol. 1986;57:916e922.
11. Clemmensen P, Ohman EM, Sevilla DC, et al. Changes instandard electrocardiographic ST-segment elevationpredictive of successful reperfusion in acute myocardialinfarction. Am J Cardiol. 1990;66:1407e1411.
12. Yusuf S, Lopez R, Maddison A, et al. Value ofelectrocardiogram in predicting and estimating infarct size inman. Br Heart J. 1979;42:286e293.
13. Birnbaum Y, Kloner RA, Sclarovsky S, et al. Distortion of theterminal portion of the QRS on the admissionelectrocardiogram in acute myocardial infarction andcorrelation with infarct size and long-term prognosis(Thrombolysis in Myocardial Infarction 4 Trial). Am J Cardiol.1996;78:396e403.
14. Birnbaum Y, Herz I, Sclarovsky S, et al. Prognostic significanceof the admission electrocardiogram in acute myocardialinfarction. J Am Coll Cardiol. 1996;27:1128e1132.
15. White HD, Norris RM, Brown MA, et al. Left ventricularend-systolic volume as the major determinant of survivalafter recovery from myocardial infarction. Circulation.1987;76:44e51.
16. Sheehan FH, Mathey DG, Schofer J, et al. Effect ofinterventions in salvaging left ventricular function in acutemyocardial infarction: a study of intracoronary streptokinase.Am J Cardiol. 1983;52:431e438.
17. Hamer AW, Takayama M, Abraham KA, et al. End-systolicvolume and long-term survival after coronary artery bypassgraft surgery in patients with impaired left ventricularfunction. Circulation. 1994;90:2899e2904.
18. Reimer KA, Jennings RB, Cobb FR, et al. Animal models forprotecting ischemic myocardium: results of the NHLBICooperative Study. Comparison of unconscious andconscious dog models. Circ Res. 1985;56:651e665.
19. Christian TF, Schwartz RS, Gibbons RJ. Determinants ofinfarct size in reperfusion therapy for acute myocardialinfarction. Circulation. 1992;86:81e90.
20. Milavetz JJ, Giebel DW, Christian TF, Schwartz RS,Holmes Jr DR, Gibbons RJ. Time to therapy and salvage inmyocardial infarction. J Am Coll Cardiol. 1998;31:1246e1251.
21. Ottani F, Galvani M, Ferrini D, et al. Prodromal angina limitsinfarct size. A role for ischemic preconditioning. Circulation.1995;91:291e297.
22. Kloner RA, Yellon D. Does ischemic preconditioning occur inpatients? J Am Coll Cardiol. 1994;24:1133e1142.
23. Birnbaum Y, Sclarovsky S, Herz I, et al. Admission clinical andelectrocardiographic characteristics predicting in hospitaldevelopment of high-degree atrioventricular block in inferiorwall acute myocardial infarction. Am J Cardiol.1997;80:1134e1138.
24. Clements IP, Christian TF, Higano ST, Gibbons EU, Gersh BI.Residual flow to the infarct zone as a determinant of infarctsize after direct angioplasty. Circulation. 1993;88:1527e1533.
25. Christian TF, Gibbons RJ, Clements IP, Berger PB, Selvester RH,Wagner GS. Estimates of myocardium at risk and collateralflow in acute myocardial infarction usingelectrocardiographic indexes with comparison toradionuclide and angiographic measures. J Am Coll Cardiol.1995;26:388e393.
26. Bruce CJ, Christian TF, Schaer GL, et al. Determinants ofinfarct size after thrombolytic treatment in acute myocardialinfarction. Am J Cardiol. 1999;83:1600e1605.
27. Birnbaum Y, Maynard C, Wolfe S, et al. Terminal QRSdistortion on admission is better than ST segmentmeasurements in predicting final infarct size and assessingthe potential effect of thrombolytic therapy in anterior wallacute myocardial infarction. Am J Cardiol. 1999;84:530e534.
28. Jose VJ, Gupta SN. Mortality and morbidity of acute STsegment elevation myocardial infarction in the current era.Indian Heart J. 2004;56:210e214.

i n d i a n h e a r t j o u rn a l 6 5 ( 2 0 1 3 ) 6 7 1e6 7 7 677
29. Birnbaum Y, Herz I, Sclarovsky S, et al. Prognostic significanceof precordial ST segment depression on admissionelectrocardiogram in patients with inferior wall myocardialinfarction. J Am Coll Cardiol. 1996;28:313e318.
30. Garcia-Rubira JC, Perez-Leal I, Garcia-Martinez JT, et al. Theinitial electrocardiogram pattern is a strong predictor ofoutcome in acute myocardial infarction. Int J Cardiol.1995;51:301e305.
31. Birnbaum Y, Criger D, Wanger G, et al. Prediction of the extentand severity of left ventricular dysfunction in anterior acutemyocardial infarction by the admission electrocardiogram.Am Heart J. 2001;141:915e924.
32. Mager A, Sclarovsky S, Herz I, Zlotikamien B, Strasberg B,Birnbaum Y. QRS complex distortion predicts no reflow afteremergency angioplasty in patients with anterior wall acutemyocardial infarction. Coron Artery Dis. 1999:199e205.Lippincott-Raven Publishers.
33. Holland R, Brooks H. The QRS complex during myocardialischemia: an experimental analysis in the porcine heart. J ClinInvest. 1976;57:541e550.
34. Friedman T, Chua K, Childres R. R wave of the surface andintra coronary electrocardiogram during acute coronaryartery occlusion. Am J Cardiol. 1986;58:885e890.
35. Birnbaum Y, Mahaffey K, Criger D, et al. Grade III ischemia onpresentation with acute myocardial infarction predicts rapidprogression of necrosis and less myocardial salvage withthrombolysis. Cardiology. 2002;97:166e174.
36. Spekhorst H, Sippens Groenwegan A, David GK, Janse MJ,Dunning AJ. Body surface mapping during percutaneoustransluminal coronary angioplasty: QRS changes indicatingregional myocardial conduction delay. Circulation.1990;81:840e849.
Obituary
The Cardiological Society of India expresses its deep shockand grief at the sudden demise of Dr. C.A. Abdul Latheef,
Aluva, Kerala. Dr. Abdul Latheef was a valuable and esteemed
member of our society.0019-4832/$ e see front matter
http://dx.doi.org/10.1016/j.ihj.2013.12.002