Embed Size (px)
Citation preview
Prognostic models for
Inflammatory Bowel Disease:
evidence, classification and prediction
Claudia Camila Rodrigues Pereira Dias
February 2017

Dissertacao de candidatura ao grau de Doutor apresentada a Faculdade de Medicina da Universidade do Porto,
no ambito do Programa Doutoral em Investigacao Clınica e em Servicos de Saude.
This PhD thesis has been submitted in fulfilment of the requirements for the PhD degree in Clinical and
Health Services Research at the Faculty of Medicine of the University of Porto.

Juri
Presidente
Doutor Rui Manuel Lopes Nunes, professor catedratico da Faculdade de Medicina da Universidade do Porto
Vogais
Doutor Mario Jorge Dinis Ribeiro, professor catedratico convidado da Faculdade de Medicina da Universidade
do Porto
Doutor Ruy Miguel Sousa Soeiro de Figueiredo Ribeiro, professor associado convidado com agregacao da
Faculdade de Medicina da Universidade de Lisboa
Doutor Jose Artur Osorio de Carvalho Paiva, professor associado convidado da Faculdade de Medicina da
Universidade do Porto
Doutor Fernando Jose Magro Dias, professor associado convidado da Faculdade de Medicina da Universi-
dade do Porto
Doutor Luıs Filipe Ribeiro de Azevedo, professor auxiliar da Faculdade de Medicina da Universidade do Porto
Doutora Carla Rolanda da Rocha Goncalves, professora auxiliar convidada da Escola de Ciencias da Saude da
Universidade do Minho
Doutor Paulo Andre Vinagreiro Freire, assistente convidado da Faculdade de Medicina da Universidade de
Coimbra

Title
Prognostic models for Inflammatory Bowel Disease: evidence, classification and prediction
Modelos de prognostico na Doenca Inflamatoria Intestinal: evidencia, classificacao e previsao
Candidate
Claudia Camila Rodrigues Pereira Dias
Adviser
Professor Doutor Fernando Jose Magro Dias
Co-advisers
Professor Doutor Altamiro Manuel Rodrigues da Costa PereiraProfessor Doutor Manuel Guilherme Goncalves Macedo
Artigo 48o, paragrafo 3o: A Faculdade nao responde pelas doutrinas expendidas na dissertacao (Regulamento
da Faculdade de Medicina do Porto. Lei nr. 19337, de 29 de Janeiro de 1931)

Professores Catedraticos
Manuel Alberto Coimbra Sobrinho Simoes
Maria Amelia Duarte Ferreira
Jose Agostinho Marques Lopes
Patrıcio Manuel Vieira Araujo Soares Silva
Alberto Manuel Barros Da Silva
Jose Manuel Lopes Teixeira Amarante
Jose Henrique Dias Pinto De Barros
Maria Fatima Machado Henriques Carneiro
Isabel Maria Amorim Pereira Ramos
Deolinda Maria Valente Alves Lima Teixeira
Maria Dulce Cordeiro Madeira
Altamiro Manuel Rodrigues Costa Pereira
Rui Manuel Almeida Mota Cardoso
Jose Carlos Neves Da Cunha Areias
Manuel Jesus Falcao Pestana Vasconcelos
Joao Francisco Montenegro Andrade Lima Bernardes
Maria Leonor Martins Soares David
Rui Manuel Lopes Nunes
Jose Eduardo Torres Eckenroth Guimaraes
Francisco Fernando Rocha Goncalves
Jose Manuel Pereira Dias De Castro Lopes
Antonio Albino Coelho Marques Abrantes Teixeira
Joaquim Adelino Correia Ferreira Leite Moreira
Raquel Angela Silva Soares Lino

Professores Jubilados e Aposentados
Alexandre Alberto Guerra Sousa Pinto
Alvaro Jeronimo Leal Machado De Aguiar
Antonio Augusto Lopes Vaz
Antonio Carlos De Freitas Ribeiro Saraiva
Antonio Carvalho Almeida Coimbra
Antonio Fernandes Oliveira Barbosa Ribeiro Braga
Antonio Jose Pacheco Palha
Antonio Manuel Sampaio De Araujo Teixeira
Belmiro Dos Santos Patrıcio
Candido Alves Hipolito Reis
Carlos Rodrigo Magalhaes Ramalhao
Cassiano Pena De Abreu E Lima
Daniel Filipe De Lima Moura
Daniel Santos Pinto Serrao
Eduardo Jorge Cunha Rodrigues Pereira
Fernando Tavarela Veloso
Henrique Jose Ferreira Goncalves Lecour De Menezes
Jorge Manuel Mergulhao Castro Tavares
Jose Carvalho De Oliveira
Jose Fernando Barros Castro Correia
Jose Luıs Medina Vieira
Jose Manuel Costa Mesquita Guimaraes
Levi Eugenio Ribeiro Guerra
Luıs Alberto Martins Gomes De Almeida
Manuel Antonio Caldeira Pais Clemente
Manuel Augusto Cardoso De Oliveira
Manuel Machado Rodrigues Gomes
Manuel Maria Paula Barbosa
Maria Da Conceicao Fernandes Marques Magalhaes
Maria Isabel Amorim De Azevedo
Mario Jose Cerqueira Gomes Braga
Serafim Correia Pinto Guimaraes
Valdemar Miguel Botelho Dos Santos Cardoso
Walter Friedrich Alfred Osswald


To
Pedro,Tomas and Eva
ix

Contents
Acknowledgments xiii
List of Publications xv
Abbreviations and Notation xvii
List of Tables xix
List of Figures xxi
Abstract xxiii
Resumo xxv
1. Outline 1
2. Rationale 5
2.1 Inflammatory bowel disease . . . . . . . . . . . . . . . . . . . . . . . . . . . . . . . . . . . . 7
2.1.1 IBD in Portugal . . . . . . . . . . . . . . . . . . . . . . . . . . . . . . . . . . . . . . 9
2.2 Clinical decision . . . . . . . . . . . . . . . . . . . . . . . . . . . . . . . . . . . . . . . . . . 11
2.2.1 Bayesian network . . . . . . . . . . . . . . . . . . . . . . . . . . . . . . . . . . . . . 12
2.2.2 Decision tree . . . . . . . . . . . . . . . . . . . . . . . . . . . . . . . . . . . . . . . . 15
2.2.3 Methods of validation . . . . . . . . . . . . . . . . . . . . . . . . . . . . . . . . . . . 16
2.2.4 From modeling to bedside . . . . . . . . . . . . . . . . . . . . . . . . . . . . . . . . 18
3. Objectives 19
4. Evidence 23
4.1 Prognostic factors for disabling Crohn’s disease: a systematic review and meta-analysis . . . . 26
4.2 Clinical predictors of colectomy in patients with ulcerative colitis: systematic review and meta-
analysis of cohort studies . . . . . . . . . . . . . . . . . . . . . . . . . . . . . . . . . . . . . 33
5. Classification 43
5.1 The impact of early surgery and immunosuppression on Crohn’s disease disabling outcomes. . 46
5.2 The timing of early therapeutics strategies has a significant impact on the Crohn’s disease
prognosis . . . . . . . . . . . . . . . . . . . . . . . . . . . . . . . . . . . . . . . . . . . . . . 56
xi
6. Prediction 75
6.1 Development and validation of risk matrices for Crohn’s disease outcomes in patients submitted
to early therapeutic interventions. . . . . . . . . . . . . . . . . . . . . . . . . . . . . . . . . 78
6.2 The risk of disabling, surgery and reoperation in Crohn’s disease: a decision tree-based approach
to prognosis . . . . . . . . . . . . . . . . . . . . . . . . . . . . . . . . . . . . . . . . . . . . 88
7. Discussion and recommendations 109
7.1 Disabling disease . . . . . . . . . . . . . . . . . . . . . . . . . . . . . . . . . . . . . . . . . . 111
7.2 Surgery and Reoperation . . . . . . . . . . . . . . . . . . . . . . . . . . . . . . . . . . . . . 112
7.3 Recomendation . . . . . . . . . . . . . . . . . . . . . . . . . . . . . . . . . . . . . . . . . . 113
A. Preliminary study for a Bayesian net 121
A.1 Preliminary study for a Bayesian network prognostic model for Crohn´s disease. . . . . . . . 123
B. Building the Bayesian net 129
B.1 Disabling and reoperation in patients with Crohn´s disease subject to early surgery or immuno-
suppression: A Bayesian network prognostic model. disease. . . . . . . . . . . . . . . . . . . 131
C. Using the Bayesian net 137

Acknowledgments
To Professor Doutor Fernando Magro, Professor Doutor Altamiro Costa Pereira and Professor Doutor Gui-
lherme Macedo for having accepted the risk of guiding me on this dissertation.
To Professor Fernando Magro for all the teaching, patience and rigor over these, not always easy, years,
during which I hope I have responded to all your expectations.
To Professor Altamiro da Costa Pereira, for always believing and betting on me over the past fifteen years, for
all the teachings and for providing all the conditions that made this work possible.
To Sandra Dias for all the help during the data collection process.
To Raphael Oliveira for the development of the online tool.
This work has been developed under the scope of GEDII (Grupo de Estudo da Doenca Inflamatoria Intestinal),
which gave an invaluable institutional support for this thesis, and project NanoSTIMA (NORTE-01-0145-
FEDER-000016) which is financed by the North Portugal Regional Operational Programme (NORTE 2020),
under the PORTUGAL 2020 Partnership Agreement, and through the European Regional Development Fund
(ERDF).
For understanding, encouragement and always believing in me over all these years, I could not fail to thank
my parents, hoping one day I may be able to return in the same extent.
I thank also all members of the department for constant willingness to discuss my work. I shall not fail
to give a special word to Ines Vaz, my companion since early in this adventure.
For the help and encouragement in some of the not so good times and their presence during those good
times, I thank all my friends.
To Pedro, Tomas and Eva for being my safe haven and whom I know I can always count on.
xiii

List of Publications
This thesis was based in several publications.
Research Papers and Abstracts
Prognostic factors for disabling Crohn’s disease: a systematic review and meta-analysis.
World Journal of Gastroentereology 19(24): 3866-71, 2013.
Claudia Camila Dias, Pedro Pereira Rodrigues, Altamiro da Costa Pereira, Fernando Magro
Clinical Predictors of colectomy in patients with ulcerative colitis: systematic review and meta-
analysis of cohort studies.
Journal of Crohn’s and Colitis, 9(2):156-163, 2015
Claudia Camila Dias, Pedro Pereira Rodrigues, Altamiro da Costa Pereira, Fernando Magro
The impact of early surgery and immunosuppression on Crohn’s disease disabling outcomes.
(Inflammatory Bowel Diseases, 23 (2):289-297, 2017)
Fernando Magro, Claudia Camila Dias, Rosa Coelho, Paula Moura Santos, Samuel Fernandes, Cidalina Cae-
tano, Angela Rodrigues, Francisco Portela, Ana Oliveira, Paula Ministro, Eugenia Cancela, Ana Isabel Vieira,
Rita Barosa, Jose Cotter, Pedro Carvalho, Isabelle Cremers, Daniel Trabulo, Paulo Caldeira, Artur Antunes,
Isadora Rosa, Joana Moleiro, Paula Peixe, Rita Herculano, Raquel Goncalves, Bruno Goncalves, Helena Tavares
Sousa, Luıs Contente, Henrique Morna, Susana Lopes on behalf of GEDII
Development and validation of risk matrices for Crohn’s disease outcomes in patients submitted
to early therapeutic interventions.
Journal of Crohn’s and Colitis (accepted), 2016
Claudia Camila Dias, Pedro Pereira Rodrigues, Rosa Coelho, Paula Moura Santos, Samuel Fernandes, Cidalina
Caetano, Angela Rodrigues, Francisco Portela, Ana Oliveira, Paula Ministro, Eugnia Cancela, Ana Isabel Vieira,
Rita Barosa, Jose Cotter, Pedro Carvalho, Isabelle Cremers, Daniel Trabulo, Paulo Caldeira, Artur Antunes,
Isadora Rosa, Joana Moleiro, Paula Peixe, Rita Herculano, Raquel Goncalves, Bruno Goncalves, Helena Tavares
Sousa, Luıs Contente, Henrique Morna , Susana Lopes, and Fernando Magro on behalf of GEDII
The timing of early therapeutics strategies has a significante impact on the Crohn’s disease prognosis
(submitted, 2016)
Claudia Camila Dias, Samuel Fernandes, Francisco Portela, Paula Ministro, Diana Martins, Paula Sousa, Paula
Lago, Isadora Rosa, Luıs Correia, Paula Moura Santos Fernando Magro on behalf GEDII
xv
The risk of disabling, surgery and reoperation in Crohn’s disease a decision tree-based approach to
prognosis
(submitted, 2016)
Claudia Camila Dias, Pedro Pereira Rodrigues, Samuel Fernandes, Francisco Portela, Paula Ministro, Diana
Martins, Paula Sousa, Paula Lago, Isadora Rosa, Luıs Correia, Paula Moura Santos Fernando Magro on behalf
GEDII
Preliminary study for a Bayesian network prognostic model for Crohn’s disease.
Proceedings of 2015 IEEE 28th International Symposium on Computer-Based Medical Systems 141-144, 2015
Claudia Camila Dias, Fernando Magro e Pedro Pereira Rodrigues
Disabling and reoperation in patients with Crohn’s disease subject to early surgery or immuno-
suppression: A Bayesian network prognostic model. disease.
Proceedings of 2016 IEEE 29th International Symposium on Computer-Based Medical Systems 265-268, 2016
Claudia Camila Dias, Fernando Magro e Pedro Pereira Rodrigues
EArly SurgerY or Immunosuppression - EASY study.
Journal of Crohn’s and Colitis, 9(suppl 1):S317, 2015
Fernado Magro, Rosa Coelho, Samuel Fernandes, Angela Rodrigues, Ana Oliveira, Paula Sousa, Rita Barosa,
Pedro Boal Carvalho, Daniel Trabulo, Marta Eusebio, Joana Moleiro, Rita Herculano, Paula Peixe, Bruno
Goncalves, Henrique Morna, Helena Tavares, Luıs Contente, Raquel Goncalves, Paulo Caldeira, Isadora Rosa,
Isabel Cremers, Jose Cotter, Ana Isabel Vieira, Paula Ministro, Francisco Portela, Cidalina Caetano, Paula
Moura-Santos, Susana Lopes, Caudia Camila-Dias
Oral Communications
BioData Meeting 2016, CINTESIS, Porto
June 14th
Development and validation of risk matrices for Crohn’s disease outcomes in patients submitted to early ther-
apeutic interventions
CBMS 2016, Dublin-Belfast
June 20nd-23th
Disabling and reoperation in patients with Crohn’s disease subject to early surgery or immunosuppression: A
Bayesian network prognostic model
CBMS 2015, Sao Carlos, Brasil
June 22nd-25th
Preliminary study for a Bayesian network prognostic model for Crohn’s disease.
UEG 2015, Barcelona, Spain
October 15th-19th
Early surgery or immunossuppresion in Cronh’s Disease Easy study
Abbreviations and Notation
CD: Crohn disease
UC: Ulcerative colitis
IBD: Inflammatory Bowel disease
NB: Naive Bayes
TAN: Tree Augmented Naive Bayes
AUC: Area Under the Curve
ROC: Receiver operating characteristics
OR: Odds Ratio
CI 95%: Confidence interval of 95%
Prev: Prevalence
IQR: Inter Quartile Range
Pretest: Pre-test probability
Acc: Accuracy
Sens: Sensitivity
Spec: Specificity
PPV: Positive predictive value
NPV: Negative predictive value
LR+: Positive likelihood ratio
LR-: Negative likelihood ratio
Odds post-test+: Positive post-test odds
Odds post-test-: Negative post-test odds
+: positive test
∼ D: no disease
D: disease
p(D): probability of D occurs
p(A,B): probability of A and B both occurs
p(A|B): probability of A occurs given that B also occurs
xvii

List of Tables
2.1 Classification of Montreal - Extent of ulcerative colitis. . . . . . . . . . . . . . . . . . . . . . 7
2.2 Classification of Montreal - Severity of ulcerative colitis. . . . . . . . . . . . . . . . . . . . . . 8
2.3 Montreal classification for Crohn’s disease . . . . . . . . . . . . . . . . . . . . . . . . . . . . 8
2.4 Risk factors for developing IBD . . . . . . . . . . . . . . . . . . . . . . . . . . . . . . . . . . 9
2.5 Classification of clinical decision support according interaction . . . . . . . . . . . . . . . . . 11
2.6 Classification of different usage risk for clinical decision support . . . . . . . . . . . . . . . . . 11
2.7 Diagnostic testing confusion matrix . . . . . . . . . . . . . . . . . . . . . . . . . . . . . . . . 16
2.8 Descriptions of measures which can be calculated from the confusion matrix (using the diag-
nostic testing metaphor) . . . . . . . . . . . . . . . . . . . . . . . . . . . . . . . . . . . . . 17
xix

List of Figures
2.1 Graphical probabilistic model for representation of a diagnostic test . . . . . . . . . . . . . . 13
2.2 Graphical probabilistic model for representation of two diagnostic tests . . . . . . . . . . . . . 13
2.3 Qualitative model for Naıve Bayes . . . . . . . . . . . . . . . . . . . . . . . . . . . . . . . . 14
2.4 Qualitative model of a TAN Classifier . . . . . . . . . . . . . . . . . . . . . . . . . . . . . . 14
2.5 Decision tree example (adapted from [Gama et al., 2012]) . . . . . . . . . . . . . . . . . . . 15
2.6 Examples of ROC curves of different quality models. . . . . . . . . . . . . . . . . . . . . . . 18
C.1 CrohnBayes: Online clinical decision tool . . . . . . . . . . . . . . . . . . . . . . . . . . . . . 140
C.2 CrohnBayes: Example of use with missing observations . . . . . . . . . . . . . . . . . . . . . 141
C.3 CrohnBayes: Example of use with all included variables . . . . . . . . . . . . . . . . . . . . . 142
xxi

Abstract
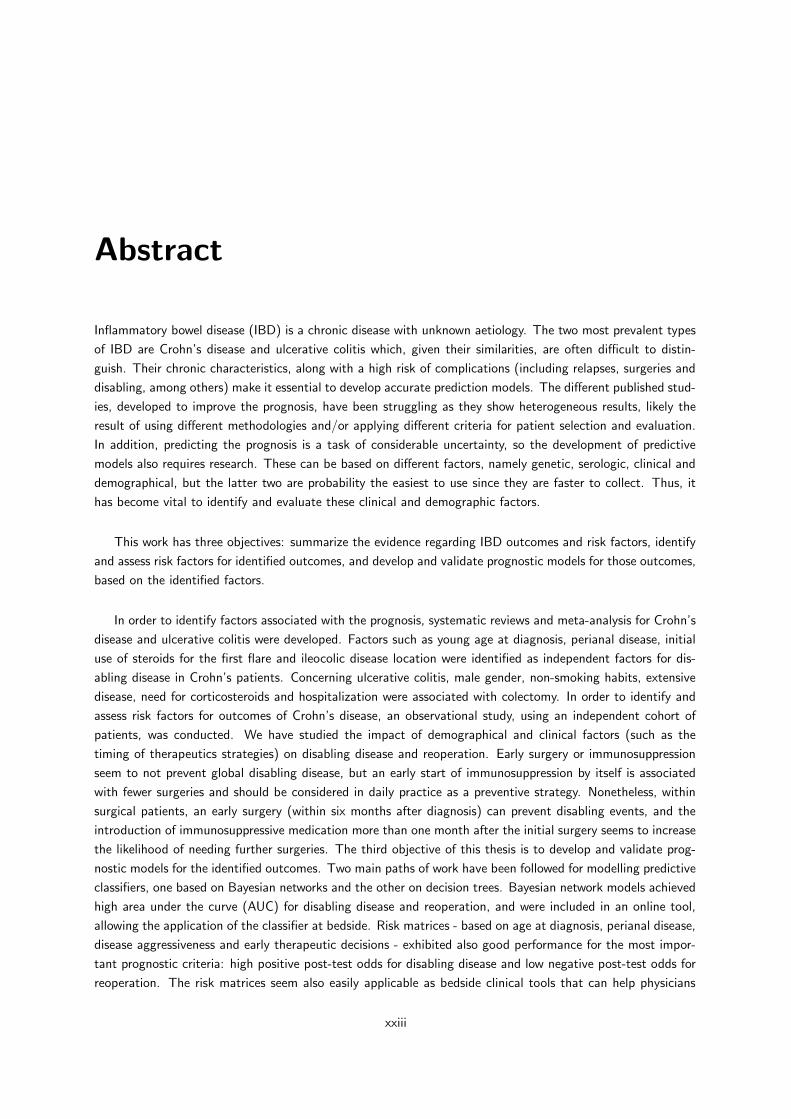
Inflammatory bowel disease (IBD) is a chronic disease with unknown aetiology. The two most prevalent types
of IBD are Crohn’s disease and ulcerative colitis which, given their similarities, are often difficult to distin-
guish. Their chronic characteristics, along with a high risk of complications (including relapses, surgeries and
disabling, among others) make it essential to develop accurate prediction models. The different published stud-
ies, developed to improve the prognosis, have been struggling as they show heterogeneous results, likely the
result of using different methodologies and/or applying different criteria for patient selection and evaluation.
In addition, predicting the prognosis is a task of considerable uncertainty, so the development of predictive
models also requires research. These can be based on different factors, namely genetic, serologic, clinical and
demographical, but the latter two are probability the easiest to use since they are faster to collect. Thus, it
has become vital to identify and evaluate these clinical and demographic factors.
This work has three objectives: summarize the evidence regarding IBD outcomes and risk factors, identify
and assess risk factors for identified outcomes, and develop and validate prognostic models for those outcomes,
based on the identified factors.
In order to identify factors associated with the prognosis, systematic reviews and meta-analysis for Crohn’s
disease and ulcerative colitis were developed. Factors such as young age at diagnosis, perianal disease, initial
use of steroids for the first flare and ileocolic disease location were identified as independent factors for dis-
abling disease in Crohn’s patients. Concerning ulcerative colitis, male gender, non-smoking habits, extensive
disease, need for corticosteroids and hospitalization were associated with colectomy. In order to identify and
assess risk factors for outcomes of Crohn’s disease, an observational study, using an independent cohort of
patients, was conducted. We have studied the impact of demographical and clinical factors (such as the
timing of therapeutics strategies) on disabling disease and reoperation. Early surgery or immunosuppression
seem to not prevent global disabling disease, but an early start of immunosuppression by itself is associated
with fewer surgeries and should be considered in daily practice as a preventive strategy. Nonetheless, within
surgical patients, an early surgery (within six months after diagnosis) can prevent disabling events, and the
introduction of immunosuppressive medication more than one month after the initial surgery seems to increase
the likelihood of needing further surgeries. The third objective of this thesis is to develop and validate prog-
nostic models for the identified outcomes. Two main paths of work have been followed for modelling predictive
classifiers, one based on Bayesian networks and the other on decision trees. Bayesian network models achieved
high area under the curve (AUC) for disabling disease and reoperation, and were included in an online tool,
allowing the application of the classifier at bedside. Risk matrices - based on age at diagnosis, perianal disease,
disease aggressiveness and early therapeutic decisions - exhibited also good performance for the most impor-
tant prognostic criteria: high positive post-test odds for disabling disease and low negative post-test odds for
reoperation. The risk matrices seem also easily applicable as bedside clinical tools that can help physicians
xxiii
during therapeutic decisions in early disease management. In the second path, decision trees were able to
predict disabling, surgery and reoperation with high AUC, and were shown to be a valid and useful approach
to depict outcome risks. The defined cut-off risk levels expressed high odds for a positive test for disabling,
while excluding surgery and reoperation with low odds for a negative test.
In conclusion, clinical and demographical factors should be used more frequently in the prognosis of IBD
as they are easier to collect than serologic or genetic ones. Factors such as age at diagnosis, behavior, perianal
disease, and location are important predictors for negative outcomes and should, as soon as possible, be known.
Concerning interventions, immunosuppression, as the first therapy after diagnosis, is effective in preventing
future surgeries, being its efficiency higher upon an early start. On the other hand, patients undergoing an
early surgery after diagnosis have an increased tendency to be re-operated, even with a concomitantly early
start of immunosuppression therapy. Given this, predictive models for CD prognosis could enhance the initial
approach and, therefore, improve the clinical outcome.
Resumo
A doenca inflamatoria intestinal (DII) e uma doenca cronica e com etiologia desconhecida. As duas formas
mais prevalentes de DII sao a doenca de Crohn e a colite ulcerosa que, dadas as suas semelhancas, sao muitas
vezes difıceis de distinguir. As suas caracterısticas cronicas, acumuladas com um grande risco de complicacoes
(nomeadamente recidivas, cirurgias e doenca incapacitante, entre outras), tornam imprescindıvel o desen-
volvimento de modelos de prognostico. Os estudos desenvolvidos no intuito de melhorar esse prognostico
tem apresentado resultados muito dıspares, fruto provavevelmente da utilizacao de diferentes metodologias e
criterios de selecao e avaliacao utilizados. Para alem disso, a previsao do prognostico reveste-se de elevada
incerteza, pelo que o desenvolvimento de modelos preditivos requer tambem uma investigacao mais aprofun-
dada. Os modelos podem ser baseados em diferentes fatores, nomeadamente geneticos, serologicos, clınicos e
demograficos, sendo estes ultimos mais faceis de usar, uma vez que sao mais facilmente recolhidos tornando-se
assim vital a sua identificacao e utilizacao mais frequente.
Este trabalho tem tres objetivos: o primeiro, resumir a evidencia no que diz respeito aos factores de risco
na DII, identificar e avaliar fatores de risco para diferentes outcomes, e desenvolver e validar modelos de
prognosticos para os outcomes utilizados, com base nos fatores identificados.
Com o objectivo de identificar os fatores associados ao prognostico, foram realizadas duas revisoes sis-
tematicas e meta-analise para a doenca de Crohn e colite ulcerosa. Fatores como idade ao diagnostico menor
que 40 anos, doenca perianal, uso inicial de corticosteroides durante a primeira recaıda e doenca ileocolica
foram identificados como fatores de risco independentes para a doenca incapacitante nos pacientes com
doenca Crohn. No que diz respeito a colite ulcerosa, foram associados com a colectomia o sexo masculino,
nao-fumadores, doenca extensa, necessidade de corticosteroides e de hospitalizacao . A fim de identificar e
avaliar os fatores de risco na doenca de Crohn, foi realizado um estudo observacional, utilizando uma coorte
independente de pacientes, foi realizado. Foi tambem estudado o impacto de fatores demograficos e clınicos
(como o tempo de introducao de terapeuticas farmacologicas) na doenca incapacitante e na reoperacao. A
cirurgia precoce ou imunossupressao parece nao prevenir a doenca incapacitante, mas um inıcio precoce da
imunossupressao, por si so, esta associado a menos cirurgias e devera ser considerado na pratica diaria como
uma estrategia preventiva. No entanto, em pacientes cirurgicos, uma cirurgia precoce (nos primeiros seis
meses apos o diagnostico) pode prevenir a doenca incapacitante. Por outro lado a introducao de imunos-
supressores um mes apos a cirurgia inicial parece aumentar o risco de reoperacao. O terceiro objetivo desta
tese e desenvolver e validar modelos de prognostico para os outcomes identificados. Foram efetuadas duas
abordagens na modelacao: uma baseada em redes Bayesianas e a outra em arvores de decisao. Os modelos
baseados nas redes Bayesianas apresentaram AUC elevadas tanto para a doenca incapacitante como para a re-
operacao, tendo sido incluıdos numa ferramenta online, que permite a aplicacao diretamente na pratica clınica.
As matrizes de risco - com base na idade ao diagnostico, a doenca perianal, comportamento da doenca e as
xxv
decisoes terapeuticas precoces - exibiram tambem um bom desempenho para os criterios de prognostico mais
importantes: elevados odds pos-teste positivos para a doenca incapacitante e baixos odds pos-teste negativos
para a reoperacao. As matrizes de risco podem ser facilmente aplicaveis como ferramentas clınicas podendo
ajudar os clınicos durante as decisoes terapeuticas com efeitos no percurso da doenca. Na segunda abordagem,
as arvores de decisao foram, tambem, capazes de prever doenca incapacitante, a cirurgia e reoperacao com
valores altos de AUC, tendo sido mostrado que as arvores de decisao sao uma abordagem valida e util. Mais
uma vez, para a doenca incapacitante foram obtidos valores altos de odds pos-teste positivos e valores baixos
de odds pos-teste negativos para a cirurgia e reoperacao.
Em conclusao, fatores clınicos e demograficos devem ao ser usados com mais frequencia no prognostico da
DII, uma vez que sao mais faceis e baratos de recolher do que os serologicos ou geneticos. Fatores como idade
ao diagnostico, comportamento da doenca, doenca perianal, e localizacao da doenca sao importantes preditores
de maus outcomes e devem, logo que possıvel, ser conhecidos. No que diz respeito a intervencoes precoces, a
imunossupressao, como primeira abordagem da doenca, e eficaz na prevencao de futuras cirurgias. Por outro
lado, os pacientes submetidos a uma cirurgia precoce tem uma maior tendencia para serem reoperados, mesmo
com um inıcio precoce da imunossupressao. Perante isto, modelos preditivos para o prognostico na doenca de
Crohn poderiam reforcar a abordagem inicial a doenca e, consequentemente, melhorar o seu resultado clınico.

1. Outline

1. Outline
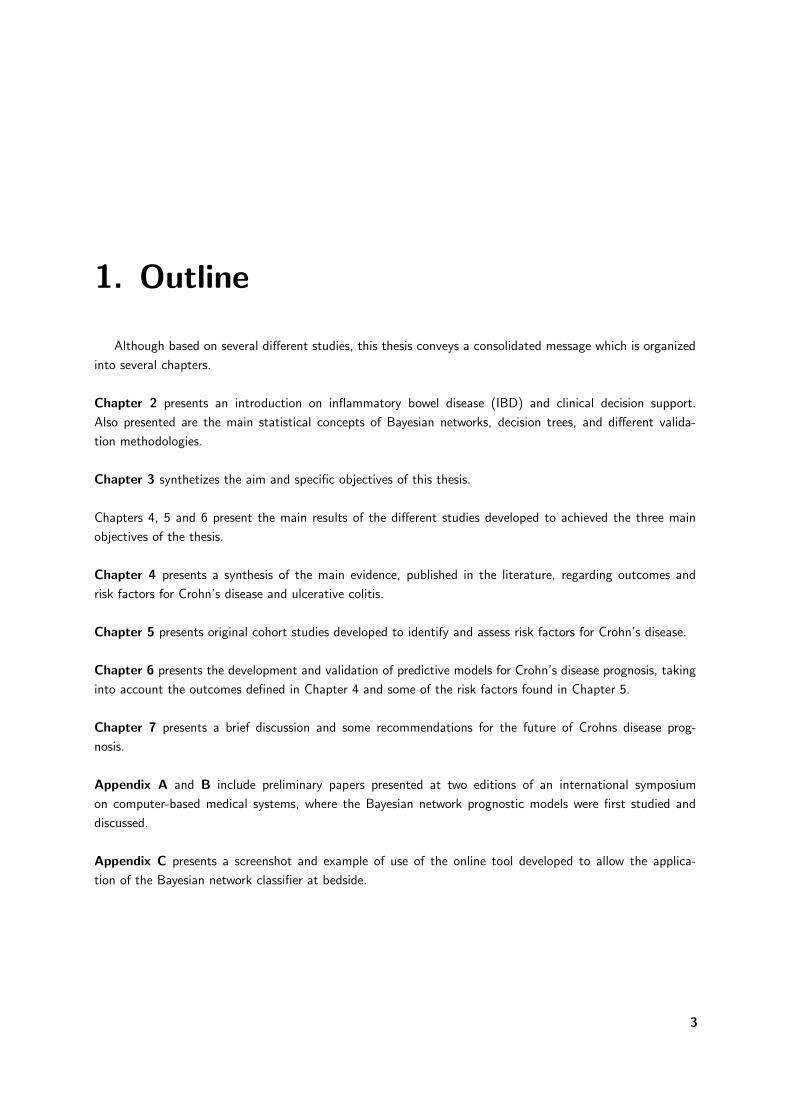
Although based on several different studies, this thesis conveys a consolidated message which is organized
into several chapters.
Chapter 2 presents an introduction on inflammatory bowel disease (IBD) and clinical decision support.
Also presented are the main statistical concepts of Bayesian networks, decision trees, and different valida-
tion methodologies.
Chapter 3 synthetizes the aim and specific objectives of this thesis.
Chapters 4, 5 and 6 present the main results of the different studies developed to achieved the three main
objectives of the thesis.
Chapter 4 presents a synthesis of the main evidence, published in the literature, regarding outcomes and
risk factors for Crohn’s disease and ulcerative colitis.
Chapter 5 presents original cohort studies developed to identify and assess risk factors for Crohn’s disease.
Chapter 6 presents the development and validation of predictive models for Crohn’s disease prognosis, taking
into account the outcomes defined in Chapter 4 and some of the risk factors found in Chapter 5.
Chapter 7 presents a brief discussion and some recommendations for the future of Crohns disease prog-
nosis.
Appendix A and B include preliminary papers presented at two editions of an international symposium
on computer-based medical systems, where the Bayesian network prognostic models were first studied and
discussed.
Appendix C presents a screenshot and example of use of the online tool developed to allow the applica-
tion of the Bayesian network classifier at bedside.
3


2. Rationale

2. Rationale
2.1 Inflammatory bowel disease
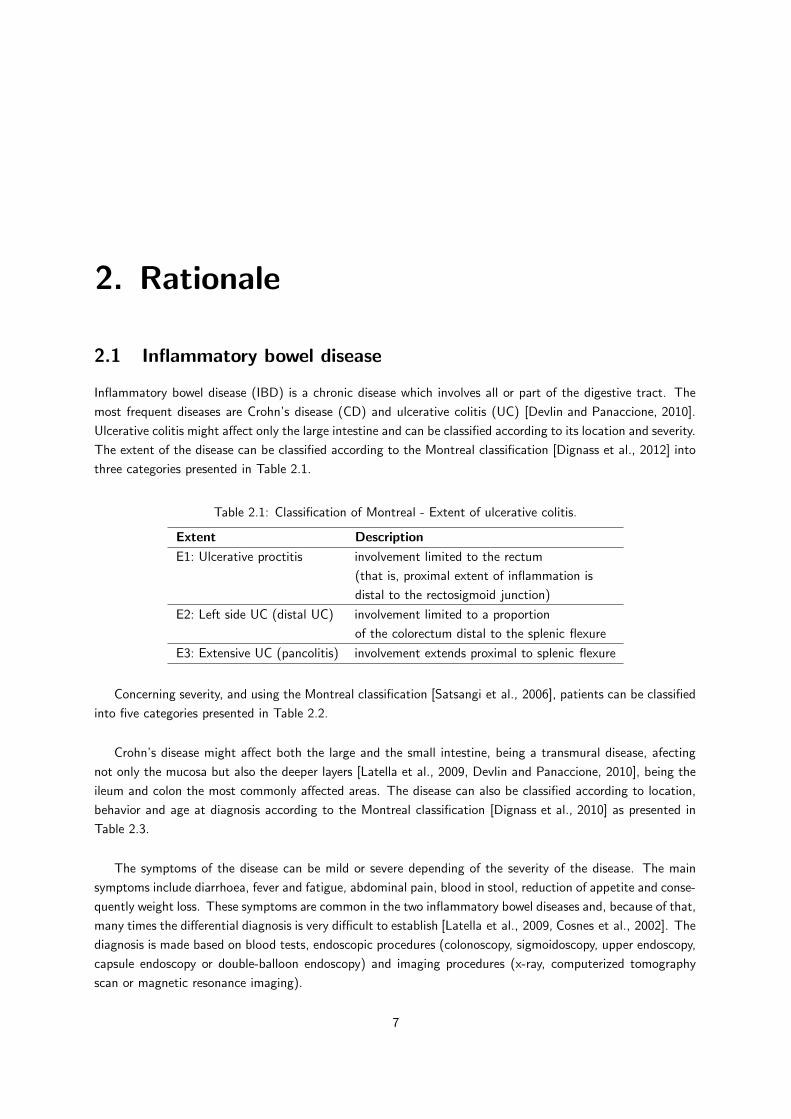
Inflammatory bowel disease (IBD) is a chronic disease which involves all or part of the digestive tract. The
most frequent diseases are Crohn’s disease (CD) and ulcerative colitis (UC) [Devlin and Panaccione, 2010].
Ulcerative colitis might affect only the large intestine and can be classified according to its location and severity.
The extent of the disease can be classified according to the Montreal classification [Dignass et al., 2012] into
three categories presented in Table 2.1.
Table 2.1: Classification of Montreal - Extent of ulcerative colitis.
Extent Description
E1: Ulcerative proctitis involvement limited to the rectum
(that is, proximal extent of inflammation is
distal to the rectosigmoid junction)
E2: Left side UC (distal UC) involvement limited to a proportion
of the colorectum distal to the splenic flexure
E3: Extensive UC (pancolitis) involvement extends proximal to splenic flexure
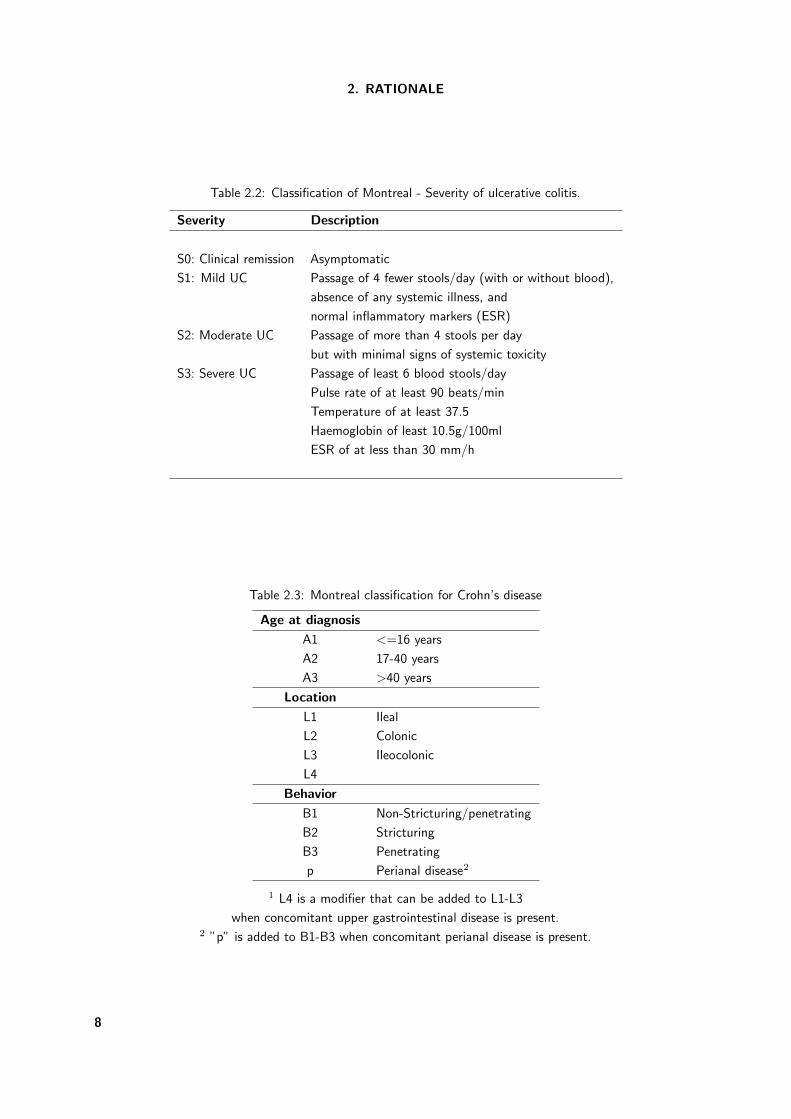
Concerning severity, and using the Montreal classification [Satsangi et al., 2006], patients can be classified
into five categories presented in Table 2.2.
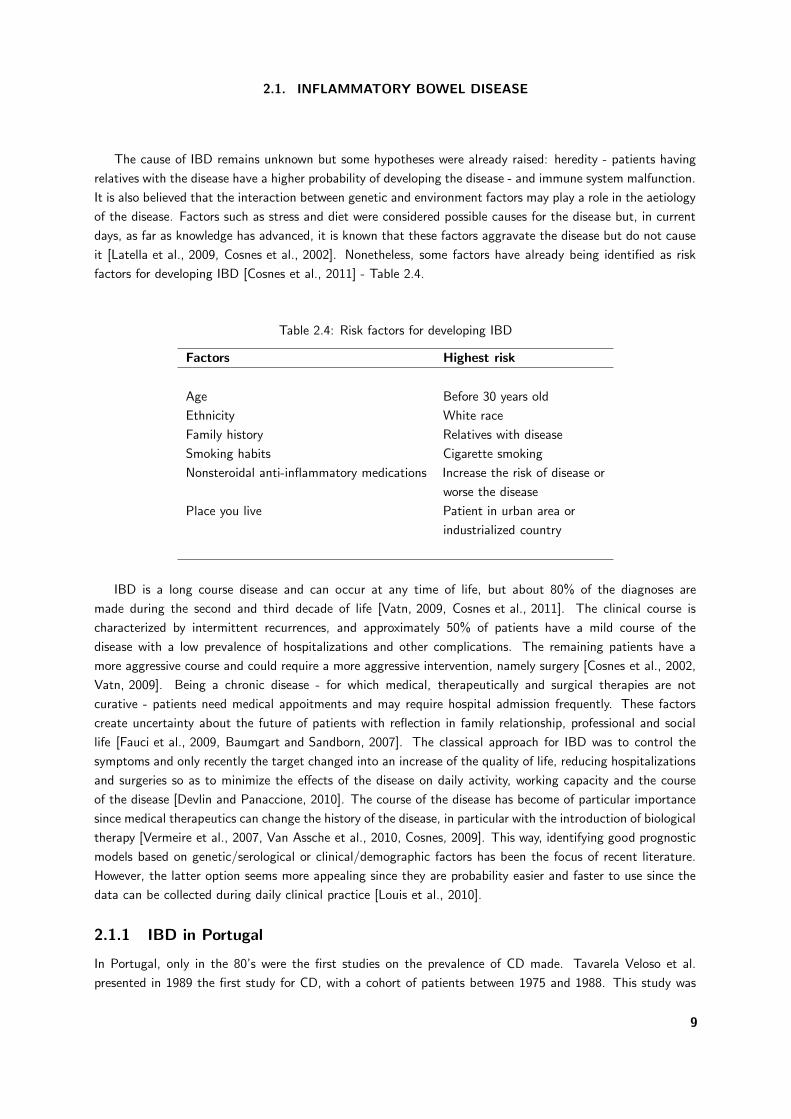
Crohn’s disease might affect both the large and the small intestine, being a transmural disease, afecting
not only the mucosa but also the deeper layers [Latella et al., 2009, Devlin and Panaccione, 2010], being the
ileum and colon the most commonly affected areas. The disease can also be classified according to location,
behavior and age at diagnosis according to the Montreal classification [Dignass et al., 2010] as presented in
Table 2.3.
The symptoms of the disease can be mild or severe depending of the severity of the disease. The main
symptoms include diarrhoea, fever and fatigue, abdominal pain, blood in stool, reduction of appetite and conse-
quently weight loss. These symptoms are common in the two inflammatory bowel diseases and, because of that,
many times the differential diagnosis is very difficult to establish [Latella et al., 2009, Cosnes et al., 2002]. The
diagnosis is made based on blood tests, endoscopic procedures (colonoscopy, sigmoidoscopy, upper endoscopy,
capsule endoscopy or double-balloon endoscopy) and imaging procedures (x-ray, computerized tomography
scan or magnetic resonance imaging).
7
2. RATIONALE
Table 2.2: Classification of Montreal - Severity of ulcerative colitis.
Severity Description
S0: Clinical remission Asymptomatic
S1: Mild UC Passage of 4 fewer stools/day (with or without blood),
absence of any systemic illness, and
normal inflammatory markers (ESR)
S2: Moderate UC Passage of more than 4 stools per day
but with minimal signs of systemic toxicity
S3: Severe UC Passage of least 6 blood stools/day
Pulse rate of at least 90 beats/min
Temperature of at least 37.5
Haemoglobin of least 10.5g/100ml
ESR of at less than 30 mm/h
Table 2.3: Montreal classification for Crohn’s disease
Age at diagnosis
A1 <=16 years
A2 17-40 years
A3 >40 years
Location
L1 Ileal
L2 Colonic
L3 Ileocolonic
L4
Behavior
B1 Non-Stricturing/penetrating
B2 Stricturing
B3 Penetrating
p Perianal disease2
1 L4 is a modifier that can be added to L1-L3
when concomitant upper gastrointestinal disease is present.2 ”p” is added to B1-B3 when concomitant perianal disease is present.
8
2.1. INFLAMMATORY BOWEL DISEASE
The cause of IBD remains unknown but some hypotheses were already raised: heredity - patients having
relatives with the disease have a higher probability of developing the disease - and immune system malfunction.
It is also believed that the interaction between genetic and environment factors may play a role in the aetiology
of the disease. Factors such as stress and diet were considered possible causes for the disease but, in current
days, as far as knowledge has advanced, it is known that these factors aggravate the disease but do not cause
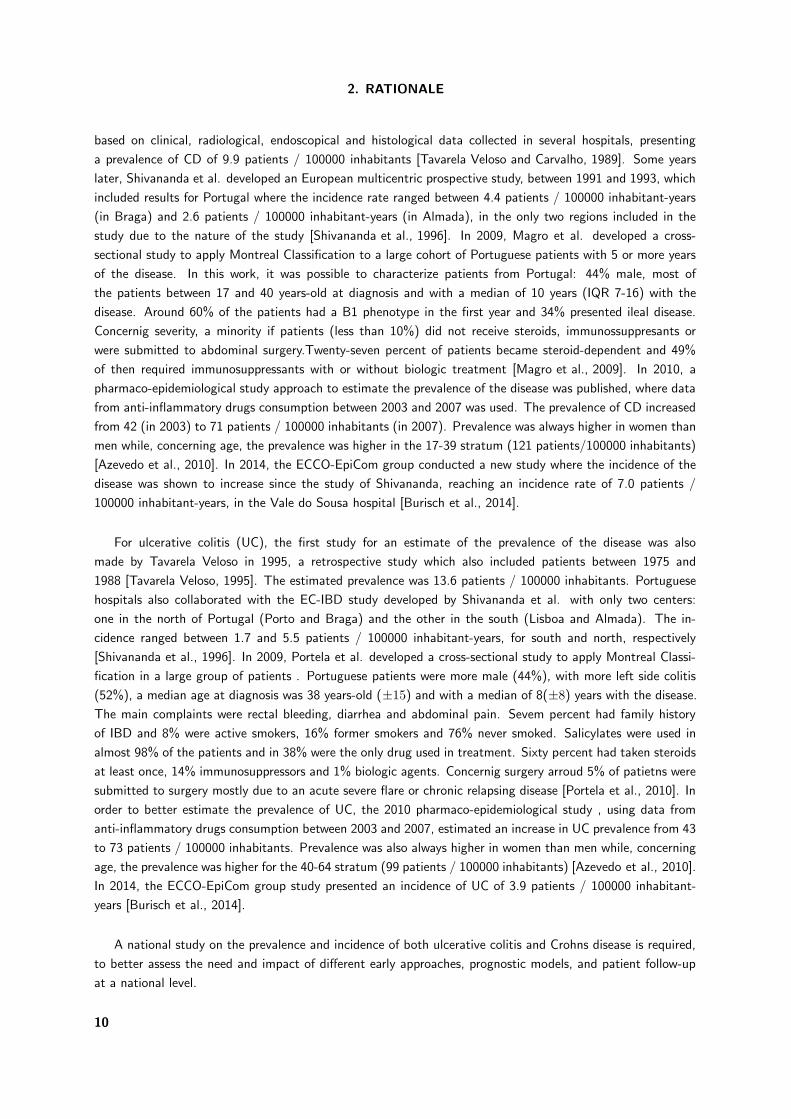
it [Latella et al., 2009, Cosnes et al., 2002]. Nonetheless, some factors have already being identified as risk
factors for developing IBD [Cosnes et al., 2011] - Table 2.4.
Table 2.4: Risk factors for developing IBD
Factors Highest risk
Age Before 30 years old
Ethnicity White race
Family history Relatives with disease
Smoking habits Cigarette smoking
Nonsteroidal anti-inflammatory medications Increase the risk of disease or
worse the disease
Place you live Patient in urban area or
industrialized country
IBD is a long course disease and can occur at any time of life, but about 80% of the diagnoses are
made during the second and third decade of life [Vatn, 2009, Cosnes et al., 2011]. The clinical course is
characterized by intermittent recurrences, and approximately 50% of patients have a mild course of the
disease with a low prevalence of hospitalizations and other complications. The remaining patients have a
more aggressive course and could require a more aggressive intervention, namely surgery [Cosnes et al., 2002,
Vatn, 2009]. Being a chronic disease - for which medical, therapeutically and surgical therapies are not
curative - patients need medical appoitments and may require hospital admission frequently. These factors
create uncertainty about the future of patients with reflection in family relationship, professional and social
life [Fauci et al., 2009, Baumgart and Sandborn, 2007]. The classical approach for IBD was to control the
symptoms and only recently the target changed into an increase of the quality of life, reducing hospitalizations
and surgeries so as to minimize the effects of the disease on daily activity, working capacity and the course
of the disease [Devlin and Panaccione, 2010]. The course of the disease has become of particular importance
since medical therapeutics can change the history of the disease, in particular with the introduction of biological
therapy [Vermeire et al., 2007, Van Assche et al., 2010, Cosnes, 2009]. This way, identifying good prognostic
models based on genetic/serological or clinical/demographic factors has been the focus of recent literature.
However, the latter option seems more appealing since they are probability easier and faster to use since the
data can be collected during daily clinical practice [Louis et al., 2010].
2.1.1 IBD in Portugal
In Portugal, only in the 80’s were the first studies on the prevalence of CD made. Tavarela Veloso et al.
presented in 1989 the first study for CD, with a cohort of patients between 1975 and 1988. This study was
9
2. RATIONALE
based on clinical, radiological, endoscopical and histological data collected in several hospitals, presenting
a prevalence of CD of 9.9 patients / 100000 inhabitants [Tavarela Veloso and Carvalho, 1989]. Some years
later, Shivananda et al. developed an European multicentric prospective study, between 1991 and 1993, which
included results for Portugal where the incidence rate ranged between 4.4 patients / 100000 inhabitant-years
(in Braga) and 2.6 patients / 100000 inhabitant-years (in Almada), in the only two regions included in the
study due to the nature of the study [Shivananda et al., 1996]. In 2009, Magro et al. developed a cross-
sectional study to apply Montreal Classification to a large cohort of Portuguese patients with 5 or more years
of the disease. In this work, it was possible to characterize patients from Portugal: 44% male, most of
the patients between 17 and 40 years-old at diagnosis and with a median of 10 years (IQR 7-16) with the
disease. Around 60% of the patients had a B1 phenotype in the first year and 34% presented ileal disease.
Concernig severity, a minority if patients (less than 10%) did not receive steroids, immunossuppresants or
were submitted to abdominal surgery.Twenty-seven percent of patients became steroid-dependent and 49%
of then required immunosuppressants with or without biologic treatment [Magro et al., 2009]. In 2010, a
pharmaco-epidemiological study approach to estimate the prevalence of the disease was published, where data
from anti-inflammatory drugs consumption between 2003 and 2007 was used. The prevalence of CD increased
from 42 (in 2003) to 71 patients / 100000 inhabitants (in 2007). Prevalence was always higher in women than
men while, concerning age, the prevalence was higher in the 17-39 stratum (121 patients/100000 inhabitants)
[Azevedo et al., 2010]. In 2014, the ECCO-EpiCom group conducted a new study where the incidence of the
disease was shown to increase since the study of Shivananda, reaching an incidence rate of 7.0 patients /
100000 inhabitant-years, in the Vale do Sousa hospital [Burisch et al., 2014].
For ulcerative colitis (UC), the first study for an estimate of the prevalence of the disease was also
made by Tavarela Veloso in 1995, a retrospective study which also included patients between 1975 and
1988 [Tavarela Veloso, 1995]. The estimated prevalence was 13.6 patients / 100000 inhabitants. Portuguese
hospitals also collaborated with the EC-IBD study developed by Shivananda et al. with only two centers:
one in the north of Portugal (Porto and Braga) and the other in the south (Lisboa and Almada). The in-
cidence ranged between 1.7 and 5.5 patients / 100000 inhabitant-years, for south and north, respectively
[Shivananda et al., 1996]. In 2009, Portela et al. developed a cross-sectional study to apply Montreal Classi-
fication in a large group of patients . Portuguese patients were more male (44%), with more left side colitis
(52%), a median age at diagnosis was 38 years-old (±15) and with a median of 8(±8) years with the disease.
The main complaints were rectal bleeding, diarrhea and abdominal pain. Sevem percent had family history
of IBD and 8% were active smokers, 16% former smokers and 76% never smoked. Salicylates were used in
almost 98% of the patients and in 38% were the only drug used in treatment. Sixty percent had taken steroids
at least once, 14% immunosuppressors and 1% biologic agents. Concernig surgery arroud 5% of patietns were
submitted to surgery mostly due to an acute severe flare or chronic relapsing disease [Portela et al., 2010]. In
order to better estimate the prevalence of UC, the 2010 pharmaco-epidemiological study , using data from
anti-inflammatory drugs consumption between 2003 and 2007, estimated an increase in UC prevalence from 43
to 73 patients / 100000 inhabitants. Prevalence was also always higher in women than men while, concerning
age, the prevalence was higher for the 40-64 stratum (99 patients / 100000 inhabitants) [Azevedo et al., 2010].
In 2014, the ECCO-EpiCom group study presented an incidence of UC of 3.9 patients / 100000 inhabitant-
years [Burisch et al., 2014].
A national study on the prevalence and incidence of both ulcerative colitis and Crohns disease is required,
to better assess the need and impact of different early approaches, prognostic models, and patient follow-up
at a national level.
10
2.2. CLINICAL DECISION
2.2 Clinical decision
A clinical decision tool, as defined by Wyatt and Liu [Wyatt and Liu, 2002], is: ”any type of mechanical, paper,
or electronic aid that collects or processes data from an individual patient and generates a specific output that
aids clinical decision”. In this way, clinical decision tools are a kind of clinical decision support developed for a
healthcare professional involved in patient care [Teich et al., 2005]. The definition of clinical decision support
tools is nowadays a very important topic as they provide help in the diagnosis, prognosis or even treatment
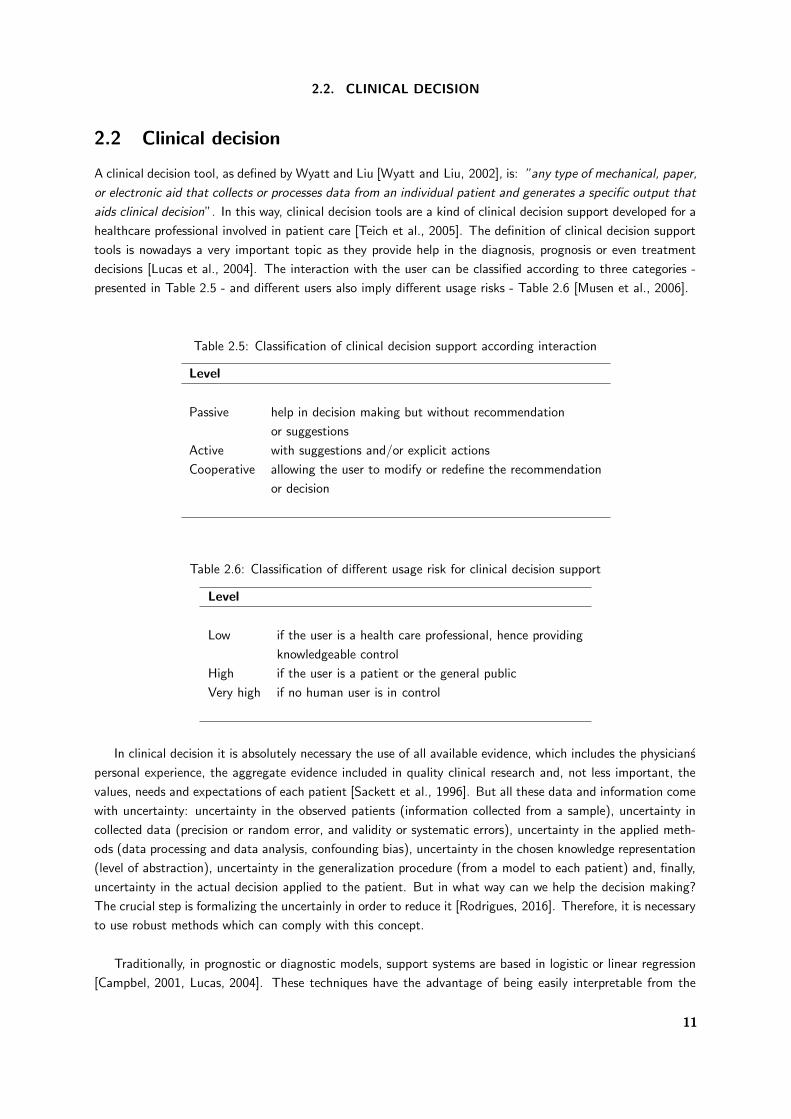
decisions [Lucas et al., 2004]. The interaction with the user can be classified according to three categories -
presented in Table 2.5 - and different users also imply different usage risks - Table 2.6 [Musen et al., 2006].
Table 2.5: Classification of clinical decision support according interaction
Level
Passive help in decision making but without recommendation
or suggestions
Active with suggestions and/or explicit actions
Cooperative allowing the user to modify or redefine the recommendation
or decision
Table 2.6: Classification of different usage risk for clinical decision support
Level
Low if the user is a health care professional, hence providing
knowledgeable control
High if the user is a patient or the general public
Very high if no human user is in control
In clinical decision it is absolutely necessary the use of all available evidence, which includes the physicians
personal experience, the aggregate evidence included in quality clinical research and, not less important, the
values, needs and expectations of each patient [Sackett et al., 1996]. But all these data and information come
with uncertainty: uncertainty in the observed patients (information collected from a sample), uncertainty in
collected data (precision or random error, and validity or systematic errors), uncertainty in the applied meth-
ods (data processing and data analysis, confounding bias), uncertainty in the chosen knowledge representation
(level of abstraction), uncertainty in the generalization procedure (from a model to each patient) and, finally,
uncertainty in the actual decision applied to the patient. But in what way can we help the decision making?
The crucial step is formalizing the uncertainly in order to reduce it [Rodrigues, 2016]. Therefore, it is necessary
to use robust methods which can comply with this concept.
Traditionally, in prognostic or diagnostic models, support systems are based in logistic or linear regression
[Campbel, 2001, Lucas, 2004]. These techniques have the advantage of being easily interpretable from the
11
2. RATIONALE
clinical point of view, having nonetheless a poor graphical representation. The nature of biomedical data
requires the application of techniques that go beyond traditional biostatistics [Lucas, 2004] , such as Bayesian
networks (which allow the computation of posterior probabilities) [Darwiche, 2010] or decision trees (whose
estimates are computed strictly from the proportions in the sample) [Breiman et al., 1984]. Both techniques
have an intuitive graphical representation for the user without losing the necessary formalism to clinical rea-
soning.
For learning these methods it is important to follow several steps, which include selection of relevant
variables, identification of variables interaction, validation of the model and sensitivity analysis. In each of
them it is necessary to take into account the knowledge of experts, the evidence in the literature and not least
important the patient data [Lucas et al., 2004, Lucas, 2004].
2.2.1 Bayesian network
Contrary to the common frequentist statistical inference, which gives us confidence intervals and hypothesis
testing theory, Bayesian statistical approaches compute the probability that the hypothesis is true, updating
the prior probability about the hypothesis with the new incoming available data [Petrie and Sabin, 2009]. In
medical diagnosis problems, it is common to calculate estimates such as prevalence (prev) of the disease (prior
probability) and sensitivity (sens) or specificity (spec) of a diagnostic test, equivalent to the conditional proba-
bility of positive/negative test given the presence/absence of disease - e.g sens = p(+|D) = P (+,D)/P (D).But in daily routine what is important to be calculated is the probability of having a disease given a posi-
tive/negative test. This value is the positive/negative predictive value (posterior probability) and can be easily
calculated using Bayes theorem:
p(D|+) =p(+,D) ∗ p(D)
p(+)(2.1)
with
p(+) = p(+|D) ∗ p(D) + p(+| ∼ D) ∗ p(∼ D) (2.2)
where D is the disease outcome and + is the observation of a positive test. Given the usual information
available for the diagnostic test and the disease, this equation could be re-written as:
p(D|+) =sens ∗ prev
sens ∗ prev + (1 − spec) ∗ (1 − prev)(2.3)
For example, considering a disease with a prevalence of 1%, and a test with 99% sensitivity and 60% specificity,
the question is what is the probability of having the disease given a positive test? If we apply the previously
presented Bayes theorem to calculate p(D|+), i.e. the positive predictive value, we obtain the following
posterior probability:
p(D|+) =0.001 ∗ 0.99
0.001 ∗ 0.99 + 0.99 ∗ 0.40= 0.02 (2.4)
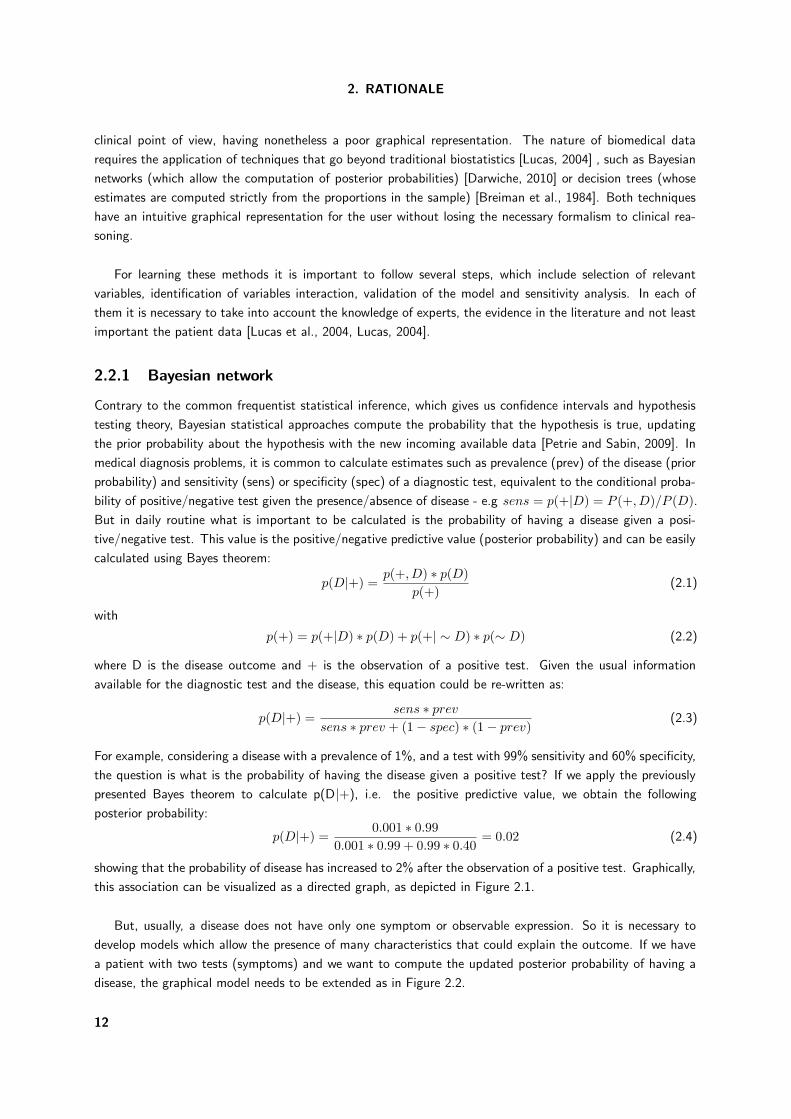
showing that the probability of disease has increased to 2% after the observation of a positive test. Graphically,
this association can be visualized as a directed graph, as depicted in Figure 2.1.
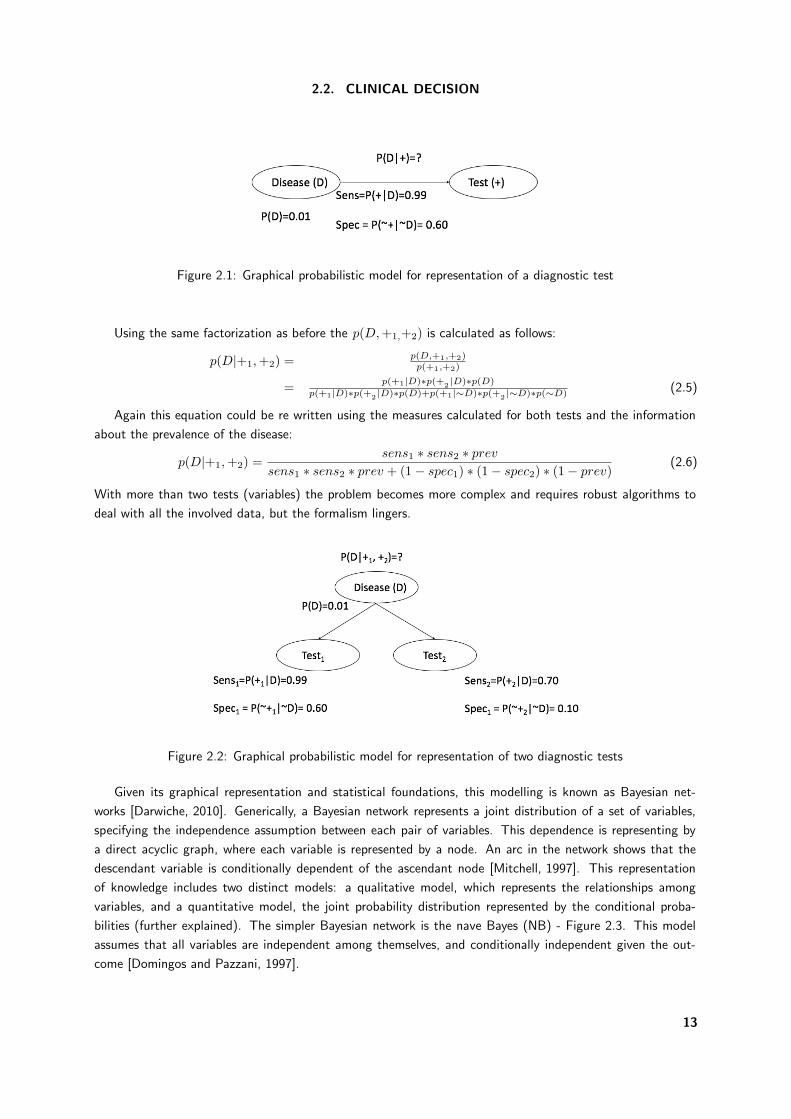
But, usually, a disease does not have only one symptom or observable expression. So it is necessary to
develop models which allow the presence of many characteristics that could explain the outcome. If we have
a patient with two tests (symptoms) and we want to compute the updated posterior probability of having a
disease, the graphical model needs to be extended as in Figure 2.2.
12
2.2. CLINICAL DECISION
Figure 2.1: Graphical probabilistic model for representation of a diagnostic test
Using the same factorization as before the p(D, +1,+2) is calculated as follows:
p(D|+1,+2) = p(D,+1,+2)p(+1,+2)
= p(+1|D)∗p(+2 |D)∗p(D)p(+1|D)∗p(+2 |D)∗p(D)+p(+1|∼D)∗p(+2 |∼D)∗p(∼D) (2.5)
Again this equation could be re written using the measures calculated for both tests and the information
about the prevalence of the disease:
p(D|+1,+2) =sens1 ∗ sens2 ∗ prev
sens1 ∗ sens2 ∗ prev + (1 − spec1) ∗ (1 − spec2) ∗ (1 − prev)(2.6)
With more than two tests (variables) the problem becomes more complex and requires robust algorithms to
deal with all the involved data, but the formalism lingers.
Figure 2.2: Graphical probabilistic model for representation of two diagnostic tests
Given its graphical representation and statistical foundations, this modelling is known as Bayesian net-
works [Darwiche, 2010]. Generically, a Bayesian network represents a joint distribution of a set of variables,
specifying the independence assumption between each pair of variables. This dependence is representing by
a direct acyclic graph, where each variable is represented by a node. An arc in the network shows that the
descendant variable is conditionally dependent of the ascendant node [Mitchell, 1997]. This representation
of knowledge includes two distinct models: a qualitative model, which represents the relationships among
variables, and a quantitative model, the joint probability distribution represented by the conditional proba-
bilities (further explained). The simpler Bayesian network is the nave Bayes (NB) - Figure 2.3. This model
assumes that all variables are independent among themselves, and conditionally independent given the out-
come [Domingos and Pazzani, 1997].
13
2. RATIONALE
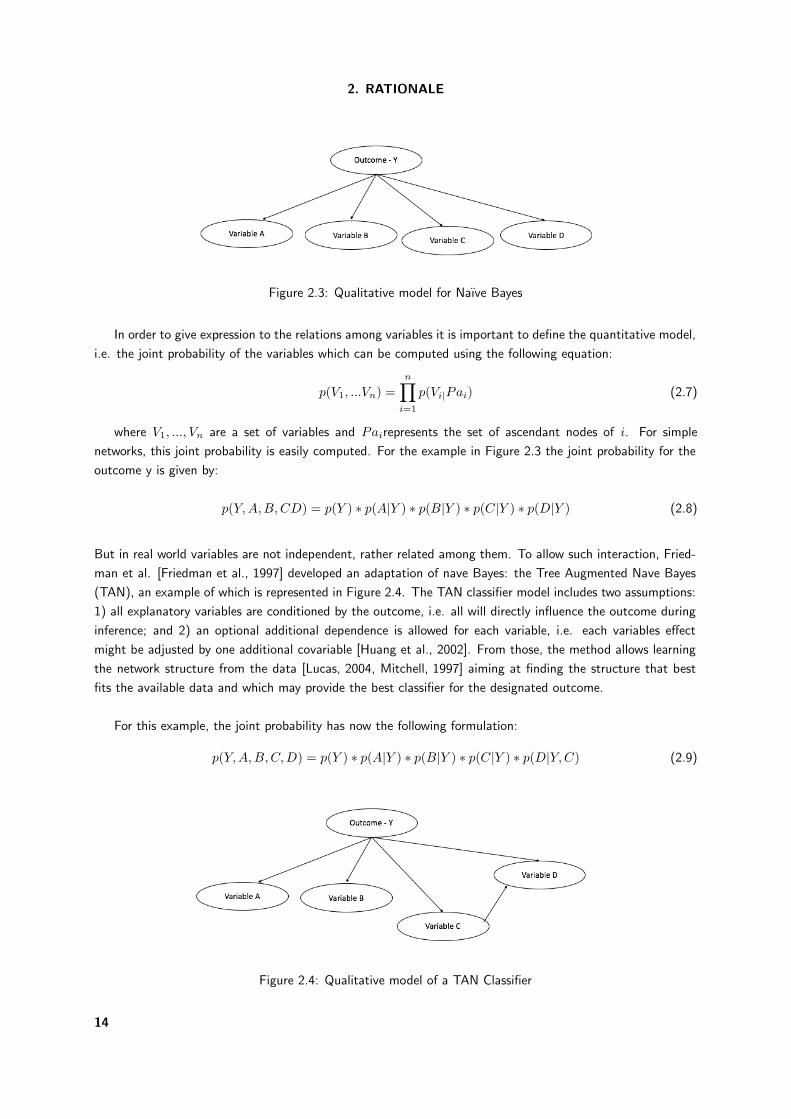
Figure 2.3: Qualitative model for Naıve Bayes
In order to give expression to the relations among variables it is important to define the quantitative model,
i.e. the joint probability of the variables which can be computed using the following equation:
p(V1, ...Vn) =n!
i=1
p(Vi|Pai) (2.7)
where V1, ..., Vn are a set of variables and Pairepresents the set of ascendant nodes of i. For simple
networks, this joint probability is easily computed. For the example in Figure 2.3 the joint probability for the
outcome y is given by:
p(Y,A,B,CD) = p(Y ) ∗ p(A|Y ) ∗ p(B|Y ) ∗ p(C|Y ) ∗ p(D|Y ) (2.8)
But in real world variables are not independent, rather related among them. To allow such interaction, Fried-
man et al. [Friedman et al., 1997] developed an adaptation of nave Bayes: the Tree Augmented Nave Bayes
(TAN), an example of which is represented in Figure 2.4. The TAN classifier model includes two assumptions:
1) all explanatory variables are conditioned by the outcome, i.e. all will directly influence the outcome during
inference; and 2) an optional additional dependence is allowed for each variable, i.e. each variables effect
might be adjusted by one additional covariable [Huang et al., 2002]. From those, the method allows learning
the network structure from the data [Lucas, 2004, Mitchell, 1997] aiming at finding the structure that best
fits the available data and which may provide the best classifier for the designated outcome.
For this example, the joint probability has now the following formulation:
p(Y,A,B,C,D) = p(Y ) ∗ p(A|Y ) ∗ p(B|Y ) ∗ p(C|Y ) ∗ p(D|Y,C) (2.9)
Figure 2.4: Qualitative model of a TAN Classifier
14
2.2. CLINICAL DECISION
Several different topologies and learning algorithms exist, but the TAN has given solid evidence of provid-
ing sound classifiers [Dias et al., 2014, Sakellaropoulos and Nikiforidis, 2000] and knowledge representations
in clinical settings.
Bayesian approaches have an extreme importance in clinical problems, since they provide a qualitative
and quantitative perspective. Additionally, they take into account prior knowledge, making data analysis an
update processing of prior knowledge with observed evidence [Lucas, 2004], making it a very useful tool in the
practice of evidence-based medicine.
2.2.2 Decision tree
A decision tree is a formal knowledge model which uses a divide-and-conquer strategy to solve decision prob-
lems. A complex problem is divided in simpler problems to which the same strategy is applied, recursively.
The solution of sub-problems can afterwards be combined, in the form of a tree, to produce the solution of the
original problem. One advantage of this approach relates with its capacity to divide the instance space into
disjoint subspaces, possibly adjusting different models to each subspace. As other knowledge models, decision
trees are commonly handcrafted by experts. But this idea of defining subspaces allows the rising of automatic
methods to induce the trees from data, and is the basis of all algorithms behind decision tree induction, such
as: ID3 [Quinlan, 1986], which can use the entropy or the information gain to choose the best variable to be
selected at each node; CART [Breiman et al., 1984], which uses the entropy (a negative sum of logarithmic
proportions) to choose the best variable to be selected at each node; or CHAID [Kass, 1980], which uses a
chi-squared test, with Bonferroni correction, instead.
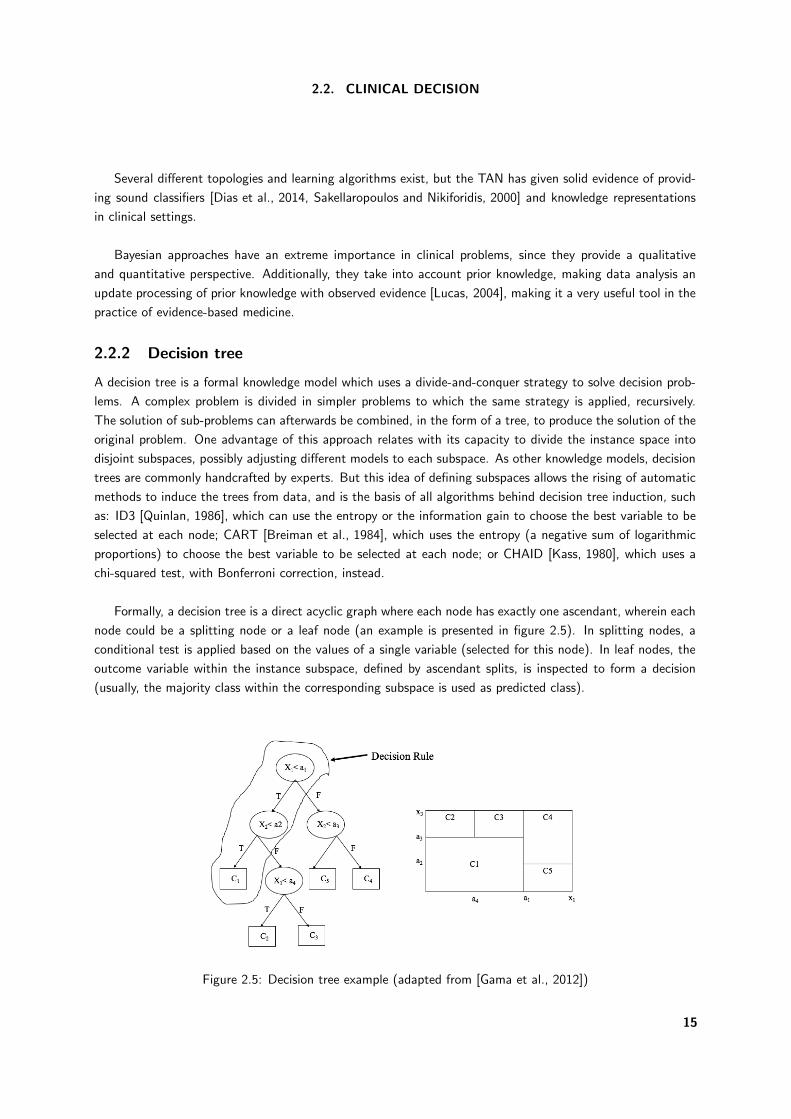
Formally, a decision tree is a direct acyclic graph where each node has exactly one ascendant, wherein each
node could be a splitting node or a leaf node (an example is presented in figure 2.5). In splitting nodes, a
conditional test is applied based on the values of a single variable (selected for this node). In leaf nodes, the
outcome variable within the instance subspace, defined by ascendant splits, is inspected to form a decision
(usually, the majority class within the corresponding subspace is used as predicted class).
Figure 2.5: Decision tree example (adapted from [Gama et al., 2012])
15
2. RATIONALE
Figure 2.5 represents an example of a decision tree and the correspondent split in the space of variables
x1 and x2. Each node of the tree corresponds to a subspace defined by the variables. The areas defined by
the leaves of the tree are mutually exclusive and the union of these areas is the entire instance space. This
way defined, each path traversing the tree defines a decision rule (e.g. if x1 < a1 <x1 and then C1).
2.2.3 Methods of validation
After the development of any model, it is necessary to estimate the performance of the model. In fact, the
generalising ability of the model is related to its capacity to predict cases on an independent sample of new
data [Hastie et al., 2001]. Therefore, the aim of this approach is to estimate the validity of the model by
assessing the expected error associated to it. There are many methods to estimate this validity, as presented
as follows:
Independent external sample to use an independently collected sample of data and compute the predictive
error in it;
Holdout to divide the data into two samples: one used for building the model and the other to compute the
predictive error;
Cross-validation to divide the sample into k exclusive sets of equal size (folds) and assess validity in k models,
each built with k-1 folds and tested in the remaining fold, with the error estimated as the mean of all k
error estimates - this is usually repeated several times to improve the precision of the error estimates;
Leave-one-out a special case of cross-validation, where k=n, with n being the number of cases in the sample.
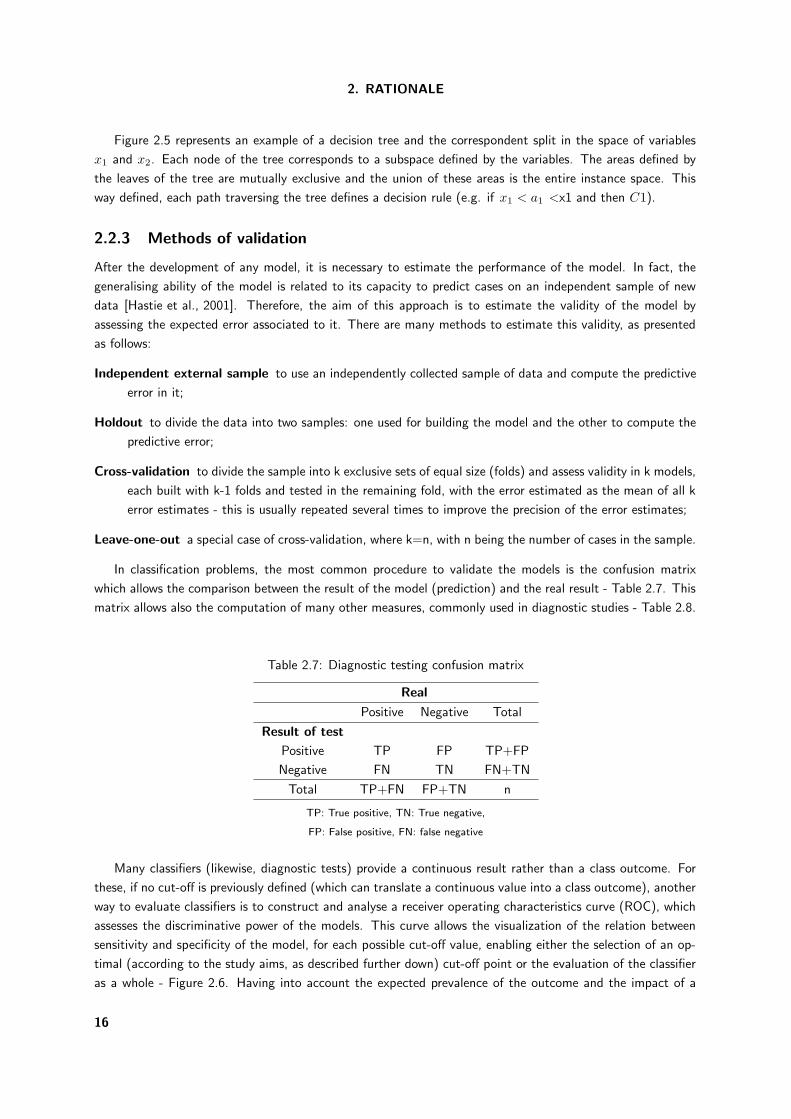
In classification problems, the most common procedure to validate the models is the confusion matrix
which allows the comparison between the result of the model (prediction) and the real result - Table 2.7. This
matrix allows also the computation of many other measures, commonly used in diagnostic studies - Table 2.8.
Table 2.7: Diagnostic testing confusion matrix
Real
Positive Negative Total
Result of test
Positive TP FP TP+FP
Negative FN TN FN+TN
Total TP+FN FP+TN n
TP: True positive, TN: True negative,
FP: False positive, FN: false negative
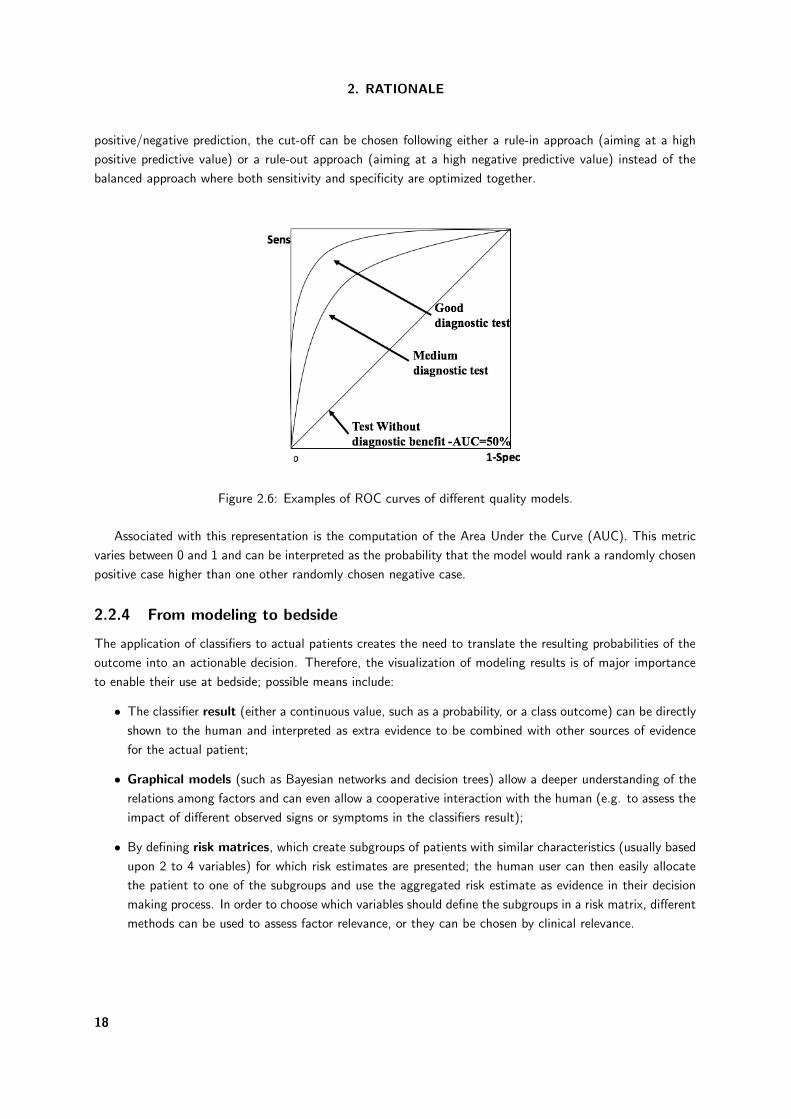
Many classifiers (likewise, diagnostic tests) provide a continuous result rather than a class outcome. For
these, if no cut-off is previously defined (which can translate a continuous value into a class outcome), another
way to evaluate classifiers is to construct and analyse a receiver operating characteristics curve (ROC), which
assesses the discriminative power of the models. This curve allows the visualization of the relation between
sensitivity and specificity of the model, for each possible cut-off value, enabling either the selection of an op-
timal (according to the study aims, as described further down) cut-off point or the evaluation of the classifier
as a whole - Figure 2.6. Having into account the expected prevalence of the outcome and the impact of a
16
2.2. CLINICAL DECISION
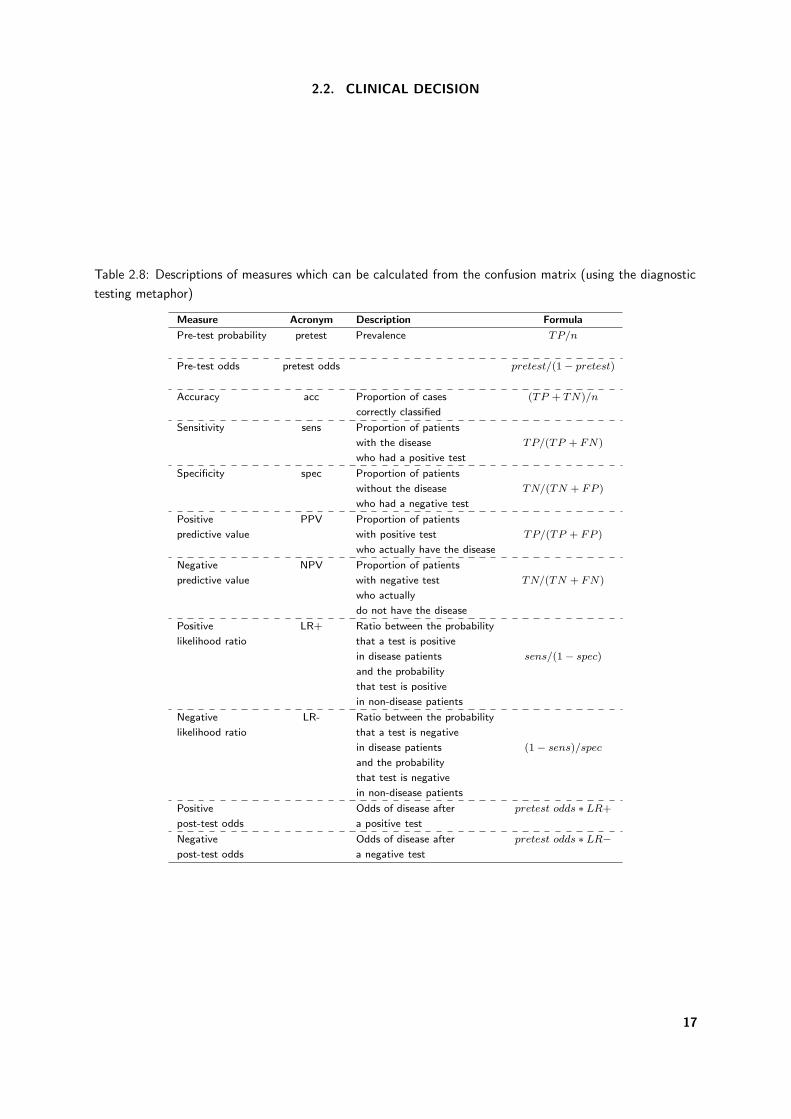
Table 2.8: Descriptions of measures which can be calculated from the confusion matrix (using the diagnostic
testing metaphor)
Measure Acronym Description Formula
Pre-test probability pretest Prevalence TP/n
Pre-test odds pretest odds pretest/(1 − pretest)
Accuracy acc Proportion of cases (TP + TN)/n
correctly classified
Sensitivity sens Proportion of patients
with the disease TP/(TP + FN)
who had a positive test
Specificity spec Proportion of patients
without the disease TN/(TN + FP )
who had a negative test
Positive PPV Proportion of patients
predictive value with positive test TP/(TP + FP )
who actually have the disease
Negative NPV Proportion of patients
predictive value with negative test TN/(TN + FN)
who actually
do not have the disease
Positive LR+ Ratio between the probability
likelihood ratio that a test is positive
in disease patients sens/(1 − spec)
and the probability
that test is positive
in non-disease patients
Negative LR- Ratio between the probability
likelihood ratio that a test is negative
in disease patients (1 − sens)/spec
and the probability
that test is negative
in non-disease patients
Positive Odds of disease after pretest odds ∗ LR+
post-test odds a positive test
Negative Odds of disease after pretest odds ∗ LR−post-test odds a negative test
17
2. RATIONALE
positive/negative prediction, the cut-off can be chosen following either a rule-in approach (aiming at a high
positive predictive value) or a rule-out approach (aiming at a high negative predictive value) instead of the
balanced approach where both sensitivity and specificity are optimized together.
Figure 2.6: Examples of ROC curves of different quality models.
Associated with this representation is the computation of the Area Under the Curve (AUC). This metric
varies between 0 and 1 and can be interpreted as the probability that the model would rank a randomly chosen
positive case higher than one other randomly chosen negative case.
2.2.4 From modeling to bedside
The application of classifiers to actual patients creates the need to translate the resulting probabilities of the
outcome into an actionable decision. Therefore, the visualization of modeling results is of major importance
to enable their use at bedside; possible means include:
• The classifier result (either a continuous value, such as a probability, or a class outcome) can be directly
shown to the human and interpreted as extra evidence to be combined with other sources of evidence
for the actual patient;
• Graphical models (such as Bayesian networks and decision trees) allow a deeper understanding of the
relations among factors and can even allow a cooperative interaction with the human (e.g. to assess the
impact of different observed signs or symptoms in the classifiers result);
• By defining risk matrices, which create subgroups of patients with similar characteristics (usually based
upon 2 to 4 variables) for which risk estimates are presented; the human user can then easily allocate
the patient to one of the subgroups and use the aggregated risk estimate as evidence in their decision
making process. In order to choose which variables should define the subgroups in a risk matrix, different
methods can be used to assess factor relevance, or they can be chosen by clinical relevance.
18

3. Objectives


3. Objectives
This thesis has three main goals:
Goal 1: Evidence (Chapter 4)
The first aim of this thesis is to summarize the evidence regarding Crohn’s disease and ulcerative
colitis outcomes and corresponding associated factors, limited to clinical and demographical data.
Goal 2: Classification (Chapter 5)
The second aim of this thesis is to identify and assess risk factors for outcomes identified in Goal
1 for Crohn’s disease, using an independent cohort of patients.
Goal 3: Prediction (Chapter 6)
The third aim of this thesis is to develop and validate prognostic models for outcomes identified
in Goal 1, with risk factors isolated in Goals 1 and 2.
21


4. Evidence

4. Evidence
The first aim of this thesis is to summarize the evidence regarding Crohn’s disease and ulcerative colitis
outcomes and corresponding associated factors, limited to clinical and demographical data. Factors such as
age at diagnosis, perianal disease, initial use of steroids and disease location were identified as independent
factors of disabling disease for Crohn’s patients. Concerning ulcerative colitis, gender, smoking habits, disease
extent, need for corticosteroids and hospitalization were associated with colectomy.
Two studies were conducted:
Prognostic factors for disabling Crohn’s disease: a systematic review and meta-analysis.
World Journal of Gastroentereology 19(24): 3866-71, 2013.
Claudia Camila Dias, Pedro Pereira Rodrigues, Altamiro da Costa Pereira, Fernando Magro
Clinical Predictors of colectomy in patients with ulcerative colitis: systematic review and meta-
analysis of cohort studies.
Journal of Crohn’s and Colitis, 9(2): 156-163, 2015
Claudia Camila Dias, Pedro Pereira Rodrigues, Altamiro da Costa Pereira, Fernando Magro
25
4. EVIDENCE
4.1 Prognostic factors for disabling Crohn’s disease: a systematic
review and meta-analysis
World Journal of Gastroentereology 19(24): 3866-71, 2013.
Claudia Camila Dias, Pedro Pereira Rodrigues, Altamiro da Costa Pereira, Fernando Magro
26
META-ANALYSIS
Clinical prognostic factors for disabling Crohn's disease: A systematic review and meta-analysis
Cláudia Camila Dias, Pedro Pereira Rodrigues, Altamiro da Costa-Pereira, Fernando Magro
World J Gastroenterol 2013 June 28; 19(24): 3866-3871ISSN 1007-9327 (print) ISSN 2219-2840 (online)
© 2013 Baishideng. All rights reserved.
Online Submissions: http://www.wjgnet.com/esps/[email protected]:10.3748/wjg.v19.i24.3866
3866 June 28, 2013|Volume 19|Issue 24|WJG|www.wjgnet.com
Cláudia Camila Dias, Pedro Pereira Rodrigues, Altamiro da Costa Pereira, Health Information and Decision Sciences
Department, Faculty of Medicine, University of Porto, 4200-319
Porto, Portugal
Cláudia Camila Dias, Pedro Pereira Rodrigues, Altamiro da Costa Pereira, Centre for Research in Health Informatics Sys-
tems and Technologies (CINTESIS), 4200-319 Porto, Portugal
Pedro Pereira Rodrigues, Laboratory of Artificial Intelligence
and Decision Support, INESC TEC, Artificial Intelligence and
Decision Support Laboratory, 4200-465 Porto, Portugal
Fernando Magro, Centro Hospital de São João, Institute of
Pharmacology and Therapeutics, Faculty of Medicine, Univer-
sity of Porto, 4200-319 Porto, Portugal
Fernando Magro, Institute for Molecular and Cell Biology
(IBMC), 4150-180 Porto, Portugal
Author contributions: Dias CC was involved in the concep-
tion and design of the study, acquisition, analysis and interpre-
tation of data, and was responsible for drafting the manuscript;
Rodrigues PP was involved in the analysis and interpretation
of data and drafting the manuscript; da Costa-Pereira A was
involved in interpretation of data and critically revising the
manuscript; Magro F was involved in the conception and design
of the study, interpretation of data, and drafting and revised the
manuscript; all authors read and approved the final manuscript.
Supported by Centre for Research in Health Informatics Sys-
tems and Technologies (CINTESIS)
Correspondence to: Fernando Magro, MD, PhD, Centro Hos-
pital de São João, Institute of Pharmacology and Therapeutics,
Faculty of Medicine, University of Porto, Alameda Prof Hernâni
Monteiro, 4200-319 Porto, Portugal. [email protected]
Telephone: +351-225-513642 Fax: +351-225-513643
Received: December 1, 2012 Revised: December 20, 2012
Accepted: February 7, 2013
Published online: June 28, 2013
AbstractAIM: To identify demographic and clinical factors asso-ciated with disabling Crohn’s disease (CD).
METHODS: A systematic review and meta-analysis
of observational studies, focusing on the factors that can predict the prognosis of different outcomes of CD was undertaken. PubMed, ISI Web of Knowledge and Scopus were searched to identify studies investigat-ing the above mentioned factors in adult patients with CD. Studies were eligible for inclusion if they describe prognostic factors in CD, with inclusion and exclusion criteria defined as follows. Studies with adult patients and CD, written in English and studying association between clinical factors and at least one prognosis out-come were included. Meta-analysis of effects was un-dertaken for the disabling disease outcome, using odds ratio (OR) to assess the effect of the different factors in the outcome. The statistical method used was Mantel-Haenszel for fixed effects. The 16-item quality assess-ment tool (QATSDD) was used to assess the quality of the studies (range: 0-42).
RESULTS: Of the 913 papers initially selected, sixty studies were reviewed and three were included in the systematic review and meta-analysis. The global QA-TSDD scores of papers were 18, 21 and 22. Of a total of 1961 patients enrolled, 1332 (78%) were classified with disabling disease five years after diagnosis. In two studies, age at diagnosis was a factor associated with disabling disease five years after diagnosis. Individu-als under 40 years old had a higher risk of developing disabling disease. In two studies, patients who were treated with corticosteroids on the first flare developed disabling disease five years after diagnosis. Further, perianal disease was found to be relevant in all of the studies at two and five years after diagnosis. Finally, one study showed localization as a factor associated with disabling disease five years after diagnosis, with L3 being a higher risk factor. This meta-analysis showed a significantly higher risk of developing disabling dis-ease at five years after initial diagnosis among patients younger than 40 years of age (OR = 2.47, 95%CI: 1.74-3.51), with initial steroid treatment for first flare (OR = 2.42, 95%CI: 1.87-3.11) and with perianal dis-ease (OR = 2.00, 95%CI: 1.41-2.85).
4.1. PROGNOSTIC FACTORS FOR DISABLING CROHN’S DISEASE: A SYSTEMATICREVIEW AND META-ANALYSIS
27
Dias CC et al . Disabling Crohn's disease
3867 June 28, 2013|Volume 19|Issue 24|WJG|www.wjgnet.com
CONCLUSION: Age at diagnosis, perianal disease, ini-tial use of steroids and localization seem to be indepen-dent prognostic factors of disabling disease.
© 2013 Baishideng. All rights reserved.
Key words: Crohn’s disease; Disabling disease; Prognos-tic factors; Outcome; Systematic review; Meta-analysis
Dias CC, Rodrigues PP, da Costa-Pereira A, Magro F. Clinical
prognostic factors for disabling Crohn’s disease: A system-
atic review and meta-analysis. World J Gastroenterol 2013;
19(24): 3866-3871 Available from: URL: http://www.wjgnet.
com/1007-9327/full/v19/i24/3866.htm DOI: http://dx.doi.
org/10.3748/wjg.v19.i24.3866
INTRODUCTIONCrohn’s disease (CD) occurs in equal proportion in both genders and its incidence has been growing worldwide in the last decades[1]. CD is a disabling disease affecting psychological, familial, and social dimensions of life[2]. Therefore, the need to develop a specific instrument able to evaluate disabilities and identify specific fac-tors as predictors is paramount. This is particularly true since in the last decades the medical treatment options have been dramatically changed. Other strategies are now approaching, namely accelerate step-up and top-down treatment[3]. The top-down strategy is based on the very early use of intensive therapy (immunosuppres-sants and/or biologics) to maintain a good quality of life from the first flare-up of the disease and prevent any ir-reversible consequences[3]. Therefore, it is now crucial to identify simple clinical criteria at diagnosis to predict CD outcome. This work aims to systematically review the evidence with respect to predictive clinical prognostic factors for CD.
MATERIALS AND METHODSA systematic review and meta-analysis of observational studies focusing on the factors that can predict the prog-nosis of different outcomes of CD was undertaken. The methodology included the definition of eligibility crite-ria, search strategies, study selection and characteristics, outcome measures, quantitative data synthesis and sen-sitivity analysis, methodological quality of studies, and statistical data analysis.
Eligibility criteria
Studies that described prognostic factors in CD were eligible for inclusion. The criteria for inclusion were studies with adult patients and CD written in English and studying association between clinical factors and dis-abling disease. Studies not in English, without available abstract, with genetic or serologic factors, biomarker studies, or those addressing diagnosis or quality of life were excluded.
Search strategy
The main method to search for the eligible articles was a broad literature search using PubMed with the follow-ing keywords and MeSH terms: “crohn disease”[MeSH Terms] OR “crohn”[All Fields] AND predictor [All Fields] OR predictors [All Fields] OR predict [All Fields] OR “prog-nostic factor” [All Fields] OR “prognostic factors” [All Fields]. Literature searches were also undertaken in Scopus data-base and ISI Web of Knowledge using the same search keywords: crohn disease AND (predictors OR predict OR prog-nostic factors).
Study selection
The studies were screened and selected by two reviewers. First, all titles and abstracts were read and the inclusion and exclusion criteria were applied. Second, the reviewers read the full text of all papers considered for inclusion after abstract selection, again applying the inclusion and exclusion criteria.
Study characteristics
The following properties of each study were recorded: total number of patients, prognostic variables, and per-centage of patients with disabling disease.
Outcome measures
The aim of the study is to assess prognostic factors to predict disabling CD.
Methodological quality of included studies
The 16-item quality assessment tool (QATSDD), devel-oped by Higgins et al[4], was used to assess the quality of the included studies. This tool includes 16 items, scored between 0 and 3, and can be applied to different types of studies using different approaches. However, two of the items were not evaluated as they only address qualitative studies, hence we only considered a maximum score of 42.
Statistical analysis
Statistical evidence of effects is presented as described in the original studies. Meta-analysis of effects was un-dertaken for the disabling disease outcome using odds ratio (OR) to assess the effect of the different factors in the outcome. The statistical method used was Mantel-Haenszel for fixed effects. All included estimates are recomputed from original articles descriptions, potentially resulting in slightly different values. All reported P-values are 2-sided with a significance level of 5%. Statistical het-erogeneity was assessed with the I2 statistic; values higher than 50% indicate a substantial level of heterogeneity
[5]. RevMan v5.1 (The Nordic Cochrane Center, The Cochrane
Collaboration, 2011) was used to calculate OR and 95%CI for disabling disease and to derived forest plots showing the results of individual studies and pooled analysis.
RESULTSSearch and study selection
A total of 913 articles were identified using the search
4. EVIDENCE
28
3868 June 28, 2013|Volume 19|Issue 24|WJG|www.wjgnet.com
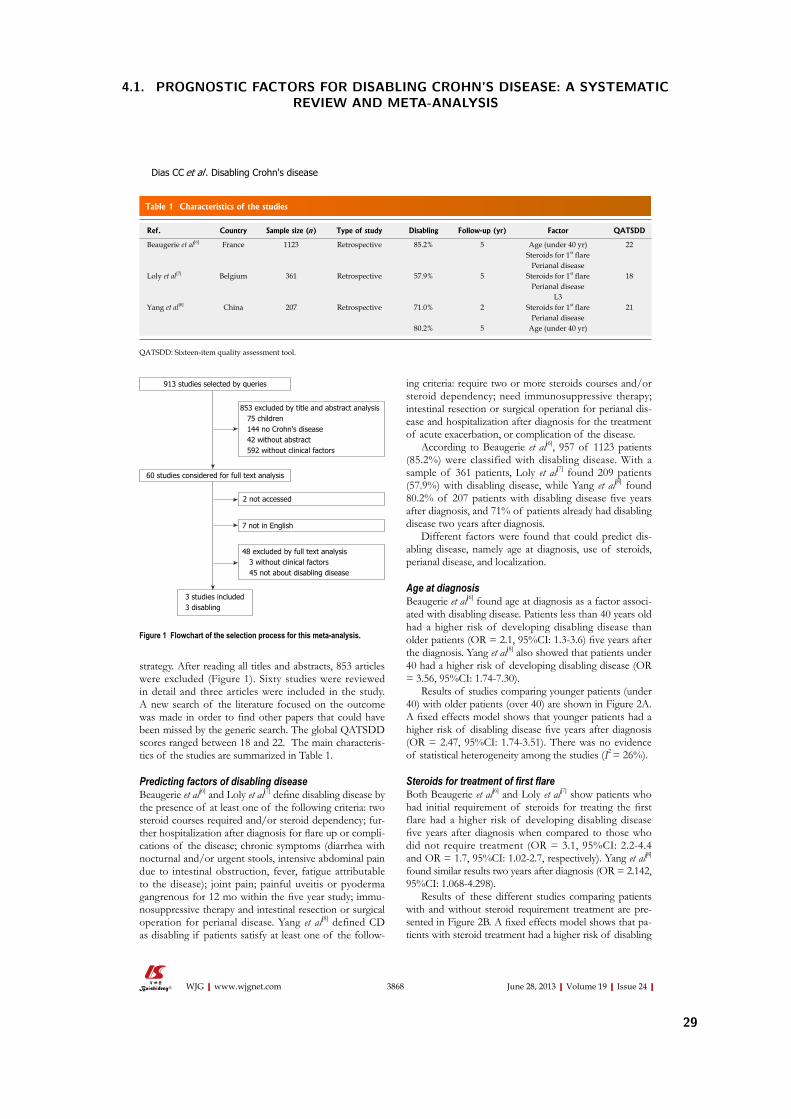
strategy. After reading all titles and abstracts, 853 articles
were excluded (Figure 1). Sixty studies were reviewed in detail and three articles were included in the study. A new search of the literature focused on the outcome was made in order to find other papers that could have
been missed by the generic search. The global QATSDD scores ranged between 18 and 22. The main characteris-tics of the studies are summarized in Table 1.
Predicting factors of disabling disease
Beaugerie et al[6] and Loly et al[7] define disabling disease by
the presence of at least one of the following criteria: two steroid courses required and/or steroid dependency; fur-ther hospitalization after diagnosis for flare up or compli-cations of the disease; chronic symptoms (diarrhea with nocturnal and/or urgent stools, intensive abdominal pain due to intestinal obstruction, fever, fatigue attributable to the disease); joint pain; painful uveitis or pyoderma gangrenous for 12 mo within the five year study; immu-nosuppressive therapy and intestinal resection or surgical operation for perianal disease. Yang et al[8] defined CD as disabling if patients satisfy at least one of the follow-
ing criteria: require two or more steroids courses and/or steroid dependency; need immunosuppressive therapy; intestinal resection or surgical operation for perianal dis-ease and hospitalization after diagnosis for the treatment of acute exacerbation, or complication of the disease.
According to Beaugerie et al[6], 957 of 1123 patients
(85.2%) were classified with disabling disease. With a
sample of 361 patients, Loly et al[7] found 209 patients (57.9%) with disabling disease, while Yang et al[8] found 80.2% of 207 patients with disabling disease five years
after diagnosis, and 71% of patients already had disabling
disease two years after diagnosis. Different factors were found that could predict dis-
abling disease, namely age at diagnosis, use of steroids, perianal disease, and localization.
Age at diagnosis
Beaugerie et al[6] found age at diagnosis as a factor associ-ated with disabling disease. Patients less than 40 years old had a higher risk of developing disabling disease than older patients (OR = 2.1, 95%CI: 1.3-3.6) five years after
the diagnosis. Yang et al[8] also showed that patients under 40 had a higher risk of developing disabling disease (OR = 3.56, 95%CI: 1.74-7.30).
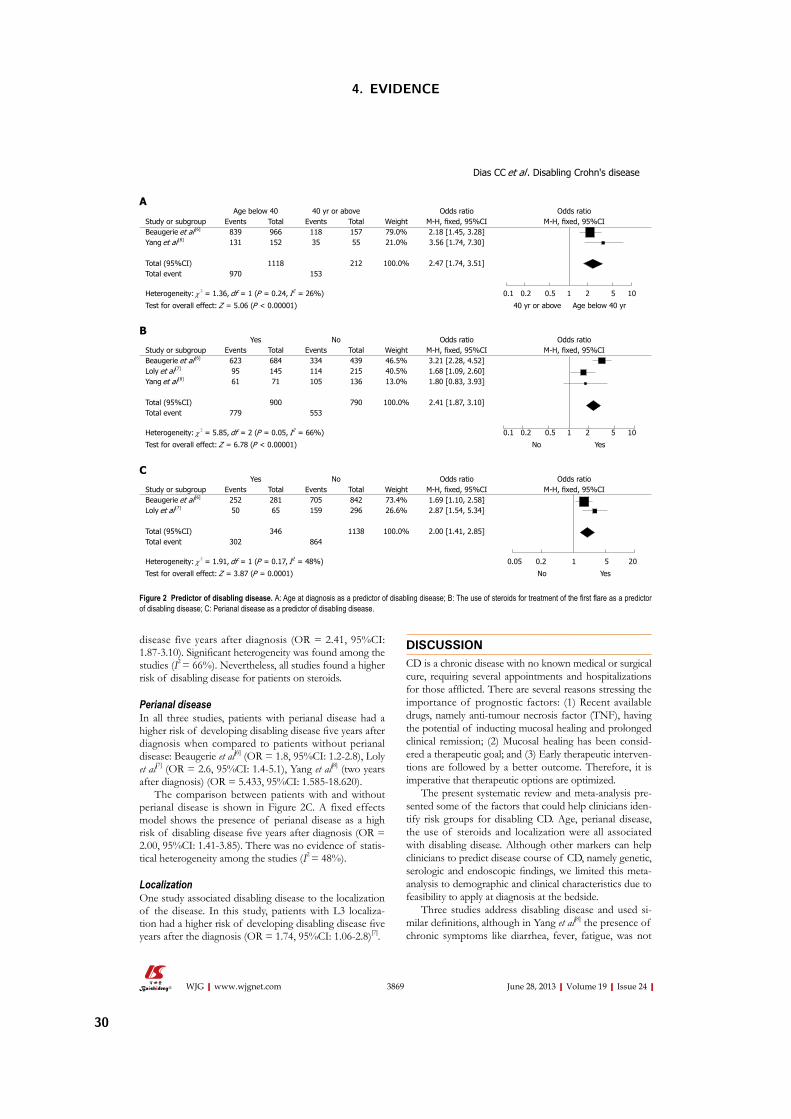
Results of studies comparing younger patients (under 40) with older patients (over 40) are shown in Figure 2A. A fixed effects model shows that younger patients had a
higher risk of disabling disease five years after diagnosis
(OR = 2.47, 95%CI: 1.74-3.51). There was no evidence
of statistical heterogeneity among the studies (I2 = 26%).
Steroids for treatment of first flare Both Beaugerie et al[6] and Loly et al[7] show patients who had initial requirement of steroids for treating the first
flare had a higher risk of developing disabling disease five years after diagnosis when compared to those who
did not require treatment (OR = 3.1, 95%CI: 2.2-4.4
and OR = 1.7, 95%CI: 1.02-2.7, respectively). Yang et al[8] found similar results two years after diagnosis (OR = 2.142, 95%CI: 1.068-4.298).
Results of these different studies comparing patients with and without steroid requirement treatment are pre-sented in Figure 2B. A fixed effects model shows that pa-tients with steroid treatment had a higher risk of disabling
913 studies selected by queries
60 studies considered for full text analysis
2 not accessed
3 studies included3 disabling
7 not in English
853 excluded by title and abstract analysis 75 children 144 no Crohn's disease 42 without abstract 592 without clinical factors
48 excluded by full text analysis 3 without clinical factors 45 not about disabling disease
Figure 1 Flowchart of the selection process for this meta-analysis.
Table 1 Characteristics of the studies
Ref. Country Sample size (n ) Type of study Disabling Follow-up (yr) Factor QATSDD
Beaugerie et al[6] France 1123 Retrospective 85.2% 5 Age (under 40 yr) 22Steroids for 1st flare
Perianal diseaseLoly et al[7] Belgium 361 Retrospective 57.9% 5 Steroids for 1st flare 18
Perianal diseaseL3
Yang et al[8] China 207 Retrospective 71.0% 2 Steroids for 1st flare 21Perianal disease
80.2% 5 Age (under 40 yr)
QATSDD: Sixteen-item quality assessment tool.
Dias CC et al . Disabling Crohn's disease
4.1. PROGNOSTIC FACTORS FOR DISABLING CROHN’S DISEASE: A SYSTEMATICREVIEW AND META-ANALYSIS
29
3869 June 28, 2013|Volume 19|Issue 24|WJG|www.wjgnet.com
disease five years after diagnosis (OR = 2.41, 95%CI:
1.87-3.10). Significant heterogeneity was found among the
studies (I2 = 66%). Nevertheless, all studies found a higher
risk of disabling disease for patients on steroids.
Perianal disease
In all three studies, patients with perianal disease had a higher risk of developing disabling disease five years after
diagnosis when compared to patients without perianal disease: Beaugerie et al[6]
(OR = 1.8, 95%CI: 1.2-2.8), Loly
et al[7] (OR = 2.6, 95%CI: 1.4-5.1), Yang et al[8] (two years
after diagnosis) (OR = 5.433, 95%CI: 1.585-18.620).
The comparison between patients with and without perianal disease is shown in Figure 2C. A fixed effects model shows the presence of perianal disease as a high risk of disabling disease five years after diagnosis (OR =
2.00, 95%CI: 1.41-3.85). There was no evidence of statis-tical heterogeneity among the studies (I2
= 48%).
Localization
One study associated disabling disease to the localization of the disease. In this study, patients with L3 localiza-tion had a higher risk of developing disabling disease five
years after the diagnosis (OR = 1.74, 95%CI: 1.06-2.8)[7].
DISCUSSIONCD is a chronic disease with no known medical or surgical cure, requiring several appointments and hospitalizations for those afflicted. There are several reasons stressing the
importance of prognostic factors: (1) Recent available drugs, namely anti-tumour necrosis factor (TNF), having
the potential of inducting mucosal healing and prolonged clinical remission; (2) Mucosal healing has been consid-ered a therapeutic goal; and (3) Early therapeutic interven-tions are followed by a better outcome. Therefore, it is imperative that therapeutic options are optimized.
The present systematic review and meta-analysis pre-sented some of the factors that could help clinicians iden-tify risk groups for disabling CD. Age, perianal disease, the use of steroids and localization were all associated with disabling disease. Although other markers can help clinicians to predict disease course of CD, namely genetic, serologic and endoscopic findings, we limited this meta-
analysis to demographic and clinical characteristics due to feasibility to apply at diagnosis at the bedside.
Three studies address disabling disease and used si-milar definitions, although in Yang et al[8] the presence of chronic symptoms like diarrhea, fever, fatigue, was not
Age below 40 40 yr or above Odds ratio Odds ratioStudy or subgroup Events Total Events Total Weight M-H, fixed, 95%CI M-H, fixed, 95%CIBeaugerie et al [6] 839 966 118 157 79.0% 2.18 [1.45, 3.28]Yang et al [8] 131 152 35 55 21.0% 3.56 [1.74, 7.30]
Total (95%CI) 1118 212 100.0% 2.47 [1.74, 3.51]Total event 970 153
Heterogeneity: χ 2 = 1.36, df = 1 (P = 0.24, I2 = 26%) 0.1 0.2 0.5 1 2 5 10
Test for overall effect: Z = 5.06 (P < 0.00001) 40 yr or above Age below 40 yr
A
Yes No Odds ratio Odds ratioStudy or subgroup Events Total Events Total Weight M-H, fixed, 95%CI M-H, fixed, 95%CIBeaugerie et al [6] 623 684 334 439 46.5% 3.21 [2.28, 4.52]Loly et al [7] 95 145 114 215 40.5% 1.68 [1.09, 2.60]Yang et al [8] 61 71 105 136 13.0% 1.80 [0.83, 3.93]
Total (95%CI) 900 790 100.0% 2.41 [1.87, 3.10]Total event 779 553
Heterogeneity: χ 2 = 5.85, df = 2 (P = 0.05, I2 = 66%) 0.1 0.2 0.5 1 2 5 10
Test for overall effect: Z = 6.78 (P < 0.00001) No Yes
B
Yes No Odds ratio Odds ratioStudy or subgroup Events Total Events Total Weight M-H, fixed, 95%CI M-H, fixed, 95%CIBeaugerie et al [6] 252 281 705 842 73.4% 1.69 [1.10, 2.58]Loly et al [7] 50 65 159 296 26.6% 2.87 [1.54, 5.34]
Total (95%CI) 346 1138 100.0% 2.00 [1.41, 2.85]Total event 302 864
Heterogeneity: χ 2 = 1.91, df = 1 (P = 0.17, I2 = 48%) 0.05 0.2 1 5 20
Test for overall effect: Z = 3.87 (P = 0.0001) No Yes
C
Figure 2 Predictor of disabling disease. A: Age at diagnosis as a predictor of disabling disease; B: The use of steroids for treatment of the first flare as a predictor
of disabling disease; C: Perianal disease as a predictor of disabling disease.
Dias CC et al . Disabling Crohn's disease
4. EVIDENCE
30
3870 June 28, 2013|Volume 19|Issue 24|WJG|www.wjgnet.com
considered. All studies were retrospective and the num-ber of patients in each study ranged from 207 to 1123[6,8]. It was clear that a large number of patients had disabling disease (range: 59%-81%), which gives an indication of
the severity of the disease. Moreover, the study with the highest percentage of disabling disease included the least amount of defining characteristics
[8]. Our meta-analysis showed that patients under 40 years old and patients with an initial requirement of steroids, or patients with perianal disease had a higher risk of having disabling dis-ease five years following initial diagnosis. These results
are in line with the three studies used in the meta-analy-sis[6-8]. Although the definition of disabling disease in Yang
et al[8] is slightly different, this study had a lower weight in the final result of the meta-analysis, hence limiting the pos-sible bias. Even though the effect of age at diagnosis was clear in the meta-analysis; further studies are necessary to better assess relative CD risk, including an evaluation of more patients diagnosed after the age threshold. We call into question some of the recent points included in dis-ability definition, namely steroids following the first flare,
the need for immunosuppressants, and surgery. The per-centage of patients treated with steroids in the first flare
(65%) in Beaugerie et al[6] was very similar to the percent-age of patients who received steroids within in the first
year of disease in the North-European population-based
study, however this only reflects the step-up strategy, and
the population on immunosuppressants was very low[9]. Markowitz et al[10] showed children requiring steroids for the treatment of the first flare-up that a very early use
of 6-Mercaptopurine was associated with steroid sparing and a more favorable clinical outcome in the 18-mo pe-riod following diagnosis. Similar results were observed in those treated with anti-TNF in the first two years of dis-ease[11]. Finally, the role of early surgery in limiting ileal disease with regard to CD prognosis is also debatable. In conclusion, the risk factors analyzed in this meta-analysis should be considered when new scores or approaches are taken concerning risk factors in CD outcome, par-ticularly when more early therapeutic approaches are im-minent.
The QATSDD scale, developed by Sirriyeh et al[5], allows the comparison of the quality of the included papers even when their designs are different. The included papers con-sistently presented low quality scores, especially considering the representativeness of the sample and the absence of a critical discussion of strengths and limitations.
The results of this study may need further confirma-tion due to the small number of reviewed studies and their low quality (maximum QATSDD score of 22 out of 42). Nevertheless, this work presents a step-forward
in the definition of clinical predictors for disabling CD,
exposing their relevance and impact in disease prognosis. In summary, this review and meta-analysis showed that
age, perianal disease and the use of steroids are associated with disabling disease. The use of these factors in build-ing predictive models for CD prognosis could enhance the initial clinical approach, and therefore improve the clinical
outcome of patients with severe disease. However, more elaborate and precise definitions of disabling and severe dis-ease are needed.
COMMENTSBackground
Crohn’s disease (CD) occurs in equal proportion in both genders and its in-cidence has been growing worldwide in the last decades. CD is a disabling disease affecting psychological, familial, and social dimensions of life. There-fore, the need to develop a specific instrument able to evaluate disabilities and
identify specific factors as predictors is paramount.
Research frontiers
The top-down strategy is based on the very early use of intensive therapy (im-munosuppressants and/or biologics) to maintain a good quality of life from the first flare-up of the disease and prevent any irreversible consequences. There-fore, it is now crucial to identify simple clinical criteria at diagnosis to predict CD outcome.Innovations and breakthroughs
This work aims to systematically review the evidence with respect to predictive clinical prognostic factors for CD. Applications
This review and meta-analysis showed that age, perianal disease and the use of steroids are associated with disabling disease. The use of these factors in building predictive models for CD prognosis could enhance the initial clinical approach, and therefore improve the clinical outcome of patients with severe disease. However, more elaborate and precise definitions of disabling and se-vere disease are needed. Peer review
It is one of the first work searching the role of CD in disability of the patient. The
authors performed an extensive review of multiple manuscript related with the topic. The manuscript is very well prepared and written and can be accepted for publication.
REFERENCES1 Peyrin-Biroulet L, Loftus EV, Colombel JF, Sandborn WJ.
The natural history of adult Crohn’s disease in population-based cohorts. Am J Gastroenterol 2010; 105: 289-297 [PMID: 19861953 DOI: 10.1038/ajg.2009.579]
2 Casellas F, López-Vivancos J, Vergara M, Malagelada J. Im-pact of inflammatory bowel disease on health-related qual-ity of life. Dig Dis 1999; 17: 208-218 [PMID: 10754360 DOI: 10.1159/000016938]
3 Devlin SM, Panaccione R. Evolving inflammatory bowel disease treatment paradigms: top-down versus step-up. Med Clin North Am 2010; 94: 1-18 [PMID: 19944795 DOI: 10.1016/j.mcna.2009.08.017]
4 Higgins JP, Thompson SG, Deeks JJ, Altman DG. Measur-ing inconsistency in meta-analyses. BMJ 2003; 327: 557-560 [PMID: 12958120]
5 Sirriyeh R, Lawton R, Gardner P, Armitage G. Reviewing studies with diverse designs: the development and evalua-tion of a new tool. J Eval Clin Pract 2012; 18: 746-752 [PMID: 21410846]
6 Beaugerie L, Seksik P, Nion-Larmurier I, Gendre JP, Cosnes J. Predictors of Crohn’s disease. Gastroenterology 2006; 130: 650-656 [PMID: 16530505 DOI: 10.1053/j.gastro.2005.12.019]
7 Loly C, Belaiche J, Louis E. Predictors of severe Crohn’s dis-ease. Scand J Gastroenterol 2008; 43: 948-954 [PMID: 19086165 DOI: 10.1080/00365520801957149]
8 Yang CH, Ding J, Gao Y, Chen X, Yang ZB, Xiao SD. Risk factors that predict the requirement of aggressive therapy among Chinese patients with Crohn’s disease. J Dig Dis 2011; 12: 99-104 [PMID: 21401894 DOI: 10.1111/j.1751-2980. 2011.00484.x]
COMMENTS
Dias CC et al . Disabling Crohn's disease
4.1. PROGNOSTIC FACTORS FOR DISABLING CROHN’S DISEASE: A SYSTEMATICREVIEW AND META-ANALYSIS
31
3871 June 28, 2013|Volume 19|Issue 24|WJG|www.wjgnet.com
9 Munkholm P, Langholz E, Davidsen M, Binder V. Frequen-cy of glucocorticoid resistance and dependency in Crohn’s disease. Gut 1994; 35: 360-362 [PMID: 8150347 DOI: 10.1136/gut.35.3.360]
10 Markowitz J, Grancher K, Kohn N, Lesser M, Daum F. A multicenter trial of 6-mercaptopurine and prednisone in children with newly diagnosed Crohn’s disease. Gastroen-terology 2000; 119: 895-902 [PMID: 11040176 DOI: 10.1053/
gast.2000.18144]11 Feagan BG, Panaccione R, Sandborn WJ, D’Haens GR, Sch-
reiber S, Rutgeerts PJ, Loftus EV, Lomax KG, Yu AP, Wu EQ, Chao J, Mulani P. Effects of adalimumab therapy on incidence of hospitalization and surgery in Crohn’s disease: results from the CHARM study. Gastroenterology 2008; 135: 1493-1499 [PMID: 18848553 DOI: 10.1053/j.gastro.2008. 07.069]
P- Reviewers Perakath B, Rodriguez DCS- Editor Gou SX L- Editor A E- Editor Xiong L
Dias CC et al . Disabling Crohn's disease
4. EVIDENCE
32
4.2. CLINICAL PREDICTORS OF COLECTOMY IN PATIENTS WITH ULCERATIVE COLITIS:SYSTEMATIC REVIEW AND META-ANALYSIS OF COHORT STUDIES
4.2 Clinical predictors of colectomy in patients with ulcerative colitis:
systematic review and meta-analysis of cohort studies
Journal of Crohn’s and Colitis, 9(2): 156-163, 2015
Claudia Camila Dias, Pedro Pereira Rodrigues, Altamiro da Costa Pereira, Fernando Magro
33
Copyright © 2014 European Crohn’s and Colitis Organisation (ECCO). Published by Oxford University Press. All rights reserved. For permissions, please email: [email protected]
156
Journal of Crohn's and Colitis, 2015, 156–163doi:10.1093/ecco-jcc/jju016
Advance Access publication December 10, 2014Original Article
Original Article
Clinical Predictors of Colectomy in Patients with Ulcerative Colitis: Systematic Review and Meta-analysis of Cohort StudiesCláudia Camila Dias1,2, Pedro Pereira Rodrigues1,2, Altamiro da Costa-Pereira1,2, Fernando Magro3,4,5
1Health Information and Decision Sciences Department, Faculty of Medicine, University of Porto, Porto, Portugal 2CINTESIS – Center for Health Technology and Services Research, Porto, Portugal 3Gastroenterology Department, Hospital São João, Porto 4Institute of Pharmacology and Therapeutics, Faculty of Medicine, University of Porto, Porto, Portugal 5MedInUP - Center for Drug Discovery and Innovative Medicines, University of Porto, Porto, Portugal
Corresponding Author: Fernando Magro, Institute of Pharmacology and Therapeutics, Faculdade de Medicina da Univer-sidade do Porto, Alameda Prof Hernâni Monteiro, 4200-319 Porto, Portugal. Phone: +351225513642; Fax: +351225513643; Email: [email protected]
Abstract
Introduction: Colectomy is a major event that may significantly affect the outcome of ulcerative colitis (UC) in terms of both quality of life and mortality. This paper aims to identify clinical prognostic factors that may be significantly associated with this event.Methods: PubMed, ISI Web of Knowledge and Scopus were searched to identify studies investigating the association between clinical factors in adult patients with UC and studied events. The clinical factors evaluated in this meta-analysis were gender, smoking habits, disease extent, use of corticosteroids, and episodes of hospitalization.Results: Of the 3753 initially selected papers, 20 were included. The analysis showed a significantly lower risk of colectomy for female patients (odds ratio [OR] 0.78 [95% CI 0.68, 0.90]) and for smoking patients (OR 0.55 [0.33, 0.91]), and a higher risk for patients with extensive disease (OR 3.68 [2.39, 5.69]), for patients who took corticosteroids at least once (OR 2.10 [1.05, 4.22]), and for patients who were hospitalized (OR 4.13 [3.23, 5.27]).Conclusion: Gender, smoking habits, disease extent, need for corticosteroids, and hospitalization were all significantly associated with UC prognosis. These results may clarify the relative influences of these and other prognostic factors in the natural course of the disease and therefore help improve the management approach, thus improving the follow-up of patients.
Keywords: Ulcerative colitis; clinical prognosis; prognostic factors; outcome; systematic review; meta-analysis
1. IntroductionUlcerative colitis (UC) has a heterogeneous course. It is a chronic disease in which activity has been described as mild, moderate, or severe, based on how many of the following symptoms are present: bloody diar-rhea, abdominal cramps, and fever.1 Medical treatment and surgery are the two possible treatment options. The primary goal of medical treat-ment is to reduce symptoms, but nowadays it is also aimed at clinical,
endoscopic, and histologic remission. Surgery is limited to refractory patients and to those with dysplasia or carcinoma.2,3 Therefore, it is now crucial to define clinical criteria at diagnosis to help predict UC outcome. Demographic and clinical characteristics are also important since they are easy to use and have been consistently associated with the disease course.4 This work aims to systematically review the evi-dence with respect to predictive clinical prognostic factors for UC.
4. EVIDENCE
34
Colectomy predictors in UC 157
2. Materials and MethodsA systematic review and meta-analysis of observational studies focusing on the factors that can predict different outcomes of ulcera-tive colitis was undertaken. Eligible studies were identified through an electronic search of bibliographic databases until October 2013 (Medline through PubMed, ISI Web of Knowledge and Scopus data-bases). The method included the definition of eligibility criteria, search strategies, study selection and characteristics, outcome meas-ures, quantitative data synthesis and sensitivity analysis, methodo-logical quality of studies, and statistical data analysis.
2.1 Eligibility criteriaObservational studies describing prognostic factors in UC were eli-gible for inclusion. The criteria for inclusion were: (1) adult patients with UC; and (2) written in English and studying associations between clinical factors and colectomy. This meta-analysis was lim-ited to clinical factors because they are easy to apply in predictive models of outcome. Genetic, serologic, and biomarker studies were excluded because they are not universally used and are useful tools at only some centers. The only exception was C-reactive protein (CRP), to enhance the comprehensiveness of the analysis. We there-fore tried to analyze predictive tools applicable at the bedside by all physicians. Studies not in English, without an available abstract, studying only genetic or serologic factors, biomarker studies (with exception of CRP), or those addressing diagnosis or quality of life were excluded. Furthermore, clinical trials were also not used since they often did not contain sufficient information to determine risk factors associated with our outcome.
2.2 Search strategyTo gather a more sensitive set of data, we defined a search query with several outcomes, looking to capture studies that, although focused on other outcomes, might provide useful information regarding colectomy as well. A literature search was therefore performed using PubMed with the following keywords and MeSH terms: ‘(‘colitis, ulcerative’[MeSH Terms] OR (‘colitis’[All Fields] AND ‘ulcerative’[All Fields]) OR ‘ulcerative colitis’[All Fields]) AND (‘Prognosis’[Mesh] OR prognostic[All Fields] OR factor[All Fields] OR predictor[All Fields]) AND (‘corticoids’[All Fields] OR ‘steroids’[MeSH Terms] OR ‘steroids’[All Fields] OR ‘colectomy’[MeSH Terms] OR ‘colectomy’[All Fields] OR ‘recurrence’[MeSH Terms] OR ‘recurrence’[All Fields] OR ‘relapse’[All Fields])’. Literature searches were also undertaken in the Scopus database and the ISI Web of Knowledge using the same search keywords: (‘ulcerative colitis’ AND (‘prognostic’ OR ‘factor’ OR ‘predictors’) AND (‘corticoids’ OR ‘steroids’ OR ‘colectomy’ OR ‘relapse’)).
2.3 Study selection and data collection processThe studies were screened and selected by two reviewers. First, all titles and abstracts were read and the inclusion and exclusion cri-teria were applied. Second, the reviewers read the full text of all papers considered for inclusion after abstract selection, again apply-ing the inclusion and exclusion criteria. The following properties of each study were recorded: location and type of study, total number of patients, characteristics of included patients, definitions of out-comes, and clinical or demographic factors. Quality was assessed using a qualitative classification of the risk of bias. We used a four-item classification based on the MOOSE5 and STROBE6 checklists. The items were chosen based on the factors that can incorporate bias, i.e., inclusion and exclusion criteria, justification of the cohort
(eligibility criteria, sources and methods of selecting participants, and methods used to describe follow-up), disease assessment (if UC was evaluated or self-reported), and outcome adjustments for poten-tial confounders.
2.4 Predictors of UCThe predictors evaluated were: gender, disease extent, smoking hab-its, hospitalization at any time, use of corticoids (oral or intrave-nous) at any time, and CRP.
2.5 Outcome measuresThe main endpoint of this study was colectomy at any time dur-ing the disease course. Whenever possible, subgroup analysis was focused on (1) colectomy due to nonresponse to treatment or within 1 year after diagnosis, and (2) colectomy during the disease course.
2.6 Quantitative data synthesis and sensitivity analysisStatistical evidence of effects is presented as described in the original studies. We compared the groups using random effects meta-analysis weighted by the inverse of variance to estimate the odds ratio (OR) and 95% confidence interval (95% CI). Raw data were first converted to the OR using classic methods. When raw data were not available we used the hazard ratio (HR) in the analysis. All included estimates were recomputed from descriptions given in the original articles, which might result in slightly different values. All reported p-values are two-sided with a significance level of 5%. Statistical heterogeneity was assessed with the I2 statistic; values higher than 50% indicate a substantial level of heterogeneity.7 Review Manager v5.1 was used to calculate ORs and 95% CIs. Sensitivity analysis, to evaluate the weight of each study in the heterogeneity analysis, was performed to assess robustness of findings.
3. Results
3.1 Search and study selectionA total of 3753 articles were identified using the search strategy. After reading all titles and abstracts, 3634 articles were excluded (mostly because they did not address UC or the studied clinical fac-tors). The reasons for exclusion are shown in Figure 1. One hun-dred nineteen studies were reviewed in detail and 20 articles were included.
3.2 Description of studiesOf the total of 20 studies showing clinical factors for colec-tomy,8–27 12 were conducted in Europe,10,11,15–17,20,22–27 six in North America,8,9,12,13,18,19 and two in Asia. Their main characteristics are summarized in Table 1. All had suitable inclusion and exclusion criteria, five did not clearly justify the cohort or disease assess-ment,13,17,18,22,23 and one did not adjust the outcome for possible con-founders.28 The highest risks of bias were found for these unadjusted outcomes (Figure 2). Concerning publication bias, funnel plots were derived and did not reveal any obvious asymmetric tail other than some possible bias in disease extent, as shown later in this article (Figure 8). Also, sensitivity analysis did not show significant changes in the results for any of the outcomes.
3.3 ColectomyColectomy was studied as an outcome in 20 studies.8–27 Different fac-tors were found that could predict colectomy, namely gender, extent
4.2. CLINICAL PREDICTORS OF COLECTOMY IN PATIENTS WITH ULCERATIVE COLITIS:SYSTEMATIC REVIEW AND META-ANALYSIS OF COHORT STUDIES
35
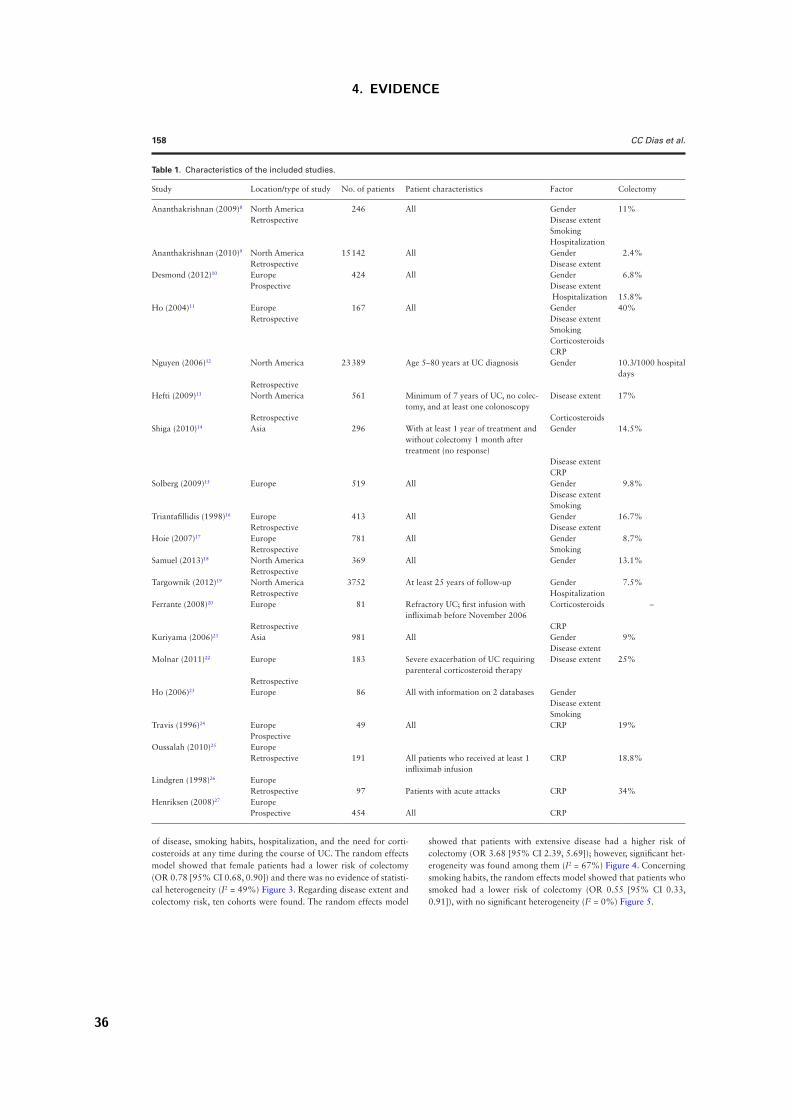
158 CC Dias et al.
Table 1. Characteristics of the included studies.
Study Location/type of study No. of patients Patient characteristics Factor Colectomy
Ananthakrishnan (2009)8 North America 246 All Gender 11%Retrospective Disease extent
SmokingHospitalization
Ananthakrishnan (2010)9 North America 15 142 All Gender 2.4%Retrospective Disease extent
Desmond (2012)10 Europe 424 All Gender 6.8%Prospective Disease extent
Hospitalization 15.8%Ho (2004)11 Europe 167 All Gender 40%
Retrospective Disease extentSmokingCorticosteroidsCRP
Nguyen (2006)12 North America 23 389 Age 5–80 years at UC diagnosis Gender 10.3/1000 hospital days
RetrospectiveHefti (2009)13 North America 561 Minimum of 7 years of UC, no colec-
tomy, and at least one colonoscopyDisease extent 17%
Retrospective CorticosteroidsShiga (2010)14 Asia 296 With at least 1 year of treatment and
without colectomy 1 month after treatment (no response)
Gender 14.5%
Disease extentCRP
Solberg (2009)15 Europe 519 All Gender 9.8%Disease extentSmoking
Triantafillidis (1998)16 Europe 413 All Gender 16.7%Retrospective Disease extent
Hoie (2007)17 Europe 781 All Gender 8.7%Retrospective Smoking
Samuel (2013)18 North America 369 All Gender 13.1%Retrospective
Targownik (2012)19 North America 3752 At least 25 years of follow-up Gender 7.5%Retrospective Hospitalization
Ferrante (2008)20 Europe 81 Refractory UC; first infusion with infliximab before November 2006
Corticosteroids –
Retrospective CRPKuriyama (2006)21 Asia 981 All Gender 9%
Disease extentMolnar (2011)22 Europe 183 Severe exacerbation of UC requiring
parenteral corticosteroid therapyDisease extent 25%
RetrospectiveHo (2006)23 Europe 86 All with information on 2 databases Gender
Disease extentSmoking
Travis (1996)24 Europe 49 All CRP 19%Prospective
Oussalah (2010)25 EuropeRetrospective 191 All patients who received at least 1
infliximab infusionCRP 18.8%
Lindgren (1998)26 EuropeRetrospective 97 Patients with acute attacks CRP 34%
Henriksen (2008)27 EuropeProspective 454 All CRP
of disease, smoking habits, hospitalization, and the need for corti-costeroids at any time during the course of UC. The random effects model showed that female patients had a lower risk of colectomy (OR 0.78 [95% CI 0.68, 0.90]) and there was no evidence of statisti-cal heterogeneity (I2 = 49%) Figure 3. Regarding disease extent and colectomy risk, ten cohorts were found. The random effects model
showed that patients with extensive disease had a higher risk of colectomy (OR 3.68 [95% CI 2.39, 5.69]); however, significant het-erogeneity was found among them (I2 = 67%) Figure 4. Concerning smoking habits, the random effects model showed that patients who smoked had a lower risk of colectomy (OR 0.55 [95% CI 0.33, 0.91]), with no significant heterogeneity (I2 = 0%) Figure 5.
4. EVIDENCE
36
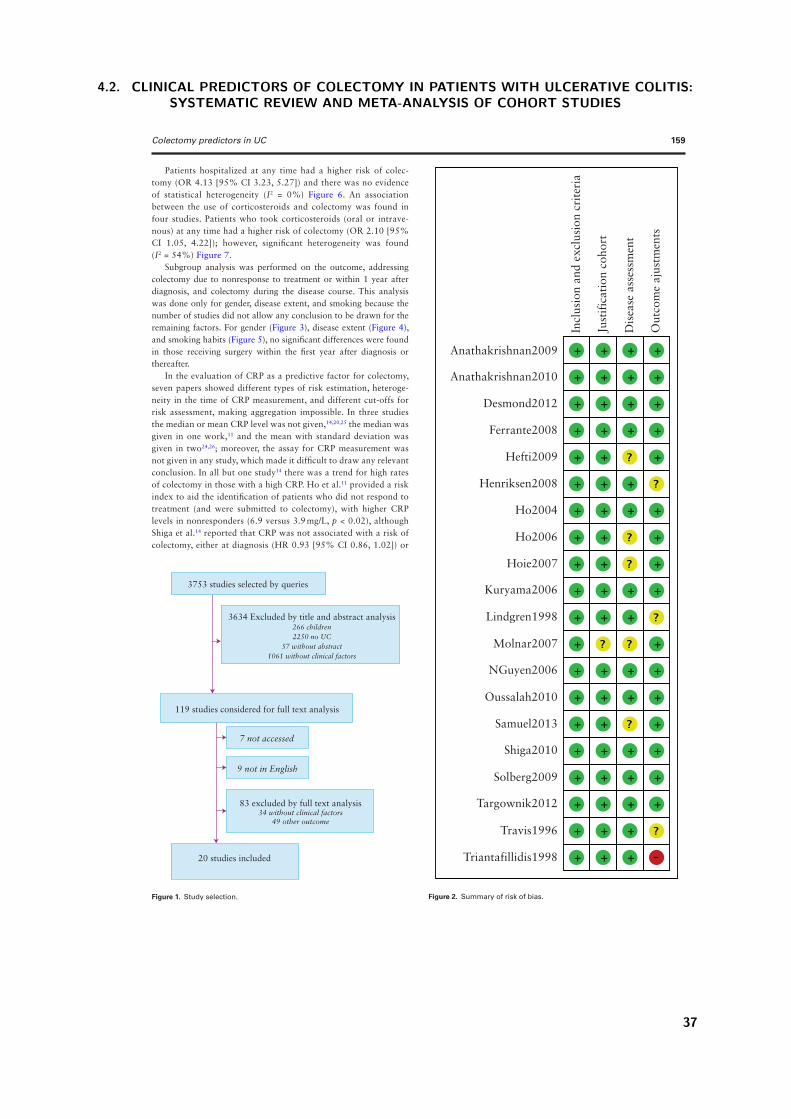
Colectomy predictors in UC 159
Patients hospitalized at any time had a higher risk of colec-tomy (OR 4.13 [95% CI 3.23, 5.27]) and there was no evidence of statistical heterogeneity (I2 = 0%) Figure 6. An association between the use of corticosteroids and colectomy was found in four studies. Patients who took corticosteroids (oral or intrave-nous) at any time had a higher risk of colectomy (OR 2.10 [95% CI 1.05, 4.22]); however, significant heterogeneity was found (I2 = 54%) Figure 7.
Subgroup analysis was performed on the outcome, addressing colectomy due to nonresponse to treatment or within 1 year after diagnosis, and colectomy during the disease course. This analysis was done only for gender, disease extent, and smoking because the number of studies did not allow any conclusion to be drawn for the remaining factors. For gender (Figure 3), disease extent (Figure 4), and smoking habits (Figure 5), no significant differences were found in those receiving surgery within the first year after diagnosis or thereafter.
In the evaluation of CRP as a predictive factor for colectomy, seven papers showed different types of risk estimation, heteroge-neity in the time of CRP measurement, and different cut-offs for risk assessment, making aggregation impossible. In three studies the median or mean CRP level was not given,14,20,25 the median was given in one work,11 and the mean with standard deviation was given in two24,26; moreover, the assay for CRP measurement was not given in any study, which made it difficult to draw any relevant conclusion. In all but one study14 there was a trend for high rates of colectomy in those with a high CRP. Ho et al.11 provided a risk index to aid the identification of patients who did not respond to treatment (and were submitted to colectomy), with higher CRP levels in nonresponders (6.9 versus 3.9 mg/L, p < 0.02), although Shiga et al.14 reported that CRP was not associated with a risk of colectomy, either at diagnosis (HR 0.93 [95% CI 0.86, 1.02]) or
Anathakrishnan2009
Incl
usio
n an
d ex
clus
ion
crite
ria
Just
ifica
tion
coho
rt
Dis
ease
ass
essm
ent
Out
com
e aj
ustm
ents
Anathakrishnan2010
Desmond2012
Ferrante2008
Hefti2009
Henriksen2008
Ho2004
Ho2006
Hoie2007
Kuryama2006
Lindgren1998
Molnar2007
NGuyen2006
Oussalah2010
Samuel2013
Shiga2010
Solberg2009
Targownik2012
Travis1996
Triantafillidis1998
Figure 2. Summary of risk of bias.
3753 studies selected by queries
119 studies considered for full text analysis
20 studies included
7 not accessed
9 not in English
83 excluded by full text analysis34 without clinical factors
49 other outcome
3634 Excluded by title and abstract analysis266 children2250 no UC
57 without abstract1061 without clinical factors
Figure 1. Study selection.
4.2. CLINICAL PREDICTORS OF COLECTOMY IN PATIENTS WITH ULCERATIVE COLITIS:SYSTEMATIC REVIEW AND META-ANALYSIS OF COHORT STUDIES
37
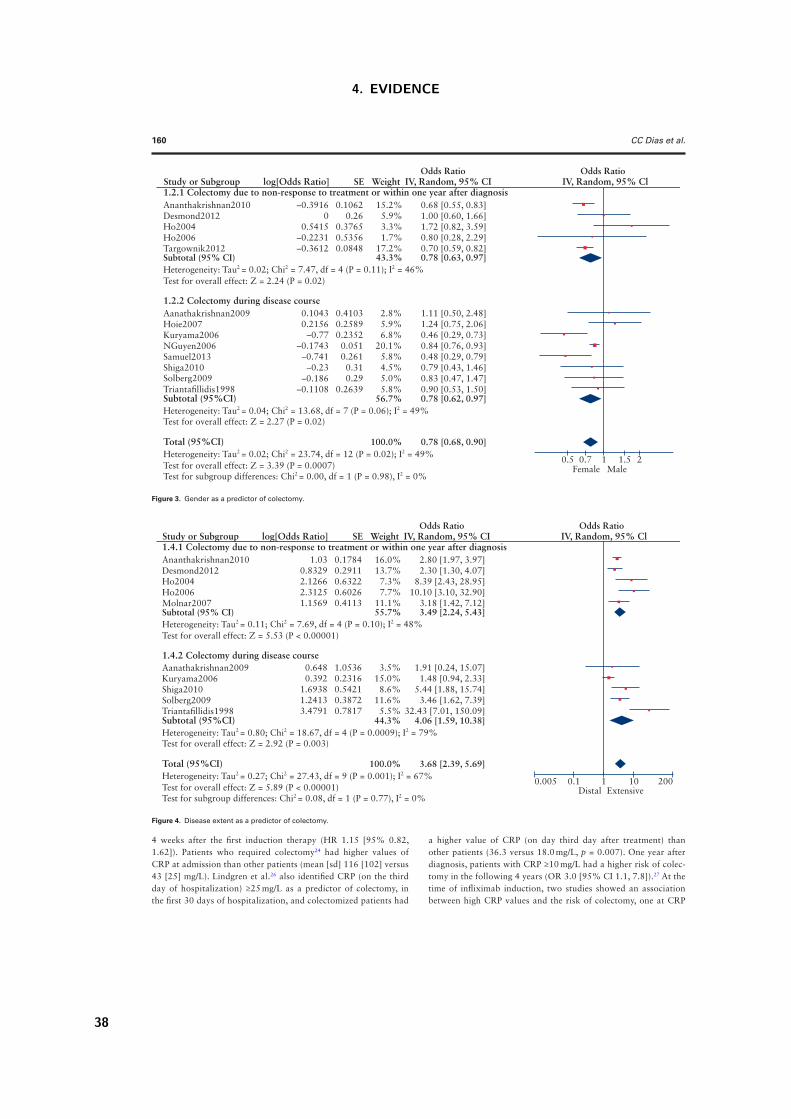
160 CC Dias et al.
4 weeks after the first induction therapy (HR 1.15 [95% 0.82, 1.62]). Patients who required colectomy24 had higher values of CRP at admission than other patients (mean [sd] 116 [102] versus 43 [25] mg/L). Lindgren et al.26 also identified CRP (on the third day of hospitalization) ≥25 mg/L as a predictor of colectomy, in the first 30 days of hospitalization, and colectomized patients had
a higher value of CRP (on day third day after treatment) than other patients (36.3 versus 18.0 mg/L, p = 0.007). One year after diagnosis, patients with CRP ≥10 mg/L had a higher risk of colec-tomy in the following 4 years (OR 3.0 [95% CI 1.1, 7.8]).27 At the time of infliximab induction, two studies showed an association between high CRP values and the risk of colectomy, one at CRP
Study or Subgroup1.4.1 Colectomy due to non-response to treatment or within one year after diagnosisAnanthakrishnan2010 1.03
0.83292.12662.31251.1569
0.17840.29110.63220.60260.4113
16.0%13.7%
7.3%7.7%
11.1%
2.80 [1.97, 3.97]2.30 [1.30, 4.07]
8.39 [2.43, 28.95]10.10 [3.10, 32.90]
3.18 [1.42, 7.12]55.7% 3.49 [2.24, 5.43]
0.6480.392
1.69381.24133.4791
1.05360.23160.54210.38720.7817
3.5%15.0%
8.6%11.6%
5.5%
1.91 [0.24, 15.07]1.48 [0.94, 2.33]
5.44 [1.88, 15.74]3.46 [1.62, 7.39]
32.43 [7.01, 150.09]4.06 [1.59, 10.38]44.3%
3.68 [2.39, 5.69]100.0%
Desmond2012
Ho2006Molnar2007Subtotal (95% CI)Heterogeneity: Tau2 = 0.11; Chi2 = 7.69, df = 4 (P = 0.10); I2 = 48%
Aanathakrishnan2009Kuryama2006Shiga2010Solberg2009Triantafillidis1998
Test for overall effect: Z = 5.53 (P < 0.00001)
Heterogeneity: Tau2 = 0.27; Chi2 = 27.43, df = 9 (P = 0.001); I2 = 67% Test for overall effect: Z = 5.89 (P < 0.00001)
Heterogeneity: Tau2 = 0.80; Chi2 = 18.67, df = 4 (P = 0.0009); I2 = 79%
Test for subgroup differences: Chi2 = 0.08, df = 1 (P = 0.77), I2 = 0%
0.005 0.1 1Distal Extensive
10 200
Test for overall effect: Z = 2.92 (P = 0.003)
1.4.2 Colectomy during disease course
Subtotal (95%CI)
Total (95%CI)
Ho2004
log[Odds Ratio] SE Weight IV, Random, 95% CIOdds Ratio
IV, Random, 95% ClOdds Ratio
Figure 4. Disease extent as a predictor of colectomy.
Study or Subgroup1.2.1 Colectomy due to non-response to treatment or within one year after diagnosisAnanthakrishnan2010 –0.3916
00.5415
–0.2231–0.3612
0.10620.26
0.37650.53560.0848
15.2%5.9%3.3%1.7%
17.2%
0.68 [0.55, 0.83]1.00 [0.60, 1.66]1.72 [0.82, 3.59]0.80 [0.28, 2.29]0.70 [0.59, 0.82]
43.3% 0.78 [0.63, 0.97]
0.10430.2156
–0.77–0.1743
–0.741–0.23
–0.186–0.1108
0.41030.25890.2352
0.0510.261
0.31
0.5 1Female Male
20.7 1.5
0.290.2639
2.8%5.9%6.8%
20.1%5.8%4.5%5.0%5.8%
1.11 [0.50, 2.48]1.24 [0.75, 2.06]0.46 [0.29, 0.73]0.84 [0.76, 0.93]0.48 [0.29, 0.79]0.79 [0.43, 1.46]0.83 [0.47, 1.47]0.90 [0.53, 1.50]0.78 [0.62, 0.97]56.7%
0.78 [0.68, 0.90]100.0%
Desmond2012
Ho2006Targownik2012Subtotal (95% CI)Heterogeneity: Tau2 = 0.02; Chi2 = 7.47, df = 4 (P = 0.11); I2 = 46%
Aanathakrishnan2009Hoie2007Kuryama2006NGuyen2006Samuel2013Shiga2010Solberg2009Triantafillidis1998
Test for overall effect: Z = 2.24 (P = 0.02)
Heterogeneity: Tau2 = 0.02; Chi2 = 23.74, df = 12 (P = 0.02); I2 = 49% Test for overall effect: Z = 3.39 (P = 0.0007)
Heterogeneity: Tau2 = 0.04; Chi2 = 13.68, df = 7 (P = 0.06); I2 = 49%
Test for subgroup differences: Chi2 = 0.00, df = 1 (P = 0.98), I2 = 0%
Test for overall effect: Z = 2.27 (P = 0.02)
1.2.2 Colectomy during disease course
Subtotal (95%CI)
Total (95%CI)
Ho2004
log[Odds Ratio] SE Weight IV, Random, 95% CIOdds Ratio
IV, Random, 95% ClOdds Ratio
Figure 3. Gender as a predictor of colectomy.
4. EVIDENCE
38
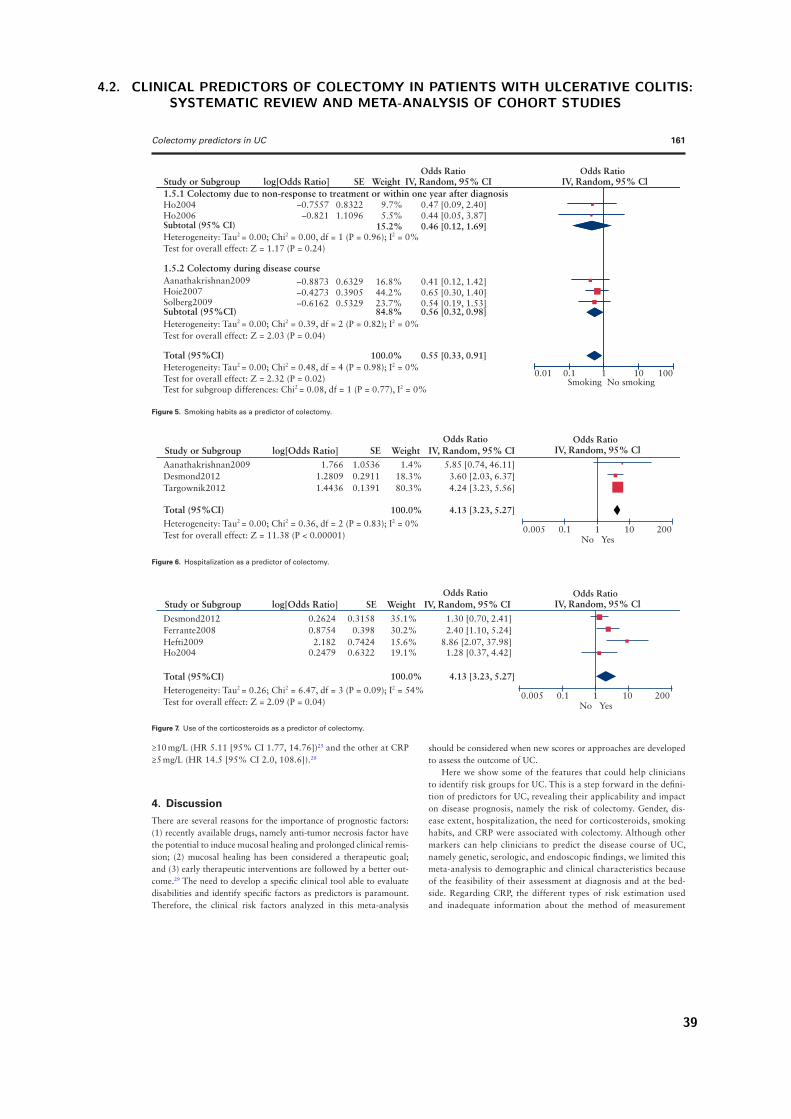
Colectomy predictors in UC 161
≥10 mg/L (HR 5.11 [95% CI 1.77, 14.76])25 and the other at CRP ≥5 mg/L (HR 14.5 [95% CI 2.0, 108.6]).20
4. DiscussionThere are several reasons for the importance of prognostic factors: (1) recently available drugs, namely anti-tumor necrosis factor have the potential to induce mucosal healing and prolonged clinical remis-sion; (2) mucosal healing has been considered a therapeutic goal; and (3) early therapeutic interventions are followed by a better out-come.29 The need to develop a specific clinical tool able to evaluate disabilities and identify specific factors as predictors is paramount. Therefore, the clinical risk factors analyzed in this meta-analysis
should be considered when new scores or approaches are developed to assess the outcome of UC.
Here we show some of the features that could help clinicians to identify risk groups for UC. This is a step forward in the defini-tion of predictors for UC, revealing their applicability and impact on disease prognosis, namely the risk of colectomy. Gender, dis-ease extent, hospitalization, the need for corticosteroids, smoking habits, and CRP were associated with colectomy. Although other markers can help clinicians to predict the disease course of UC, namely genetic, serologic, and endoscopic findings, we limited this meta-analysis to demographic and clinical characteristics because of the feasibility of their assessment at diagnosis and at the bed-side. Regarding CRP, the different types of risk estimation used and inadequate information about the method of measurement
Study or Subgroup1.5.1 Colectomy due to non-response to treatment or within one year after diagnosis
–0.7557–0.821
0.83221.1096
9.7%5.5%
0.47 [0.09, 2.40]0.44 [0.05, 3.87]
15.2% 0.46 [0.12, 1.69]
–0.8873–0.4273
0.63290.3905
16.8%44.2%
0.41 [0.12, 1.42]
0.01 0.1 1Smoking No smoking
10 100
0.65 [0.30, 1.40]
0.56 [0.32, 0.98]84.8%
0.55 [0.33, 0.91]100.0%
Ho2006Subtotal (95% CI)Heterogeneity: Tau2 = 0.00; Chi2 = 0.00, df = 1 (P = 0.96); I2 = 0%
Aanathakrishnan2009Hoie2007
–0.6162 0.5329 23.7% 0.54 [0.19, 1.53]Solberg2009
Test for overall effect: Z = 1.17 (P = 0.24)
Heterogeneity: Tau2 = 0.00; Chi2 = 0.48, df = 4 (P = 0.98); I2 = 0% Test for overall effect: Z = 2.32 (P = 0.02)
Heterogeneity: Tau2 = 0.00; Chi2 = 0.39, df = 2 (P = 0.82); I2 = 0%
Test for subgroup differences: Chi2 = 0.08, df = 1 (P = 0.77), I2 = 0%
Test for overall effect: Z = 2.03 (P = 0.04)
1.5.2 Colectomy during disease course
Subtotal (95%CI)
Total (95%CI)
Ho2004
log[Odds Ratio] SE Weight IV, Random, 95% CIOdds Ratio
IV, Random, 95% ClOdds Ratio
Figure 5. Smoking habits as a predictor of colectomy.
Study or Subgroup0.2624 0.3158 35.1% 1.30 [0.70, 2.41]
0.005 0.1 1No Yes
10 200
Desmond2012Ferrante2008 0.8754 0.398 30.2% 2.40 [1.10, 5.24]
4.13 [3.23, 5.27]100.0%
2.182 0.7424 15.6% 8.86 [2.07, 37.98]Hefti20090.2479 0.6322 19.1% 1.28 [0.37, 4.42]Ho2004
Heterogeneity: Tau2 = 0.26; Chi2 = 6.47, df = 3 (P = 0.09); I2 = 54% Test for overall effect: Z = 2.09 (P = 0.04)
Total (95%CI)
log[Odds Ratio] SE Weight IV, Random, 95% CIOdds Ratio
IV, Random, 95% ClOdds Ratio
Figure 7. Use of the corticosteroids as a predictor of colectomy.
Study or Subgroup1.766 1.0536 1.4% 5.85 [0.74, 46.11]
0.005 0.1 1No Yes
10 200
Aanathakrishnan2009Desmond2012 1.2809 0.2911 18.3% 3.60 [2.03, 6.37]
4.13 [3.23, 5.27]100.0%
1.4436 0.1391 80.3% 4.24 [3.23, 5.56]Targownik2012
Heterogeneity: Tau2 = 0.00; Chi2 = 0.36, df = 2 (P = 0.83); I2 = 0% Test for overall effect: Z = 11.38 (P < 0.00001)
Total (95%CI)
log[Odds Ratio] SE Weight IV, Random, 95% CIOdds Ratio
IV, Random, 95% ClOdds Ratio
Figure 6. Hospitalization as a predictor of colectomy.
4.2. CLINICAL PREDICTORS OF COLECTOMY IN PATIENTS WITH ULCERATIVE COLITIS:SYSTEMATIC REVIEW AND META-ANALYSIS OF COHORT STUDIES
39
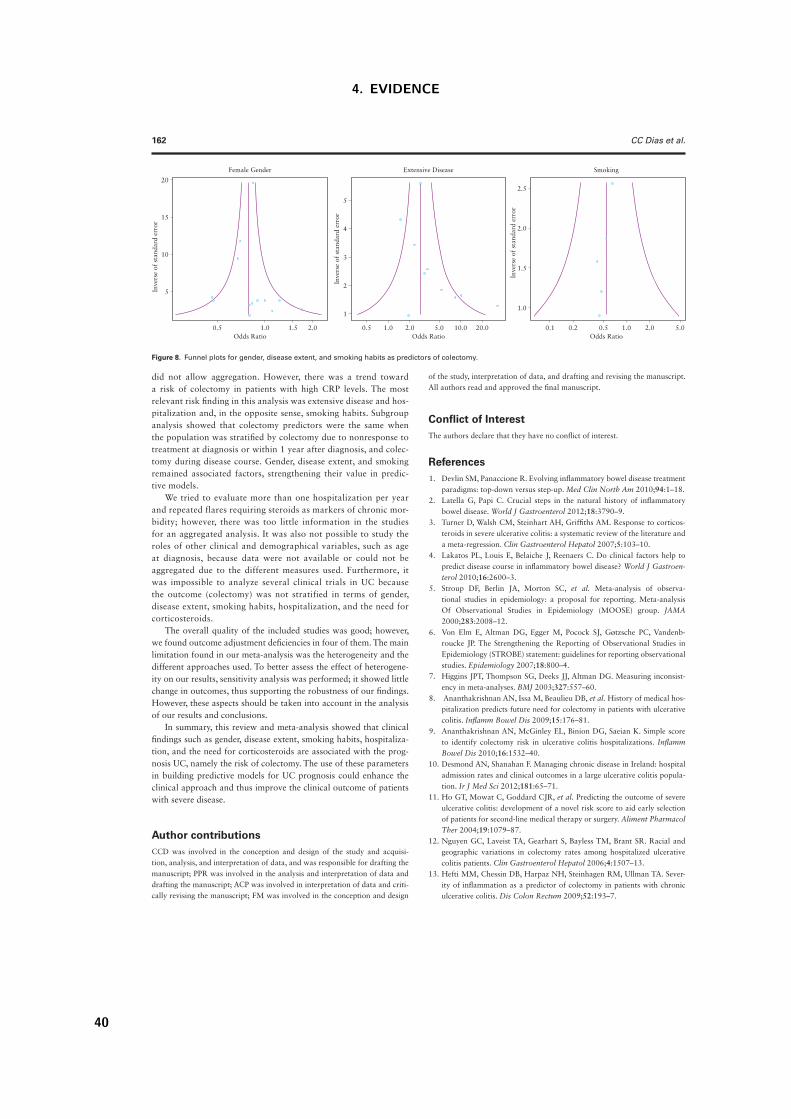
162 CC Dias et al.
did not allow aggregation. However, there was a trend toward a risk of colectomy in patients with high CRP levels. The most relevant risk finding in this analysis was extensive disease and hos-pitalization and, in the opposite sense, smoking habits. Subgroup analysis showed that colectomy predictors were the same when the population was stratified by colectomy due to nonresponse to treatment at diagnosis or within 1 year after diagnosis, and colec-tomy during disease course. Gender, disease extent, and smoking remained associated factors, strengthening their value in predic-tive models.
We tried to evaluate more than one hospitalization per year and repeated flares requiring steroids as markers of chronic mor-bidity; however, there was too little information in the studies for an aggregated analysis. It was also not possible to study the roles of other clinical and demographical variables, such as age at diagnosis, because data were not available or could not be aggregated due to the different measures used. Furthermore, it was impossible to analyze several clinical trials in UC because the outcome (colectomy) was not stratified in terms of gender, disease extent, smoking habits, hospitalization, and the need for corticosteroids.
The overall quality of the included studies was good; however, we found outcome adjustment deficiencies in four of them. The main limitation found in our meta-analysis was the heterogeneity and the different approaches used. To better assess the effect of heterogene-ity on our results, sensitivity analysis was performed; it showed little change in outcomes, thus supporting the robustness of our findings. However, these aspects should be taken into account in the analysis of our results and conclusions.
In summary, this review and meta-analysis showed that clinical findings such as gender, disease extent, smoking habits, hospitaliza-tion, and the need for corticosteroids are associated with the prog-nosis UC, namely the risk of colectomy. The use of these parameters in building predictive models for UC prognosis could enhance the clinical approach and thus improve the clinical outcome of patients with severe disease.
Author contributionsCCD was involved in the conception and design of the study and acquisi-tion, analysis, and interpretation of data, and was responsible for drafting the manuscript; PPR was involved in the analysis and interpretation of data and drafting the manuscript; ACP was involved in interpretation of data and criti-cally revising the manuscript; FM was involved in the conception and design
of the study, interpretation of data, and drafting and revising the manuscript. All authors read and approved the final manuscript.
Conflict of InterestThe authors declare that they have no conflict of interest.
References 1. Devlin SM, Panaccione R. Evolving inflammatory bowel disease treatment
paradigms: top-down versus step-up. Med Clin North Am 2010;94:1–18. 2. Latella G, Papi C. Crucial steps in the natural history of inflammatory
bowel disease. World J Gastroenterol 2012;18:3790–9. 3. Turner D, Walsh CM, Steinhart AH, Griffiths AM. Response to corticos-
teroids in severe ulcerative colitis: a systematic review of the literature and a meta-regression. Clin Gastroenterol Hepatol 2007;5:103–10.
4. Lakatos PL, Louis E, Belaiche J, Reenaers C. Do clinical factors help to predict disease course in inflammatory bowel disease? World J Gastroen-terol 2010;16:2600–3.
5. Stroup DF, Berlin JA, Morton SC, et al. Meta-analysis of observa-tional studies in epidemiology: a proposal for reporting. Meta-analysis Of Observational Studies in Epidemiology (MOOSE) group. JAMA 2000;283:2008–12.
6. Von Elm E, Altman DG, Egger M, Pocock SJ, Gøtzsche PC, Vandenb-roucke JP. The Strengthening the Reporting of Observational Studies in Epidemiology (STROBE) statement: guidelines for reporting observational studies. Epidemiology 2007;18:800–4.
7. Higgins JPT, Thompson SG, Deeks JJ, Altman DG. Measuring inconsist-ency in meta-analyses. BMJ 2003;327:557–60.
8. Ananthakrishnan AN, Issa M, Beaulieu DB, et al. History of medical hos-pitalization predicts future need for colectomy in patients with ulcerative colitis. Inflamm Bowel Dis 2009;15:176–81.
9. Ananthakrishnan AN, McGinley EL, Binion DG, Saeian K. Simple score to identify colectomy risk in ulcerative colitis hospitalizations. Inflamm Bowel Dis 2010;16:1532–40.
10. Desmond AN, Shanahan F. Managing chronic disease in Ireland: hospital admission rates and clinical outcomes in a large ulcerative colitis popula-tion. Ir J Med Sci 2012;181:65–71.
11. Ho GT, Mowat C, Goddard CJR, et al. Predicting the outcome of severe ulcerative colitis: development of a novel risk score to aid early selection of patients for second-line medical therapy or surgery. Aliment Pharmacol Ther 2004;19:1079–87.
12. Nguyen GC, Laveist TA, Gearhart S, Bayless TM, Brant SR. Racial and geographic variations in colectomy rates among hospitalized ulcerative colitis patients. Clin Gastroenterol Hepatol 2006;4:1507–13.
13. Hefti MM, Chessin DB, Harpaz NH, Steinhagen RM, Ullman TA. Sever-ity of inflammation as a predictor of colectomy in patients with chronic ulcerative colitis. Dis Colon Rectum 2009;52:193–7.
20
15
10
Inve
rse
of s
tand
ard
erro
r
5
5
4
3
Inve
rse
of s
tand
ard
erro
r
2
1
2.5
2.0
Inve
rse
of s
tand
ard
erro
r
1.5
1.0
0.5 1.0
Female Gender Extensive Disease Smoking
1.5 2.0 0.5 0.1 0.2 0.5 1.0 2.0 5.05.02.01.0Odds RatioOdds Ratio Odds Ratio
10.0 20.0
Figure 8. Funnel plots for gender, disease extent, and smoking habits as predictors of colectomy.
4. EVIDENCE
40
Colectomy predictors in UC 163
14. Shiga H, Takagi S, Inoue R, et al. What determines the later clinical course of patients who do not undergo colectomy at the first attack? A Japanese cohort study on ulcerative colitis. Digestion 2010;81:104–12.
15. Solberg IC, Lygren I, Jahnsen J, et al. Clinical course during the first 10 years of ulcerative colitis: Results from a population-based inception cohort (IBSEN Study). Scand J Gastroenterol 2009;44:431–40.
16. Triantafillidis JK, Emmanouilidis A, Manousos, et al. Ulcerative colitis in Greece: Clinicoepidemiological data, course, and prognostic factors in 413 consecutve patients. J Clin Gastroenterol 1998;27:204–10.
17. Hoie O, Wolters FL, Riis L, et al. Low colectomy rates in ulcerative colitis in an unselected European cohort followed for 10 years. Gastroenterology 2007;132:507–15.
18. Samuel S, Ingle SB, Dhillon S, et al. Cumulative incidence and risk factors for hospitalization and surgery in a population-based cohort of ulcerative colitis. Inflamm Bowel Dis 2013;19:1858–66.
19. Targownik LE, Singh H, Nugent Z, Bernstein CN. The epidemiology of colectomy in ulcerative colitis: results from a population-based cohort. Am J Gastroenterol 2012;107:1228–35.
20. Ferrante M, Vermeire S, Fidder H, et al. Long-term outcome after inf-liximab for refractory ulcerative colitis. J Crohns Colitis 2008;2:219–25.
21. Kuriyama M, Kato J, Fujimoto T, et al. Risk factors and indications for colectomy in ulcerative colitis patients are different according to patient’s clinical background. Dis Colon Rectum 2006;49:1307–15.
22. Molnár T, Farkas K, Nyári T, et al. Response to first intravenous steroid therapy determines the subsequent risk of colectomy in ulcerative colitis patients. J Gastrointest Liver Dis 2011;20:359–63.
23. Ho GT, Chiam P, Drummond H, Loane J, Arnott IDR, Satsangi J. The effi-cacy of corticosteroid therapy in inflammatory bowel disease: analysis of a 5-year UK inception cohort. Aliment Pharmacol Ther 2006;24:319–30.
24. Travis SPL, Farrant JM, Ricketts C, et al. Predicting outcome in severe ulcerative colitis. Gut 1996;38:905–10.
25. Oussalah A, Evesque L, Laharie D, et al. A multicenter experience with inf-liximab for ulcerative colitis: outcomes and predictors of response, optimiza-tion, colectomy, and hospitalization. Am J Gastroenterol 2010;105:2617–25.
26. Lindgren SC, Flood LM, Kilander AF, Löfberg R, Persson TB, Sjödahl RI. Early predictors of glucocorticosteroid treatment failure in severe and moderately severe attacks of ulcerative colitis. Eur J Gastroenterol Hepatol 1998;10:831–5.
27. Henriksen M, Jahnsen J, Lygren I, et al. C-reactive protein: a predictive factor and marker of inflammation in inflammatory bowel disease. Results from a prospective population-based study. Gut 2008;57:1518–23.
28. Triantafillidis JK, Emmanouilidis A, Manousos ON, et al. Ulcerative colitis in Greece: Clinicoepidemiological data, course, and prognostic factors in 413 consecutive patients. J Clin Gastroenterol 1998;27:204–10.
29. Magro F, Rodrigues-Pinto E, Coelho R, et al. Is it possible to change phenotype progression in Crohn’s disease in the era of immunomodula-tors? Predictive factors of phenotype progression. Am J Gastroenterol 2014;109:1026–36.
4.2. CLINICAL PREDICTORS OF COLECTOMY IN PATIENTS WITH ULCERATIVE COLITIS:SYSTEMATIC REVIEW AND META-ANALYSIS OF COHORT STUDIES
41

4. EVIDENCE
42

5. Classification

5. Classification
The second aim of this thesis is to identify and assess risk factors for outcomes identified in Goal 1 for
Crohn’s disease, using an independent cohort of patients. In this chapter we study the impact of demogra-
phical and clinical factors (such as the timing of therapeutics strategies). Early surgery or immunosuppression
seem to not prevent global disabling disease, an early start of immunosuppression by itself is associated with
fewer surgeries and should be considered in daily practice as a preventive strategy. Although, within surgical
patients, an early surgery (within six months after diagnosis) can prevent disabling events, and the introduc-
tion of immunosuppressive medication more than one month after the initial surgery seems to increase the
likelihood of needing further surgeries.
Two studies were conducted:
The impact of early surgery and immunosuppression on Crohn’s disease disabling outcomes.
(Inflammatory Bowel Diseases, 23 (2):289-297, 2017)
Fernando Magro, Claudia Camila Dias, Rosa Coelho, Paula Moura Santos, Samuel Fernandes, Cidalina Cae-
tano, Angela Rodrigues, Francisco Portela, Ana Oliveira, Paula Ministro, Eugenia Cancela, Ana Isabel Vieira,
Rita Barosa, Jose Cotter, Pedro Carvalho, Isabelle Cremers, Daniel Trabulo, Paulo Caldeira, Artur Antunes,
Isadora Rosa, Joana Moleiro, Paula Peixe, Rita Herculano, Raquel Goncalves, Bruno Goncalves, Helena Tavares
Sousa, Luıs Contente, Henrique Morna , Susana Lopes on behalf of GEDII
The timing of early therapeutics strategies has a significante impact on the Crohn’s disease prog-
nosis
(submitted, 2016)
Claudia Camila Dias, Samuel Fernandes, Francisco Portela, Paula Ministro, Diana Martins, Paula Sousa, Paula
Lago, Isadora Rosa, Luıs Correia, Paula Moura Santos Fernando Magro on behalf GEDII
45
5. CLASSIFICATION
5.1 The impact of early surgery and immunosuppression on Crohn’s
disease disabling outcomes.
Inflammatory Bowel Diseases, 23 (2):289-297, 2017
Fernando Magro, Claudia Camila Dias, Rosa Coelho, Paula Moura Santos, Samuel Fernandes,
Cidalina Caetano, Angela Rodrigues, Francisco Portela, Ana Oliveira, Paula Ministro, Eugenia
Cancela, Ana Isabel Vieira, Rita Barosa, Jose Cotter, Pedro Carvalho, Isabelle Cremers, Daniel
Trabulo, Paulo Caldeira, Artur Antunes, Isadora Rosa, Joana Moleiro, Paula Peixe, Rita Hercu-
lano, Raquel Goncalves, Bruno Goncalves, Helena Tavares Sousa, Luıs Contente, Henrique Morna
, Susana Lopes on behalf of GEDII
46
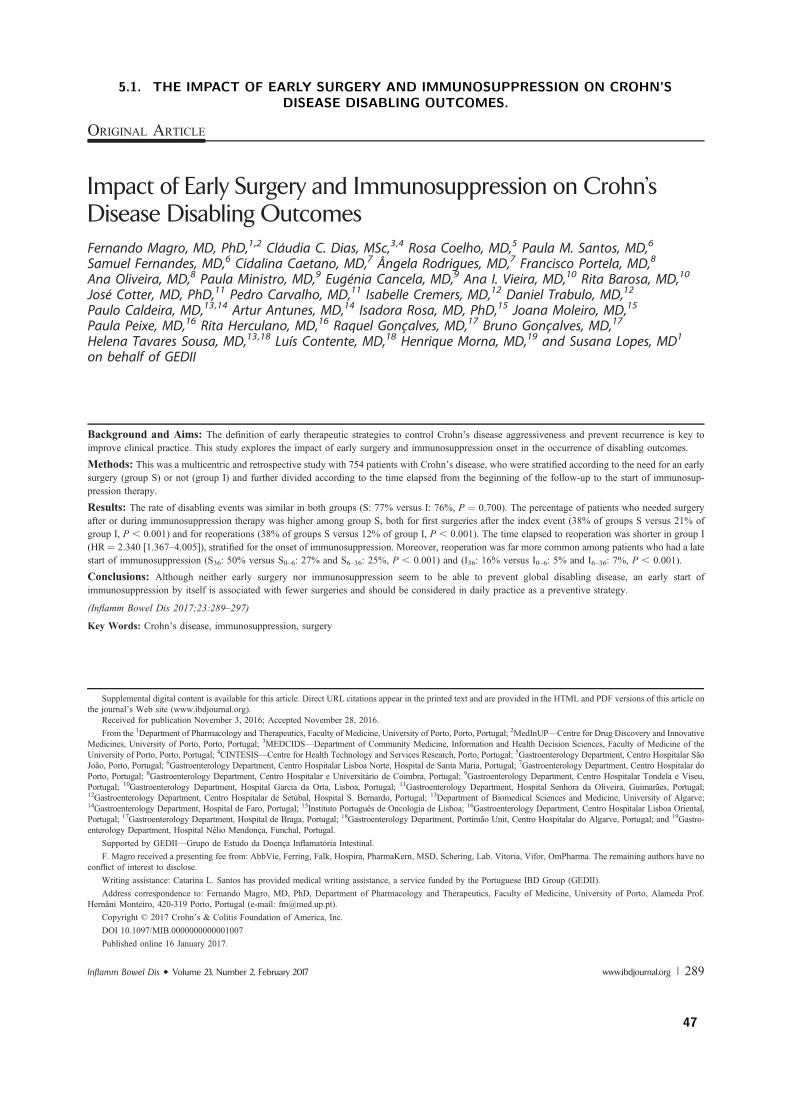
ORIGINAL ARTICLE
Impact of Early Surgery and Immunosuppression on Crohn’sDisease Disabling OutcomesFernando Magro, MD, PhD,1,2 Cláudia C. Dias, MSc,3,4 Rosa Coelho, MD,5 Paula M. Santos, MD,6
Samuel Fernandes, MD,6 Cidalina Caetano, MD,7 Ângela Rodrigues, MD,7 Francisco Portela, MD,8
Ana Oliveira, MD,8 Paula Ministro, MD,9 Eugénia Cancela, MD,9 Ana I. Vieira, MD,10 Rita Barosa, MD,10
José Cotter, MD, PhD,11 Pedro Carvalho, MD,11 Isabelle Cremers, MD,12 Daniel Trabulo, MD,12
Paulo Caldeira, MD,13,14 Artur Antunes, MD,14 Isadora Rosa, MD, PhD,15 Joana Moleiro, MD,15
Paula Peixe, MD,16 Rita Herculano, MD,16 Raquel Goncalves, MD,17 Bruno Goncalves, MD,17
Helena Tavares Sousa, MD,13,18 Luís Contente, MD,18 Henrique Morna, MD,19 and Susana Lopes, MD1
on behalf of GEDII
Background and Aims: The definition of early therapeutic strategies to control Crohn’s disease aggressiveness and prevent recurrence is key toimprove clinical practice. This study explores the impact of early surgery and immunosuppression onset in the occurrence of disabling outcomes.
Methods: This was a multicentric and retrospective study with 754 patients with Crohn’s disease, who were stratified according to the need for an earlysurgery (group S) or not (group I) and further divided according to the time elapsed from the beginning of the follow-up to the start of immunosup-pression therapy.
Results: The rate of disabling events was similar in both groups (S: 77% versus I: 76%, P ¼ 0.700). The percentage of patients who needed surgeryafter or during immunosuppression therapy was higher among group S, both for first surgeries after the index event (38% of groups S versus 21% ofgroup I, P , 0.001) and for reoperations (38% of groups S versus 12% of group I, P , 0.001). The time elapsed to reoperation was shorter in group I(HR ¼ 2.340 [1.367–4.005]), stratified for the onset of immunosuppression. Moreover, reoperation was far more common among patients who had a latestart of immunosuppression (S36: 50% versus S0–6: 27% and S6–36: 25%, P , 0.001) and (I36: 16% versus I0–6: 5% and I6–36: 7%, P , 0.001).
Conclusions: Although neither early surgery nor immunosuppression seem to be able to prevent global disabling disease, an early start ofimmunosuppression by itself is associated with fewer surgeries and should be considered in daily practice as a preventive strategy.
(Inflamm Bowel Dis 2017;23:289–297)
Key Words: Crohn’s disease, immunosuppression, surgery
Supplemental digital content is available for this article. Direct URL citations appear in the printed text and are provided in the HTML and PDF versions of this article onthe journal’s Web site (www.ibdjournal.org).
Received for publication November 3, 2016; Accepted November 28, 2016.From the 1Department of Pharmacology and Therapeutics, Faculty of Medicine, University of Porto, Porto, Portugal; 2MedInUP—Centre for Drug Discovery and Innovative
Medicines, University of Porto, Porto, Portugal; 3MEDCIDS—Department of Community Medicine, Information and Health Decision Sciences, Faculty of Medicine of theUniversity of Porto, Porto, Portugal; 4CINTESIS—Centre for Health Technology and Services Research, Porto, Portugal; 5Gastroenterology Department, Centro Hospitalar SãoJoão, Porto, Portugal; 6Gastroenterology Department, Centro Hospitalar Lisboa Norte, Hospital de Santa Maria, Portugal; 7Gastroenterology Department, Centro Hospitalar doPorto, Portugal; 8Gastroenterology Department, Centro Hospitalar e Universitário de Coimbra, Portugal; 9Gastroenterology Department, Centro Hospitalar Tondela e Viseu,Portugal; 10Gastroenterology Department, Hospital Garcia da Orta, Lisboa, Portugal; 11Gastroenterology Department, Hospital Senhora da Oliveira, Guimarães, Portugal;12Gastroenterology Department, Centro Hospitalar de Setúbal, Hospital S. Bernardo, Portugal; 13Department of Biomedical Sciences and Medicine, University of Algarve;14Gastroenterology Department, Hospital de Faro, Portugal; 15Instituto Português de Oncologia de Lisboa; 16Gastroenterology Department, Centro Hospitalar Lisboa Oriental,Portugal; 17Gastroenterology Department, Hospital de Braga, Portugal; 18Gastroenterology Department, Portimão Unit, Centro Hospitalar do Algarve, Portugal; and 19Gastro-enterology Department, Hospital Nélio Mendonca, Funchal, Portugal.
Supported by GEDII—Grupo de Estudo da Doenca Inflamatória Intestinal.F. Magro received a presenting fee from: AbbVie, Ferring, Falk, Hospira, PharmaKern, MSD, Schering, Lab. Vitoria, Vifor, OmPharma. The remaining authors have no
conflict of interest to disclose.Writing assistance: Catarina L. Santos has provided medical writing assistance, a service funded by the Portuguese IBD Group (GEDII).Address correspondence to: Fernando Magro, MD, PhD, Department of Pharmacology and Therapeutics, Faculty of Medicine, University of Porto, Alameda Prof.
Hernâni Monteiro, 420-319 Porto, Portugal (e-mail: [email protected]).Copyright © 2017 Crohn’s & Colitis Foundation of America, Inc.DOI 10.1097/MIB.0000000000001007Published online 16 January 2017.
Inflamm Bowel Dis " Volume 23, Number 2, February 2017 www.ibdjournal.org | 289
5.1. THE IMPACT OF EARLY SURGERY AND IMMUNOSUPPRESSION ON CROHN’SDISEASE DISABLING OUTCOMES.
47
C rohn’s disease (CD) is an idiopathic, chronic, and transmuralinflammatory process that can affect the entire gastrointesti-
nal tract, from the mouth to the anus. It is characterized by a remit-ting and relapsing course and can cause digestive damage and lossof function, thus being considered as a disabling condition overtime.1,2 Treatment of CD has evolved over the past few years withthe appearance of anti–tumor necrosis factor a (anti-TNF a)agents and the development of new drugs, such as anti-integrinantibodies (natalizumab and vedolizumab), and a monoclonalantibody against interleukin-12 and interleukin-23 (ustekinu-mab).3,4 These therapies have considerably advanced the treat-ment of CD and have improved the likelihood of inducing andmaintaining clinical remission.5 In addition, a significant reduc-tion in the rate of early intestinal surgery has been described andassociated with the increased use of thiopurines.6 Nonetheless, theimpact of these therapeutic changes in the paradigms that guideCD treatment remains poorly known.1
Surgery is nowadays considered as an option when medicaltherapy fails; conversely, in the past decades, surgery was animportant step in CD treatment, with more than 40% of thepatients being submitted to at least one disease-related abdominalsurgery, most of them in the first year of the disease course.6 Morerecently, Peyrin-Biroulet et al1 described a cumulative risk of 40%to 55% to undergo surgery in the initial 10 years after diagnosis.Surgical laparoscopic approaches became increasingly commonand have low complication and conversion rates, decreased mor-bidity, and reduced costs.7,8 Although laparoscopy can be usedsafely even in those with recurrent diseases, it did not seem todecrease the risk of recurrence.9
The concept of “disabling disease” in inflammatory boweldisease was introduced by Beaugerie10 in 2006 and furtherexplored by Loly et al11 in 2008. These authors defined disablingdisease by the presence of at least one of the following criteria: 2steroid courses required and/or steroid dependency; further hos-pitalization after diagnosis or complications of the disease;chronic symptoms; immunosuppressive therapy; and intestinalresection or surgical operation for perianal disease. In 2011, Yanget al12 used a similar disabling definition but without the inclusionof chronic symptoms (diarrhea, fever, fatigue, etc.). Currently,there is no consensus regarding the definition of disabling disease;in fact, “disabling” is a dynamic concept that necessarily changeswith the evolution of medical techniques and the different strate-gies followed to achieve disease control.
This study aimed to identify the impact of 2 differenttherapeutic approaches to CD—early surgery and/or immunosup-pression—on disease outcomes, namely disabling events and theneed for further surgeries.
METHODSThis was a nationwide, multicentric, and retrospective
study. Patients with CD from 14 Portuguese inflammatory boweldisease referral centers were consecutively included. The inclu-sion criteria were as follows: (1) a definitive diagnosis of CD; (2)
more than 3 years of follow-up; and (3) aged older than 18 years.The entire population was split into 2 groups: patients whounderwent an early surgery (i.e., within the initial 6 months afterdiagnosis) before starting any immunosuppressive therapy (groupS)—for these patients, the index event was the first surgery; andpatients who started immunosuppression before any surgery(group I)—for these patients, the index event was the diagnosis.These 2 groups were further stratified by the time of the introduc-tion of immunosuppressive medication after the index event:within the initial 6 months (very early introduction), betweenthe 6th and the 36th month, and after the 36th month (late intro-duction). Being an observational study, these groups reflected thedifferent clinical approaches motivated by the aggressiveness ofthe disease.
Demographic and clinical information was collected for eachpatient, including date of birth, date of CD diagnosis, presence ofperianal disease, and smoking habits. Age at diagnosis, diseaselocation, and phenotype were classified according to the Montrealclassification.13 The date of the first abdominal surgery and the totalnumber of surgeries during the follow-up period were also col-lected, as was data concerning therapy (type and onset date).Steroid use was classified into 6 categories: never exposed to thedrug, 1 steroid course per year, 2 or more steroids courses per year,1 course every 3 years, steroid dependence, or steroid refractori-ness. The definition of steroid dependence was the inability toreduce steroids below the equivalent of 10 mg/d prednisolonewithin 3 months of starting steroids without recurrent active diseaseor disease relapse within 3 months of stopping steroids. Steroidresistance was defined as the presence of active disease despitea prednisolone dose of up to 0.75 mg$kg21$d21 over a period of4 weeks.14 The number of hospital admissions directly related toCD and the appearance of clinical events after the index episode(fistula, abscess, stenosis, perforation, or anal disease) and the timepoint at which they occurred were also collected. The concept ofglobal disabling disease was defined by the presence of one of thefollowing criteria: more than 1 abdominal surgery or 2 hospitaladmissions in the follow-up period; more than 2 courses of steroidsper year, steroid dependence or steroid refractoriness; need toswitch the initial immunosuppressor or anti-TNF a; and the appear-ance of new clinical events after the index episode (fistula, abscess,stenosis, perforation, or anal disease).15 All data were collectedfrom a web database, and the investigators reviewed all the missingdata and discrepancies. The study was monitored by the nationalcoordinator of the Portuguese IBD group (GEDII).
Statistical AnalysisCategorical variables were described through absolute (n)
and relative (%) frequencies, and continuous variables weredescribed by their median, minimum, and maximum. Hypotheseswere tested regarding the distribution of continuous variables withnonnormal distribution using the nonparametric Mann–Whitneyand Kruskal–Wallis tests, depending on the nature of the hypoth-esis. When testing a hypothesis regarding categorical variables,a chi-square test or a Fisher’s exact test was used, as appropriate.
Magro et al Inflamm Bowel Dis ! Volume 23, Number 2, February 2017
290 | www.ibdjournal.org
5. CLASSIFICATION
48
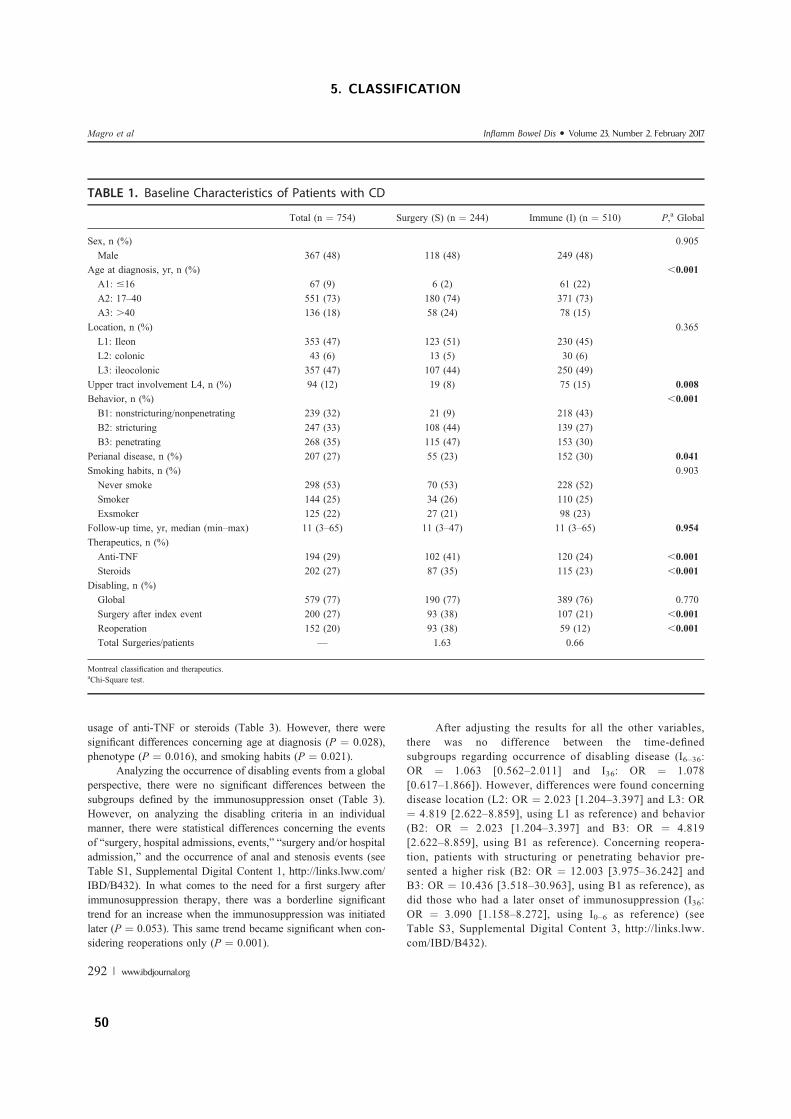
usage of anti-TNF or steroids (Table 3). However, there weresignificant differences concerning age at diagnosis (P ¼ 0.028),phenotype (P ¼ 0.016), and smoking habits (P ¼ 0.021).
Analyzing the occurrence of disabling events from a globalperspective, there were no significant differences between thesubgroups defined by the immunosuppression onset (Table 3).However, on analyzing the disabling criteria in an individualmanner, there were statistical differences concerning the eventsof “surgery, hospital admissions, events,” “surgery and/or hospitaladmission,” and the occurrence of anal and stenosis events (seeTable S1, Supplemental Digital Content 1, http://links.lww.com/IBD/B432). In what comes to the need for a first surgery afterimmunosuppression therapy, there was a borderline significanttrend for an increase when the immunosuppression was initiatedlater (P ¼ 0.053). This same trend became significant when con-sidering reoperations only (P ¼ 0.001).
After adjusting the results for all the other variables,there was no difference between the time-definedsubgroups regarding occurrence of disabling disease (I6–36:OR ¼ 1.063 [0.562–2.011] and I36: OR ¼ 1.078[0.617–1.866]). However, differences were found concerningdisease location (L2: OR ¼ 2.023 [1.204–3.397] and L3: OR¼ 4.819 [2.622–8.859], using L1 as reference) and behavior(B2: OR ¼ 2.023 [1.204–3.397] and B3: OR ¼ 4.819[2.622–8.859], using B1 as reference). Concerning reopera-tion, patients with structuring or penetrating behavior pre-sented a higher risk (B2: OR ¼ 12.003 [3.975–36.242] andB3: OR ¼ 10.436 [3.518–30.963], using B1 as reference), asdid those who had a later onset of immunosuppression (I36:OR ¼ 3.090 [1.158–8.272], using I0–6 as reference) (seeTable S3, Supplemental Digital Content 3, http://links.lww.com/IBD/B432).
TABLE 1. Baseline Characteristics of Patients with CD
Total (n ¼ 754) Surgery (S) (n ¼ 244) Immune (I) (n ¼ 510) P,a Global
Sex, n (%) 0.905Male 367 (48) 118 (48) 249 (48)
Age at diagnosis, yr, n (%) ,0.001A1: #16 67 (9) 6 (2) 61 (22)A2: 17–40 551 (73) 180 (74) 371 (73)A3: .40 136 (18) 58 (24) 78 (15)
Location, n (%) 0.365L1: Ileon 353 (47) 123 (51) 230 (45)L2: colonic 43 (6) 13 (5) 30 (6)L3: ileocolonic 357 (47) 107 (44) 250 (49)
Upper tract involvement L4, n (%) 94 (12) 19 (8) 75 (15) 0.008Behavior, n (%) ,0.001B1: nonstricturing/nonpenetrating 239 (32) 21 (9) 218 (43)B2: stricturing 247 (33) 108 (44) 139 (27)B3: penetrating 268 (35) 115 (47) 153 (30)
Perianal disease, n (%) 207 (27) 55 (23) 152 (30) 0.041Smoking habits, n (%) 0.903Never smoke 298 (53) 70 (53) 228 (52)Smoker 144 (25) 34 (26) 110 (25)Exsmoker 125 (22) 27 (21) 98 (23)
Follow-up time, yr, median (min–max) 11 (3–65) 11 (3–47) 11 (3–65) 0.954Therapeutics, n (%)Anti-TNF 194 (29) 102 (41) 120 (24) ,0.001Steroids 202 (27) 87 (35) 115 (23) ,0.001
Disabling, n (%)Global 579 (77) 190 (77) 389 (76) 0.770Surgery after index event 200 (27) 93 (38) 107 (21) ,0.001Reoperation 152 (20) 93 (38) 59 (12) ,0.001Total Surgeries/patients — 1.63 0.66
Montreal classification and therapeutics.aChi-Square test.
Magro et al Inflamm Bowel Dis " Volume 23, Number 2, February 2017
292 | www.ibdjournal.org
5. CLASSIFICATION
50
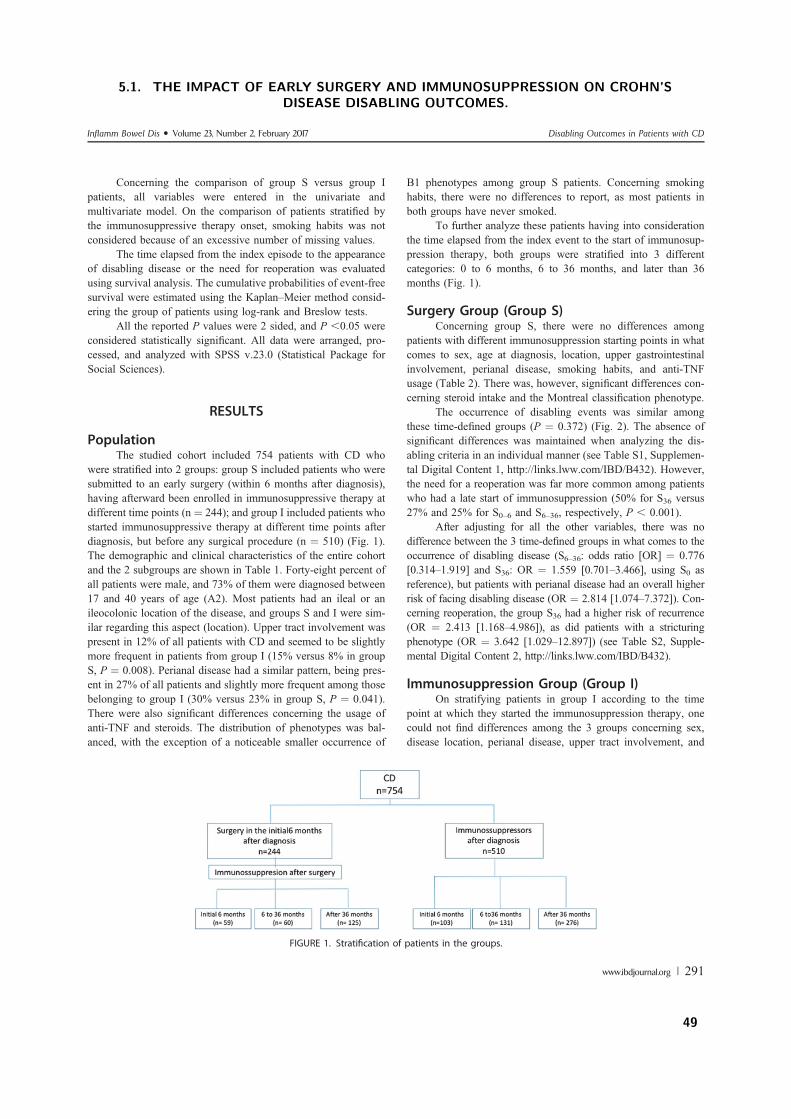
Concerning the comparison of group S versus group Ipatients, all variables were entered in the univariate andmultivariate model. On the comparison of patients stratified bythe immunosuppressive therapy onset, smoking habits was notconsidered because of an excessive number of missing values.
The time elapsed from the index episode to the appearanceof disabling disease or the need for reoperation was evaluatedusing survival analysis. The cumulative probabilities of event-freesurvival were estimated using the Kaplan–Meier method consid-ering the group of patients using log-rank and Breslow tests.
All the reported P values were 2 sided, and P ,0.05 wereconsidered statistically significant. All data were arranged, pro-cessed, and analyzed with SPSS v.23.0 (Statistical Package forSocial Sciences).
RESULTS
PopulationThe studied cohort included 754 patients with CD who
were stratified into 2 groups: group S included patients who weresubmitted to an early surgery (within 6 months after diagnosis),having afterward been enrolled in immunosuppressive therapy atdifferent time points (n ¼ 244); and group I included patients whostarted immunosuppressive therapy at different time points afterdiagnosis, but before any surgical procedure (n ¼ 510) (Fig. 1).The demographic and clinical characteristics of the entire cohortand the 2 subgroups are shown in Table 1. Forty-eight percent ofall patients were male, and 73% of them were diagnosed between17 and 40 years of age (A2). Most patients had an ileal or anileocolonic location of the disease, and groups S and I were sim-ilar regarding this aspect (location). Upper tract involvement waspresent in 12% of all patients with CD and seemed to be slightlymore frequent in patients from group I (15% versus 8% in groupS, P ¼ 0.008). Perianal disease had a similar pattern, being pres-ent in 27% of all patients and slightly more frequent among thosebelonging to group I (30% versus 23% in group S, P ¼ 0.041).There were also significant differences concerning the usage ofanti-TNF and steroids. The distribution of phenotypes was bal-anced, with the exception of a noticeable smaller occurrence of
B1 phenotypes among group S patients. Concerning smokinghabits, there were no differences to report, as most patients inboth groups have never smoked.
To further analyze these patients having into considerationthe time elapsed from the index event to the start of immunosup-pression therapy, both groups were stratified into 3 differentcategories: 0 to 6 months, 6 to 36 months, and later than 36months (Fig. 1).
Surgery Group (Group S)Concerning group S, there were no differences among
patients with different immunosuppression starting points in whatcomes to sex, age at diagnosis, location, upper gastrointestinalinvolvement, perianal disease, smoking habits, and anti-TNFusage (Table 2). There was, however, significant differences con-cerning steroid intake and the Montreal classification phenotype.
The occurrence of disabling events was similar amongthese time-defined groups (P ¼ 0.372) (Fig. 2). The absence ofsignificant differences was maintained when analyzing the dis-abling criteria in an individual manner (see Table S1, Supplemen-tal Digital Content 1, http://links.lww.com/IBD/B432). However,the need for a reoperation was far more common among patientswho had a late start of immunosuppression (50% for S36 versus27% and 25% for S0–6 and S6–36, respectively, P , 0.001).
After adjusting for all the other variables, there was nodifference between the 3 time-defined groups in what comes to theoccurrence of disabling disease (S6–36: odds ratio [OR] ¼ 0.776[0.314–1.919] and S36: OR ¼ 1.559 [0.701–3.466], using S0 asreference), but patients with perianal disease had an overall higherrisk of facing disabling disease (OR ¼ 2.814 [1.074–7.372]). Con-cerning reoperation, the group S36 had a higher risk of recurrence(OR ¼ 2.413 [1.168–4.986]), as did patients with a stricturingphenotype (OR ¼ 3.642 [1.029–12.897]) (see Table S2, Supple-mental Digital Content 2, http://links.lww.com/IBD/B432).
Immunosuppression Group (Group I)On stratifying patients in group I according to the time
point at which they started the immunosuppression therapy, onecould not find differences among the 3 groups concerning sex,disease location, perianal disease, upper tract involvement, and
FIGURE 1. Stratification of patients in the groups.
Inflamm Bowel Dis " Volume 23, Number 2, February 2017 Disabling Outcomes in Patients with CD
www.ibdjournal.org | 291
5.1. THE IMPACT OF EARLY SURGERY AND IMMUNOSUPPRESSION ON CROHN’SDISEASE DISABLING OUTCOMES.
49
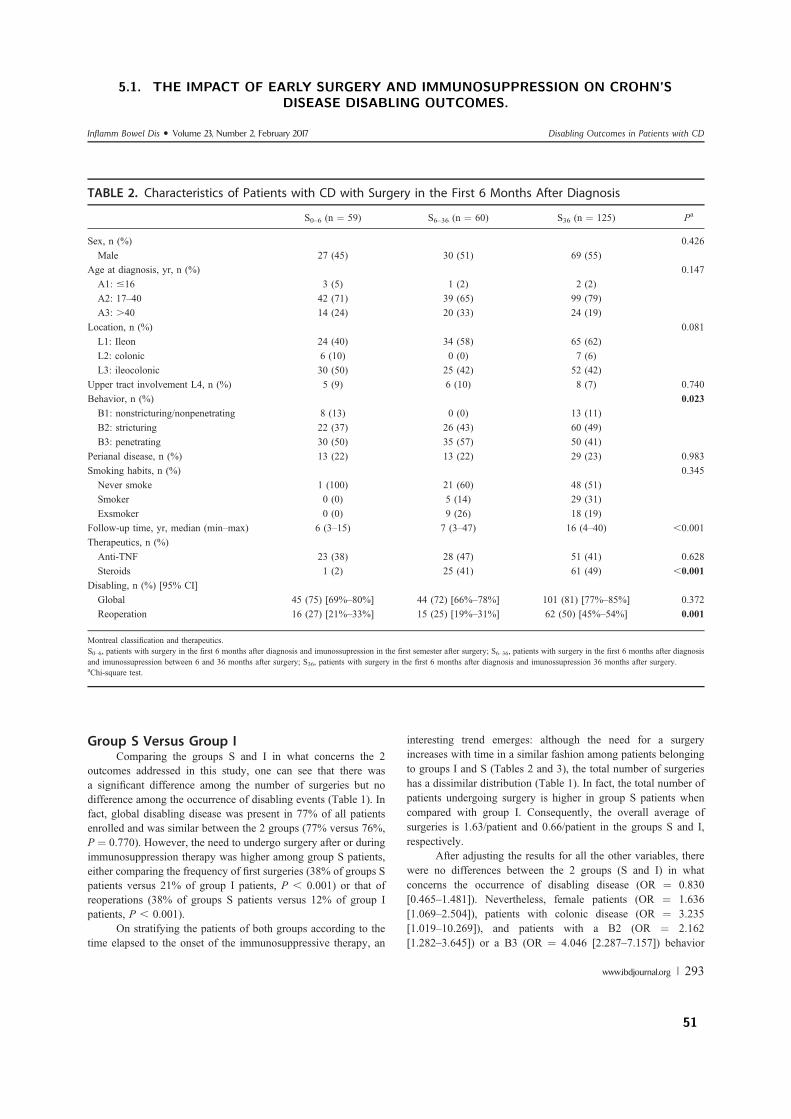
Group S Versus Group IComparing the groups S and I in what concerns the 2
outcomes addressed in this study, one can see that there wasa significant difference among the number of surgeries but nodifference among the occurrence of disabling events (Table 1). Infact, global disabling disease was present in 77% of all patientsenrolled and was similar between the 2 groups (77% versus 76%,P ¼ 0.770). However, the need to undergo surgery after or duringimmunosuppression therapy was higher among group S patients,either comparing the frequency of first surgeries (38% of groups Spatients versus 21% of group I patients, P , 0.001) or that ofreoperations (38% of groups S patients versus 12% of group Ipatients, P , 0.001).
On stratifying the patients of both groups according to thetime elapsed to the onset of the immunosuppressive therapy, an
interesting trend emerges: although the need for a surgeryincreases with time in a similar fashion among patients belongingto groups I and S (Tables 2 and 3), the total number of surgerieshas a dissimilar distribution (Table 1). In fact, the total number ofpatients undergoing surgery is higher in group S patients whencompared with group I. Consequently, the overall average ofsurgeries is 1.63/patient and 0.66/patient in the groups S and I,respectively.
After adjusting the results for all the other variables, therewere no differences between the 2 groups (S and I) in whatconcerns the occurrence of disabling disease (OR ¼ 0.830[0.465–1.481]). Nevertheless, female patients (OR ¼ 1.636[1.069–2.504]), patients with colonic disease (OR ¼ 3.235[1.019–10.269]), and patients with a B2 (OR ¼ 2.162[1.282–3.645]) or a B3 (OR ¼ 4.046 [2.287–7.157]) behavior
TABLE 2. Characteristics of Patients with CD with Surgery in the First 6 Months After Diagnosis
S0–6 (n ¼ 59) S6–36 (n ¼ 60) S36 (n ¼ 125) Pa
Sex, n (%) 0.426Male 27 (45) 30 (51) 69 (55)
Age at diagnosis, yr, n (%) 0.147A1: #16 3 (5) 1 (2) 2 (2)A2: 17–40 42 (71) 39 (65) 99 (79)A3: .40 14 (24) 20 (33) 24 (19)
Location, n (%) 0.081L1: Ileon 24 (40) 34 (58) 65 (62)L2: colonic 6 (10) 0 (0) 7 (6)L3: ileocolonic 30 (50) 25 (42) 52 (42)
Upper tract involvement L4, n (%) 5 (9) 6 (10) 8 (7) 0.740Behavior, n (%) 0.023B1: nonstricturing/nonpenetrating 8 (13) 0 (0) 13 (11)B2: stricturing 22 (37) 26 (43) 60 (49)B3: penetrating 30 (50) 35 (57) 50 (41)
Perianal disease, n (%) 13 (22) 13 (22) 29 (23) 0.983Smoking habits, n (%) 0.345Never smoke 1 (100) 21 (60) 48 (51)Smoker 0 (0) 5 (14) 29 (31)Exsmoker 0 (0) 9 (26) 18 (19)
Follow-up time, yr, median (min–max) 6 (3–15) 7 (3–47) 16 (4–40) ,0.001Therapeutics, n (%)Anti-TNF 23 (38) 28 (47) 51 (41) 0.628Steroids 1 (2) 25 (41) 61 (49) ,0.001
Disabling, n (%) [95% CI]Global 45 (75) [69%–80%] 44 (72) [66%–78%] 101 (81) [77%–85%] 0.372Reoperation 16 (27) [21%–33%] 15 (25) [19%–31%] 62 (50) [45%–54%] 0.001
Montreal classification and therapeutics.S0–6, patients with surgery in the first 6 months after diagnosis and imunossupression in the first semester after surgery; S6–36, patients with surgery in the first 6 months after diagnosisand imunossupression between 6 and 36 months after surgery; S36, patients with surgery in the first 6 months after diagnosis and imunossupression 36 months after surgery.aChi-square test.
Inflamm Bowel Dis " Volume 23, Number 2, February 2017 Disabling Outcomes in Patients with CD
www.ibdjournal.org | 293
5.1. THE IMPACT OF EARLY SURGERY AND IMMUNOSUPPRESSION ON CROHN’SDISEASE DISABLING OUTCOMES.
51
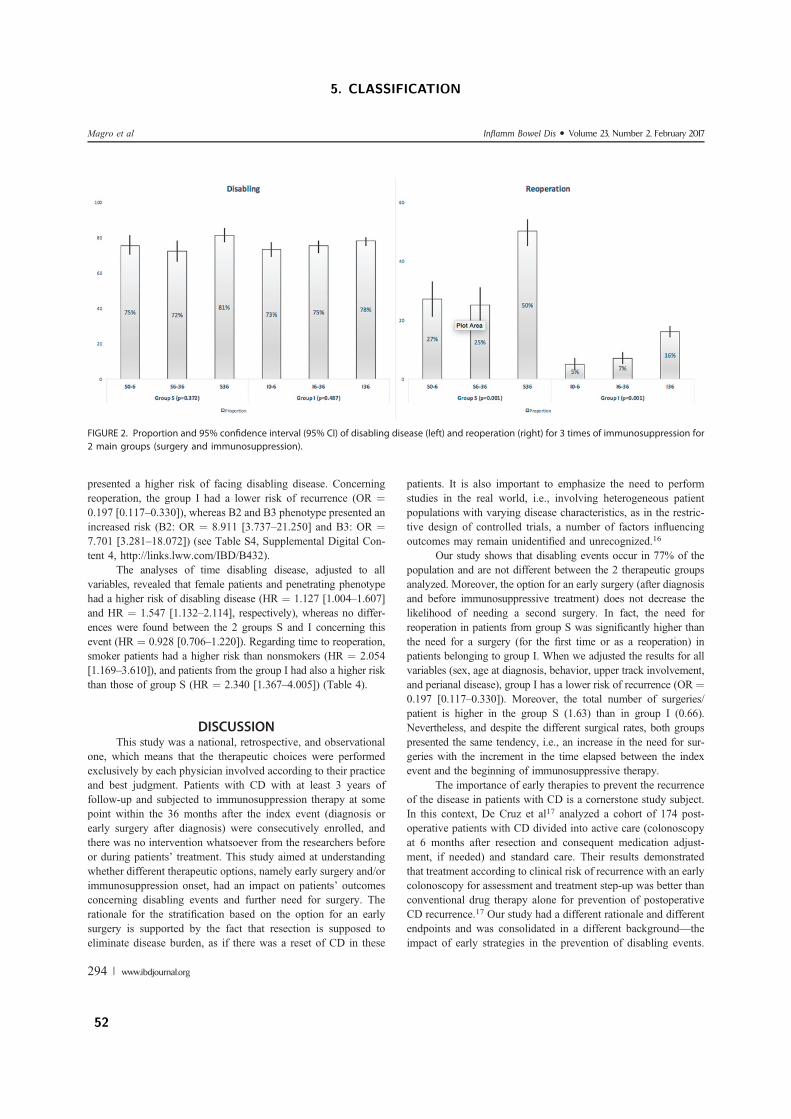
presented a higher risk of facing disabling disease. Concerningreoperation, the group I had a lower risk of recurrence (OR ¼0.197 [0.117–0.330]), whereas B2 and B3 phenotype presented anincreased risk (B2: OR ¼ 8.911 [3.737–21.250] and B3: OR ¼7.701 [3.281–18.072]) (see Table S4, Supplemental Digital Con-tent 4, http://links.lww.com/IBD/B432).
The analyses of time disabling disease, adjusted to allvariables, revealed that female patients and penetrating phenotypehad a higher risk of disabling disease (HR ¼ 1.127 [1.004–1.607]and HR ¼ 1.547 [1.132–2.114], respectively), whereas no differ-ences were found between the 2 groups S and I concerning thisevent (HR ¼ 0.928 [0.706–1.220]). Regarding time to reoperation,smoker patients had a higher risk than nonsmokers (HR ¼ 2.054[1.169–3.610]), and patients from the group I had also a higher riskthan those of group S (HR ¼ 2.340 [1.367–4.005]) (Table 4).
DISCUSSIONThis study was a national, retrospective, and observational
one, which means that the therapeutic choices were performedexclusively by each physician involved according to their practiceand best judgment. Patients with CD with at least 3 years offollow-up and subjected to immunosuppression therapy at somepoint within the 36 months after the index event (diagnosis orearly surgery after diagnosis) were consecutively enrolled, andthere was no intervention whatsoever from the researchers beforeor during patients’ treatment. This study aimed at understandingwhether different therapeutic options, namely early surgery and/orimmunosuppression onset, had an impact on patients’ outcomesconcerning disabling events and further need for surgery. Therationale for the stratification based on the option for an earlysurgery is supported by the fact that resection is supposed toeliminate disease burden, as if there was a reset of CD in these
patients. It is also important to emphasize the need to performstudies in the real world, i.e., involving heterogeneous patientpopulations with varying disease characteristics, as in the restric-tive design of controlled trials, a number of factors influencingoutcomes may remain unidentified and unrecognized.16
Our study shows that disabling events occur in 77% of thepopulation and are not different between the 2 therapeutic groupsanalyzed. Moreover, the option for an early surgery (after diagnosisand before immunosuppressive treatment) does not decrease thelikelihood of needing a second surgery. In fact, the need forreoperation in patients from group S was significantly higher thanthe need for a surgery (for the first time or as a reoperation) inpatients belonging to group I. When we adjusted the results for allvariables (sex, age at diagnosis, behavior, upper track involvement,and perianal disease), group I has a lower risk of recurrence (OR ¼0.197 [0.117–0.330]). Moreover, the total number of surgeries/patient is higher in the group S (1.63) than in group I (0.66).Nevertheless, and despite the different surgical rates, both groupspresented the same tendency, i.e., an increase in the need for sur-geries with the increment in the time elapsed between the indexevent and the beginning of immunosuppressive therapy.
The importance of early therapies to prevent the recurrenceof the disease in patients with CD is a cornerstone study subject.In this context, De Cruz et al17 analyzed a cohort of 174 post-operative patients with CD divided into active care (colonoscopyat 6 months after resection and consequent medication adjust-ment, if needed) and standard care. Their results demonstratedthat treatment according to clinical risk of recurrence with an earlycolonoscopy for assessment and treatment step-up was better thanconventional drug therapy alone for prevention of postoperativeCD recurrence.17 Our study had a different rationale and differentendpoints and was consolidated in a different background—theimpact of early strategies in the prevention of disabling events.
FIGURE 2. Proportion and 95% confidence interval (95% CI) of disabling disease (left) and reoperation (right) for 3 times of immunosuppression for2 main groups (surgery and immunosuppression).
Magro et al Inflamm Bowel Dis " Volume 23, Number 2, February 2017
294 | www.ibdjournal.org
5. CLASSIFICATION
52
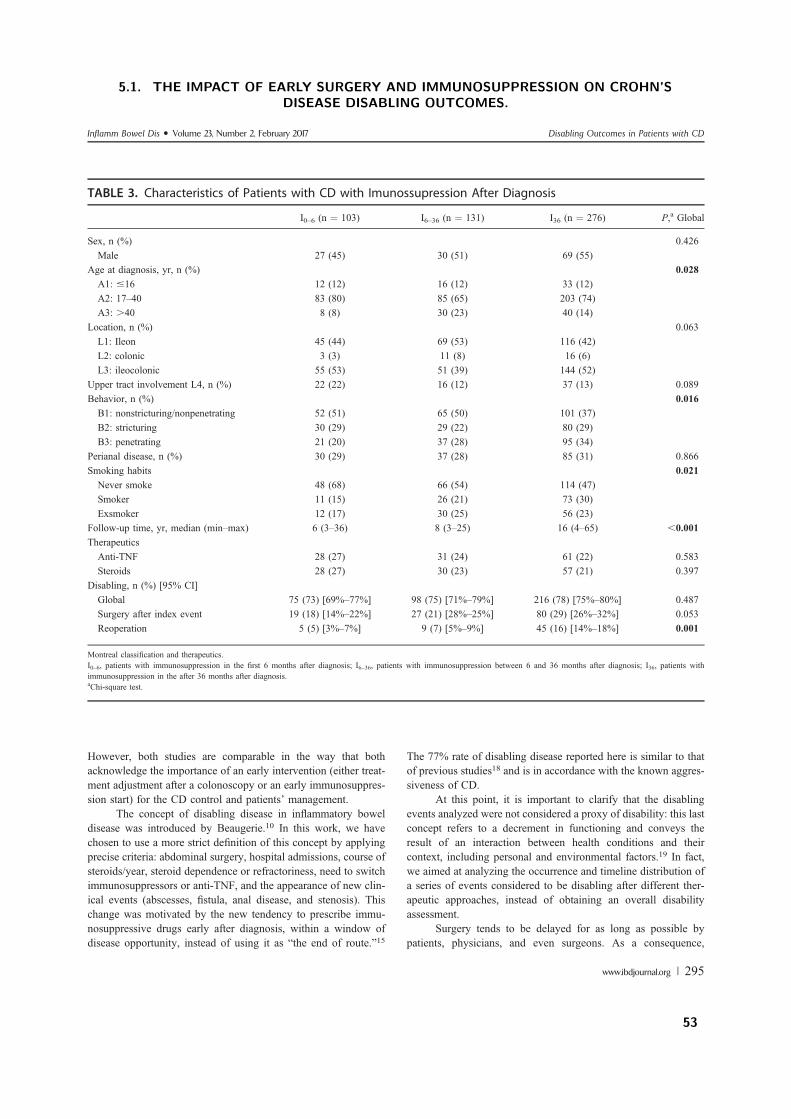
However, both studies are comparable in the way that bothacknowledge the importance of an early intervention (either treat-ment adjustment after a colonoscopy or an early immunosuppres-sion start) for the CD control and patients’ management.
The concept of disabling disease in inflammatory boweldisease was introduced by Beaugerie.10 In this work, we havechosen to use a more strict definition of this concept by applyingprecise criteria: abdominal surgery, hospital admissions, course ofsteroids/year, steroid dependence or refractoriness, need to switchimmunosuppressors or anti-TNF, and the appearance of new clin-ical events (abscesses, fistula, anal disease, and stenosis). Thischange was motivated by the new tendency to prescribe immu-nosuppressive drugs early after diagnosis, within a window ofdisease opportunity, instead of using it as “the end of route.”15
The 77% rate of disabling disease reported here is similar to thatof previous studies18 and is in accordance with the known aggres-siveness of CD.
At this point, it is important to clarify that the disablingevents analyzed were not considered a proxy of disability: this lastconcept refers to a decrement in functioning and conveys theresult of an interaction between health conditions and theircontext, including personal and environmental factors.19 In fact,we aimed at analyzing the occurrence and timeline distribution ofa series of events considered to be disabling after different ther-apeutic approaches, instead of obtaining an overall disabilityassessment.
Surgery tends to be delayed for as long as possible bypatients, physicians, and even surgeons. As a consequence,
TABLE 3. Characteristics of Patients with CD with Imunossupression After Diagnosis
I0–6 (n ¼ 103) I6–36 (n ¼ 131) I36 (n ¼ 276) P,a Global
Sex, n (%) 0.426Male 27 (45) 30 (51) 69 (55)
Age at diagnosis, yr, n (%) 0.028A1: #16 12 (12) 16 (12) 33 (12)A2: 17–40 83 (80) 85 (65) 203 (74)A3: .40 8 (8) 30 (23) 40 (14)
Location, n (%) 0.063L1: Ileon 45 (44) 69 (53) 116 (42)L2: colonic 3 (3) 11 (8) 16 (6)L3: ileocolonic 55 (53) 51 (39) 144 (52)
Upper tract involvement L4, n (%) 22 (22) 16 (12) 37 (13) 0.089Behavior, n (%) 0.016B1: nonstricturing/nonpenetrating 52 (51) 65 (50) 101 (37)B2: stricturing 30 (29) 29 (22) 80 (29)B3: penetrating 21 (20) 37 (28) 95 (34)
Perianal disease, n (%) 30 (29) 37 (28) 85 (31) 0.866Smoking habits 0.021Never smoke 48 (68) 66 (54) 114 (47)Smoker 11 (15) 26 (21) 73 (30)Exsmoker 12 (17) 30 (25) 56 (23)
Follow-up time, yr, median (min–max) 6 (3–36) 8 (3–25) 16 (4–65) ,0.001TherapeuticsAnti-TNF 28 (27) 31 (24) 61 (22) 0.583Steroids 28 (27) 30 (23) 57 (21) 0.397
Disabling, n (%) [95% CI]Global 75 (73) [69%–77%] 98 (75) [71%–79%] 216 (78) [75%–80%] 0.487Surgery after index event 19 (18) [14%–22%] 27 (21) [28%–25%] 80 (29) [26%–32%] 0.053Reoperation 5 (5) [3%–7%] 9 (7) [5%–9%] 45 (16) [14%–18%] 0.001
Montreal classification and therapeutics.I0–6, patients with immunosuppression in the first 6 months after diagnosis; I6–36, patients with immunosuppression between 6 and 36 months after diagnosis; I36, patients withimmunosuppression in the after 36 months after diagnosis.aChi-square test.
Inflamm Bowel Dis " Volume 23, Number 2, February 2017 Disabling Outcomes in Patients with CD
www.ibdjournal.org | 295
5.1. THE IMPACT OF EARLY SURGERY AND IMMUNOSUPPRESSION ON CROHN’SDISEASE DISABLING OUTCOMES.
53
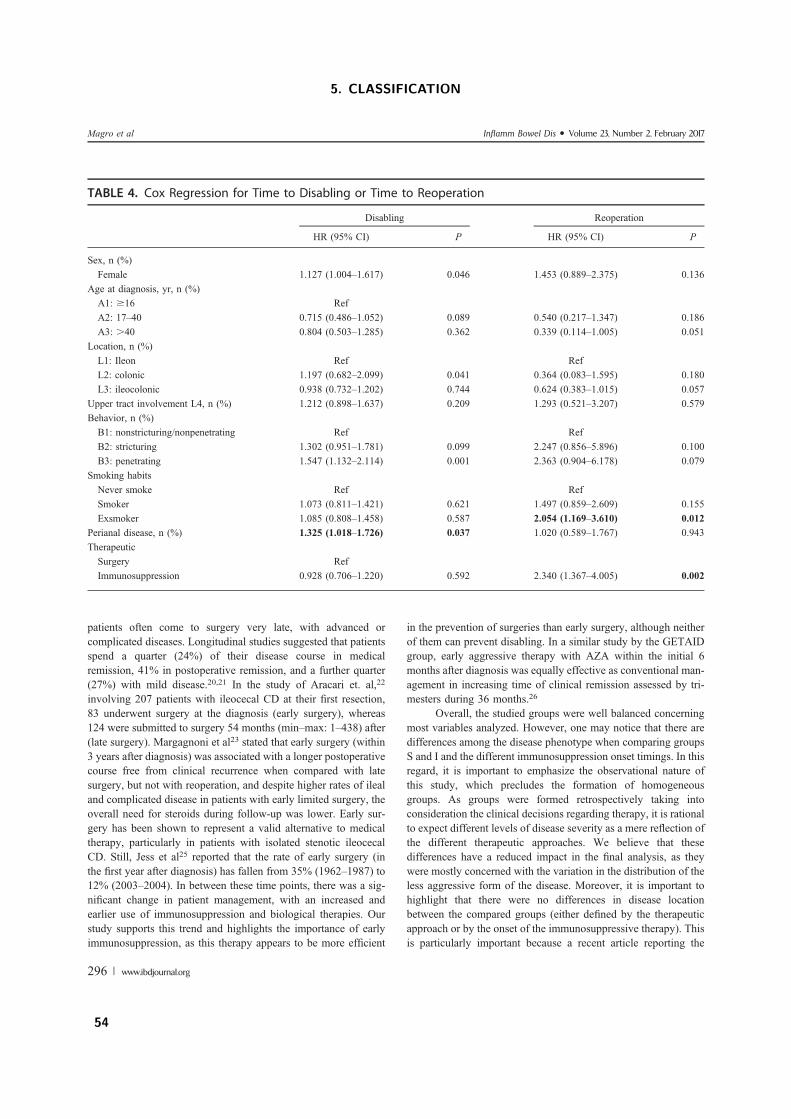
patients often come to surgery very late, with advanced orcomplicated diseases. Longitudinal studies suggested that patientsspend a quarter (24%) of their disease course in medicalremission, 41% in postoperative remission, and a further quarter(27%) with mild disease.20,21 In the study of Aracari et. al,22
involving 207 patients with ileocecal CD at their first resection,83 underwent surgery at the diagnosis (early surgery), whereas124 were submitted to surgery 54 months (min–max: 1–438) after(late surgery). Margagnoni et al23 stated that early surgery (within3 years after diagnosis) was associated with a longer postoperativecourse free from clinical recurrence when compared with latesurgery, but not with reoperation, and despite higher rates of ilealand complicated disease in patients with early limited surgery, theoverall need for steroids during follow-up was lower. Early sur-gery has been shown to represent a valid alternative to medicaltherapy, particularly in patients with isolated stenotic ileocecalCD. Still, Jess et al25 reported that the rate of early surgery (inthe first year after diagnosis) has fallen from 35% (1962–1987) to12% (2003–2004). In between these time points, there was a sig-nificant change in patient management, with an increased andearlier use of immunosuppression and biological therapies. Ourstudy supports this trend and highlights the importance of earlyimmunosuppression, as this therapy appears to be more efficient
in the prevention of surgeries than early surgery, although neitherof them can prevent disabling. In a similar study by the GETAIDgroup, early aggressive therapy with AZA within the initial 6months after diagnosis was equally effective as conventional man-agement in increasing time of clinical remission assessed by tri-mesters during 36 months.26
Overall, the studied groups were well balanced concerningmost variables analyzed. However, one may notice that there aredifferences among the disease phenotype when comparing groupsS and I and the different immunosuppression onset timings. In thisregard, it is important to emphasize the observational nature ofthis study, which precludes the formation of homogeneousgroups. As groups were formed retrospectively taking intoconsideration the clinical decisions regarding therapy, it is rationalto expect different levels of disease severity as a mere reflection ofthe different therapeutic approaches. We believe that thesedifferences have a reduced impact in the final analysis, as theywere mostly concerned with the variation in the distribution of theless aggressive form of the disease. Moreover, it is important tohighlight that there were no differences in disease locationbetween the compared groups (either defined by the therapeuticapproach or by the onset of the immunosuppressive therapy). Thisis particularly important because a recent article reporting the
TABLE 4. Cox Regression for Time to Disabling or Time to Reoperation
Disabling Reoperation
HR (95% CI) P HR (95% CI) P
Sex, n (%)Female 1.127 (1.004–1.617) 0.046 1.453 (0.889–2.375) 0.136
Age at diagnosis, yr, n (%)A1: $16 RefA2: 17–40 0.715 (0.486–1.052) 0.089 0.540 (0.217–1.347) 0.186A3: .40 0.804 (0.503–1.285) 0.362 0.339 (0.114–1.005) 0.051
Location, n (%)L1: Ileon Ref RefL2: colonic 1.197 (0.682–2.099) 0.041 0.364 (0.083–1.595) 0.180L3: ileocolonic 0.938 (0.732–1.202) 0.744 0.624 (0.383–1.015) 0.057
Upper tract involvement L4, n (%) 1.212 (0.898–1.637) 0.209 1.293 (0.521–3.207) 0.579Behavior, n (%)B1: nonstricturing/nonpenetrating Ref RefB2: stricturing 1.302 (0.951–1.781) 0.099 2.247 (0.856–5.896) 0.100B3: penetrating 1.547 (1.132–2.114) 0.001 2.363 (0.904–6.178) 0.079
Smoking habitsNever smoke Ref RefSmoker 1.073 (0.811–1.421) 0.621 1.497 (0.859–2.609) 0.155Exsmoker 1.085 (0.808–1.458) 0.587 2.054 (1.169–3.610) 0.012
Perianal disease, n (%) 1.325 (1.018–1.726) 0.037 1.020 (0.589–1.767) 0.943TherapeuticSurgery RefImmunosuppression 0.928 (0.706–1.220) 0.592 2.340 (1.367–4.005) 0.002
Magro et al Inflamm Bowel Dis ! Volume 23, Number 2, February 2017
296 | www.ibdjournal.org
5. CLASSIFICATION
54
largest genotype–phenotype association study ever performed ininflammatory bowel diseases highlighted the role of diseaselocation as an intrinsic aspect of a patient’s disease, in partgenetically determined.27 In fact, and after correcting for diseaselocation and age at diagnosis, there was little or no geneticassociation with disease behavior, which tends to change dra-matically over time.
The authors are aware of the possible limitations of thepresent work including (1) the retrospective nature of the studythat, although addressed as far as possible with the adjustedregression methods, may have led to a biased underestimation ofthe protective effect of surgery for disabling disease; (2) thetiming of the surgery in the surgical groups was determined by theclinical presentation and not by a physician’s strategic decisionbecause most of the patients were operated because of acuteabdomen, abscesses, or acute symptoms; and (3) different medicaland surgical strategies during the follow-up period. However, wetried to limit these drawbacks by (1) monitoring the inclusion witha data entry monitor; (2) defining the inclusion and exclusioncriteria well at the beginning of the study; and (3) creatinga web platform for the purpose of the study, which automaticallysent missing data reports.
Overall, this study shows that neither early surgery norearly immunosuppression can prevent the occurrence of disablingevents in patients with CD. However, immunosuppression as thefirst therapy after diagnosis is effective in preventing futuresurgeries, being its efficiency higher with an earlier start.However, patients undergoing an early surgery after diagnosishave an increased tendency to be reoperated, even with a con-comitantly early start of immunosuppression therapy.
REFERENCES1. Peyrin-Biroulet L, Loftus EV, Colombel JF, et al. The natural history of
adult Crohn’s disease in population-based cohorts. Am J Gastroenterol.2010;105:289–297.
2. Pariente B, Cosnes J, Danese S, et al. Development of the Crohn’s diseasedigestive damage score, the Lémann score. Inflamm Bowel Dis. 2011;17:1415–1422.
3. Feagan BG, Greenberg GR, Wild G, et al. Treatment of active Crohn’sdisease with MLN0002, a humanized antibody to the alpha4beta7 integ-rin. Clin Gastroenterol Hepatol. 2008;6:1370–1377.
4. Sandborn WJ, Gasink C, Gao LL, et al. Ustekinumab induction andmaintenance therapy in refractory Crohn’s disease. N Engl J Med.2012;367:1519–1528.
5. Rubin DT, Panaccione R, Chao J, et al. A practical, evidence-based guideto the use of adalimumab in Crohn’s disease. Curr Med Res Opin. 2011;27:1803–1813.
6. Chatu S, Saxena S, Subramanian V, et al. The impact of timing andduration of thiopurine treatment on first intestinal resection in Crohn’s
disease: National UK Population-Based Study 1989–2010. Am J Gastro-enterol. 2014;109:409–416.
7. Agrez MV, Valente RM, Pierce W, et al. Surgical history of Crohn’sdisease in a well-defined population. Mayo Clin Proc. 1982;57:747–752.
8. Huang R, Valerian BT, Lee EC. Laparoscopic approach in patients withrecurrent Crohn’s disease. Am Surg. 2012;78:595–599.
9. Lee Y, Fleming FJ, Deeb A-P, et al. A laparoscopic approach reducesshort-term complications and length of stay following ileocolic resectionin Crohn’s disease: an analysis of outcomes from the NSQIP database.Colorectal Dis. 2012;14:572–577.
10. Beaugerie L, Seksik P, Nion-Larmurier I, et al. Predictors of Crohn’sdisease. Gastroenterology. 2006;130:650–656.
11. Loly C, Belaiche J, Louis E. Predictors of severe Crohn’s disease. Scand JGastroenterol. 2008;43:948–954.
12. Yang CH, Ding J, Gao Y, et al. Risk factors that predict the requirement ofaggressive therapy among Chinese patients with Crohn’s disease. J DigDis. 2011;12:99–104.
13. Silverberg MS, Satsangi J, Ahmad T, et al. Toward an integrated clinical,molecular and serological classification of inflammatory bowel disease:report of a Working Party of the 2005 Montreal World Congress ofGastroenterology. Can J Gastroenterol. 2005;19(suppl A):5A–36A.
14. Dignass A, Van Assche G, Lindsay JO, et al. The second Europeanevidence-based Consensus on the diagnosis and management of Crohn’sdisease: current management. J Crohns Colitis. 2010;4:28–62.
15. Dias CC, Rodrigues PP, Coelho R, et al. Development and validation ofrisk matrices for Crohn’s disease outcomes in patients submitted to earlytherapeutic interventions. J Crohns Colitis. 2016.
16. Mishra D, Vora J. Non interventional drug studies in oncology: why weneed them? Perspect Clin Res. 2010;1:128–133.
17. De Cruz P, Kamm MA, Hamilton AL, et al. Crohn’s disease managementafter intestinal resection: a randomised trial. Lancet. 2015;385:1406–1417.
18. Dias CC, Rodrigues PP, da Costa-Pereira A, et al. Clinical prognosticfactors for disabling Crohn’s disease: a systematic review and meta-anal-ysis. World J Gastroenterol. 2013;19:3866–3871.
19. Peyrin-Biroulet L, Cieza A, Sandborn WJ, et al. Development of the firstdisability index for inflammatory bowel disease based on the internationalclassification of functioning, disability and health. Gut. 2012;61:241–247.
20. Loftus EV, Schoenfeld P, Sandborn WJ. The epidemiology and naturalhistory of Crohn’s disease in population-based patient cohorts from NorthAmerica: a systematic review. Aliment Pharmacol Ther. 2002;16:51–60.
21. Silverstein MD, Loftus EV Jr, Sandborn WJ, et al. Clinical course andcosts of care for Crohn’s disease: Markov model analysis of a population-based cohort. Gastroenterology. 1999;117:49–57.
22. Aratari A, Papi C, Leandro G, et al. Early versus late surgery for ileo-caecal Crohn’s disease. Aliment Pharmacol Ther. 2007;26:1303–1312.
23. Margagnoni G, Aratari A, Mangone M, et al. Natural history of ileo-caecalCrohn’s disease after surgical resection. A long term study. MinervaGastroenterol Dietol. 2011;57:335–344.
24. Golovics PA, Lakatos L, Nagy A, et al. Is early limited surgery associatedwith a more benign disease course in Crohn’s disease? World J Gastro-enterol. 2013;19:7701–7710.
25. Jess T, Riis L, Vind I, et al. Changes in clinical characteristics, course, andprognosis of inflammatory bowel disease during the last 5 decades: a pop-ulation-based study from Copenhagen, Denmark. Inflamm Bowel Dis.2007;13:481–489.
26. Cosnes J, Bourrier A, Laharie D, et al. Early administration of azathio-prine vs conventional management of Crohn’s Disease: a randomizedcontrolled trial. Gastroenterology. 2013;145:758–765.e2; quiz e14–e15.
27. Cleynen I, Boucher G, Jostins L, et al. Inherited determinants of Crohn’sdisease and ulcerative colitis phenotypes: a genetic association study.Lancet. 2016;387:156–167.
Inflamm Bowel Dis ! Volume 23, Number 2, February 2017 Disabling Outcomes in Patients with CD
www.ibdjournal.org | 297
5.1. THE IMPACT OF EARLY SURGERY AND IMMUNOSUPPRESSION ON CROHN’SDISEASE DISABLING OUTCOMES.
55
5. CLASSIFICATION
5.2 The timing of early therapeutics strategies has a significant im-
pact on the Crohn’s disease prognosis
(submitted, 2016)
Claudia Camila Dias, Samuel Fernandes, Francisco Portela, Paula Ministro, Diana Martins, Paula
Sousa, Paula Lago, Isadora Rosa, Luıs Correia, Paula Moura Santos Fernando Magro on behalf
GEDII
56
1
The timing of early therapeutic strategies has a significant impact on the Crohn’s Disease prognosis
Short title: Timing of early therapy on Crohn Disease Cláudia Camila Dias1,2,Samuel Fernandes3, Francisco Portela4, Paula Ministro5, Diana Martins5, Paula Sousa5 Paula Lago6, Isadora Rosa7, Luis Correia3, Paula Moura Santos3 , Fernando Magro8,9,10 on behalf GEDII
1- Health Information and Decision Sciences Department, Faculty of Medicine of the University of Porto, Portugal;
2- CINTESIS - Centre for Research in Health Informatics Systems and Technologies, Porto, Portugal;
3- Centro Hospitalar Lisboa Norte, Hospital de Santa Maria, Portugal 4- Gastroenterology Department, Centro Hospitalar e Universitário de Coimbra, Portugal 5- Gastroenterology Department, Centro Hospitalar Tondela e Viseu, Portugal 6- Gastroenterology Department, Centro Hospitalar do Porto, Portugal 7- IPO Lisboa 8 - Gastroenterology Department, Hospital São João, Porto; 9- Institute of Pharmacology and Therapeutics Faculty of Medicine of the University of Porto, Portugal; 10- MedInUP - Center for Drug Discovery and Innovative Medicines, University of Porto, Porto, Portugal Corresponding Author: Fernando Magro Institute of Pharmacology and Therapeutics Faculdade de Medicina da Universidade do Porto Alameda Prof Hernâni Monteiro 4200-319 Porto PORTUGAL Phone: +351225513642 Fax: +351225513643 email: [email protected] Guarantor of the article: Fernando Magro
5.2. THE TIMING OF EARLY THERAPEUTICS STRATEGIES HAS A SIGNIFICANT IMPACTON THE CROHN’S DISEASE PROGNOSIS
57
2
Abstract Backgroud: Crohn’s disease (CD) is an auto-inflammatory disease characterized by several relapses and abdominal surgery is a therapeutic option often followed by physicians for CD management. This study aims to determine the effect of the timing of the first surgical intervention on patients’ prognosis. Methods: This manuscript describes a retrospective analysis of a multicentric cohort involving 767 CD patients. Data on the disease characteristics, development and need for interventions was collected and determine the significant predictors for disabling disease and reoperation Results: Disabling disease affected 75% of all patients and 33% needed reoperation. The Odds Ratios (OR) of being affected by disabling disease was higher when patients had colonic disease (2.615 [1.125-0.078], upper tract involvement [2.593 [1.125-6.078]] and a longer time elapsed from diagnosis to first surgery (13-36 months: 2,754[1.538-4.934] and >36 months: 2.114 [1.318-3.235]). On the other hand, the need to undergo further surgical interventions was significantly increased in patients with severe CD phenotypes (B2:3.090 [1.601-5.964] and B3: 2.440 [1.283-4.640]) , perianal disease (2.143 [1.428-3.217] and that those medicated with AZA (2.070 [1.251-3.425]) or anti-TNF (2.253 [1.522-3.334]) more than one month after the initial surgery. Conclusions: The timing of therapeutic strategies affects the CD outcomes. Whereas an early surgery (within six months after diagnosis) can decrease the occurrence of disabling events, the introduction of immunosuppressive medication more than one month after the initial surgery seems to increase the likelihood of needing further surgeries. Keywords: Disabling disease, reoperation, Crohn’s disease
5. CLASSIFICATION
58
3
Introduction
Crohn’s disease (CD) is a chronic auto-inflammatory disease that can affect any part of the gastrointestinal tract, and is characterized by frequent relapses (1). So far, there is no definitive treatment for CD: current therapies are meant to alleviate the symptoms and to improve patients’ quality of life (2). Among these therapies, bowel surgery appears as an almost inevitable option: approximately 50% of patients undergo surgery within the first 10 years after diagnosis (3,4), whereas a total of 80% is estimated to need surgery at some time during the entire course of the disease (5,6). Surgery has an obvious important impact in patients’ quality of life, and is also known to play a role in the disease outcomes afterwards, namely disabling disease and recurrence. Recurrence is extremely frequent and, according to the literature, affects 40% to 80% of CD patients (7,8). Information on the proportion of patients experiencing disabling disease is more variable, as the notion of “disabling” is rather dynamic and has been changing over the years with the introduction of new therapies and a better management of CD. This concept was initially introduced by Beaugerie et al. in 2006 (9) and Loly et al. in 2008 (10), who performed an evaluation of the disease’s impact according to measurable clinical criteria. Those studies reported a proportion of disabling disease of 85% and 58%, respectively. Five years after the initial study, Yang et al. (11) reported a new analysis that settled the proportion of patients with disabling disease at 80%. Following the new strategies for disease control meanwhile established, this study used a slightly different definition of disabling disease.
As mentioned previously, surgery in CD patients impacts not only their quality of life, but also the likelihood of experiencing certain outcomes afterwards. For that reason, it is important to characterize the several variables associated to surgery and the specific ways in which they affect the course of the disease. This work aimed specifically at identifying the effect of the timing of the initial surgery (i.e., the time elapsed from diagnosis to the first surgery) on two important CD outcomes, the occurrence of disabling events and the need for further surgeries.
Material and Methods This was consisted in a retrospective multicentric cohort analysis of 767 CD patients being followed prospectively by six physicians attending at different hospitals. The patients’ inclusion criteria were: 1) a definitive diagnosis of CD; 2) at least three years of follow-up; 3) at least one appointment with one of the physicians involved in this study between 2014 and 2015; 4) had performed at least an X-ray computed tomography (CT) or magnetic resonance imaging (MRI) during the follow-up; and 5) the occurrence of a first abdominal surgery after the CD diagnosis. Collected variables All variables were prospectively collected from the Portuguese Inflammatory Bowel Disease study group (GEDII – Grupo de Estudo de Doenças
5.2. THE TIMING OF EARLY THERAPEUTICS STRATEGIES HAS A SIGNIFICANT IMPACTON THE CROHN’S DISEASE PROGNOSIS
59
4
Inflamatórias Intestinais) database (gediibasedados.med.up.pt) (12). Disease location and behavior were classified according to the Montreal criteria (13). In what concerns pharmacological therapy, both the nature of the treatment – immunosuppression with azathioprine (AZA) or anti-Tumour Necrosis Factor α (anti-TNFα) – and its starting timepoint were collected. Outcomes assessment The primary endpoints of the study were the occurrence of disabling disease and reoperation. Disabling disease was a composite endpoint defined by the presence of at least one of the following criteria: more than one abdominal surgery or two hospital admissions in the follow-up period; steroid dependence or steroid refractoriness; need for switching the first immunosuppressive drug or anti-TNFα; and the appearance of new clinical events after the index episode (stenosis, anal disease or penetrating disease). Steroid use was classified as dependence or refractoriness. The definition of steroid dependence was the inability to reduce steroids below the equivalent of 10 mg per day, prednisolone within 3 months of starting steroids without recurrent active disease, or disease relapse within 3 months of stopping steroids. Steroid resistance was defined as the presence of active disease despite a prednisolone dose of up to 0.75 mg.kg−1 per day over a period of four weeks (14). Reoperation was defined as the need for further surgeries after an initial one. Statistical Analyses Categorical variables were described through absolute (n) and relative (%) frequencies, while continuous variables were described as mean and standard deviation, or median, percentiles, and minimum and maximum, when appropriate. Hypothesis regarding categorical variables were tested using a chi-square test or a Fisher’s exact test, as appropriate. The time elapsed from surgery (index event) to disabling disease or reoperation was evaluated using survival analysis. This time frame was either measured between surgery and disabling disease or reoperation, or was considered to be the last known follow-up time (censored cases). The cumulative probabilities of event-free survival were estimated using the Kaplan–Meier method considering the group of patients by using LogRank and Breslow tests. Logistic regression was applied to determine the relationship between clinical or demographical factors and the occurrence of disabling disease and reoperation. The multivariable analysis included all variables (gender, smoking habits, age at diagnosis, location disease, behavior, upper tract involvement, perianal disease and time between diagnosis and surgery). For reoperation, medical therapies (immunosuppressor and anti-TNF) were also included. These variables could not be included in the disabling analysis because the disabling definition involved medical therapies. Models were built according to the backward stepwise approach. All reported p-values were two-sided, and the significance level was set at 5%. All data were arranged, processed and analyzed with SPSS® v.23.0 (Statistical Package for Social Sciences).
5. CLASSIFICATION
60
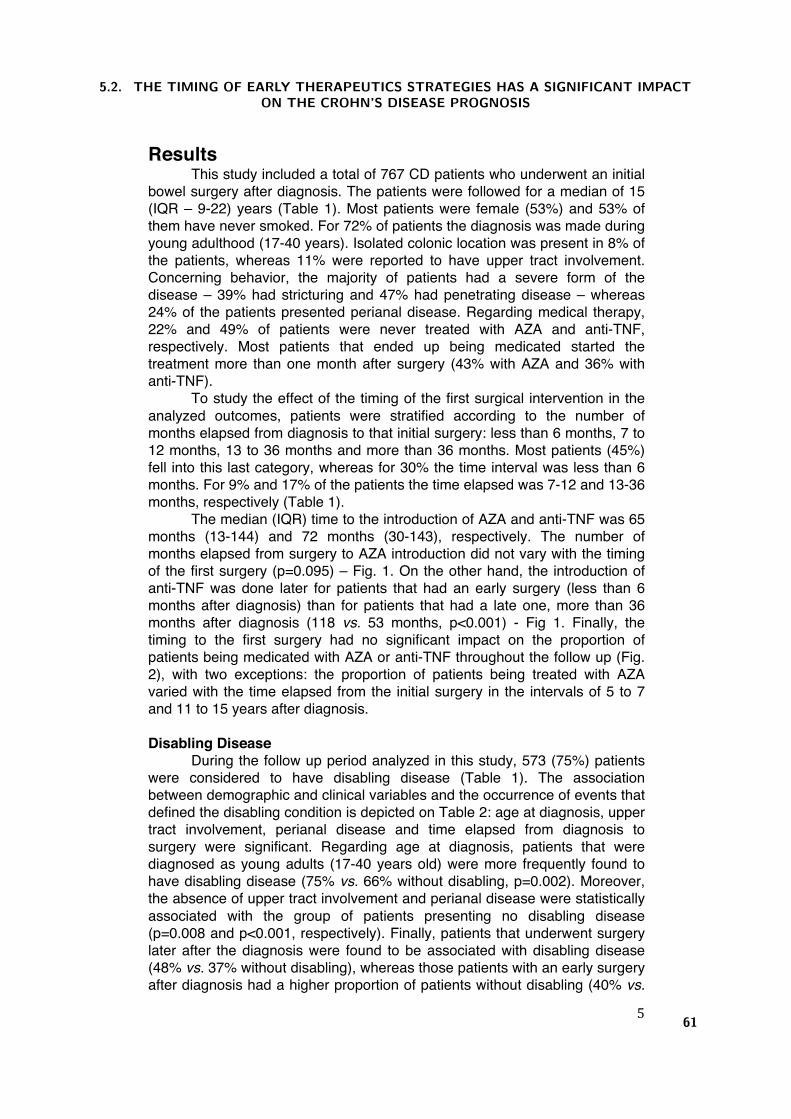
5
Results This study included a total of 767 CD patients who underwent an initial
bowel surgery after diagnosis. The patients were followed for a median of 15 (IQR – 9-22) years (Table 1). Most patients were female (53%) and 53% of them have never smoked. For 72% of patients the diagnosis was made during young adulthood (17-40 years). Isolated colonic location was present in 8% of the patients, whereas 11% were reported to have upper tract involvement. Concerning behavior, the majority of patients had a severe form of the disease – 39% had stricturing and 47% had penetrating disease – whereas 24% of the patients presented perianal disease. Regarding medical therapy, 22% and 49% of patients were never treated with AZA and anti-TNF, respectively. Most patients that ended up being medicated started the treatment more than one month after surgery (43% with AZA and 36% with anti-TNF).
To study the effect of the timing of the first surgical intervention in the analyzed outcomes, patients were stratified according to the number of months elapsed from diagnosis to that initial surgery: less than 6 months, 7 to 12 months, 13 to 36 months and more than 36 months. Most patients (45%) fell into this last category, whereas for 30% the time interval was less than 6 months. For 9% and 17% of the patients the time elapsed was 7-12 and 13-36 months, respectively (Table 1).
The median (IQR) time to the introduction of AZA and anti-TNF was 65 months (13-144) and 72 months (30-143), respectively. The number of months elapsed from surgery to AZA introduction did not vary with the timing of the first surgery (p=0.095) – Fig. 1. On the other hand, the introduction of anti-TNF was done later for patients that had an early surgery (less than 6 months after diagnosis) than for patients that had a late one, more than 36 months after diagnosis (118 vs. 53 months, p<0.001) - Fig 1. Finally, the timing to the first surgery had no significant impact on the proportion of patients being medicated with AZA or anti-TNF throughout the follow up (Fig. 2), with two exceptions: the proportion of patients being treated with AZA varied with the time elapsed from the initial surgery in the intervals of 5 to 7 and 11 to 15 years after diagnosis. Disabling Disease
During the follow up period analyzed in this study, 573 (75%) patients were considered to have disabling disease (Table 1). The association between demographic and clinical variables and the occurrence of events that defined the disabling condition is depicted on Table 2: age at diagnosis, upper tract involvement, perianal disease and time elapsed from diagnosis to surgery were significant. Regarding age at diagnosis, patients that were diagnosed as young adults (17-40 years old) were more frequently found to have disabling disease (75% vs. 66% without disabling, p=0.002). Moreover, the absence of upper tract involvement and perianal disease were statistically associated with the group of patients presenting no disabling disease (p=0.008 and p<0.001, respectively). Finally, patients that underwent surgery later after the diagnosis were found to be associated with disabling disease (48% vs. 37% without disabling), whereas those patients with an early surgery after diagnosis had a higher proportion of patients without disabling (40% vs.
5.2. THE TIMING OF EARLY THERAPEUTICS STRATEGIES HAS A SIGNIFICANT IMPACTON THE CROHN’S DISEASE PROGNOSIS
61
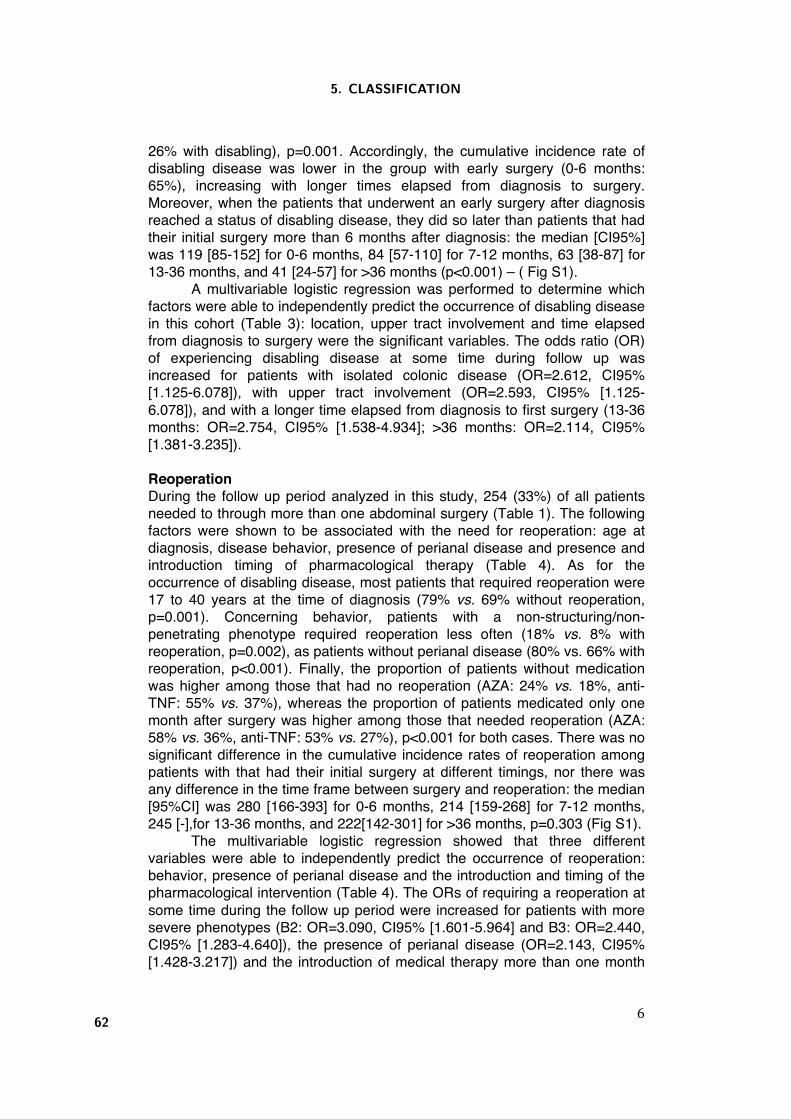
6
26% with disabling), p=0.001. Accordingly, the cumulative incidence rate of disabling disease was lower in the group with early surgery (0-6 months: 65%), increasing with longer times elapsed from diagnosis to surgery. Moreover, when the patients that underwent an early surgery after diagnosis reached a status of disabling disease, they did so later than patients that had their initial surgery more than 6 months after diagnosis: the median [CI95%] was 119 [85-152] for 0-6 months, 84 [57-110] for 7-12 months, 63 [38-87] for 13-36 months, and 41 [24-57] for >36 months (p<0.001) – ( Fig S1).
A multivariable logistic regression was performed to determine which factors were able to independently predict the occurrence of disabling disease in this cohort (Table 3): location, upper tract involvement and time elapsed from diagnosis to surgery were the significant variables. The odds ratio (OR) of experiencing disabling disease at some time during follow up was increased for patients with isolated colonic disease (OR=2.612, CI95% [1.125-6.078]), with upper tract involvement (OR=2.593, CI95% [1.125-6.078]), and with a longer time elapsed from diagnosis to first surgery (13-36 months: OR=2.754, CI95% [1.538-4.934]; >36 months: OR=2.114, CI95% [1.381-3.235]). Reoperation During the follow up period analyzed in this study, 254 (33%) of all patients needed to through more than one abdominal surgery (Table 1). The following factors were shown to be associated with the need for reoperation: age at diagnosis, disease behavior, presence of perianal disease and presence and introduction timing of pharmacological therapy (Table 4). As for the occurrence of disabling disease, most patients that required reoperation were 17 to 40 years at the time of diagnosis (79% vs. 69% without reoperation, p=0.001). Concerning behavior, patients with a non-structuring/non-penetrating phenotype required reoperation less often (18% vs. 8% with reoperation, p=0.002), as patients without perianal disease (80% vs. 66% with reoperation, p<0.001). Finally, the proportion of patients without medication was higher among those that had no reoperation (AZA: 24% vs. 18%, anti-TNF: 55% vs. 37%), whereas the proportion of patients medicated only one month after surgery was higher among those that needed reoperation (AZA: 58% vs. 36%, anti-TNF: 53% vs. 27%), p<0.001 for both cases. There was no significant difference in the cumulative incidence rates of reoperation among patients with that had their initial surgery at different timings, nor there was any difference in the time frame between surgery and reoperation: the median [95%CI] was 280 [166-393] for 0-6 months, 214 [159-268] for 7-12 months, 245 [-],for 13-36 months, and 222[142-301] for >36 months, p=0.303 (Fig S1). The multivariable logistic regression showed that three different variables were able to independently predict the occurrence of reoperation: behavior, presence of perianal disease and the introduction and timing of the pharmacological intervention (Table 4). The ORs of requiring a reoperation at some time during the follow up period were increased for patients with more severe phenotypes (B2: OR=3.090, CI95% [1.601-5.964] and B3: OR=2.440, CI95% [1.283-4.640]), the presence of perianal disease (OR=2.143, CI95% [1.428-3.217]) and the introduction of medical therapy more than one month
5. CLASSIFICATION
62
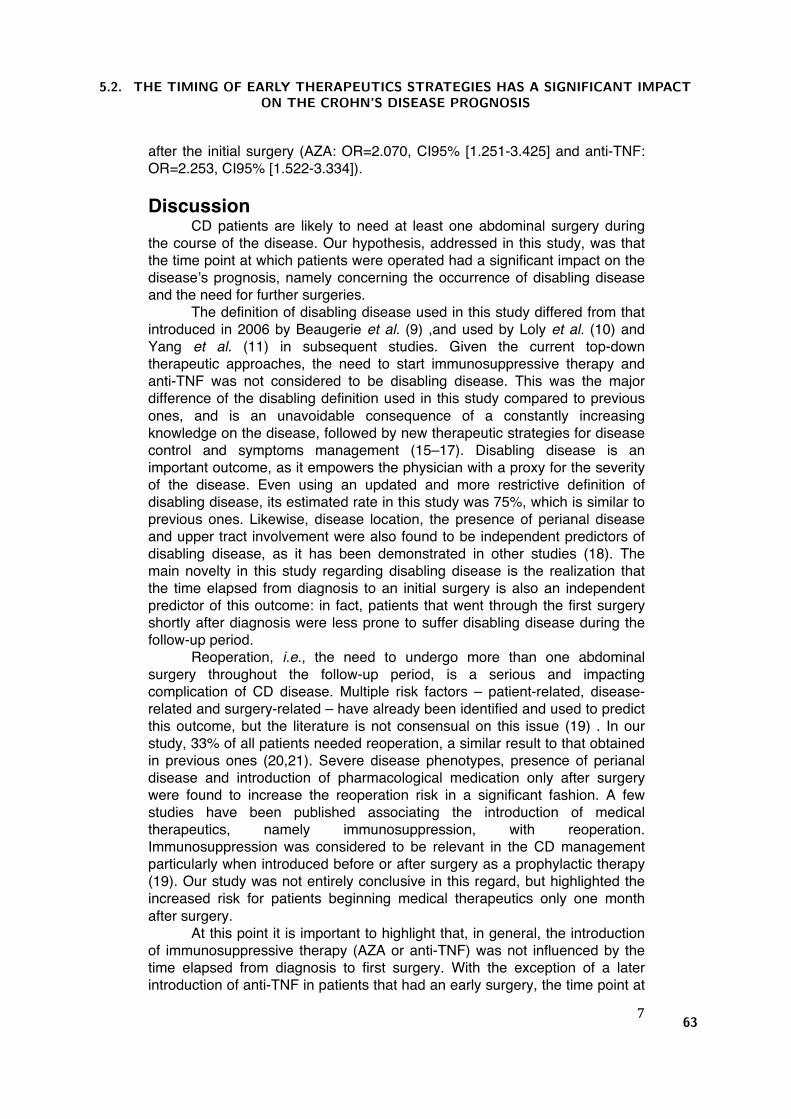
7
after the initial surgery (AZA: OR=2.070, CI95% [1.251-3.425] and anti-TNF: OR=2.253, CI95% [1.522-3.334]). Discussion
CD patients are likely to need at least one abdominal surgery during the course of the disease. Our hypothesis, addressed in this study, was that the time point at which patients were operated had a significant impact on the disease’s prognosis, namely concerning the occurrence of disabling disease and the need for further surgeries.
The definition of disabling disease used in this study differed from that introduced in 2006 by Beaugerie et al. (9) ,and used by Loly et al. (10) and Yang et al. (11) in subsequent studies. Given the current top-down therapeutic approaches, the need to start immunosuppressive therapy and anti-TNF was not considered to be disabling disease. This was the major difference of the disabling definition used in this study compared to previous ones, and is an unavoidable consequence of a constantly increasing knowledge on the disease, followed by new therapeutic strategies for disease control and symptoms management (15–17). Disabling disease is an important outcome, as it empowers the physician with a proxy for the severity of the disease. Even using an updated and more restrictive definition of disabling disease, its estimated rate in this study was 75%, which is similar to previous ones. Likewise, disease location, the presence of perianal disease and upper tract involvement were also found to be independent predictors of disabling disease, as it has been demonstrated in other studies (18). The main novelty in this study regarding disabling disease is the realization that the time elapsed from diagnosis to an initial surgery is also an independent predictor of this outcome: in fact, patients that went through the first surgery shortly after diagnosis were less prone to suffer disabling disease during the follow-up period.
Reoperation, i.e., the need to undergo more than one abdominal surgery throughout the follow-up period, is a serious and impacting complication of CD disease. Multiple risk factors – patient-related, disease-related and surgery-related – have already been identified and used to predict this outcome, but the literature is not consensual on this issue (19) . In our study, 33% of all patients needed reoperation, a similar result to that obtained in previous ones (20,21). Severe disease phenotypes, presence of perianal disease and introduction of pharmacological medication only after surgery were found to increase the reoperation risk in a significant fashion. A few studies have been published associating the introduction of medical therapeutics, namely immunosuppression, with reoperation. Immunosuppression was considered to be relevant in the CD management particularly when introduced before or after surgery as a prophylactic therapy (19). Our study was not entirely conclusive in this regard, but highlighted the increased risk for patients beginning medical therapeutics only one month after surgery.
At this point it is important to highlight that, in general, the introduction of immunosuppressive therapy (AZA or anti-TNF) was not influenced by the time elapsed from diagnosis to first surgery. With the exception of a later introduction of anti-TNF in patients that had an early surgery, the time point at
5.2. THE TIMING OF EARLY THERAPEUTICS STRATEGIES HAS A SIGNIFICANT IMPACTON THE CROHN’S DISEASE PROGNOSIS
63
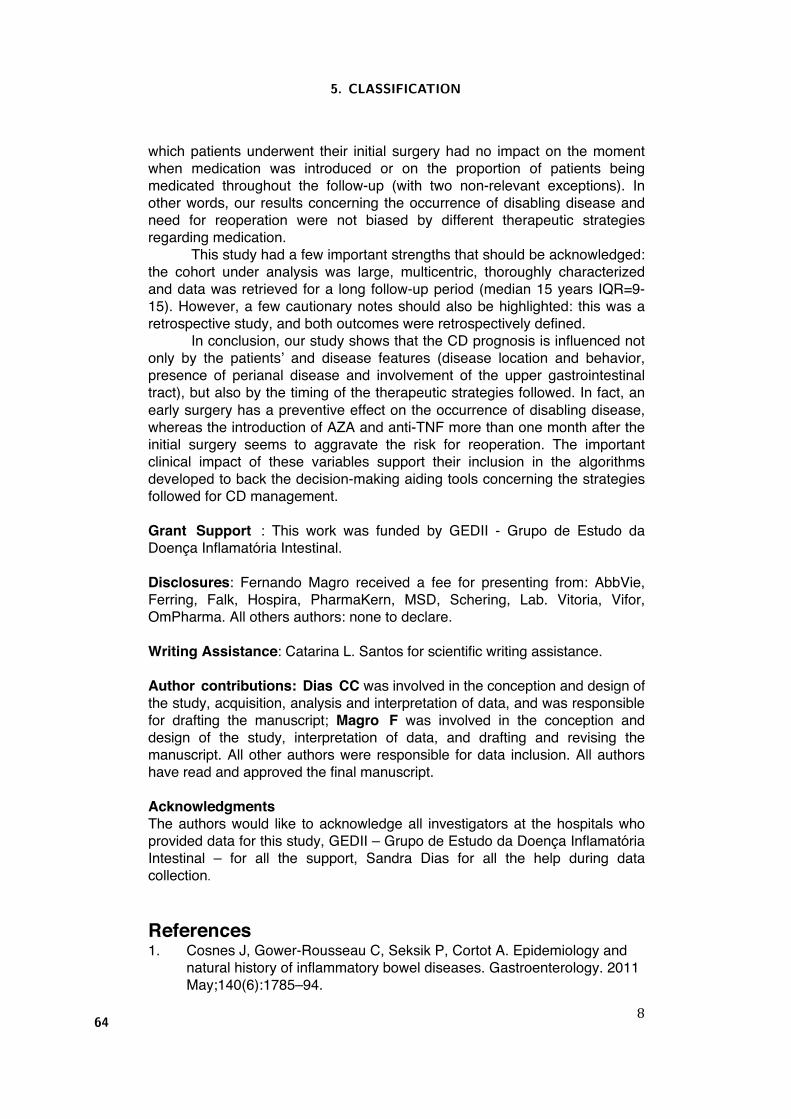
8
which patients underwent their initial surgery had no impact on the moment when medication was introduced or on the proportion of patients being medicated throughout the follow-up (with two non-relevant exceptions). In other words, our results concerning the occurrence of disabling disease and need for reoperation were not biased by different therapeutic strategies regarding medication.
This study had a few important strengths that should be acknowledged: the cohort under analysis was large, multicentric, thoroughly characterized and data was retrieved for a long follow-up period (median 15 years IQR=9-15). However, a few cautionary notes should also be highlighted: this was a retrospective study, and both outcomes were retrospectively defined.
In conclusion, our study shows that the CD prognosis is influenced not only by the patients’ and disease features (disease location and behavior, presence of perianal disease and involvement of the upper gastrointestinal tract), but also by the timing of the therapeutic strategies followed. In fact, an early surgery has a preventive effect on the occurrence of disabling disease, whereas the introduction of AZA and anti-TNF more than one month after the initial surgery seems to aggravate the risk for reoperation. The important clinical impact of these variables support their inclusion in the algorithms developed to back the decision-making aiding tools concerning the strategies followed for CD management. Grant Support : This work was funded by GEDII - Grupo de Estudo da Doença Inflamatória Intestinal. Disclosures: Fernando Magro received a fee for presenting from: AbbVie, Ferring, Falk, Hospira, PharmaKern, MSD, Schering, Lab. Vitoria, Vifor, OmPharma. All others authors: none to declare. Writing Assistance: Catarina L. Santos for scientific writing assistance. Author contributions: Dias CC was involved in the conception and design of the study, acquisition, analysis and interpretation of data, and was responsible for drafting the manuscript; Magro F was involved in the conception and design of the study, interpretation of data, and drafting and revising the manuscript. All other authors were responsible for data inclusion. All authors have read and approved the final manuscript. Acknowledgments The authors would like to acknowledge all investigators at the hospitals who provided data for this study, GEDII – Grupo de Estudo da Doença Inflamatória Intestinal – for all the support, Sandra Dias for all the help during data collection.
References 1. Cosnes J, Gower-Rousseau C, Seksik P, Cortot A. Epidemiology and
natural history of inflammatory bowel diseases. Gastroenterology. 2011 May;140(6):1785–94.
5. CLASSIFICATION
64
9
2. Baumgart DC, Sandborn WJ. Inflammatory bowel disease: clinical aspects and established and evolving therapies. Lancet. 2007. p. 1641–57.
3. Carter MJ, Lobo AJ, Travis SPL, IBD Section BS of G. Guidelines for the management of inflammatory bowel disease in adults. Gut [Internet]. 2004 Sep;53 Suppl 5:V1–16. Available from: http://www.ncbi.nlm.nih.gov/pubmed/15306569
4. Peyrin-Biroulet L, Loftus E V, Colombel J-F, Sandborn WJ. The natural history of adult Crohn’s disease in population-based cohorts. Am J Gastroenterol [Internet]. 2010;105(2):289–97. Available from: http://www.ncbi.nlm.nih.gov/pubmed/19861953
5. Moss AC. Prevention of postoperative recurrence of Crohn’s disease: what does the evidence support? Inflamm Bowel Dis [Internet]. 19(4):856–9. Available from: http://www.ncbi.nlm.nih.gov/pubmed/23446339
6. Cosnes J, Cattan S, Blain A, Beaugerie L, Carbonnel F, Parc R, et al. Long-term evolution of disease behavior of Crohn’s disease. Inflamm Bowel Dis [Internet]. 2002 Jul;8(4):244–50. Available from: http://www.ncbi.nlm.nih.gov/pubmed/12131607
7. Bernell O, Lapidus A, Hellers G. Risk factors for surgery and recurrence in 907 patients with primary ileocaecal Crohn’s disease. Br J Surg [Internet]. 2000;87(12):1697–701. Available from: http://www.ncbi.nlm.nih.gov/pubmed/11122187
8. Olaison G, Smedh K, Sjödahl R. Natural course of Crohn’s disease after ileocolic resection: endoscopically visualised ileal ulcers preceding symptoms. Gut [Internet]. 1992 Mar;33(3):331–5. Available from: http://www.ncbi.nlm.nih.gov/pubmed/1568651
9. Beaugerie L, Seksik P, Nion-Larmurier I, Gendre J-P, Cosnes J. Predictors of Crohn’s disease. Gastroenterology [Internet]. 2006;130(3):650–6. Available from: http://www.ncbi.nlm.nih.gov/pubmed/16530505
10. Loly C, Belaiche J, Louis E. Predictors of severe Crohn’s disease. Scand J Gastroenterol [Internet]. 2008 Aug;43(8):948–54. Available from: http://www.ncbi.nlm.nih.gov/pubmed/19086165
11. Yang CH, Ding J, Gao Y, Chen X, Yang Z Bin, Xiao SD. Risk factors that predict the requirement of aggressive therapy among Chinese patients with Crohn’s disease. J Dig Dis [Internet]. 2011 Apr;12(2):99–104. Available from: http://www.ncbi.nlm.nih.gov/pubmed/21401894
12. GEDII Group. GEDII data base. https://gediibasedados.med.up.pt/; 2016.
13. Silverberg MS, Satsangi J, Ahmad T, Arnott IDR, Bernstein CN, Brant SR, et al. Toward an integrated clinical, molecular and serological classification of inflammatory bowel disease: report of a Working Party of the 2005 Montreal World Congress of Gastroenterology. Can J Gastroenterol [Internet]. 2005;19 Suppl A:5A – 36A. Available from: http://www.ncbi.nlm.nih.gov/pubmed/16151544
14. Dignass A, Van Assche G, Lindsay JO, Lémann M, Söderholm J, Colombel JF, et al. The second European evidence-based Consensus on the diagnosis and management of Crohn’s disease: Current
5.2. THE TIMING OF EARLY THERAPEUTICS STRATEGIES HAS A SIGNIFICANT IMPACTON THE CROHN’S DISEASE PROGNOSIS
65
10
management. J Crohns Colitis [Internet]. 2010;4(1):28–62. Available from: http://www.ncbi.nlm.nih.gov/pubmed/21122489
15. Feagan BG, Greenberg GR, Wild G, Fedorak RN, Paré P, McDonald JWD, et al. Treatment of active Crohn’s disease with MLN0002, a humanized antibody to the alpha4beta7 integrin. Clin Gastroenterol Hepatol [Internet]. 2008;6(12):1370–7. Available from: http://www.ncbi.nlm.nih.gov/pubmed/18829392
16. Sandborn WJ, Gasink C, Gao L-L, Blank MA, Johanns J, Guzzo C, et al. Ustekinumab induction and maintenance therapy in refractory Crohn’s disease. N Engl J Med [Internet]. 2012;367(16):1519–28. Available from: http://www.ncbi.nlm.nih.gov/pubmed/23075178
17. Devlin SM, Panaccione R. Evolving Inflammatory Bowel Disease Treatment Paradigms: Top-Down Versus Step-Up. Medical Clinics of North America. 2010. p. 1–18.
18. Dias CC, Rodrigues PP, da Costa-Pereira A, Magro F. Clinical prognostic factors for disabling Crohn’s disease: A systematic review and meta-analysis. World J Gastroenterol [Internet]. 2013;19(24):3866–71. Available from: http://www.wjgnet.com/1007-9327/pdf/v19/i24/3866.pdf
19. Vaughn BP. Prevention of post-operative recurrence of Crohn’s disease. World J Gastroenterol [Internet]. 2014;20(5):1147. Available from: http://www.wjgnet.com/1007-9327/full/v20/i5/1147.htm
20. Whelan G, Farmer RG, Fazio VW, Goormastic M. Recurrence after surgery in Crohn’s disease. Relationship to location of disease (clinical pattern) and surgical indication. Gastroenterology [Internet]. 1985 Jun;88(6):1826–33. Available from: http://www.ncbi.nlm.nih.gov/pubmed/3996839
21. Borley NR, Mortensen NJM, Chaudry MA, Mohammed S, Warren BF, George BD, et al. Recurrence after abdominal surgery for Crohn’s disease: relationship to disease site and surgical procedure. Dis Colon Rectum [Internet]. 2002 Mar;45(3):377–83. Available from: http://www.ncbi.nlm.nih.gov/pubmed/12068198
5. CLASSIFICATION
66
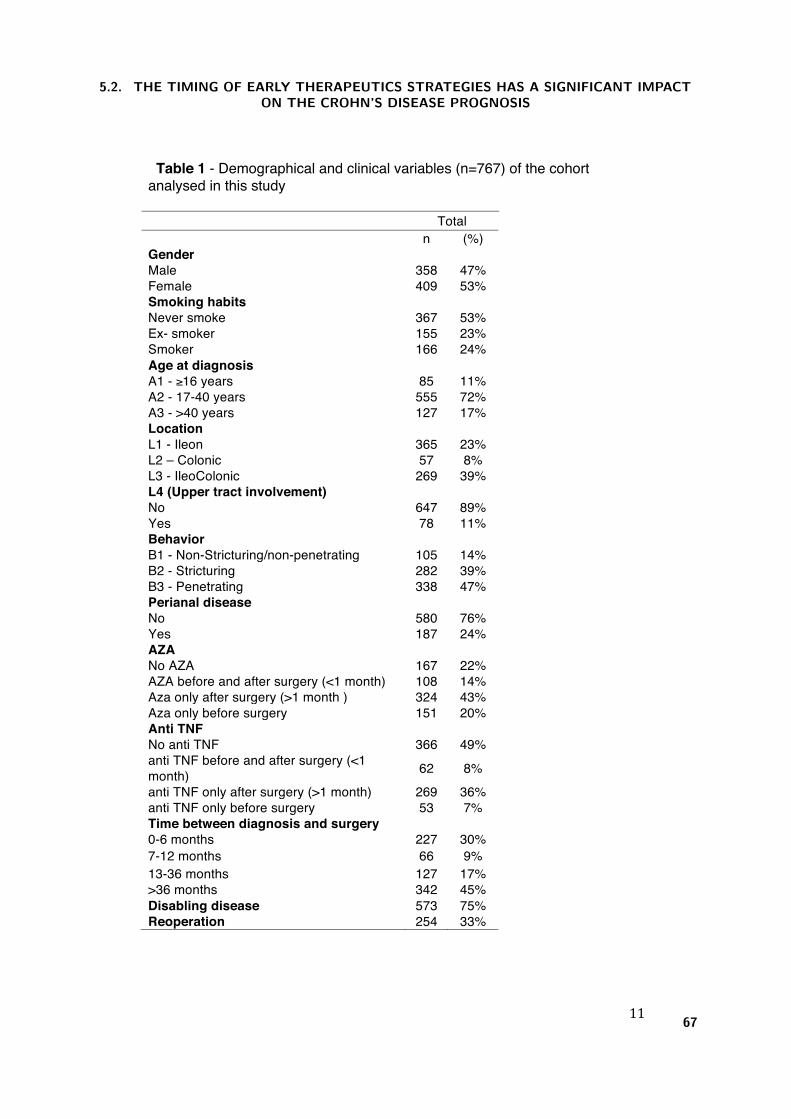
11
Table 1 - Demographical and clinical variables (n=767) of the cohort analysed in this study
Total n (%) Gender Male 358 47% Female 409 53% Smoking habits Never smoke 367 53% Ex- smoker 155 23% Smoker 166 24% Age at diagnosis A1 - ≥16 years 85 11% A2 - 17-40 years 555 72% A3 - >40 years 127 17% Location L1 - Ileon 365 23% L2 – Colonic 57 8% L3 - IleoColonic 269 39% L4 (Upper tract involvement) No 647 89% Yes 78 11% Behavior B1 - Non-Stricturing/non-penetrating 105 14% B2 - Stricturing 282 39% B3 - Penetrating 338 47% Perianal disease No 580 76% Yes 187 24% AZA No AZA 167 22% AZA before and after surgery (<1 month) 108 14% Aza only after surgery (>1 month ) 324 43% Aza only before surgery 151 20% Anti TNF No anti TNF 366 49% anti TNF before and after surgery (<1 month) 62 8% anti TNF only after surgery (>1 month) 269 36% anti TNF only before surgery 53 7% Time between diagnosis and surgery 0-6 months 227 30% 7-12 months 66 9% 13-36 months 127 17% >36 months 342 45% Disabling disease 573 75% Reoperation 254 33%
5.2. THE TIMING OF EARLY THERAPEUTICS STRATEGIES HAS A SIGNIFICANT IMPACTON THE CROHN’S DISEASE PROGNOSIS
67
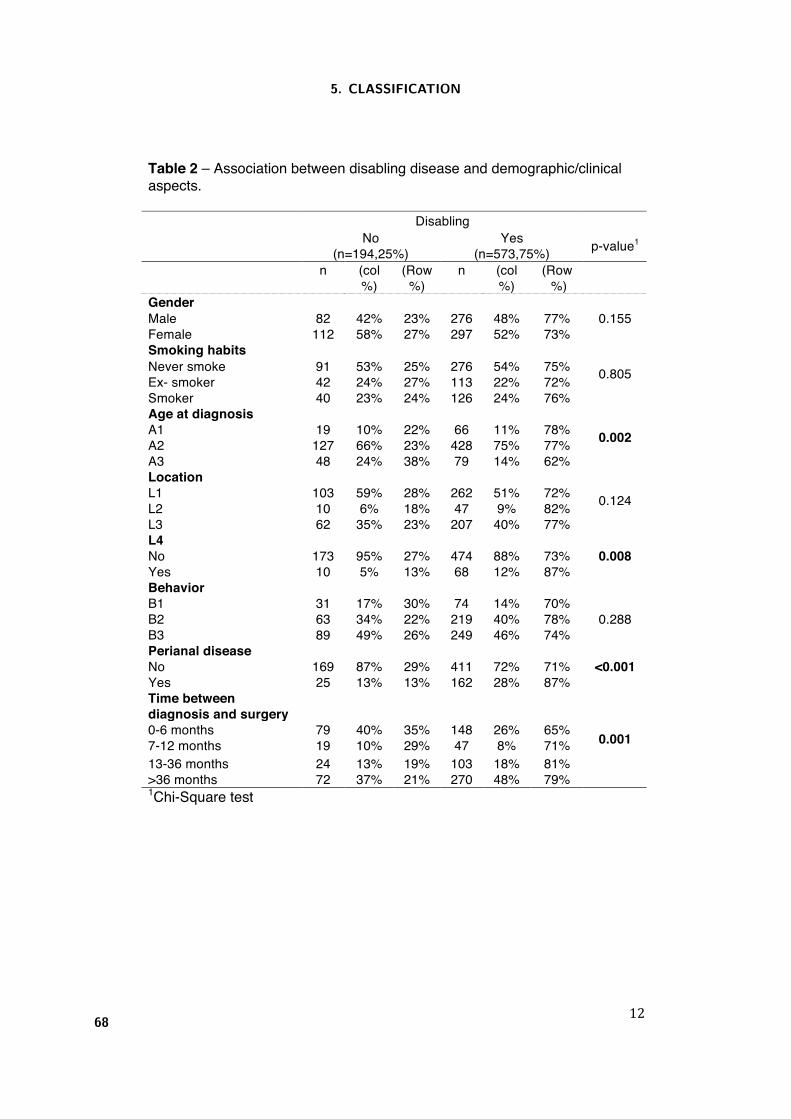
12
Table 2 – Association between disabling disease and demographic/clinical aspects.
Disabling
No (n=194,25%)
Yes (n=573,75%) p-value1
n (col %)
(Row %)
n (col %)
(Row %)
Gender 0.155 Male 82 42% 23% 276 48% 77%
Female 112 58% 27% 297 52% 73% Smoking habits
0.805 Never smoke 91 53% 25% 276 54% 75% Ex- smoker 42 24% 27% 113 22% 72% Smoker 40 23% 24% 126 24% 76% Age at diagnosis
0.002 A1 19 10% 22% 66 11% 78% A2 127 66% 23% 428 75% 77% A3 48 24% 38% 79 14% 62% Location
0.124 L1 103 59% 28% 262 51% 72% L2 10 6% 18% 47 9% 82% L3 62 35% 23% 207 40% 77% L4
0.008 No 173 95% 27% 474 88% 73% Yes 10 5% 13% 68 12% 87% Behavior B1 31 17% 30% 74 14% 70%
0.288 B2 63 34% 22% 219 40% 78% B3 89 49% 26% 249 46% 74% Perianal disease
<0.001 No 169 87% 29% 411 72% 71% Yes 25 13% 13% 162 28% 87% Time between diagnosis and surgery
0.001 0-6 months 79 40% 35% 148 26% 65% 7-12 months 19 10% 29% 47 8% 71% 13-36 months 24 13% 19% 103 18% 81% >36 months 72 37% 21% 270 48% 79% 1Chi-Square test
5. CLASSIFICATION
68
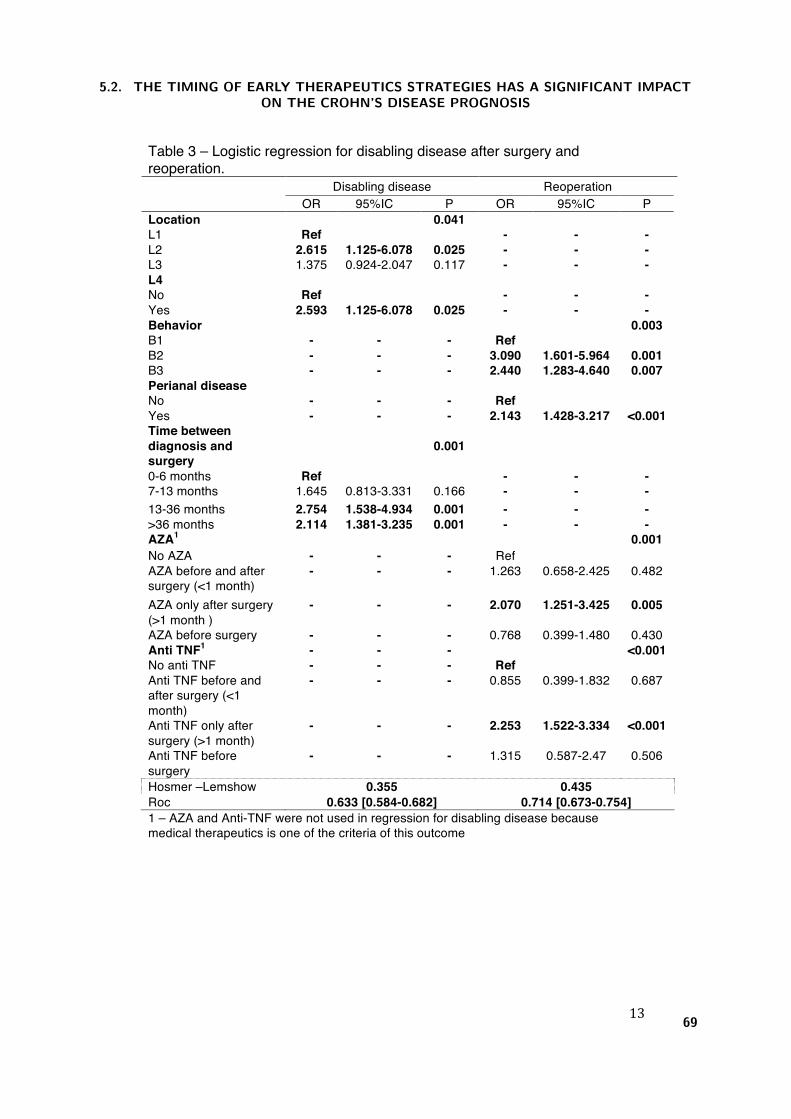
13
Table 3 – Logistic regression for disabling disease after surgery and reoperation.
Disabling disease Reoperation OR 95%IC P OR 95%IC P Location 0.041 L1 Ref - - - L2 2.615 1.125-6.078 0.025 - - - L3 1.375 0.924-2.047 0.117 - - - L4 No Ref - - - Yes 2.593 1.125-6.078 0.025 - - - Behavior 0.003 B1 - - - Ref B2 - - - 3.090 1.601-5.964 0.001 B3 - - - 2.440 1.283-4.640 0.007 Perianal disease No - - - Ref Yes - - - 2.143 1.428-3.217 <0.001 Time between diagnosis and surgery
0.001
0-6 months Ref - - - 7-13 months 1.645 0.813-3.331 0.166 - - - 13-36 months 2.754 1.538-4.934 0.001 - - - >36 months 2.114 1.381-3.235 0.001 - - - AZA1 0.001 No AZA - - - Ref AZA before and after surgery (<1 month)
- - - 1.263 0.658-2.425 0.482
AZA only after surgery (>1 month )
- - - 2.070 1.251-3.425 0.005
AZA before surgery - - - 0.768 0.399-1.480 0.430 Anti TNF1 - - - <0.001 No anti TNF - - - Ref Anti TNF before and after surgery (<1 month)
- - - 0.855 0.399-1.832 0.687
Anti TNF only after surgery (>1 month)
- - - 2.253 1.522-3.334 <0.001
Anti TNF before surgery
- - - 1.315 0.587-2.47 0.506
Hosmer –Lemshow 0.355 0.435 Roc 0.633 [0.584-0.682] 0.714 [0.673-0.754] 1 – AZA and Anti-TNF were not used in regression for disabling disease because medical therapeutics is one of the criteria of this outcome
5.2. THE TIMING OF EARLY THERAPEUTICS STRATEGIES HAS A SIGNIFICANT IMPACTON THE CROHN’S DISEASE PROGNOSIS
69
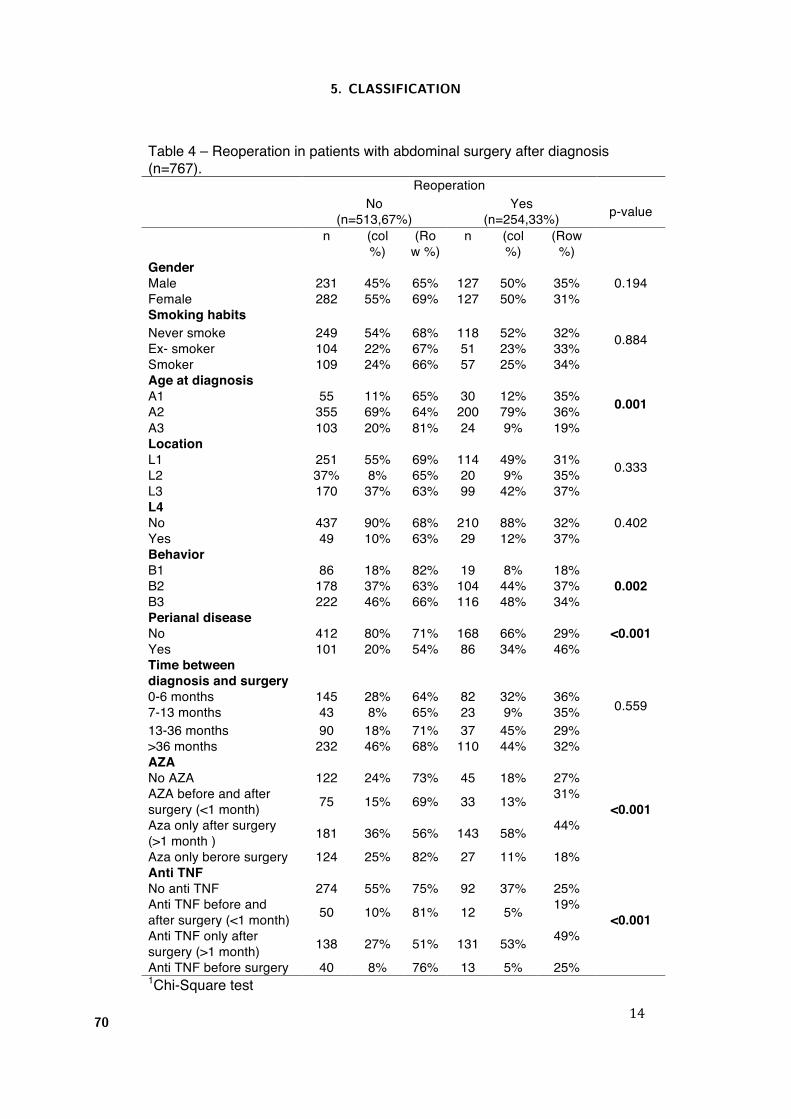
14
Table 4 – Reoperation in patients with abdominal surgery after diagnosis (n=767).
Reoperation
No (n=513,67%)
Yes (n=254,33%) p-value
n (col %)
(Row %)
n (col %)
(Row %)
Gender 0.194 Male 231 45% 65% 127 50% 35%
Female 282 55% 69% 127 50% 31% Smoking habits
0.884 Never smoke 249 54% 68% 118 52% 32% Ex- smoker 104 22% 67% 51 23% 33% Smoker 109 24% 66% 57 25% 34% Age at diagnosis
0.001 A1 55 11% 65% 30 12% 35% A2 355 69% 64% 200 79% 36% A3 103 20% 81% 24 9% 19% Location
0.333 L1 251 55% 69% 114 49% 31% L2 37% 8% 65% 20 9% 35% L3 170 37% 63% 99 42% 37% L4
0.402 No 437 90% 68% 210 88% 32% Yes 49 10% 63% 29 12% 37% Behavior B1 86 18% 82% 19 8% 18%
0.002 B2 178 37% 63% 104 44% 37% B3 222 46% 66% 116 48% 34% Perianal disease
<0.001 No 412 80% 71% 168 66% 29% Yes 101 20% 54% 86 34% 46% Time between diagnosis and surgery
0.559 0-6 months 145 28% 64% 82 32% 36% 7-13 months 43 8% 65% 23 9% 35% 13-36 months 90 18% 71% 37 45% 29% >36 months 232 46% 68% 110 44% 32% AZA
<0.001
No AZA 122 24% 73% 45 18% 27% AZA before and after surgery (<1 month) 75 15% 69% 33 13% 31%
Aza only after surgery (>1 month ) 181 36% 56% 143 58% 44%
Aza only berore surgery 124 25% 82% 27 11% 18% Anti TNF
<0.001
No anti TNF 274 55% 75% 92 37% 25% Anti TNF before and after surgery (<1 month) 50 10% 81% 12 5% 19%
Anti TNF only after surgery (>1 month) 138 27% 51% 131 53% 49%
Anti TNF before surgery 40 8% 76% 13 5% 25% 1Chi-Square test
5. CLASSIFICATION
70
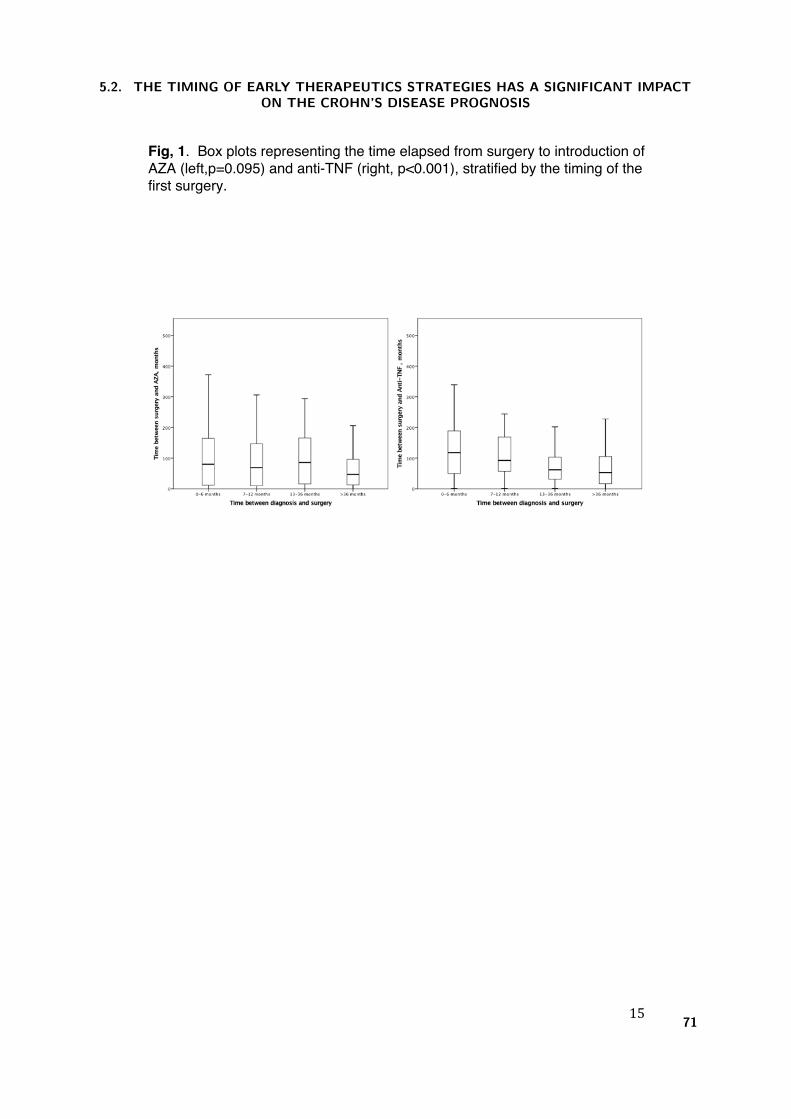
15
Fig, 1. Box plots representing the time elapsed from surgery to introduction of AZA (left,p=0.095) and anti-TNF (right, p<0.001), stratified by the timing of the first surgery.
5.2. THE TIMING OF EARLY THERAPEUTICS STRATEGIES HAS A SIGNIFICANT IMPACTON THE CROHN’S DISEASE PROGNOSIS
71
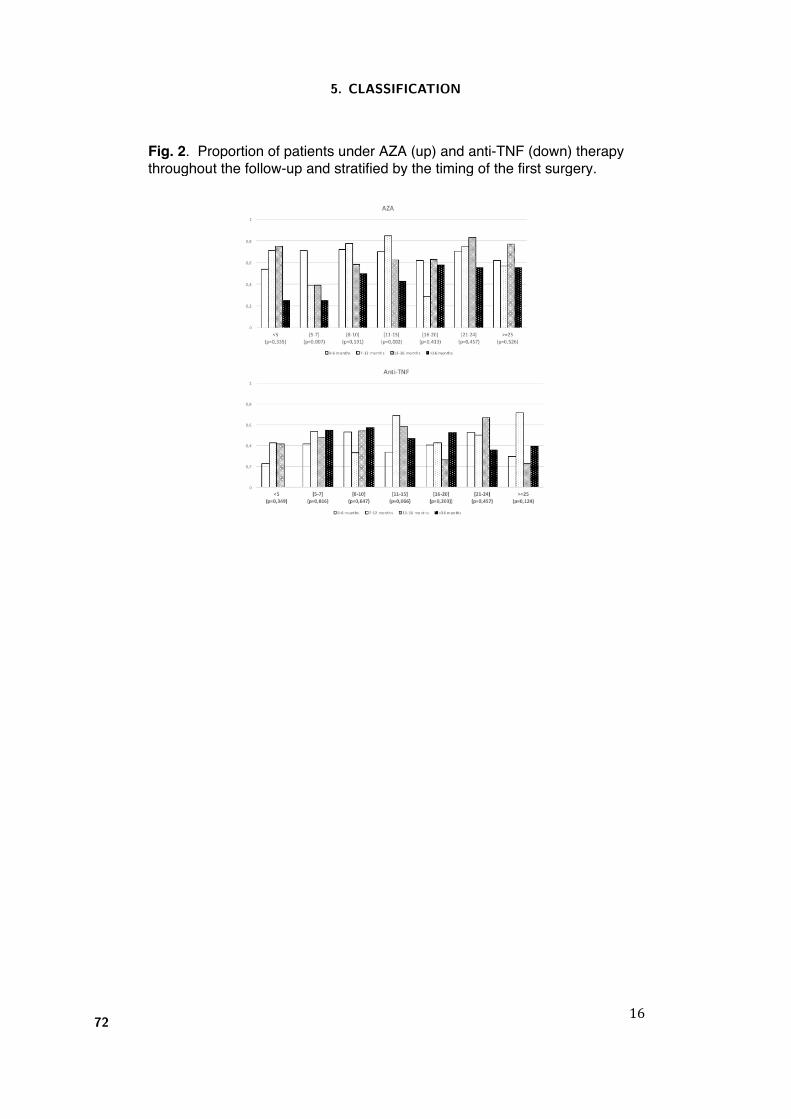
16
Fig. 2. Proportion of patients under AZA (up) and anti-TNF (down) therapy throughout the follow-up and stratified by the timing of the first surgery.
5. CLASSIFICATION
72
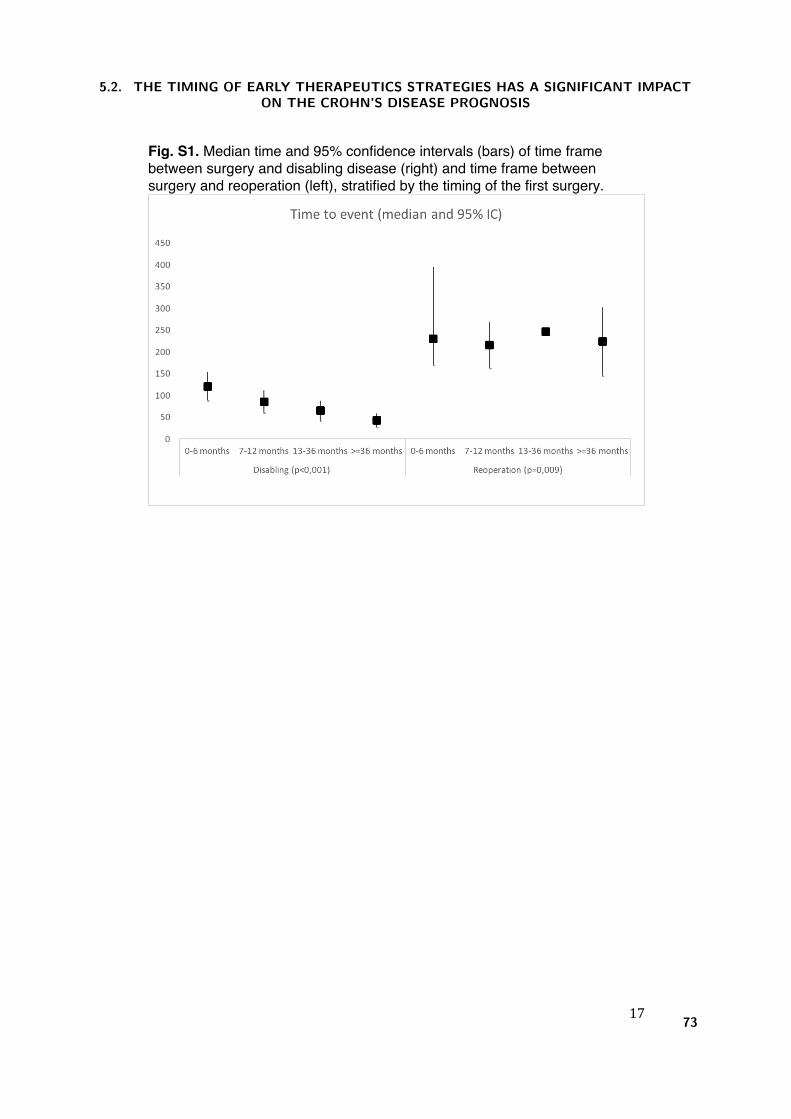
17
Fig. S1. Median time and 95% confidence intervals (bars) of time frame between surgery and disabling disease (right) and time frame between surgery and reoperation (left), stratified by the timing of the first surgery.
5.2. THE TIMING OF EARLY THERAPEUTICS STRATEGIES HAS A SIGNIFICANT IMPACTON THE CROHN’S DISEASE PROGNOSIS
73

5. CLASSIFICATION
74

6. Prediction

6. Prediction
The third aim of this thesis is to develop and validate prognostic models for outcomes identified in Goal 1,
with risk factors isolated in Goals 1 and 2. Two main paths of work have been followed for modelling predictive
classifiers, one based on Bayesian networks and the other on decision trees. In the first path, two preparatory
studies, presented in international forums of computer-based medical systems, were developed to a) compare
Bayesian network classifiers with logistic regression (Appendix A), and b) simply assess the classification ability
of the Bayesian network (Appendix B). Then, from the main study, the defined Bayesian models achieved high
AUC for disabling disease and reoperation, and an online tool allows the application of the classifier at bedside
(Appendix C). The risk matrices - based on age at diagnosis, perianal disease, disease aggressiveness and early
therapeutic decisions - exhibited good performance for the most important prognostic criteria: high positive
post-test odds for disabling disease and low negative post-test odds for reoperation. The risk matrices are also
easily applicable as bedside clinical tools that can help physicians during therapeutic decisions in early disease
management. In the second path, decision trees were able to predict disabling, surgery and reoperation with
high AUC, and were shown to be a valid and useful approach to depict outcome risks. The defined cut-off
risk levels had high odds test positivity for disabling, while excluding surgery and reoperation with low odds
test negativity.
Two studies were conducted:
Development and validation of risk matrices for Crohn’s disease outcomes in patients submitted
to early therapeutic interventions.
Journal of Crohn’s and Colitis (accepted), 2016
Claudia Camila Dias, Pedro Pereira Rodrigues, Rosa Coelho, Paula Moura Santos, Samuel Fernandes, Cidalina
Caetano, Angela Rodrigues, Francisco Portela, Ana Oliveira, Paula Ministro, Eugnia Cancela, Ana Isabel Vieira,
Rita Barosa, Jose Cotter, Pedro Carvalho, Isabelle Cremers, Daniel Trabulo, Paulo Caldeira, Artur Antunes,
Isadora Rosa, Joana Moleiro, Paula Peixe, Rita Herculano, Raquel Goncalves, Bruno Goncalves, Helena Tavares
Sousa, Luıs Contente, Henrique Morna, Susana Lopes, and Fernando Magro on behalf of GEDII
The risk of disabling , surgery and reoperation in Crohn’s disease: a decision tree-based approach
to prognosis
(submitted, 2016)
Claudia Camila Dias, Pedro Pereira Rodrigues, Samuel Fernandes, Francisco Portela, Paula Ministro, Diana
Martins, Paula Sousa, Paula Lago, Isadora Rosa, Luıs Correia, Paula Moura Santos, Fernando Magro on behalf
GEDII
77
6. PREDICTION
6.1 Development and validation of risk matrices for Crohn’s disease
outcomes in patients submitted to early therapeutic interven-
tions.
Journal of Cronh’s and Colitis (accepted, 2016)
Claudia Camila Dias, Pedro Pereira Rodrigues, Rosa Coelho, Paula Moura Santos, Samuel Fer-
nandes, Cidalina Caetano, Angela Rodrigues, Francisco Portela, Ana Oliveira, Paula Ministro,
Eugnia Cancela, Ana Isabel Vieira, Rita Barosa, Jose Cotter, Pedro Carvalho, Isabelle Cremers,
Daniel Trabulo, Paulo Caldeira, Artur Antunes, Isadora Rosa, Joana Moleiro, Paula Peixe, Rita
Herculano, Raquel Goncalves, Bruno Goncalves, Helena Tavares Sousa, Luıs Contente, Henrique
Morna, Susana Lopes, and Fernando Magro on behalf of GEDII
78
Copyright © 2016 European Crohn’s and Colitis Organisation (ECCO). Published by Oxford University Press. All rights reserved. For permissions, please email: [email protected]
1
Journal of Crohn's and Colitis, 2016, 1–9doi:10.1093/ecco-jcc/jjw171
Original Article
Original Article
Development and Validation of Risk Matrices for Crohn’s Disease Outcomes in Patients Who Underwent Early Therapeutic InterventionsCláudia Camila Dias,a,b Pedro Pereira Rodrigues,a,b Rosa Coelho,c Paula Moura Santos,d Samuel Fernandes,d Paula Lago,e Cidalina Caetano,e Ângela Rodrigues,e Francisco Portela,f Ana Oliveira,f Paula Ministro,g Eugénia Cancela,g Ana Isabel Vieira,h Rita Barosa,h José Cotter,i Pedro Carvalho,i Isabelle Cremers,j Daniel Trabulo,j Paulo Caldeira,k,l Artur Antunes,l Isadora Rosa,m Joana Moleiro,m Paula Peixe,n Rita Herculano,n Raquel Gonçalves,o Bruno Gonçalves,o Helena Tavares Sousa,k,p Luís Contente,p Henrique Morna,q Susana Lopes,c Fernando Magroc,r,s; on behalf GEDIIaHealth Information and Decision Sciences Department, Faculty of Medicine of the University of Porto, Porto, Portugal bCINTESIS – Center for Health Technology and Services Research, Porto, Portugal cGastroenterology Department, Hospital São João, Porto, Portugal dGastroenterology Department, Faculty of Medicine, Centro Hospitalar Lisboa Norte, Hospital de Santa Maria, Lisboa, Portugal eGastroenterology Department, Centro Hospitalar do Porto, Porto, Portugal fGastroenterology Department, Centro Hospitalar e Universitário de Coimbra, Coimbra, Portugal gGastroenterology Department, Centro Hospitalar Tondela e Viseu, Tondela e Viseu, Portugal hGastroenterology Department, Hospital Garcia da Orta, Lisboa, Portugal iGastroenterology Department, Centro Hospitalar do Alto Ave, Guimarães, Portugal jGastroenterology Department, Centro Hospitalar de Setúbal, Hospital São Bernardo, Setúbal, Portugal kDepartment of Biomedical Sciences and Medicine, University of Algarve, Faro, Portugal lGastroenterology Department, Hospital de Faro, Faro, Portugal mInstituto Português de Oncologia Francisco Gentil, Lisboa, Portugal nGastroenterology Department, Centro Hospitalar Lisboa Oriental Portugal, Lisboa, Portugal oGastroenterology Department, Hospital de Braga, Braga, Portugal pGastroenterology Department, Portimão Unit, Centro Hospitalar do Algarve, Portimão, Portugal qGastroenterology Department, Hospital Nélio Mendonça, Funchal, Portugal rInstitute of Pharmacology and Therapeutics Faculty of Medicine of the University of Porto, Porto, Portugal sMedInUP – Center for Drug Discovery and Innovative Medicines, University of Porto, Porto, Portugal
Corresponding Author: Fernando Magro, MD, PhD, Institute of Pharmacology and Therapeutics, Faculdade de Medicina da Uni-versidade do Porto, Alameda Prof Hernâni Monteiro, 4200–319 Porto, PORTUGAL. Tel: +351-22-5513642; Fax: +351-22-5513643; Email: [email protected]
Abstract
Introduction: The establishment of prognostic models for Crohn’s disease [CD] is highly desirable, as they have the potential to guide physicians in the decision-making process concerning therapeutic choices, thus improving patients’ health and quality of life. Our aim was to derive models for disabling CD and reoperation based solely on clinical/demographic data.Methods: A multicentric and retrospectively enrolled cohort of CD patients, subject to early surgery or immunosuppression, was analysed in order to build Bayesian network models and
Journal of Crohn's and Colitis Advance Access published January 10, 2017
by guest on January 11, 2017http://ecco-jcc.oxfordjournals.org/
Dow
nloaded from
6.1. DEVELOPMENT AND VALIDATION OF RISK MATRICES FOR CROHN’S DISEASEOUTCOMES IN PATIENTS SUBMITTED TO EARLY THERAPEUTIC INTERVENTIONS.
79
risk matrices. The final results were validated internally and with a multicentric and prospectively enrolled cohort.Results: The derivation cohort included a total of 489 CD patients [64% with disabling disease and 18% who needed reoperation], while the validation cohort included 129 CD patients with similar outcome proportions. The Bayesian models achieved an area under the curve of 78% for disabling disease and 86% for reoperation. Age at diagnosis, perianal disease, disease aggressiveness and early therapeutic decisions were found to be significant factors, and were used to construct user-friendly matrices depicting the probability of each outcome in patients with various combinations of these factors. The matrices exhibit good performance for the most important criteria: disabling disease positive post-test odds = 8.00 [2.72–23.44] and reoperation negative post-test odds = 0.02 [0.00–0.11].Conclusions: Clinical and demographical risk factors for disabling CD and reoperation were determined and their impact was quantified by means of risk matrices, which are applicable as bedside clinical tools that can help physicians during therapeutic decisions in early disease management.
Key Words: Disabling disease; reoperation; Crohn’s disease; risk matrices
1. IntroductionCrohn’s disease [CD] is a chronic and progressive disease of unknown etiology, prone to relapses and disabling events. The clinical course is usually characterized by intermittent relapses, although half of the patients express a mild disease with low propensity to recurrent episodes. On the other hand, the more aggressive cases may require surgery.1 As a chronic disease, neither treatment nor surgery actually heal the patients, which are usually the subject of frequent medical visits and hospitalizations, creating an aura of uncertainty surrounding their professional and social future that also affects their families.2,3
The new concepts on CD treatment are leaving behind the clas-sical approach of controlling the disease symptoms—instead, stud-ies focusing on improvement of quality of life and on the reduction of hospitalizations and surgeries are now emerging. Since the treat-ment schedule clearly affects the disease course, identifying good prognostic models based on genetic/serological and clinical/demo-graphic factors have been a focus of research. The latter option is more appealing, as it can be supported by data collected during the daily clinical practice.4,5 The identification of clinical criteria that can predict CD outcomes at an early phase of the disease is therefore cru-cial, as it can guide the decision-making process on the therapeutic options.
The notion of disabling disease was introduced in 2006 by Beaugerie et al.6 Two years later, Lolly et al.7 presented another study on this subject. Later, in 2011, Yang et al.8 used a similar definition in their study. Currently, and due to the emergence of the above-mentioned new strategies for disease control, there is no consensus regarding the concept of ‘disabling’ in CD.
The studies seeking to identify factors that can improve the CD outcomes have conflicting conclusions, as the different cohorts yield heterogeneous results due to different methodologies and/or different criteria for patient selection and evaluation. Although the computation of prognostic models can be considered a crucial step towards CD control and management, these are, unfortunately, sel-dom-addressed topics in the current literature. Moreover, the intri-cate nature of real-world biomedical data requires the utilization of analyses in which complexity goes beyond traditional biostatistics,9 without losing the necessary formality.10,11
2. Material and Methods
2.1. Derivation and validation cohortsData from CD patients being followed by 14 secondary and ter-tiary care centres was collected in a retrospective fashion [between April and December 2013]. Inclusion criteria were defined as fol-lows: patients aged more than 18 years who had undergone sur-gery or immunosuppressive therapy in the initial 6 months after diagnosis, and who had at least 3 years of follow-up. All data was collected through a web database, and all missing data or discrep-ancies were reviewed by the investigators. The study was moni-tored by the national coordinator of the Portuguese IBD group [GEDII].
The independent validation cohort included patients [from five hospitals] who were enrolled in a prospective fashion. Their data were registered in a national clinical database [gediibasedados.med.up.pt] of IBD patients. Inclusion criteria were similar to those used in the derivation cohort.
Patients from both cohorts were stratified according to the early therapeutic strategies followed by their physicians: Group I patients started immunosuppression during the initial 6 months after diag-nosis [index event] and prior to any surgical procedure; Group S0 patients underwent a surgical intervention [index event] in the initial 6 months after diagnosis and had no immunosuppression therapy during the known follow-up period; and Group SI patients under-went a surgical intervention [index event] in the initial 6 months after diagnosis and started immunosuppression within the 6 months after surgery.
2.2. Clinical and demographic variablesBesides the basic demographic data, clinical information was col-lected for each patient, including the Montreal classification12 and the follow-up data [total number of surgeries and hospitalizations; treatment, namely corticoids, immunosuppression or anti-TNF, and disease adverse events—stenosis, abscess, perforation and anal disease]. Regarding Montreal classification, patients were classified according to disease extent, behaviour and age. Steroid resistance was defined as the presence of active disease despite a prednisolone dose of up to 0.75 mg/kg per day over a period of 4 weeks.13,14
2 C. C. Dias et al.
by guest on January 11, 2017http://ecco-jcc.oxfordjournals.org/
Dow
nloaded from
6. PREDICTION
80
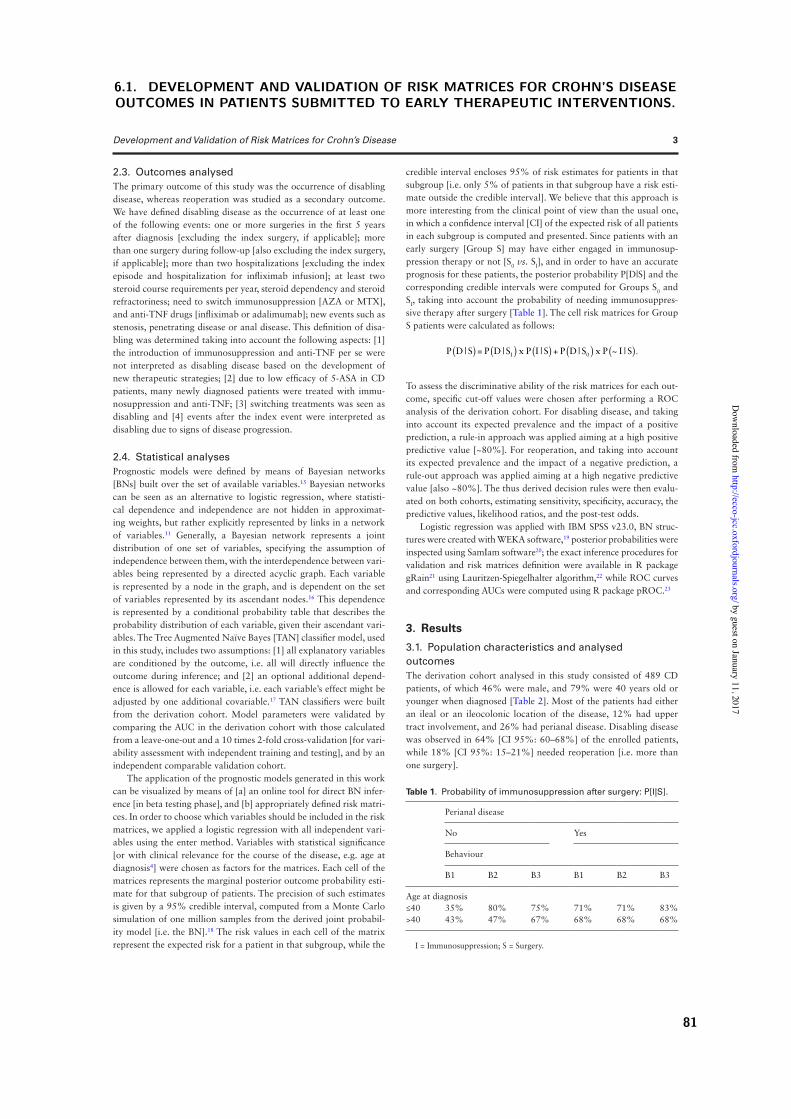
2.3. Outcomes analysedThe primary outcome of this study was the occurrence of disabling disease, whereas reoperation was studied as a secondary outcome. We have defined disabling disease as the occurrence of at least one of the following events: one or more surgeries in the first 5 years after diagnosis [excluding the index surgery, if applicable]; more than one surgery during follow-up [also excluding the index surgery, if applicable]; more than two hospitalizations [excluding the index episode and hospitalization for infliximab infusion]; at least two steroid course requirements per year, steroid dependency and steroid refractoriness; need to switch immunosuppression [AZA or MTX], and anti-TNF drugs [infliximab or adalimumab]; new events such as stenosis, penetrating disease or anal disease. This definition of disa-bling was determined taking into account the following aspects: [1] the introduction of immunosuppression and anti-TNF per se were not interpreted as disabling disease based on the development of new therapeutic strategies; [2] due to low efficacy of 5-ASA in CD patients, many newly diagnosed patients were treated with immu-nosuppression and anti-TNF; [3] switching treatments was seen as disabling and [4] events after the index event were interpreted as disabling due to signs of disease progression.
2.4. Statistical analysesPrognostic models were defined by means of Bayesian networks [BNs] built over the set of available variables.15 Bayesian networks can be seen as an alternative to logistic regression, where statisti-cal dependence and independence are not hidden in approximat-ing weights, but rather explicitly represented by links in a network of variables.11 Generally, a Bayesian network represents a joint distribution of one set of variables, specifying the assumption of independence between them, with the interdependence between vari-ables being represented by a directed acyclic graph. Each variable is represented by a node in the graph, and is dependent on the set of variables represented by its ascendant nodes.16 This dependence is represented by a conditional probability table that describes the probability distribution of each variable, given their ascendant vari-ables. The Tree Augmented Naïve Bayes [TAN] classifier model, used in this study, includes two assumptions: [1] all explanatory variables are conditioned by the outcome, i.e. all will directly influence the outcome during inference; and [2] an optional additional depend-ence is allowed for each variable, i.e. each variable’s effect might be adjusted by one additional covariable.17 TAN classifiers were built from the derivation cohort. Model parameters were validated by comparing the AUC in the derivation cohort with those calculated from a leave-one-out and a 10 times 2-fold cross-validation [for vari-ability assessment with independent training and testing], and by an independent comparable validation cohort.
The application of the prognostic models generated in this work can be visualized by means of [a] an online tool for direct BN infer-ence [in beta testing phase], and [b] appropriately defined risk matri-ces. In order to choose which variables should be included in the risk matrices, we applied a logistic regression with all independent vari-ables using the enter method. Variables with statistical significance [or with clinical relevance for the course of the disease, e.g. age at diagnosis4] were chosen as factors for the matrices. Each cell of the matrices represents the marginal posterior outcome probability esti-mate for that subgroup of patients. The precision of such estimates is given by a 95% credible interval, computed from a Monte Carlo simulation of one million samples from the derived joint probabil-ity model [i.e. the BN].18 The risk values in each cell of the matrix represent the expected risk for a patient in that subgroup, while the
credible interval encloses 95% of risk estimates for patients in that subgroup [i.e. only 5% of patients in that subgroup have a risk esti-mate outside the credible interval]. We believe that this approach is more interesting from the clinical point of view than the usual one, in which a confidence interval [CI] of the expected risk of all patients in each subgroup is computed and presented. Since patients with an early surgery [Group S] may have either engaged in immunosup-pression therapy or not [S0 vs. SI], and in order to have an accurate prognosis for these patients, the posterior probability P[D|S] and the corresponding credible intervals were computed for Groups S0 and SI, taking into account the probability of needing immunosuppres-sive therapy after surgery [Table 1]. The cell risk matrices for Group S patients were calculated as follows:
P D | S = P D | S x P I | S + P D | S x P ~ I | SI 0( ) ( ) ( ) ( ) ( ).
To assess the discriminative ability of the risk matrices for each out-come, specific cut-off values were chosen after performing a ROC analysis of the derivation cohort. For disabling disease, and taking into account its expected prevalence and the impact of a positive prediction, a rule-in approach was applied aiming at a high positive predictive value [~80%]. For reoperation, and taking into account its expected prevalence and the impact of a negative prediction, a rule-out approach was applied aiming at a high negative predictive value [also ~80%]. The thus derived decision rules were then evalu-ated on both cohorts, estimating sensitivity, specificity, accuracy, the predictive values, likelihood ratios, and the post-test odds.
Logistic regression was applied with IBM SPSS v23.0, BN struc-tures were created with WEKA software,19 posterior probabilities were inspected using SamIam software20; the exact inference procedures for validation and risk matrices definition were available in R package gRain21 using Lauritzen-Spiegelhalter algorithm,22 while ROC curves and corresponding AUCs were computed using R package pROC.23
3. Results
3.1. Population characteristics and analysed outcomesThe derivation cohort analysed in this study consisted of 489 CD patients, of which 46% were male, and 79% were 40 years old or younger when diagnosed [Table 2]. Most of the patients had either an ileal or an ileocolonic location of the disease, 12% had upper tract involvement, and 26% had perianal disease. Disabling disease was observed in 64% [CI 95%: 60–68%] of the enrolled patients, while 18% [CI 95%: 15–21%] needed reoperation [i.e. more than one surgery].
Table 1. Probability of immunosuppression after surgery: P[I|S].
Perianal disease
No Yes
Behaviour
B1 B2 B3 B1 B2 B3
Age at diagnosis≤40 35% 80% 75% 71% 71% 83%>40 43% 47% 67% 68% 68% 68%
I = Immunosuppression; S = Surgery.
Development and Validation of Risk Matrices for Crohn’s Disease 3
by guest on January 11, 2017http://ecco-jcc.oxfordjournals.org/
Dow
nloaded from
6.1. DEVELOPMENT AND VALIDATION OF RISK MATRICES FOR CROHN’S DISEASEOUTCOMES IN PATIENTS SUBMITTED TO EARLY THERAPEUTIC INTERVENTIONS.
81
This cohort was stratified according to the early therapeutic strat-egies followed for each patient: Group I consisted of patients who started immunosuppression in the initial six months after diagnosis and prior to any surgical procedure, and Group S consisted of patients who underwent surgery in the initial 6 months following diagnosis. Group S was further divided into patients who started immunosuppression 6 months after the initial surgery [SI], and patients who did not follow any immunosuppression therapy during the follow-up time considered in this study [S0]. Eighty [16%] patients were in Group S0, 175 [36%] in Group SI and 234 [48%] in Group I, and significant differences were observed between these groups for all variables accounted for in this study, with the exception of gender [Table 2]. Concerning outcome, disabling disease occurred most frequently among SI patients [78% of SI, 69% of I and 19% of S0, p < 0.001], as did the need for reoperation [40% of SI, 3% of I and 15% of S0, p < 0.001].
3.2. Bayesian prognostic models and relevant risk factorsIn order to unveil the interdependent relationships between the ana-lysed CD outcomes and the variables considered, BN-based models were built for the presence of disabling disease and the need for reop-eration [Figure 1]. In both cases, patient group was associated [arc between variables] with disease behaviour, upper gastrointestinal tract location [L4], and age at diagnosis, while location was associated with perianal disease. For disabling disease, an association between perianal disease and gender was also found, whereas an association between gender and upper tract involvement was found for reoperation.
To determine which of the factors listed above were significant and should be included in risk matrices, a logistic regression was carried out using all the independent variables considered. Those that were statistically significant and those that had been shown by previous
Table 2. Characteristics of the derivation cohort enrolled in this study [n = 489].
Total [n = 489] Group S0 [n = 80] Group SI [n = 175] Group I [n = 234] p-value1
n [%] n [%] n [%] n [%]
Gender 0.914Male 225 [46%] 36 [45%] 79 [45%] 110 [47%]Location <0.001L1. Ileal 232 [47%] 55 [69%] 95 [54%] 82 [35%]L2. Colonic 45 [10%] 1 [1%] 4 [2%] 40 [17%]L3. IleoColonic 212 [43%] 24 [30%] 76 [43%] 112 [48%]Upper tract involvement [L4] <0.001Yes 55 [12%] 2 [2%] 11 [6%] 42 [18%]Disease behaviour <0.001B1. Non-structuring/non-penetrating 158 [32%] 17 [21%] 14 [8%] 127 [54%]B2. Structuring 176 [36%] 35 [44%] 80 [46%] 61 [26%]B3. Penetrating 155 [32%] 28 [35%] 81 [46%] 46 [20%]Perianal disease 0.001Yes 125 [26%] 11 [14%] 38 [22%] 76 [32%]Age at diagnosis <0.001≤40 years 388 [79%] 48 [60%] 132 [75%] 208 [89%]>40 years 101 [21%] 32 [40%] 43 [25%] 26 [11%]Follow-up time, median [IQR] 9[6–14] 13 [8–19] 13 [8–19] 6 [5–10] <0.001Disabling disease 314 [64%] 15 [19%] 137 [78%] 162 [69%] <0.001CI 95% [60–68%] [10–28%] [72–84%] [63–75%]Reoperation 89 [18%] 12 [15%] 70 [40%] 7 [3%] <0.001
CI 95% [15–21%] [7–23%] [33–47%] [0.8–5%]Total of surgeries [including index] –None 132 [31%] – – 132 [78%]1 204 [48%] 68 [85%] 105 [60%] 31 [18%]2 52 [12%] 9 [11%] 39 [22%] 4 [2%]3 22 [5%] 1 [1%] 18 [10%] 3 [2%]4 10 [2%] 1 [1%] 9 [5%] 0 [0%]5 3 [1%] 1 [1%] 2 [1%] 0 [0%]6 1 [1%] 0 [0%] 1 [1%] 0 [0%]9 2 [1%] 0 [0%] 1 [1%] 1 [1%]Required anti-TNF 176 [37%] 0 [0%] 74 [42%] 102 [45%] <0.001Steroids 318 [67%] 21 [28%] 105 [63%] 192 [83%] <0.001 1 cycle/years 57 [29%] 6 [46%] 18 [28%] 33 [28%] 0.670 ≥2 cycles/year 11 [6%] 0 [0%] 5 [8%] 6 [5%] 1 cycle for each 3 years 70 [36%] 6 [46%] 24 [37%] 40 [34%] Steroid dependent 46 [24%] 1 [8%] 14 [22%] 31 [27%] Steroid resistant 11 [6%] 0 [0%] 4 [6%] 7 [6%]New eventsStenosis 74 [15%] 6 [8%] 43 [25%] 25 [11%] <0.001Penetrating disease 5 [1%] 2 [3%] 3 [2%] 0 [0%] 0.089Anal disease 51 [10%] 4 [4%] 25 [14%] 23 [10%] 0.036
1 Chi-Squared test; IQR: interquartile range; 95% CI: 95% confidence interval.
4 C. C. Dias et al.
by guest on January 11, 2017http://ecco-jcc.oxfordjournals.org/
Dow
nloaded from
6. PREDICTION
82
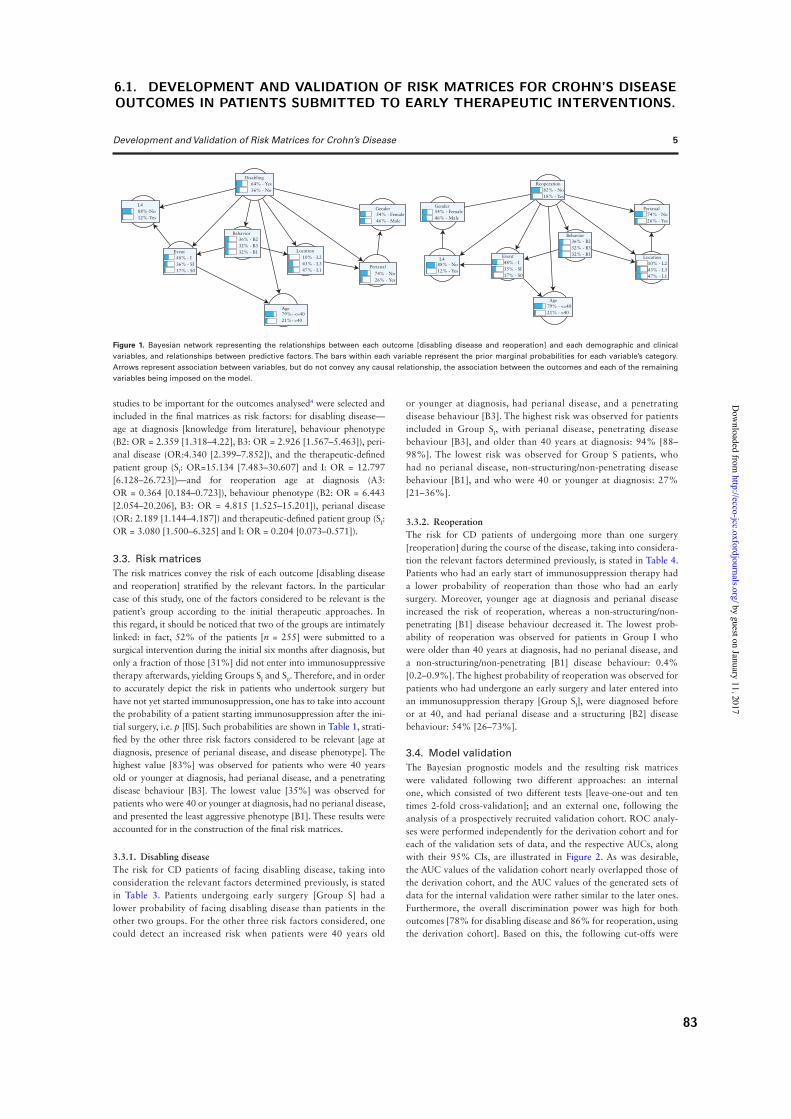
studies to be important for the outcomes analysed4 were selected and included in the final matrices as risk factors: for disabling disease—age at diagnosis [knowledge from literature], behaviour phenotype (B2: OR = 2.359 [1.318–4.22], B3: OR = 2.926 [1.567–5.463]), peri-anal disease (OR:4.340 [2.399–7.852]), and the therapeutic-defined patient group (SI: OR=15.134 [7.483–30.607] and I: OR = 12.797 [6.128–26.723])—and for reoperation age at diagnosis (A3: OR = 0.364 [0.184–0.723]), behaviour phenotype (B2: OR = 6.443 [2.054–20.206], B3: OR = 4.815 [1.525–15.201]), perianal disease (OR: 2.189 [1.144–4.187]) and therapeutic-defined patient group (SI: OR = 3.080 [1.500–6.325] and I: OR = 0.204 [0.073–0.571]).
3.3. Risk matricesThe risk matrices convey the risk of each outcome [disabling disease and reoperation] stratified by the relevant factors. In the particular case of this study, one of the factors considered to be relevant is the patient’s group according to the initial therapeutic approaches. In this regard, it should be noticed that two of the groups are intimately linked: in fact, 52% of the patients [n = 255] were submitted to a surgical intervention during the initial six months after diagnosis, but only a fraction of those [31%] did not enter into immunosuppressive therapy afterwards, yielding Groups SI and S0. Therefore, and in order to accurately depict the risk in patients who undertook surgery but have not yet started immunosuppression, one has to take into account the probability of a patient starting immunosuppression after the ini-tial surgery, i.e. p [I|S]. Such probabilities are shown in Table 1, strati-fied by the other three risk factors considered to be relevant [age at diagnosis, presence of perianal disease, and disease phenotype]. The highest value [83%] was observed for patients who were 40 years old or younger at diagnosis, had perianal disease, and a penetrating disease behaviour [B3]. The lowest value [35%] was observed for patients who were 40 or younger at diagnosis, had no perianal disease, and presented the least aggressive phenotype [B1]. These results were accounted for in the construction of the final risk matrices.
3.3.1. Disabling diseaseThe risk for CD patients of facing disabling disease, taking into consideration the relevant factors determined previously, is stated in Table 3. Patients undergoing early surgery [Group S] had a lower probability of facing disabling disease than patients in the other two groups. For the other three risk factors considered, one could detect an increased risk when patients were 40 years old
or younger at diagnosis, had perianal disease, and a penetrating disease behaviour [B3]. The highest risk was observed for patients included in Group SI, with perianal disease, penetrating disease behaviour [B3], and older than 40 years at diagnosis: 94% [88–98%]. The lowest risk was observed for Group S patients, who had no perianal disease, non-structuring/non-penetrating disease behaviour [B1], and who were 40 or younger at diagnosis: 27% [21–36%].
3.3.2. ReoperationThe risk for CD patients of undergoing more than one surgery [reoperation] during the course of the disease, taking into considera-tion the relevant factors determined previously, is stated in Table 4. Patients who had an early start of immunosuppression therapy had a lower probability of reoperation than those who had an early surgery. Moreover, younger age at diagnosis and perianal disease increased the risk of reoperation, whereas a non-structuring/non-penetrating [B1] disease behaviour decreased it. The lowest prob-ability of reoperation was observed for patients in Group I who were older than 40 years at diagnosis, had no perianal disease, and a non-structuring/non-penetrating [B1] disease behaviour: 0.4% [0.2–0.9%]. The highest probability of reoperation was observed for patients who had undergone an early surgery and later entered into an immunosuppression therapy [Group SI], were diagnosed before or at 40, and had perianal disease and a structuring [B2] disease behaviour: 54% [26–73%].
3.4. Model validationThe Bayesian prognostic models and the resulting risk matrices were validated following two different approaches: an internal one, which consisted of two different tests [leave-one-out and ten times 2-fold cross-validation]; and an external one, following the analysis of a prospectively recruited validation cohort. ROC analy-ses were performed independently for the derivation cohort and for each of the validation sets of data, and the respective AUCs, along with their 95% CIs, are illustrated in Figure 2. As was desirable, the AUC values of the validation cohort nearly overlapped those of the derivation cohort, and the AUC values of the generated sets of data for the internal validation were rather similar to the later ones. Furthermore, the overall discrimination power was high for both outcomes [78% for disabling disease and 86% for reoperation, using the derivation cohort]. Based on this, the following cut-offs were
Behavior
Disabling
Event Location
Perianal
L4 Event
Reoperation
Behavior
Location
PerianalGender Gender
54% - Female46% - Male
54% - Female46% - Male
48% - I35% - SI17% - S0
Age79% - <=4021% - >40
88% - No12% - Yes
82% - No18% - Yes
10% - L243% - L347% - L1
74% - No26% - Yes
36% - B232% - B332% - B1
Age79%- <=4021%- >40
36% - B232% - B332% - B1
48% - I36% - SI17% - S0
10% - L243% - L347% - L1
74% - No26% - Yes
64% - Yes36% - No
L488%-No12%-Yes
Figure 1. Bayesian network representing the relationships between each outcome [disabling disease and reoperation] and each demographic and clinical variables, and relationships between predictive factors. The bars within each variable represent the prior marginal probabilities for each variable’s category. Arrows represent association between variables, but do not convey any causal relationship, the association between the outcomes and each of the remaining variables being imposed on the model.
Development and Validation of Risk Matrices for Crohn’s Disease 5
by guest on January 11, 2017http://ecco-jcc.oxfordjournals.org/
Dow
nloaded from
6.1. DEVELOPMENT AND VALIDATION OF RISK MATRICES FOR CROHN’S DISEASEOUTCOMES IN PATIENTS SUBMITTED TO EARLY THERAPEUTIC INTERVENTIONS.
83
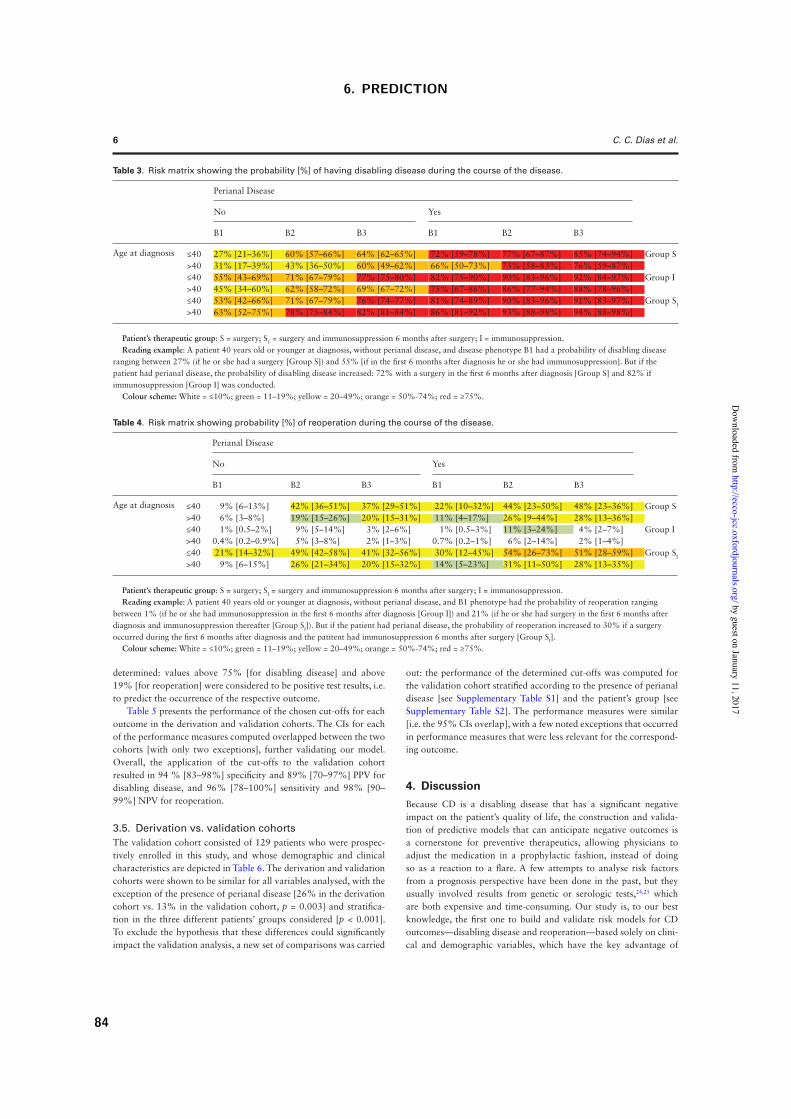
determined: values above 75% [for disabling disease] and above 19% [for reoperation] were considered to be positive test results, i.e. to predict the occurrence of the respective outcome.
Table 5 presents the performance of the chosen cut-offs for each outcome in the derivation and validation cohorts. The CIs for each of the performance measures computed overlapped between the two cohorts [with only two exceptions], further validating our model. Overall, the application of the cut-offs to the validation cohort resulted in 94 % [83–98%] specificity and 89% [70–97%] PPV for disabling disease, and 96% [78–100%] sensitivity and 98% [90–99%] NPV for reoperation.
3.5. Derivation vs. validation cohortsThe validation cohort consisted of 129 patients who were prospec-tively enrolled in this study, and whose demographic and clinical characteristics are depicted in Table 6. The derivation and validation cohorts were shown to be similar for all variables analysed, with the exception of the presence of perianal disease [26% in the derivation cohort vs. 13% in the validation cohort, p = 0.003] and stratifica-tion in the three different patients’ groups considered [p < 0.001]. To exclude the hypothesis that these differences could significantly impact the validation analysis, a new set of comparisons was carried
out: the performance of the determined cut-offs was computed for the validation cohort stratified according to the presence of perianal disease [see Supplementary Table S1] and the patient’s group [see Supplementary Table S2]. The performance measures were similar [i.e. the 95% CIs overlap], with a few noted exceptions that occurred in performance measures that were less relevant for the correspond-ing outcome.
4. DiscussionBecause CD is a disabling disease that has a significant negative impact on the patient’s quality of life, the construction and valida-tion of predictive models that can anticipate negative outcomes is a cornerstone for preventive therapeutics, allowing physicians to adjust the medication in a prophylactic fashion, instead of doing so as a reaction to a flare. A few attempts to analyse risk factors from a prognosis perspective have been done in the past, but they usually involved results from genetic or serologic tests,24,25 which are both expensive and time-consuming. Our study is, to our best knowledge, the first one to build and validate risk models for CD outcomes—disabling disease and reoperation—based solely on clini-cal and demographic variables, which have the key advantage of
Table 4. Risk matrix showing probability [%] of reoperation during the course of the disease.
Perianal Disease
No Yes
B1 B2 B3 B1 B2 B3
Age at diagnosis ≤40 9% [6–13%] 42% [36–51%] 37% [29–51%] 22% [10–32%] 44% [23–50%] 48% [23–36%] Group S>40 6% [3–8%] 19% [15–26%] 20% [15–31%] 11% [4–17%] 26% [9–44%] 28% [13–36%]≤40 1% [0.5–2%] 9% [5–14%] 3% [2–6%] 1% [0.5–3%] 11% [3–24%] 4% [2–7%] Group I>40 0.4% [0.2–0.9%] 5% [3–8%] 2% [1–3%] 0.7% [0.2–1%] 6% [2–14%] 2% [1–4%]≤40 21% [14–32%] 49% [42–58%] 41% [32–56%] 30% [12–45%] 54% [26–73%] 51% [28–59%] Group SI
>40 9% [6–15%] 26% [21–34%] 20% [15–32%] 14% [5–23%] 31% [11–50%] 28% [13–35%]
Patient’s therapeutic group: S = surgery; SI = surgery and immunosuppression 6 months after surgery; I = immunosuppression.Reading example: A patient 40 years old or younger at diagnosis, without perianal disease, and B1 phenotype had the probability of reoperation ranging
between 1% (if he or she had immunosuppression in the first 6 months after diagnosis [Group I]) and 21% (if he or she had surgery in the first 6 months after diagnosis and immunosuppression thereafter [Group SI]). But if the patient had perianal disease, the probability of reoperation increased to 30% if a surgery occurred during the first 6 months after diagnosis and the patitent had immunosuppression 6 months after surgery [Group SI].
Colour scheme: White = ≤10%; green = 11–19%; yellow = 20–49%; orange = 50%-74%; red = ≥75%.
Table 3. Risk matrix showing the probability [%] of having disabling disease during the course of the disease.
Perianal Disease
No Yes
B1 B2 B3 B1 B2 B3
Age at diagnosis ≤40 27% [21–36%] 60% [57–66%] 64% [62–65%] 72% [59–78%] 77% [67–87%] 85% [74–94%] Group S>40 31% [17–39%] 43% [36–50%] 60% [49–62%] 66% [50–73%] 73% [58–83%] 76% [59–87%]≤40 55% [43–69%] 71% [67–79%] 77% [75–80%] 82% [75–90%] 90% [83–96%] 92% [84–97%] Group I>40 45% [34–60%] 62% [58–72%] 69% [67–72%] 75% [67–86%] 86% [77–94%] 88% [78–96%]≤40 53% [42–66%] 71% [67–79%] 76% [74–77%] 81% [74–89%] 90% [83–96%] 91% [83–97%] Group SI
>40 63% [52–75%] 78% [75–84%] 82% [81–84%] 86% [81–92%] 93% [88–98%] 94% [88–98%]
Patient’s therapeutic group: S = surgery; S1 = surgery and immunosuppression 6 months after surgery; I = immunosuppression.Reading example: A patient 40 years old or younger at diagnosis, without perianal disease, and disease phenotype B1 had a probability of disabling disease
ranging between 27% (if he or she had a surgery [Group S]) and 55% [if in the first 6 months after diagnosis he or she had immunosuppression]. But if the patient had perianal disease, the probability of disabling disease increased: 72% with a surgery in the first 6 months after diagnosis [Group S] and 82% if immunosuppression [Group I] was conducted.
Colour scheme: White = ≤10%; green = 11–19%; yellow = 20–49%; orange = 50%-74%; red = ≥75%.
6 C. C. Dias et al.
by guest on January 11, 2017http://ecco-jcc.oxfordjournals.org/
Dow
nloaded from
6. PREDICTION
84
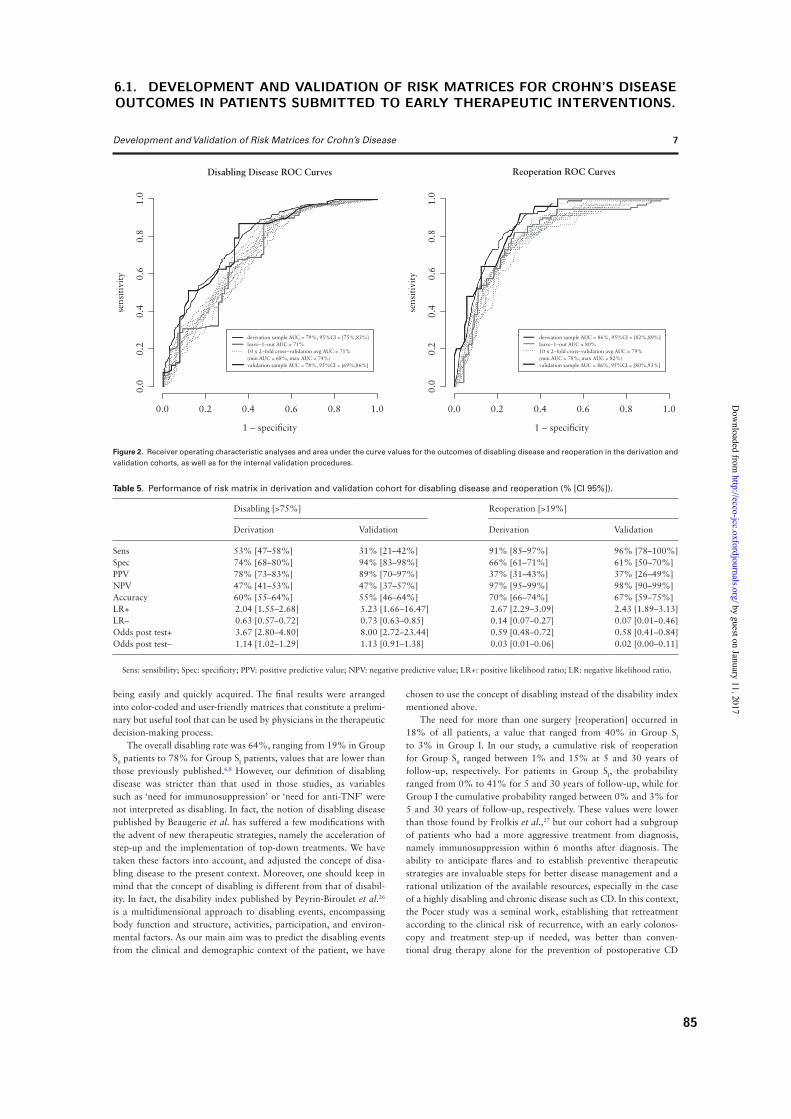
being easily and quickly acquired. The final results were arranged into color-coded and user-friendly matrices that constitute a prelimi-nary but useful tool that can be used by physicians in the therapeutic decision-making process.
The overall disabling rate was 64%, ranging from 19% in Group S0 patients to 78% for Group SI patients, values that are lower than those previously published.6,8 However, our definition of disabling disease was stricter than that used in those studies, as variables such as ‘need for immunosuppression’ or ‘need for anti-TNF’ were not interpreted as disabling. In fact, the notion of disabling disease published by Beaugerie et al. has suffered a few modifications with the advent of new therapeutic strategies, namely the acceleration of step-up and the implementation of top-down treatments. We have taken these factors into account, and adjusted the concept of disa-bling disease to the present context. Moreover, one should keep in mind that the concept of disabling is different from that of disabil-ity. In fact, the disability index published by Peyrin-Biroulet et al.26 is a multidimensional approach to disabling events, encompassing body function and structure, activities, participation, and environ-mental factors. As our main aim was to predict the disabling events from the clinical and demographic context of the patient, we have
chosen to use the concept of disabling instead of the disability index mentioned above.
The need for more than one surgery [reoperation] occurred in 18% of all patients, a value that ranged from 40% in Group SI to 3% in Group I. In our study, a cumulative risk of reoperation for Group S0 ranged between 1% and 15% at 5 and 30 years of follow-up, respectively. For patients in Group SI, the probability ranged from 0% to 41% for 5 and 30 years of follow-up, while for Group I the cumulative probability ranged between 0% and 3% for 5 and 30 years of follow-up, respectively. These values were lower than those found by Frolkis et al.,27 but our cohort had a subgroup of patients who had a more aggressive treatment from diagnosis, namely immunosuppression within 6 months after diagnosis. The ability to anticipate flares and to establish preventive therapeutic strategies are invaluable steps for better disease management and a rational utilization of the available resources, especially in the case of a highly disabling and chronic disease such as CD. In this context, the Pocer study was a seminal work, establishing that retreatment according to the clinical risk of recurrence, with an early colonos-copy and treatment step-up if needed, was better than conven-tional drug therapy alone for the prevention of postoperative CD
Disabling Disease ROC Curves Reoperation ROC Curves
1.0
0.0
0.0 0.2 0.4 0.6
1 − specificity
0.8
derivation sample AUC = 79%, 95%CI = [75%,83%]leave−1−out AUC = 71%10 x 2−fold cross−validation avg AUC = 71%(min AUC = 68%, max AUC = 74%)validation sample AUC = 78%, 95%CI = [69%,86%]
1.0
0.8
0.6
0.4se
nsiti
vity
0.2
1.0
0.0
0.0 0.2 0.4 0.6
1 − specificity
0.8
derivation sample AUC = 86%, 95%CI = [82%,89%]leave−1−out AUC = 80%10 x 2−fold cross−validation avg AUC = 79%(min AUC = 78%, max AUC = 82%)validation sample AUC = 86%, 95%CI = [80%,93%]
1.0
0.8
0.6
0.4se
nsiti
vity
0.2
Figure 2. Receiver operating characteristic analyses and area under the curve values for the outcomes of disabling disease and reoperation in the derivation and validation cohorts, as well as for the internal validation procedures.
Table 5. Performance of risk matrix in derivation and validation cohort for disabling disease and reoperation (% [CI 95%]).
Disabling [>75%] Reoperation [>19%]
Derivation Validation Derivation Validation
Sens 53% [47–58%] 31% [21–42%] 91% [85–97%] 96% [78–100%]Spec 74% [68–80%] 94% [83–98%] 66% [61–71%] 61% [50–70%]PPV 78% [73–83%] 89% [70–97%] 37% [31–43%] 37% [26–49%]NPV 47% [41–53%] 47% [37–57%] 97% [95–99%] 98% [90–99%]Accuracy 60% [55–64%] 55% [46–64%] 70% [66–74%] 67% [59–75%]LR+ 2.04 [1.55–2.68] 5.23 [1.66–16.47] 2.67 [2.29–3.09] 2.43 [1.89–3.13]LR– 0.63 [0.57–0.72] 0.73 [0.63–0.85] 0.14 [0.07–0.27] 0.07 [0.01–0.46]Odds post test+ 3.67 [2.80–4.80] 8.00 [2.72–23.44] 0.59 [0.48–0.72] 0.58 [0.41–0.84]Odds post test– 1.14 [1.02–1.29] 1.13 [0.91–1.38] 0.03 [0.01–0.06] 0.02 [0.00–0.11]
Sens: sensibility; Spec: specificity; PPV: positive predictive value; NPV: negative predictive value; LR+: positive likelihood ratio; LR: negative likelihood ratio.
Development and Validation of Risk Matrices for Crohn’s Disease 7
by guest on January 11, 2017http://ecco-jcc.oxfordjournals.org/
Dow
nloaded from
6.1. DEVELOPMENT AND VALIDATION OF RISK MATRICES FOR CROHN’S DISEASEOUTCOMES IN PATIENTS SUBMITTED TO EARLY THERAPEUTIC INTERVENTIONS.
85
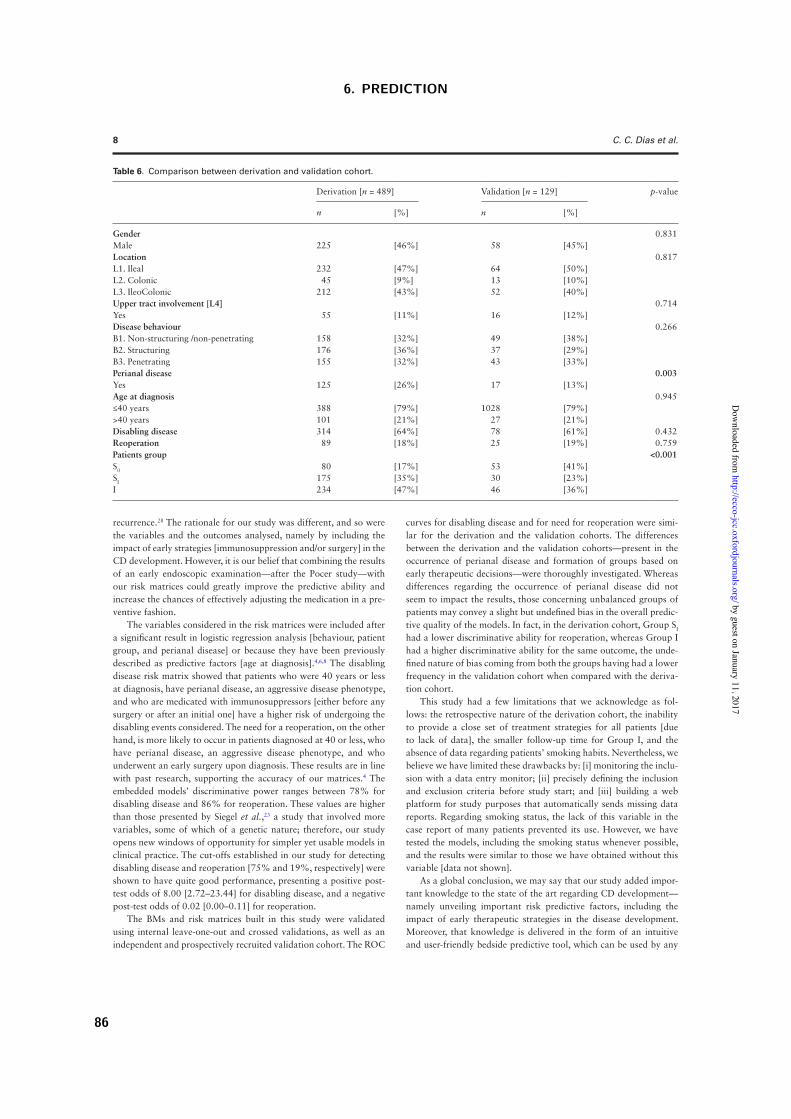
recurrence.28 The rationale for our study was different, and so were the variables and the outcomes analysed, namely by including the impact of early strategies [immunosuppression and/or surgery] in the CD development. However, it is our belief that combining the results of an early endoscopic examination—after the Pocer study—with our risk matrices could greatly improve the predictive ability and increase the chances of effectively adjusting the medication in a pre-ventive fashion.
The variables considered in the risk matrices were included after a significant result in logistic regression analysis [behaviour, patient group, and perianal disease] or because they have been previously described as predictive factors [age at diagnosis].4,6,8 The disabling disease risk matrix showed that patients who were 40 years or less at diagnosis, have perianal disease, an aggressive disease phenotype, and who are medicated with immunosuppressors [either before any surgery or after an initial one] have a higher risk of undergoing the disabling events considered. The need for a reoperation, on the other hand, is more likely to occur in patients diagnosed at 40 or less, who have perianal disease, an aggressive disease phenotype, and who underwent an early surgery upon diagnosis. These results are in line with past research, supporting the accuracy of our matrices.4 The embedded models’ discriminative power ranges between 78% for disabling disease and 86% for reoperation. These values are higher than those presented by Siegel et al.,23 a study that involved more variables, some of which of a genetic nature; therefore, our study opens new windows of opportunity for simpler yet usable models in clinical practice. The cut-offs established in our study for detecting disabling disease and reoperation [75% and 19%, respectively] were shown to have quite good performance, presenting a positive post-test odds of 8.00 [2.72–23.44] for disabling disease, and a negative post-test odds of 0.02 [0.00–0.11] for reoperation.
The BMs and risk matrices built in this study were validated using internal leave-one-out and crossed validations, as well as an independent and prospectively recruited validation cohort. The ROC
curves for disabling disease and for need for reoperation were simi-lar for the derivation and the validation cohorts. The differences between the derivation and the validation cohorts—present in the occurrence of perianal disease and formation of groups based on early therapeutic decisions—were thoroughly investigated. Whereas differences regarding the occurrence of perianal disease did not seem to impact the results, those concerning unbalanced groups of patients may convey a slight but undefined bias in the overall predic-tive quality of the models. In fact, in the derivation cohort, Group SI had a lower discriminative ability for reoperation, whereas Group I had a higher discriminative ability for the same outcome, the unde-fined nature of bias coming from both the groups having had a lower frequency in the validation cohort when compared with the deriva-tion cohort.
This study had a few limitations that we acknowledge as fol-lows: the retrospective nature of the derivation cohort, the inability to provide a close set of treatment strategies for all patients [due to lack of data], the smaller follow-up time for Group I, and the absence of data regarding patients’ smoking habits. Nevertheless, we believe we have limited these drawbacks by: [i] monitoring the inclu-sion with a data entry monitor; [ii] precisely defining the inclusion and exclusion criteria before study start; and [iii] building a web platform for study purposes that automatically sends missing data reports. Regarding smoking status, the lack of this variable in the case report of many patients prevented its use. However, we have tested the models, including the smoking status whenever possible, and the results were similar to those we have obtained without this variable [data not shown].
As a global conclusion, we may say that our study added impor-tant knowledge to the state of the art regarding CD development—namely unveiling important risk predictive factors, including the impact of early therapeutic strategies in the disease development. Moreover, that knowledge is delivered in the form of an intuitive and user-friendly bedside predictive tool, which can be used by any
Table 6. Comparison between derivation and validation cohort.
Derivation [n = 489] Validation [n = 129] p-value
n [%] n [%]
Gender 0.831Male 225 [46%] 58 [45%]Location 0.817L1. Ileal 232 [47%] 64 [50%]L2. Colonic 45 [9%] 13 [10%]L3. IleoColonic 212 [43%] 52 [40%]Upper tract involvement [L4] 0.714Yes 55 [11%] 16 [12%]Disease behaviour 0.266B1. Non-structuring /non-penetrating 158 [32%] 49 [38%]B2. Structuring 176 [36%] 37 [29%]B3. Penetrating 155 [32%] 43 [33%]Perianal disease 0.003Yes 125 [26%] 17 [13%]Age at diagnosis 0.945≤40 years 388 [79%] 1028 [79%]>40 years 101 [21%] 27 [21%]Disabling disease 314 [64%] 78 [61%] 0.432Reoperation 89 [18%] 25 [19%] 0.759Patients group <0.001S0 80 [17%] 53 [41%]SI 175 [35%] 30 [23%]I 234 [47%] 46 [36%]
8 C. C. Dias et al.
by guest on January 11, 2017http://ecco-jcc.oxfordjournals.org/
Dow
nloaded from
6. PREDICTION
86
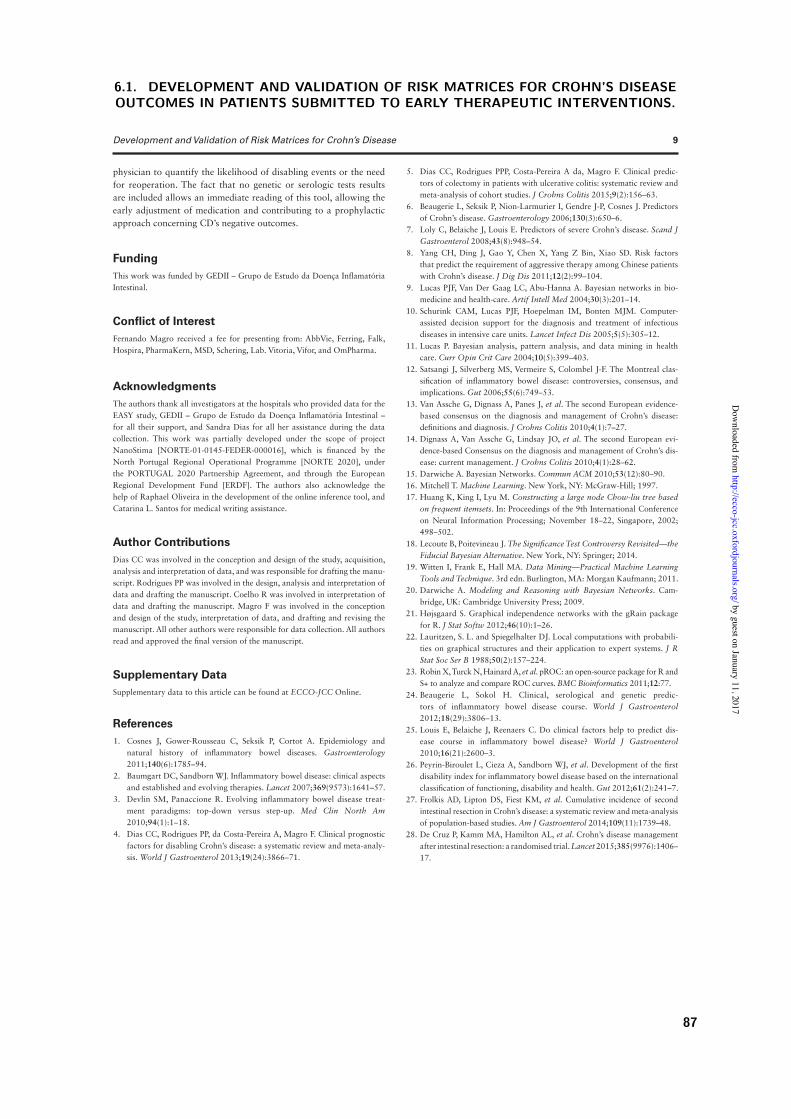
physician to quantify the likelihood of disabling events or the need for reoperation. The fact that no genetic or serologic tests results are included allows an immediate reading of this tool, allowing the early adjustment of medication and contributing to a prophylactic approach concerning CD’s negative outcomes.
FundingThis work was funded by GEDII – Grupo de Estudo da Doença Inflamatória Intestinal.
Conflict of InterestFernando Magro received a fee for presenting from: AbbVie, Ferring, Falk, Hospira, PharmaKern, MSD, Schering, Lab. Vitoria, Vifor, and OmPharma.
AcknowledgmentsThe authors thank all investigators at the hospitals who provided data for the EASY study, GEDII – Grupo de Estudo da Doença Inflamatória Intestinal – for all their support, and Sandra Dias for all her assistance during the data collection. This work was partially developed under the scope of project NanoStima [NORTE-01-0145-FEDER-000016], which is financed by the North Portugal Regional Operational Programme [NORTE 2020], under the PORTUGAL 2020 Partnership Agreement, and through the European Regional Development Fund [ERDF]. The authors also acknowledge the help of Raphael Oliveira in the development of the online inference tool, and Catarina L. Santos for medical writing assistance.
Author ContributionsDias CC was involved in the conception and design of the study, acquisition, analysis and interpretation of data, and was responsible for drafting the manu-script. Rodrigues PP was involved in the design, analysis and interpretation of data and drafting the manuscript. Coelho R was involved in interpretation of data and drafting the manuscript. Magro F was involved in the conception and design of the study, interpretation of data, and drafting and revising the manuscript. All other authors were responsible for data collection. All authors read and approved the final version of the manuscript.
Supplementary DataSupplementary data to this article can be found at ECCO-JCC Online.
References 1. Cosnes J, Gower-Rousseau C, Seksik P, Cortot A. Epidemiology and
natural history of inflammatory bowel diseases. Gastroenterology 2011;140(6):1785–94.
2. Baumgart DC, Sandborn WJ. Inflammatory bowel disease: clinical aspects and established and evolving therapies. Lancet 2007;369(9573):1641–57.
3. Devlin SM, Panaccione R. Evolving inflammatory bowel disease treat-ment paradigms: top-down versus step-up. Med Clin North Am 2010;94(1):1–18.
4. Dias CC, Rodrigues PP, da Costa-Pereira A, Magro F. Clinical prognostic factors for disabling Crohn’s disease: a systematic review and meta-analy-sis. World J Gastroenterol 2013;19(24):3866–71.
5. Dias CC, Rodrigues PPP, Costa-Pereira A da, Magro F. Clinical predic-tors of colectomy in patients with ulcerative colitis: systematic review and meta-analysis of cohort studies. J Crohns Colitis 2015;9(2):156–63.
6. Beaugerie L, Seksik P, Nion-Larmurier I, Gendre J-P, Cosnes J. Predictors of Crohn’s disease. Gastroenterology 2006;130(3):650–6.
7. Loly C, Belaiche J, Louis E. Predictors of severe Crohn’s disease. Scand J Gastroenterol 2008;43(8):948–54.
8. Yang CH, Ding J, Gao Y, Chen X, Yang Z Bin, Xiao SD. Risk factors that predict the requirement of aggressive therapy among Chinese patients with Crohn’s disease. J Dig Dis 2011;12(2):99–104.
9. Lucas PJF, Van Der Gaag LC, Abu-Hanna A. Bayesian networks in bio-medicine and health-care. Artif Intell Med 2004;30(3):201–14.
10. Schurink CAM, Lucas PJF, Hoepelman IM, Bonten MJM. Computer-assisted decision support for the diagnosis and treatment of infectious diseases in intensive care units. Lancet Infect Dis 2005;5(5):305–12.
11. Lucas P. Bayesian analysis, pattern analysis, and data mining in health care. Curr Opin Crit Care 2004;10(5):399–403.
12. Satsangi J, Silverberg MS, Vermeire S, Colombel J-F. The Montreal clas-sification of inflammatory bowel disease: controversies, consensus, and implications. Gut 2006;55(6):749–53.
13. Van Assche G, Dignass A, Panes J, et al. The second European evidence-based consensus on the diagnosis and management of Crohn’s disease: definitions and diagnosis. J Crohns Colitis 2010;4(1):7–27.
14. Dignass A, Van Assche G, Lindsay JO, et al. The second European evi-dence-based Consensus on the diagnosis and management of Crohn’s dis-ease: current management. J Crohns Colitis 2010;4(1):28–62.
15. Darwiche A. Bayesian Networks. Commun ACM 2010;53(12):80–90. 16. Mitchell T. Machine Learning. New York, NY: McGraw-Hill; 1997. 17. Huang K, King I, Lyu M. Constructing a large node Chow-liu tree based
on frequent itemsets. In: Proceedings of the 9th International Conference on Neural Information Processing; November 18–22, Singapore, 2002; 498–502.
18. Lecoute B, Poitevineau J. The Significance Test Controversy Revisited—the Fiducial Bayesian Alternative. New York, NY: Springer; 2014.
19. Witten I, Frank E, Hall MA. Data Mining—Practical Machine Learning Tools and Technique. 3rd edn. Burlington, MA: Morgan Kaufmann; 2011.
20. Darwiche A. Modeling and Reasoning with Bayesian Networks. Cam-bridge, UK: Cambridge University Press; 2009.
21. Højsgaard S. Graphical independence networks with the gRain package for R. J Stat Softw 2012;46(10):1–26.
22. Lauritzen, S. L. and Spiegelhalter DJ. Local computations with probabili-ties on graphical structures and their application to expert systems. J R Stat Soc Ser B 1988;50(2):157–224.
23. Robin X, Turck N, Hainard A, et al. pROC: an open-source package for R and S+ to analyze and compare ROC curves. BMC Bioinformatics 2011;12:77.
24. Beaugerie L, Sokol H. Clinical, serological and genetic predic-tors of inflammatory bowel disease course. World J Gastroenterol 2012;18(29):3806–13.
25. Louis E, Belaiche J, Reenaers C. Do clinical factors help to predict dis-ease course in inflammatory bowel disease? World J Gastroenterol 2010;16(21):2600–3.
26. Peyrin-Biroulet L, Cieza A, Sandborn WJ, et al. Development of the first disability index for inflammatory bowel disease based on the international classification of functioning, disability and health. Gut 2012;61(2):241–7.
27. Frolkis AD, Lipton DS, Fiest KM, et al. Cumulative incidence of second intestinal resection in Crohn’s disease: a systematic review and meta-analysis of population-based studies. Am J Gastroenterol 2014;109(11):1739–48.
28. De Cruz P, Kamm MA, Hamilton AL, et al. Crohn’s disease management after intestinal resection: a randomised trial. Lancet 2015;385(9976):1406–17.
Development and Validation of Risk Matrices for Crohn’s Disease 9
by guest on January 11, 2017http://ecco-jcc.oxfordjournals.org/
Dow
nloaded from
6.1. DEVELOPMENT AND VALIDATION OF RISK MATRICES FOR CROHN’S DISEASEOUTCOMES IN PATIENTS SUBMITTED TO EARLY THERAPEUTIC INTERVENTIONS.
87
6. PREDICTION
6.2 The risk of disabling, surgery and reoperation in Crohn’s disease:
a decision tree-based approach to prognosis
(submitted, 2016)
Claudia Camila Dias, Pedro Pereira Rodrigues, Samuel Fernandes, Francisco Portela, Paula Min-
istro, Diana Martins, Paula Sousa, Paula Lago, Isadora Rosa, Luıs Correia, Paula Moura Santos,
Fernando Magro on behalf GEDII
88
1
The risk of disabling, surgery and reoperation in Crohn’s disease – a decision tree-based approach to prognosis
Cláudia Camila Dias1,2, Pedro Pereira Rodrigues1,2,Samuel Fernandes3, Francisco Portela4, Paula Ministro5, Diana Martins5, Paula Sousa5 Paula Lago6, Isadora Rosa7, Luis Correia3, Paula Moura Santos3 , Fernando Magro8,9,10 on behalf GEDII
1- Health Information and Decision Sciences Department, Faculty of Medicine of the University of Porto, Portugal;
2- CINTESIS - Centre for Research in Health Informatics Systems and Technologies, Porto, Portugal;
3- Centro Hospitalar Lisboa Norte, Hospital de Santa Maria, Portugal 4- Gastroenterology Department, Centro Hospitalar e Universitário de Coimbra, Portugal 5- Gastroenterology Department, Centro Hospitalar Tondela e Viseu, Portugal 6- Gastroenterology Department, Centro Hospitalar do Porto, Portugal 7- IPO Lisboa 8 - Gastroenterology Department, Hospital São João, Porto; 9- Institute of Pharmacology and Therapeutics Faculty of Medicine of the University of Porto, Portugal; 10- MedInUP - Center for Drug Discovery and Innovative Medicines, University of Porto, Porto, Portugal Corresponding Author: Fernando Magro Institute of Pharmacology and Therapeutics Faculdade de Medicina da Universidade do Porto Alameda Prof Hernâni Monteiro 4200-319 Porto PORTUGAL Phone: +351225513642 Fax: +351225513643 email: [email protected] Author contributions: Dias CC was involved in the conception and design of the study, acquisition, analysis and interpretation of data, and was responsible for drafting the manuscript; Magro F was involved in the conception and design of the study, interpretation of data, and drafting and revising the manuscript. All others others were responsible for data inclusion. All authors read and approved the final manuscript.
6.2. THE RISK OF DISABLING, SURGERY AND REOPERATION IN CROHN’S DISEASE: ADECISION TREE-BASED APPROACH TO PROGNOSIS
89

2
Conflict of interest: Fernando Magro received a fee for presenting from: AbbVie, Ferring, Falk, Hospira, PharmaKern, MSD, Schering, Lab. Vitoria, Vifor, OmPharma. Funding: This work was funded by GEDII - Grupo de Estudo da Doença Inflamatória Intestinal.
6. PREDICTION
90
3
Abstract Introduction: Crohn’s disease (CD) is a chronic inflammatory bowel disease known to carry a high risk of disabling and many times requiring surgical interventions. The computation of prognosis models is a key step towards a better comprehension of the disease and a more efficient management of its symptoms. This article describes a decision-tree based approach that defines the CD patients’ risk or undergoing disabling events, surgical interventions and reoperations, based on a particular combination of clinical and demographic variables. Material and methods: This multicentric study involved 1547 CD patients retrospectively enrolled and divided into two cohorts: a derivation one (80%) and a validation one (20%). Decision trees were built upon applying the CHAIRT algorithm for the selection of variables. Results: Three-level decision trees were built for the risk of disabling and reoperation, whereas the risk of surgery was described in a two-level one. A receiver operating characteristic (ROC) analysis was performed, and the area under the curves (AUC) revealed that the decision trees were able to predict disabling, surgery and reoperation with a probability of 72%, 80% and 69%, respectively. Risk cut-off levels were defined and shown to be useful for the outcomes assessment: risk levels above 75% for disabling had an odds test positivity of 4.06 [3.50-4.71], whereas risk levels below 34% and 19% excluded surgery and reoperation with an odds test negativity of 0.15 [0.09-0.25] and 0.50 [0.24-1.01], respectively. Globally, patients with B2 or B3 phenotype had a higher proportion of disabling disease and surgery, while patients with later introduction of pharmacological therapeutic (1 months after initial surgery) had a higher proportion of reoperation. Conclusions: Demographic and clinical variables can be used to accurately assess the CD patients’ future risk of disabling, surgery and reoperation. The decision-tree based approach used in this study has shown to be a valid and useful approach to depict such risks. Keywords: Disabling disease, reoperation, Crohn’s disease. Risk matrices
6.2. THE RISK OF DISABLING, SURGERY AND REOPERATION IN CROHN’S DISEASE: ADECISION TREE-BASED APPROACH TO PROGNOSIS
91
4
Introduction
Crohn’s disease (CD) is a chronic inflammatory bowel disease for which no definitive treatment has been described. As so, clinicians approach the disease attempting to control the symptoms, avoiding disease complications and improving patients’ quality of life (1). The most frequent CD complications are related to an uncontrolled inflammation of the bowel, which may cause obstruction and perforation of the small intestine or of the colon, abscess, fistulae and/or intestinal bleeding. The occurrence of these events may require a surgical intervention, which ends up being a common strategy in CD management. In fact, previous studies have reported that around 50% of all CD patients will eventually undergo bowel surgery within 10 years after the diagnosis, whereas 80% will eventually require a surgery throughout the entire disease course (1,2). Moreover, recurrence is extremely frequent, and the rate of reoperations in previous studies ranged from 40% to 80% (2,3).
As for the concept of disabling, this term was introduced by Beaugerie et al. in 2006 (4) and by Loly et al. (5) in 2008: both groups evaluated the impact of the disease using clinical and measurable criteria. These studies reported a proportion of disabling disease between 85% and 58%, respectively. Five years after the initial study on this topic, Yang et al. (6) presented a new report that settled the proportion of disabling at 80%. However, this last study used a slightly different definition of disabling disease. In fact, given the rapid evolution of disease control strategies, there is currently no consensus on the concept of disabling disease.
The definition of a strong and accurate prognosis model is a key step towards a better disease control and a higher quality of life in CD patients. In this context, this study aimed to unveil the differential impact of several clinical and demographic variables on the CD patients’ risk of surgery, disabling and reoperation, using a decision trees-based strategy.
Material and Methods Derivation and validation cohort This manuscript describes a multicentric retrospective cohort study including 1547 CD patients recruited from six Portuguese inflammatory bowel disease (IBD) specialist hospitals. Patients were included if 1) had a definitive diagnosis of CD; 2) had at least three years of follow-up; 3) had at least one consultation with a physician involved in this study during 2014 or 2015; and 4) had performed at least an X-ray computed tomography (CT) or a magnetic resonance imaging (MRI) during the follow-up. A hold-out strategy was followed to enable a generalized validation of the prognostic models: the cohort was randomly split into two groups. The first one comprised 80% of patients and constituted the derivation cohort; the held-out remaining 20% of patients were considered to be the validation cohort.
6. PREDICTION
92
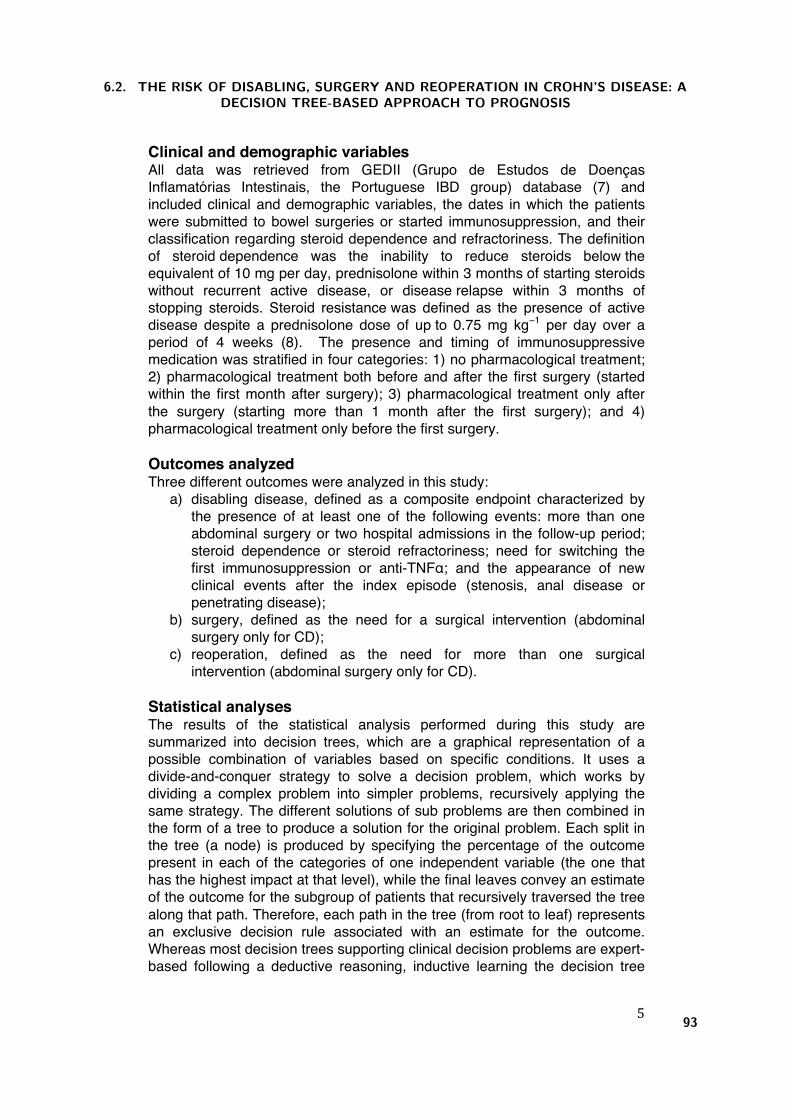
5
Clinical and demographic variables All data was retrieved from GEDII (Grupo de Estudos de Doenças Inflamatórias Intestinais, the Portuguese IBD group) database (7) and included clinical and demographic variables, the dates in which the patients were submitted to bowel surgeries or started immunosuppression, and their classification regarding steroid dependence and refractoriness. The definition of steroid dependence was the inability to reduce steroids below the equivalent of 10 mg per day, prednisolone within 3 months of starting steroids without recurrent active disease, or disease relapse within 3 months of stopping steroids. Steroid resistance was defined as the presence of active disease despite a prednisolone dose of up to 0.75 mg kg−1 per day over a period of 4 weeks (8). The presence and timing of immunosuppressive medication was stratified in four categories: 1) no pharmacological treatment; 2) pharmacological treatment both before and after the first surgery (started within the first month after surgery); 3) pharmacological treatment only after the surgery (starting more than 1 month after the first surgery); and 4) pharmacological treatment only before the first surgery. Outcomes analyzed Three different outcomes were analyzed in this study:
a) disabling disease, defined as a composite endpoint characterized by the presence of at least one of the following events: more than one abdominal surgery or two hospital admissions in the follow-up period; steroid dependence or steroid refractoriness; need for switching the first immunosuppression or anti-TNFα; and the appearance of new clinical events after the index episode (stenosis, anal disease or penetrating disease);
b) surgery, defined as the need for a surgical intervention (abdominal surgery only for CD);
c) reoperation, defined as the need for more than one surgical intervention (abdominal surgery only for CD).
Statistical analyses The results of the statistical analysis performed during this study are summarized into decision trees, which are a graphical representation of a possible combination of variables based on specific conditions. It uses a divide-and-conquer strategy to solve a decision problem, which works by dividing a complex problem into simpler problems, recursively applying the same strategy. The different solutions of sub problems are then combined in the form of a tree to produce a solution for the original problem. Each split in the tree (a node) is produced by specifying the percentage of the outcome present in each of the categories of one independent variable (the one that has the highest impact at that level), while the final leaves convey an estimate of the outcome for the subgroup of patients that recursively traversed the tree along that path. Therefore, each path in the tree (from root to leaf) represents an exclusive decision rule associated with an estimate for the outcome. Whereas most decision trees supporting clinical decision problems are expert-based following a deductive reasoning, inductive learning the decision tree
6.2. THE RISK OF DISABLING, SURGERY AND REOPERATION IN CROHN’S DISEASE: ADECISION TREE-BASED APPROACH TO PROGNOSIS
93
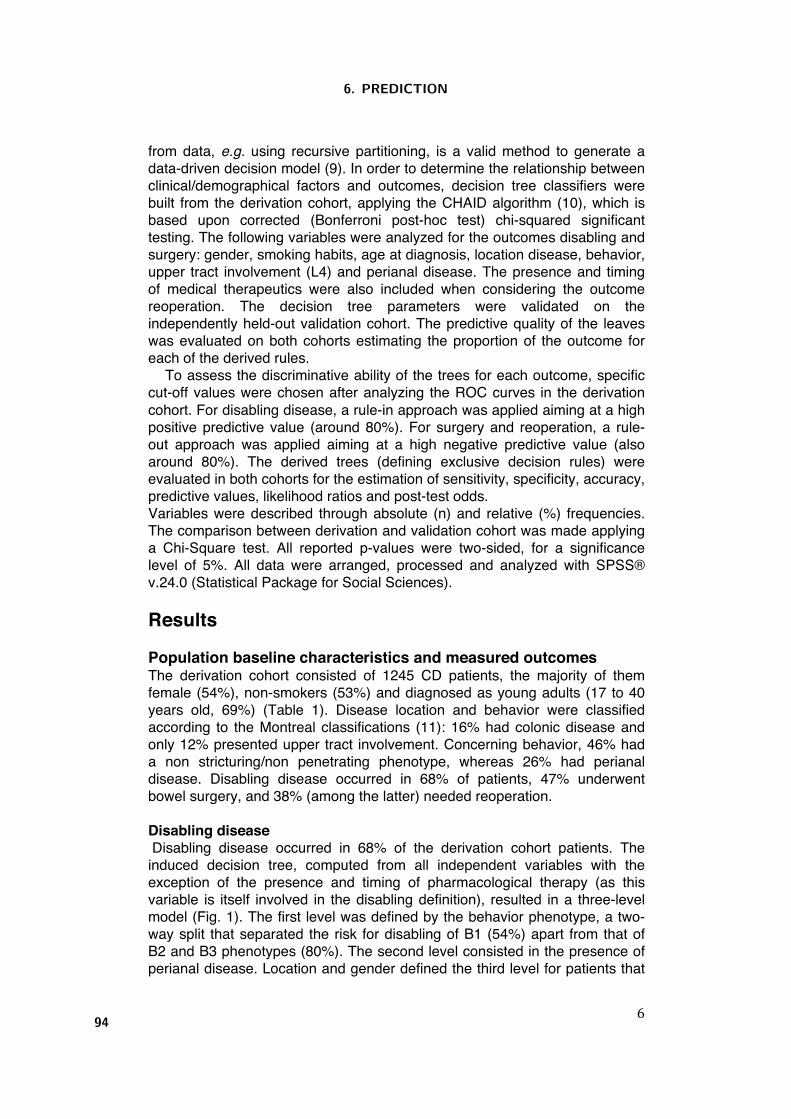
6
from data, e.g. using recursive partitioning, is a valid method to generate a data-driven decision model (9). In order to determine the relationship between clinical/demographical factors and outcomes, decision tree classifiers were built from the derivation cohort, applying the CHAID algorithm (10), which is based upon corrected (Bonferroni post-hoc test) chi-squared significant testing. The following variables were analyzed for the outcomes disabling and surgery: gender, smoking habits, age at diagnosis, location disease, behavior, upper tract involvement (L4) and perianal disease. The presence and timing of medical therapeutics were also included when considering the outcome reoperation. The decision tree parameters were validated on the independently held-out validation cohort. The predictive quality of the leaves was evaluated on both cohorts estimating the proportion of the outcome for each of the derived rules.
To assess the discriminative ability of the trees for each outcome, specific cut-off values were chosen after analyzing the ROC curves in the derivation cohort. For disabling disease, a rule-in approach was applied aiming at a high positive predictive value (around 80%). For surgery and reoperation, a rule-out approach was applied aiming at a high negative predictive value (also around 80%). The derived trees (defining exclusive decision rules) were evaluated in both cohorts for the estimation of sensitivity, specificity, accuracy, predictive values, likelihood ratios and post-test odds. Variables were described through absolute (n) and relative (%) frequencies. The comparison between derivation and validation cohort was made applying a Chi-Square test. All reported p-values were two-sided, for a significance level of 5%. All data were arranged, processed and analyzed with SPSS® v.24.0 (Statistical Package for Social Sciences). Results Population baseline characteristics and measured outcomes The derivation cohort consisted of 1245 CD patients, the majority of them female (54%), non-smokers (53%) and diagnosed as young adults (17 to 40 years old, 69%) (Table 1). Disease location and behavior were classified according to the Montreal classifications (11): 16% had colonic disease and only 12% presented upper tract involvement. Concerning behavior, 46% had a non stricturing/non penetrating phenotype, whereas 26% had perianal disease. Disabling disease occurred in 68% of patients, 47% underwent bowel surgery, and 38% (among the latter) needed reoperation. Disabling disease Disabling disease occurred in 68% of the derivation cohort patients. The induced decision tree, computed from all independent variables with the exception of the presence and timing of pharmacological therapy (as this variable is itself involved in the disabling definition), resulted in a three-level model (Fig. 1). The first level was defined by the behavior phenotype, a two-way split that separated the risk for disabling of B1 (54%) apart from that of B2 and B3 phenotypes (80%). The second level consisted in the presence of perianal disease. Location and gender defined the third level for patients that
6. PREDICTION
94
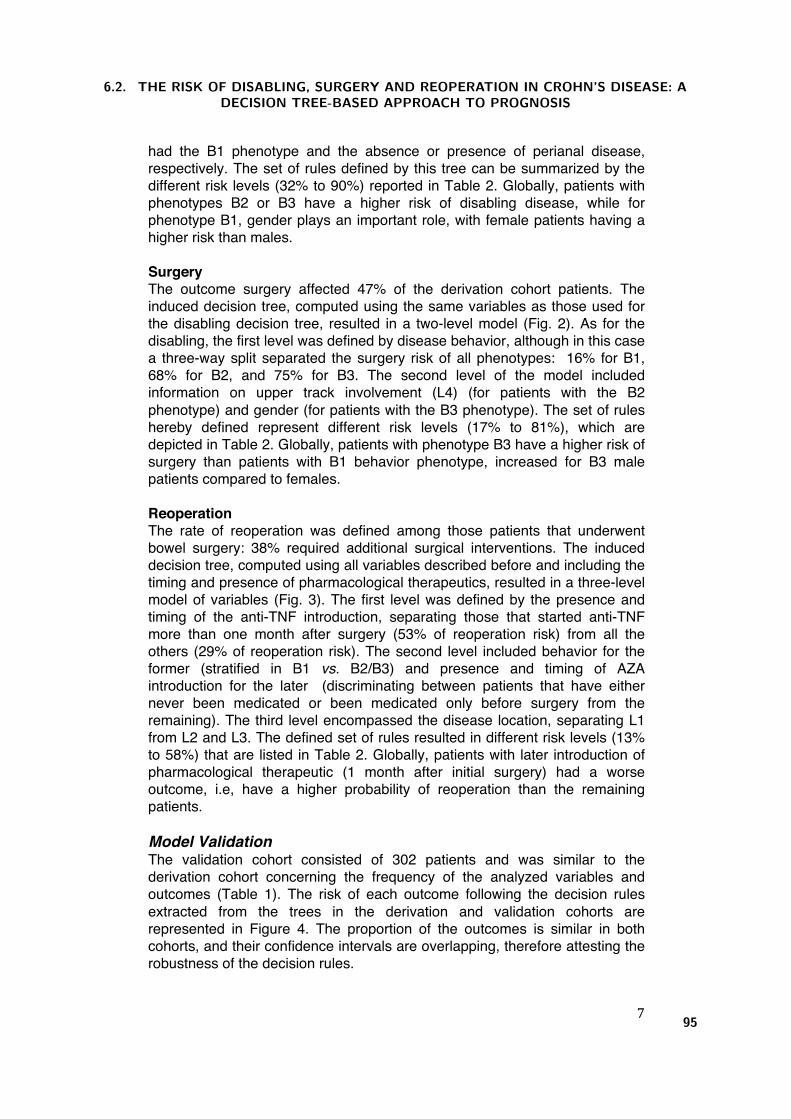
7
had the B1 phenotype and the absence or presence of perianal disease, respectively. The set of rules defined by this tree can be summarized by the different risk levels (32% to 90%) reported in Table 2. Globally, patients with phenotypes B2 or B3 have a higher risk of disabling disease, while for phenotype B1, gender plays an important role, with female patients having a higher risk than males. Surgery The outcome surgery affected 47% of the derivation cohort patients. The induced decision tree, computed using the same variables as those used for the disabling decision tree, resulted in a two-level model (Fig. 2). As for the disabling, the first level was defined by disease behavior, although in this case a three-way split separated the surgery risk of all phenotypes: 16% for B1, 68% for B2, and 75% for B3. The second level of the model included information on upper track involvement (L4) (for patients with the B2 phenotype) and gender (for patients with the B3 phenotype). The set of rules hereby defined represent different risk levels (17% to 81%), which are depicted in Table 2. Globally, patients with phenotype B3 have a higher risk of surgery than patients with B1 behavior phenotype, increased for B3 male patients compared to females. Reoperation The rate of reoperation was defined among those patients that underwent bowel surgery: 38% required additional surgical interventions. The induced decision tree, computed using all variables described before and including the timing and presence of pharmacological therapeutics, resulted in a three-level model of variables (Fig. 3). The first level was defined by the presence and timing of the anti-TNF introduction, separating those that started anti-TNF more than one month after surgery (53% of reoperation risk) from all the others (29% of reoperation risk). The second level included behavior for the former (stratified in B1 vs. B2/B3) and presence and timing of AZA introduction for the later (discriminating between patients that have either never been medicated or been medicated only before surgery from the remaining). The third level encompassed the disease location, separating L1 from L2 and L3. The defined set of rules resulted in different risk levels (13% to 58%) that are listed in Table 2. Globally, patients with later introduction of pharmacological therapeutic (1 month after initial surgery) had a worse outcome, i.e, have a higher probability of reoperation than the remaining patients. Model Validation The validation cohort consisted of 302 patients and was similar to the derivation cohort concerning the frequency of the analyzed variables and outcomes (Table 1). The risk of each outcome following the decision rules extracted from the trees in the derivation and validation cohorts are represented in Figure 4. The proportion of the outcomes is similar in both cohorts, and their confidence intervals are overlapping, therefore attesting the robustness of the decision rules.
6.2. THE RISK OF DISABLING, SURGERY AND REOPERATION IN CROHN’S DISEASE: ADECISION TREE-BASED APPROACH TO PROGNOSIS
95
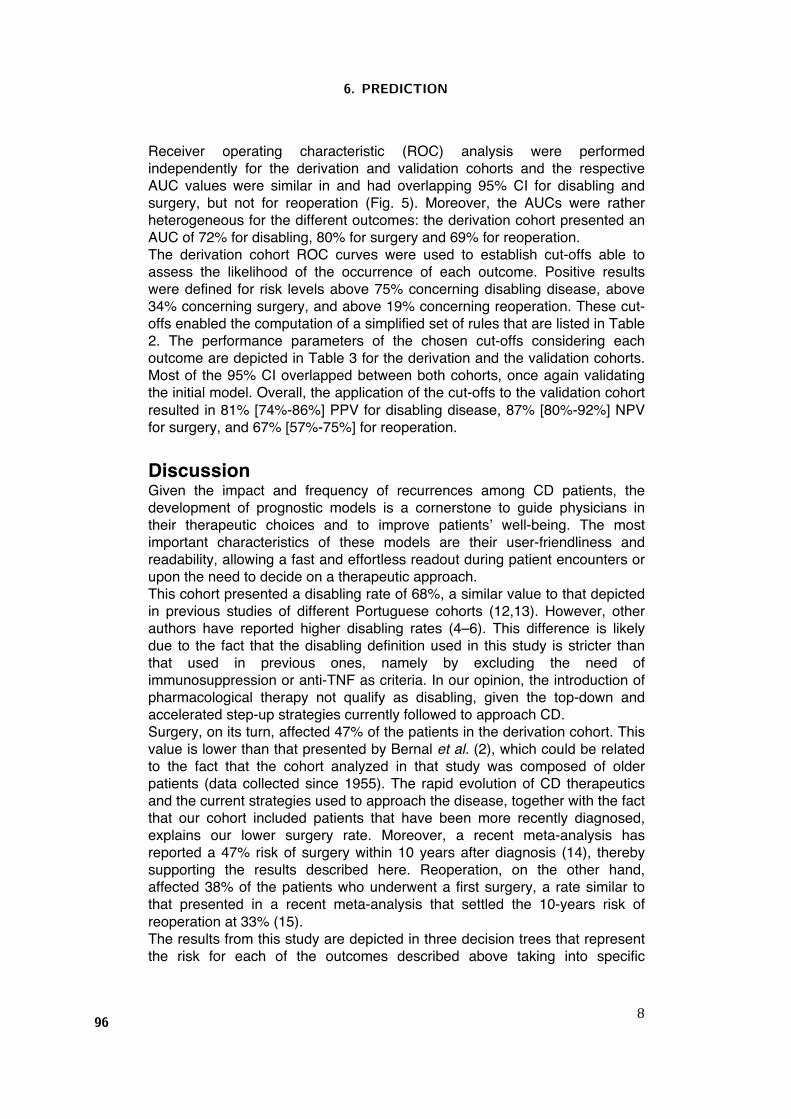
8
Receiver operating characteristic (ROC) analysis were performed independently for the derivation and validation cohorts and the respective AUC values were similar in and had overlapping 95% CI for disabling and surgery, but not for reoperation (Fig. 5). Moreover, the AUCs were rather heterogeneous for the different outcomes: the derivation cohort presented an AUC of 72% for disabling, 80% for surgery and 69% for reoperation. The derivation cohort ROC curves were used to establish cut-offs able to assess the likelihood of the occurrence of each outcome. Positive results were defined for risk levels above 75% concerning disabling disease, above 34% concerning surgery, and above 19% concerning reoperation. These cut-offs enabled the computation of a simplified set of rules that are listed in Table 2. The performance parameters of the chosen cut-offs considering each outcome are depicted in Table 3 for the derivation and the validation cohorts. Most of the 95% CI overlapped between both cohorts, once again validating the initial model. Overall, the application of the cut-offs to the validation cohort resulted in 81% [74%-86%] PPV for disabling disease, 87% [80%-92%] NPV for surgery, and 67% [57%-75%] for reoperation. Discussion Given the impact and frequency of recurrences among CD patients, the development of prognostic models is a cornerstone to guide physicians in their therapeutic choices and to improve patients’ well-being. The most important characteristics of these models are their user-friendliness and readability, allowing a fast and effortless readout during patient encounters or upon the need to decide on a therapeutic approach. This cohort presented a disabling rate of 68%, a similar value to that depicted in previous studies of different Portuguese cohorts (12,13). However, other authors have reported higher disabling rates (4–6). This difference is likely due to the fact that the disabling definition used in this study is stricter than that used in previous ones, namely by excluding the need of immunosuppression or anti-TNF as criteria. In our opinion, the introduction of pharmacological therapy not qualify as disabling, given the top-down and accelerated step-up strategies currently followed to approach CD. Surgery, on its turn, affected 47% of the patients in the derivation cohort. This value is lower than that presented by Bernal et al. (2), which could be related to the fact that the cohort analyzed in that study was composed of older patients (data collected since 1955). The rapid evolution of CD therapeutics and the current strategies used to approach the disease, together with the fact that our cohort included patients that have been more recently diagnosed, explains our lower surgery rate. Moreover, a recent meta-analysis has reported a 47% risk of surgery within 10 years after diagnosis (14), thereby supporting the results described here. Reoperation, on the other hand, affected 38% of the patients who underwent a first surgery, a rate similar to that presented in a recent meta-analysis that settled the 10-years risk of reoperation at 33% (15). The results from this study are depicted in three decision trees that represent the risk for each of the outcomes described above taking into specific
6. PREDICTION
96
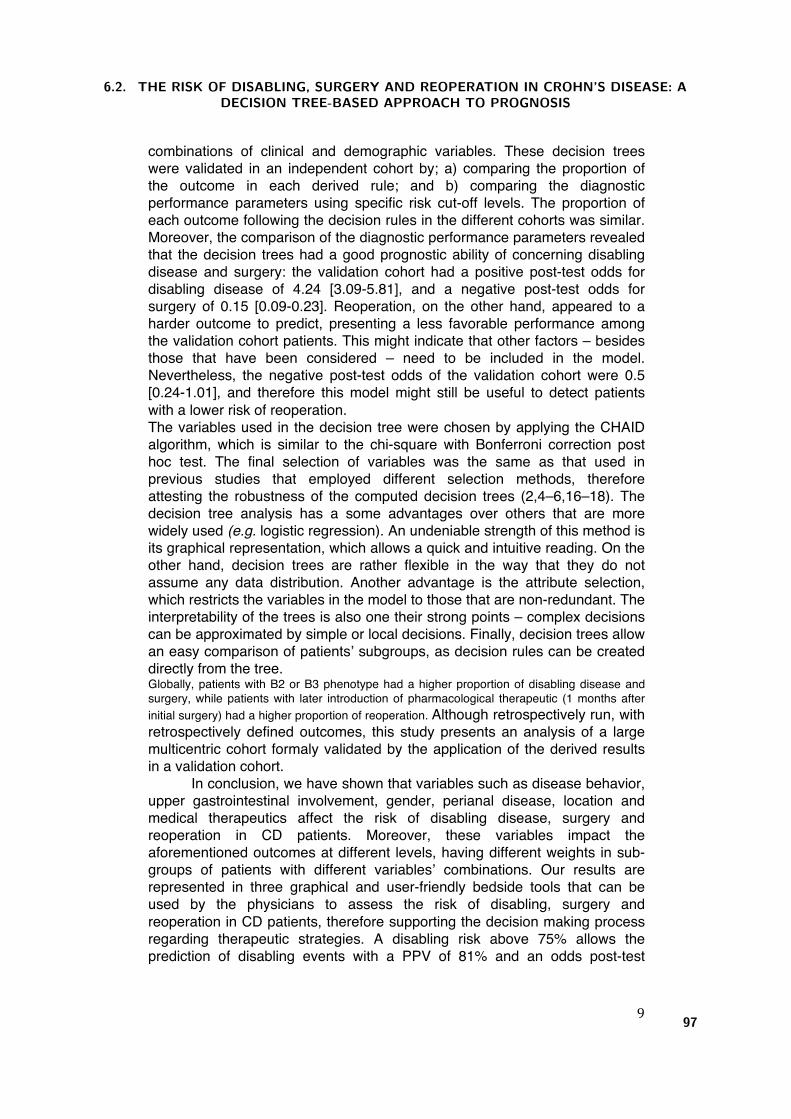
9
combinations of clinical and demographic variables. These decision trees were validated in an independent cohort by; a) comparing the proportion of the outcome in each derived rule; and b) comparing the diagnostic performance parameters using specific risk cut-off levels. The proportion of each outcome following the decision rules in the different cohorts was similar. Moreover, the comparison of the diagnostic performance parameters revealed that the decision trees had a good prognostic ability of concerning disabling disease and surgery: the validation cohort had a positive post-test odds for disabling disease of 4.24 [3.09-5.81], and a negative post-test odds for surgery of 0.15 [0.09-0.23]. Reoperation, on the other hand, appeared to a harder outcome to predict, presenting a less favorable performance among the validation cohort patients. This might indicate that other factors – besides those that have been considered – need to be included in the model. Nevertheless, the negative post-test odds of the validation cohort were 0.5 [0.24-1.01], and therefore this model might still be useful to detect patients with a lower risk of reoperation. The variables used in the decision tree were chosen by applying the CHAID algorithm, which is similar to the chi-square with Bonferroni correction post hoc test. The final selection of variables was the same as that used in previous studies that employed different selection methods, therefore attesting the robustness of the computed decision trees (2,4–6,16–18). The decision tree analysis has a some advantages over others that are more widely used (e.g. logistic regression). An undeniable strength of this method is its graphical representation, which allows a quick and intuitive reading. On the other hand, decision trees are rather flexible in the way that they do not assume any data distribution. Another advantage is the attribute selection, which restricts the variables in the model to those that are non-redundant. The interpretability of the trees is also one their strong points – complex decisions can be approximated by simple or local decisions. Finally, decision trees allow an easy comparison of patients’ subgroups, as decision rules can be created directly from the tree. Globally, patients with B2 or B3 phenotype had a higher proportion of disabling disease and surgery, while patients with later introduction of pharmacological therapeutic (1 months after initial surgery) had a higher proportion of reoperation. Although retrospectively run, with retrospectively defined outcomes, this study presents an analysis of a large multicentric cohort formaly validated by the application of the derived results in a validation cohort.
In conclusion, we have shown that variables such as disease behavior, upper gastrointestinal involvement, gender, perianal disease, location and medical therapeutics affect the risk of disabling disease, surgery and reoperation in CD patients. Moreover, these variables impact the aforementioned outcomes at different levels, having different weights in sub-groups of patients with different variables’ combinations. Our results are represented in three graphical and user-friendly bedside tools that can be used by the physicians to assess the risk of disabling, surgery and reoperation in CD patients, therefore supporting the decision making process regarding therapeutic strategies. A disabling risk above 75% allows the prediction of disabling events with a PPV of 81% and an odds post-test
6.2. THE RISK OF DISABLING, SURGERY AND REOPERATION IN CROHN’S DISEASE: ADECISION TREE-BASED APPROACH TO PROGNOSIS
97
10
positivity of 4.24, whereas a surgery risk inferior to 34% allows the exclusion of future surgeries with a NPV of 87% and an odds post-test negativity of 0.15. The reoperation was the hardest outcome to predict, although a risk below 19% could be useful for excluding future events (NPV: 87 and odds post-test negativity: 0.5). Acknowledgments
The authors would like to acknowledge all investigators at the hospitals who provided data for this study, GEDII – Grupo de Estudo da Doença Inflamatória Intestinal – for all the support, Sandra Dias for all the help during data collection, and Catarina L. Santos for scientific writing assistance. This work was partially developed under the scope of project NanoStima (NORTE-01-0145-FEDER-000016), which is financed by the North Portugal Regional Operational Programme (NORTE 2020), under the PORTUGAL 2020 Partnership Agreement, and through the European Regional Development Fund (ERDF). References 1. Carter MJ, Lobo AJ, Travis SPL, IBD Section BS of G. Guidelines for
the management of inflammatory bowel disease in adults. Gut [Internet]. 2004 Sep;53 Suppl 5:V1–16. Available from: http://www.ncbi.nlm.nih.gov/pubmed/15306569
2. Bernell O, Lapidus A, Hellers G. Risk factors for surgery and recurrence in 907 patients with primary ileocaecal Crohn’s disease. Br J Surg [Internet]. 2000;87(12):1697–701. Available from: http://www.ncbi.nlm.nih.gov/pubmed/11122187
3. Olaison G, Smedh K, Sjödahl R. Natural course of Crohn’s disease after ileocolic resection: endoscopically visualised ileal ulcers preceding symptoms. Gut [Internet]. 1992 Mar;33(3):331–5. Available from: http://www.ncbi.nlm.nih.gov/pubmed/1568651
4. Beaugerie L, Seksik P, Nion-Larmurier I, Gendre J-P, Cosnes J. Predictors of Crohn’s disease. Gastroenterology [Internet]. 2006;130(3):650–6. Available from: http://www.ncbi.nlm.nih.gov/pubmed/16530505
5. Loly C, Belaiche J, Louis E. Predictors of severe Crohn’s disease. Scand J Gastroenterol [Internet]. 2008 Aug;43(8):948–54. Available from: http://www.ncbi.nlm.nih.gov/pubmed/19086165
6. Yang CH, Ding J, Gao Y, Chen X, Yang Z Bin, Xiao SD. Risk factors that predict the requirement of aggressive therapy among Chinese patients with Crohn’s disease. J Dig Dis [Internet]. 2011 Apr;12(2):99–104. Available from: http://www.ncbi.nlm.nih.gov/pubmed/21401894
7. GEDII Group. GEDII data base. https://gediibasedados.med.up.pt/; 2016.
8. Dignass A, Van Assche G, Lindsay JO, Lémann M, Söderholm J, Colombel JF, et al. The second European evidence-based Consensus
6. PREDICTION
98
11
on the diagnosis and management of Crohn’s disease: Current management. J Crohns Colitis [Internet]. 2010;4(1):28–62. Available from: http://www.ncbi.nlm.nih.gov/pubmed/21122489
9. Breiman L, Friedman J, Olshen R, Stone C. Classification and Regression Tree. 1984.
10. Biggs D, Ville B, Suen E. A method of choosing multiway partitions for classification and decision trees. J Appl Stat. 1991;18(1):49–62.
11. Silverberg MS, Satsangi J, Ahmad T, Arnott IDR, Bernstein CN, Brant SR, et al. Toward an integrated clinical, molecular and serological classification of inflammatory bowel disease: report of a Working Party of the 2005 Montreal World Congress of Gastroenterology. Can J Gastroenterol [Internet]. 2005;19 Suppl A:5A – 36A. Available from: http://www.ncbi.nlm.nih.gov/pubmed/16151544
12. Dias CC, Rodrigues PP, Coelho R, Moura-Santos P, Fernandes S, Caetano C, et al. Development and validatio of risk matrices for Crohn’s disease outcomes in patientes submitted to early therapeutic interventions. 2016.
13. Magro F, Dias CC, Coelho R, Moura-Santos P, Fernandes S, Caetano C, et al. The impact or early surgery and immunosuppression on Crohn’s disease disabling outcomes. 2016.
14. Frolkis AD, Dykeman J, Negrón ME, Debruyn J, Jette N, Fiest KM, et al. Risk of surgery for inflammatory bowel diseases has decreased over time: a systematic review and meta-analysis of population-based studies. Gastroenterology [Internet]. 2013 Nov;145(5):996–1006. Available from: http://www.ncbi.nlm.nih.gov/pubmed/23896172
15. Frolkis AD, Lipton DS, Fiest KM, Negrón ME, Dykeman J, DeBruyn J, et al. Cumulative incidence of second intestinal resection in Crohn’s disease: a systematic review and meta-analysis of population-based studies. Am J Gastroenterol [Internet]. 2014;109(11):1739–48. Available from: http://www.ncbi.nlm.nih.gov/pubmed/25331349
16. Dias CC, Rodrigues PP, da Costa-Pereira A, Magro F. Clinical prognostic factors for disabling Crohn’s disease: A systematic review and meta-analysis. World J Gastroenterol [Internet]. 2013;19(24):3866–71. Available from: http://www.wjgnet.com/1007-9327/pdf/v19/i24/3866.pdf
17. Beaugerie L, Sokol H. Clinical, serological and genetic predictors of inflammatory bowel disease course. World J Gastroenterol [Internet]. 2012;18(29):3806–13. Available from: http://www.pubmedcentral.nih.gov/articlerender.fcgi?artid=3413051&tool=pmcentrez&rendertype=abstract
18. De Cruz P, Kamm MA, Hamilton AL, Ritchie KJ, Krejany EO, Gorelik A, et al. Crohn’s disease management after intestinal resection: a randomised trial. Lancet [Internet]. 2015;385(9976):1406–17. Available from: http://linkinghub.elsevier.com/retrieve/pii/S0140673614619085
6.2. THE RISK OF DISABLING, SURGERY AND REOPERATION IN CROHN’S DISEASE: ADECISION TREE-BASED APPROACH TO PROGNOSIS
99
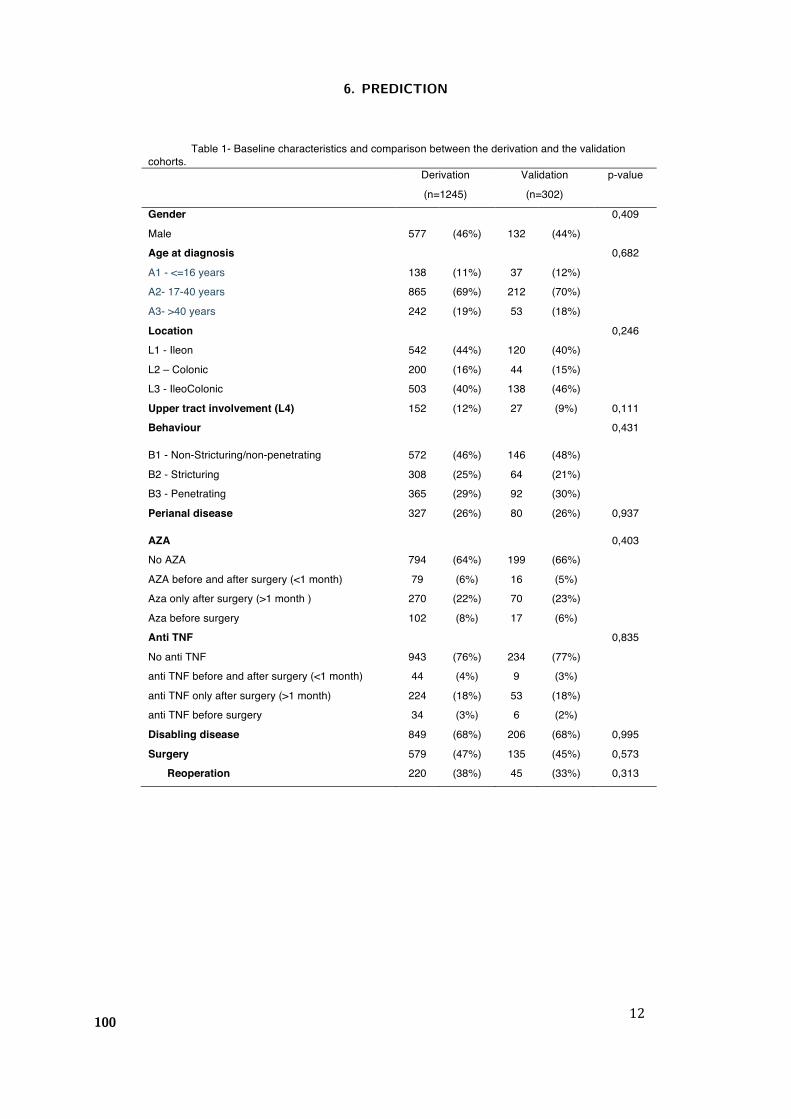
12
Table 1- Baseline characteristics and comparison between the derivation and the validation cohorts. Derivation
(n=1245) Validation (n=302)
p-value
Gender 0,409 Male 577 (46%) 132 (44%) Age at diagnosis 0,682 A1 - <=16 years 138 (11%) 37 (12%) A2- 17-40 years 865 (69%) 212 (70%) A3- >40 years 242 (19%) 53 (18%) Location 0,246 L1 - Ileon 542 (44%) 120 (40%) L2 – Colonic 200 (16%) 44 (15%) L3 - IleoColonic 503 (40%) 138 (46%) Upper tract involvement (L4) 152 (12%) 27 (9%) 0,111 Behaviour 0,431
B1 - Non-Stricturing/non-penetrating 572 (46%) 146 (48%) B2 - Stricturing 308 (25%) 64 (21%) B3 - Penetrating 365 (29%) 92 (30%) Perianal disease 327 (26%) 80 (26%) 0,937
AZA 0,403 No AZA 794 (64%) 199 (66%) AZA before and after surgery (<1 month) 79 (6%) 16 (5%) Aza only after surgery (>1 month ) 270 (22%) 70 (23%) Aza before surgery 102 (8%) 17 (6%) Anti TNF 0,835 No anti TNF 943 (76%) 234 (77%) anti TNF before and after surgery (<1 month) 44 (4%) 9 (3%) anti TNF only after surgery (>1 month) 224 (18%) 53 (18%) anti TNF before surgery 34 (3%) 6 (2%) Disabling disease 849 (68%) 206 (68%) 0,995 Surgery 579 (47%) 135 (45%) 0,573
Reoperation 220 (38%) 45 (33%) 0,313
6. PREDICTION
100
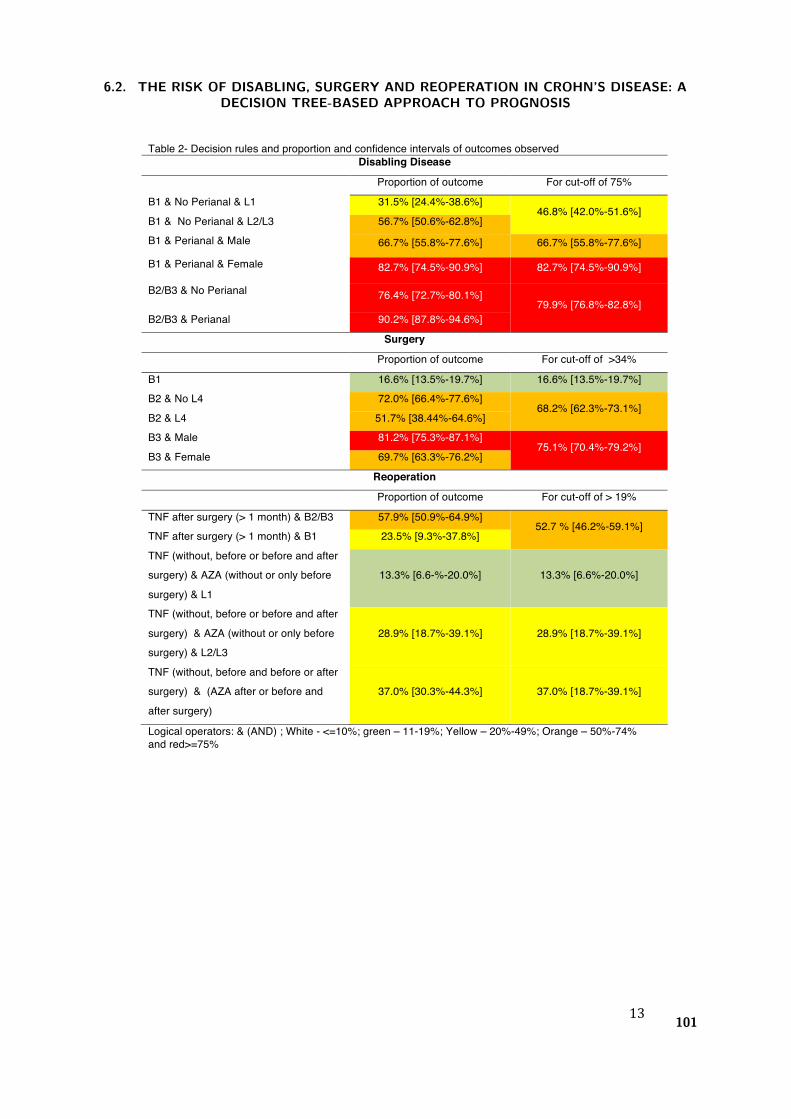
13
Table 2- Decision rules and proportion and confidence intervals of outcomes observed Disabling Disease
Proportion of outcome For cut-off of 75%
B1 & No Perianal & L1 31.5% [24.4%-38.6%] 46.8% [42.0%-51.6%]
B1 & No Perianal & L2/L3 56.7% [50.6%-62.8%] B1 & Perianal & Male 66.7% [55.8%-77.6%] 66.7% [55.8%-77.6%]
B1 & Perianal & Female 82.7% [74.5%-90.9%] 82.7% [74.5%-90.9%]
B2/B3 & No Perianal 76.4% [72.7%-80.1%] 79.9% [76.8%-82.8%]
B2/B3 & Perianal 90.2% [87.8%-94.6%]
Surgery
Proportion of outcome For cut-off of >34%
B1 16.6% [13.5%-19.7%] 16.6% [13.5%-19.7%] B2 & No L4 72.0% [66.4%-77.6%]
68.2% [62.3%-73.1%] B2 & L4 51.7% [38.44%-64.6%] B3 & Male 81.2% [75.3%-87.1%]
75.1% [70.4%-79.2%] B3 & Female 69.7% [63.3%-76.2%]
Reoperation
Proportion of outcome For cut-off of > 19%
TNF after surgery (> 1 month) & B2/B3 57.9% [50.9%-64.9%] 52.7 % [46.2%-59.1%]
TNF after surgery (> 1 month) & B1 23.5% [9.3%-37.8%] TNF (without, before or before and after surgery) & AZA (without or only before surgery) & L1
13.3% [6.6-%-20.0%] 13.3% [6.6%-20.0%]
TNF (without, before or before and after surgery) & AZA (without or only before surgery) & L2/L3
28.9% [18.7%-39.1%] 28.9% [18.7%-39.1%]
TNF (without, before and before or after surgery) & (AZA after or before and after surgery)
37.0% [30.3%-44.3%] 37.0% [18.7%-39.1%]
Logical operators: & (AND) ; White - <=10%; green – 11-19%; Yellow – 20%-49%; Orange – 50%-74% and red>=75%
6.2. THE RISK OF DISABLING, SURGERY AND REOPERATION IN CROHN’S DISEASE: ADECISION TREE-BASED APPROACH TO PROGNOSIS
101
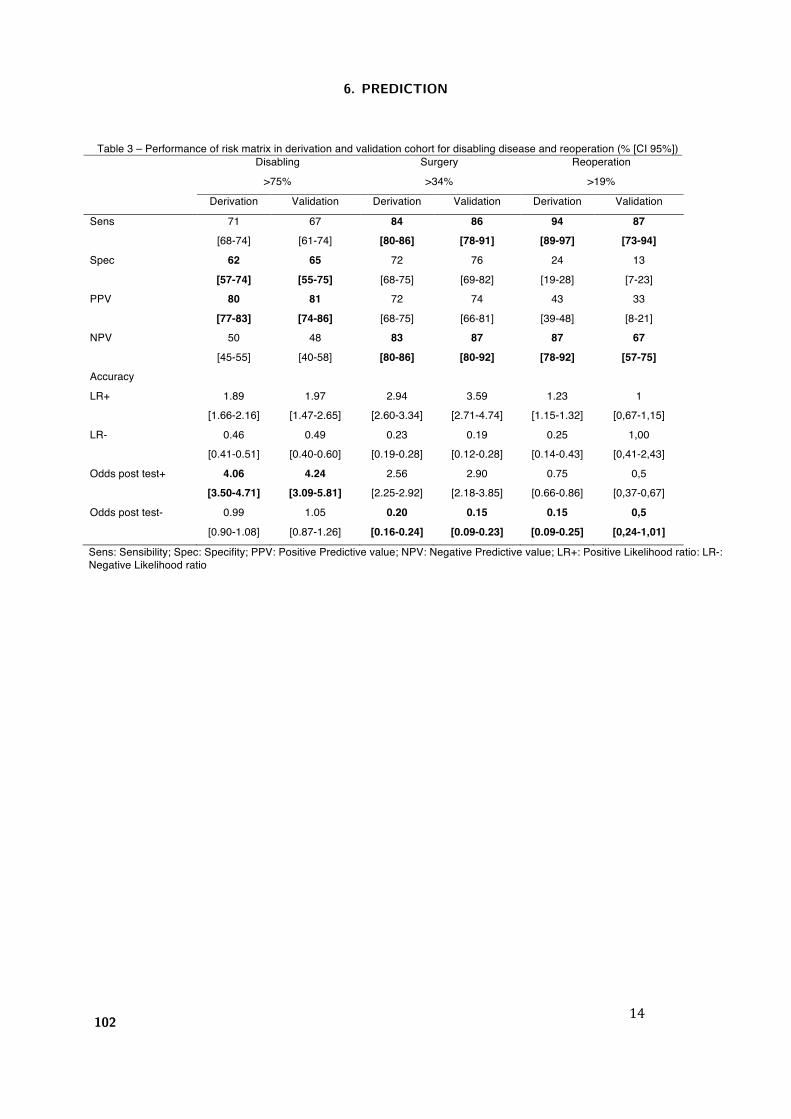
14
Table 3 – Performance of risk matrix in derivation and validation cohort for disabling disease and reoperation (% [CI 95%]) Disabling
>75% Surgery >34%
Reoperation >19%
Derivation Validation Derivation Validation Derivation Validation
Sens 71 [68-74]
67 [61-74]
84 [80-86]
86 [78-91]
94 [89-97]
87 [73-94]
Spec 62 [57-74]
65 [55-75]
72 [68-75]
76 [69-82]
24 [19-28]
13 [7-23]
PPV 80 [77-83]
81 [74-86]
72 [68-75]
74 [66-81]
43 [39-48]
33 [8-21]
NPV 50 [45-55]
48 [40-58]
83 [80-86]
87 [80-92]
87 [78-92]
67 [57-75]
Accuracy LR+ 1.89
[1.66-2.16] 1.97
[1.47-2.65] 2.94
[2.60-3.34] 3.59
[2.71-4.74] 1.23
[1.15-1.32] 1
[0,67-1,15] LR- 0.46
[0.41-0.51] 0.49
[0.40-0.60] 0.23
[0.19-0.28] 0.19
[0.12-0.28] 0.25
[0.14-0.43] 1,00
[0,41-2,43] Odds post test+ 4.06
[3.50-4.71] 4.24
[3.09-5.81] 2.56
[2.25-2.92] 2.90
[2.18-3.85] 0.75
[0.66-0.86] 0,5
[0,37-0,67] Odds post test- 0.99
[0.90-1.08] 1.05
[0.87-1.26] 0.20
[0.16-0.24] 0.15
[0.09-0.23] 0.15
[0.09-0.25] 0,5
[0,24-1,01]
Sens: Sensibility; Spec: Specifity; PPV: Positive Predictive value; NPV: Negative Predictive value; LR+: Positive Likelihood ratio: LR-: Negative Likelihood ratio
6. PREDICTION
102
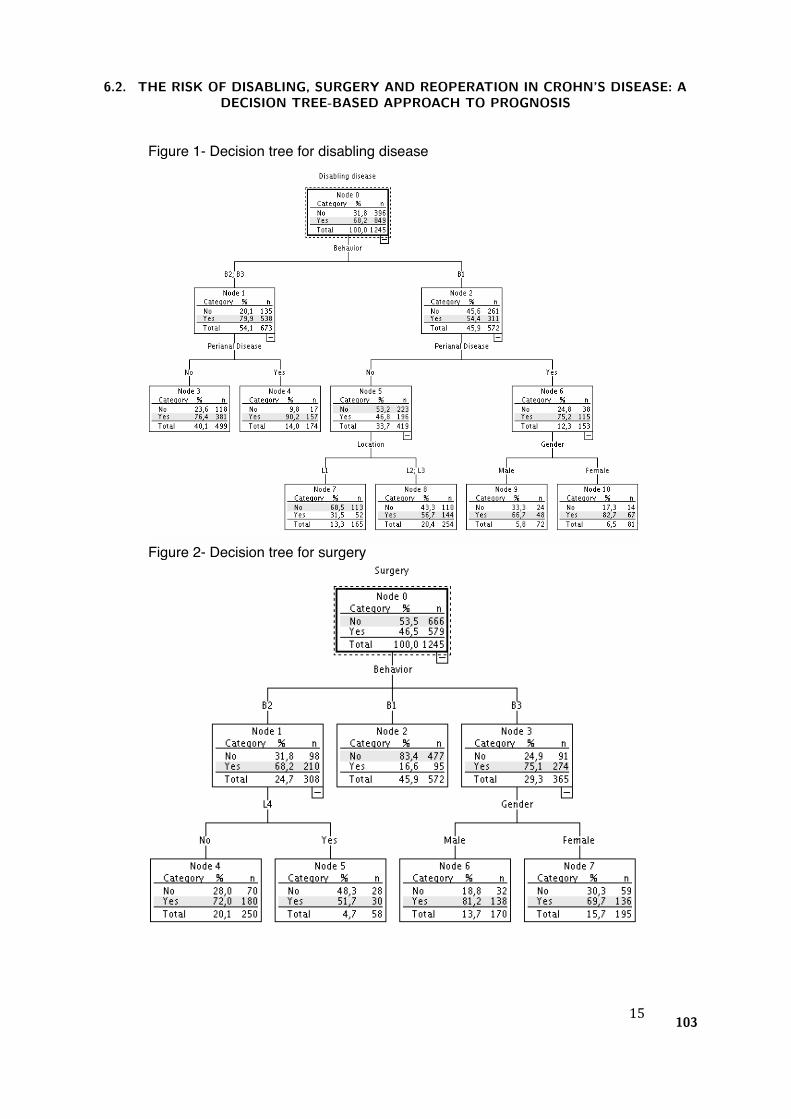
15
Figure 1- Decision tree for disabling disease
Figure 2- Decision tree for surgery
6.2. THE RISK OF DISABLING, SURGERY AND REOPERATION IN CROHN’S DISEASE: ADECISION TREE-BASED APPROACH TO PROGNOSIS
103
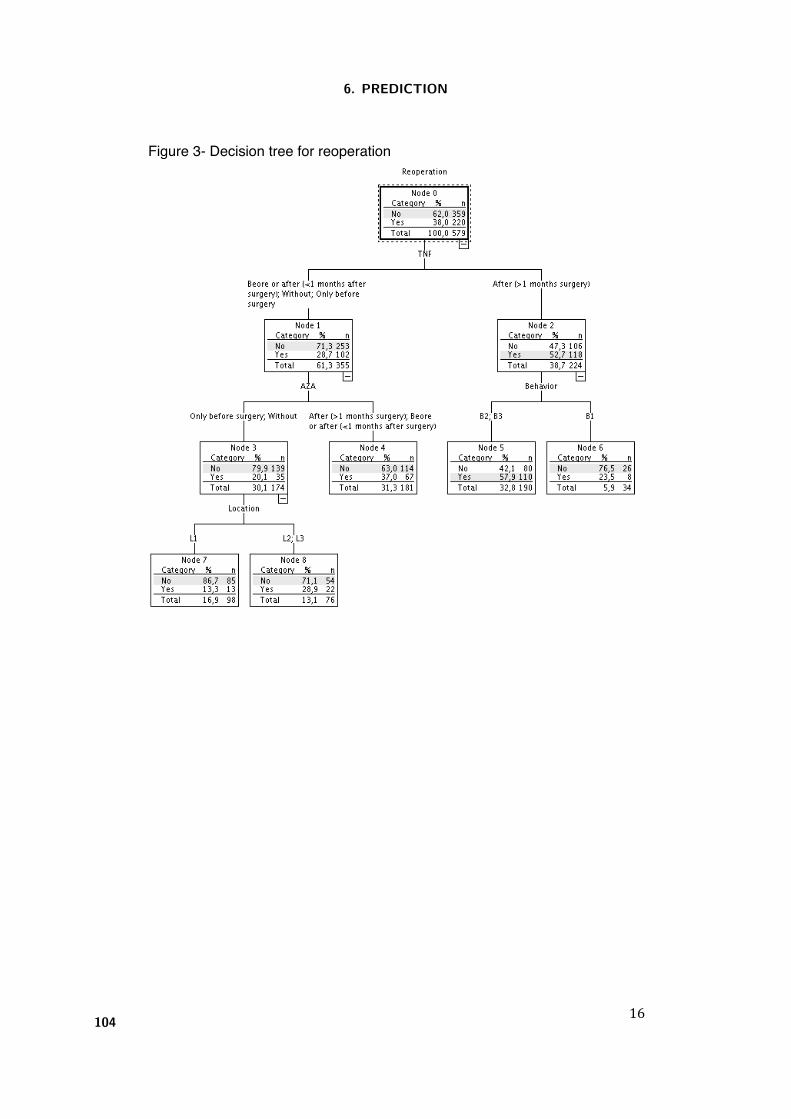
16
Figure 3- Decision tree for reoperation
6. PREDICTION
104
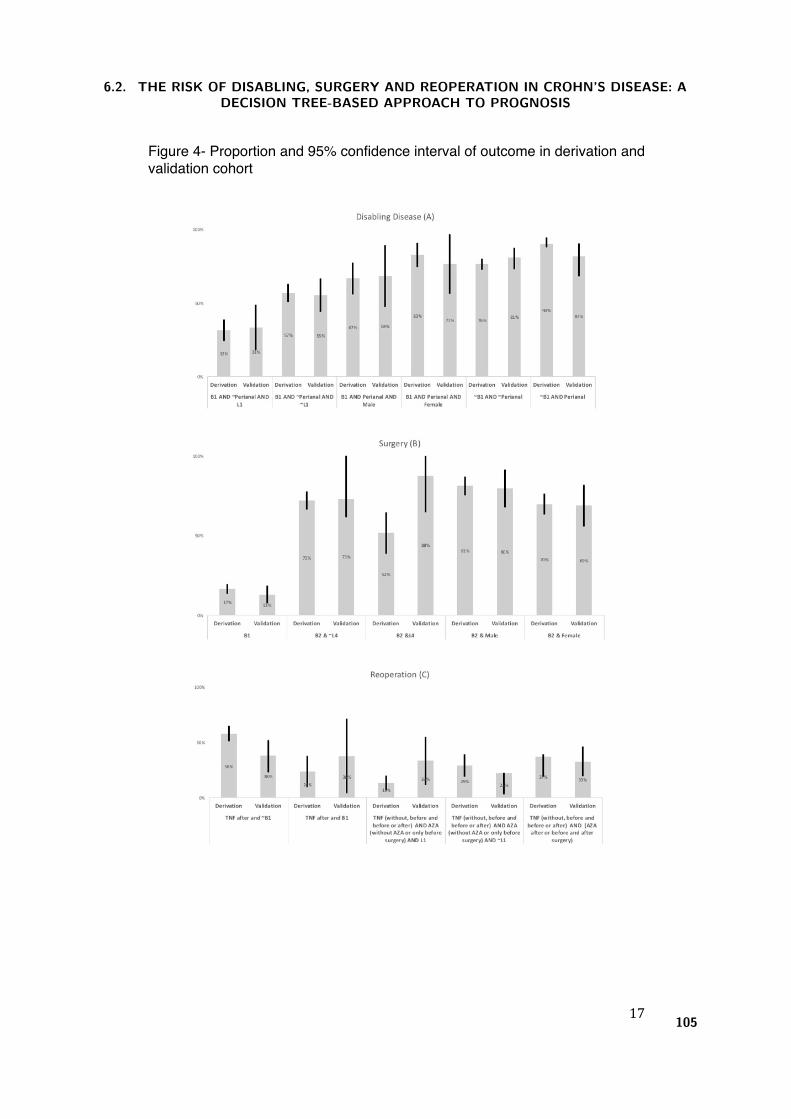
17
Figure 4- Proportion and 95% confidence interval of outcome in derivation and validation cohort
6.2. THE RISK OF DISABLING, SURGERY AND REOPERATION IN CROHN’S DISEASE: ADECISION TREE-BASED APPROACH TO PROGNOSIS
105
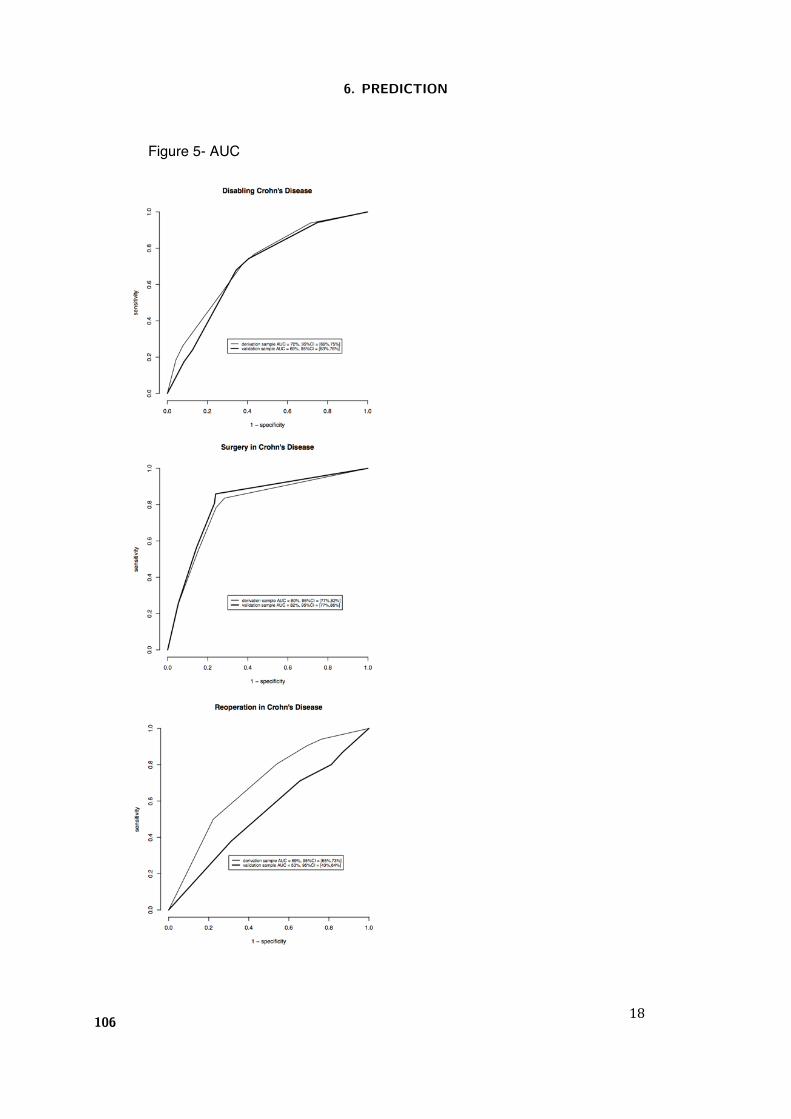
18
Figure 5- AUC
6. PREDICTION
106
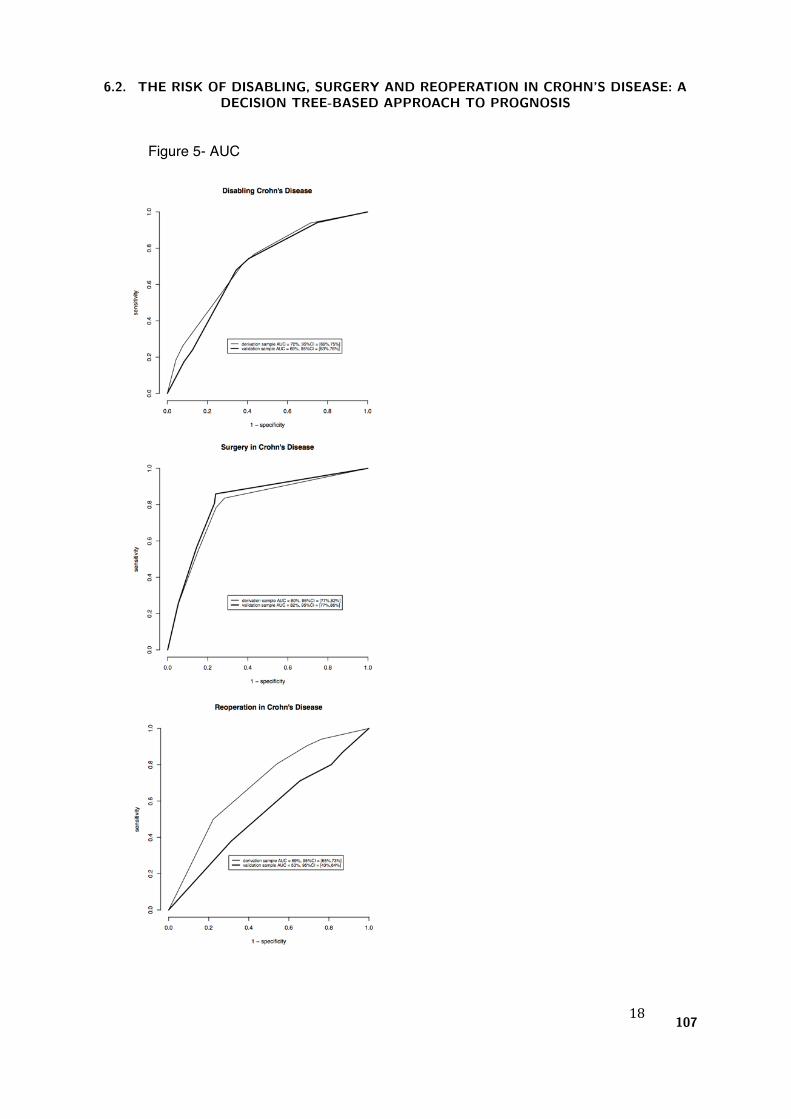
18
Figure 5- AUC
6.2. THE RISK OF DISABLING, SURGERY AND REOPERATION IN CROHN’S DISEASE: ADECISION TREE-BASED APPROACH TO PROGNOSIS
107

6. PREDICTION
108

7. Discussion and recommendations

7. Discussion and recommendations
Being a chronic disease, and with non-curative therapeutic approaches, the prognosis of inflammatory
bowel disease has a huge importance for both the patients and the clinicians. Given this, it is important to
develop models which can predict the major outcomes with only few factors and as soon as possible. One of
the most important groups of factors are clinical and demographical because they are easy to collect and do not
depended on external methods, such as genetic or serologic ones. In recent years, different disease outcomes
have been studied, namely disabling disease and reoperation for Crohns disease and colectomy for ulcerative
colitis, and different factors were identified to be related with those outcomes. In this thesis, two systematic
reviews with meta-analysis were developed to identify outcomes, and clinical and demographical factors which
can predict those outcomes. In ulcerative colitis, the major event that may significantly affect the patients in
terms of quality of life and mortality is colectomy [Baumgart and Sandborn, 2007]. The probability of having
an abdominal surgery in these patients is around 25% in the first 10 years of the disease but half of them occur
in the first year after diagnosis and colectomy rate is around 10%. Factors such as gender, smoking habits,
disease extent, need for corticosteroids and hospitalization are all associated with colectomy [Dias et al., 2015].
7.1 Disabling disease
In Crohns disease, disabling disease was studied and factors such as age at diagnosis, perianal disease, location
and initial use of steroids were isolated as independent prognostic factors [Dias et al., 2013]. However, the
concept of disabling disease, introduced by Beaugerie et al.[Beaugerie et al., 2006] in 2006, is not consensual;
in fact, disabling is a dynamic concept, which necessarily changes with the evolution of medical techniques and
the different strategies followed to achieve disease control. Beaugerie et al.´s definition is the presence of at
least one of the following criteria: two steroid courses required and/or steroid dependency; further hospitalisa-
tion after diagnosis or complications of the disease; chronic symptoms; immunosuppressive therapy; intestinal
resection or surgical operation for perianal disease. This definition was used by Lolly et al. [Loly et al., 2008],
in 2008 but, in 2011, Yang et al. [Yang et al., 2011] presented a study of disabling disease with the definition
not including chronic symptoms. In our studies, we have chosen to use a stricter definition of global disabling
disease, defining precise criteria: abdominal surgery, hospital admissions, course of steroids/year, steroid de-
pendence or refractoriness, need to switch immunosuppressors or anti-TNF, and the appearance of new clinical
events (abscesses, fistula, anal disease, stenosis). This change was motivated by the new concept of early
starting immunosuppression, within a window of disease opportunity, instead of using it as the end of route.
From our original studies of independent cohorts of Crohn´s patients, some clinical/demographical factors,
as well as the impact of early approaches (surgery or immunosuppression), were identified as relevant for the
studied outcomes.
111
7. DISCUSSION AND RECOMMENDATIONS
The rate of disabling disease events were considerably high and did not differ between the two therapeutic
choices (surgery: 77%, or immunosuppression: 76%, p=0.770). Concerning the surgical group there were
no differences among patients with different immunosuppression starting points in the occurrence of disabling
disease (p=0.372). The same scenario was observed in the immunosuppression group with no difference in
the rate of disabling disease (p=0.487). When analysing the time to disabling disease adjusted to all variables
(gender, age at diagnosis, location, behaviour, upper tract involvement and perianal disease) there were also
no differences between the two groups (HR=0.963 [0.771-1.202]). This study shows that neither early surgery
nor early immunosuppression can prevent the occurrence of disabling events in CD patients.
When we studied only patients with a surgical intervention, disabling disease was observed in 75% of
the patients. Factors such as location (colonic disease: OR=2.615 [1.125-0.078]), upper tract involvement
(OR=2.593 [1.125-6.078]) and a longer time elapsed from diagnosis to first surgery (13-36 months: OR=2.754
[1.538-4.934] and 36 months: OR=2.114 [1.318-3.235] presented a higher risk of disabling disease. Overall,
the timing of therapeutic strategies affects the CD outcomes and an early surgery (within six months after
diagnosis) can decrease the occurrence of disabling events.
Different prognostic models for disabling disease were derived using only clinical/demographical data. In
the first one, Bayesian networks were used, achieving an AUC of 78% for the prognosis of disabling disease.
Age at diagnosis, perianal disease, behavior and early therapeutic decision were found to be significant factors
and used to create user-friendly matrices depicting the probability of having disabling disease, exhibiting good
rule-in performance for the most important criteria: positive post-test odds=8.00 [2.72-23.44]. This value
gives us improved safety in applying the matrices, since the odds of having disabling disease, having a positive
test, are extremely high. A second model was developed, inducing a decision tree from the cohort data. The
induced decision tree resulted in a three-level model of variables: first level included behavior phenotype, a
two-way split with the risk of disabling for B1 (54%) apart from that of B2 and B3 phenotypes (80%); the
second level considered the existence of perianal disease; location and gender were then included at the third
level. Overall, patients with phenotypes B2 or B3 have a higher risk of disabling disease, while for pheno-
type B1, gender plays an important role, with female patients having a higher risk than males. Again this
model exhibited good rule-in performance, with positive post-test odds of 4.24 [3.09-5.81]. The variables
chosen by both methods were the same used in previous studies, showing the robustness of these algorithms
[Beaugerie et al., 2006, Loly et al., 2008, Yang et al., 2011] and with good performance in the validation co-
horts.
7.2 Surgery and Reoperation
Surgery has also an important impact in patients quality of life. Fifty percent of patients undergo surgery in
the initial 10 years after diagnosis of CD [Carter et al., 2004, Peyrin-Biroulet et al., 2010], whereas a total of
80% is estimated to need surgery during the course of the disease [Moss, , Cosnes et al., 2002]. An induced
decision tree, computed with all variables, resulted in a two-level model of variables: the first one included
behavior phenotype, with different risk levels for B1 (16%), B2 (68%) and B3 (75%); the second level included
information on upper track involvement (L4) and gender, i e, patients with a B3 phenotype have a higher risk
of surgery than those with a B1 behavior, and this risk is further aggravated in male B3 patients. This model
112
7.3. RECOMENDATION
exhibited good rule-out performance, with negative post-test odds for surgery of 0.15 [0.09-0.23], i.e. when
the model predicts the absence of need for surgery, the odds of actually needing it are very low.
Recurrence, including reoperation, is also extremely frequent and affects 40% to 80% of CD patients
[Bernell et al., 2000, Olaison et al., 1992]. Some clinical/demographical factors, as well as the impact of early
approaches (surgery or immunosuppression), were identified and evaluated.
Concerning the impact of early approaches, our results show differences between surgery and immunosup-
pression approaches, and also relevant is the different time point at which the patients start immunosuppression
therapy. When we studied only patients with the first abdominal surgery after diagnosis, the achieved rate
of reoperation of 33% was the same as the value presented in a recent meta-analysis [Frolkis et al., 2014]
for the 10-years risk of reoperation. Multiple risk factors patient-related, disease-related and surgery-related
have already been identified and used to predict this outcome, but the literature is not consensual on this
issue [Vaughn, 2014]. In our study, some risk factors were identified, namely age at diagnosis, disease pheno-
type, perianal disease and the introduction of pharmacological medication. A few studies have been published
associating the introduction of medical therapeutics, namely immunosuppression, with reoperation. Immuno-
suppression was considered to be relevant in the CD management particularly when introduced before or after
surgery as a prophylactic therapy [Vaughn, 2014]. Our study was not entirely conclusive in this regard, but
highlighted the increased risk for patients beginning medical therapeutics only one month after surgery.
Different prognostic models for reoperation were also derived using only clinical/demographical data. In
the first one (using Bayesian networks) achieved an AUC of 86% for the prognosis of reoperation. Age at
diagnosis, perianal disease, behavior and early therapeutic decision were found to be significant factors and
used to create user-friendly matrices depicting the probability of needing reoperation, exhibiting good rule-out
performance for the most important criteria: negative post-test odds=0.02 [0.00-0.11]. This value gives us
improved safety in applying the matrices, since the odds of needing reoperation, having a negative test, are
extremely low. A second model was developed, also inducing a decision tree from the cohort data. The induced
decision tree, computed with all variables plus therapeutics used during the disease, resulted in a three-level
model of variables: first one included the moment of anti-TNF therapeutics, singling out those with more
than 1 month after surgery (53% risk) from the remaining (29% risk); the second level included behavior
(stratified in B1 vs B2/B3) and immunosuppression therapeutics, discriminating between those without or
only before surgery, and the remaining; the third level considered disease location (L1 vs L2/L3). Overall,
patients with a later introduction of pharmacological intervention (1 month after initial surgery) had a worse
outcome, i.e, they have a higher probability of undergoing more than one surgery during the disease course.
However, reoperation stood out as a harder outcome to predict, perhaps signalling a need for other factors
to be included in the model, although negative post-test odds of 0.5 [0.24-1.01] suggests the model might
nonetheless be useful to rule out patients.
7.3 Recomendation
Overall, clinical and demographical factors should be used more frequently in the prognosis of IBD because
they are easier to collect than serologic or genetic ones. Factors such as age at diagnosis, behavior, perianal
disease, and location are important predictors for negative outcomes and should, as soon as possible, be known.
113

7. DISCUSSION AND RECOMMENDATIONS
Concerning interventions, immunosuppression, as the first therapy after diagnosis, is effective in preventing
future surgeries, being its efficiency higher upon an early start. On the other hand, patients undergoing an early
surgery after diagnosis have an increased tendency to be re-operated, even with a concomitantly early start of
immunosuppression therapy. Given this, predictive models for CD prognosis could enhance the initial approach
and, therefore, improve the clinical outcome. Likewise, models for ulcerative colitis must be developed using
the same strategies and data. Finally, software or paper tools that could bring such models into bedside
application are welcome and should be pursued, while cost-effectiveness studies should be run to evaluate the
impact of such models/tools in clinical practice and in the prevention of new cases with negative prognosis.
114
Bibliography
[Azevedo et al., 2010] Azevedo, L. F., Magro, F., Portela, F., Lago, P., Deus, J., Cotter, J., Cremers, I.,
Vieira, A., Peixe, P., Caldeira, P., Lopes, H., Goncalves, R., Reis, J., Cravo, M., Barros, L., Ministro,
P., Lurdes, M., Duarte, A., Campos, M., Carvalho, L., and Costa-Pereira, A. (2010).
Estimating the prevalence of inflammatory bowel disease in Portugal using a pharmaco-epidemiological
approach.
Pharmacoepidemiology and drug safety, 19(5):499–510.
[Baumgart and Sandborn, 2007] Baumgart, D. C. and Sandborn, W. J. (2007).
Inflammatory bowel disease: clinical aspects and established and evolving therapies.
[Beaugerie et al., 2006] Beaugerie, L., Seksik, P., Nion-Larmurier, I., Gendre, J.-P., and Cosnes, J. (2006).
Predictors of Crohn’s disease.
Gastroenterology, 130(3):650–6.
[Bernell et al., 2000] Bernell, O., Lapidus, A., and Hellers, G. (2000).
Risk factors for surgery and recurrence in 907 patients with primary ileocaecal Crohn’s disease.
The British journal of surgery, 87(12):1697–701.
[Breiman et al., 1984] Breiman, L., Friedman, J., Olshen, R., and Stone, C. (1984).
Classification and Regression Tree.
[Burisch et al., 2014] Burisch, J., Pedersen, N., Cukovic-Cavka, S., Brinar, M., Kaimakliotis, I., Duricova,
D., Shonova, O., Vind, I., Avnstrøm, S., Thorsgaard, N., Andersen, V., Krabbe, S., Dahlerup, J. F.,
Salupere, R., Nielsen, K. R., Olsen, J., Manninen, P., Collin, P., Tsianos, E. V., Katsanos, K. H.,
Ladefoged, K., Lakatos, L., Bjornsson, E., Ragnarsson, G., Bailey, Y., Odes, S., Schwartz, D., Martinato,
M., Lupinacci, G., Milla, M., De Padova, A., D’Inca, R., Beltrami, M., Kupcinskas, L., Kiudelis, G.,
Turcan, S., Tighineanu, O., Mihu, I., Magro, F., Barros, L. F., Goldis, A., Lazar, D., Belousova,
E., Nikulina, I., Hernandez, V., Martinez-Ares, D., Almer, S., Zhulina, Y., Halfvarson, J., Arebi, N.,
Sebastian, S., Lakatos, P. L., Langholz, E., Munkholm, P., and EpiCom-group (2014).
East-West gradient in the incidence of inflammatory bowel disease in Europe: the ECCO-EpiCom inception
cohort.
Gut, 63(4):588–97.
[Campbel, 2001] Campbel, M. (2001).
Statistics at Square Two: Understanding Modern Statistical Applications in Medicine .
BMJ Books, London.
[Carter et al., 2004] Carter, M. J., Lobo, A. J., Travis, S. P. L., and IBD Section, B. S. o. G. (2004).
Guidelines for the management of inflammatory bowel disease in adults.
Gut, 53 Suppl 5:V1–16.
115
BIBLIOGRAPHY
[Cosnes, 2009] Cosnes, J. (2009).
Can we modulate the clinical course of inflammatory bowel diseases by our current treatment strategies?
Digestive diseases (Basel, Switzerland), 27(4):516–21.
[Cosnes et al., 2002] Cosnes, J., Cattan, S., Blain, A., Beaugerie, L., Carbonnel, F., Parc, R., and Gendre,
J.-P. (2002).
Long-term evolution of disease behavior of Crohn’s disease.
Inflammatory bowel diseases, 8(4):244–50.
[Cosnes et al., 2011] Cosnes, J., Gower-Rousseau, C., Seksik, P., and Cortot, A. (2011).
Epidemiology and natural history of inflammatory bowel diseases.
Gastroenterology, 140(6):1785–94.
[Darwiche, 2010] Darwiche, A. (2010).
Bayesian Networks.
Communications of the ACM, 53(12):80–90.
[Devlin and Panaccione, 2010] Devlin, S. M. and Panaccione, R. (2010).
Evolving Inflammatory Bowel Disease Treatment Paradigms: Top-Down Versus Step-Up.
[Dias et al., 2014] Dias, C. C., Granja, C., Costa-Pereira, A., Gama, J., and Rodrigues, P. P. (2014).
Using Probabilistic Graphical Models to Enhance the Prognosis of Health-Related Quality of Life in Adult
Survivors of Critical Illness,.
2014 IEEE 27th International Symposium on Computer-Based Medical Systems, pages 56–61.
[Dias et al., 2013] Dias, C. C., Rodrigues, P. P., da Costa-Pereira, A., and Magro, F. (2013).
Clinical prognostic factors for disabling Crohn’s disease: A systematic review and meta-analysis.
World Journal of Gastroenterology, 19(24):3866–3871.
[Dias et al., 2015] Dias, C. C., Rodrigues, P. P. P., da Costa-Pereira, A., and Magro, F. (2015).
Clinical predictors of colectomy in patients with ulcerative colitis: systematic review and meta-analysis of
cohort studies.
Journal of Crohn’s & colitis, 9(2):156–163.
[Dignass et al., 2012] Dignass, A., Lindsay, J. O., Sturm, A., Windsor, A., Colombel, J.-F., Allez, M., D’Haens,
G., D’Hoore, A., Mantzaris, G., Novacek, G., Oresland, T., Reinisch, W., Sans, M., Stange, E., Vermeire,
S., Travis, S., and Van Assche, G. (2012).
Second European evidence-based consensus on the diagnosis and management of ulcerative colitis part 2:
current management.
Journal of Crohn’s & colitis, 6(10):991–1030.
[Dignass et al., 2010] Dignass, A., Van Assche, G., Lindsay, J. O., Lemann, M., Soderholm, J., Colombel,
J. F., Danese, S., D’Hoore, A., Gassull, M., Gomollon, F., Hommes, D. W., Michetti, P., O’Morain, C.,
Oresland, T., Windsor, A., Stange, E. F., Travis, S. P. L., and European Crohn’s and Colitis Organisation
(ECCO) (2010).
The second European evidence-based Consensus on the diagnosis and management of Crohn’s disease:
Current management.
Journal of Crohn’s & colitis, 4(1):28–62.
[Domingos and Pazzani, 1997] Domingos, P. and Pazzani, M. (1997).
On the Optimality of the Simple Bayesian Classifier under Zero-One Loss.
Machine Learning, 29:103–130.
116
BIBLIOGRAPHY
[Fauci et al., 2009] Fauci, A., Braunwald, E., Kasper, D., Hauser, S., Longo, D., Jameson, J., and Loscalso,
J. (2009).
Harrison’s Principles of Internal Medicine.
McGraw-Hill, 17th editi edition.
[Friedman et al., 1997] Friedman, N., Geiger, D., and Goldszmidt, M. (1997).
Bayesian Network Classifiers.
Machine Learning, 29:131–163.
[Frolkis et al., 2014] Frolkis, A. D., Lipton, D. S., Fiest, K. M., Negron, M. E., Dykeman, J., DeBruyn, J.,
Jette, N., Frolkis, T., Rezaie, A., Seow, C. H., Panaccione, R., Ghosh, S., and Kaplan, G. G. (2014).
Cumulative incidence of second intestinal resection in Crohn’s disease: a systematic review and meta-analysis
of population-based studies.
The American journal of gastroenterology, 109(11):1739–48.
[Gama et al., 2012] Gama, J., Carvalo, A., Faceli, K., Lorena, A. C., and Oliveira, M. (2012).
Extracao de Conhecimento de Dados - Data Mining.
Edcoes Sılabo, Lda.
[Hastie et al., 2001] Hastie, T., Tibshirani, R., and Friedman, J. (2001).
The Elements of Statistic Learinig.
Springer.
[Huang et al., 2002] Huang, K., King, I., and Lyu, M. (2002).
Constructing a large node Chow-liu tree based on frequent itemsets.
Proceedings of the 9th International Conference on Neural Information Processing , pages 498–502.
[Kass, 1980] Kass, G. V. (1980).
An Exploratory Technique for Investigating Large Quantities of Categorical Data.
Applied Statistics, 29(2):119–127.
[Latella et al., 2009] Latella, G., Cocco, A., Angelucci, E., Viscido, A., Bacci, S., Necozione, S., and Caprilli,
R. (2009).
Clinical course of Crohn’s disease first diagnosed at surgery for acute abdomen.
Digestive and liver disease : official journal of the Italian Society of Gastroenterology and the Italian
Association for the Study of the Liver, 41(4):269–76.
[Loly et al., 2008] Loly, C., Belaiche, J., and Louis, E. (2008).
Predictors of severe Crohn’s disease.
Scandinavian journal of gastroenterology, 43(8):948–54.
[Louis et al., 2010] Louis, E., Belaiche, J., and Reenaers, C. (2010).
Do clinical factors help to predict disease course in inflammatory bowel disease?
World journal of gastroenterology, 16(21):2600–3.
[Lucas, 2004] Lucas, P. (2004).
Bayesian analysis, pattern analysis, and data mining in health care.
Current opinion in critical care, 10(5):399–403.
[Lucas et al., 2004] Lucas, P. J. F., Van Der Gaag, L. C., and Abu-Hanna, A. (2004).
Bayesian networks in biomedicine and health-care.
Artificial Intelligence in Medicine, 30(3):201–214.
117
BIBLIOGRAPHY
[Magro et al., 2009] Magro, F., Portela, F., Lago, P., de Deus, J. R., Vieira, A., Peixe, P., Cremers, I., Cotter,
J., Cravo, M., Tavares, L., Reis, J., Goncalves, R., Lopes, H., Caldeira, P., Ministro, P., Carvalho, L.,
Azevedo, L., and Da Costa-Pereira, A. (2009).
Crohns disease in a southern European country: Montreal classification and clinical activity.
Inflammatory Bowel Diseases, 15(9):1343–1350.
[Mitchell, 1997] Mitchell, T. (1997).
Machine Learning.
McGraw-Hill.
[Moss, ] Moss, A. C.
Prevention of postoperative recurrence of Crohn’s disease: what does the evidence support?
Inflammatory bowel diseases, 19(4):856–9.
[Musen et al., 2006] Musen, M., Shahar, Y., and Shortliffe, E. (2006).
Clinical Decision Support Systems.
In Biomedical Informatics, Health Informatics, chapter 20, pages 698–736. Springer Verlag, New York, NY.
[Olaison et al., 1992] Olaison, G., Smedh, K., and Sjodahl, R. (1992).
Natural course of Crohn’s disease after ileocolic resection: endoscopically visualised ileal ulcers preceding
symptoms.
Gut, 33(3):331–5.
[Petrie and Sabin, 2009] Petrie, A. and Sabin, C. (2009).
Medical Statistics at a Glance.
Wiley-Blackwell.
[Peyrin-Biroulet et al., 2010] Peyrin-Biroulet, L., Loftus, E. V., Colombel, J.-F., and Sandborn, W. J. (2010).
The natural history of adult Crohn’s disease in population-based cohorts.
The American journal of gastroenterology, 105(2):289–97.
[Portela et al., 2010] Portela, F., Magro, F., Lago, P., Cotter, J., Cremers, I., de Deus, J., Vieira, A., Lopes,
H., Caldeira, P., Barros, L., Reis, J., Carvalho, L., Goncalves, R., Campos, M. J., Ministro, P., Duarte,
M. A., Amil, J., Rodrigues, S., Azevedo, L., and Costa-Pereira, A. (2010).
Ulcerative colitis in a Southern European country: A national perspective.
Inflammatory Bowel Diseases, 16(5):822–829.
[Quinlan, 1986] Quinlan, R. (1986).
Induction of decision trees.
Machine Learning, 1(81):106.
[Rodrigues, 2016] Rodrigues, P. P. (2016).
Estimativas: da observacao ao conhecimeto biomedico.
[Sackett et al., 1996] Sackett, D. L., Rosenberg, W. M., Gray, J. A., Haynes, R. B., and Richardson, W. S.
(1996).
Evidence based medicine: what it is and what it isn’t.
BMJ (Clinical research ed.), 312(7023):71–2.
[Sakellaropoulos and Nikiforidis, 2000] Sakellaropoulos, G. and Nikiforidis, G. (2000).
Prognostic performance of two expert systems based on Bayesian belief networks.
Decision Support Systems, 27(4):431–442.
118
BIBLIOGRAPHY
[Satsangi et al., 2006] Satsangi, J., Silverberg, M. S., Vermeire, S., and Colombel, J.-F. (2006).
The Montreal classification of inflammatory bowel disease: controversies, consensus, and implications.
Gut, 55(6):749–53.
[Shivananda et al., 1996] Shivananda, S., Lennard-Jones, J., Logan, R., Fear, N., Price, A., Carpenter, L.,
and van Blankenstein, M. (1996).
Incidence of inflammatory bowel disease across Europe: is there a difference between north and south?
Results of the European Collaborative Study on Inflammatory Bowel Disease (EC-IBD).
Gut, 39(5):690–7.
[Tavarela Veloso, 1995] Tavarela Veloso, F. (1995).
IBD in the north of POrtugal.
In Monteiro, E. and Tavarela Veloso, F., editors, Inflammatory Bowel Disease - New insights into the
Mechanisms of INflammation and Chalenges in Diagnosis and Treatment , pages 3–8. Falk Symposium
76, Kluwer Academic Publishers.
[Tavarela Veloso and Carvalho, 1989] Tavarela Veloso, F. and Carvalho, J. (1989).
Inflammatpry bowel disease in the north of Portugal.
In Goebell, H., Peskar, B., and H, M., editors, Inflammatory Bowel Disease - basic search and clinical
implications, page 59.
[Teich et al., 2005] Teich, J. M., Osheroff, J. A., Pifer, E. A., Sittig, D. F., Jenders, R. A., and CDS Expert
Review Panel (2005).
Clinical decision support in electronic prescribing: recommendations and an action plan: report of the joint
clinical decision support workgroup.
Journal of the American Medical Informatics Association : JAMIA, 12(4):365–76.
[Van Assche et al., 2010] Van Assche, G., Vermeire, S., and Rutgeerts, P. (2010).
The potential for disease modification in Crohn’s disease.
Nature reviews. Gastroenterology & hepatology, 7(2):79–85.
[Vatn, 2009] Vatn, M. H. (2009).
Natural history and complications of IBD.
Current gastroenterology reports, 11(6):481–7.
[Vaughn, 2014] Vaughn, B. P. (2014).
Prevention of post-operative recurrence of Crohn’s disease.
World Journal of Gastroenterology, 20(5):1147.
[Vermeire et al., 2007] Vermeire, S., van Assche, G., and Rutgeerts, P. (2007).
Review article: Altering the natural history of Crohn’s disease–evidence for and against current therapies.
Alimentary pharmacology & therapeutics, 25(1):3–12.
[Wyatt and Liu, 2002] Wyatt, J. C. and Liu, J. L. Y. (2002).
Basic concepts in medical informatics.
Journal of epidemiology and community health, 56(11):808–12.
[Yang et al., 2011] Yang, C. H., Ding, J., Gao, Y., Chen, X., Yang, Z. B., and Xiao, S. D. (2011).
Risk factors that predict the requirement of aggressive therapy among Chinese patients with Crohn’s disease.
Journal of digestive diseases, 12(2):99–104.
119


A. Preliminary study for a Bayesian net

A. Preliminary study for a Bayesian net
A.1 Preliminary study for a Bayesian network prognostic model for
Crohn´s disease.
Proceedings of 2015 IEEE 28th International Symposium on Computer-Based Medical Systems
141-144, 2015
Claudia Camila Dias, Fernando Magro e Pedro Pereira Rodrigues
123
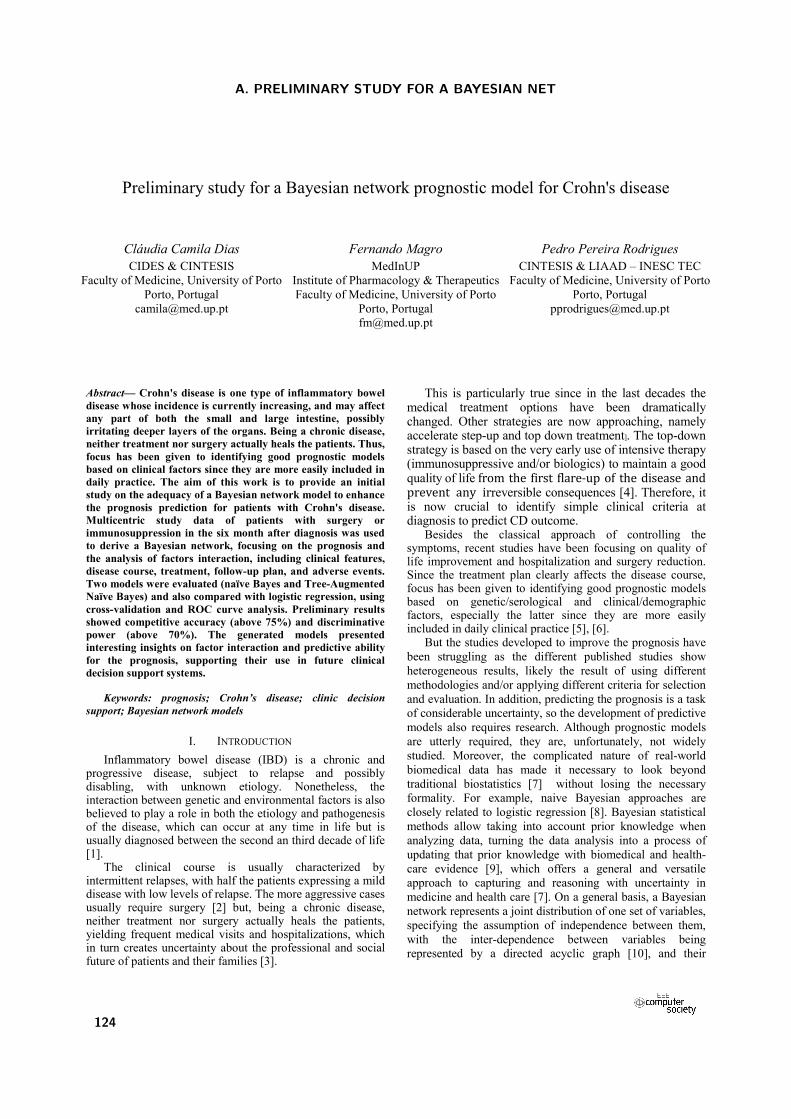
Preliminary study for a Bayesian network prognostic model for Crohn's disease
Cláudia Camila Dias CIDES & CINTESIS
Faculty of Medicine, University of Porto Porto, Portugal
Fernando Magro MedInUP
Institute of Pharmacology & Therapeutics Faculty of Medicine, University of Porto
Porto, Portugal [email protected]
Pedro Pereira Rodrigues CINTESIS & LIAAD – INESC TEC
Faculty of Medicine, University of Porto Porto, Portugal
Abstract— Crohn's disease is one type of inflammatory bowel disease whose incidence is currently increasing, and may affect any part of both the small and large intestine, possibly irritating deeper layers of the organs. Being a chronic disease, neither treatment nor surgery actually heals the patients. Thus, focus has been given to identifying good prognostic models based on clinical factors since they are more easily included in daily practice. The aim of this work is to provide an initial study on the adequacy of a Bayesian network model to enhance the prognosis prediction for patients with Crohn's disease. Multicentric study data of patients with surgery or immunosuppression in the six month after diagnosis was used to derive a Bayesian network, focusing on the prognosis and the analysis of factors interaction, including clinical features, disease course, treatment, follow-up plan, and adverse events. Two models were evaluated (naïve Bayes and Tree-Augmented Naïve Bayes) and also compared with logistic regression, using cross-validation and ROC curve analysis. Preliminary results showed competitive accuracy (above 75%) and discriminative power (above 70%). The generated models presented interesting insights on factor interaction and predictive ability for the prognosis, supporting their use in future clinical decision support systems.
Keywords: prognosis; Crohn’s disease; clinic decision support; Bayesian network models
I. INTRODUCTION Inflammatory bowel disease (IBD) is a chronic and
progressive disease, subject to relapse and possibly disabling, with unknown etiology. Nonetheless, the interaction between genetic and environmental factors is also believed to play a role in both the etiology and pathogenesis of the disease, which can occur at any time in life but is usually diagnosed between the second an third decade of life [1].
The clinical course is usually characterized by intermittent relapses, with half the patients expressing a mild disease with low levels of relapse. The more aggressive cases usually require surgery [2] but, being a chronic disease, neither treatment nor surgery actually heals the patients, yielding frequent medical visits and hospitalizations, which in turn creates uncertainty about the professional and social future of patients and their families [3].
This is particularly true since in the last decades the medical treatment options have been dramatically changed. Other strategies are now approaching, namely accelerate step-up and top down treatment]. The top-down strategy is based on the very early use of intensive therapy (immunosuppressive and/or biologics) to maintain a good quality of life from the first flare-up of the disease and prevent any irreversible consequences [4]. Therefore, it is now crucial to identify simple clinical criteria at diagnosis to predict CD outcome.
Besides the classical approach of controlling the symptoms, recent studies have been focusing on quality of life improvement and hospitalization and surgery reduction. Since the treatment plan clearly affects the disease course, focus has been given to identifying good prognostic models based on genetic/serological and clinical/demographic factors, especially the latter since they are more easily included in daily clinical practice [5], [6].
But the studies developed to improve the prognosis have been struggling as the different published studies show heterogeneous results, likely the result of using different methodologies and/or applying different criteria for selection and evaluation. In addition, predicting the prognosis is a task of considerable uncertainty, so the development of predictive models also requires research. Although prognostic models are utterly required, they are, unfortunately, not widely studied. Moreover, the complicated nature of real-world biomedical data has made it necessary to look beyond traditional biostatistics [7] without losing the necessary formality. For example, naive Bayesian approaches are closely related to logistic regression [8]. Bayesian statistical methods allow taking into account prior knowledge when analyzing data, turning the data analysis into a process of updating that prior knowledge with biomedical and health-care evidence [9], which offers a general and versatile approach to capturing and reasoning with uncertainty in medicine and health care [7]. On a general basis, a Bayesian network represents a joint distribution of one set of variables, specifying the assumption of independence between them, with the inter-dependence between variables being represented by a directed acyclic graph [10], and their
2015 IEEE 28th International Symposium on Computer-Based Medical Systems
2372-9198/15 $3.00 © 2015 IEEE
DOI 10.1109/CBMS.2015.40
141
A. PRELIMINARY STUDY FOR A BAYESIAN NET
124
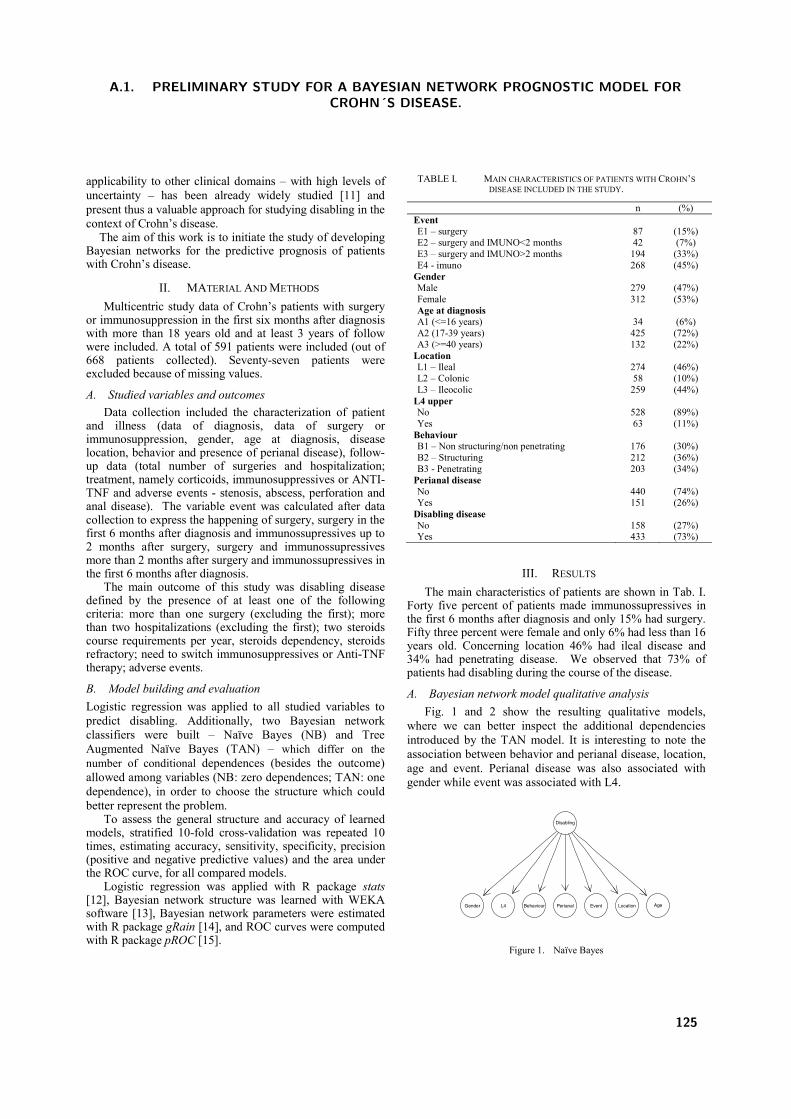
applicability to other clinical domains – with high levels of uncertainty – has been already widely studied [11] and present thus a valuable approach for studying disabling in the context of Crohn’s disease.
The aim of this work is to initiate the study of developing Bayesian networks for the predictive prognosis of patients with Crohn’s disease.
II. MATERIAL AND METHODS Multicentric study data of Crohn’s patients with surgery
or immunosuppression in the first six months after diagnosis with more than 18 years old and at least 3 years of follow were included. A total of 591 patients were included (out of 668 patients collected). Seventy-seven patients were excluded because of missing values.
A. Studied variables and outcomes Data collection included the characterization of patient
and illness (data of diagnosis, data of surgery or immunosuppression, gender, age at diagnosis, disease location, behavior and presence of perianal disease), follow-up data (total number of surgeries and hospitalization; treatment, namely corticoids, immunosuppressives or ANTI-TNF and adverse events - stenosis, abscess, perforation and anal disease). The variable event was calculated after data collection to express the happening of surgery, surgery in the first 6 months after diagnosis and immunossupressives up to 2 months after surgery, surgery and immunossupressives more than 2 months after surgery and immunossupressives in the first 6 months after diagnosis.
The main outcome of this study was disabling disease defined by the presence of at least one of the following criteria: more than one surgery (excluding the first); more than two hospitalizations (excluding the first); two steroids course requirements per year, steroids dependency, steroids refractory; need to switch immunosuppressives or Anti-TNF therapy; adverse events.
B. Model building and evaluation Logistic regression was applied to all studied variables to predict disabling. Additionally, two Bayesian network classifiers were built – Naïve Bayes (NB) and Tree Augmented Naïve Bayes (TAN) – which differ on the number of conditional dependences (besides the outcome) allowed among variables (NB: zero dependences; TAN: one dependence), in order to choose the structure which could better represent the problem.
To assess the general structure and accuracy of learned models, stratified 10-fold cross-validation was repeated 10 times, estimating accuracy, sensitivity, specificity, precision (positive and negative predictive values) and the area under the ROC curve, for all compared models.
Logistic regression was applied with R package stats [12], Bayesian network structure was learned with WEKA software [13], Bayesian network parameters were estimated with R package gRain [14], and ROC curves were computed with R package pROC [15].
TABLE I. MAIN CHARACTERISTICS OF PATIENTS WITH CROHN’S DISEASE INCLUDED IN THE STUDY.
n (%) Event E1 – surgery 87 (15%) E2 – surgery and IMUNO<2 months 42 (7%) E3 – surgery and IMUNO>2 months 194 (33%) E4 - imuno 268 (45%)
Gender Male 279 (47%) Female 312 (53%) Age at diagnosis A1 (<=16 years) 34 (6%) A2 (17-39 years) 425 (72%) A3 (>=40 years) 132 (22%)
Location L1 – Ileal 274 (46%) L2 – Colonic 58 (10%) L3 – Ileocolic 259 (44%)
L4 upper No 528 (89%) Yes 63 (11%)
Behaviour B1 – Non structuring/non penetrating 176 (30%) B2 – Structuring 212 (36%) B3 - Penetrating 203 (34%)
Perianal disease No 440 (74%) Yes 151 (26%)
Disabling disease No 158 (27%) Yes 433 (73%)
III. RESULTS The main characteristics of patients are shown in Tab. I.
Forty five percent of patients made immunossupressives in the first 6 months after diagnosis and only 15% had surgery. Fifty three percent were female and only 6% had less than 16 years old. Concerning location 46% had ileal disease and 34% had penetrating disease. We observed that 73% of patients had disabling during the course of the disease.
A. Bayesian network model qualitative analysis Fig. 1 and 2 show the resulting qualitative models,
where we can better inspect the additional dependencies introduced by the TAN model. It is interesting to note the association between behavior and perianal disease, location, age and event. Perianal disease was also associated with gender while event was associated with L4.
Disabling
Gender L4 Behaviour Perianal Event Location Age
Figure 1. Naïve Bayes
142
A.1. PRELIMINARY STUDY FOR A BAYESIAN NETWORK PROGNOSTIC MODEL FORCROHN´S DISEASE.
125
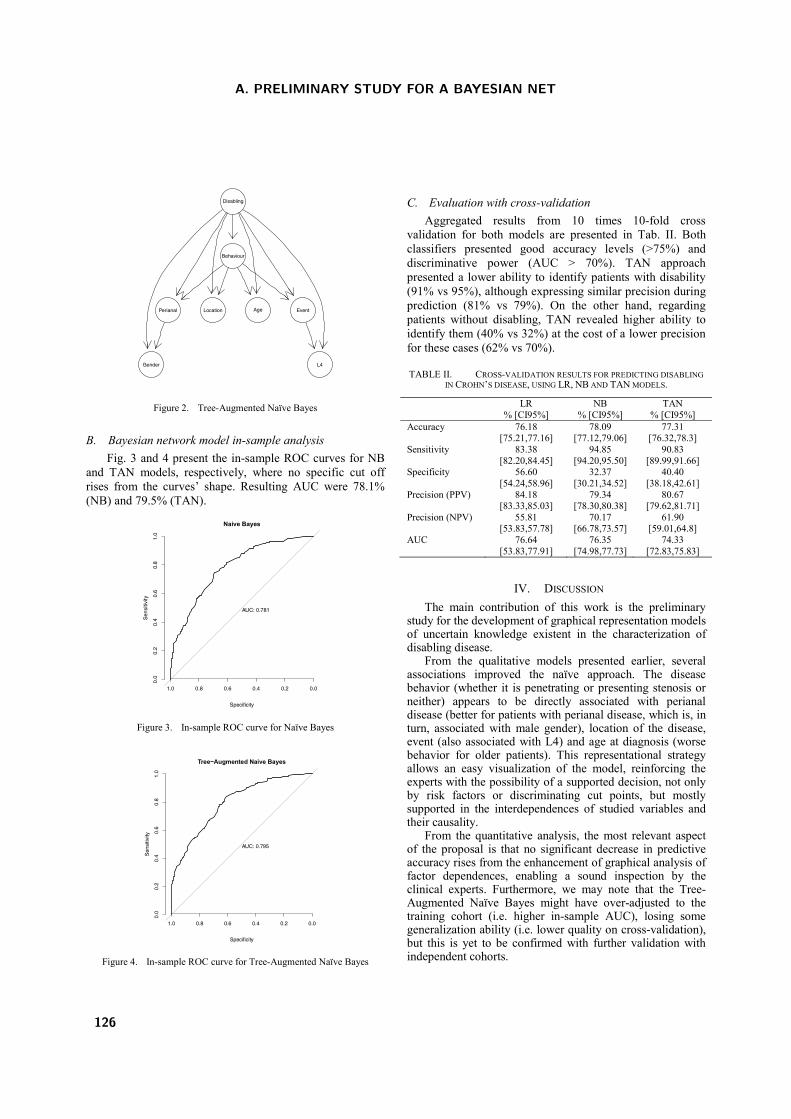
Perianal
Behaviour
Disabling
Gender
Location Age
L4
Event
Figure 2. Tree-Augmented Naïve Bayes
B. Bayesian network model in-sample analysis Fig. 3 and 4 present the in-sample ROC curves for NB
and TAN models, respectively, where no specific cut off rises from the curves’ shape. Resulting AUC were 78.1% (NB) and 79.5% (TAN).
Naive Bayes
Specificity
Sen
sitiv
ity
AUC: 0.781
1.0 0.8 0.6 0.4 0.2 0.0
0.0
0.2
0.4
0.6
0.8
1.0
Figure 3. In-sample ROC curve for Naïve Bayes
Tree−Augmented Naive Bayes
Specificity
Sen
sitiv
ity
AUC: 0.795
1.0 0.8 0.6 0.4 0.2 0.0
0.0
0.2
0.4
0.6
0.8
1.0
Figure 4. In-sample ROC curve for Tree-Augmented Naïve Bayes
C. Evaluation with cross-validation Aggregated results from 10 times 10-fold cross
validation for both models are presented in Tab. II. Both classifiers presented good accuracy levels (>75%) and discriminative power (AUC > 70%). TAN approach presented a lower ability to identify patients with disability (91% vs 95%), although expressing similar precision during prediction (81% vs 79%). On the other hand, regarding patients without disabling, TAN revealed higher ability to identify them (40% vs 32%) at the cost of a lower precision for these cases (62% vs 70%).
TABLE II. CROSS-VALIDATION RESULTS FOR PREDICTING DISABLING IN CROHN’S DISEASE, USING LR, NB AND TAN MODELS.
LR % [CI95%]
NB % [CI95%]
TAN % [CI95%]
Accuracy 76.18 [75.21,77.16]
78.09 [77.12,79.06]
77.31 [76.32,78.3]
Sensitivity 83.38 [82.20,84.45]
94.85 [94.20,95.50]
90.83 [89.99,91.66]
Specificity 56.60 [54.24,58.96]
32.37 [30.21,34.52]
40.40 [38.18,42.61]
Precision (PPV) 84.18 [83.33,85.03]
79.34 [78.30,80.38]
80.67 [79.62,81.71]
Precision (NPV) 55.81 [53.83,57.78]
70.17 [66.78,73.57]
61.90 [59.01,64.8]
AUC 76.64 [53.83,77.91]
76.35 [74.98,77.73]
74.33 [72.83,75.83]
IV. DISCUSSION The main contribution of this work is the preliminary
study for the development of graphical representation models of uncertain knowledge existent in the characterization of disabling disease.
From the qualitative models presented earlier, several associations improved the naïve approach. The disease behavior (whether it is penetrating or presenting stenosis or neither) appears to be directly associated with perianal disease (better for patients with perianal disease, which is, in turn, associated with male gender), location of the disease, event (also associated with L4) and age at diagnosis (worse behavior for older patients). This representational strategy allows an easy visualization of the model, reinforcing the experts with the possibility of a supported decision, not only by risk factors or discriminating cut points, but mostly supported in the interdependences of studied variables and their causality.
From the quantitative analysis, the most relevant aspect of the proposal is that no significant decrease in predictive accuracy rises from the enhancement of graphical analysis of factor dependences, enabling a sound inspection by the clinical experts. Furthermore, we may note that the Tree-Augmented Naïve Bayes might have over-adjusted to the training cohort (i.e. higher in-sample AUC), losing some generalization ability (i.e. lower quality on cross-validation), but this is yet to be confirmed with further validation with independent cohorts.
143
A. PRELIMINARY STUDY FOR A BAYESIAN NET
126
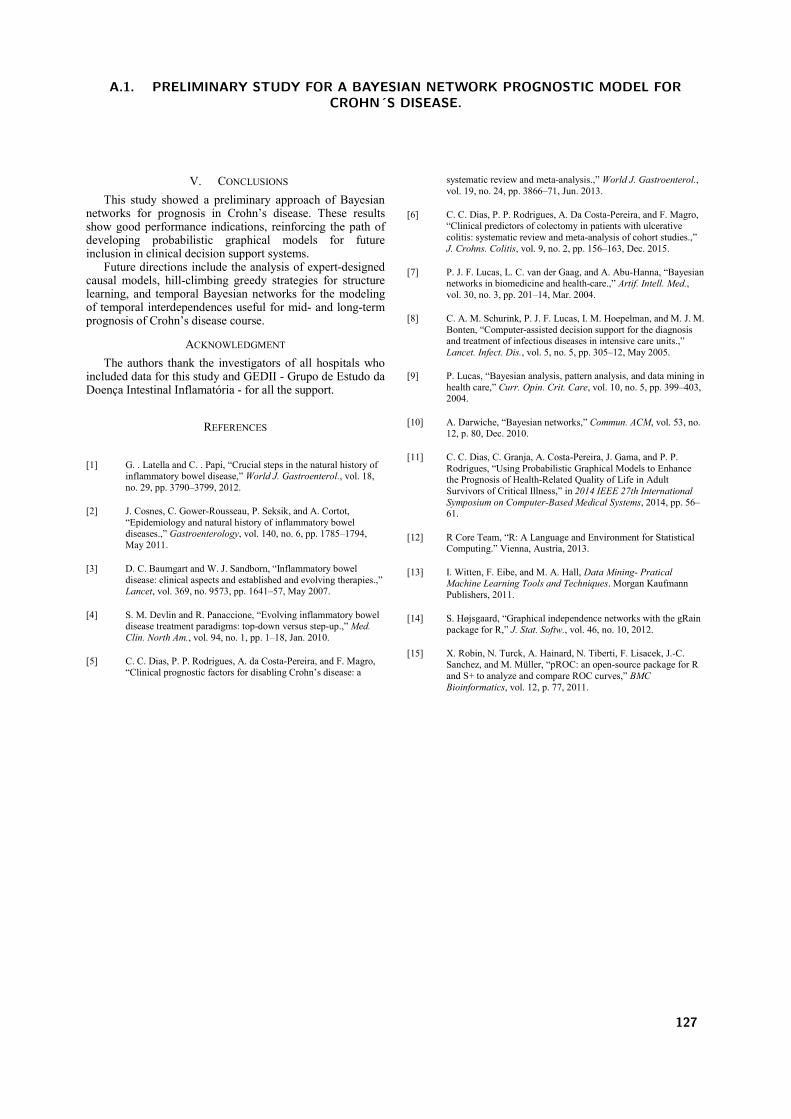
V. CONCLUSIONS This study showed a preliminary approach of Bayesian
networks for prognosis in Crohn’s disease. These results show good performance indications, reinforcing the path of developing probabilistic graphical models for future inclusion in clinical decision support systems.
Future directions include the analysis of expert-designed causal models, hill-climbing greedy strategies for structure learning, and temporal Bayesian networks for the modeling of temporal interdependences useful for mid- and long-term prognosis of Crohn’s disease course.
ACKNOWLEDGMENT The authors thank the investigators of all hospitals who
included data for this study and GEDII - Grupo de Estudo da Doença Intestinal Inflamatória - for all the support.
REFERENCES
[1] G. . Latella and C. . Papi, “Crucial steps in the natural history of inflammatory bowel disease,” World J. Gastroenterol., vol. 18, no. 29, pp. 3790–3799, 2012.
[2] J. Cosnes, C. Gower-Rousseau, P. Seksik, and A. Cortot, “Epidemiology and natural history of inflammatory bowel diseases.,” Gastroenterology, vol. 140, no. 6, pp. 1785–1794, May 2011.
[3] D. C. Baumgart and W. J. Sandborn, “Inflammatory bowel disease: clinical aspects and established and evolving therapies.,” Lancet, vol. 369, no. 9573, pp. 1641–57, May 2007.
[4] S. M. Devlin and R. Panaccione, “Evolving inflammatory bowel disease treatment paradigms: top-down versus step-up.,” Med. Clin. North Am., vol. 94, no. 1, pp. 1–18, Jan. 2010.
[5] C. C. Dias, P. P. Rodrigues, A. da Costa-Pereira, and F. Magro, “Clinical prognostic factors for disabling Crohn’s disease: a
systematic review and meta-analysis.,” World J. Gastroenterol., vol. 19, no. 24, pp. 3866–71, Jun. 2013.
[6] C. C. Dias, P. P. Rodrigues, A. Da Costa-Pereira, and F. Magro, “Clinical predictors of colectomy in patients with ulcerative colitis: systematic review and meta-analysis of cohort studies.,” J. Crohns. Colitis, vol. 9, no. 2, pp. 156–163, Dec. 2015.
[7] P. J. F. Lucas, L. C. van der Gaag, and A. Abu-Hanna, “Bayesian networks in biomedicine and health-care.,” Artif. Intell. Med., vol. 30, no. 3, pp. 201–14, Mar. 2004.
[8] C. A. M. Schurink, P. J. F. Lucas, I. M. Hoepelman, and M. J. M. Bonten, “Computer-assisted decision support for the diagnosis and treatment of infectious diseases in intensive care units.,” Lancet. Infect. Dis., vol. 5, no. 5, pp. 305–12, May 2005.
[9] P. Lucas, “Bayesian analysis, pattern analysis, and data mining in health care,” Curr. Opin. Crit. Care, vol. 10, no. 5, pp. 399–403, 2004.
[10] A. Darwiche, “Bayesian networks,” Commun. ACM, vol. 53, no. 12, p. 80, Dec. 2010.
[11] C. C. Dias, C. Granja, A. Costa-Pereira, J. Gama, and P. P. Rodrigues, “Using Probabilistic Graphical Models to Enhance the Prognosis of Health-Related Quality of Life in Adult Survivors of Critical Illness,” in 2014 IEEE 27th International Symposium on Computer-Based Medical Systems, 2014, pp. 56–61.
[12] R Core Team, “R: A Language and Environment for Statistical Computing.” Vienna, Austria, 2013.
[13] I. Witten, F. Eibe, and M. A. Hall, Data Mining- Pratical Machine Learning Tools and Techniques. Morgan Kaufmann Publishers, 2011.
[14] S. Højsgaard, “Graphical independence networks with the gRain package for R,” J. Stat. Softw., vol. 46, no. 10, 2012.
[15] X. Robin, N. Turck, A. Hainard, N. Tiberti, F. Lisacek, J.-C. Sanchez, and M. Müller, “pROC: an open-source package for R and S+ to analyze and compare ROC curves,” BMC Bioinformatics, vol. 12, p. 77, 2011.
144
A.1. PRELIMINARY STUDY FOR A BAYESIAN NETWORK PROGNOSTIC MODEL FORCROHN´S DISEASE.
127

A. PRELIMINARY STUDY FOR A BAYESIAN NET
128

B. Building the Bayesian net

B. Building the Bayesian net
B.1 Disabling and reoperation in patients with Crohn´s disease sub-
ject to early surgery or immunosuppression: A Bayesian network
prognostic model. disease.
Proceedings of 2016 IEEE 29th International Symposium on Computer-Based Medical Systems
265-268, 2016
Claudia Camila Dias, Fernando Magro e Pedro Pereira Rodrigues
131
Disabling and reoperation in patients with Crohn’s disease subject to early surgery or immunosuppression: a Bayesian network prognostic model
Cláudia Camila Dias CIDES & CINTESIS
Faculty of Medicine, University of Porto Porto, Portugal
Fernando Magro MedInUP
Institute of Pharmacology & Therapeutics Faculty of Medicine, University of Porto
Porto, Portugal [email protected]
Pedro Pereira Rodrigues CINTESIS & LIAAD – INESC TEC
Faculty of Medicine, University of Porto Porto, Portugal
Abstract— Crohn's disease is one type of inflammatory bowel disease whose incidence is currently increasing, subject to relapse and disabling, with unknown etiology, and usually diagnosed between the second and third decade of life. The aim of this work is to develop a Bayesian network tool to predict disabling and reoperation in patients with Crohn’s disease subject to early surgery or immunosuppressors intake. Multi-centric study data from patients with surgery or immunosuppression in the first six months after diagnosis was used, focusing on the prognosis and the analysis of factors’ interaction. Patients were grouped by the index episode: immunosuppressors intake, and surgery (stratified considering the use or not of immunosuppressors 6 months after surgery). Patient group was associated with disease behavior, upper gastrointestinal tract location (L4) and age at diagnosis, while disease extent was associated to perianal disease. For disabling, association between perianal disease and gender and location was also found. Association between gender and L4 was also found for reoperation. The cross-validated discriminative power of the models were high for both disabling (above 70%) and reoperation (above 80%). The generated models presented interesting insights on factor interaction and predictive ability for the prognosis, supporting their use in future clinical decision support systems.
Keywords: prognosis; Crohn’s disease; clinic decision support; Bayesian network models
I.! INTRODUCTION Crohn’s disease is a chronic illness with unknown etiology usually diagnosed during the second and third decade of life. The interaction between genetic and environment factors had a important role in the etiology of the disease [1].
The disease could had along periods of remission but the more aggressive cases requires more aggressive interventions like surgery [2] but, being a chronic disease, neither treatment nor surgery actually heals the patients, yielding frequent medical visits and hospitalizations, which in turn creates uncertainty about the professional and social future of patients and their families [3].
The treatment of Crohn’s disease has changed in the last decades. Strategies like step-up or top down treatments have been more frequently chosen. The top-down strategy is based on the very early use of intensive therapy (immunosuppressive and/or biologics) to maintain a good quality of life !"#$%&'(%!)"*&%!+,"(-./%#!%&'(%0)*(,*(%,10%/"(2(1&%,13%)"reversible consequences [4].
In our day the principal focus of treatment has been the improvement of quality of life, reduction of surgeries or hospitalization, besides the sole control of symptoms. Since the treatment plan clearly affects the disease course, focus has been given to identifying good prognostic models based on clinical/demographic factors since they are more easily included in daily clinical practice [5], [6].
However, prognostic studies show heterogeneous results, likely as a result of using different methodologies and/or applying different criteria for selection and evaluation. In addition, predicting the prognosis is a considerably uncertain task, so the development of predictive models also requires research. Also, traditional biostatistics is no longer enough to cope with the real-world biomedical data and it is necessary to look to other techniques [7]. Bayesian networks are a good choice since they deal well with prior knowledge, collected in published evidence included in quality literature or in primary or secondary data sources, and transform the data analyses in a process of updating the prior knowledge with available evidence at inference time [9], dealing better than other models with the uncertainty in the data. Bayesian networks are represented by a qualitative model (which describes the relations among variables) and a quantitative model (which gives the joint probability of all variables) which allows the inspection of marginal probabilities for each variable’s state, and their use in the computation of a posteriori probabilities for single patients at inference time [10].
A preliminary study on the problem constituted a proof-of-concept for the use of Bayesian network classifiers as prognostic predictor model for disabling of prognostic prediction of disabling [15]. However, a thorough follow-up clinical appraisal of those results revealed that the analysis of immunosuppressive therapy prior to six months after surgery was misleading, so a new definition of groups should be
2016 IEEE 29th International Symposium on Computer-Based Medical Systems
2372-9198/16 $31.00 © 2016 IEEE
DOI 10.1109/CBMS.2016.65
265
B. BUILDING THE BAYESIAN NET
132
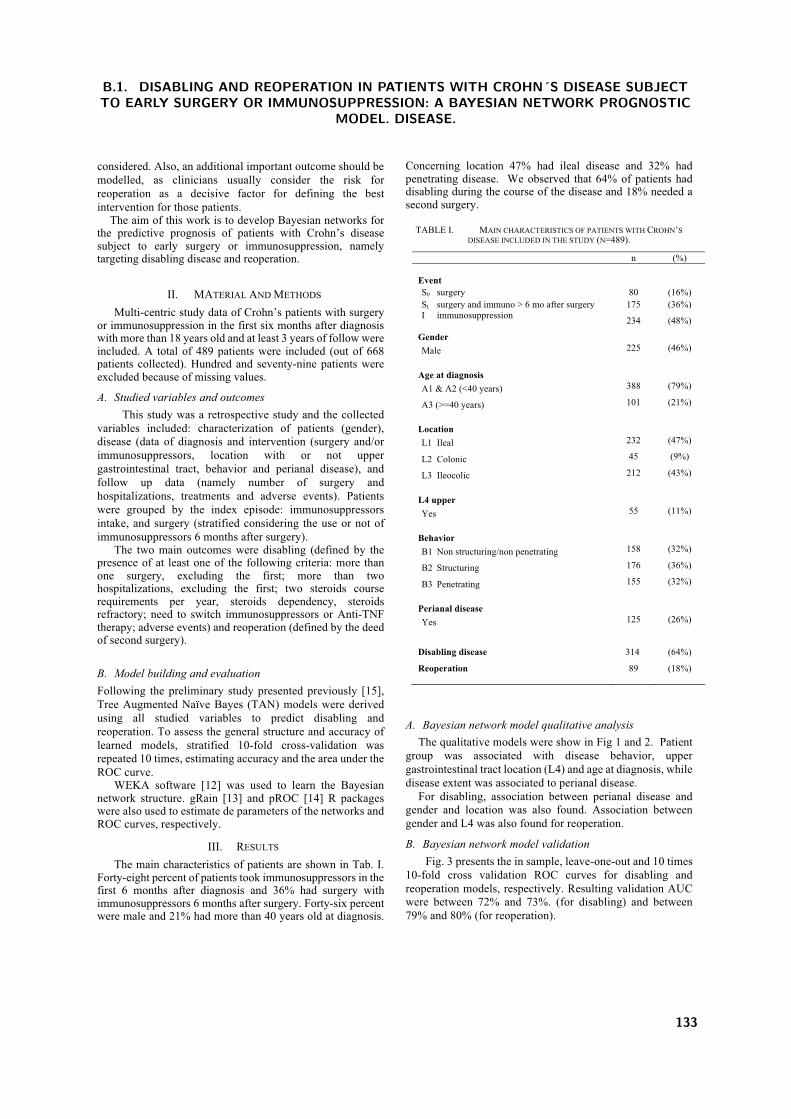
considered. Also, an additional important outcome should be modelled, as clinicians usually consider the risk for reoperation as a decisive factor for defining the best intervention for those patients.
The aim of this work is to develop Bayesian networks for the predictive prognosis of patients with Crohn’s disease subject to early surgery or immunosuppression, namely targeting disabling disease and reoperation.
II.! MATERIAL AND METHODS Multi-centric study data of Crohn’s patients with surgery
or immunosuppression in the first six months after diagnosis with more than 18 years old and at least 3 years of follow were included. A total of 489 patients were included (out of 668 patients collected). Hundred and seventy-nine patients were excluded because of missing values.
A.! Studied variables and outcomes This study was a retrospective study and the collected
variables included: characterization of patients (gender), disease (data of diagnosis and intervention (surgery and/or immunosuppressors, location with or not upper gastrointestinal tract, behavior and perianal disease), and follow up data (namely number of surgery and hospitalizations, treatments and adverse events). Patients were grouped by the index episode: immunosuppressors intake, and surgery (stratified considering the use or not of immunosuppressors 6 months after surgery).
The two main outcomes were disabling (defined by the presence of at least one of the following criteria: more than one surgery, excluding the first; more than two hospitalizations, excluding the first; two steroids course requirements per year, steroids dependency, steroids refractory; need to switch immunosuppressors or Anti-TNF therapy; adverse events) and reoperation (defined by the deed of second surgery).
B.! Model building and evaluation Following the preliminary study presented previously [15], Tree Augmented Naïve Bayes (TAN) models were derived using all studied variables to predict disabling and reoperation. To assess the general structure and accuracy of learned models, stratified 10-fold cross-validation was repeated 10 times, estimating accuracy and the area under the ROC curve.
WEKA software [12] was used to learn the Bayesian network structure. gRain [13] and pROC [14] R packages were also used to estimate de parameters of the networks and ROC curves, respectively.
III.! RESULTS The main characteristics of patients are shown in Tab. I.
Forty-eight percent of patients took immunosuppressors in the first 6 months after diagnosis and 36% had surgery with immunosuppressors 6 months after surgery. Forty-six percent were male and 21% had more than 40 years old at diagnosis.
Concerning location 47% had ileal disease and 32% had penetrating disease. We observed that 64% of patients had disabling during the course of the disease and 18% needed a second surgery.
TABLE I. ! MAIN CHARACTERISTICS OF PATIENTS WITH CROHN’S DISEASE INCLUDED IN THE STUDY (N=489).
n (%) Event
S0 surgery 80 (16%) SI surgery and immuno > 6 mo after surgery 175 (36%) I immunosuppression 234 (48%)
Gender Male 225 (46%)
Age at diagnosis
A1 & A2 (<40 years) 388 (79%)
A3 (>=40 years) 101 (21%)
Location
L1 Ileal 232 (47%)
L2 Colonic 45 (9%)
L3 Ileocolic 212 (43%)
L4 upper
Yes 55 (11%)
Behavior
B1 Non structuring/non penetrating 158 (32%)
B2 Structuring 176 (36%)
B3 Penetrating 155 (32%)
Perianal disease
Yes 125 (26%)
Disabling disease
314
(64%)
Reoperation
89
(18%)
A.! Bayesian network model qualitative analysis The qualitative models were show in Fig 1 and 2. Patient
group was associated with disease behavior, upper gastrointestinal tract location (L4) and age at diagnosis, while disease extent was associated to perianal disease.
For disabling, association between perianal disease and gender and location was also found. Association between gender and L4 was also found for reoperation.
B.! Bayesian network model validation Fig. 3 presents the in sample, leave-one-out and 10 times
10-fold cross validation ROC curves for disabling and reoperation models, respectively. Resulting validation AUC were between 72% and 73%. (for disabling) and between 79% and 80% (for reoperation).
266
B.1. DISABLING AND REOPERATION IN PATIENTS WITH CROHN´S DISEASE SUBJECTTO EARLY SURGERY OR IMMUNOSUPPRESSION: A BAYESIAN NETWORK PROGNOSTIC
MODEL. DISEASE.
133
IV.! DISCUSSION The main contribution of this work was the development
of prognostic models for disabling disease and reoperation. This models were developed after a preliminary study [15] done for the adequacy of these techniques into this problem, where comparison with other methods, namely logistic regression, has been assessed. Other clinical problems were also already addressed in the past with good performance, easy interpretation and friendly representations [7], [8], [11].
From models presented in Fig. 1 and 2 it was possible to infer some known clinical associations. In both outcomes, patient group was associated with disease behavior (whether it is penetrating or presenting stenosis or neither), upper gastrointestinal tract location (L4) and age at diagnosis, while disease extent was associated to perianal disease. These global dependencies show a common thread for knowledge representation in Crohn’s disease management, specifically tune for each outcome considering the added associations between perianal disease and gender and location (found for disabling) and the association between gender and L4 (found for reoperation).
This knowledge representation allows an easy visualization of the model, supporting the experts’ decision beyond the use of risk factors and discriminative cut points, into a support on the interdependences of studied variables and their induced causality.
From the quantitative analysis, and following the discussion from previous preliminary study - which showed that no significant decrease in predictive accuracy rises (beyond the naïve Bayes approach) with the enhancement of graphical analysis of variables’ dependences - the Tree Augmented Naïve Bayes proved to be an accurate prognostic model, usable in clinical settings, even though it might (as expected) slightly over fit the training cohort (i.e. higher in-sample AUC), losing some generalization ability (i.e. lower quality on cross-validation). Further analysis shall confirm such suspicions using independent cohorts.
V.! CONCLUSIONS The cross-validated evaluation of the Bayesian network
classifiers derived in this study resulted in high accuracy and discriminative power for both disabling (above 70%) and reoperation (above 80%) outcomes in Crohn’s disease patients subject to early surgery or immunosuppression. The generated models presented interesting insights on factor interaction and predictive ability for the prognosis, supporting their use in future clinical decision support systems.
Current path of research includes the definition of clinically usable decision support tools, based on the hereby derived Bayesian network classifiers and temporal Bayesian networks for the modeling of temporal interdependences useful for mid- and long-term prognosis of Crohn’s disease course, taking into account the specific modeling of immunosuppressors intake.
ACKNOWLEDGMENT The authors thank the investigators of all hospitals who included data for this study, to GEDII - Grupo de Estudo da Doença Intestinal Inflamatória - for all the support, and project NanoStima "NORTE-01-0145-FEDER-000016" which is financed by the North Portugal Regional Operational Programme (NORTE 2020), under the PORTUGAL 2020 Partnership Agreement, and through the European Regional Development Fund (ERDF).
REFERENCES
[1] G. . Latella and C. . Papi, “Crucial steps in the natural history of inflammatory bowel disease,” World J. Gastroenterol., vol. 18, no. 29, pp. 3790–3799, 2012.
[2] J. Cosnes, C. Gower-Rousseau, P. Seksik, and A. Cortot, “Epidemiology and natural history of inflammatory bowel diseases.,” Gastroenterology, vol. 140, no. 6, pp. 1785–1794, May 2011.
[3] D. C. Baumgart and W. J. Sandborn, “Inflammatory bowel disease: clinical aspects and established and evolving therapies,” Lancet, vol. 369, no. 9573. pp. 1641–1657, 2007.
[4] S. M. Devlin and R. Panaccione, “Evolving Inflammatory Bowel Disease Treatment Paradigms: Top-Down Versus Step-Up,” Medical Clinics of North America, vol. 94, no. 1. pp. 1–18, 2010.
[5] C. C. Dias, P. P. Rodrigues, A. da Costa-Pereira, and F. Magro, “Clinical prognostic factors for disabling Crohn’s disease: A systematic review and meta-analysis,” World J. Gastroenterol., vol. 19, no. 24, pp. 3866–3871, 2013.
[6] C. C. Dias, P. P. P. Rodrigues, A. da Costa-Pereira, and F. Magro, “Clinical predictors of colectomy in patients with ulcerative colitis: systematic review and meta-analysis of cohort studies.,” J. Crohns. Colitis, vol. 9, no. 2, pp. 156–163, 2015.
[7] P. J. F. Lucas, L. C. Van Der Gaag, and A. Abu-Hanna, “Bayesian networks in biomedicine and health-care,” Artif. Intell. Med., vol. 30, no. 3, pp. 201–214, 2004.
[8] C. A. M. Schurink, P. J. F. Lucas, I. M. Hoepelman, and M. J. M. Bonten, “Computer-assisted decision support for the diagnosis and treatment of infectious diseases in intensive care units.,” Lancet Infect. Dis., vol. 5, no. 5, pp. 305–312, 2005.
[9] P. Lucas, “Bayesian analysis, pattern analysis, and data mining in health care,” Curr. Opin. Crit. Care, vol. 10, no. 5, pp. 399–403, 2004.
[10] A. Darwiche, “Bayesian Networks,” Commun. ACM, vol. 53, no. 12, pp. 80–90, 2010.
[11] C. C. Dias, C. Granja, A. Costa-Pereira, J. Gama, and P. P. Rodrigues, “Using Probabilistic Graphical Models to Enhance the Prognosis of Health-Related Quality of Life in Adult Survivors of Critical Illness,” 2014 IEEE 27th Int. Symp. Comput. Med. Syst., pp. 56–61, 2014.
[12] I. Witten, F. Eibe, and M. A. Hall, Data Mining- Pratical Machine Learning Tools and Techniques. Morgan Kaufmann Publishers, 2011.
[13] S. Højsgaard, “Graphical independence networks with the gRain package for R,” J. Stat. Softw., vol. 46, no. 10, 2012.
[14] X. Robin, N. Turck, A. Hainard, N. Tiberti, F. Lisacek, J.-C. Sanchez, and M. Müller, “pROC: an open-source package for R and S+ to analyze and compare ROC curves.,” BMC
267
B. BUILDING THE BAYESIAN NET
134
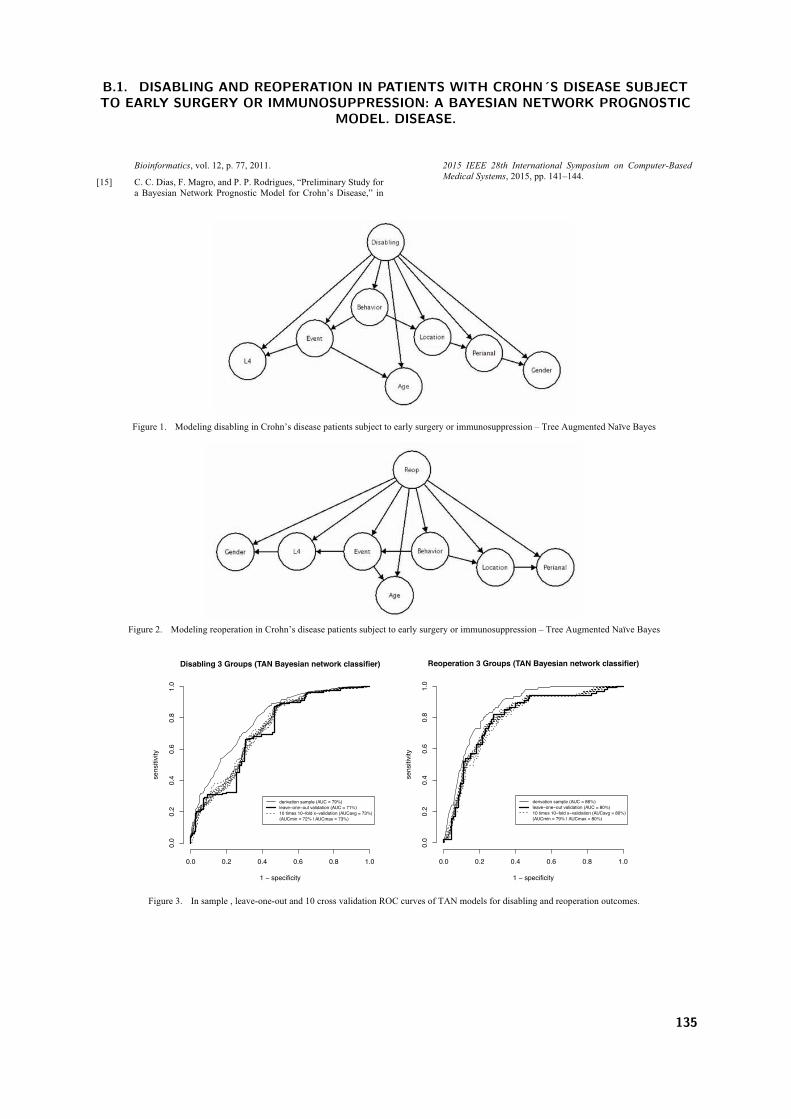
Bioinformatics, vol. 12, p. 77, 2011.
[15] C. C. Dias, F. Magro, and P. P. Rodrigues, “Preliminary Study for a Bayesian Network Prognostic Model for Crohn’s Disease,” in
2015 IEEE 28th International Symposium on Computer-Based Medical Systems, 2015, pp. 141–144.
Figure 1. ! Modeling disabling in Crohn’s disease patients subject to early surgery or immunosuppression – Tree Augmented Naïve Bayes
Figure 2. ! Modeling reoperation in Crohn’s disease patients subject to early surgery or immunosuppression – Tree Augmented Naïve Bayes
Figure 3. ! In sample , leave-one-out and 10 cross validation ROC curves of TAN models for disabling and reoperation outcomes.
Disabling 3 Groups (TAN Bayesian network classifier)
1 − specificity
sens
itivity
0.0 0.2 0.4 0.6 0.8 1.0
0.0
0.2
0.4
0.6
0.8
1.0
derivation sample (AUC = 79%)leave−one−out validation (AUC = 71%)10 times 10−fold x−validation (AUCavg = 73%)(AUCmin = 72% | AUCmax = 73%)
Reoperation 3 Groups (TAN Bayesian network classifier)
1 − specificity
sens
itivity
0.0 0.2 0.4 0.6 0.8 1.0
0.0
0.2
0.4
0.6
0.8
1.0
derivation sample (AUC = 86%)leave−one−out validation (AUC = 80%)10 times 10−fold x−validation (AUCavg = 80%)(AUCmin = 79% | AUCmax = 80%)
268
B.1. DISABLING AND REOPERATION IN PATIENTS WITH CROHN´S DISEASE SUBJECTTO EARLY SURGERY OR IMMUNOSUPPRESSION: A BAYESIAN NETWORK PROGNOSTIC
MODEL. DISEASE.
135

B. BUILDING THE BAYESIAN NET
136

C. Using the Bayesian net

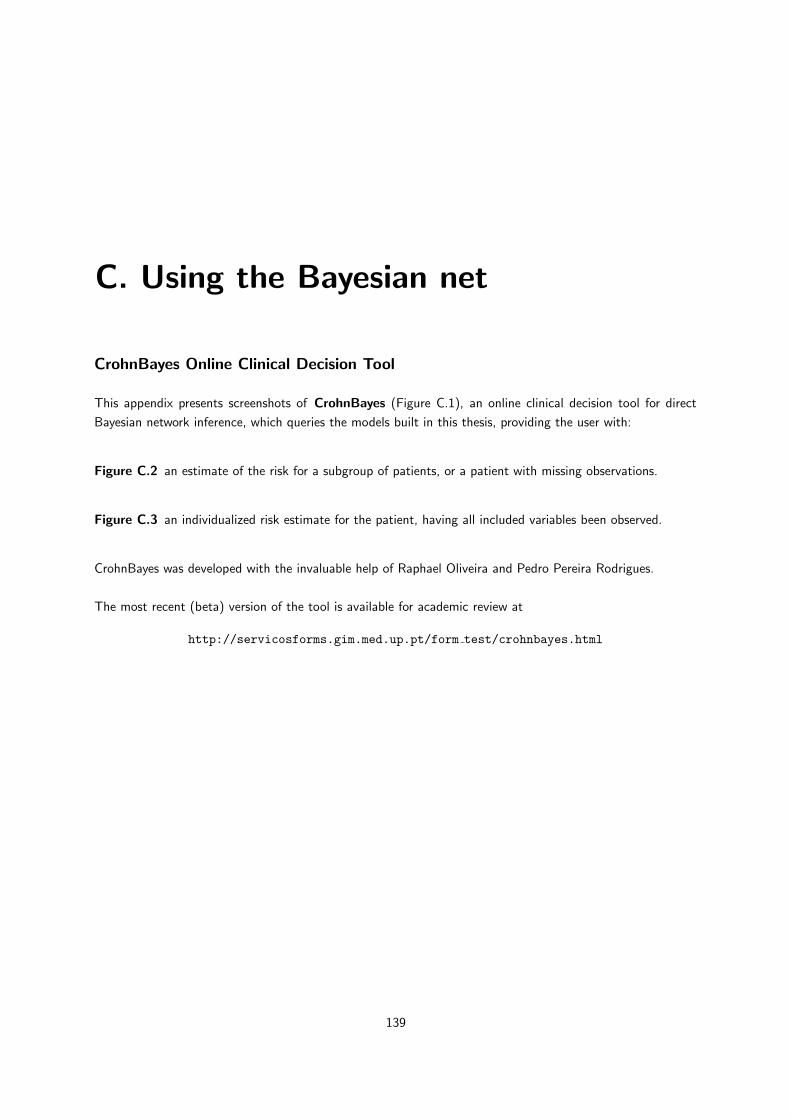
C. Using the Bayesian net
CrohnBayes Online Clinical Decision Tool
This appendix presents screenshots of CrohnBayes (Figure C.1), an online clinical decision tool for direct
Bayesian network inference, which queries the models built in this thesis, providing the user with:
Figure C.2 an estimate of the risk for a subgroup of patients, or a patient with missing observations.
Figure C.3 an individualized risk estimate for the patient, having all included variables been observed.
CrohnBayes was developed with the invaluable help of Raphael Oliveira and Pedro Pereira Rodrigues.
The most recent (beta) version of the tool is available for academic review at
http://servicosforms.gim.med.up.pt/form test/crohnbayes.html
139
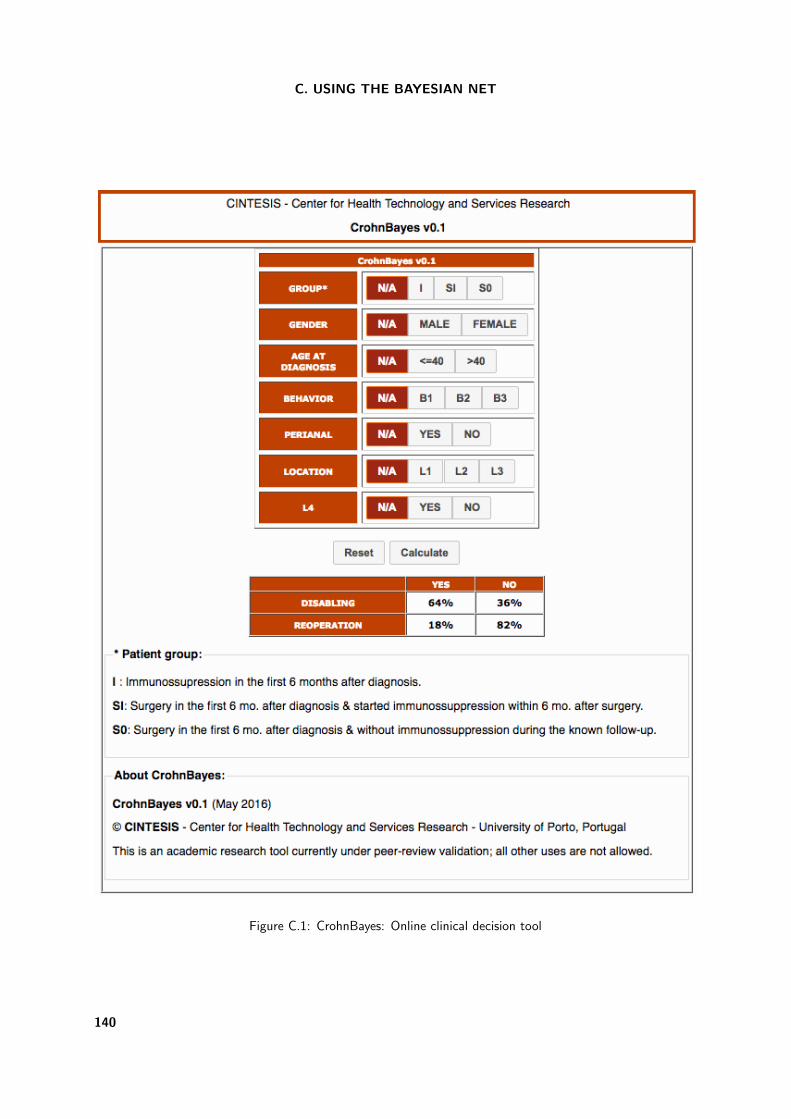
C. USING THE BAYESIAN NET
Figure C.1: CrohnBayes: Online clinical decision tool
140

Figure C.2: CrohnBayes: Example of use with missing observations
141
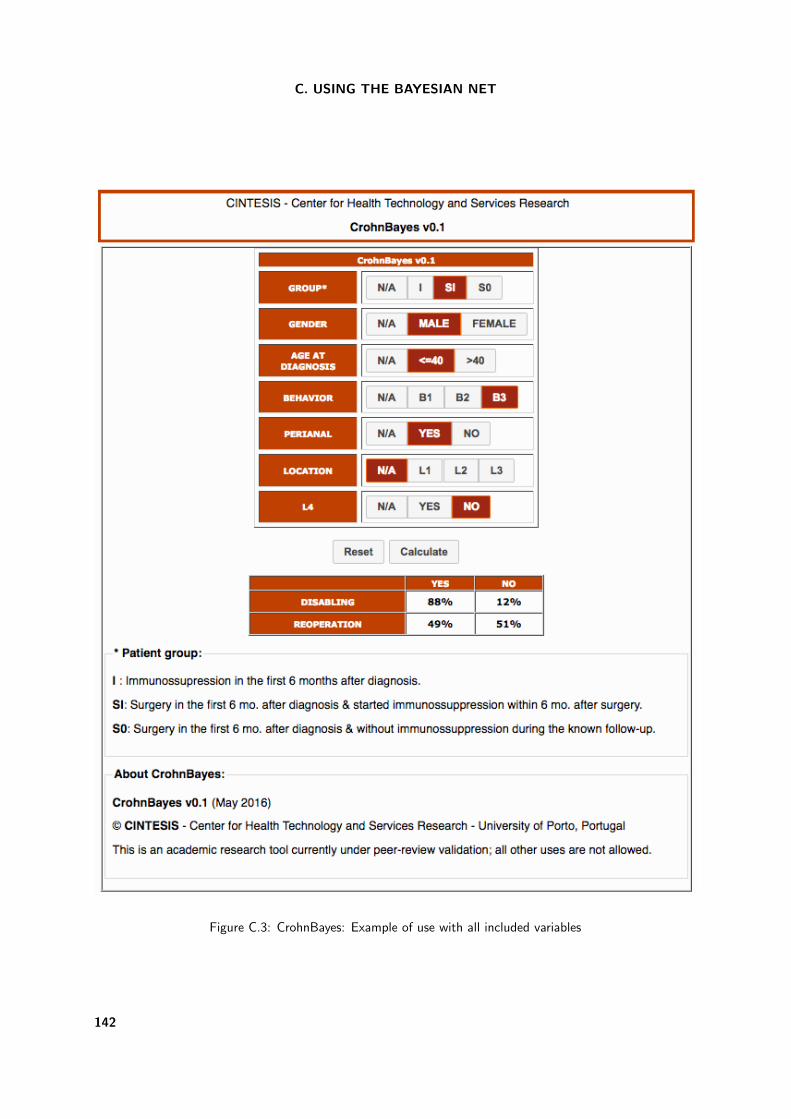
C. USING THE BAYESIAN NET
Figure C.3: CrohnBayes: Example of use with all included variables
142

Prognostic models for Inflammatory Bowel Disease: evidence, classification and prediction
c⃝ Claudia Camila Rodrigues Pereira Dias – Porto, 2017