Embed Size (px)
Citation preview

p. 1
Profitable Growth &Long-Term Leadership
January 2010Investor Presentation
p. 2
DisclaimerDisclaimer
This presentation does not constitute or form part of and should not be construed as an advertisement of securities, an offer or invitation to sell or issue or the solicitation of an offer to buy or acquire or subscribe for securities of X5 Retail Group N.V. or any of its subsidiaries or any depositary receipts representing such securities in any jurisdiction or an invitation or inducement to engage in investment activity in relation thereto. In particular, this presentation does not constitute an advertisement or an offer of securities in the Russian Federation.
No part of this presentation, nor the fact of its distribution, should form the basis of, or be relied on in connection with, any contract or commitment or investment decision whatsoever.
No representation, warranty or undertaking, express or implied, is given by or on behalf of X5 Retail Group N.V. or any of its directors, officers, employees, shareholders, affiliates, advisers, representatives or any other person as to, and no reliance should be placed on, the fairness, accuracy, completeness or correctness of the information or the opinions contained herein or any other material discussed at the presentation. Neither X5 Retail Group N.V. nor any of its directors, officers, employees, shareholders, affiliates, advisors, representatives or any other person shall have any liability whatsoever (in negligence or otherwise) for any loss howsoever arising from any use of this presentation or any other material discussed at the presentation or their contents or otherwise arising in connection with the presentation.
This presentation includes statements that are, or may be deemed to be, “forward-looking statements”, with respect to the financial condition, results, operations and businesses of X5 Retail Group N.V. These forward-looking statements can be identified by the fact that they do not only relate to historical or current events. Forward-looking statements often use words such as”anticipate”, “target”, “expect”, “estimate”, “intend”, “expected”, “plan”, “goal” believe”, or other words of similar meaning.
By their nature, forward-looking statements involve risk and uncertainty because they relate to future events and circumstances, a number of which are beyond X5 Retail Group N.V’s control. As a result, X5 Retail Group N.V’s actual future results may differ materially from the plans, goals and expectations set out in these forward-looking statements. X5 Retail Group N.V. assumes no responsibility to update any of the forward looking statements contained in this presentation.
This presentation is not for distribution in, nor does it constitute an offer of securities for sale, or the solicitation of an offer to subscribe for securities in Australia, Canada, Japan or in any jurisdiction where such distribution, offer or solicitation is unlawful. Neither the presentation nor any copy of it may be taken or transmitted into the United States of America, its territories or possessions, or distributed, directly or indirectly, in the United States of America, its territories or possessions or to, or viewed by any U.S. person as defined in Regulation S under the USSecurities Act 1933 (the "Securities Act”). Any failure to comply with these restrictions may constitute a violation of United States, Australian, Canadian or Japanese securities laws. The distribution of this presentation in certain jurisdictions may be restricted by law and persons into whose possession this document or any other document or other information referred to herein comes should inform themselves about, and observe, any such restrictions. Any failure to comply with these restrictions may constitute a violation of the securities law of any such jurisdiction.
For Russian law purposes, the securities mentioned in this presentation (the "Securities") represent foreign securities. It is not permitted to place or publicly circulate the Securities on the territory of the Russian Federation at present. No prospectus for the issue of the Securities has been or is intended to be registered with the Federal Service for Financial Markets of the Russian Federation. The information provided in this presentation is not intended to advertise or facilitate the offer of the Securities in the territory of the Russian Federation. This presentation does not represent an offer to acquire the Securities or an invitation to make offers to acquire the Securities.
The information and opinions contained in this document are provided as at the date of this presentation and are subject to change without notice. Some of the information is still in draft form and neither X5 Retail Group N.V. nor any other party is under any duty to update or inform recipients of this presentation of any changes to such information or opinions. In particular, it should be noted that some of the financial information relating to X5 Retail Group N.V. and its subsidiaries contained in this document has not been audited and in some cases is based on management information and estimates.
Neither X5 Retail Group N.V. nor any of its agents, employees or advisors intend or have any duty or obligation to supplement, amend, update or revise any of the statements contained in this presentation.
p. 3
AgendaAgenda
I. X5 Retail Group – Profitable Growth and Long-Term Leadership
• X5’s Strategic Priorities
• 2009 Performance
• 2010 Growth Outlook
II. Q3 & 9M 2009 Financial Highlights
Appendices
p. 4
X5 X5 -- #1 Russia#1 Russia’’s Retailers Retailer
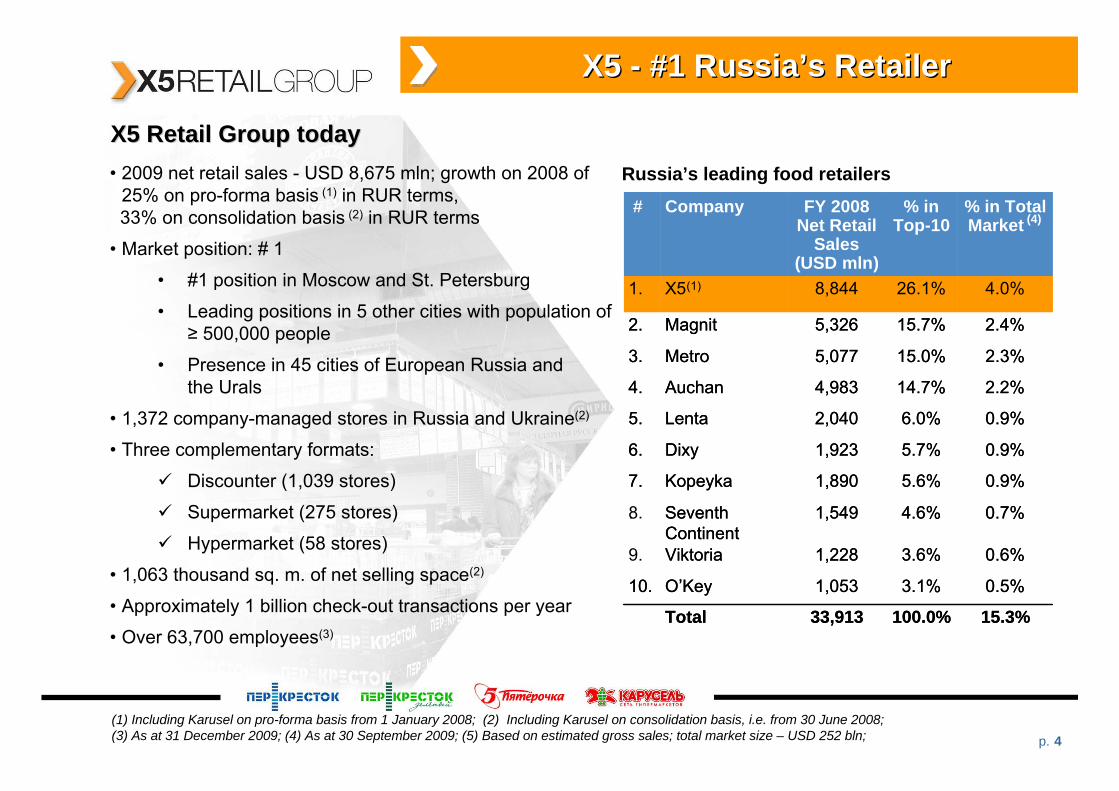
• 2009 net retail sales - USD 8,675 mln; growth on 2008 of 25% on pro-forma basis (1) in RUR terms, 33% on consolidation basis (2) in RUR terms
• Market position: # 1
• #1 position in Moscow and St. Petersburg
• Leading positions in 5 other cities with population of ≥ 500,000 people
• Presence in 45 cities of European Russia andthe Urals
• 1,372 company-managed stores in Russia and Ukraine(2)
• Three complementary formats:
Discounter (1,039 stores)
Supermarket (275 stores)
Hypermarket (58 stores)
• 1,063 thousand sq. m. of net selling space(2)
• Approximately 1 billion check-out transactions per year
• Over 63,700 employees(3)
(1) Including Karusel on pro-forma basis from 1 January 2008; (2) Including Karusel on consolidation basis, i.e. from 30 June 2008;(3) As at 31 December 2009; (4) As at 30 September 2009; (5) Based on estimated gross sales; total market size – USD 252 bln;
X5 Retail Group todayX5 Retail Group todayRussia’s leading food retailers
# Company FY 2008 Net Retail
Sales(USD mln)
% inTop-10
% in TotalMarket (4)
1. X5(1) 8,844 26.1% 4.0%
2. Magnit 5,326 15.7% 2.4%
3. Metro 5,077 15.0% 2.3%
4. Auchan 4,983 14.7% 2.2%
5. Lenta 2,040 6.0% 0.9%
6. Dixy 1,923 5.7% 0.9%
7. Kopeyka 1,890 5.6% 0.9%
8. SeventhContinent
1,549 4.6% 0.7%
9. Viktoria 1,228 3.6% 0.6%
10. O’Key 1,053 3.1% 0.5%
Total 33,913 100.0% 15.3%
# Company FY 2008 Net Retail
Sales(USD mln)
% inTop-10
% in TotalMarket (4)
1. X5(1) 8,844 26.1% 4.0%
2. Magnit 5,326 15.7% 2.4%
3. Metro 5,077 15.0% 2.3%
4. Auchan 4,983 14.7% 2.2%
5. Lenta 2,040 6.0% 0.9%
6. Dixy 1,923 5.7% 0.9%
7. Kopeyka 1,890 5.6% 0.9%
. SeventhContinent
1,549 4.6% 0.7%
Viktoria 1,228 3.6% 0.6%
10. O’Key 1,053 3.1% 0.5%
Total 33,913 100.0% 15.3%
p. 5
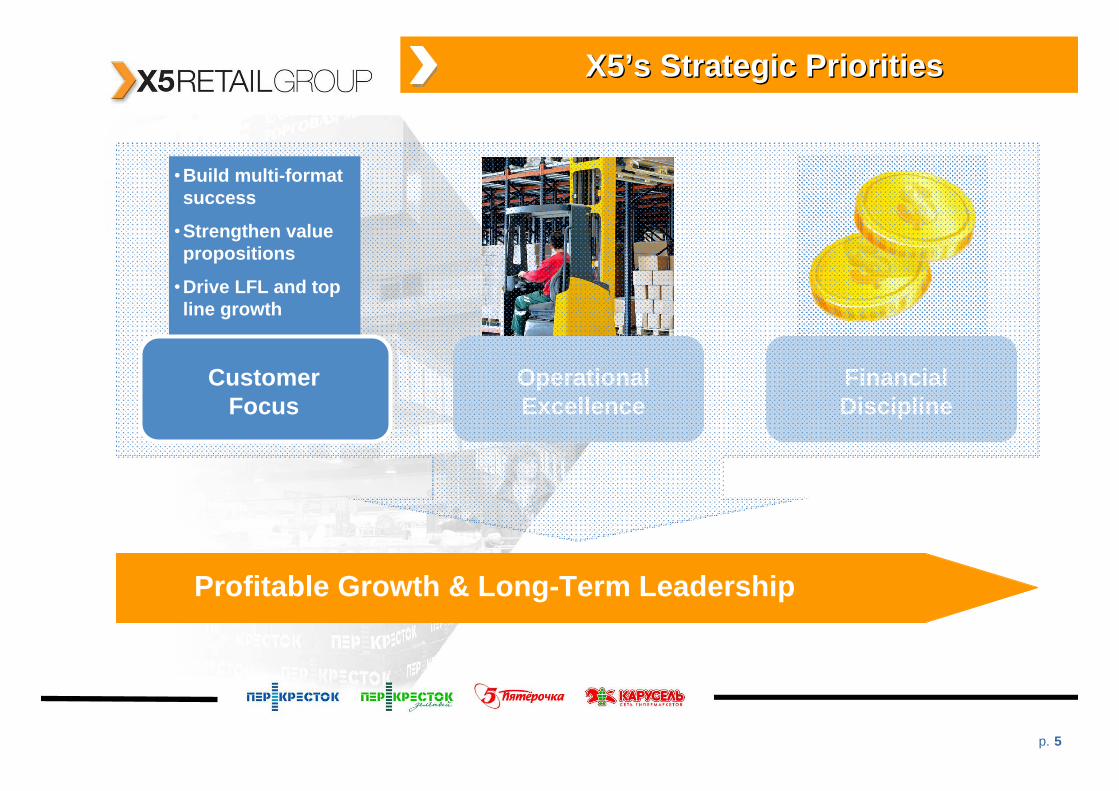
X5X5’’s Strategic s Strategic PrioritiesPriorities
Profitable Growth & Long-Term Leadership
Operational Excellence
FinancialDiscipline
•Build multi-format success
•Strengthen value propositions
•Drive LFL and top line growth
Customer Focus
p. 6
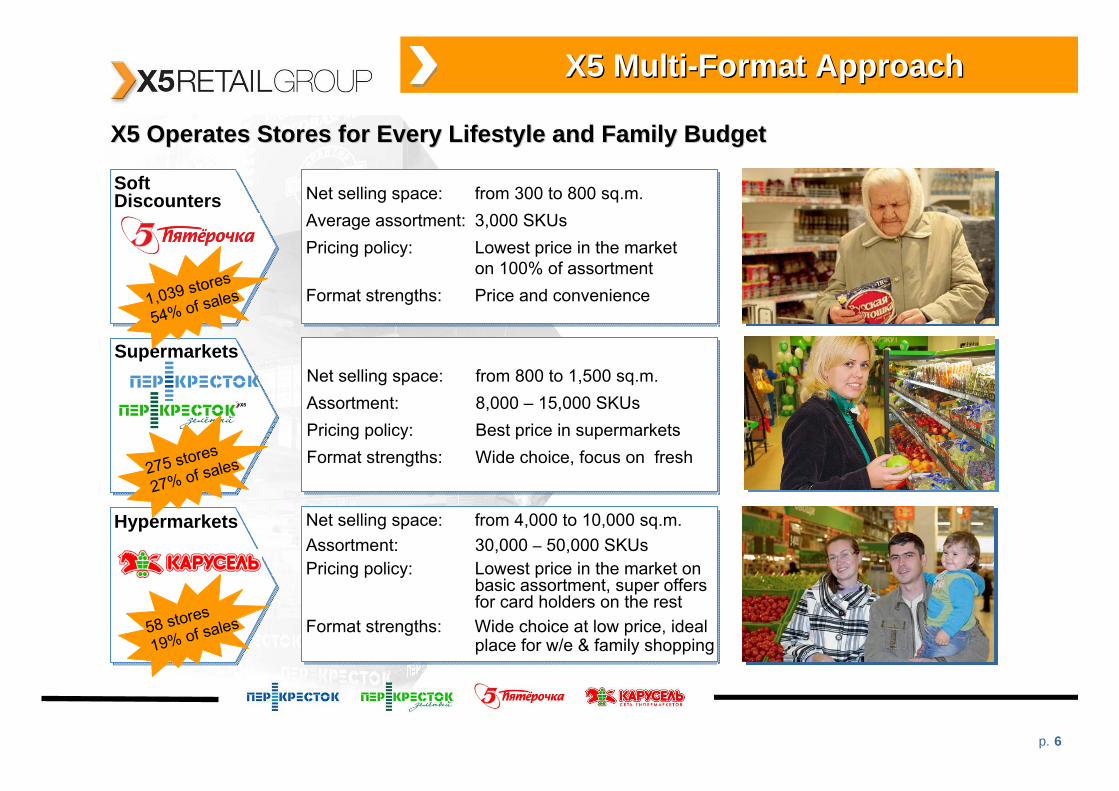
Net selling space: from 4,000 to 10,000 sq.m.Assortment: 30,000 – 50,000 SKUsPricing policy: Lowest price in the market on
basic assortment, super offers for card holders on the rest
Format strengths: Wide choice at low price, ideal place for w/e & family shopping
X5 MultiX5 Multi--Format ApproachFormat Approach
SoftDiscounters
Supermarkets
Hypermarkets
X5 Operates Stores for Every Lifestyle and Family BudgetX5 Operates Stores for Every Lifestyle and Family Budget
Net selling space: from 800 to 1,500 sq.m.Assortment: 8,000 – 15,000 SKUsPricing policy: Best price in supermarketsFormat strengths: Wide choice, focus on fresh
Net selling space: from 300 to 800 sq.m.Average assortment: 3,000 SKUsPricing policy: Lowest price in the market
on 100% of assortmentFormat strengths: Price and convenience
275 stores
27% of sales
58 stores
19% of sales
1,039 stores
54% of sales
p. 7
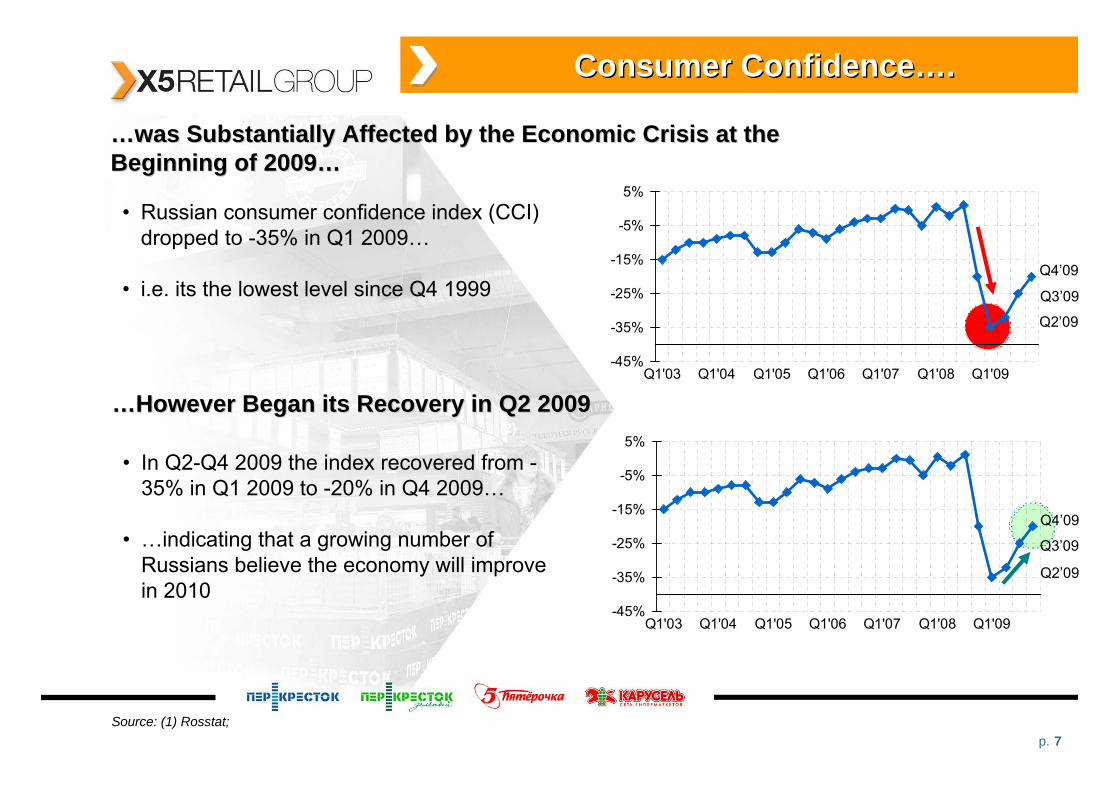
Consumer ConfidenceConsumer Confidence……..
……was Substantially Affected by the Economic Crisis at the was Substantially Affected by the Economic Crisis at the Beginning of 2009Beginning of 2009……
Source: (1) Rosstat;
-45%
-35%
-25%
-15%
-5%
5%
Q1'03 Q1'04 Q1'05 Q1'06 Q1'07 Q1'08 Q1'09
(2) (2)
Q2’09
• Russian consumer confidence index (CCI) dropped to -35% in Q1 2009…
• i.e. its the lowest level since Q4 1999 Q3’09
Q4’09
-45%
-35%
-25%
-15%
-5%
5%
Q1'03 Q1'04 Q1'05 Q1'06 Q1'07 Q1'08 Q1'09
Q2’09
Q3’09
Q4’09
……However Began its Recovery in Q2 2009However Began its Recovery in Q2 2009
• In Q2-Q4 2009 the index recovered from -35% in Q1 2009 to -20% in Q4 2009…
• …indicating that a growing number of Russians believe the economy will improve in 2010

p. 8
Throughout 2009 X5 DeliveredThroughout 2009 X5 Delivered……
…… Stable LFL Performance Despite Persistent Trading Down TrendsStable LFL Performance Despite Persistent Trading Down Trends
7%4% 4% 5%
6%
4%
-1%
5%
Moscow St. Pet Regions TOTAL
Traffic BasketSupermarkets’ 2009 LFL Performance
Based on RUR-denominated gross sales
Hypermarkets’ 2009 LFL PerformanceBased on RUR-denominated gross sales
Discounters’ 2009 LFL PerformanceBased on RUR-denominated gross sales
X5’s 2009 LFL Performance by Region
+ 13%
+ 8%
+ 3%
Based on RUR-denominated gross sales
+ 10%
6% 4% 4%1%
-9%-4%
-3%
-4%Moscow St. Pet TOTAL
Traffic Basket
+ 3% + 5%
- 13%0%Regions
13%
9%
3%5%
15% 10%
8%
7%
Moscow St. Pet Regions TOTAL
Traffic Basket
+ 22%
+ 8%
+ 23%
+ 17%
3%
7%5% 7%
-4%2%
6%
Moscow St. Pet TOTAL
Traffic Basket
+ 10%+ 7% 2% + 7%
Regions
p. 9
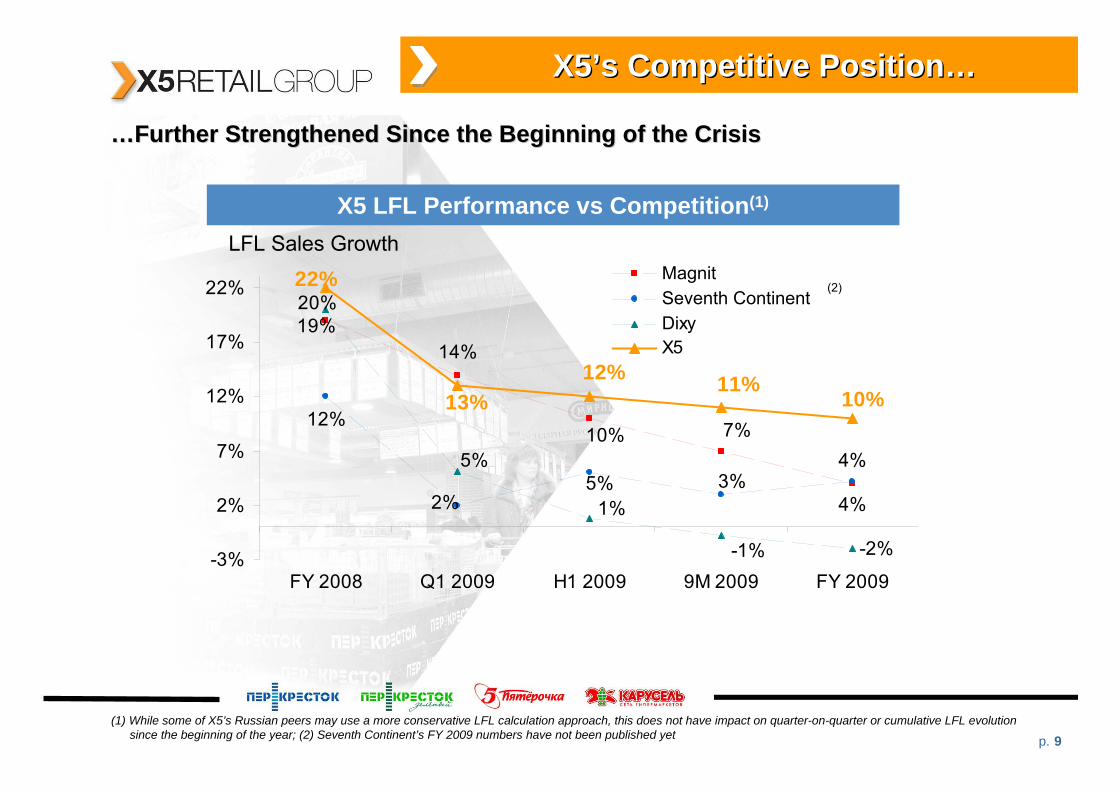
X5X5’’s Competitive Positions Competitive Position……
……Further Strengthened Since the Beginning of the CrisisFurther Strengthened Since the Beginning of the Crisis
X5 LFL Performance vs Competition(1)
LFL Sales Growth
(1) While some of X5’s Russian peers may use a more conservative LFL calculation approach, this does not have impact on quarter-on-quarter or cumulative LFL evolution since the beginning of the year; (2) Seventh Continent’s FY 2009 numbers have not been published yet
(2)
14%
4%
12%
-2%
19%
10% 7%
2%5% 3%
4%
20%
5%
1%
-1%
22%
13%12% 11%
10%
-3%
2%
7%
12%
17%
22%
FY 2008 Q1 2009 H1 2009 9M 2009 FY 2009
MagnitSeventh ContinentDixyX5
p. 10
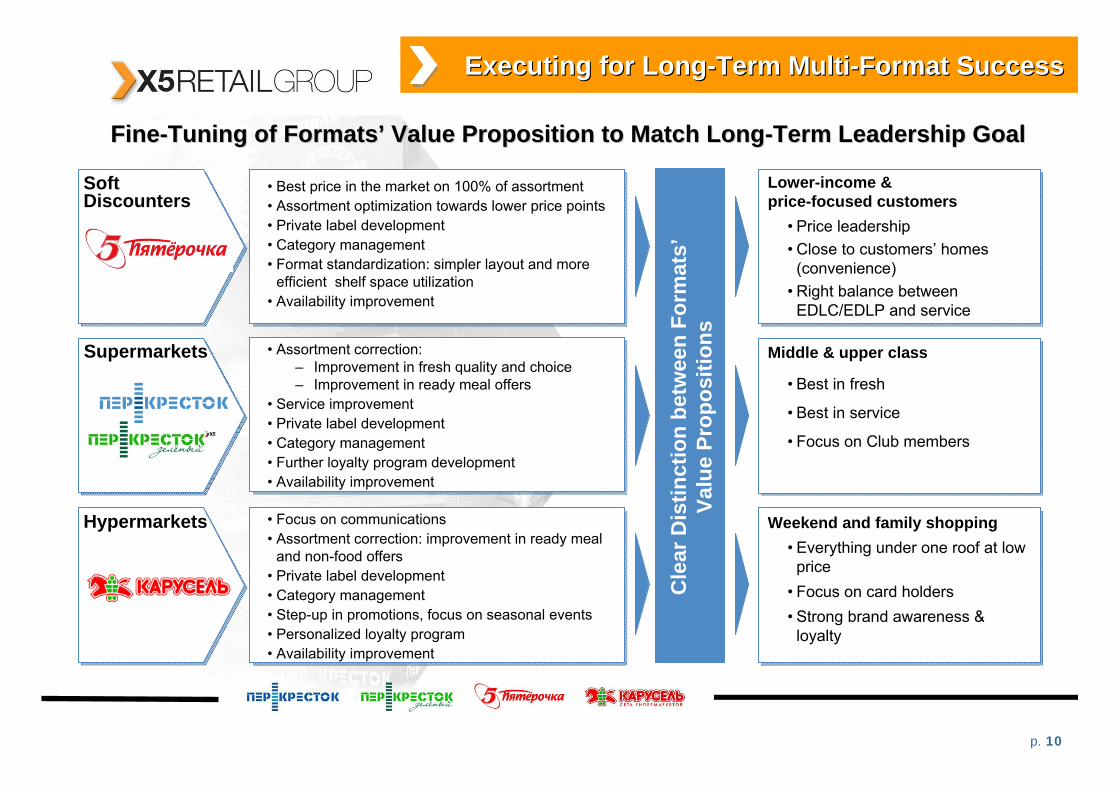
Executing for LongExecuting for Long--Term MultiTerm Multi--Format SuccessFormat Success
SoftDiscounters
Supermarkets
Hypermarkets
FineFine--Tuning of FormatsTuning of Formats’’ Value Proposition to Match LongValue Proposition to Match Long--Term Leadership GoalTerm Leadership Goal
• Best price in the market on 100% of assortment• Assortment optimization towards lower price points• Private label development • Category management• Format standardization: simpler layout and more
efficient shelf space utilization• Availability improvement
• Assortment correction:– Improvement in fresh quality and choice– Improvement in ready meal offers
• Service improvement• Private label development• Category management• Further loyalty program development• Availability improvement
• Focus on communications• Assortment correction: improvement in ready meal
and non-food offers• Private label development• Category management• Step-up in promotions, focus on seasonal events• Personalized loyalty program• Availability improvement
• Price leadership• Close to customers’ homes
(convenience)• Right balance between
EDLC/EDLP and service
Cle
ar D
istin
ctio
n be
twee
n Fo
rmat
s’Va
lue
Prop
ositi
ons
• Best in fresh
• Best in service
• Focus on Club members
• Everything under one roof at low price
• Focus on card holders• Strong brand awareness &
loyalty
Lower-income &price-focused customers
Middle & upper class
Weekend and family shopping
p. 11
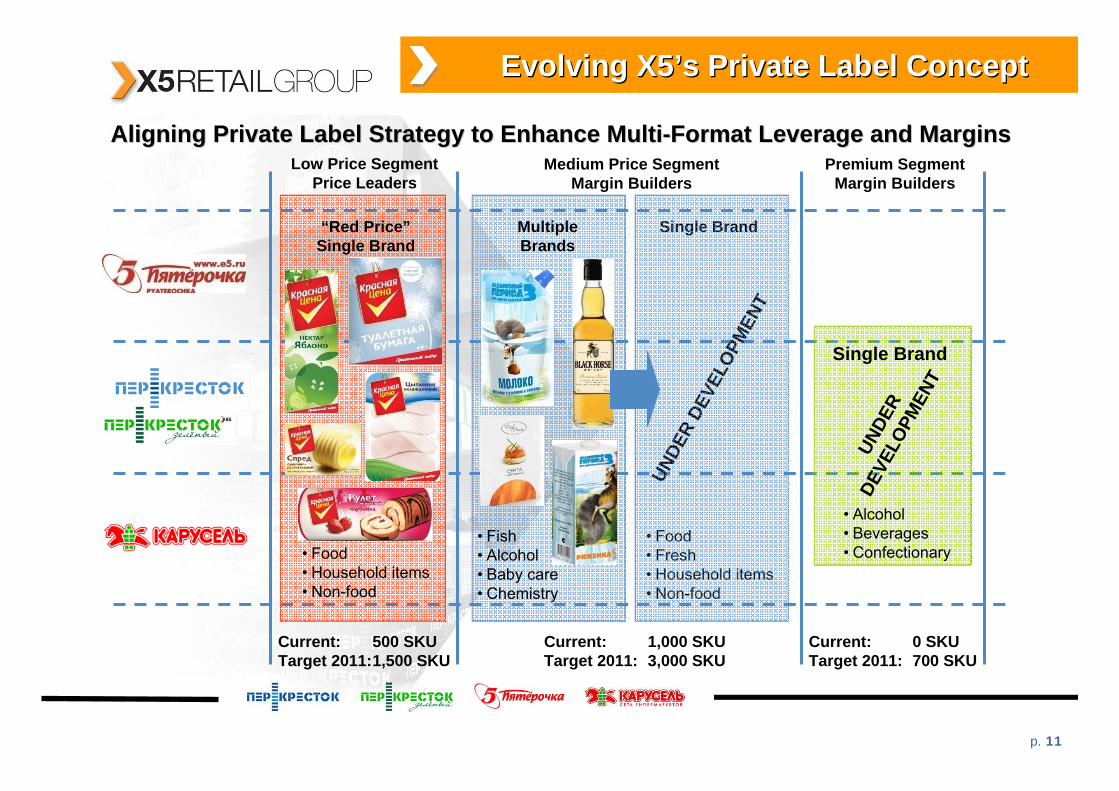
Evolving X5Evolving X5’’s Private Label Concepts Private Label Concept
Aligning Private Label Strategy to Enhance MultiAligning Private Label Strategy to Enhance Multi--Format Leverage and MarginsFormat Leverage and MarginsLow Price Segment
Price LeadersMedium Price Segment
Margin BuildersPremium Segment
Margin Builders
“Red Price”Single Brand
UNDE
RDE
VELO
PMEN
T
Single Brand
• Food• Household items• Non-food
• Alcohol• Beverages• Confectionary
MultipleBrands
• Fish• Alcohol• Baby care• Chemistry
Single Brand
UNDE
R DE
VELO
PMEN
T
• Food• Fresh• Household items• Non-food
Current: 500 SKUTarget 2011:1,500 SKU
Current: 1,000 SKUTarget 2011: 3,000 SKU
Current: 0 SKUTarget 2011: 700 SKU
p. 12
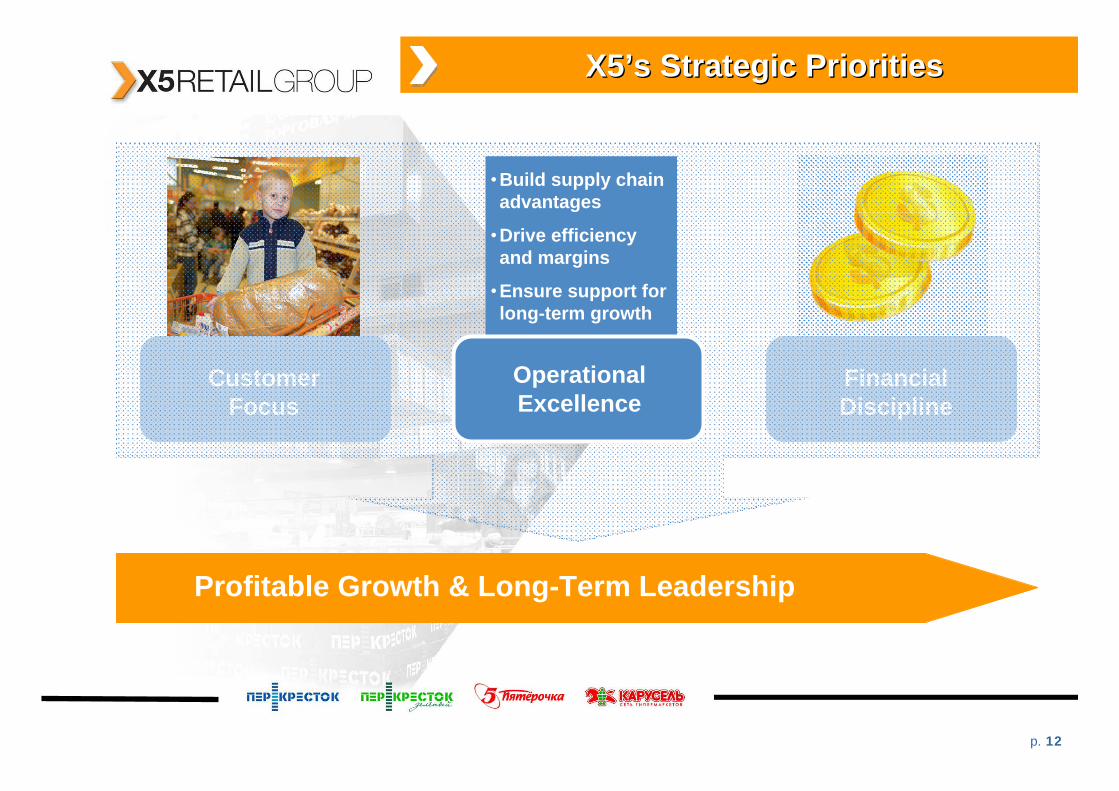
X5X5’’s Strategic s Strategic PrioritiesPriorities
Customer Focus
FinancialDiscipline
Profitable Growth & Long-Term Leadership
•Build supply chain advantages
•Drive efficiency and margins
•Ensure support for long-term growth
Operational Excellence
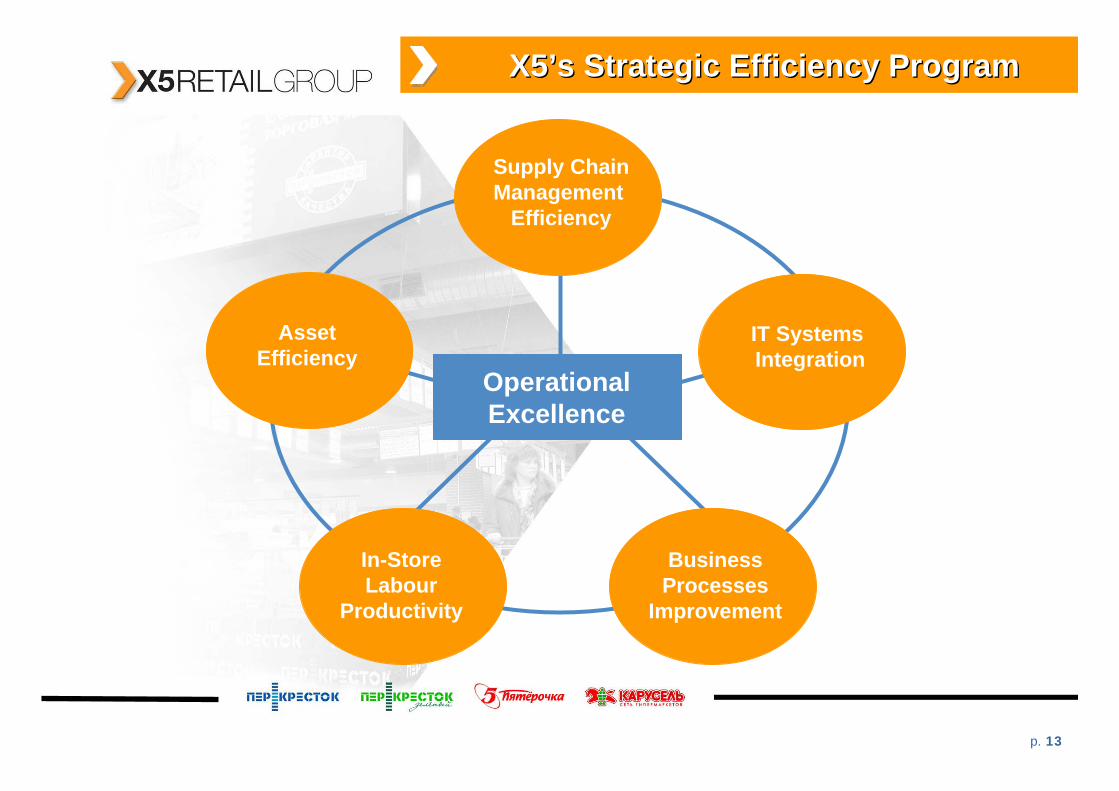
p. 13
Supply ChainManagement
Efficiency
BusinessProcesses
Improvement
In-StoreLabour
Productivity
Operational Excellence
X5X5’’s Strategic Efficiency Programs Strategic Efficiency Program
IT Systems Integration
AssetEfficiency
p. 14
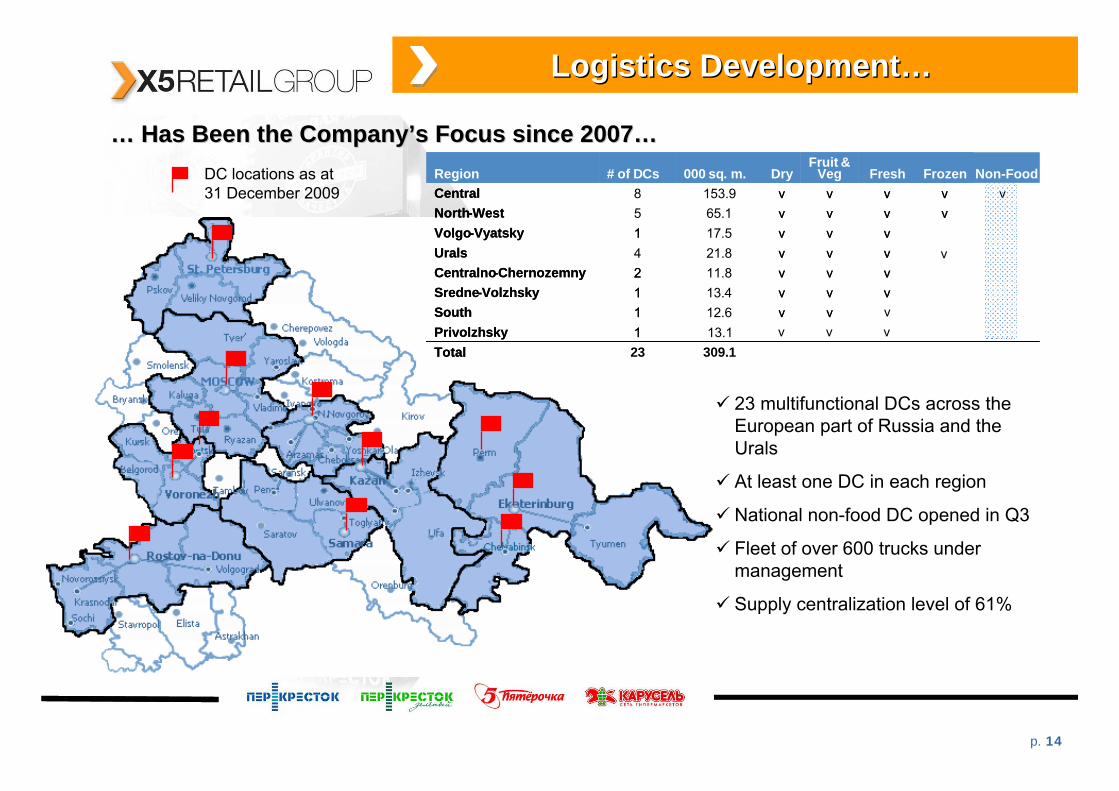
Logistics DevelopmentLogistics Development……
…… Has Been the CompanyHas Been the Company’’s Focus since 2007s Focus since 2007……DC locations as at31 December 2009
23 multifunctional DCs across the European part of Russia and the Urals
At least one DC in each region
National non-food DC opened in Q3
Fleet of over 600 trucks under management
Supply centralization level of 61%
309.123Total13.11Privolzhsky
vv12.61Southvvv13.41Sredne-Volzhskyvvv11.82Centralno-Chernozemnyvvv21.84Uralsvvv17.51Volgo-Vyatsky
vvvv65.15North-Westvvvv153.98Central
FrozenFreshFruit &
VegDry000 sq. m.# of DCsRegion
Total1Privolzhsky
vv1Southvvv1Sredne-Volzhskyvvv2Centralno-ChernozemnyvvvUralsvvv1Volgo-Vyatsky
vvvvNorth-WestvvvvCentral
FrozenFreshFruit &
VegDry000 sq. m.# of DCsRegion
vvv
Non-Foodv
v
v
p. 15
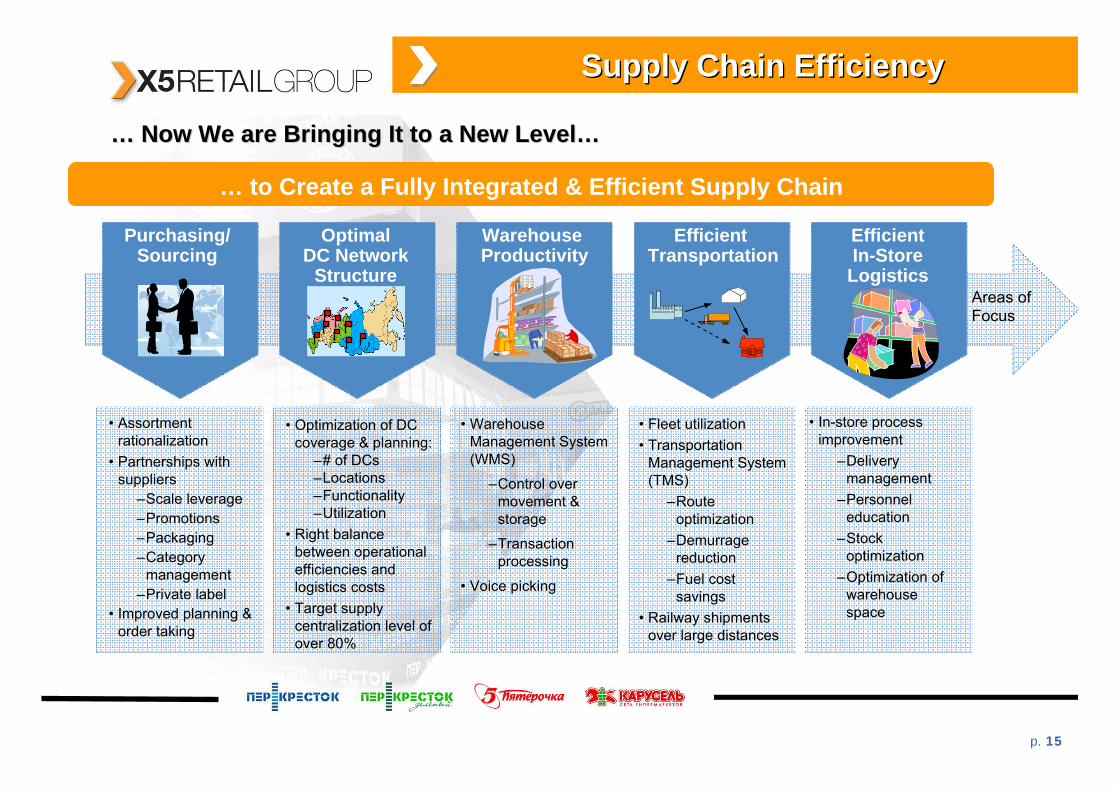
• Warehouse Management System (WMS)
–Control over movement & storage
–Transaction processing
• Voice picking
• Fleet utilization• Transportation
Management System (TMS)
–Route optimization
–Demurrage reduction
–Fuel cost savings
• Railway shipments over large distances
• In-store process improvement
–Delivery management
–Personnel education
–Stock optimization
–Optimization of warehouse space
• Assortment rationalization
• Partnerships with suppliers
–Scale leverage–Promotions–Packaging–Category
management–Private label
• Improved planning & order taking
• Optimization of DC coverage & planning:
–# of DCs–Locations–Functionality–Utilization
• Right balance between operational efficiencies and logistics costs
• Target supply centralization level of over 80%
Supply Chain EfficiencySupply Chain Efficiency
…… Now We are Bringing It to a New LevelNow We are Bringing It to a New Level……
… to Create a Fully Integrated & Efficient Supply Chain
Areas of
Purchasing/Sourcing
Efficient Transportation
EfficientIn-Store
Logistics
Warehouse Productivity
OptimalDC Network
Structure
Focus
p. 16
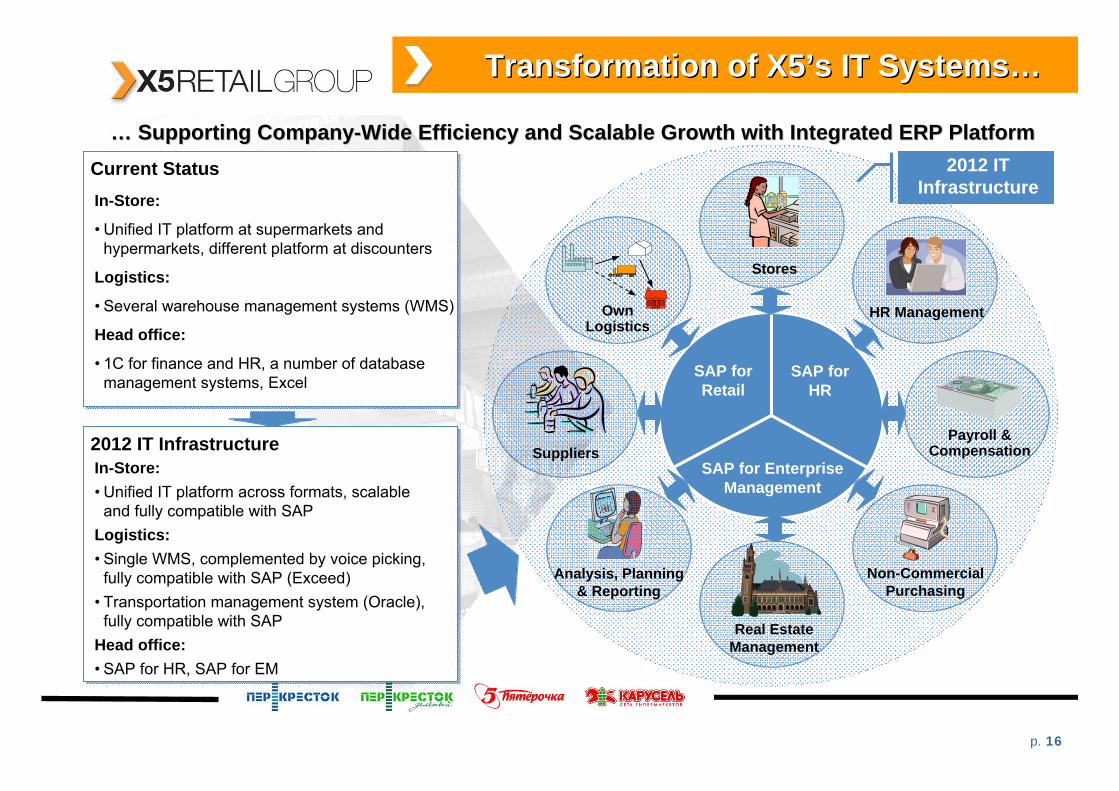
Transformation of X5Transformation of X5’’s IT Systemss IT Systems……
…… Supporting CompanySupporting Company--Wide Efficiency and Scalable Growth with Integrated ERP PlatformWide Efficiency and Scalable Growth with Integrated ERP Platform
Suppliers
Own Logistics
Stores
HR Management
Payroll & Compensation
Analysis, Planning & Reporting
Non-CommercialPurchasing
Real EstateManagement
SAP for Retail
SAP for HR
SAP for Enterprise Management
In-Store:
• Unified IT platform at supermarkets and hypermarkets, different platform at discounters
Logistics:
• Several warehouse management systems (WMS)
Head office:
• 1C for finance and HR, a number of database management systems, Excel
Current Status
In-Store:• Unified IT platform across formats, scalable
and fully compatible with SAPLogistics:• Single WMS, complemented by voice picking,
fully compatible with SAP (Exceed)• Transportation management system (Oracle),
fully compatible with SAP Head office:• SAP for HR, SAP for EM
2012 IT Infrastructure
2012 ITInfrastructure
p. 17
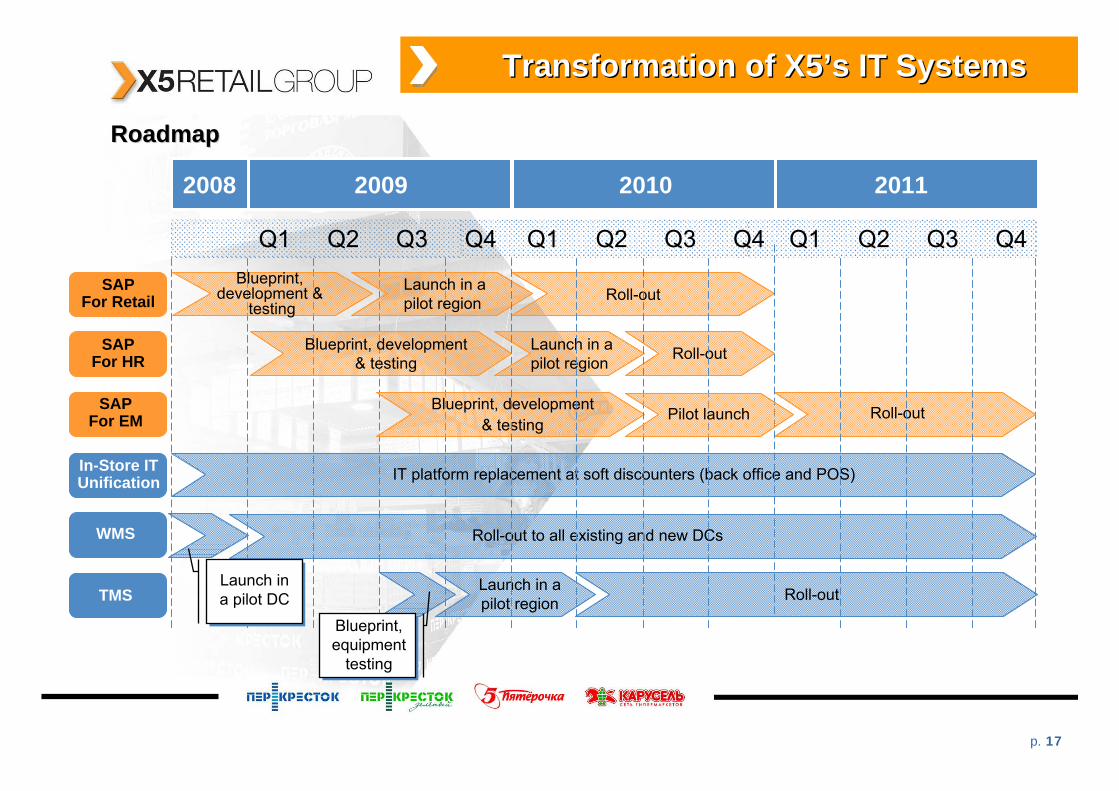
Transformation of X5Transformation of X5’’s IT Systemss IT Systems
RoadmapRoadmap
2008 2009 2010
Q1 Q2 Q3 Q4
SAPFor Retail
Launch in apilot region Roll-out
Blueprint, development & testing
Launch in apilot region Roll-out
Blueprint, development & testing
Roll-out
Blueprint,development &
testing
SAPFor HR
SAPFor EM
TMS
In-Store ITUnification
WMS Roll-out to all existing and new DCs
IT platform replacement at soft discounters (back office and POS)
Launch in a pilot region Roll-out
2011
Q1 Q2 Q3 Q4 Q1 Q2 Q3 Q4
Pilot launch
Launch in a pilot DC
Blueprint, equipment
testing
p. 18
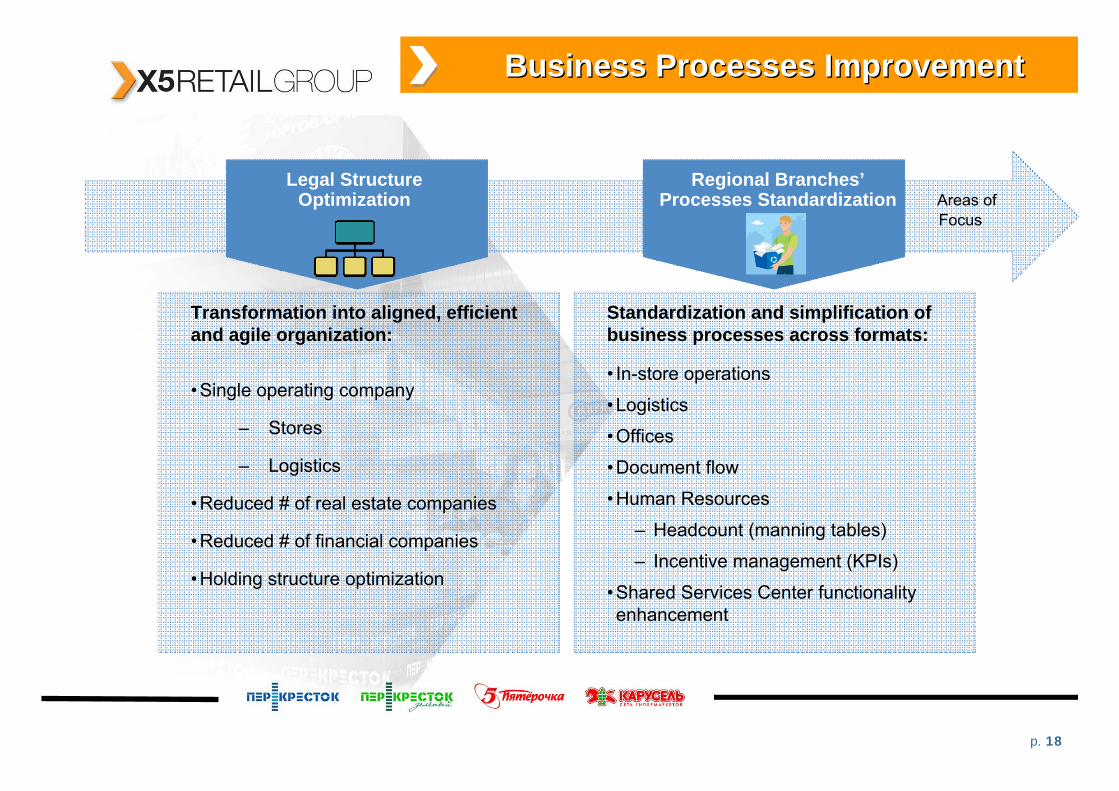
Business Processes ImprovementBusiness Processes Improvement
Areas ofLegal Structure
OptimizationFocus
Regional Branches’Processes Standardization
Transformation into aligned, efficient and agile organization:
•Single operating company
– Stores
– Logistics
•Reduced # of real estate companies
•Reduced # of financial companies
•Holding structure optimization
Standardization and simplification of business processes across formats:
• In-store operations
•Logistics
•Offices
•Document flow
•Human Resources
– Headcount (manning tables)
– Incentive management (KPIs)
•Shared Services Center functionality enhancement
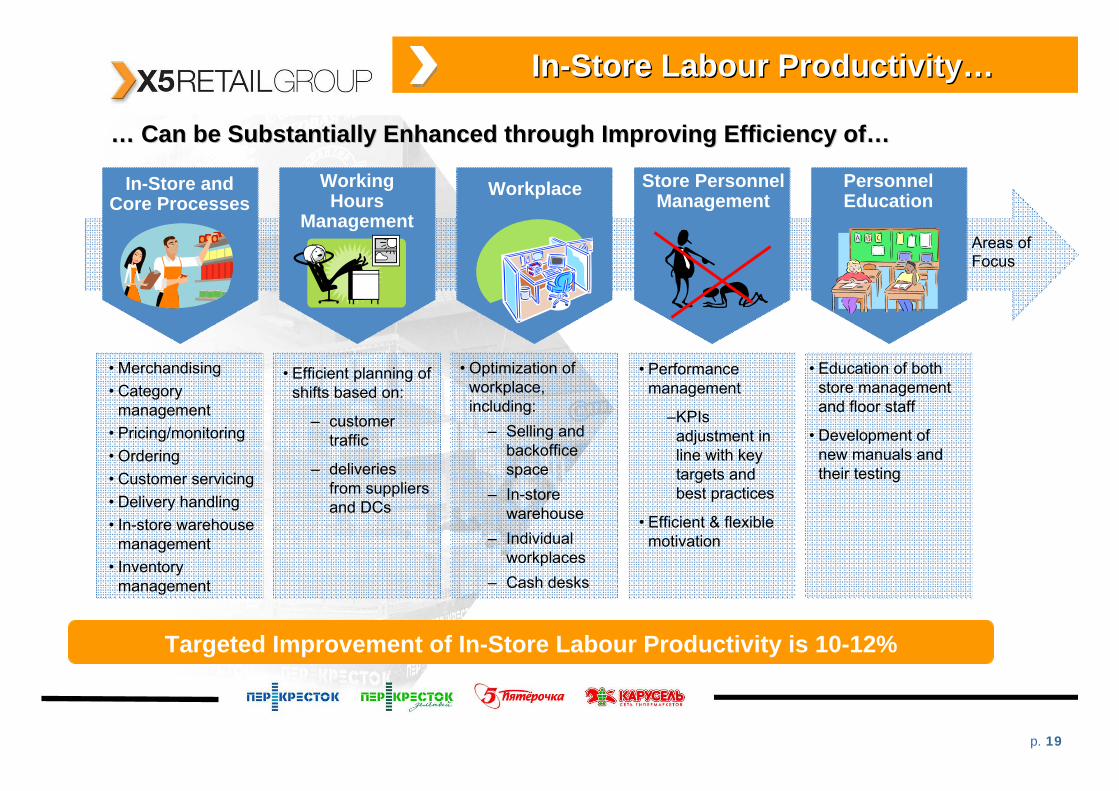
p. 19
• Performance management
–KPIsadjustment in line with key targets and best practices
• Efficient & flexible motivation
• Education of both store management and floor staff
• Development of new manuals and their testing
• Merchandising• Category
management• Pricing/monitoring• Ordering• Customer servicing• Delivery handling• In-store warehouse
management• Inventory
management
InIn--Store Store LabourLabour ProductivityProductivity……
Areas of
In-Store andCore Processes
Store PersonnelManagement
PersonnelEducationWorkplaceWorking
Hours Management
Focus
Targeted Improvement of In-Store Labour Productivity is 10-12%
• Efficient planning of shifts based on:
– customer traffic
– deliveries from suppliers and DCs
…… Can be Substantially Enhanced throughCan be Substantially Enhanced through Improving Efficiency ofImproving Efficiency of……
• Optimization of workplace, including:
– Selling and backofficespace
– In-store warehouse
– Individual workplaces
– Cash desks
p. 20
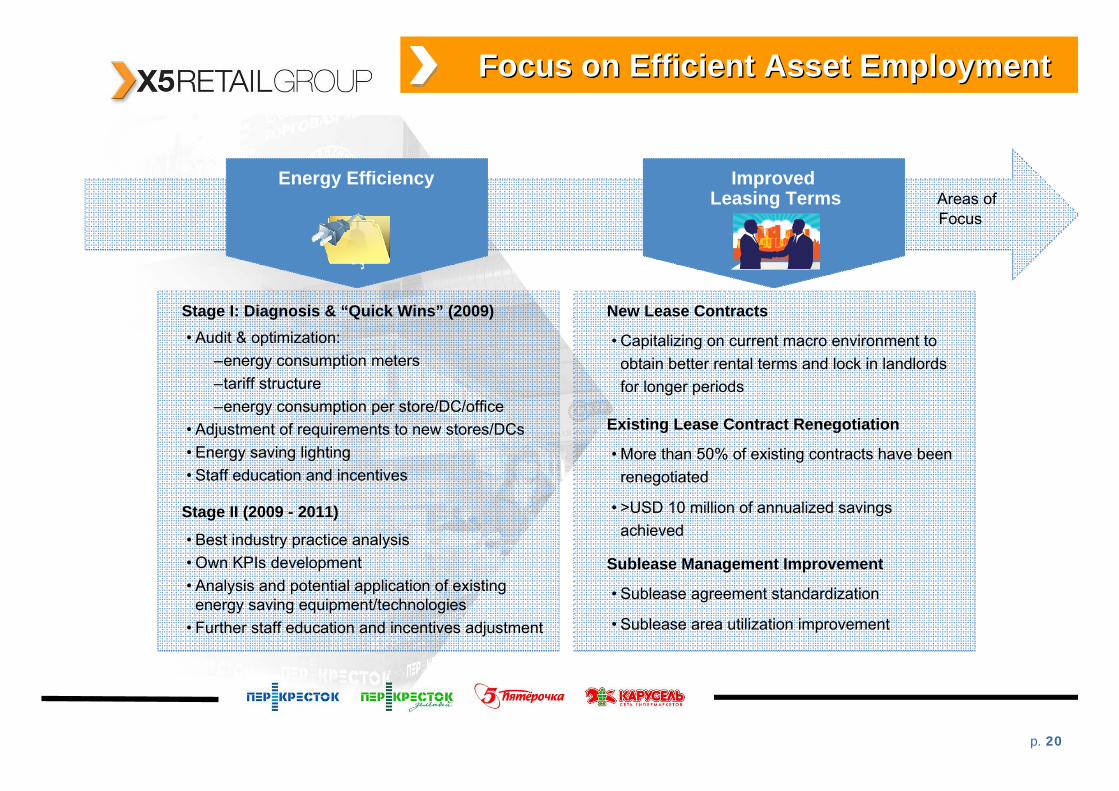
Focus on Efficient Asset EmploymentFocus on Efficient Asset Employment
Areas ofEnergy Efficiency
Focus
Improved Leasing Terms
Stage I: Diagnosis & “Quick Wins” (2009)• Audit & optimization:
–energy consumption meters–tariff structure–energy consumption per store/DC/office
• Adjustment of requirements to new stores/DCs• Energy saving lighting• Staff education and incentives
Stage II (2009 - 2011)
• Best industry practice analysis • Own KPIs development • Analysis and potential application of existing
energy saving equipment/technologies• Further staff education and incentives adjustment
New Lease Contracts
• Capitalizing on current macro environment to obtain better rental terms and lock in landlords for longer periods
Existing Lease Contract Renegotiation
• More than 50% of existing contracts have been renegotiated
• >USD 10 million of annualized savings achieved
Sublease Management Improvement
• Sublease agreement standardization
• Sublease area utilization improvement
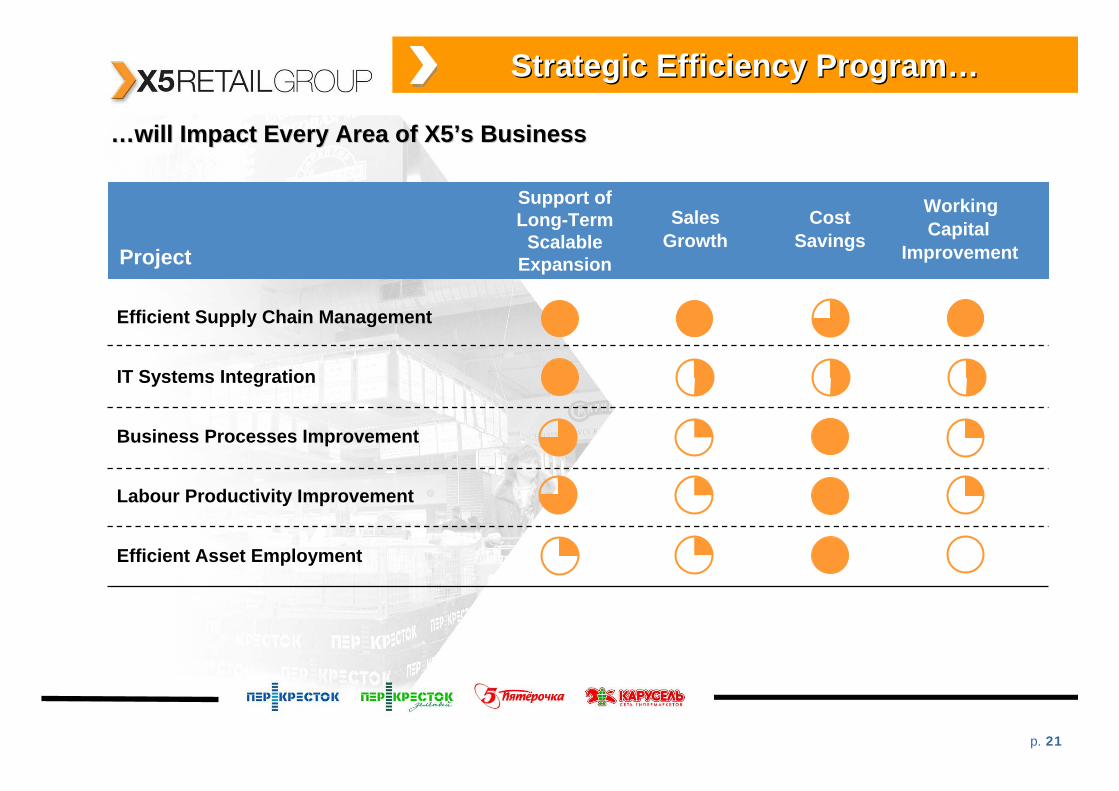
p. 21
Strategic Efficiency ProgramStrategic Efficiency Program……
……will Impact Every Area of X5will Impact Every Area of X5’’s Businesss Business
SalesGrowth
CostSavings
WorkingCapital
Improvement
Efficient Supply Chain Management
IT Systems Integration
Business Processes Improvement
Labour Productivity Improvement
Efficient Asset Employment
Support of Long-Term
Scalable ExpansionProject
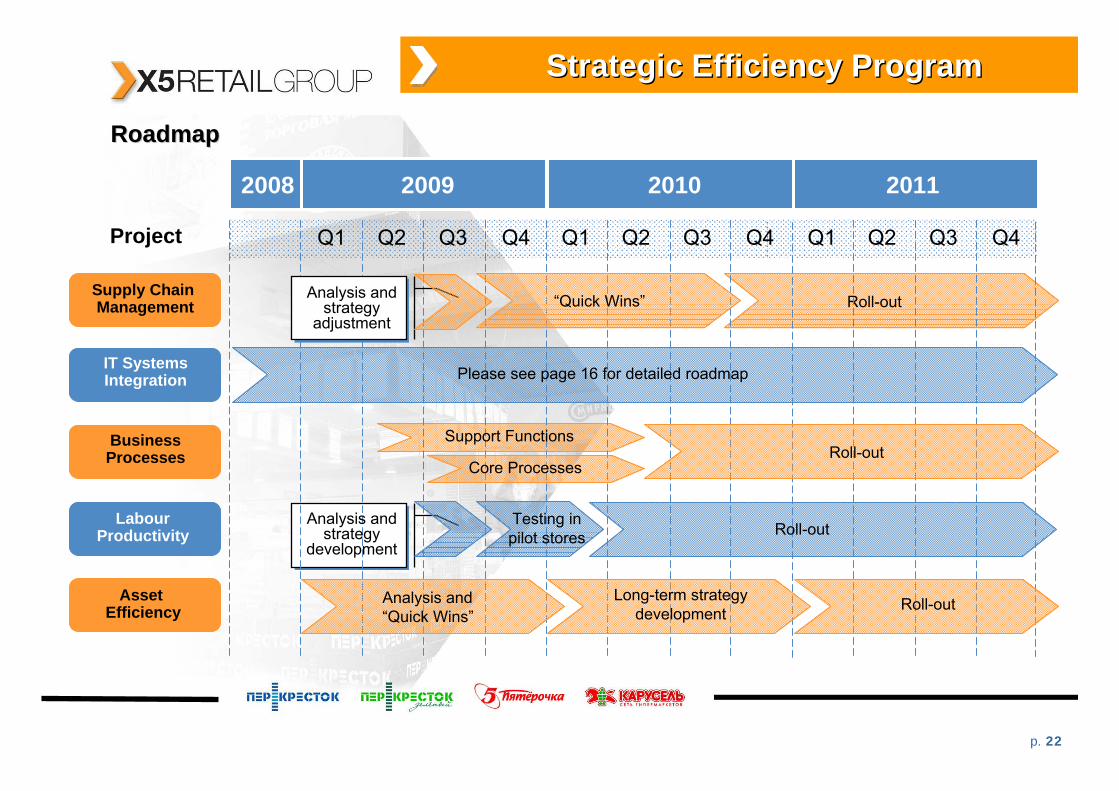
p. 22
Strategic Efficiency ProgramStrategic Efficiency Program
RoadmapRoadmap
IT SystemsIntegration
2008 2009 2010
Q1 Q2 Q3 Q4
Supply Chain Management Roll-out
Asset Efficiency
LabourProductivity
2011
Business Processes
Project Q1 Q2 Q3 Q4 Q1 Q2 Q3 Q4
Analysis and strategy
adjustment“Quick Wins”
Please see page 16 for detailed roadmap
Support Functions
Core Processes
Analysis and strategy
development
Testing inpilot stores Roll-out
Analysis and “Quick Wins”
Long-term strategy development Roll-out
Roll-out
p. 23
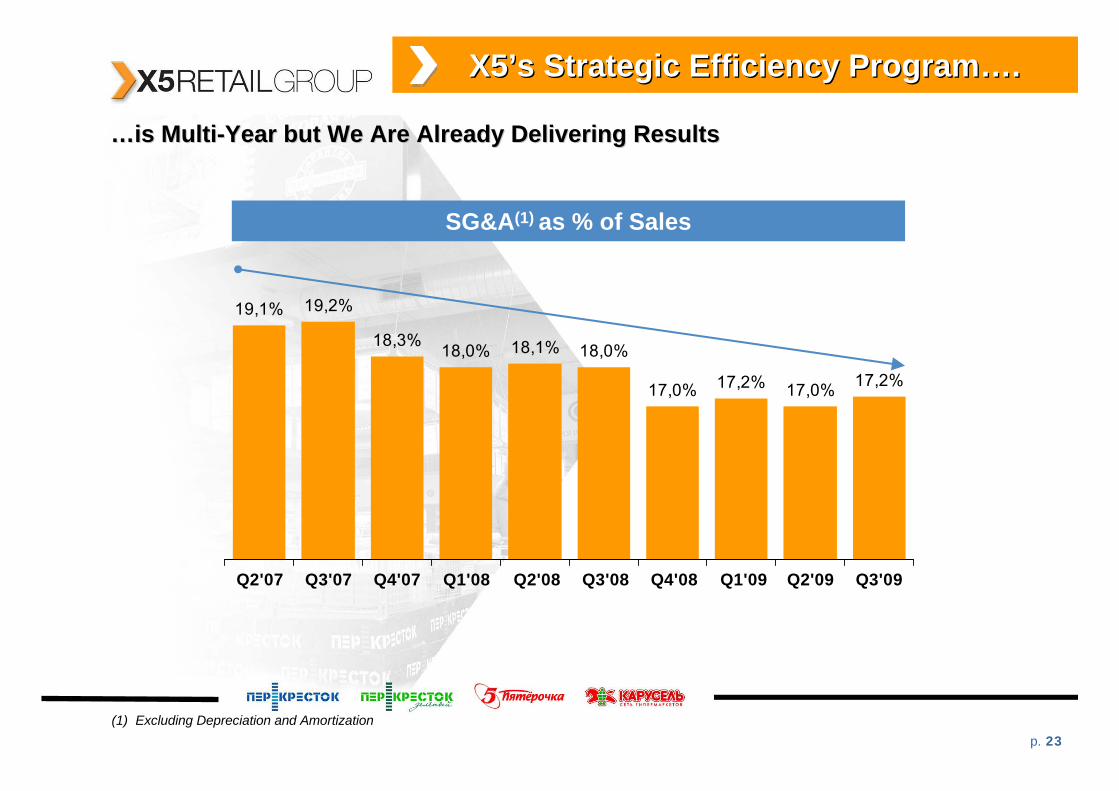
X5X5’’s Strategic Efficiency Programs Strategic Efficiency Program……..
……is Multiis Multi--Year but We Are Already Delivering ResultsYear but We Are Already Delivering Results
(1) Excluding Depreciation and Amortization
19,1% 19,2%
18,3% 18,0% 18,1% 18,0%
17,0% 17,2% 17,0% 17,2%
Q2'07 Q3'07 Q4'07 Q1'08 Q2'08 Q3'08 Q4'08 Q1'09 Q2'09 Q3'09
SG&A(1) as % of Sales
p. 24
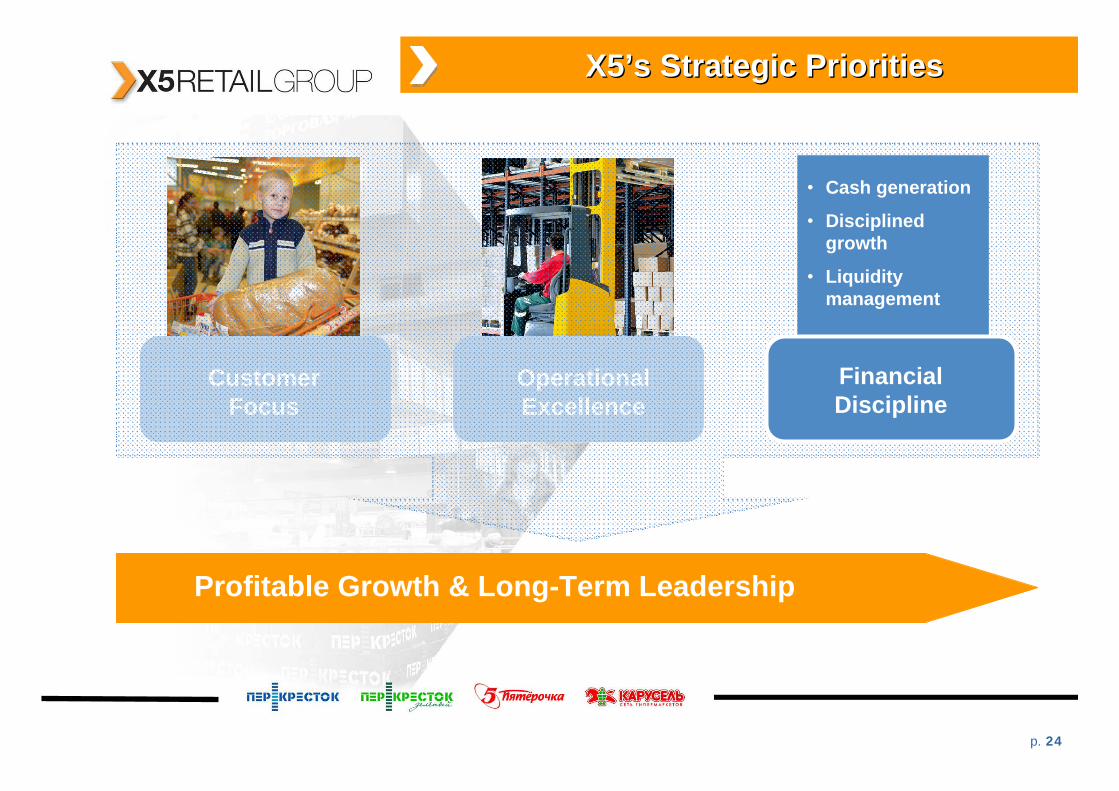
X5X5’’s Strategic s Strategic PrioritiesPriorities
Customer Focus
Operational Excellence
Profitable Growth & Long-Term Leadership
Financial Discipline
• Cash generation
• Disciplined growth
• Liquidity management
p. 25
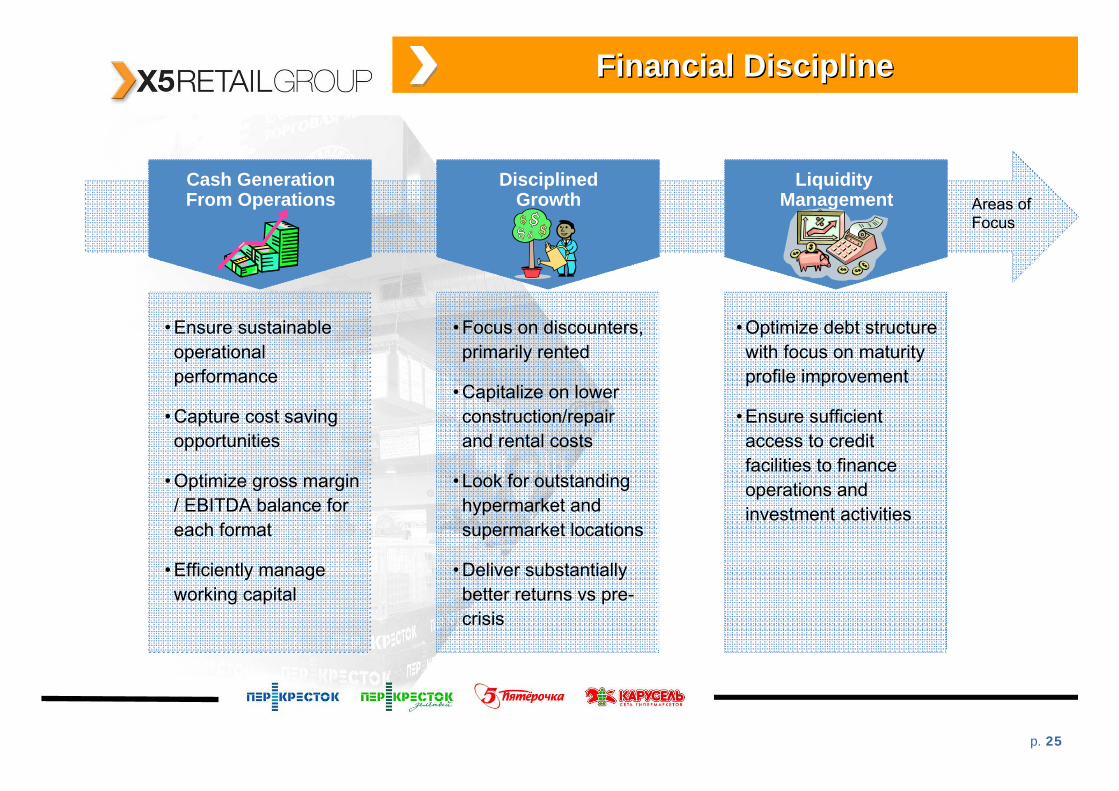
Financial DisciplineFinancial Discipline
Cash GenerationFrom Operations
DisciplinedGrowth
Liquidity Management Areas of
Focus
• Ensure sustainable operational performance
• Capture cost saving opportunities
• Optimize gross margin / EBITDA balance for each format
• Efficiently manage working capital
• Focus on discounters, primarily rented
• Capitalize on lower construction/repair and rental costs
• Look for outstanding hypermarket and supermarket locations
• Deliver substantially better returns vs pre-crisis
• Optimize debt structure with focus on maturity profile improvement
• Ensure sufficient access to credit facilities to finance operations and investment activities
p. 26
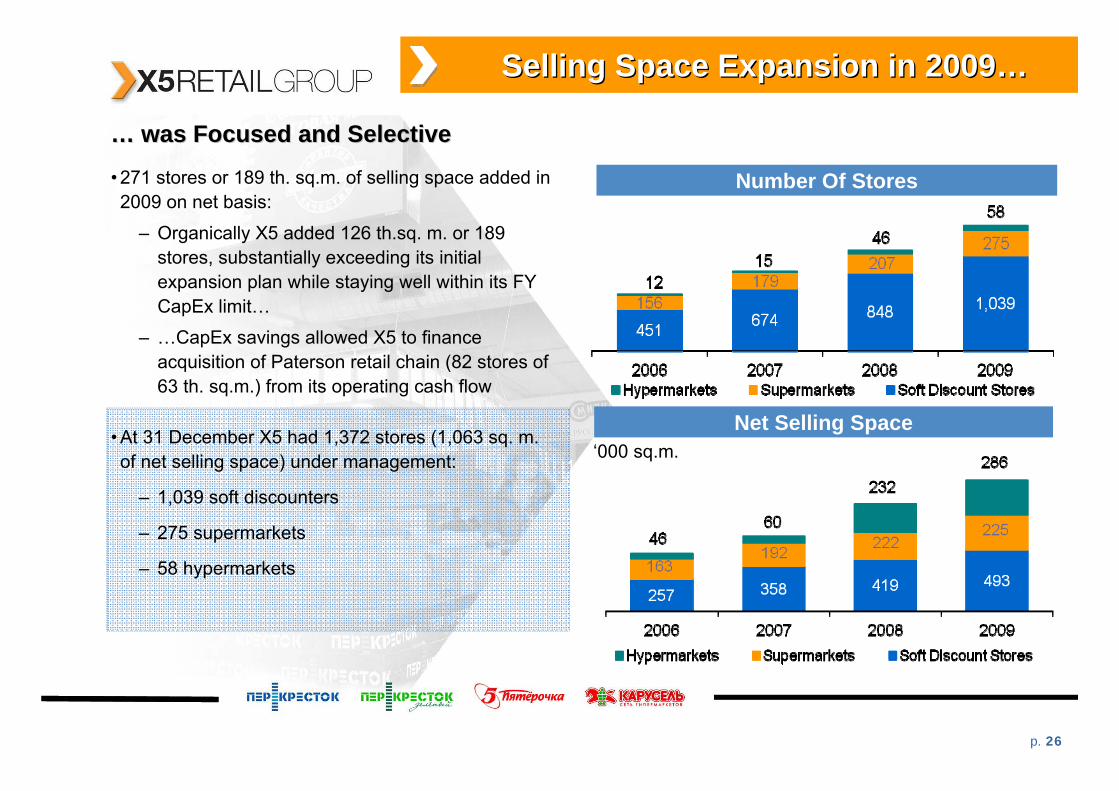
Selling Space Expansion in 2009Selling Space Expansion in 2009……
• 271 stores or 189 th. sq.m. of selling space added in 2009 on net basis:
– Organically X5 added 126 th.sq. m. or 189 stores, substantially exceeding its initial expansion plan while staying well within its FY CapEx limit…
– …CapEx savings allowed X5 to finance acquisition of Paterson retail chain (82 stores of 63 th. sq.m.) from its operating cash flow
• At 31 December X5 had 1,372 stores (1,063 sq. m. of net selling space) under management:
– 1,039 soft discounters
– 275 supermarkets
– 58 hypermarkets
Number Of Stores
Net Selling Space‘000 sq.m.
…… was Focused and Selectivewas Focused and Selective
p. 27
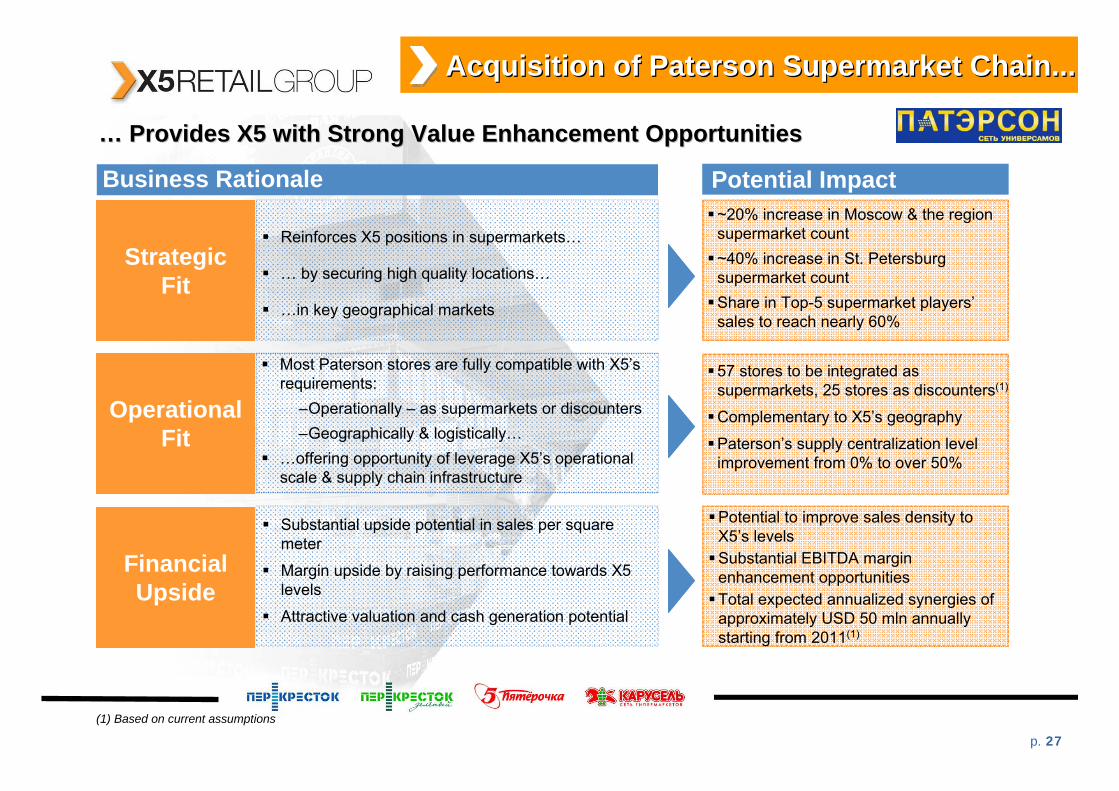
Acquisition of Paterson Supermarket Chain... Acquisition of Paterson Supermarket Chain...
…… Provides X5 with Strong Value Enhancement OpportunitiesProvides X5 with Strong Value Enhancement Opportunities
~20% increase in Moscow & the region supermarket count ~40% increase in St. Petersburg supermarket countShare in Top-5 supermarket players’sales to reach nearly 60%
57 stores to be integrated as supermarkets, 25 stores as discounters(1)
Complementary to X5’s geography
Paterson’s supply centralization level improvement from 0% to over 50%
OperationalFit
FinancialUpside
Strategic Fit
Substantial upside potential in sales per square meter
Margin upside by raising performance towards X5 levels
Attractive valuation and cash generation potential
Most Paterson stores are fully compatible with X5’s requirements:
–Operationally – as supermarkets or discounters–Geographically & logistically…
…offering opportunity of leverage X5’s operational scale & supply chain infrastructure
Reinforces X5 positions in supermarkets…
… by securing high quality locations…
…in key geographical markets
Potential to improve sales density to X5’s levelsSubstantial EBITDA margin enhancement opportunities Total expected annualized synergies of approximately USD 50 mln annually starting from 2011(1)
Business Rationale Potential Impact
(1) Based on current assumptions

p. 28
Performance Improvement RoadmapPerformance Improvement Roadmap
Paterson performance can be substantially improved by raising sales density and EBITDA margin through rebranding, integration and application of X5’s efficiency programs
▲Full impact of synergies▲EBITDA margin at Perekrestokand Pyaterochka levels
▲Opex optimization and post-integration synergies
▼Short-term closing of stores for integration
▼One-off integration costs
7.4%(2)EBITDA Margin
Gross margin dynamics in line with Perekrestok and Pyaterochka
▼Margin investment in customer loyalty, to retain customers and support stores re-launch
27.9%(2)Gross Margin
▲Sales per sq.m. normalizing at Perekrestok and Pyaterochkalevels
▲Early benefits of re-branding▲Competitive pricing to drive sales
density▼Short-term closing of stores for re-
branding, integration and IT upgrade
10,968Net Sales(RUR mln)
2011201012 Months to
Sep-09(1)
(1) Q4 2008 + Q1 to Q3 2009; (2) Adjusted in line with X5’s reporting policySource: company data: RGAAP financial statements, management accounts
p. 29
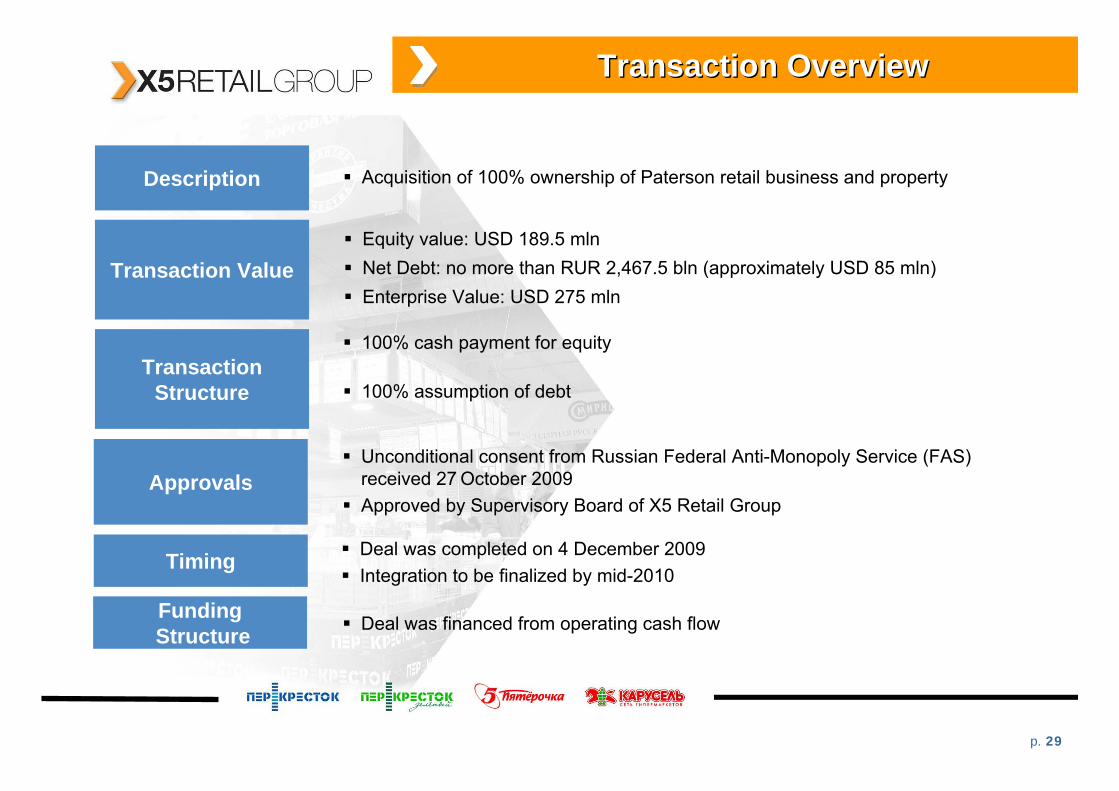
Transaction OverviewTransaction Overview
Transaction Value
Description
Approvals
Timing
FundingStructure
Acquisition of 100% ownership of Paterson retail business and property
Equity value: USD 189.5 mlnNet Debt: no more than RUR 2,467.5 bln (approximately USD 85 mln)Enterprise Value: USD 275 mln
100% cash payment for equity
100% assumption of debt
Unconditional consent from Russian Federal Anti-Monopoly Service (FAS) received 27 October 2009Approved by Supervisory Board of X5 Retail Group
Deal was completed on 4 December 2009Integration to be finalized by mid-2010
Deal was financed from operating cash flow
TransactionStructure
p. 30
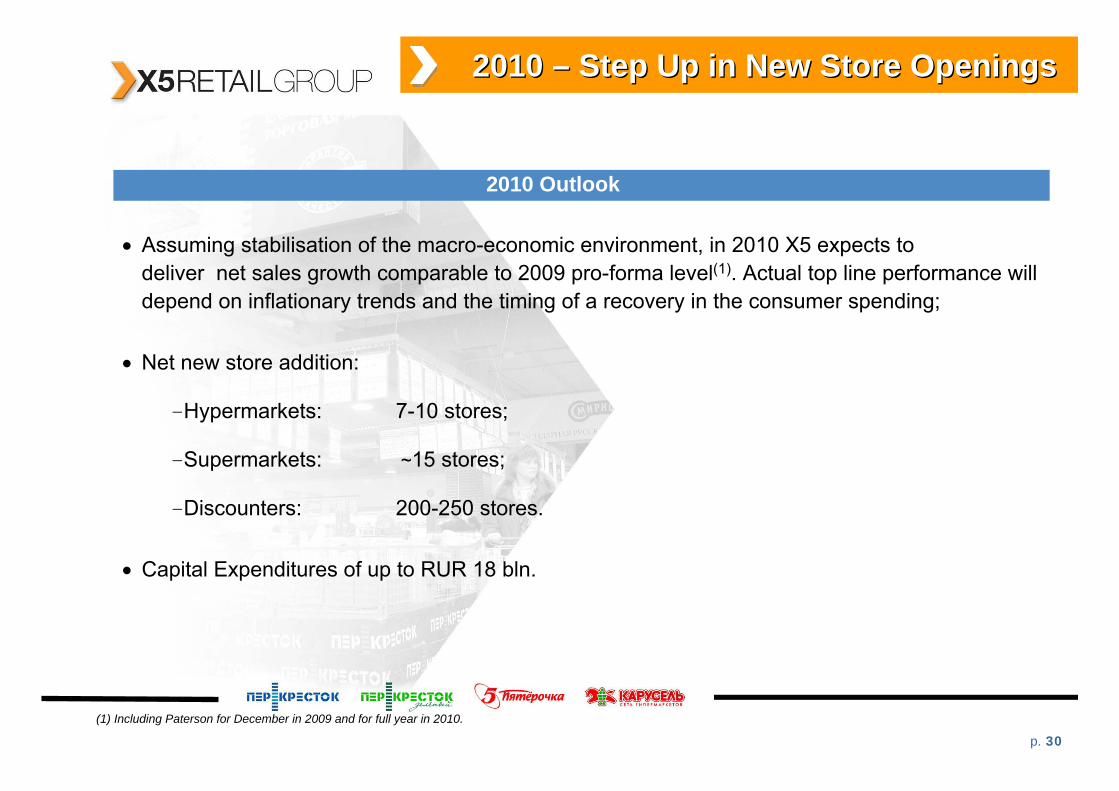
2010 2010 –– Step Up in New Store OpeningsStep Up in New Store Openings
2010 Outlook
• Assuming stabilisation of the macro-economic environment, in 2010 X5 expects to deliver net sales growth comparable to 2009 pro-forma level(1). Actual top line performance will depend on inflationary trends and the timing of a recovery in the consumer spending;
• Net new store addition:
-Hypermarkets: 7-10 stores;
-Supermarkets: ~15 stores;
-Discounters: 200-250 stores.
• Capital Expenditures of up to RUR 18 bln.
(1) Including Paterson for December in 2009 and for full year in 2010.
p. 31
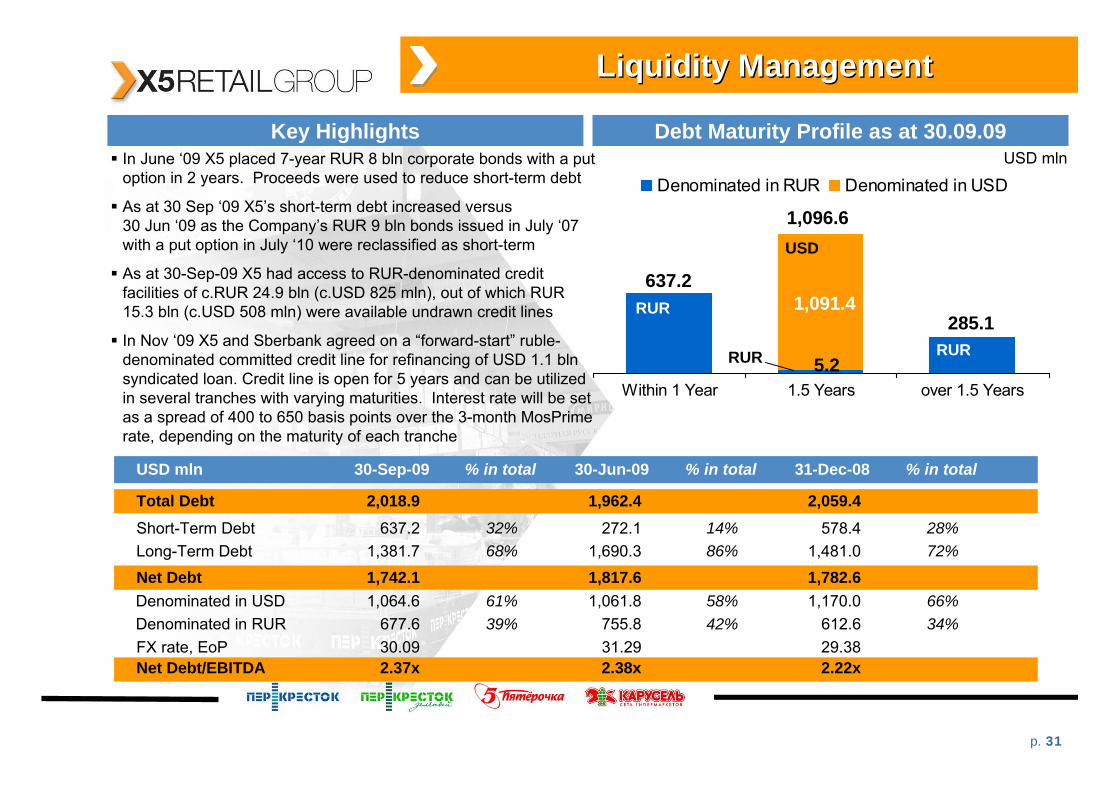
Within 1 Year 1.5 Years over 1.5 Years
Denominated in RUR Denominated in USD
Liquidity ManagementLiquidity Management
Debt Maturity Profile as at 30.09.09
637.2
1,096.6
285.11,091.4
5.2
USD
RUR
RUR RUR
In June ‘09 X5 placed 7-year RUR 8 bln corporate bonds with a put option in 2 years. Proceeds were used to reduce short-term debt
As at 30 Sep ‘09 X5’s short-term debt increased versus 30 Jun ‘09 as the Company’s RUR 9 bln bonds issued in July ‘07 with a put option in July ‘10 were reclassified as short-term
As at 30-Sep-09 X5 had access to RUR-denominated credit facilities of c.RUR 24.9 bln (c.USD 825 mln), out of which RUR 15.3 bln (c.USD 508 mln) were available undrawn credit lines
In Nov ‘09 X5 and Sberbank agreed on a “forward-start” ruble-denominated committed credit line for refinancing of USD 1.1 blnsyndicated loan. Credit line is open for 5 years and can be utilized in several tranches with varying maturities. Interest rate will be set as a spread of 400 to 650 basis points over the 3-month MosPrimerate, depending on the maturity of each tranche
USD mln 30-Sep-09 % in total 30-Jun-09 % in total 31-Dec-08 % in total
Total Debt 2,018.9 1,962.4 2,059.4Short-Term Debt 637.2 32% 272.1 14% 578.4 28%Long-Term Debt 1,381.7 68% 1,690.3 86% 1,481.0 72%
Net Debt 1,742.1 1,817.6 1,782.6Denominated in USD 1,064.6 61% 1,061.8 58% 1,170.0 66%Denominated in RUR 677.6 39% 755.8 42% 612.6 34%FX rate, EoP 30.09 31.29 29.38Net Debt/EBITDA 2.37x 2.38x 2.22x
Key HighlightsUSD mln
p. 32
AgendaAgenda
I. X5 Retail Group – Profitable Growth and Long-Term Leadership
• X5’s Strategic Priorities
• 2009 Performance
• 2010 Growth Outlook
II. Q3 & 9M 2009 Financial Highlights
Appendices
p. 33
Q3 2008 Q3 2009
Net Profit, USD mlnNet Margin, %
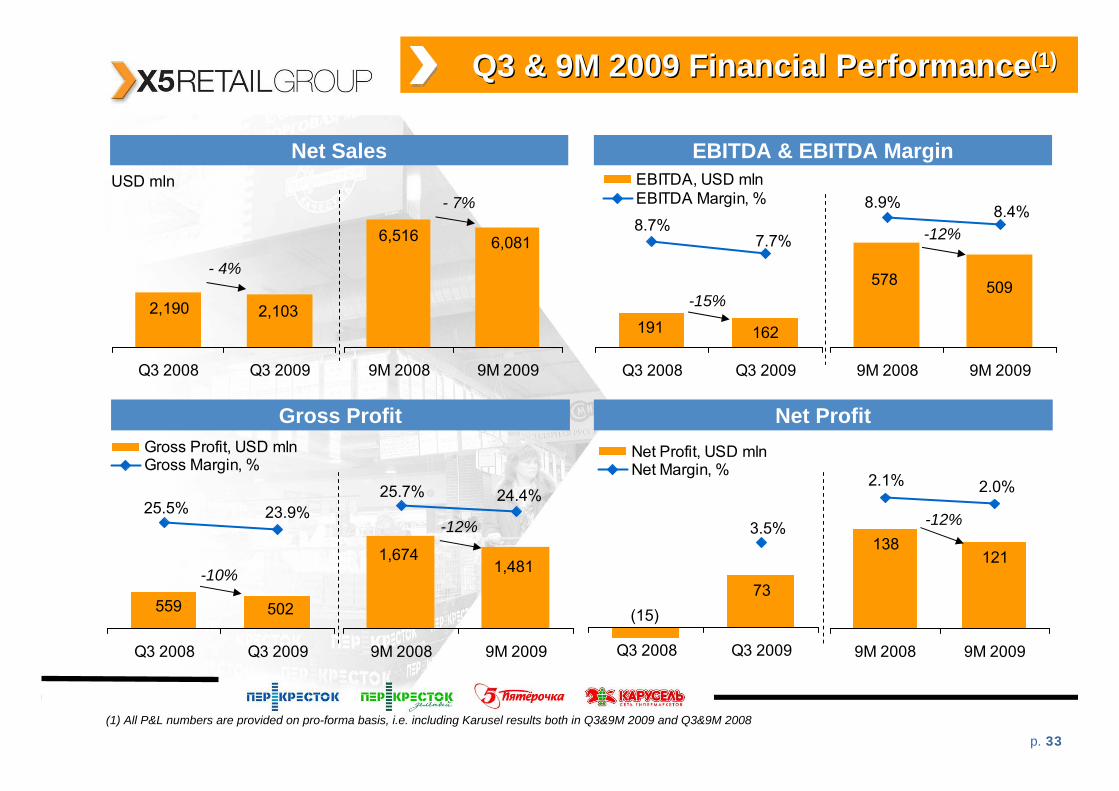
Q3 & 9M 2009 Financial PerformanceQ3 & 9M 2009 Financial Performance(1)(1)
Net Profit
EBITDA & EBITDA Margin
Gross Profit
Net Sales
9M 2008 9M 2009
9M 2008 9M 2009
-12%
9M 2008 9M 2009
USD mln
9M 2008 9M 2009
- 7%
-12%
Q3 2008 Q3 2009
Q3 2008 Q3 2009
Gross Profit, USD mlnGross Margin, %
Q3 2008 Q3 2009
EBITDA, USD mlnEBITDA Margin, %
502559
25.5% 23.9%25.7% 24.4%
1,4811,674
-10%
2,1032,190
- 4%6,0816,516 8.7%
7.7%
162191-15%
509578
8.9% 8.4%
73(15)
121138
3.5%
2.1% 2.0%
-12%
(1) All P&L numbers are provided on pro-forma basis, i.e. including Karusel results both in Q3&9M 2009 and Q3&9M 2008
p. 34
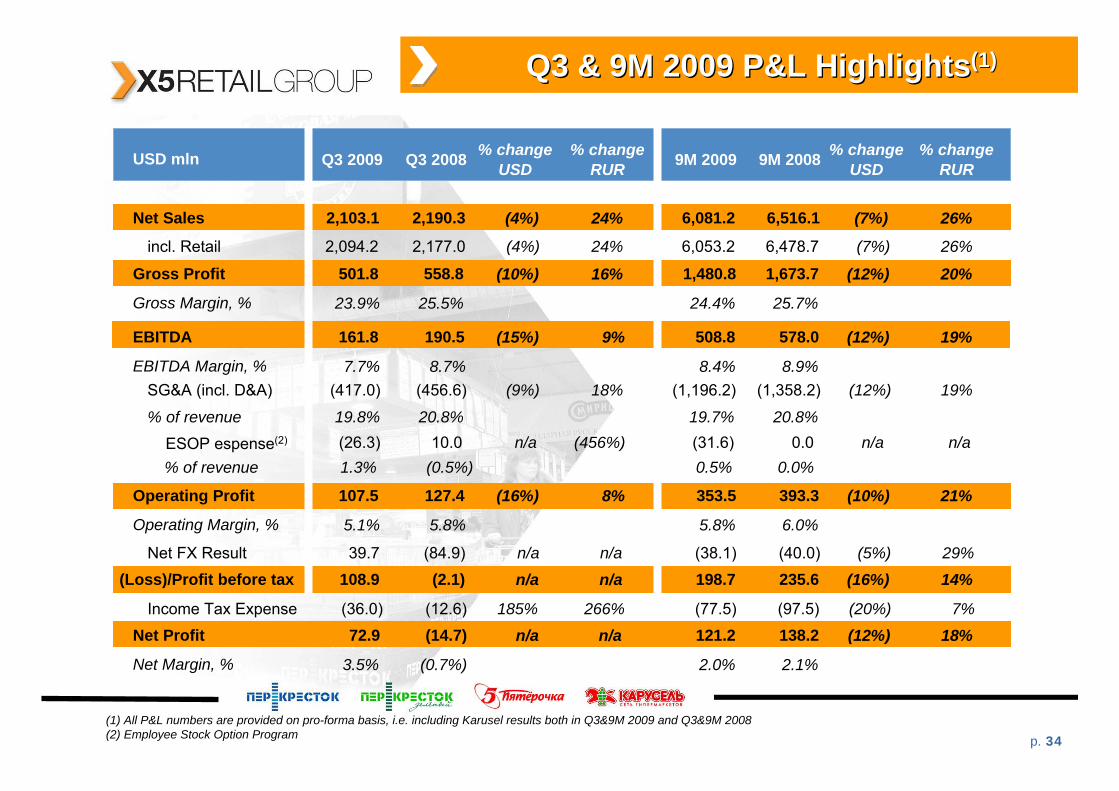
Q3 & 9M 200Q3 & 9M 20099 P&L HighlightsP&L Highlights(1) (1)
(1) All P&L numbers are provided on pro-forma basis, i.e. including Karusel results both in Q3&9M 2009 and Q3&9M 2008(2) Employee Stock Option Program
Q3 2009 Q3 2008 % changeUSD
% changeRUR 9M 2009 9M 2008 % change
USD% change
RUR
2,103.1 2,190.3 (4%) 24% 6,081.2 6,516.1 (7%) 26%
incl. Retail 2,094.2 2,177.0 (4%) 24% 6,053.2 6,478.7 (7%) 26%
501.8 558.8 (10%) 16% 1,480.8 1,673.7 (12%) 20%
Gross Margin, % 23.9% 25.5% 24.4% 25.7%
161.8 190.5 (15%) 9% 508.8 578.0 (12%) 19%
EBITDA Margin, % 7.7% 8.7% 8.4% 8.9%
107.5 127.4 (16%) 8% 353.5 393.3 (10%) 21%
Operating Margin, % 5.1% 5.8% 5.8% 6.0%
Net FX Result 39.7 (84.9) n/a n/a (38.1) (40.0) (5%) 29%
(Loss)/Profit before tax 108.9 (2.1) n/a n/a 198.7 235.6 (16%) 14%
Income Tax Expense (36.0) (12.6) 185% 266% (77.5) (97.5) (20%) 7%
72.9 (14.7) n/a n/a 121.2 138.2 (12%) 18%
Net Margin, % 3.5% (0.7%) 2.0% 2.1%
Net Profit
EBITDA
Operating Profit
USD mln
Net Sales
Gross Profit
SG&A (incl. D&A) (417.0) (456.6) (9%) 18% (1,196.2) (1,358.2) (12%) 19%
% of revenue 19.8% 20.8% 19.7% 20.8%
ESOP espense(2) (26.3) 10.0 n/a (456%) (31.6) 0.0 n/a n/a% of revenue 1.3% (0.5%) 0.5% 0.0%
p. 35
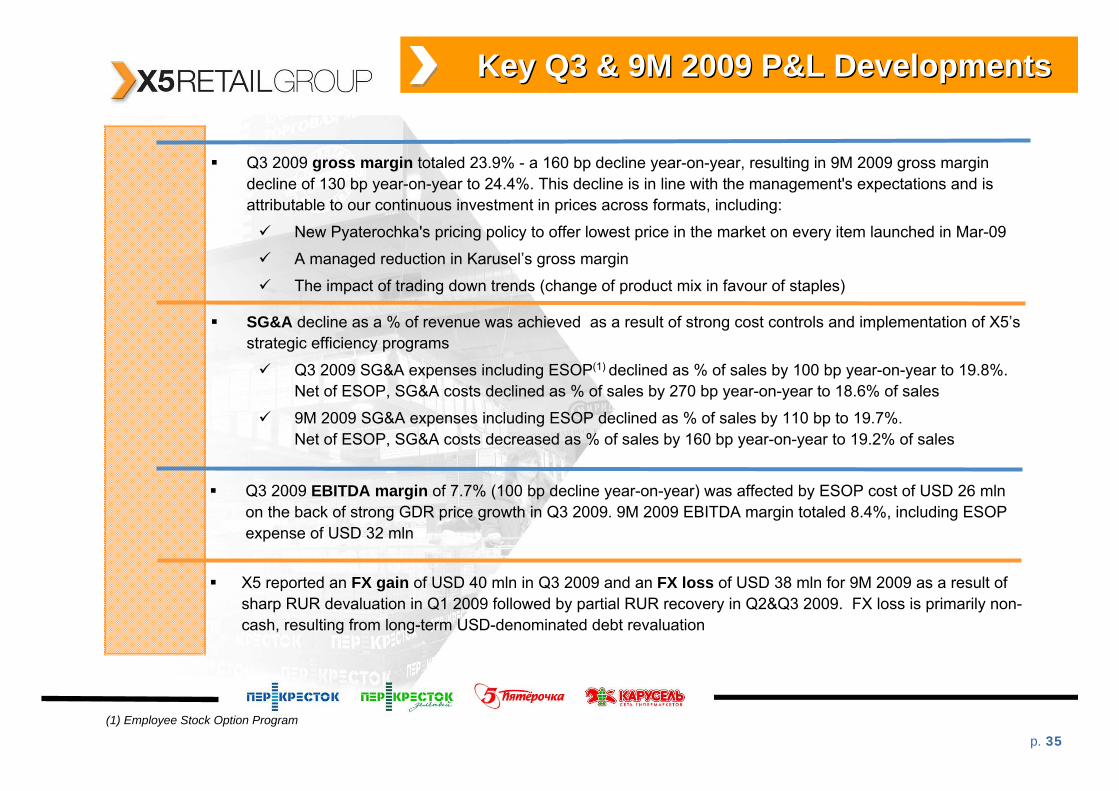
Key Q3 & 9M 2009 P&L DevelopmentsKey Q3 & 9M 2009 P&L Developments
Q3 2009 gross margin totaled 23.9% - a 160 bp decline year-on-year, resulting in 9M 2009 gross margin decline of 130 bp year-on-year to 24.4%. This decline is in line with the management's expectations and is attributable to our continuous investment in prices across formats, including:
New Pyaterochka's pricing policy to offer lowest price in the market on every item launched in Mar-09
A managed reduction in Karusel’s gross margin
The impact of trading down trends (change of product mix in favour of staples)
Q3 2009 EBITDA margin of 7.7% (100 bp decline year-on-year) was affected by ESOP cost of USD 26 mlnon the back of strong GDR price growth in Q3 2009. 9M 2009 EBITDA margin totaled 8.4%, including ESOP expense of USD 32 mln
SG&A decline as a % of revenue was achieved as a result of strong cost controls and implementation of X5’s strategic efficiency programs
Q3 2009 SG&A expenses including ESOP(1) declined as % of sales by 100 bp year-on-year to 19.8%. Net of ESOP, SG&A costs declined as % of sales by 270 bp year-on-year to 18.6% of sales
9M 2009 SG&A expenses including ESOP declined as % of sales by 110 bp to 19.7%. Net of ESOP, SG&A costs decreased as % of sales by 160 bp year-on-year to 19.2% of sales
X5 reported an FX gain of USD 40 mln in Q3 2009 and an FX loss of USD 38 mln for 9M 2009 as a result of sharp RUR devaluation in Q1 2009 followed by partial RUR recovery in Q2&Q3 2009. FX loss is primarily non-cash, resulting from long-term USD-denominated debt revaluation
(1) Employee Stock Option Program
p. 36
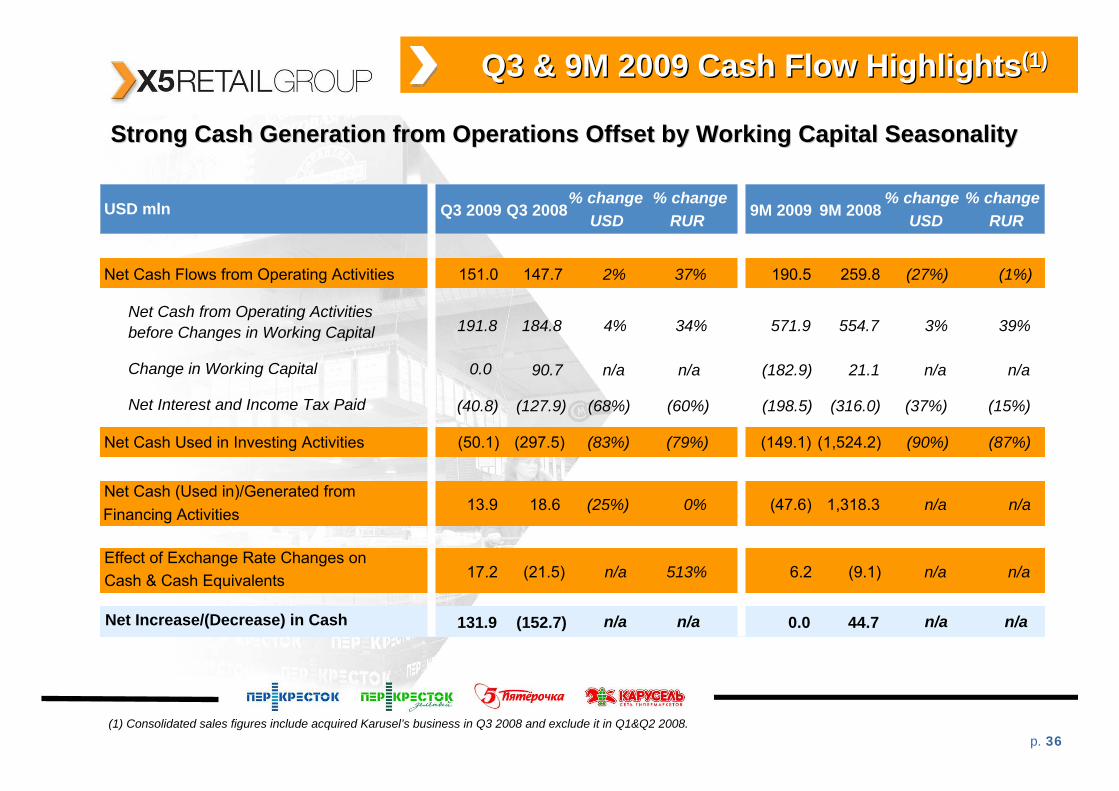
Q3 & 9M 2009 Cash Flow HighlightsQ3 & 9M 2009 Cash Flow Highlights(1)(1)
Strong Cash Generation from Operations Offset by Working CapitalStrong Cash Generation from Operations Offset by Working Capital SeasonalitySeasonality
USD mln Q3 2009 Q3 2008% change
USD
Net Cash Flows from Operating Activities 151.0 147.7 2%
Net Cash from Operating Activitiesbefore Changes in Working Capital 191.8 184.8 4%
Change in Working Capital 0.0 90.7 n/a
Net Interest and Income Tax Paid (40.8) (127.9) (68%)
Net Cash Used in Investing Activities (50.1) (297.5) (83%)
Net Cash (Used in)/Generated fromFinancing Activities 13.9 18.6 (25%)
Effect of Exchange Rate Changes onCash & Cash Equivalents 17.2 (21.5) n/a
Net Increase/(Decrease) in Cash 131.9 (152.7) n/a
% changeRUR
37%
34%
n/a
(60%)
(79%)
0%
513%
n/a
(1) Consolidated sales figures include acquired Karusel’s business in Q3 2008 and exclude it in Q1&Q2 2008.
9M 2009 9M 2008% change
USD
190.5 259.8 (27%)
571.9 554.7 3%
(182.9) 21.1 n/a
(198.5) (316.0) (37%)
(149.1) (1,524.2) (90%)
(47.6) 1,318.3 n/a
6.2 (9.1) n/a
0.0 44.7 n/a
% changeRUR
(1%)
39%
n/a
(15%)
(87%)
n/a
n/a
n/a
p. 37
AgendaAgenda
I. X5 Retail Group – Profitable Growth and Long-Term Leadership
• X5’s Strategic Priorities
• 2009 Performance
• 2010 Growth Outlook
II. Q3 & 9M 2009 Financial Highlights
Appendices
p. 38
1,328
3,054
423
2,702
452
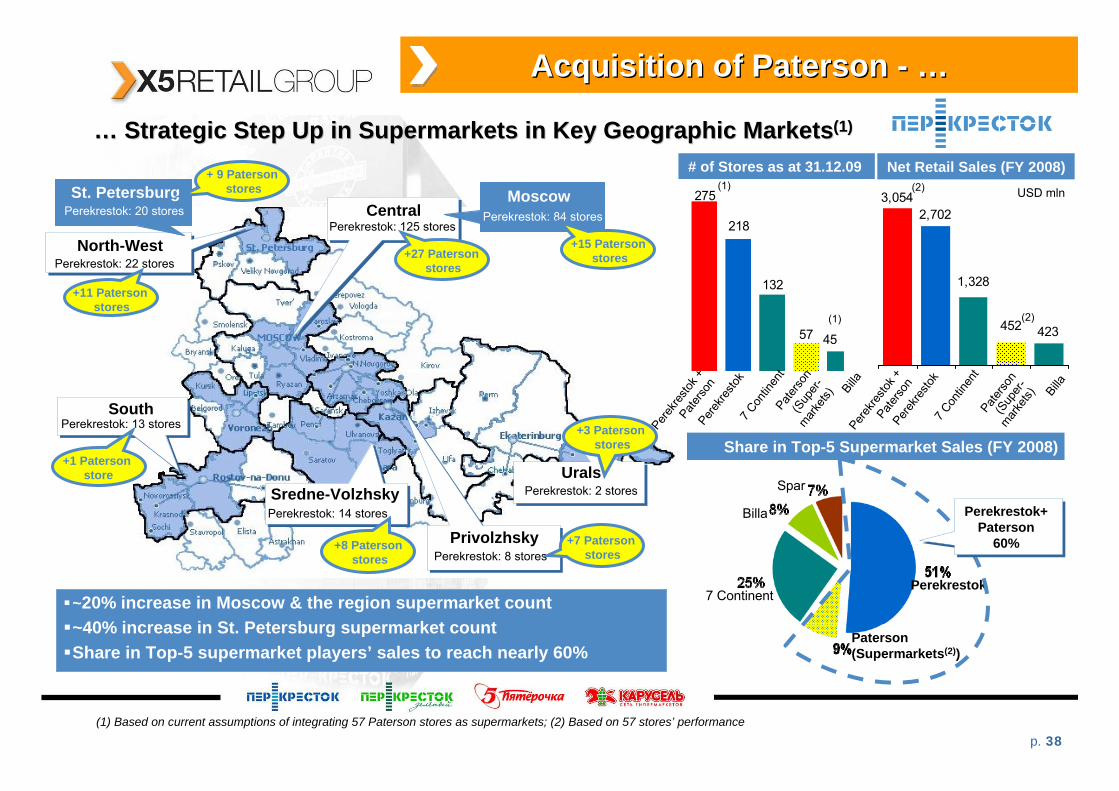
Acquisition of Paterson Acquisition of Paterson -- ……
…… Strategic Step Up in Supermarkets in Key Geographic MarketsStrategic Step Up in Supermarkets in Key Geographic Markets(1)(1)
(1) Based on current assumptions of integrating 57 Paterson stores as supermarkets; (2) Based on 57 stores’ performance
USD mln
# of Stores as at 31.12.09
Share in Top-5 Supermarket Sales (FY 2008)
Net Retail Sales (FY 2008)
275
218
132
57 45
Perek
resto
k7 C
ontin
ent
Paterso
n(S
uper
-mar
kets)
Billa
(1)
(1)
Perek
resto
k +Pate
rson
Perek
resto
k7 C
ontin
ent
Paterso
n(S
uper
-mar
kets) Billa
(2)
(2)
~20% increase in Moscow & the region supermarket count~40% increase in St. Petersburg supermarket countShare in Top-5 supermarket players’ sales to reach nearly 60%
North-West
Central
South
Sredne-VolzhskyUrals
Privolzhsky
Perekrestok: 125 stores
Perekrestok: 22 stores
Perekrestok: 13 stores
Perekrestok: 14 stores
Perekrestok: 8 stores
Perekrestok: 2 stores
MoscowPerekrestok: 84 stores
St. PetersburgPerekrestok: 20 stores
+27 Patersonstores
+15 Patersonstores
+ 9 Patersonstores
+11 Patersonstores
+1 Patersonstore
+8 Patersonstores
+7 Patersonstores
+3 Patersonstores
Perek
resto
k +Pate
rson
Paterson (Supermarkets(2))
Perekrestok7 Continent
Spar
Billa Perekrestok+Paterson
60%
p. 39
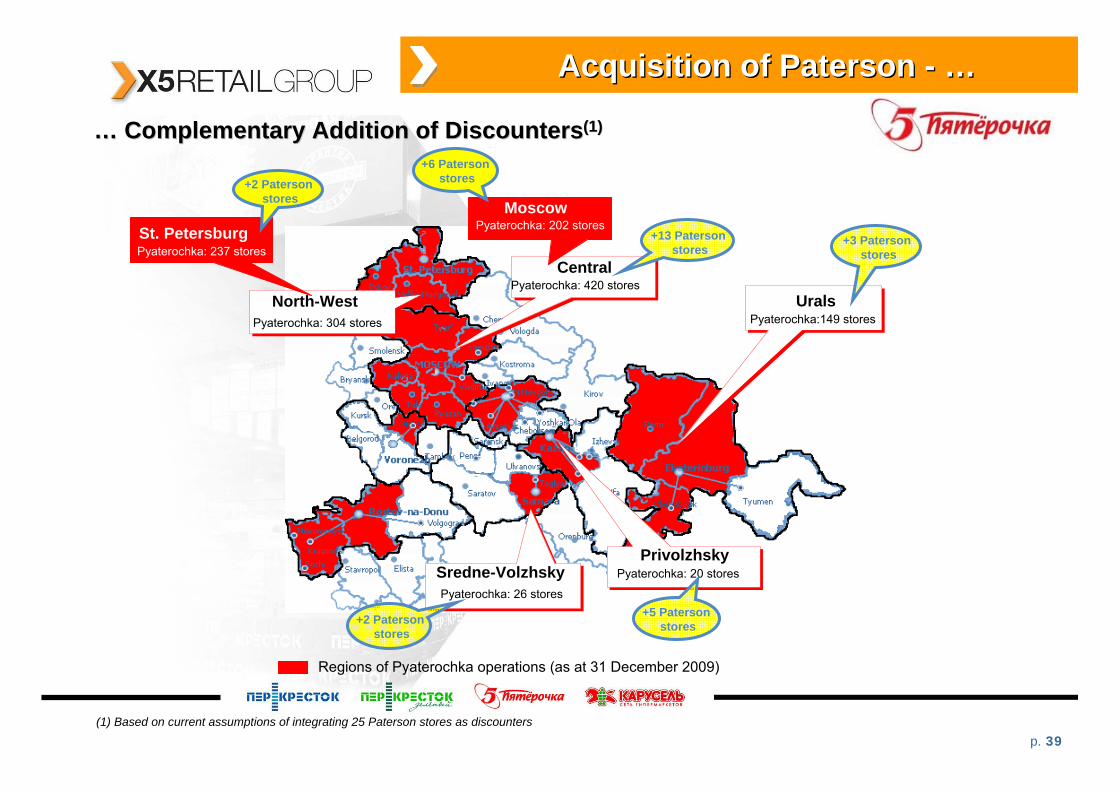
Acquisition of Paterson Acquisition of Paterson -- ……
(1) Based on current assumptions of integrating 25 Paterson stores as discounters
Regions of Pyaterochka operations (as at 31 December 2009)
Moscow
North-West
Central
Sredne-Volzhsky
Urals
Privolzhsky
Pyaterochka: 420 stores
Pyaterochka:149 stores
Pyaterochka: 20 stores
Pyaterochka: 26 stores
Pyaterochka: 304 stores
MoscowPyaterochka: 202 storesSt. Petersburg
Pyaterochka: 237 stores
+6 Patersonstores
+13 Patersonstores
+2 Patersonstores
+2 Patersonstores
+5 Patersonstores
+3 Patersonstores
…… Complementary Addition of DiscountersComplementary Addition of Discounters(1)(1)
p. 40
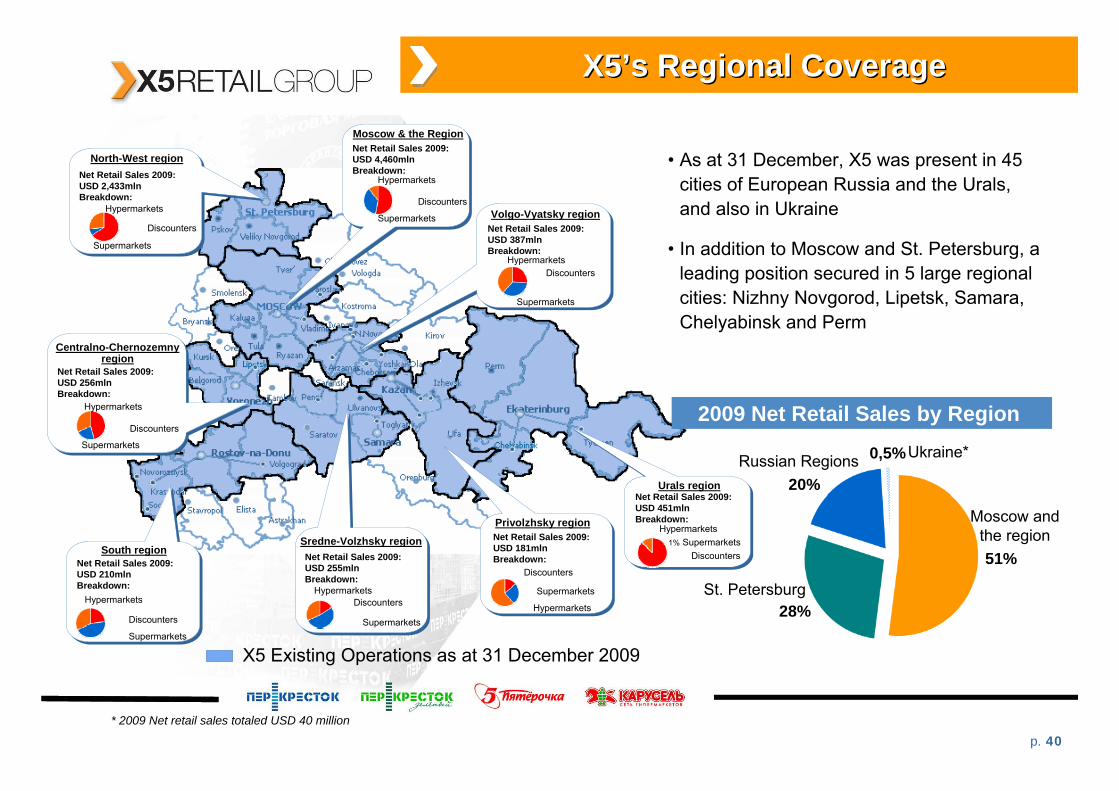
X5X5’’s Regional Coverages Regional Coverage
X5 Existing Operations as at 31 December 2009
Supermarkets
Discounters
Hypermarkets
Supermarkets
Discounters
HypermarketsSupermarkets
Discounters
Hypermarkets
Supermarkets
Discounters
Hypermarkets
Supermarkets
DiscountersHypermarkets
Supermarkets
DiscountersHypermarkets
Discounters
Hypermarkets
North-West region
Moscow & the Region
Volgo-Vyatsky region
Centralno-Chernozemnyregion
South regionSredne-Volzhsky region
Urals region
Privolzhsky region
Supermarkets
Hypermarkets
Discounters
2009 Net Retail Sales by Region
• As at 31 December, X5 was present in 45 cities of European Russia and the Urals, and also in Ukraine
• In addition to Moscow and St. Petersburg, a leading position secured in 5 large regional cities: Nizhny Novgorod, Lipetsk, Samara, Chelyabinsk and Perm
Moscow and the region
St. Petersburg
Russian Regions Ukraine*
Net Retail Sales 2009: USD 451mln Breakdown:
Net Retail Sales 2009: USD 4,460mln Breakdown:
Net Retail Sales 2009: USD 387mln Breakdown:
Net Retail Sales 2009: USD 181mln Breakdown:Net Retail Sales 2009:
USD 255mln Breakdown:
Net Retail Sales 2009: USD 210mln Breakdown:
Net Retail Sales 2009: USD 256mln Breakdown:
Net Retail Sales 2009: USD 2,433mln Breakdown:
* 2009 Net retail sales totaled USD 40 million
0,5%
20%
51%
28%
1% Supermarkets
p. 41
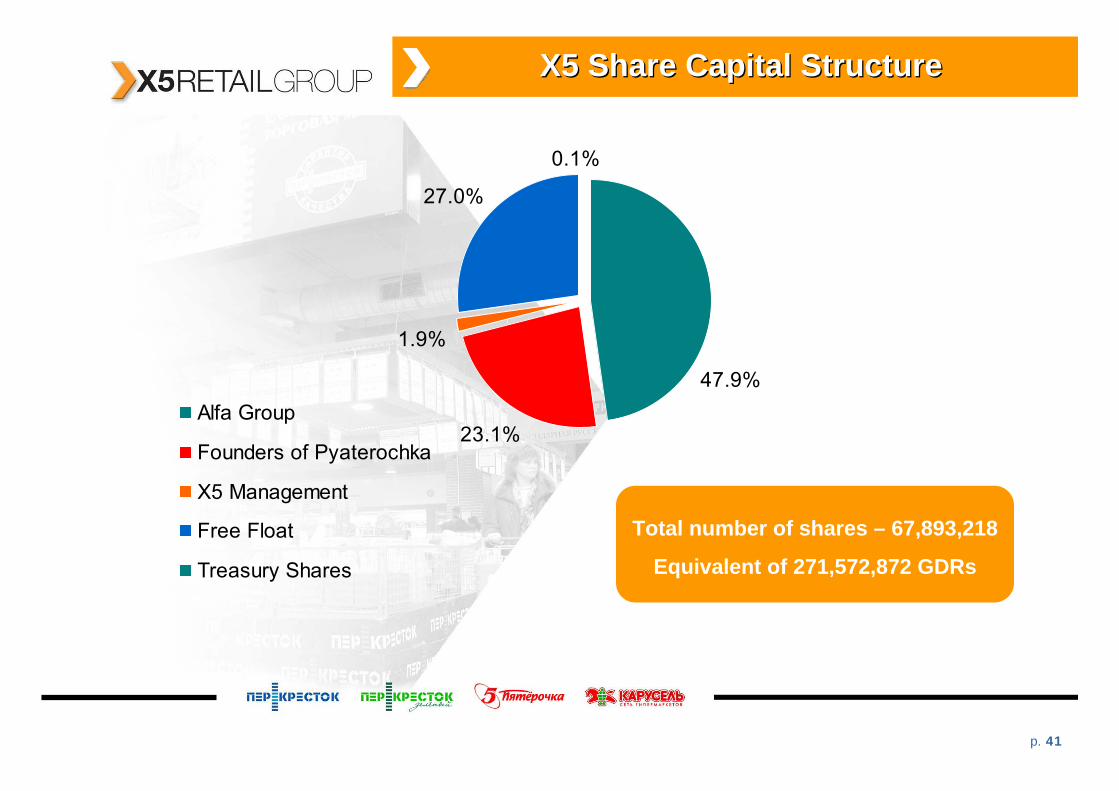
47.9%
23.1%
1.9%
27.0%
0.1%
Alfa Group
Founders of Pyaterochka
X5 Management
Free Float
Treasury Shares
X5 Share Capital StructureX5 Share Capital Structure
Total number of shares – 67,893,218
Equivalent of 271,572,872 GDRs
p. 42
Contact informationContact information
IR Department Contact DetailsIR Department Contact Details
Anna KarevaIR Director
X5 Retail Group N.V.28 bldg., 4, Sr. Kalitnikovskaya, Moscow, Russia
Tel.: +7 (495) 792 3511Mob.: +7 (903) 624 3234
E-mail: [email protected]: www.X5.ru
Maria KorotaevaIR Manager
X5 Retail Group N.V.28 bldg., 4, Sr. Kalitnikovskaya, Moscow, Russia
Tel.: +7 (495) 980 2729 ext. 22-450Mob.: +7 (926) 275 7841
E-mail: [email protected]: www.X5.ru

![AMG Investor Presentation March 2015.pptx [Read-Only] · 2017-02-17 · presentation does not form a part of, and should not be construed as, an offer, invitation or solicitation](https://img.pdfslide.us/doc/110x75/5ed19ee0b67ae8796d0efcfc/amg-investor-presentation-march-2015pptx-read-only-2017-02-17-presentation.jpg)