Embed Size (px)
Citation preview
Profitability of Value Investing Strategies in the South Korea Stock Market September 4, 2014
Sponsored by:
Value Partners Center for Investing
2 | 8 P a g e s
Profitability of Value Investing Strategies in the South Korea Stock Market
Introduction
This newsletter reports the performance of five value investing strategies based on a stock’s quantitative value measures in the South Korea stock market in the past 30 years. Four strategies significantly outperformed the aggregate stock market and handsomely rewarded investors in the period from January 1987 to December 2013.
Data Sample
We retrieve the daily total return index and market value of each stock and the aggregate South Korea stock market from Datastream. We also obtain accounting variables such as book value, earnings, cash flow, debt, and dividend from Worldscope. We exclude exchange-traded funds (ETFs) and warrants from our study and ignore the bottom one-third of stocks based on their market value in order to eliminate stocks that filed for bankruptcy each month. The sample period of our analysis is from January 1987 to December 2013. We measure a stock’s value by its book-to-market (B/M) ratio, dividend yield (DY), earnings-to-price (E/P) ratio, cash flow-to-price ratio (OCF), and leverage-to-price ratio (LP).
The Performance of Value Investing Strategies
We sort all stocks into five portfolios based on our five value measures at the end of each month. We then calculate both the equal- and value-weighted one-month future returns of each portfolio. The former is the simple average of the returns of all stocks in the portfolio whereas the latter is calculated by weighting each stock’s returns based on its market capitalization. This portfolio formation methodology implies that these five portfolios are rebalanced monthly.
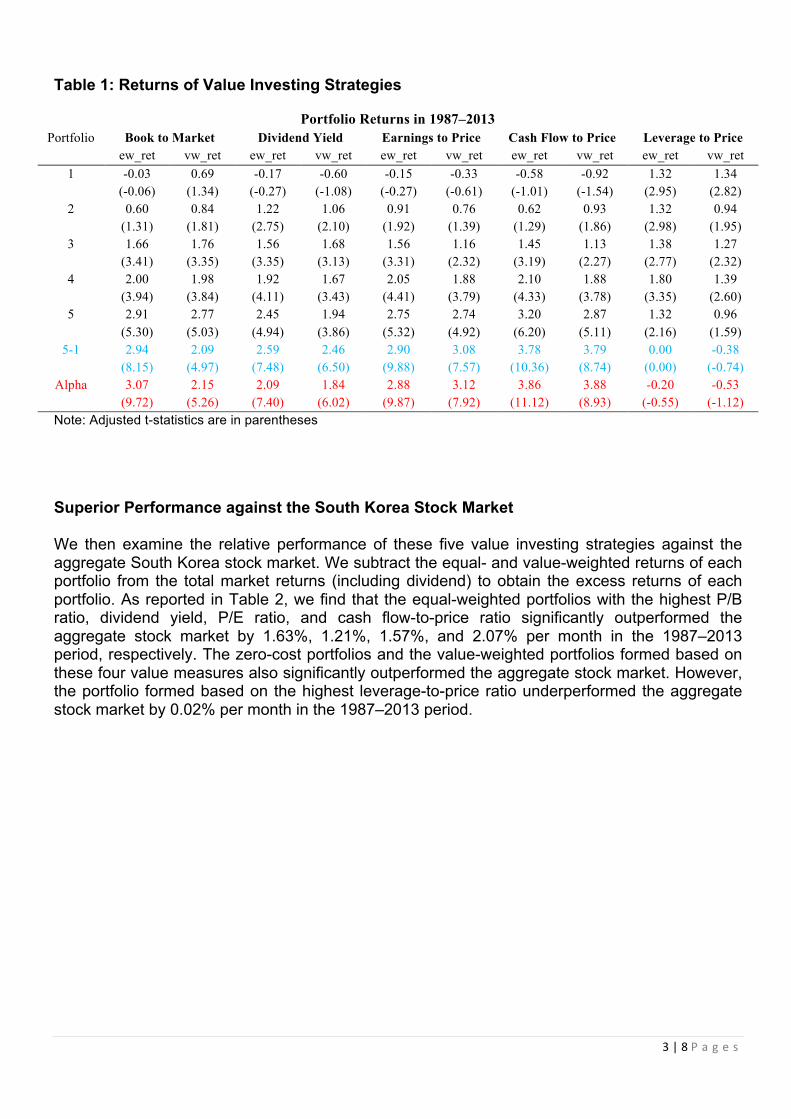
As shown in Table 1, we find that the equal-weighted portfolios with the highest P/B ratio, dividend yield, E/P ratio, cash flow-to-price ratio, and leverage-to-price ratio generated returns of 2.91%, 2.45%, 2.75%, 3.20% and 1.32% respectively in the 1987–2013 period. We also find that the equal-weighted portfolios with the highest P/B ratio, dividend yield, E/P ratio, and cash flow-to-price ratio significantly outperformed stocks with the lowest values of these measures. The zero-cost portfolios that long the stocks with the highest values of these measures (5) and short the stocks with the lowest values of these measures (1) generated returns of 2.94%, 2.59%, 2.90%, and 3.78% as well as market-adjusted excess returns (alpha) of 3.07%, 2.09%, 2.88%, and 3.86% in CAPM per month over the 1987–2013 period, respectively. The value-weighted portfolios formed based on these four value measures achieved even higher returns and market-adjusted excess returns over the same period.
3 | 8 P a g e s
Table 1: Returns of Value Investing Strategies
Portfolio Returns in 1987–2013 Portfolio Book to Market Dividend Yield Earnings to Price Cash Flow to Price Leverage to Price
ew_ret vw_ret ew_ret vw_ret ew_ret vw_ret ew_ret vw_ret ew_ret vw_ret 1 -0.03 0.69 -0.17 -0.60 -0.15 -0.33 -0.58 -0.92 1.32 1.34
(-0.06) (1.34) (-0.27) (-1.08) (-0.27) (-0.61) (-1.01) (-1.54) (2.95) (2.82) 2 0.60 0.84 1.22 1.06 0.91 0.76 0.62 0.93 1.32 0.94
(1.31) (1.81) (2.75) (2.10) (1.92) (1.39) (1.29) (1.86) (2.98) (1.95) 3 1.66 1.76 1.56 1.68 1.56 1.16 1.45 1.13 1.38 1.27
(3.41) (3.35) (3.35) (3.13) (3.31) (2.32) (3.19) (2.27) (2.77) (2.32) 4 2.00 1.98 1.92 1.67 2.05 1.88 2.10 1.88 1.80 1.39
(3.94) (3.84) (4.11) (3.43) (4.41) (3.79) (4.33) (3.78) (3.35) (2.60) 5 2.91 2.77 2.45 1.94 2.75 2.74 3.20 2.87 1.32 0.96
(5.30) (5.03) (4.94) (3.86) (5.32) (4.92) (6.20) (5.11) (2.16) (1.59) 5-1 2.94 2.09 2.59 2.46 2.90 3.08 3.78 3.79 0.00 -0.38
(8.15) (4.97) (7.48) (6.50) (9.88) (7.57) (10.36) (8.74) (0.00) (-0.74) Alpha 3.07 2.15 2.09 1.84 2.88 3.12 3.86 3.88 -0.20 -0.53
(9.72) (5.26) (7.40) (6.02) (9.87) (7.92) (11.12) (8.93) (-0.55) (-1.12) Note: Adjusted t-statistics are in parentheses
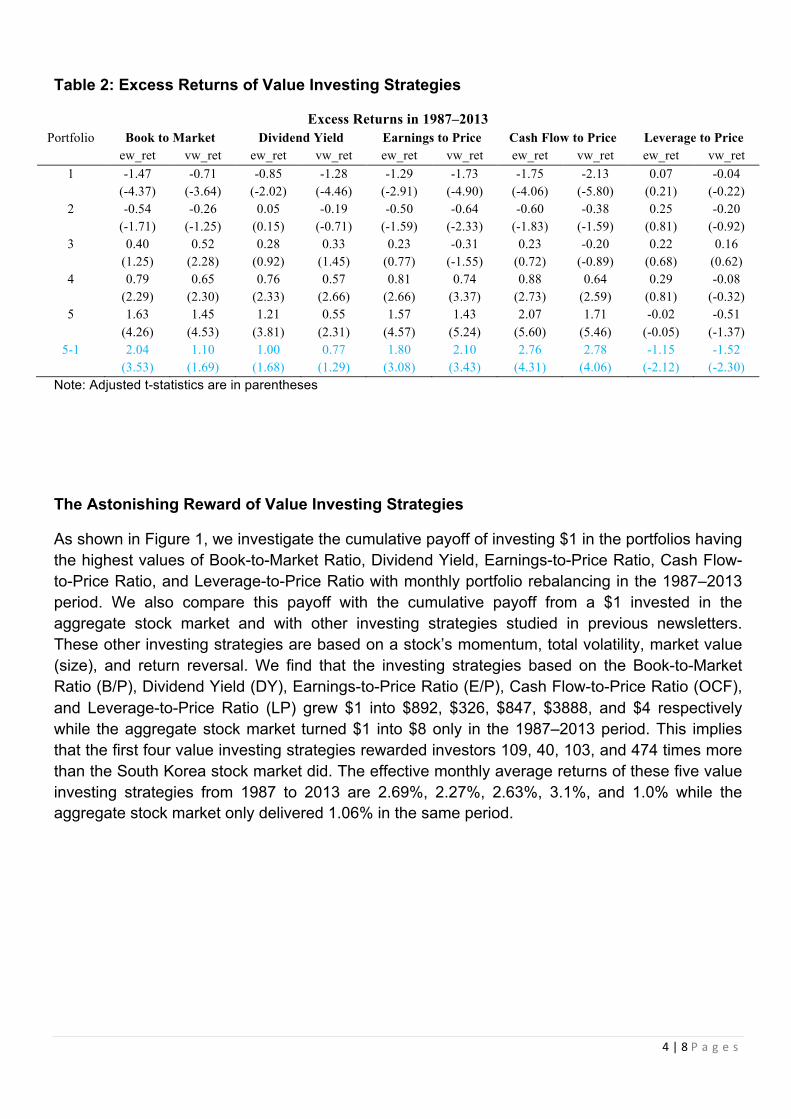
Superior Performance against the South Korea Stock Market We then examine the relative performance of these five value investing strategies against the aggregate South Korea stock market. We subtract the equal- and value-weighted returns of each portfolio from the total market returns (including dividend) to obtain the excess returns of each portfolio. As reported in Table 2, we find that the equal-weighted portfolios with the highest P/B ratio, dividend yield, P/E ratio, and cash flow-to-price ratio significantly outperformed the aggregate stock market by 1.63%, 1.21%, 1.57%, and 2.07% per month in the 1987–2013 period, respectively. The zero-cost portfolios and the value-weighted portfolios formed based on these four value measures also significantly outperformed the aggregate stock market. However, the portfolio formed based on the highest leverage-to-price ratio underperformed the aggregate stock market by 0.02% per month in the 1987–2013 period.
4 | 8 P a g e s
Table 2: Excess Returns of Value Investing Strategies
Excess Returns in 1987–2013 Portfolio Book to Market Dividend Yield Earnings to Price Cash Flow to Price Leverage to Price
ew_ret vw_ret ew_ret vw_ret ew_ret vw_ret ew_ret vw_ret ew_ret vw_ret 1 -1.47 -0.71 -0.85 -1.28 -1.29 -1.73 -1.75 -2.13 0.07 -0.04
(-4.37) (-3.64) (-2.02) (-4.46) (-2.91) (-4.90) (-4.06) (-5.80) (0.21) (-0.22) 2 -0.54 -0.26 0.05 -0.19 -0.50 -0.64 -0.60 -0.38 0.25 -0.20
(-1.71) (-1.25) (0.15) (-0.71) (-1.59) (-2.33) (-1.83) (-1.59) (0.81) (-0.92) 3 0.40 0.52 0.28 0.33 0.23 -0.31 0.23 -0.20 0.22 0.16
(1.25) (2.28) (0.92) (1.45) (0.77) (-1.55) (0.72) (-0.89) (0.68) (0.62) 4 0.79 0.65 0.76 0.57 0.81 0.74 0.88 0.64 0.29 -0.08
(2.29) (2.30) (2.33) (2.66) (2.66) (3.37) (2.73) (2.59) (0.81) (-0.32) 5 1.63 1.45 1.21 0.55 1.57 1.43 2.07 1.71 -0.02 -0.51
(4.26) (4.53) (3.81) (2.31) (4.57) (5.24) (5.60) (5.46) (-0.05) (-1.37) 5-1 2.04 1.10 1.00 0.77 1.80 2.10 2.76 2.78 -1.15 -1.52
(3.53) (1.69) (1.68) (1.29) (3.08) (3.43) (4.31) (4.06) (-2.12) (-2.30)
Note: Adjusted t-statistics are in parentheses
The Astonishing Reward of Value Investing Strategies
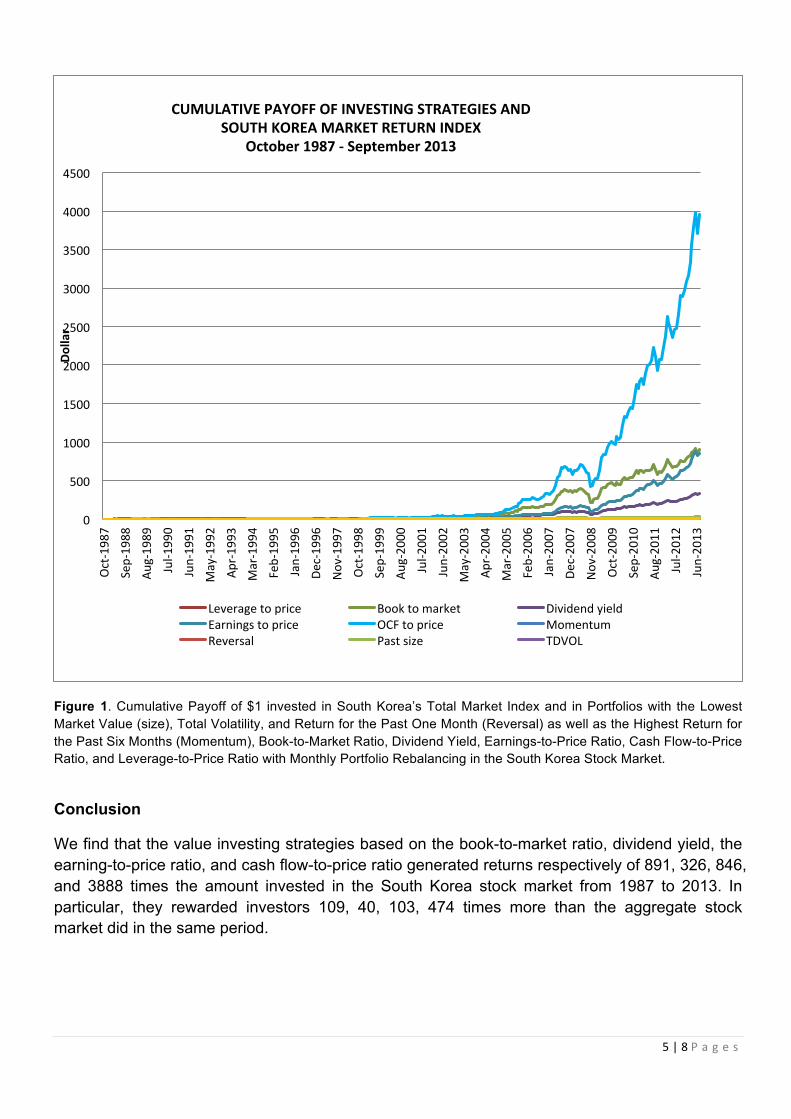
As shown in Figure 1, we investigate the cumulative payoff of investing $1 in the portfolios having the highest values of Book-to-Market Ratio, Dividend Yield, Earnings-to-Price Ratio, Cash Flow-to-Price Ratio, and Leverage-to-Price Ratio with monthly portfolio rebalancing in the 1987–2013 period. We also compare this payoff with the cumulative payoff from a $1 invested in the aggregate stock market and with other investing strategies studied in previous newsletters. These other investing strategies are based on a stock’s momentum, total volatility, market value (size), and return reversal. We find that the investing strategies based on the Book-to-Market Ratio (B/P), Dividend Yield (DY), Earnings-to-Price Ratio (E/P), Cash Flow-to-Price Ratio (OCF), and Leverage-to-Price Ratio (LP) grew $1 into $892, $326, $847, $3888, and $4 respectively while the aggregate stock market turned $1 into $8 only in the 1987–2013 period. This implies that the first four value investing strategies rewarded investors 109, 40, 103, and 474 times more than the South Korea stock market did. The effective monthly average returns of these five value investing strategies from 1987 to 2013 are 2.69%, 2.27%, 2.63%, 3.1%, and 1.0% while the aggregate stock market only delivered 1.06% in the same period.
5 | 8 P a g e s
Figure 1. Cumulative Payoff of $1 invested in South Korea’s Total Market Index and in Portfolios with the Lowest Market Value (size), Total Volatility, and Return for the Past One Month (Reversal) as well as the Highest Return for the Past Six Months (Momentum), Book-to-Market Ratio, Dividend Yield, Earnings-to-Price Ratio, Cash Flow-to-Price Ratio, and Leverage-to-Price Ratio with Monthly Portfolio Rebalancing in the South Korea Stock Market.
Conclusion
We find that the value investing strategies based on the book-to-market ratio, dividend yield, the earning-to-price ratio, and cash flow-to-price ratio generated returns respectively of 891, 326, 846, and 3888 times the amount invested in the South Korea stock market from 1987 to 2013. In particular, they rewarded investors 109, 40, 103, 474 times more than the aggregate stock market did in the same period.
0
500
1000
1500
2000
2500
3000
3500
4000
4500
Oct-‐1987
Sep-‐1988
Aug-‐1989
Jul-‐1
990
Jun-‐1991
May-‐1992
Apr-‐1993
Mar-‐1994
Feb-‐1995
Jan-‐1996
Dec-‐19
96
Nov-‐1997
Oct-‐1998
Sep-‐1999
Aug-‐2000
Jul-‐2
001
Jun-‐2002
May-‐2003
Apr-‐2004
Mar-‐2005
Feb-‐2006
Jan-‐2007
Dec-‐20
07
Nov-‐2008
Oct-‐2009
Sep-‐2010
Aug-‐2011
Jul-‐2
012
Jun-‐2013
Dollar
CUMULATIVE PAYOFF OF INVESTING STRATEGIES AND SOUTH KOREA MARKET RETURN INDEX
October 1987 -‐ September 2013
Leverage to price Book to market Dividend yield Earnings to price OCF to price Momentum Reversal Past size TDVOL
6 | 8 P a g e s
About Value Partners Center for Investing (http://vpcenter.ust.hk/)
The Value Partners Center for Investing of the Hong Kong University of Science and Technology Business School is an academic and intellectual center supporting research and training on investing with an emphasis on China and Hong Kong financial markets. It aims to promote Hong Kong's role as the regional asset management center. The center is sponsored by Value Partners Group Limited.
About Value Partners Group Limited (http://www.valuepartners.com.hk/en/home.html)
Value Partners is one of Asia’s largest asset management firms. Since its establishment in 1993, Value Partners has been a dedicated value investor with a focus on the Greater China region. The Group manages absolute return long-biased funds, long-short hedge funds, exchange-traded funds, quantitative funds, and private equity funds for institutional and individual clients in Asia Pacific, Europe and the United States.
Author Contact Information
Dr. Samuel Xin Liang
Associate Director
Value Partners Center for Investing
Tel: +852 2358 8204
Mobile: +852 9175 8951
Fax: +852 2358 1749
Email: [email protected]
Supporting Researchers:
Ms. Cheuk, Man Yin
Mr. Wei Yue