Embed Size (px)
Citation preview

11Profitability in the
Semiconductor Industry

The profitability of firms in the semiconduc-tor industry depends on a vast array of vari-ables from manufacturing costs to namerecognition. Throughout the electronicsinfrastructure the rules are changing asglobal competition intensifies, product life-cycles shorten, and technology accelerates.As a result, the management of humanresources and compensation approacheschange, time-to market becomes more criti-cal, and business strategies are being re-eval-uated. Despite the incredible profits of mostsemiconductor companies between 1993 and1996, industry over-capacity in 1996 forcedcompany restructuring and workforcereductions, especially among semiconductorequipment suppliers.
In recent years, investors have become veryattracted to high technology firms and thestock market is influencing the way compa-nies are doing business. Having become theobjects of such close scrutiny, companies arechanging their approaches to capital spend-ing and risk.
An analysis of company profitability and thefactors influencing it is essential to an under-standing of the IC industry and the reasonswhy cost effectiveness is critical. This chap-ter first explains the industryÕs ÒboomÓ andÒbustÓ cycles, and the relationship between
average selling price (ASP) of devices, capi-tal spending, factory utilization, and prof-itability. Capital spending trends arereviewed, followed by a discussion of recentindustry downsizing and the role the stockmarket plays in the semiconductor industry.
Changes in product lifecycles, time-to-market and fab cycle time are then exam-ined. Next, typical methods of measuringcompany profitability are reviewed, fol-lowed by a profitability comparison betweenlarge and medium-sized semiconductormanufacturers as well as IC equipment sup-pliers. Finally, the reasons why IC manufac-turing is so costly are presented, leading intoan expanded analysis of cost per wafer inChapter 2.
The Profitability Cycle
Long term, the sustained profitability of thesemiconductor manufacturers depends oneach company's ability to maintain highenough profit margins on the devices it pro-duces to allow sufficient capital outlays forfuture generations of devices. As will beshown later, depreciation costs are thelargest consumer of operating costs and thecost of R&D is increasing. Together thesecosts can constitute from 25 to 35 percent ofannual revenues.
INTEGRATED CIRCUIT ENGINEERING CORPORATION 1-1
1 Profitability in the Semiconductor Industry

Profitability in the Semiconductor Industry
INTEGRATED CIRCUIT ENGINEERING CORPORATION1-2
From year to year, the health of the semicon-ductor industry as a whole is indicated by itscharacteristic "boom" and "bust" periods,known as the silicon cycle (Figure 1-1). Since1978, there have been four growth cycles inwhich sales grew an average of 30 percentper year. Following each growth cycle, theindustry experiences a one to two yearperiod when sales growth averaged slightlyunder 4 percent. ICE expects modest growthin 1997 following the ÒboomÓ of 28-41 per-cent growth in 1993-1995 and 1996Õs contrac-tion caused by plummeting memory prices.Over the industry's last 20 years (1976-1996),the growth rate has averaged a healthy 19percent.
Swings in production growth rate are closelytied to capacity utilization, ASPs of devicesand capital spending (Figure 1-2). For theindustry as a whole, when capacity utiliza-tion is high, ASPs rise and companies aremore profitable, which in turn, encouragescapital spending. However, with increasedspending, capacity constraints loosen andASPs tend to drop, decreasing companyprofitability. The decreased profitability(pre-tax income) then reduces the amount ofcapital available to invest in future needs.This "profitability cycle," and the historicalrelationships between profitability, utiliza-tion rates, ASPs, and capital spending areshown in Figures 1-3 through 1-6 for NorthAmerican merchant semiconductor manu-facturers only.
-15
-10
-5
0
5
10
15
20
25
30
35
40
45
50
������
����
������������������������ ���
���������������
������
��������
������������������
��������������������
�����
�����
������
��������������
20012000199919981997199619951994199319921991199019891988198719861985198419831982198119801979197819771976
Year
*Includes captive semiconductor manufacturers.
Per
cen
t C
han
ge
–12%
36%
28% 28% 28%
25%
5%
2%
21% 20%
34%
10%
4%
7%
10%
28%
31%
41%
–8%
12%
16% 17%
20%
24%
47%
19%
(FCST)
19753BSource: ICE
Average GrowthRate During
Expansionary Cycles
Average GrowthRate DuringContractionary Cycles
Average 20-YearGrowth Rate
Figure 1-1. Boom-Bust Cycles of Worldwide Semiconductor Sales*

Profitability in the Semiconductor Industry
INTEGRATED CIRCUIT ENGINEERING CORPORATION 1-3
CapacityUtilization
Profitability
IC ASPCapital
Spending
19417BSource: ICE
MarketConditions
Capacity Utilization
Total IC Industry ASPs
Profitability
Capital Spending
Increasing
Strong Increases
Increasing
Strong Increases
Decreasing
Decreasing
Decreasing
Small Increase
1993-1995 1996
Figure 1-2. IC Industry ÒProfitability CycleÓ
–10
–5
0
5
10
15
20
25
30
40
50
60
70
80
90
100
Year
Pre
-Tax
Inco
me
(Per
cen
t o
f S
ales
)
Cap
acit
y U
tiliz
atio
n R
ate
(Per
cen
t)
Source: SIA 19782B
*North American companies only
CapacityUtilization Rate
19971996199519941993199219911990'1989"19881987198619851984198319821981198019791978(FCST)
Figure 1-3. High Utilization Rates Indicate High Profitability* (1978-1997)

Profitability in the Semiconductor Industry
INTEGRATED CIRCUIT ENGINEERING CORPORATION1-4
0.80
1.00
1.20
1.40
1.60
1.80
2.00
2.20
2.40
2.60
2.80
9796959493929190898887868584838230
40
50
60
70
80
90
100
19426DSource: SIA
*North American companies only
AS
P (
$)
Year
Cap
acit
y U
tiliz
atio
n R
ate
(Per
cen
t)
Capacity Utilization Rate
$0.95$0.96$1.01
$0.96
$1.00
$1.09
$1.32$1.39
$1.28$1.35
$1.51
$1.75
$2.17
$2.68
$2.40
$2.30
(FCST)
Figure 1-4. IC ASPs Versus Capacity Utilization Rate* (1982-1997)
0.80
1.00
1.20
1.40
1.60
1.80
2.00
2.20
2.40
2.60
2.80
97969594939291908988878685848382–15
–12
–9
–6
–3
0
3
6
9
12
15
18
21
24
27
19427DSource: SIA
*North American companies only
AS
P (
$)
Year
Pre
-Tax
Inco
me
(Per
cen
t)Pre-Tax Income
$0.95 $0.96$1.01
$0.96$1.00
$1.09
$1.32$1.39
$1.28$1.35
$1.51
$1.75
$2.17
$2.68
$2.40$2.30
(FCST)
Figure 1-5. IC ASPs Versus Pre-Tax Income* (1982-1997)

Profitability in the Semiconductor Industry
INTEGRATED CIRCUIT ENGINEERING CORPORATION 1-5
Historically, pre-tax losses are experiencedwhen utilization rates fall below 50 percent,as illustrated in Figure 1-3. However, makingutilization projections based on past boomperiods is risky as industry growth over the1993-1995 period was unprecedented.However, ICEÕs sources indicate that fab uti-lization is dropping rapidly. This is espe-cially true among memory fabs as the moveto future generations of devices (i.e., 64M,256M and 1G DRAMs) is happening fasterthan ever and device shrinks are more dra-matic than they have been in the past.DRAM manufacturers are implementingthese shrinks to improve the margins onDRAM devices, whose ASPs plummeted in1996 (Figure 1-7). For instance, the first-gen-eration 64M devices were approximately200mm2 in size (about 300,000mil2), while thesmallest 64M in 2Q Õ97 was 123mm2 (about190,000mil2), according to ICEÕs laboratory
analysis of the parts. As more companiesadopt this strategy, more fab capacity will befreed to allow production of other devices orthe next generation of DRAMs.
For these reasons, ICE feels that despite thehealthy conditions in the computer, communi-cations and consumer electronics sectors, uti-lization in 1996 should fall below 80 percentand will decelerate below 70 percent in 1997.Because these chart reflect North Americanconditions only, ICE warns that companieshighly dependent on DRAM production willprobably experience lower fab utilization ratesand lower pre-tax incomes. This may be reme-died for some companies by the successfultransition from memory processing toadvanced logic and microcomponent manu-facturing. However, because so many compa-nies are adopting this strategy simultaneously,the risk of over-supply in other device markets
0
2,000
4,000
6,000
8,000
10,000
12,000
14,000
16,000
97969594939291908988878685848382–10
–5
0
5
10
15
20
25
19418DSource: SIA
*North American companies only
Cap
ital
Sp
end
ing
($
Mill
ion
s)
Year
Pre
-Tax
Inco
me
(Per
cen
t)
Pre-Tax Income
(EST)
Figure 1-6. Semiconductor Capital Spending and Pre-Tax Income Trends* (1982-1997)

Profitability in the Semiconductor Industry
INTEGRATED CIRCUIT ENGINEERING CORPORATION1-6
is quite high. Figure 1-8 shows worldwide fabutilization based on information from over 46semiconductor manufacturers in NorthAmerica, Japan, Korea, Taiwan, and Europe,as tracked by a new worldwide capacity study,SICAS (Semiconductor International CapacityStatistics).
Corresponding with the lower utilization offab capacity, ASPs dropped from an averageof $2.68 to $2.40 from 1995 to 1996, and ICE
expects an average ASP of $2.30 in 1997.Pre-tax incomes were cut nearly in half from1995 to 1996, due almost exclusively to thedramatic changes in the memory market.ICE expects pre-tax income to increaseslightly from 13 percent to 15 percent from1996 to 1997. It further forecasts that capitalspending by North American firms will sig-nificantly drop from 1996Õs level of $15.5billion to $12 billion in 1997.
1.00
2.00
3.00
4.00
5.00
6.00
7.00
8.00
9.00
10.00
11.00
12.00 11.50
4.00
2.91
JAN1996
AUG1996
DEC1996
5.00
10.00
15.00
20.00
25.00
30.00
35.00
40.00
45.00 43.25
14.65
9.70
JAN 1996
AUG1996
DEC1996
4M DRAM 16M DRAM
AS
P($
)
AS
P($
)
21204C
–65%
–27%
–66%
–34%
Source: ICE
Figure 1-7. DRAM ASPs Plummet
Wafer Type
Capacity Utilization*(Percent)
1H96**
MOS <0.7µm
MOS ≥0.7µm
Bipolar/BiCMOS
Total
88.4
90.1
85.6
89.1
2H96
90.0
85.7
75.1
86.1
1H95 2H95
95.8
97.2
90.9
95.7
1H94
96.3
95.7
86.7
94.0
97.4
96.5
91.2
95.9
* Figures expressed are for 150mmequivalent wafers.
** Revised 4/97Source: SIA 20354D
Figure 1-8. Wafer Fab Capacity Utilization

Profitability in the Semiconductor Industry
INTEGRATED CIRCUIT ENGINEERING CORPORATION 1-7
Worldwide Capital Spending
Because of the boom-bust cycles, IC manu-facturers must wisely invest during periodsof healthy growth, while remaining flexibleenough to curtail expenses during periods ofdownturn. In reality, the industry largelyoperates in reactionary mode, despiteincreased communication with distributorsand customers, and reductions in inventorylevels over the years. The ramp up of over 50new fab lines in 1995 and 1996, which at firstseemed incapable of meeting the insatiabledemand for semiconductors, finally resultedin over-supply of the commodity devices,DRAMs, in 1996. Fab delays occurred incycles throughout 1996 and managers beganmaking adjustments to spending plansalmost on a quarterly basis. Capital ship-ments for equipment were put on hold for 6months or more, for all but the most leading-edge equipment such as 248nm steppers,high density plasma etchers, and chemical-mechanical polishing tools.
Jim Bagley, President of OnTrak Systems,recently developed a new metric that mayprovide a leading indicator of industry reces-sions[1]. The metric, the multi-year percent-age change of semiconductor sales dividedby the sum of capital expenditures over thesame multi-year period, approaches zeroapproximately a year before an industrydownturn (Figure 1-9). Bagley points outthat historically device prices rise approxi-mately two years before the downturn.Figure 1-10 shows a metric that ICE hastracked for years, industry-wide capitalspending as a percentage of semiconductorsales. This trend illustrates the swings incapital spending and shows how, on aver-age, spending of roughly 21 percent of salesis needed to sustain the industryÕs growth.
–30
–20
–10
0
10
20
30
40
50
60
70
199619951994199319921991199019891988198719861985198419831982
Change in Revenue
Cumulative CapitalExpenditures
Per
cen
tag
e
Year
$12B$18B
$44B$46B
$44B$58B
$125B$145B
Source: OnTrack 22698
Figure 1-9. Changes in Capital Spending: Indicator of Equipment Industry Health

Profitability in the Semiconductor Industry
INTEGRATED CIRCUIT ENGINEERING CORPORATION1-8
Figure 1-11 illustrates the recent escalationin capital expenditures, which has increasedby 4X in the five year period between 1991and 1996. In Figure 1-12, one can see theannual changes in capital spending amongsemiconductor manufacturers. Taiwanesefirms (making up the majority of the rest-of-world (ROW) category) have made remark-able inroads in the industry over the mostrecent years, while Korean companiesslowed spending dramatically from 1995levels, yet still increased it by 10 percentfrom 1995 to 1996. North American andEuropean firms modestly increased spend-ing in 1996, while Japan decreased it by 4percent. On a product basis, DRAM spend-ing slowed the most dramatically, whilespending for microprocessors, by Intel pri-marily, remained staunch. Spending for
flash memory, DSPs, MOS standard cellsand microperipherals, as well as other high-value-added devices remained active.Capital spending for foundries that supply awide variety of value-added products wassubstantial.
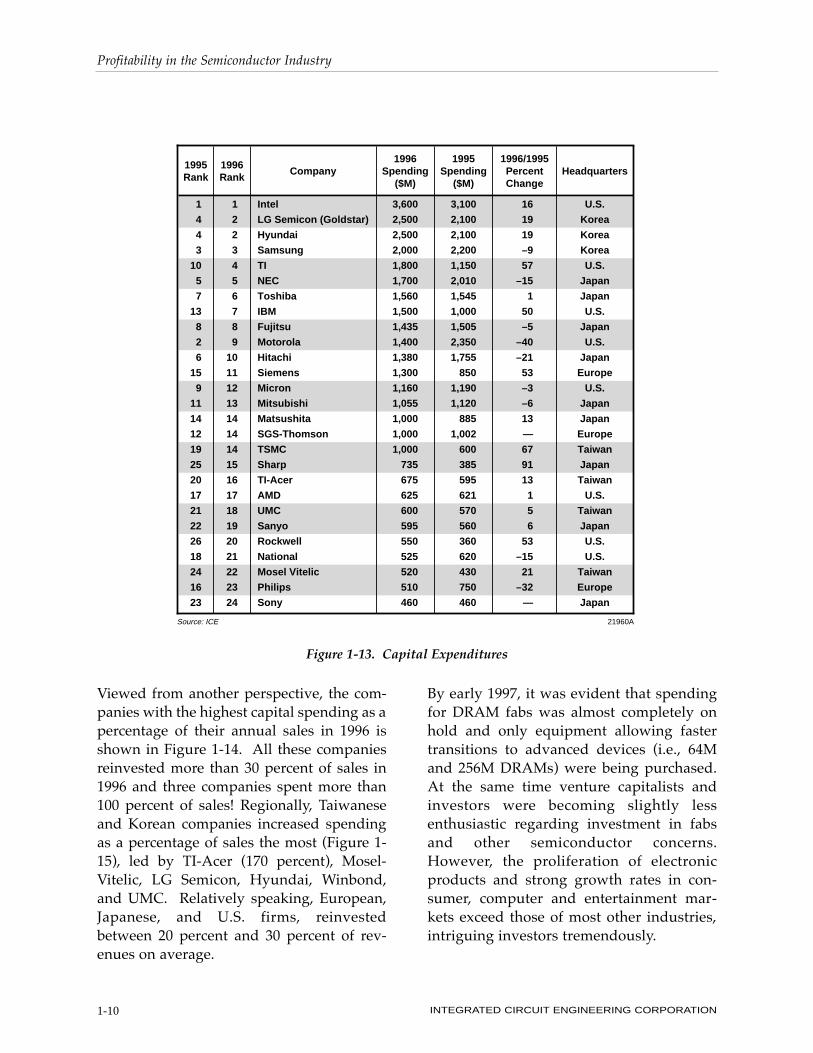
Figure 1-13 shows the details of capitalspending by company on a worldwide basisin 1995 and 1996, ranked according to 1996spending. Among the top spenders,Motorola, Hitachi, National, and NECreduced spending the most from 1995, whileSharp, TSMC, TI, Siemens, Rockwell, andIBM increased spending the most. The com-panies in this table account for nearly 70 per-cent of total spending in the industry.
18.318.8
20.3
19.4
22.4
27.4
26.5
16.216.1
18.6
21.120.9
Year14537U
Per
cen
tag
e
Source: ICE
21.5
18.3
21.8
26.9 27.2
31.6
’79-’96 AnnualAverage
19.3
15161718192021222324252627282930313233
97969594939291908988878685848382818079(FCST)
Figure 1-10. Worldwide Capital Spending as a Percent of Worldwide Semiconductor Production (1979-1997)

Profitability in the Semiconductor Industry
INTEGRATED CIRCUIT ENGINEERING CORPORATION 1-9
0
5,000
10,000
15,000
20,000
25,000
30,000
35,000
40,000
45,000
1997199619951994199319921991
Mill
ion
s o
f D
olla
rs
Year19246HSource: ICE
11,37512,645
48%
35%–10%15,385
74%
22,805
(FCST)
39,710 39,655
42,765
8%
–7%
Figure 1-11. Worldwide Merchant Semiconductor Capital Spending Trends
0
2,000
4,000
6,000
8,000
10,000
12,000
14,000
16,000
19971996199519941993199219910
2,000
4,000
6,000
8,000
10,000
12,000
19971996199519941993199219910
500
1,000
1,500
2,000
2,500
3,000
3,500
4,000
1997199619951994199319921991
0
1,000
2,000
3,000
4,000
5,000
6,000
7,000
8,000
1997199619951994199319921991
1,060 1,195
1,1601,0004,295
3,520
6,280
3,925
EUROPE
KOREA
NORTH AMERICA JAPAN
17875MSource: ICE
Year
Year
YearYear
Mill
ion
s o
f D
olla
rs
Mill
ion
s o
f D
olla
rs
Mill
ion
s o
f D
olla
rs
Mill
ion
s o
f D
olla
rs
6,400
9,020
14,015 14,345
22%49%
41%
55%
4,925
11,58011,085
–38% 25%
49%
58%
1,385
19%
2,040
3,590
47%
64%
7%
0
1,000
2,000
3,000
4,000
5,000
6,000
7,000
1997199619951994199319921991
800785
ROW
Year
Mill
ion
s o
f D
olla
rs
1,015
2% 27%
2,040
4,190
100%
105%
1,6602,360
13% 39%42%
11%
6,5757,300
179%
–4%
54%
6,445
2%
3,350
7,345
–9%
13,065 10,100
–9%
3,540
–1%
(FCST)
(FCST) (FCST) (FCST)
6,500
–11%
0%
6,450
(FCST)
Figure 1-12. Capital Spending by Region
Profitability in the Semiconductor Industry
INTEGRATED CIRCUIT ENGINEERING CORPORATION1-10
Viewed from another perspective, the com-panies with the highest capital spending as apercentage of their annual sales in 1996 isshown in Figure 1-14. All these companiesreinvested more than 30 percent of sales in1996 and three companies spent more than100 percent of sales! Regionally, Taiwaneseand Korean companies increased spendingas a percentage of sales the most (Figure 1-15), led by TI-Acer (170 percent), Mosel-Vitelic, LG Semicon, Hyundai, Winbond,and UMC. Relatively speaking, European,Japanese, and U.S. firms, reinvestedbetween 20 percent and 30 percent of rev-enues on average.
By early 1997, it was evident that spendingfor DRAM fabs was almost completely onhold and only equipment allowing fastertransitions to advanced devices (i.e., 64Mand 256M DRAMs) were being purchased.At the same time venture capitalists andinvestors were becoming slightly lessenthusiastic regarding investment in fabsand other semiconductor concerns.However, the proliferation of electronicproducts and strong growth rates in con-sumer, computer and entertainment mar-kets exceed those of most other industries,intriguing investors tremendously.
Intel
LG Semicon (Goldstar)
Hyundai
Samsung
TI
NEC
Toshiba
IBM
Fujitsu
Motorola
Hitachi
Siemens
Micron
Mitsubishi
Matsushita
SGS-Thomson
TSMC
Sharp
TI-Acer
AMD
UMC
Sanyo
Rockwell
National
Mosel Vitelic
Philips
Sony
3,600
2,500
2,500
2,000
1,800
1,700
1,560
1,500
1,435
1,400
1,380
1,300
1,160
1,055
1,000
1,000
1,000
735
675
625
600
595
550
525
520
510
460
U.S.
Korea
Korea
Korea
U.S.
Japan
Japan
U.S.
Japan
U.S.
Japan
Europe
U.S.
Japan
Japan
Europe
Taiwan
Japan
Taiwan
U.S.
Taiwan
Japan
U.S.
U.S.
Taiwan
Europe
Japan
1
2
2
3
4
5
6
7
8
9
10
11
12
13
14
14
14
15
16
17
18
19
20
21
22
23
24
1996Rank
1
4
4
3
10
5
7
13
8
2
6
15
9
11
14
12
19
25
20
17
21
22
26
18
24
16
23
1995Rank
Company1996
Spending($M)
Headquarters
Source: ICE 21960A
3,100
2,100
2,100
2,200
1,150
2,010
1,545
1,000
1,505
2,350
1,755
850
1,190
1,120
885
1,002
600
385
595
621
570
560
360
620
430
750
460
16
19
19
–9
57
–15
1
50
–5
–40
–21
53
–3
–6
13
—
67
91
13
1
5
6
53
–15
21
–32
—
1995Spending
($M)
1996/1995PercentChange
Figure 1-13. Capital Expenditures

Profitability in the Semiconductor Industry
INTEGRATED CIRCUIT ENGINEERING CORPORATION 1-11
1996Rank
Company
1996Capital
Spending($M)
HeadquartersLocation
1996IC Sales
($M)
1996 CapitalSpendingPercent ofIC Sales
1234566789
1011121314141516171819202121
TI-AcerMosel-VitelicLG SemiconHyundaiWinbondTSMCUMCMicronSiemensMacronixMatsushitaIDTFujitsuAlcatel MietecSharpCypressSeiko EpsonRockwellVLSI TechnologySamsungAtmelSanyoNippon SteelAMD
1,800520
2,5002,500
3501,000
6001,1601,300
2001,000
2451,435
90735225330550250
2,000350595120625
6,700375
2,4003,150
4501,400
8401,7402,4004,1002,235
5453,225
2101,760
535825
1,500720
5,8001,0701,885
3751,955
170140104
797871716754494545444342424037353433323232
TaiwanTaiwanKoreaKorea
TaiwanTaiwanTaiwan
U.S.EuropeTaiwanJapanU.S.
JapanEuropeJapanU.S.
JapanU.S.U.S.
KoreaU.S.
JapanJapanU.S.
19559ASource: ICE
Figure 1-14. Top Capital Spenders Ranked by Percentage of Sales
0
10
20
30
40
50
60
70
80
90
100
Per
cen
tag
e
TaiwaneseCompanies
KoreanCompanies
EuropeanCompanies
JapaneseCompanies
North AmericanCompanies
Source: ICE 21778A
1995
1996
Figure 1-15. Capital Spending as a Percent of IC Sales

Profitability in the Semiconductor Industry
INTEGRATED CIRCUIT ENGINEERING CORPORATION1-12
The Stock Market and the ChangingNature of the Business
The dawn of a new era in semiconductor his-tory began when a small sticker toutingÒIntel InsideÓ appeared on personal comput-ers and their advertisements in the early1990s. Suddenly semiconductor firms wereselling to the average consumer instead ofthe engineers working for manufacturers ofcomputers and other OEMs. Indeed, oncethe investment community became fixatedon technology stocks, many people realizedthat the days when engineering prowessruled were overÑand issues such as namerecognition and image were evidently gain-ing importance in the field of semiconduc-tors. Certainly industry followers five yearsago would not have imagined a TV commer-cial showing fab employees in metallicbunny suits dancing around and promotingadvanced chip technology, as in a recent Inteladvertisement.
Figure 1-16 shows the enormous stock valueplaced on Intel and Microsoft, the most prof-itable companies in the high technologysector. Interestingly, their combined marketvaluations exceed those of the eight well-known companies put together. The com-bined revenues of these eight traditionalcompanies, roughly $425 million, is 14X thecombined revenues of Intel and Microsoft,but merely 2X the profits[2].
But this elite treatment of companies in thesemiconductor sector is shared by few com-panies other than Intel and Microsoft,although IBM has enjoyed outstanding valu-ation as well. In most other cases, stockhold-ers react dramatically to each developmentwithin the companies. Such close surveil-lance has certain positive effects as compa-nies can gain necessary feedback when a
business strategy is tested or when companymanagers underestimate the importance oftime-to-market, for instance. Often, how-ever, such rapid and dramatic responses failto give companies the support needed toride-out market changes.
Industry Downsizing
1995 and 1996 saw initial public offerings bymany numerous semiconductor equipmentvendors seeking to expand their businessesin order to keep pace with the souringdemand for chips. In addition, there were anumber of mergers and acquisitions amongequipment and materials suppliers. Whenthe over-supply of DRAM devices was real-ized, fabs were put on hold, capital equip-ment orders were stalled for 6 months ormore, and companies were forced to lay-off anumber of employees (Figure 1-17). This fol-lowed approximately two years of growth
* As of 3/21/97Source: Wall Street Journal 22629
CompanyStock
Market Value*($B)
Microsoft
Intel
Total
General Motors
Ford Motor
Boeing
Eastman Kodak
Sears Roebuck
J.P. Morgan
Caterpillar
Kellogg
Total
115.5
109.3
224.8
42.4
37.5
36.6
29.4
20.4
19.2
15.4
14.2
$215.1
Figure 1-16. Intel and Microsoft Value ExceedsEight Traditional Stocks Combined

Profitability in the Semiconductor Industry
INTEGRATED CIRCUIT ENGINEERING CORPORATION 1-13
when companies were unable to fill themany positions they had, and had to payhigher salaries as well. Substantial work-force reductions among some of largestequipment suppliers Ñ Applied Materials,Lam Research, Tencor Instruments, and K&SÑ illustrates the gravity of the downturn. Inaddition, as small firms such as AGAssociates and Genus reduce their work-forces dramatically, the future success ofthese companies and their ability to meetglobal supply needs comes into question.
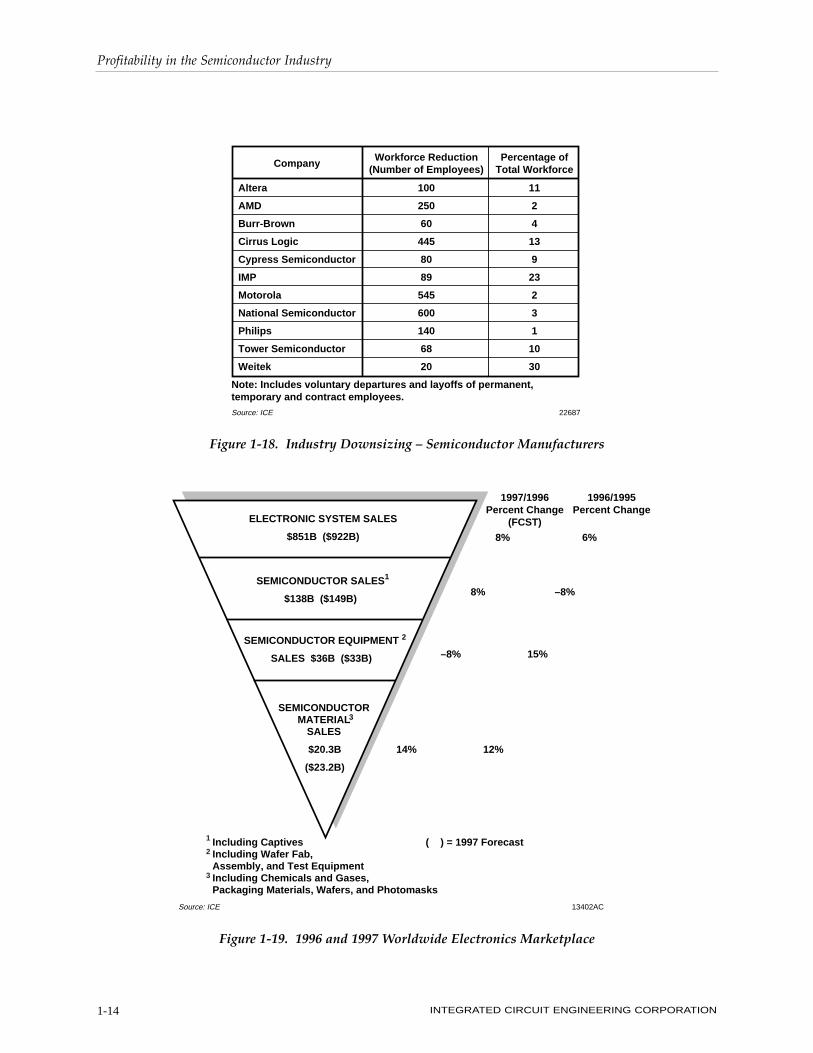
A sampling of industry restructuring amongsemiconductor manufacturers (Figure 1-18)illustrates a similar trend in that smallerfirms downsized dramatically in some cases,yet the larger IC manufacturers have notexperienced the layoffs of the larger equip-ment companies. Of course, the very wellknown exceptions are the layoffs of thou-sands of employees at IBM and AT&T butthese were company-wide layoffs through-out all their divisions. It is also important tonote that Lucent Technologies, AT&TÕs
microelectronics division, has been expand-ing its employee base since the companyrestructuring
As telling as these tables may be, compar-isons between semiconductor equipmentvendors and the chip manufacturers must beperformed with caution due to the enor-mous difference in company and industrysizes Ñ semiconductors are a $140 billionindustry while equipment is roughly one-quarter its size (Figure 1-19). Figures 1-20and 1-21 place these two industries in rela-tive context with industries of similar sizes.The semiconductor materials suppliers areslightly less sensitive to market fluctuationsbecause demand changes less radically inthis sector. Important exceptions are thewafer manufacturing and photomask manu-facturing industries. Wafer suppliers areconstrained by polysilicon supply and thelong leadtimes for new manufacturing facil-ities (2-year ramp-ups), while mask suppli-ers are limited by slow mask writing times,especially when making reticles for the mostadvanced devices.
CompanyWorkforce Reduction
(Number of Employees)Percentage of
Total Workforce
AG Associates
Applied Materials
GaSonics
Genus
Kulicke & Soffa
Lam Research
SubMicron Systems
Tencor Instruments
Teradyne
Unit Instruments
Watkins-Johnson
69
1,700
35
39
300
650
120
220
300
109
75
25
12
7
11
16
11
15
15
6
22
7
Source: ICE 22688
Note: Includes voluntary departures and layoffs of permanent,temporary and contract employees.
Figure 1-17. Industry Downsizing Ð Equipment Suppliers
Profitability in the Semiconductor Industry
INTEGRATED CIRCUIT ENGINEERING CORPORATION1-14
CompanyWorkforce Reduction
(Number of Employees)Percentage of
Total Workforce
Altera
AMD
Burr-Brown
Cirrus Logic
Cypress Semiconductor
IMP
Motorola
National Semiconductor
Philips
Tower Semiconductor
Weitek
100
250
60
445
80
89
545
600
140
68
20
11
2
4
13
9
23
2
3
1
10
30
Source: ICE
Note: Includes voluntary departures and layoffs of permanent,temporary and contract employees.
22687
Figure 1-18. Industry Downsizing Ð Semiconductor Manufacturers
3
ELECTRONIC SYSTEM SALES
$851B ($922B)
SEMICONDUCTOR SALES
$138B ($149B)
1
SEMICONDUCTOR EQUIPMENT
SALES $36B ($33B)
2
13402AC
Including CaptivesIncluding Wafer Fab,Assembly, and Test EquipmentIncluding Chemicals and Gases,Packaging Materials, Wafers, and Photomasks
1
2
3
Source: ICE
( ) = 1997 Forecast
$20.3B
($23.2B)
SEMICONDUCTORMATERIAL
SALES
1997/1996Percent Change
(FCST)
8%
8%
–8%
14%
1996/1995Percent Change
6%
–8%
15%
12%
Figure 1-19. 1996 and 1997 Worldwide Electronics Marketplace

Profitability in the Semiconductor Industry
INTEGRATED CIRCUIT ENGINEERING CORPORATION 1-15
Sales ($B)
0 5 10 15 20 25 30 35
34.6
34.5
32
27.3
24.9
22.5
19.5
18.8
18.2
17
16
Source: Wafer News 22691
U.S. Women's Apparel Store Sales (1995)
U.S. Lottery Ticket Sales (1994)
U.S. Railroad Operating Revenues (1995)
U.S. Convenience Store Sales (1995)
Worldwide Semiconductor Equipment Sales (1995)
U.S. Liquor Store Sales (1995)
U.S. Movie, Theater, Sports Ticket Sales (1994)
U.S. Shoe Store Sales (1995)
U.S. Casino Gambling (1995)
U.S. Defense Dept. Aircraft Purchases (1995)
U.S. Toy Sales (1995)
Figure 1-20. Relative View of Semiconductor Equipment Revenues
0 50 100 150 200 250
U.S. Residential New Construction (1995)
General Motors Corp. Net Sales and Revenue (1996)
Foreign Investment in China, 8th Five-Year Plan (1991-95)
U.S. Gasoline Service Station Sales (1995)
Ford Motor Company Revenue (1996)
Worldwide Semiconductor Sales (1996)
Exxon Corporation Revenue (1996)
U.S. Furniture and Appliance Retail Sales (1995)
U.S. Lumber, Building Materials, HardwareSales (1995)
WalMart Stores Inc. Corporate Revenue(1996)
Sales ($B)
$236.2B
$164.1B
$150B
$148.2B
$147B
$139B
$134.4B
$129.9B
$109.3B
$104.9B
Source: Wafer News 22692
Figure 1-21. Relative View of Semiconductor Revenues

Profitability in the Semiconductor Industry
INTEGRATED CIRCUIT ENGINEERING CORPORATION1-16
New Approaches to Compensation
Compensation and severance packages arechanging, especially among U.S. companies.Years ago, industry downturns were dealtwith by dramatic spending cuts, salaryfreezes, and temporary plant closings, if nec-essary. Training programs were often cutback. In the 1990s, companies managedownturns in a very different way. Today,training budgets and salaries are not gener-ally cut (although upper managers andCEOs occasionally reduce their pay by somesmall percentage), yet discretionary spend-ing for outside consultants and other projectsare still put on hold. As evidenced by theprevious section, layoffs are becoming muchmore common in the U.S., and stock valuesof companies typically rise, often dramati-cally, following company downsizing.
In 1996, IBMÕs distributed a 1.2 billion bonusamong its employees. This payout occurredfollowing several years of downsizing andthe layoff of over 5,000 employees. In early1997, AT&T offered buy-out packages tosome 4,000 managers, including $10,000,which could be used for retraining, relocationor financing their own businesses[3]. Thecompany began this strategy approximately ayear earlier as a larger plan of efforts to elim-inate about 17,000 jobs. After Intel celebratedits 1996 net income of $5.2 billion it paid $820million in profit-sharing and retirement con-tributions to its nearly 50,000 employeesworldwide. The company also made all of itsemployees eligible for its stock-option plan inthe future, setting an important precedent forthe treatment of employees that enablerecord-breaking profits[4].
Changing Product Lifecycles and Time-to-Market
Company performance and profitability areincreasingly tied to time-to-market, markettiming, manufacturing cost reduction, andbetter utilization of assets. In addition, theability to recognize and manage product life-cycles is becoming more important as the timeavailable for recovering significant invest-ments shortens. Figure 1-22 shows time-to-market differences between world-classmanufacturers and other companies in thesame sector. Figure 1-23 illustrates how time-to-market differences may vary according todevice market. Unless such differences can beremedied, the less competitive and oftensmaller companies will lose share of market, aphenomenon already occurring among sup-pliers of semiconductor equipment and mate-rials. This shift to a smaller supplier base isdue in large part to widening differences inglobal customer service, but also the desire bycompanies to reduce vendor base as a methodof streamlining operations.
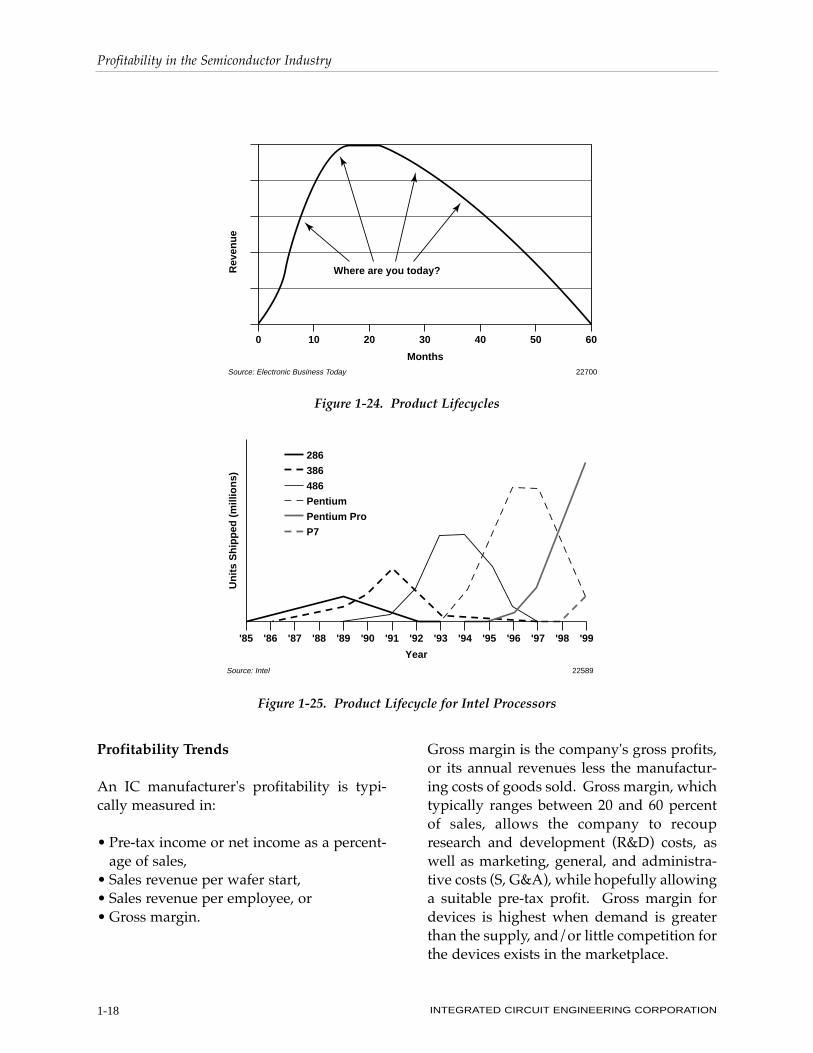
Typical product lifecycles in the semiconduc-tor industry followed a bell-curve cycle, yettoday these are changing shape to more dra-matically upward sloping curves that rapidlyplummet (Figure 1-24) better reflect reality intodayÕs marketplace. Depending on thedevice type and market niche, the identifica-tion of the positioning of products alongthese lifecycle curves is becoming more diffi-cult. However, within the microprocessormarket it is clear that new products are beingintroduced more often than in past genera-tions, and the unit volumes and revenuestreams peak earlier and subsequently plum-met faster (Figure 1-25). The accompanyingchanges in performance of IntelÕs micro-processors is shown in Figure 1-26.

Profitability in the Semiconductor Industry
INTEGRATED CIRCUIT ENGINEERING CORPORATION 1-17
It is probable that DRAM devices may ven-ture away from the traditional lifecyclecurves of today (Figure 1-27) to one in whichthe bit volumes peak faster, new generationsare introduced faster, and bit volumes fol-lowing the peak plummet faster. The morecompetition and price pressure in this
market, the more likely such a strategy maybecome. Figure 1-28 illustrates the changinglifecycles of gate arrays and standard cellproducts offered by Texas Instruments. TIplans to combine standard cores from sev-eral different vendors along with their digitalsignal processing technology, among others,to offer 0.18mm products in 1998.
Source: Semiconductor International 22635
0
20
40
60
80
100
TTM Goal in 1998TTM Goal in 1996TTM in 1995
Per
cen
t
Best-In-Class
Other Companies
Figure 1-22. Typical Product Time-To-Market
Product Type
Microprocessor,Microcontroller, DSP
MOS ASIC
MOS Memory
Analog
67%
73%
76%
55%
Gap Between Best-in-Class Companies'TTM Versus Average Companies' TTM
Source: Channel Magazine 22704
Figure 1-23. Time-To-Market Performance Gap
Profitability in the Semiconductor Industry
INTEGRATED CIRCUIT ENGINEERING CORPORATION1-18
Profitability Trends
An IC manufacturer's profitability is typi-cally measured in:
¥ Pre-tax income or net income as a percent-age of sales,
¥ Sales revenue per wafer start,¥ Sales revenue per employee, or¥ Gross margin.
Gross margin is the company's gross profits,or its annual revenues less the manufactur-ing costs of goods sold. Gross margin, whichtypically ranges between 20 and 60 percentof sales, allows the company to recoupresearch and development (R&D) costs, aswell as marketing, general, and administra-tive costs (S, G&A), while hopefully allowinga suitable pre-tax profit. Gross margin fordevices is highest when demand is greaterthan the supply, and/or little competition forthe devices exists in the marketplace.
0 10 20 30 40 50 60
Rev
enu
e
Where are you today?
Source: Electronic Business Today 22700
Months
Figure 1-24. Product Lifecycles
286
386
486
Pentium
Pentium Pro
P7
'85 '99'98'97'96'95'94'93'92'91'90'89'88'87'86
Year
Un
its
Sh
ipp
ed (
mill
ion
s)
Source: Intel 22589
Figure 1-25. Product Lifecycle for Intel Processors

Profitability in the Semiconductor Industry
INTEGRATED CIRCUIT ENGINEERING CORPORATION 1-19
1970 1975 1980 1985 1990 200019950.1
0.2
0.3
0.4
0.5
0.7
1.0
2
3
45
7
10
20
30
40
50
70
100
200
300
400
500
700
1,000
4004 108KHz (0.06 MIPS)
8008 200KHz (0.06 MIPS)
8080 2MHz (0.64 MIPS)
8085 5MHz (0.37 MIPS)
8086 10MHz (0.75 MIPS)
80286 12MHz (2.66 MIPS)
Intel 386DX 16MHz (6 MIPS)
Intel 486DX33MHz (27 MIPS)
Pentium 66MHz(112 MIPS)
Intel 386DX 20MHz (7 MIPS)
Intel 386DX 25MHz (8.5 MIPS)
Intel 386DX 30MHz (11.4 MIPS)
Intel 486DX 50MHz (41 MIPS)
Per
form
ance
(M
Hz)
Year
19062CSource: ICE
P6* 100MHz(300 MIPS)
Pentium Pro 200MHz (600 MIPS)
Pentium II, (500 MIPS)233MHz266MHz300MHz
*ICE estimate
Figure 1-26. Intel MPU Performance Trends

Profitability in the Semiconductor Industry
INTEGRATED CIRCUIT ENGINEERING CORPORATION1-20
Figure 1-29 gives examples of net incomepercentages for Intel, Analog Devices, AMD,and National, all large IC manufacturers,over the last several years. As shown, allfour companies were profitable in only fourof the fourteen years. Plotting the netincome average among these companies
indicates surging profitability in the 1991-1995 period, and net income for the fourcompanies averaged 14 percent in 1995(Figure 1-30). The gross margins for theselarge IC houses, shown in Figure 1-31,ranged between 42 and 52 percent in 1995,and averaged 48 percent.
1,000,000.00
100,000.00
10,000.00
1,000.00
100.00
10.00
1.00
0.10
1991
1992
1993
1994
1995
1996
1997
1998
1999
2000
2001
2002
2003
2004
2005
Years
Gig
abit
s S
old
64K
256K
1M
4M
16M
64M
256M
1G
Source: ICE 22004
Figure 1-27. DRAM Lifecycles
0.1
0.2
0.3
0.4
0.5
0.6
0.7
0.8
1990 1992 1994 1996 1998 2000
Gat
e L
eng
th (
µm)
Year
Gate Array ProductsStandard Cell Products
0.65µm
0.55µm
0.44µm
0.35µm
0.25µm
0.18µm TImelineTechnology
48 Ports w/Packet Memory
24 Ports WithPacket Memory
24 Ports Per Chip
12 x 10/3 x 100Ports Per Chip
4 x 10 PortsPer Chip
Source: TI 22631
Figure 1-28. 0.18µm Timeline Technology

Profitability in the Semiconductor Industry
INTEGRATED CIRCUIT ENGINEERING CORPORATION 1-21
Per
cen
tag
e o
f S
ales
YearFiscal ending 5/26/96
19363DSource: ICE
–20
–15
–10
–5
0
5
10
15
20
25
30
19961995199419931992199119901989198819871986198519841983
Analog DevicesIntel
NationalAMD
Figure 1-29. Trends in Net Income Percentage (Large Companies)
–10
–5
0
5
10
15
20
19961995199419931992199119901989198819871986198519841983
Per
cen
tag
e o
f S
ales
Year
19364DSource: ICE
*1983-1995 average of these four companies is 6.1 percent.
Figure 1-30. Net Income Average* of AMD, Analog Devices, Intel, and National

Profitability in the Semiconductor Industry
INTEGRATED CIRCUIT ENGINEERING CORPORATION1-22
Relative to the large IC manufacturers,medium-sized companies, including Cypress,Linear Technology, Micron, VLSI Technology,and LSI Logic, experience larger swings inprofitability (Figures 1-32 through 1-34). Asshown, Micron has experienced the widestswings in net income -- from Ð69 percent in1986 to 34 percent in 1988 -- mirroring thevery volatile DRAM market. Interestingly,Micron's net income averaged 25 percentduring good years (1988, 1989, 1993, 1994, and1995) and Ð18 percent during poor years. LSILogic's results illustrate how difficult prof-itability in the ASIC market has been untilrecently. From 1985 to 1996, the company'snet income averaged only 3 percent. LinearTechnology, a fabless supplier of specialtyanalog products quietly realized a 35 percentnet income for fiscal year 1996, and a 71 per-cent gross margin, following outstanding per-formance over the last four years. All four
companies were profitable in six of the twelveyears (1988, 1991, 1993, 1994, 1995, and 1996).
Profitability of Equipment and MaterialsSuppliers
A sampling of the profitability of large andmedium-sized (<$200M) equipment manu-facturers is shown in Figures 1-35 through1-39. In general, gross margins of largeequipment companies are comparable tothose of the semiconductor manufacturersduring booming years, yet 1997 is likely tosee rapid decreases in net incomes and grossmargins, especially among the larger firms.One unfortunate result of the cyclical natureof this industry is the struggle of smallerfirms to compete. As the industry has seenover the last several years, typically thelargest equipment firms gain share ofmarket following years of downturn.
0
10
20
30
40
50
60
70
199619951994199319921991199019891988198719861985
Per
cen
tag
e o
f S
ales
Fiscal Year
11050LSource: ICE
Analog Devices
AMD
Intel
National*
*Fiscal ending 5/26/96
Figure 1-31. Trends in Gross Margin Performance (Large Companies)

Profitability in the Semiconductor Industry
INTEGRATED CIRCUIT ENGINEERING CORPORATION 1-23
–20
–15
–10
–5
0
5
10
15
20
25
30
35
1996199519941993199219911990198919881987198619851984
Per
cen
tag
e o
f S
ales
Fiscal Year*Fiscal ending 6/30/96**Fiscal ending 8/29/96
Micron**
CypressLSI Logic
LinearTechnology*
(–30) (–69) (–25)
19415DSource: ICE
Figure 1-32. Trends in Net Income Percentage (Medium-Sized Companies)
–10
–5
0
5
10
15
20
25
1996199519941993199219911990198919881987198619851984**
Per
cen
tag
e o
f S
ales
Year
*1984-1995 average of these four companies is 8.9 percent. **Does not include Cypress and Linear Technology.
19416DSource: ICE
Figure 1-33. Net Income Average* of Cypress, LSI Logic, Linear Technology, and Micron

Profitability in the Semiconductor Industry
INTEGRATED CIRCUIT ENGINEERING CORPORATION1-24
What is Responsible for Rising Fab Costs?
In recent years, much controversy hasensued over the main cause of rising fabcosts. While IC manufacturers typicallypoint to the rising cost of capital equipment,the suppliers claim that higher priced equip-ment is the inevitable result of increasingdemands put on companies for higher per-formance systems and process development.Who is right?
At least part of this controversy is the resultof oversimplification of fab costs.Companies typically refer to the rising costof constructing and equipping a new, lead-ing-edge fab facility, running over a billiondollars in 1996 (Figure 1-39). Since equip-ment accounts for an increasingly larger per-centage of new fab costs, up around 80percent in 1996 (Figure 1-40), many peoplechoose to equate rising equipment costswith rising fab costs.
VLSI Technology
LSI Logic
Micron**
(-30) (0)
Per
cen
tag
e O
f S
ales
Fiscal Year
13314JSource: ICE
Cypress
LinearTechnology*
0
10
20
30
40
50
60
70
80
199619951994199319921991199019891988198719861985
Fiscal ending 6/30Fiscal ending 8/29
***
Figure 1-34. Trends in Gross Margin Performance (Medium-Sized Companies)

Profitability in the Semiconductor Industry
INTEGRATED CIRCUIT ENGINEERING CORPORATION 1-25
Figure 1-35. Net Income as a Percentage of Revenues (Large Companies)
0
5
10
15
20
25
1996199519941993
Net
Inco
me
(Per
cen
t)
Fiscal Year
Applied Materials*FSI International**Lam Research Corp***SVG****Novellus Systems IncTencor Instruments
***
Fiscal ending 10/27/96Fiscal ending 8/1/96
Source: ICE 22734
Fiscal ending 6/30/96Fiscal ending 9/30/96
*******
30
37
44
51
58
65
1996199519941993
Gro
ss M
arg
in (
Per
cen
t)
Fiscal Year
Applied Materials*FSI International**Lam Research Corp***SVG****Novellus Systems IncTencor Instruments
***
Fiscal ending 10/27/96Fiscal ending 8/1/96
Source: ICE 22735
Fiscal ending 6/30/96Fiscal ending 9/30/96
*******
Figure 1-36. Gross Margin as a Percentage of Revenues (Large Companies)

Profitability in the Semiconductor Industry
INTEGRATED CIRCUIT ENGINEERING CORPORATION1-26
0
4
8
12
16
20
1996199519941993
Net
Inco
me
(Per
cen
t)
Fiscal Year
GaSonics Int'l*Plasma-Therm Inc**Genus IncUltratech Stepper Inc
Source: ICE 22736
* Fiscal ending 9/30/96 Fiscal ending 11/30/96**
Figure 1-37. Net Income as a Percentage of Revenues (Medium-Sized Companies)
30
36
42
48
54
60
1996199519941993
Gro
ss M
arg
in (
Per
cen
t)
Fiscal Year
GaSonics Int'l*Plasma-Therm Inc**Genus IncUltratech Stepper Inc
Source: ICE 22737
* Fiscal ending 9/30/96 Fiscal ending 11/30/96**
Figure 1-38. Gross Margin as a Percentage of Revenues (Medium-Sized Companies)

Profitability in the Semiconductor Industry
INTEGRATED CIRCUIT ENGINEERING CORPORATION 1-27
1
10
100
1,000
10,000
'66 '74 '82 '90 '98 2003
Source: Forbes 22078AYear
Do
llars
in M
illio
ns
Figure 1-39. Cost of Semiconductor Factories
Building andImprovements
20%
Wafer Processing52%
Test17%
Assembly6%
Other*5%
Equipment80%
Source: ICE 20459
* Computers, automation, etc.
Figure 1-40. Breakdown of Semiconductor Capital Expenditures
Profitability in the Semiconductor Industry
INTEGRATED CIRCUIT ENGINEERING CORPORATION1-28
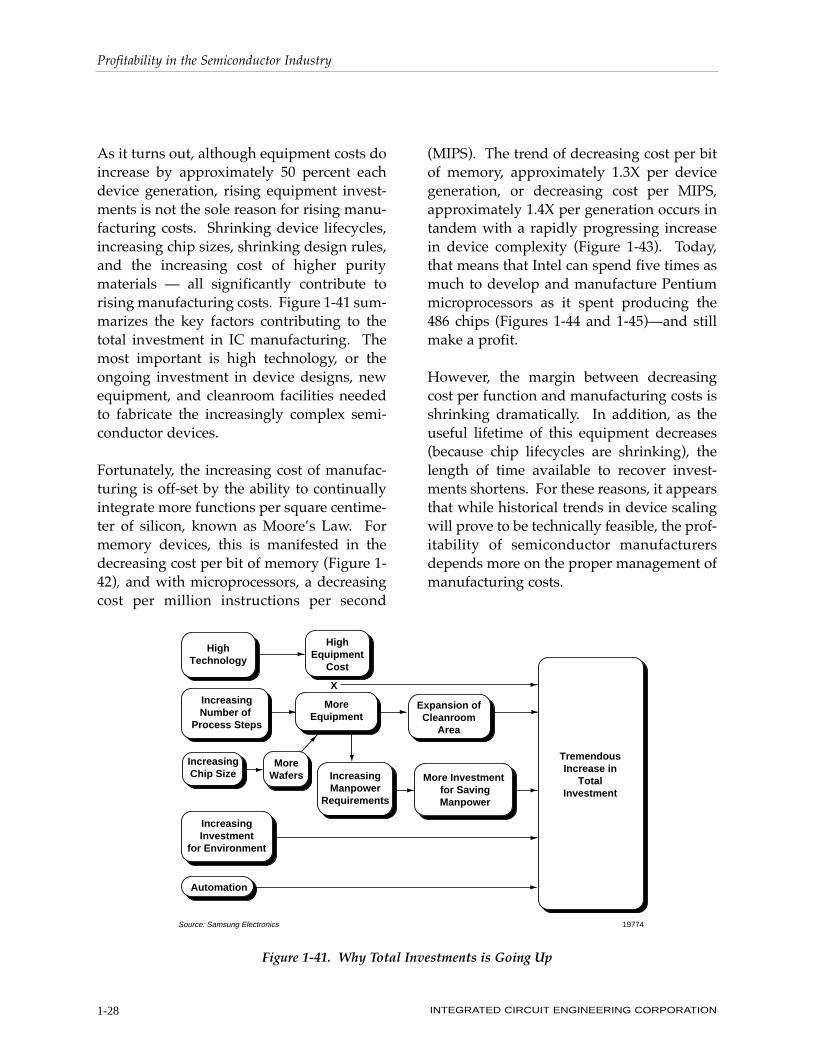
As it turns out, although equipment costs doincrease by approximately 50 percent eachdevice generation, rising equipment invest-ments is not the sole reason for rising manu-facturing costs. Shrinking device lifecycles,increasing chip sizes, shrinking design rules,and the increasing cost of higher puritymaterials Ñ all significantly contribute torising manufacturing costs. Figure 1-41 sum-marizes the key factors contributing to thetotal investment in IC manufacturing. Themost important is high technology, or theongoing investment in device designs, newequipment, and cleanroom facilities neededto fabricate the increasingly complex semi-conductor devices.
Fortunately, the increasing cost of manufac-turing is off-set by the ability to continuallyintegrate more functions per square centime-ter of silicon, known as MooreÕs Law. Formemory devices, this is manifested in thedecreasing cost per bit of memory (Figure 1-42), and with microprocessors, a decreasingcost per million instructions per second
(MIPS). The trend of decreasing cost per bitof memory, approximately 1.3X per devicegeneration, or decreasing cost per MIPS,approximately 1.4X per generation occurs intandem with a rapidly progressing increasein device complexity (Figure 1-43). Today,that means that Intel can spend five times asmuch to develop and manufacture Pentiummicroprocessors as it spent producing the486 chips (Figures 1-44 and 1-45)Ñand stillmake a profit.
However, the margin between decreasingcost per function and manufacturing costs isshrinking dramatically. In addition, as theuseful lifetime of this equipment decreases(because chip lifecycles are shrinking), thelength of time available to recover invest-ments shortens. For these reasons, it appearsthat while historical trends in device scalingwill prove to be technically feasible, the prof-itability of semiconductor manufacturersdepends more on the proper management ofmanufacturing costs.
HighTechnology
IncreasingNumber of
Process Steps
IncreasingChip Size
IncreasingInvestment
for Environment
Automation
MoreWafers
HighEquipment
Cost
MoreEquipment
IncreasingManpower
Requirements
Expansion ofCleanroom
Area
More Investment for SavingManpower
TremendousIncrease in
TotalInvestment
X
Source: Samsung Electronics 19774
Figure 1-41. Why Total Investments is Going Up

Profitability in the Semiconductor Industry
INTEGRATED CIRCUIT ENGINEERING CORPORATION 1-29
In summary, manufacturing costs are escalat-ing due to a number of factors. Specifically,each device generation (every 3 years):
¥ Capital equipment costs increase by 1.5X,¥ Clean raw materials costs increase by 35
percent,¥ Die sizes increase by 30-50 percent,¥ Device complexity increases due to 30 per-
cent reduction in design rules,¥ Number of process steps increases by 25
percent, and¥ Test (including in-line monitoring) costs
increase by 20 percent.
IC manufacturers have typically compen-sated for these changes by moving to largerwafers (100 to 125, 150, and 200mm) andincreasing product yields to preserve costs.Unfortunately, incremental increases in yieldare rapidly being exhausted (as die yieldsapproach 90 percent or better on somemature products). Therefore, future produc-tivity gains, as shown in Figure 1-46, willgreatly rely on improving the productivity ofwafer processing equipment.
0.1
0.01
1
10
100
1979
1980
1981
1982 1983
1984
1985
19861987
19881989
19901991
1992
1993
1995
1996
1997(FCST)
1994
Traditional68% Slope
Post RecessionaryPrice Strengthening
ExcessCapacity
Price Erosion
ExcessCapacity
Price Erosion
Trade Agreement
Cumulative Volume (Bits x 1012)
Pri
ce P
er B
it (
Mill
icen
ts)
7437AB
Strong Demand,Weak Supply
Source: ICE
10 100 1,000 10,0001 100,000
Figure 1-42. Price Curve for DRAM

Profitability in the Semiconductor Industry
INTEGRATED CIRCUIT ENGINEERING CORPORATION1-30
100M
1M
1K
100K
70 72 74 76 78 80 82 84 86 88 90 92 94 00 02
256K
Year
Nu
mb
er o
f T
ran
sist
ors
per
Ch
ip
Memory increase = 1.5/yearMPU increase = 1.35/year
10K
10M
68000
4004
4K
80808085
16K
64K
6802080286
16M
64M
LSI LogicGate Array
4M
1M80486
80386
8086
= Microprocessor/Logic
= Memory (DRAM)
1G
Pentium ProMPU Only
1G
96 98
P7
1K
256M
Pentium ProMPU and Cache
Memory Chip
IBMGateArray
Pentium
LSI LogicGate Array
Figure 1-43. MooreÕs Law
Year MicroprocessorIntroductory Price
(Cents/Transistor)
Introductory Price
(Dollars/MIPS*)
1978
1982
1985
1989
1993
1995
8086
286
386
486
Pentium
Pentium Pro
1.2
0.27
0.11
0.08
0.03
0.02**
21%
480
135
50
47
9
4
24%
Source: ICE 19976A
Average decline per year
*Million instructions per second**Excluding 15M-transistor cache chip
Figure 1-44. Reduction in Cost Per Function for IntelÕs Microprocessors

Profitability in the Semiconductor Industry
INTEGRATED CIRCUIT ENGINEERING CORPORATION 1-31
Methods for assessing equipment productiv-ity are discussed in Chapter 4 of this book,ÒFab BenchmarkingÓ and practical examplesof equipment improvement programs areshown in Chapter 8, Equipment-level Costand Productivity.Ó
References
1. K. Derbyshire, ÒBagley Analyzes IndustryDynamics, Predicts 1997 Will be a DownYear for Equipment,Ó WaferNews, April21, 1997.
2. J. Dorfman, ÒMicrosoft, Intel Take Overasthe New Kings of Stocks,Ó Wall StreetJournal Interactive Edition, March 21, 1997.
3. R. Ho, ÒAT&TÕs Cash Offer May Turn Ex-Workers Into Entrepreneurs,Ó Wall StreetJournal Interactive Edition, March 12, 1997.
4. D.Takahashi, ÒHey, Big Spender: IntelShares Its Wealth With All Employees,ÓWall Street Journal Interactive Edition,February 12, 1997.
MaskLayers
Feature Size (µm)
Capital InvestmentNeeded to
Produce Partat Peak Volume
10
12
18
1.0
0.8
0.6
$200M
$1.0B
$5.0B
Source: Intel 18605B
Product
386
486
Pentium
Pentium Pro 22 0.35 $25B?
Figure 1-45. Surging Capital Needs
WaferSize–4%
YieldImprovement –2%
Other Productivity –Equipment, Etc.
–7% - 10%
25% - 30%/yrImprovement
Historic
al
Curve Equipment
Productivity
>9% - 15%
–12% - 14%
<2%<1%
Feature Size –12% - 14%
1995
Present
Time
Ln
$/F
un
ctio
n
Source: Sematech/Semiconductor International 21073
Figure 1-46. Cost Productivity Curve

Profitability in the Semiconductor Industry
INTEGRATED CIRCUIT ENGINEERING CORPORATION1-32