Embed Size (px)
Citation preview

A1
APPENDIX
Profitability and net present value analysis
Introduction
1. During our original investigation, we carried out a profitability analysis for the period 2007 to 2011. We used this analysis to obtain an estimate of the customer detriment arising from HCA’s (and other private hospital operators’) market power. In contrast, we used our insured pricing analysis (IPA) and our (self-pay) price concentration analysis (PCA) results to estimate the likely impact on prices that could be expected to result from the increased competition in the market brought about by a divestiture remedy.1
2. As set out in the PFs, while we found that HCA charged higher insured prices than TLC, our revised IPA no longer allowed us to conclude on the size of this price difference that was due to weak competitive constraints, as we could not be sufficiently certain that we had adequately controlled for any differences in patient complexity between HCA and TLC.2 Therefore, in order to assess the potential impact of a divestiture remedy, we have developed our profitability analysis in a number of respects. First, we have updated the analysis to cover the period up to 2015 (inclusive) in order to ensure that we have current estimates of the economic profits made by HCA.3 Second, we have sought to identify the relative profitability of HCA’s UK (self-pay and insured) and overseas customers, through an allocation of overhead costs and capital between customer types.
Updated ROCE analysis
3. The basic approach that we have adopted to assessing the return on capital employed (ROCE) of HCA remains as set out in Section 6 of the Final Report and Appendices 6.13 to 6.17.4 In updating our analysis, we have adopted the same methodology, although we have made a number of adjustments to
1 Our approach to quantifying the benefits of divestiture was set out in the Final Report, Appendix 11.2. 2 PFs, paragraphs 11.25–11.37. 3 As set out in PFs, section 9, we provisionally concluded that there was no evidence of a material change in HCA’s profitability since 2011. We noted Bupa’s submissions that HCA’s profitability may have increased since 2011. However, an increase in profitability would not have altered our finding (that HCA was making profits that were substantially and persistently in excess of the cost of capital). Therefore, we determined that it was not necessary to update our profitability analysis for the purposes of assessing whether or not there is an AEC in the central London market. However, when considering the potential impact of remedies, we considered that an increase in HCA’s profitability could have an impact on our assessment of the proportionality of any remedies. Therefore, for these purposes, we have updated this analysis (and the accompanying WACC calculation). 4 Readers should refer to the relevant sections of the Final Report for a detailed discussion of the approach adopted to estimating both the ROCE and WACC of HCA (and other private hospital operators).
A2
reflect the additional information that we have received during the remittal. We discuss each of these adjustments below.
4. HCA provided us with financial information (profit and loss accounts and balance sheets) for the period 2012 to 2015, as well as some minor adjust-ments to the (pre-2011) information that it submitted during the original investigation.5 We used this data to identify the earnings before interest, tax, depreciation and amortisation (EBITDA) of HCA’s UK business, as well as the value of all capital employed, with the exception of land and buildings.
5. The carrying value of land and buildings on HCA’s balance sheet was recorded at historical cost, rather than at the cost of acquiring such buildings in the current market (the modern equivalent asset value). As a result, the balance sheet values of buildings were likely to be a significant under-estimate, particularly in light of the significant appreciation of property values in central London over the last 15 years. In our analysis in the Final Report,6 we used two benchmarks for the value of property employed by HCA. The first was a property valuation carried out by Altus Edwin Hill (for HCA) as of January 2013, which valued HCA’s ‘owned’7 buildings on the basis of their replacement cost, and its land on a residual value basis assuming that the building would have planning permission for commercial (office) use. We then applied an estimate of depreciation based on Valuation Office Agency (VOA) reports, which are used for the purposes of estimating business rates.8 We used Altus Edwin Hill’s 2013 property valuations (adjusted for depreciation) as the basis for the analysis across the whole period, ie we did not make any adjustments for changes in the capital value of property over the 2007 to 2011 period.9 This property valuation formed the basis of our ‘base case’.
6. The second benchmark used was based on a report prepared by KPMG (for HCA) as of early 2013, which valued HCA’s ‘owned’ buildings on the basis of residential alternative use. In this case, we did not seek to apply depreciation to the value of the properties as we considered that this would already be captured in the price that a residential developer would be prepared to pay for the buildings. However, given the significant increases in the value of
5 These adjustments related to the central management charge payable to HCA in the USA for services provided to the UK business. 6 Final Report. Appendices 6.13–6.17. 7 We defined ‘owned’ buildings to be those where HCA either held the freehold or where it held a long leasehold and paid a peppercorn (or nominal) rent. All buildings which HCA leased and on which it paid a substantive rent, were treated as rented, ie their capital value was not included in HCA’s capital employed but the rent paid was deducted from HCA’s EBITDA. 8 These reports are prepared by the VOA based on an inspection of the properties and an assessment of their level of obsolescence. We observed that the VOA estimates of obsolescence for HCA’s buildings were lower than those estimated by Altus Edwin Hill, such that this approach resulted in a higher property value than if we had just used the Altus Edwin Hill valuations. 9 In light of the significant growth in the value of property over this period, this approach was likely to be conservative.

A3
residential property in central London over the 2007 to 2011 period, we applied Land Registry price indices (for Westminster and Southwark) to KPMG’s estimates of the total capital value of buildings. This gave a capital value that increased by around []% between the beginning of 2007 and the end of 2011. We considered this ‘KPMG’ approach as a sensitivity on our base case, estimating HCA’s returns both taking into account the gain made on its properties over the period (‘full articulation’ of its accounts) and excluding this gain, ie just taking into account operating profits (but uplifting capital employed to reflect growth in property values).
7. In updating our analysis, we have estimated HCA’s ROCE using both of these approaches (and both sensitivities on the KPMG approach), with the results set out in Table 1.
Table 1: HCA ROCE, 2007 to 2015
%
FY07 FY08 FY09 FY10 FY11 FY12 FY13 FY14 FY15
Average (2007–2015)
Base case [] [] [] [] [] [] [] [] [] [] KPMG valuation 1* [] [] [] [] [] [] [] [] [] [] KPMG valuation 2† [] [] [] [] [] [] [] [] [] []
Source: CMA analysis. Notes: * These results are based on the full articulation of HCA’s accounts, ie the capital gains made on HCA’s property portfolio is recognised (as income) through the P&L. † These results are based on the partial articulation of HCA’s accounts, ie the capital gains made on HCA’s property portfolio is not recognised as income in the P&L. However, the level of capital employed is adjusted each year to reflect the growth in property values. 8. We compared these updated results with the original results10 and noted that:
(a) HCA’s ROCE had increased by around one percentage point under the base case scenario (to []%, compared with []%);
(b) Under the KPMG property valuation, with full pass-through of property gains, the ROCE result was broadly unchanged ([]%, compared with []%); and
(a) Under the KPMG property valuation, excluding the capital gains on property, HCA’s ROCE had declined by around 1.5 percentage points (to []%, compared with []%).
9. These results indicate that HCA’s profitability has not changed materially in the last few years. However, we observed that the range of ROCE estimates generated by this analysis – [] to []% – was quite broad. Therefore, we next considered which of these scenarios was the most relevant for the
10 See the Final Report, Appendix 6.13.
A4
purposes of assessing the potential impact of remedies on prices, taking into account any new evidence that we have collected.
Property valuation
10. First, we considered which approach to property valuation (Altus Edwin Hill or KPMG) best reflected the costs (capital employed) that an efficient entrant would be likely to incur in seeking to enter the central London market. In the Final Report,11 we observed that the rents charged for medical properties were similar to those assumed by Altus Edwin Hill for commercial buildings and, on this basis, concluded that the assumption of commercial alternative use was the most appropriate, ie that the Altus Edwin Hill valuation was likely to be the most accurate and should, therefore, be used in our base case scenario. However, we have collected several new pieces of evidence which suggest that property market conditions may have changed since 2011:
(a) A Cushman & Wakefield (C&W) report, prepared for Cleveland Clinic, indicates that there was a substantial increase in the rate of conversion of commercial properties to residential use (in Westminster) between 2009 and 2012.12 Westminster City Council suggested that this was the result of strong growth in the value of residential property in recent years (relative to the value of commercial property), which had made it more attractive to convert buildings from office use.13
(b) In May 2013, secondary legislation was introduced by the government to facilitate change of use from offices (B1 (a)) to homes (C3). The aim of this change was to provide new homes in existing buildings. In October 2015, these (more liberal) permitted development rights were made permanent.14 Initially, Westminster was given an exemption to this legislation for its Central Activity Zone, an area that includes Marylebone where a number of HCA’s hospitals are located. However, exempt areas will need to make an Article 4 direction15 (by May 2019) if they wish to continue determining planning applications for the change of use.
(c) We have also taken into account Cleveland Clinic’s evidence on the purchase cost of its building in 33 Grosvenor Place. While this is only one
11 Final Report, Appendix 6.17, paragraph 55. 12 This report showed that in 2009, 66 buildings in Westminster were converted from commercial to residential use, while in 2012, the number of commercial to residential conversions increased to 120. 13 WCC Report, slide 4. 14 DCLG announcement. 15 An Article 4 direction allows a local planning authority to remove permitted development rights, either by means of a condition on a planning permission, or by means of an Article 4 direction. The restrictions imposed will vary on a case-by-case basis and the specific wording of such conditions or directions. Planning guidance.

A5
‘data point’, we considered that it was potentially informative of the costs faced by a private hospital operator in entering the central London market.
11. We observed that an increase in the rate of conversions of commercial buildings to residential use could be expected to reduce the price differential between these two categories. In addition, to the extent that it has become easier for HCA to convert its hospital buildings to residential use (a higher-value use), this would suggest that the KPMG valuation may better represent the opportunity cost to HCA of operating in central London, at least towards the end of the 2007 to 2015 period.
12. However, we noted that (a) the price differentials between residential and commercial property have not disappeared (to date) and we would expect such convergence in prices to take a number of years to be realised (if at all); and (b) several of HCA’s properties were located within the Westminster Central Activity Zone, which is currently exempt from the new permitted development rights and may continue to be so if WCC obtains an Article 4 direction to allow it to continue to determine planning applications for change of use. This indicated that the value of HCA’s hospital buildings is likely to be somewhere between the Altus Edwin Hill and the KPMG valuations.
13. Next, we considered the price that Cleveland Clinic has paid for 33 Grosvenor Place. It told us that it [] million for a building with a net internal area of around 191,000 sq ft, ie a price of []. We compared this with the building valuations carried out by Altus Edwin Hill and KPMG on HCA’s property portfolio:
(a) Altus Edwin Hill estimated an undepreciated replacement cost of approximately £[] per sq ft (which was around £[] on a depreciated replacement cost basis);
(b) KPMG’s valuation (as indexed by the CMA) was approximately £[] per sq ft as of the end of 2015.16
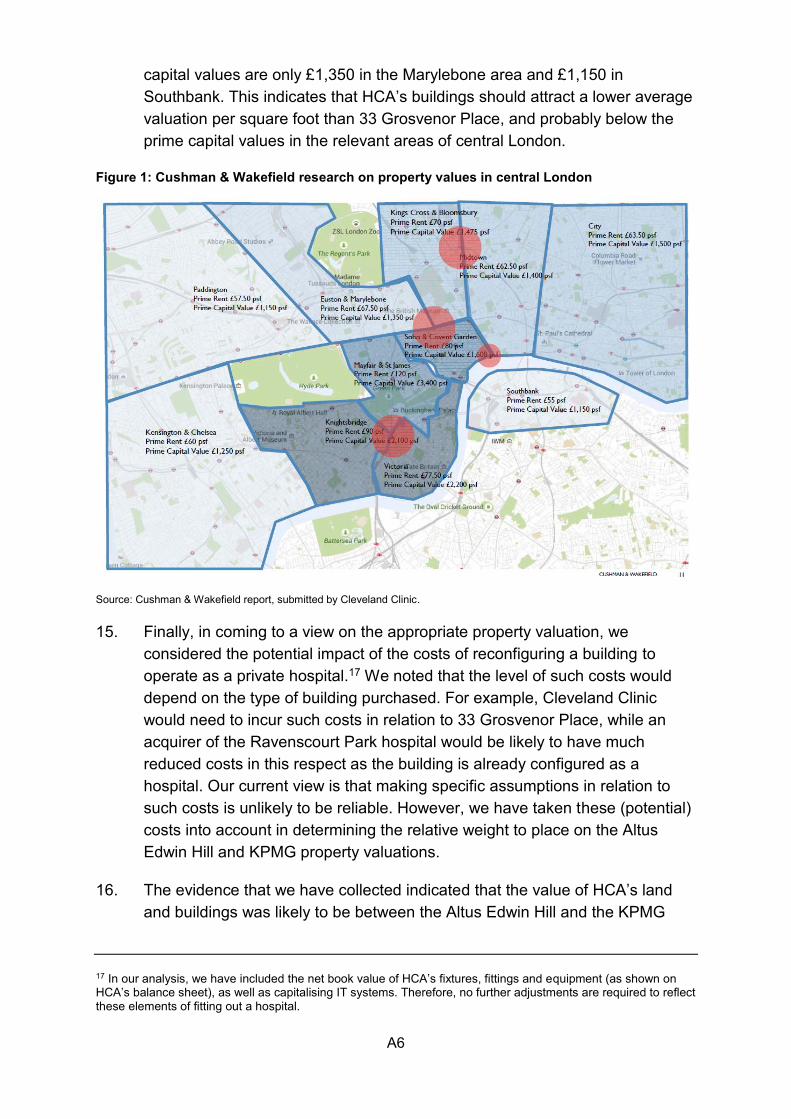
14. [] Evidence provided to us by Cleveland Clinic (see Figure 1) indicates that 33 Grosvenor Place is in a significantly more expensive location (next to Buckingham Palace) than the majority of HCA’s hospitals (in Marylebone, St John’s Wood and Southwark). For example, C&W’s research indicates that prime capital values in Knightsbridge are £2,100 per sq ft, [], while prime
16 Altus Edwin Hill valued HCA’s hospital buildings plus land at approximately £[], which is equivalent to £[] of net internal area (based on total net internal area of HCA’s hospital buildings of just under [] sq ft). The depreciated replacement cost used is approximately £[] per sq ft. KPMG valued HCA’s hospital buildings plus land at approximately £[] as of 2013, which we have indexed (using Land Registry price indices) to approximately £[] as of the end of 2015. This is equivalent to £[] per sq ft of net internal area.
A6
capital values are only £1,350 in the Marylebone area and £1,150 in Southbank. This indicates that HCA’s buildings should attract a lower average valuation per square foot than 33 Grosvenor Place, and probably below the prime capital values in the relevant areas of central London.
Figure 1: Cushman & Wakefield research on property values in central London
Source: Cushman & Wakefield report, submitted by Cleveland Clinic. 15. Finally, in coming to a view on the appropriate property valuation, we
considered the potential impact of the costs of reconfiguring a building to operate as a private hospital.17 We noted that the level of such costs would depend on the type of building purchased. For example, Cleveland Clinic would need to incur such costs in relation to 33 Grosvenor Place, while an acquirer of the Ravenscourt Park hospital would be likely to have much reduced costs in this respect as the building is already configured as a hospital. Our current view is that making specific assumptions in relation to such costs is unlikely to be reliable. However, we have taken these (potential) costs into account in determining the relative weight to place on the Altus Edwin Hill and KPMG property valuations.
16. The evidence that we have collected indicated that the value of HCA’s land and buildings was likely to be between the Altus Edwin Hill and the KPMG
17 In our analysis, we have included the net book value of HCA’s fixtures, fittings and equipment (as shown on HCA’s balance sheet), as well as capitalising IT systems. Therefore, no further adjustments are required to reflect these elements of fitting out a hospital.

A7
valuations. C&W’s report, together with the information on the purchase price of 33 Grosvenor Place, suggested that a value approximately midway between these two points may be the most appropriate. However, when taking into account the potential costs of converting a building to hospital use, this suggested that more weight should be placed on the KPMG valuation.
Treatment of capital gains
17. As set out in Table 1, we estimated HCA’s ROCE, using the KPMG property valuation, both passing through the capital gain HCA has made on its properties and excluding this capital gain. In the Final Report,18 we noted that the increase in value of central London hospital buildings may represent a ‘windfall’, which was unrelated to competitive conditions in the market for private healthcare. Our purpose in updating the profitability analysis has been to identify the economic profits currently being made by HCA and, thereby, to estimate the extent to which prices might be expected to fall if HCA’s market power were to be removed, for example by a divestiture remedy. In the first instance, we noted that capital gains made in previous years may not be repeated in the future, ie HCA may make returns in line with the ‘KPMG 2’ scenario in the future if property prices stabilise at the current level. Second, regardless of property value appreciation or depreciation over time, we would not necessarily expect such changes, which are only discovered at the end of a period, to be reflected in the pricing of HCA or other competing hospital groups, ie we would not expect a private hospital operator to base its pricing on an estimate of its costs plus or minus any expected change in the value of its property over the coming year.
18. On this basis, we concluded that, for the purposes of assessing the potential impact of remedies, such as divestiture, it was appropriate not to take into account capital gains made over the period. As a result, in conducting our analysis, we have used a range of returns between the ‘base case’ and ‘KPMG 2’ scenarios, as set out in Table 1, with more weight placed on the latter.
Allocation of profits between UK and overseas patients
19. Having identified the relevant range of overall returns made by HCA, the next step was to estimate the breakdown of returns between HCA’s UK insured and self-pay patients, for whom we have provisionally identified an AEC, and its overseas patients.
18 Final Report, Appendix 6.13, paragraph 181.

A8
20. HCA provided us with information on its gross margins by patient type, as set out in Table 2. This shows that HCA’s margins on ‘embassy’ patients, which comprise the large majority of overseas patients, have [] since 2011, such that in 2015 there were [] between the margins earned on these patients and those earned on UK insured and self-pay patients.
Table 2: HCA gross margin by patient type (or ‘payor’)
%
Payor 2011 2012 2013 2014 2015
Embassy [] [] [] [] [] NHS [] [] [] [] [] Other* [] [] [] [] [] PMI [] [] [] [] [] International PMI [] [] [] [] [] UK PMI [] [] [] [] []
Self-pay [] [] [] [] [] Grand total [] [] [] [] []
Source: HCA. * Other includes sponsored patients, travel insurance and any remaining smaller payors. 21. In order to estimate ROCE by patient type, it was necessary to split overhead
costs and capital employed between the various patient types. There are a number of potential approaches that can be adopted to allocate shared costs between different activities within a business. For the purposes of this analysis, we considered that the most straightforward approach (and the one requiring the fewest assumptions) was to allocate such costs on the basis of relative activity levels across customer types.19 We used information on levels of activity by patient type in order to do this: specifically, we took into account the number of inpatient nights, day case admissions and outpatient visits, combining these in four different scenarios:
(a) Scenario 1: we assumed that one inpatient night was equivalent in terms of overhead costs and capital employed to one day-case treatment and that either of these were equivalent to three outpatient visits.
(b) Scenario 2: we assumed that one inpatient night was equivalent in terms of overhead costs and capital employed to one day-case treatment and that either of these were equivalent to five outpatient visits.
(c) Scenario 3: we assumed that one inpatient night was equivalent in terms of overhead costs and capital employed to 1.5 day-case treatments and that either of these were equivalent to three outpatient visits.
19 This approach seeks to identify the average cost of providing treatment to a patient of each type (ie UK or overseas), across the total number of patients treated. It assumes that overhead and capital costs are incurred approximately in proportion to the level of activity by patient type. We consider this to be a reasonable approach.
A9
(d) Scenario 4: we assumed that one inpatient night was equivalent in terms of overhead costs and capital employed to 1.5 day case treatments and that either of these were equivalent to five outpatient visits.
22. These assumptions were ‘high level’, based on our broad understanding of the time taken and capital involved in various treatment modalities. All of these scenarios assumed that the costs of treating a UK patient and an overseas patient are the same for the same length of stay/treatment modality. We recognised that there are significant uncertainties with making these types of assumptions given the broad range of medical treatments offered and differing needs of patients, which we sought to reflect in the range of scenarios considered. However, we noted that the results of the analysis are not particularly sensitive to which of these scenarios is used.
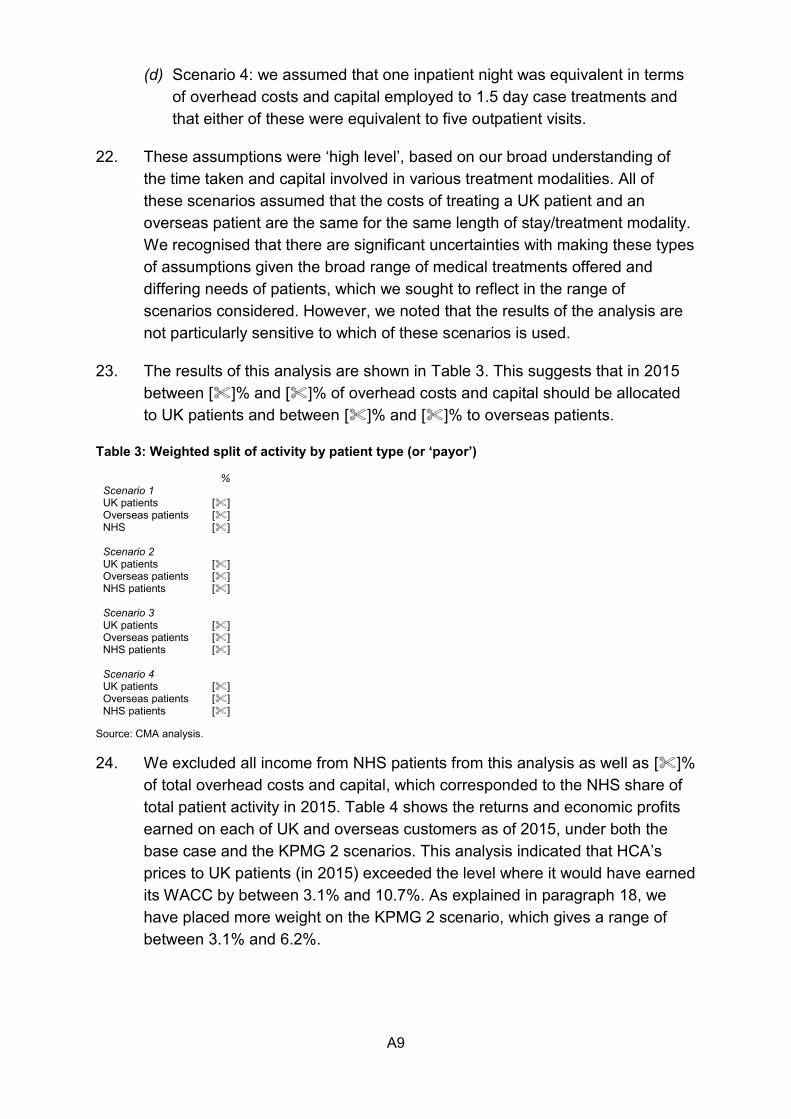
23. The results of this analysis are shown in Table 3. This suggests that in 2015 between []% and []% of overhead costs and capital should be allocated to UK patients and between []% and []% to overseas patients.
Table 3: Weighted split of activity by patient type (or ‘payor’)
% Scenario 1 UK patients [] Overseas patients [] NHS []
Scenario 2 UK patients [] Overseas patients [] NHS patients []
Scenario 3 UK patients [] Overseas patients [] NHS patients []
Scenario 4 UK patients [] Overseas patients [] NHS patients []
Source: CMA analysis. 24. We excluded all income from NHS patients from this analysis as well as []%
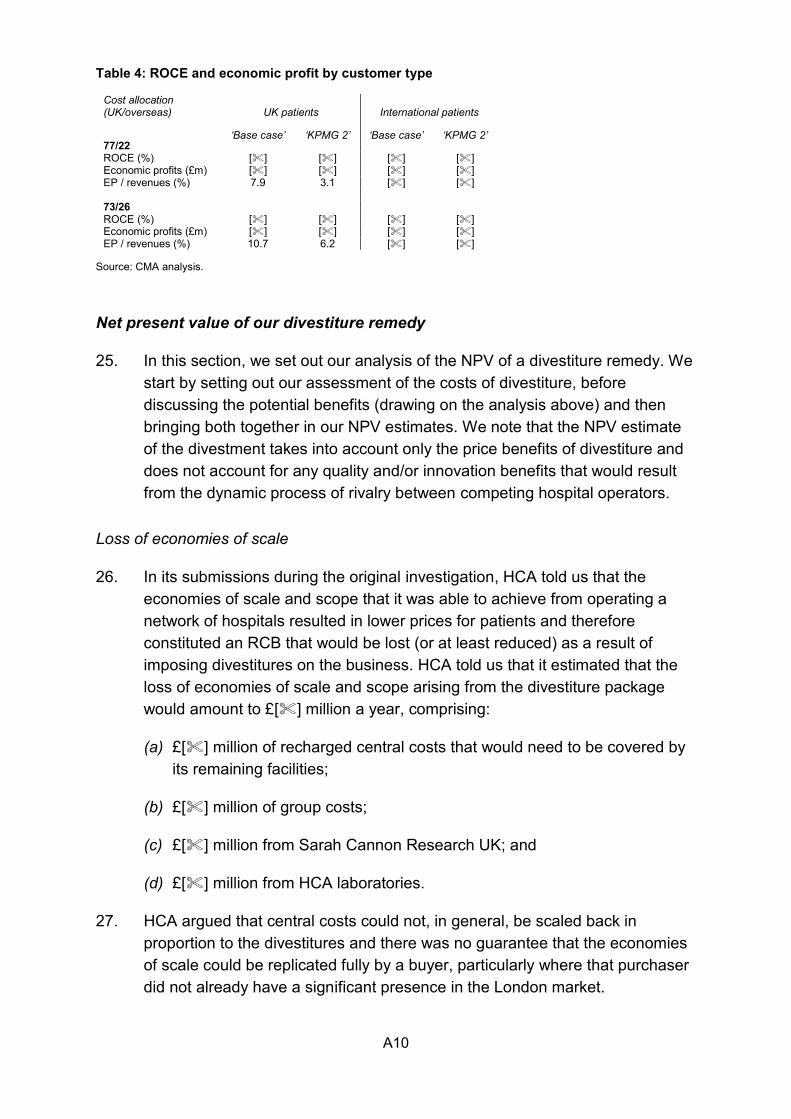
of total overhead costs and capital, which corresponded to the NHS share of total patient activity in 2015. Table 4 shows the returns and economic profits earned on each of UK and overseas customers as of 2015, under both the base case and the KPMG 2 scenarios. This analysis indicated that HCA’s prices to UK patients (in 2015) exceeded the level where it would have earned its WACC by between 3.1% and 10.7%. As explained in paragraph 18, we have placed more weight on the KPMG 2 scenario, which gives a range of between 3.1% and 6.2%.
A10
Table 4: ROCE and economic profit by customer type
Cost allocation (UK/overseas) UK patients International patients
77/22 ‘Base case’ ‘KPMG 2’ ‘Base case’ ‘KPMG 2’
ROCE (%) [] [] [] [] Economic profits (£m) [] [] [] [] EP / revenues (%) 7.9 3.1 [] [] 73/26 ROCE (%) [] [] [] [] Economic profits (£m) [] [] [] [] EP / revenues (%) 10.7 6.2 [] []
Source: CMA analysis.
Net present value of our divestiture remedy
25. In this section, we set out our analysis of the NPV of a divestiture remedy. We start by setting out our assessment of the costs of divestiture, before discussing the potential benefits (drawing on the analysis above) and then bringing both together in our NPV estimates. We note that the NPV estimate of the divestment takes into account only the price benefits of divestiture and does not account for any quality and/or innovation benefits that would result from the dynamic process of rivalry between competing hospital operators.
Loss of economies of scale
26. In its submissions during the original investigation, HCA told us that the economies of scale and scope that it was able to achieve from operating a network of hospitals resulted in lower prices for patients and therefore constituted an RCB that would be lost (or at least reduced) as a result of imposing divestitures on the business. HCA told us that it estimated that the loss of economies of scale and scope arising from the divestiture package would amount to £[] million a year, comprising:
(a) £[] million of recharged central costs that would need to be covered by its remaining facilities;
(b) £[] million of group costs;
(c) £[] million from Sarah Cannon Research UK; and
(d) £[] million from HCA laboratories.
27. HCA argued that central costs could not, in general, be scaled back in proportion to the divestitures and there was no guarantee that the economies of scale could be replicated fully by a buyer, particularly where that purchaser did not already have a significant presence in the London market.

A11
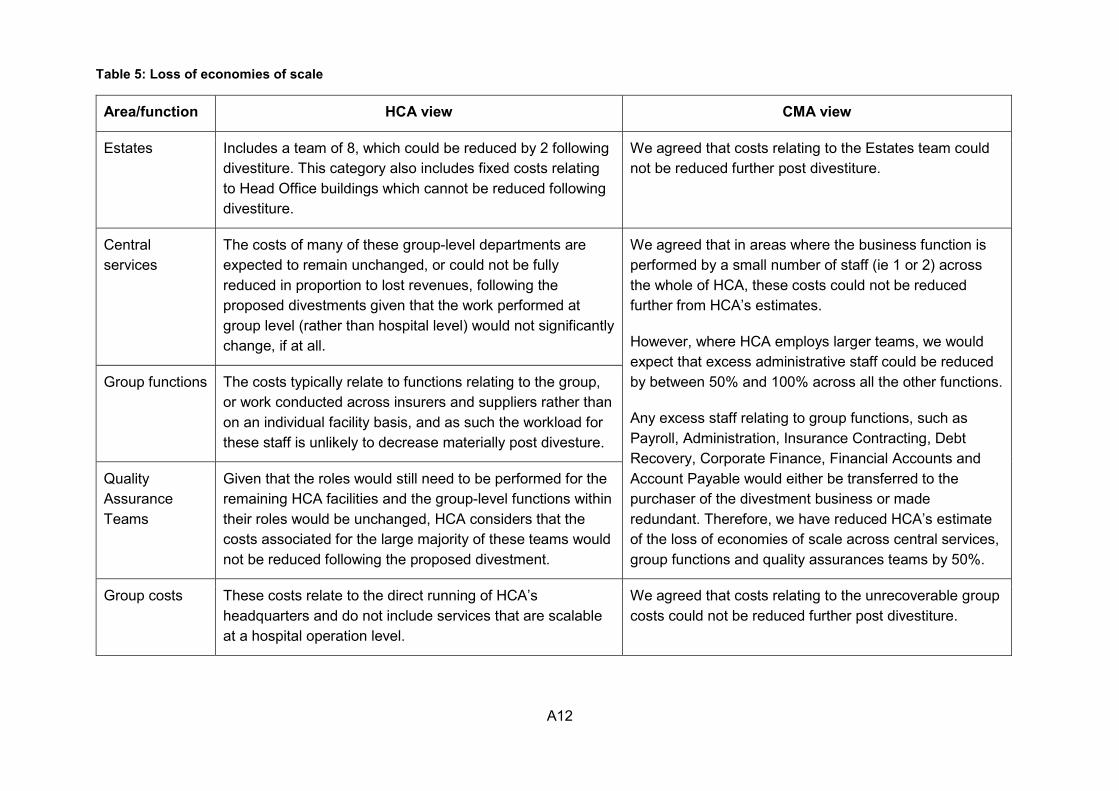
28. First, we considered the potential size of any loss of economies of scale. We took HCA’s assumption of £[] million a year loss of economies of scale as the starting point of our analysis. We have carefully considered HCA’s assumptions and estimates and we thought that, in certain areas, costs could be reduced further than HCA had assumed. Table 5 sets out HCA’s views on the likely loss of economies of scale following a divestiture, as well as our reasoning and provisional conclusions.
A12
Table 5: Loss of economies of scale
Area/function HCA view CMA view
Estates Includes a team of 8, which could be reduced by 2 following divestiture. This category also includes fixed costs relating to Head Office buildings which cannot be reduced following divestiture.
We agreed that costs relating to the Estates team could not be reduced further post divestiture.
Central services
The costs of many of these group-level departments are expected to remain unchanged, or could not be fully reduced in proportion to lost revenues, following the proposed divestments given that the work performed at group level (rather than hospital level) would not significantly change, if at all.
We agreed that in areas where the business function is performed by a small number of staff (ie 1 or 2) across the whole of HCA, these costs could not be reduced further from HCA’s estimates.
However, where HCA employs larger teams, we would expect that excess administrative staff could be reduced by between 50% and 100% across all the other functions.
Any excess staff relating to group functions, such as Payroll, Administration, Insurance Contracting, Debt Recovery, Corporate Finance, Financial Accounts and Account Payable would either be transferred to the purchaser of the divestment business or made redundant. Therefore, we have reduced HCA’s estimate of the loss of economies of scale across central services, group functions and quality assurances teams by 50%.
Group functions The costs typically relate to functions relating to the group, or work conducted across insurers and suppliers rather than on an individual facility basis, and as such the workload for these staff is unlikely to decrease materially post divesture.
Quality Assurance Teams
Given that the roles would still need to be performed for the remaining HCA facilities and the group-level functions within their roles would be unchanged, HCA considers that the costs associated for the large majority of these teams would not be reduced following the proposed divestment.
Group costs These costs relate to the direct running of HCA’s headquarters and do not include services that are scalable at a hospital operation level.
We agreed that costs relating to the unrecoverable group costs could not be reduced further post divestiture.

A13
Area/function HCA view CMA view
HCA labs HCA considers that even though the volume of tests overall may be reduced, it would still need to provide a similar level of service, therefore, would not be able to scale back its costs proportionately to the reduced volume. However, some cost reductions could be made.
We believe that HCA could make some cost reduction post divestiture (such as staff and other expenditure), albeit some other costs will be fixed (such as plant and machinery). We consider that approximately 50% of these costs could be reduced by scaling back the operation.
Sarah Cannon Research
Given the importance of SCRUK to HCA’s commitment to improving patient outcomes, it would not consider scaling back this operation.
We believe that HCA could scale back this operation if the volume of patients treated declined significantly post divestiture. HCA did not provide any evidence as to why this may not be the case.
Source: HCA submission and CMA analysis.

A14
29. As set out in Table 5, in some cases, we have included HCA’s full estimate of its loss of economies of scale, while in other cases, we have reduced the estimate by between 50% and 100% (in the case of Sarah Cannon Research). We note that this assessment involves a number of assumptions over which there is some uncertainty. As a result, we consider the results to be indicative rather than precise estimates of the likely loss of economies of scale. The table below summarises our assumptions in relation to loss of economies of scale in our ‘base case’.
Table 6: Loss of economies of scale
£ million
HCA CMA
Recharged costs – estates [] 1.02 Recharged costs – central services [] 1.67 Recharged costs – group functions [] 1.10 Recharged costs – quality assurance teams [] 0.57 Group costs [] 3.23 Variable costs – HCA labs [] 0.59 Sarah Cannon Research Institute UK [] - Total [] 8.18
Source: CMA analysis.
30. Next, we considered whether such losses should, in fact be included as a relevant cost of the purposes of our analysis. In the Final Report,20 we observed that the price difference between HCA and TLC, as measured by the IPA, could be expected to reflect any difference in the level of economies of scale realised by private hospital operators of varying sizes (since each firm’s prices should reflect their cost bases). Therefore, we did not take such a loss of economies of scale into account in our base case NPV.
31. As discussed in paragraph 2, our current approach uses our profitability analysis rather than the IPA to identify the extent to which prices may exceed the competitive level. Since the profitability of a firm is the outcome of both the prices charged and the costs incurred, we reasoned that a change in the cost base of HCA and/or the divested hospital(s) following the imposition of a divestiture remedy could result in only some proportion of the ‘economic profits’ identified in our analysis being returned to customers as a price reduction, ie to the extent that divestiture increased the cost base of one or more operators in the industry, this could increase the ‘competitive’ level of prices. On this basis, our current view is that the potential loss of economies of scale should be taken into account in estimating the NPV of a divestiture remedy.21
20 Final Report, paragraph 11.206. 21 Including the loss of economies of scale effectively reduces the price benefit of a divestiture remedy.
A15
Transaction and reorganisation costs
32. During the original investigation, HCA estimated that it would incur transaction costs of between £[] million and £[] million if it were required to divest two of its hospitals, comprising M&A fees of between £[] million and £[] million, legal fees of between £[] million and £[] million, due diligence fees of between £[] million and £[] million and various other costs amounting to £[] million. During the original investigation, HCA told us that the lower end of this range represented a sale to a single purchaser and the upper end represented a disposal to two separate purchasers, and suggested that we should use the upper end of the range (ie £[] million). In addition, HCA put forward the view that we should take into account the costs incurred by a purchaser of the hospitals, which it estimated at between £[] million and £[] million, giving total transaction costs of between £7.5 million and £10.85 million. In its response to the Remedies Notice, HCA indicated that these costs were likely to have increased since the date of the Final Report and would need to be reassessed.22
33. We do not have a view as to whether the disposal would be to one buyer or multiple buyers. Therefore, in relation to various of the transaction costs, we thought that the middle point of the range given by HCA was appropriate for our analysis. However, we reviewed the transaction cost figures submitted by HCA during the original investigation and made the following adjustments:
(a) we took [] M&A fees of £3 million (equating to approx. 1% of the property value);
(b) similarly, for legal fees, [];
(c) we discounted the political adviser fees as we did not consider that either vendor or purchaser would need to incur such costs;
(d) we observed that due diligence fees are only incurred by the buyer, not both by the buyer and seller (HCA). Therefore, we removed these costs from HCA’s estimate of the fees to the vendor;
(e) we noted that tax restructuring and property valuation fees would be covered by the legal and M&A fees, respectively, and therefore we have excluded these to avoid double-counting.
22 HCA Response to the Remedies Notice, paragraph 3.165.
A16
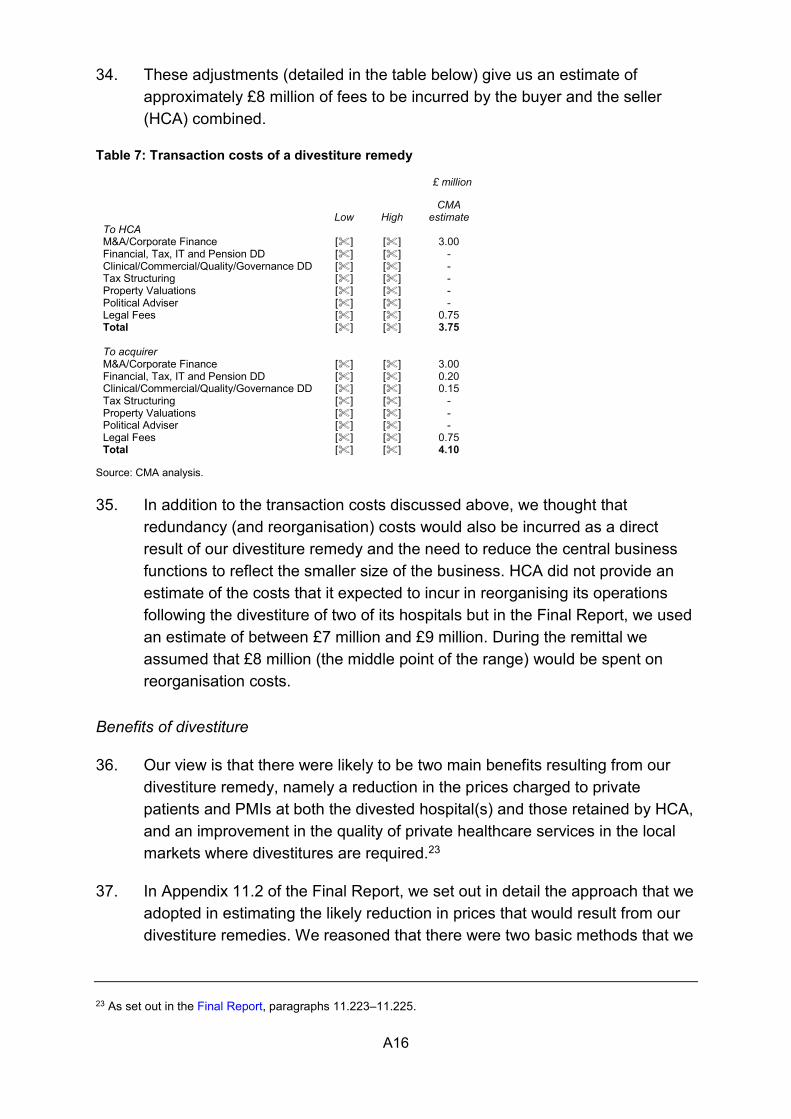
34. These adjustments (detailed in the table below) give us an estimate of approximately £8 million of fees to be incurred by the buyer and the seller (HCA) combined.
Table 7: Transaction costs of a divestiture remedy
£ million
Low High
CMA estimate
To HCA M&A/Corporate Finance [] [] 3.00 Financial, Tax, IT and Pension DD [] [] - Clinical/Commercial/Quality/Governance DD [] [] - Tax Structuring [] [] - Property Valuations [] [] - Political Adviser [] [] - Legal Fees [] [] 0.75 Total [] [] 3.75 To acquirer M&A/Corporate Finance [] [] 3.00 Financial, Tax, IT and Pension DD [] [] 0.20 Clinical/Commercial/Quality/Governance DD [] [] 0.15 Tax Structuring [] [] - Property Valuations [] [] - Political Adviser [] [] - Legal Fees [] [] 0.75 Total [] [] 4.10
Source: CMA analysis. 35. In addition to the transaction costs discussed above, we thought that
redundancy (and reorganisation) costs would also be incurred as a direct result of our divestiture remedy and the need to reduce the central business functions to reflect the smaller size of the business. HCA did not provide an estimate of the costs that it expected to incur in reorganising its operations following the divestiture of two of its hospitals but in the Final Report, we used an estimate of between £7 million and £9 million. During the remittal we assumed that £8 million (the middle point of the range) would be spent on reorganisation costs.
Benefits of divestiture
36. Our view is that there were likely to be two main benefits resulting from our divestiture remedy, namely a reduction in the prices charged to private patients and PMIs at both the divested hospital(s) and those retained by HCA, and an improvement in the quality of private healthcare services in the local markets where divestitures are required.23
37. In Appendix 11.2 of the Final Report, we set out in detail the approach that we adopted in estimating the likely reduction in prices that would result from our divestiture remedies. We reasoned that there were two basic methods that we
23 As set out in the Final Report, paragraphs 11.223–11.225.
A17
could take to estimate the likely change in total revenues resulting from a change in concentration. The first was to apply the coefficient identified in our PCA analysis to the changes in the weighted average market share of the hospitals to identify the price effect for self-pay patients, which could then be applied to revenues to estimate the total impact on revenues that divestiture would have. The second approach was to use the results of our IPA to estimate the impact that divestiture would have on revenues from insured patients on the basis that it was effective in reducing HCA’s market power to a level equivalent to that of TLC.
38. As set out in paragraph 2, we are no longer able to rely on the IPA to estimate the potential price impact of a divestiture remedy. As a result, we have used an updated profitability analysis to estimate the extent to which HCA’s prices may exceed the competitive level. This analysis gives a range of potential price effects of between 3.1% and 10.7%, although we have placed greater weight on the lower end of this range, ie for the purpose of calculating the NPV of benefits to customers we have used a price reduction of between 3% and 6%.24
NPV analysis
39. Our NPV analysis brings together the costs and benefits, as discussed above. We have made a number of assumptions in estimating the NPV of our divestiture remedies, including:
(a) The one-off costs of divestiture are approximately £[] million for HCA, as discussed above. We reasoned that the transaction costs (£[] million) would be incurred in the first year, while the reorganisation costs (£8.0 million) would be incurred equally across the first two years following divestiture (50% in Year 1 and 50% in Year 2).
(b) The ongoing costs of divestiture – associated with a loss of economies of scale – are zero in our ‘upside case’ for all years, £8.2 million per year in our ‘base case’ and £[] million per year in our ‘downside case’.
(c) We applied the price reduction to year-end 2015 HCA revenues for UK patients only (both insured and self-pay) across inpatient and day-case treatments, as we considered that there may currently be a greater competitive constraint on outpatient treatments.
24 This is the result of our reassessment of the likely capital value of HCA’s land and buildings, as discussed in paragraph 16.

A18
(d) We projected the costs and benefits over a three, five, seven and ten-year period.
(e) We have used a discount rate of 3.5%, in line with the HM Treasury Green Book25 approach.
40. Table 8 below shows our estimates of the likely impact on revenues of the divestiture of HCA’s hospitals. Our ‘base case’ estimates indicate net benefits of between –£1.5 million and £6.4 million over five years when assuming a 3% to 6% decrease in HCA tariffs. Our ‘upside case’ estimate is of net benefit of between £35.5 million and £43.4 million, while the ‘downside case’ estimate gives negative results (between –£21.9 million and –£13.9 million), meaning that there would be net costs over a five-year period.
Table 8: NPV of divestiture
£’000
NPV estimate UK self pay & insured sensitivities 3.0%
Loss of economies of scale Year 3 Year 5 Year 7 Year 10 £[] million – downside case (28,345) (21,858) (15,802) (7,465) £8.2 million – base case (15,737) (1,540) 11,713 29,960 £0 million – upside case 7,236 35,483 61,853 98,156
6.0% Loss of economies of scale Year 3 Year 5 Year 7 Year 10 £[] million – downside case (24,804) (13,884) (3,690) 10,344 £8.2 million – base case (12,196) 6,434 23,825 47,768 £0 million – upside case 10,777 43,457 73,964 115,965
Source: CMA analysis.
25 HM Treasury guidance for public sector bodies on how to appraise programmes or projects.

Glos-1
Glossary
Act The Enterprise Act 2002.
Admission A patient will be admitted to hospital where their treatment requires admission to a hospital bed. This is a clinical decision and a patient admitted may be admitted either as a day-case patient or as an inpatient.
AEC Adverse effect on competition as set out in section 134(2) of the Act.
Aviva Aviva Health UK Limited, a principal subsidiary of Aviva plc, provider of insurance, savings and investment products.
AXA PPP AXA PPP healthcare, a subsidiary of The AXA Group and provider of PMI.
BMI BMI Healthcare Limited and any company in the group as appropriate, part of General Healthcare Group (GHG), a private hospital group in the UK.
Bupa The British United Provident Association Limited, a provider of PMI and a hospital operator.
C&W Cushman & Wakefield, a global real estate services firm
Catchment area Geographical area from which a hospital draws its patients.
CC Competition Commission.
CC3 Guidelines for market investigations: Their role, procedures, assessment and remedies (April 2013).
CCAG C&C Alpha Group, a UK-based private equity firm with worldwide investments in healthcare.
Central London The NUTS 2 region of Inner London, which roughly coincides with the areas within the North and South Circular Roads. Inner London consists of Camden, City of London, Hackney, Hammersmith and Fulham, Haringey, Islington, Kensington and Chelsea, Lambeth, Lewisham, Newham, Southwark, Tower Hamlets, Wandsworth, and Westminster.
Glos-2
Clinician A health professional such as a GP, consultant, other physician or nurse involved in the care of patients.
CMA Competition and Markets Authority.
Consultant A registered medical practitioner who holds, has held, or is qualified to hold, an appointment as a consultant in the NHS in a specialty other than general practice or whose name is on the register of specialists kept by the GMC. A consultant may work exclusively for the NHS or in private practice or a combination of the two. Except where the context otherwise provides, consultant refers to a consultant in private practice whether or not they also work in the NHS.
Corporate PMI PMI provided by an employer to its employees and in some cases dependants of the employee.
Cost of capital The return that investors in a project expect to receive over the period of that investment. It is an opportunity cost and can be seen as the yield on capital employed in the next best alternative use.
Day-case patient A patient admitted during the course of a day with the intention of receiving care without requiring the use of a hospital bed overnight. If the patient’s treatment then results in an unexpected overnight stay they will be admitted as an inpatient.
EBITDA Earnings before interest, tax, depreciation and amortisation.
EP Economic profit, defined as profits in excess of the WACC.
Embassy patient An overseas patient, any patient of any nationality who is not ordinarily resident in the UK.
Final Report The Final Report of the original investigation dated 2 April 2014.
GMC The General Medical Council.
Greater London The combined area of central London and outer London, synonymous with London.
HCA HCA International Limited and any company in the group as appropriate, a private hospital operator.
Glos-3
Healthcare provider A person that provides preventive, curative, promotional, or rehabilitative healthcare services including a hospital, clinic, GP, consultant or other medical professional.
Healthcode A provider of online practice management software and services to the private healthcare market. Healthcode processes medical bills for private hospitals and PPUs, acting as an intermediary between private hospitals and PMIs.
HM Treasury Green Book
HM Treasury guidance for public sector bodies on how to appraise proposals before committing funds to a policy, programme or project.
Hospital services All services provided by a private hospital including inpatient, day-case and outpatient services. Where it is necessary in this report to distinguish between different types of hospital services this is made clear in the text.
ICU Intensive Care Unit.
Inpatient A patient admitted to hospital with the expectation that they will remain in hospital for at least one night.
Insured patient A patient who will use PMI to pay (in whole or in part/the majority) for their medical care.
IPA Insured Pricing Analysis.
LOC Leaders in Oncology Care, run by London Oncology Centre, a specialist cancer treatment centre set up by four consultants in 2005.
London The combined area of central London and outer London, synonymous with Greater London.
Medical treatment Except where the context otherwise provides, medical treatment includes medical, surgical and/or diagnostic/pathology treatments.
NHS National Health Services in England, Scotland and Wales and the Health and Social Care Services in Northern Ireland.
NHS trust A public benefit healthcare organisation created by Act of Parliament to treat NHS patients.
Glos-4
NPV Net present value.
Nuffield Nuffield Health and any company in the group as appropriate, a private hospital operator.
OFT Office of Fair Trading.
Outer London The NUTS 2 region of Outer London, roughly the area between the North and South Circular Roads and the M25 ring road. Outer London consists of Barking and Dagenham, Barnet, Bexley, Brent, Bromley, Croydon, Ealing, Enfield, Greenwich, Harrow, Havering, Hillingdon, Hounslow, Kingston upon Thames, Merton, Redbridge, Richmond upon Thames, Sutton, and Waltham Forest.
Outpatient A patient treated in a hospital, consulting room or clinic, who is not admitted.
PCA Price concentration analysis.
PDR The remittal provisional decision on remedies
PFs The remittal provisional findings published on 10 November 2015.
PMI/insurer As the context provides, either a private medical insurer or private medical insurance. Private medical insurance is an insurance product under which an insurer agrees to cover the costs, in whole or in part, of acute medical care. Insurer in this report refers to a PMI.
PPU Private patient unit, a facility within the NHS providing medical care to private patients. Such units may be separate units dedicated to private patients or facilities within the main NHS site that are made available to private patients either on a dedicated or non-dedicated basis.
Private healthcare facilities
Any facility providing medical treatments on an inpatient, day-case and/or outpatient basis, which charges fees for its services including a PPU.
Private healthcare provider
A healthcare provider that charges fees for its services.
Private hospital A facility which provides inpatient hospital services that charges fees for its services including a PPU. Except where
Glos-5
the context provides otherwise, in this report hospital refers to a private hospital.
Private hospital operator
A person that operates a private hospital including where relevant the NHS in relation to PPUs.
Privately funded healthcare services/ private healthcare
Services provided to patients via private facilities/clinics including PPUs through the services of consultants, medical and clinical professionals who work within such facilities.
Private patient A patient who is charged for medical services either as a self-pay patient or as an insured patient.
RCB Relevant customer benefit, as defined by section 134(8) of the Act.
Remedies Notice The notice of possible remedies published on the same date as publication of the remittal provisional findings report.
ROCE Return on capital employed.
Self-pay patient A patient who pays for their medical care themselves.
Specialties The GMC divides areas of medical care into 65 specialties.
Spire Spire Healthcare Limited and any company in the group as appropriate, a private hospital operator.
Sunsetted Intentionally terminating or phasing out a remedy.
TLC The London Clinic, a private hospital operator.
VOA Valuation Office Agency.
WACC Weighted average cost of capital
WCC Westminster City Council.