Embed Size (px)
Citation preview
American Journal of Applied Mathematics 2020; 8(4): 182-189 http://www.sciencepublishinggroup.com/j/ajam doi: 10.11648/j.ajam.20200804.13 ISSN: 2330-0043 (Print); ISSN: 2330-006X (Online)
Profit Optimization of an Apparel Industry in Bangladesh by Linear Programming Model
F. M. Shakirullah1, *
, Main Uddin Ahammad1, Mohammed Forhad Uddin
2
1Department of Mathematics, Dhaka University of Engineering and Technology, Gazipur, Bangladesh 2Department of Mathematics, Bangladesh University of Engineering and Technology, Dhaka, Bangladesh
Email address:
*Corresponding author
To cite this article: F. M. Shakirullah, Main Uddin Ahammad, Mohammed Forhad Uddin. Profit Optimization of an Apparel Industry in Bangladesh by Linear
Programming Model. American Journal of Applied Mathematics. Vol. 8, No. 4, 2020, pp. 182-189. doi: 10.11648/j.ajam.20200804.13
Received: March 11, 2020; Accepted: March 27, 2020; Published: July 17, 2020
Abstract: Efficient use of resources in production stages is very much important for every industry. For sustainable development
of industry, efficacious management decision making techniques may be employed to analyze and utilize resources. Linear
programming, as a quantitative decision-making tool, can be engaged by the managements for enhancing resource utilization along
with increasing profit and decreasing cost. Proper allocation and usage of resources like available processing time at different stages,
labors, materials such as fabrics and sewing threads is the tacit factor for profitability of an apparel manufacturing firm. Apparel
processes such as cutting, sewing, washing, dying, trimming and finishing are needed to be optimized for lead time management.
This study formulated a linear programming model to maximize profit and minimize cost of apparel industries. The model also
optimizes the utilization of resources. This paper considers a knit garment manufacturing unit of Bangladesh which is situated in
Gazipur district. Data containing monthly resources utilization amount, product volume, profit per unit on different types of products
have been collected from the case industry. The data collected was used as the parameters of the proposed linear programming to
validate the model. The model was implemented and solved by the Microsoft Excel Solver as well by AMPL. This research revealed
that the profit of the case company can be increased by 22% when there is sufficient demand and that can be 12.33% when clients’
requests are to be met. On the other hand, cost may be decreased by 37% by using the LPP model.
Keywords: Apparel Industry, Linear Programming, Resource Utilization, Solver, Optimization
1. Introduction
The apparel sector of Bangladesh has got a greater
attention than any other industry for its rapid growth and
major share in foreign exchange earnings. Bangladesh is the
second largest apparel exporter in the world after China. The
market share of Bangladesh, in the $447 billion global
garment earnings is 6.5 percent, according to data from the
International Trade Statistics of the World Bank in 2017. Its
contribution to the national economy by creating huge
employment opportunities and reducing poverty through
socioeconomic development is beyond anticipation. The
Ready-Made Garments (RMG) holds almost 14.07 percent of
the GDP of Bangladesh as well as the 83 percent of the total
export earnings. During the last three decades, the RMG
industry contributed significantly through creation of
physical infrastructure which is demonstrated by 4560 RMG
units along with the development of human capital as around
4 million work force are directly involved in this industry. It
has also contributed tremendously through empowering
women as almost 90 percent of its labor force is female.
Table 1. Global Market Share of RMG.
Country Global Market Share
(%)
Export Earnings in
$ Billion
China 34.4 158
Bangladesh 6.5 29
Vietnam 5.9 27
India 4.1 18
Turkey 3.3 15
Indonesia 1.8 8
Cambodia 1.6 7
Source: WTO, 2017
However, efficient supply chain management with proper
American Journal of Applied Mathematics 2020; 8(4): 182-189 183
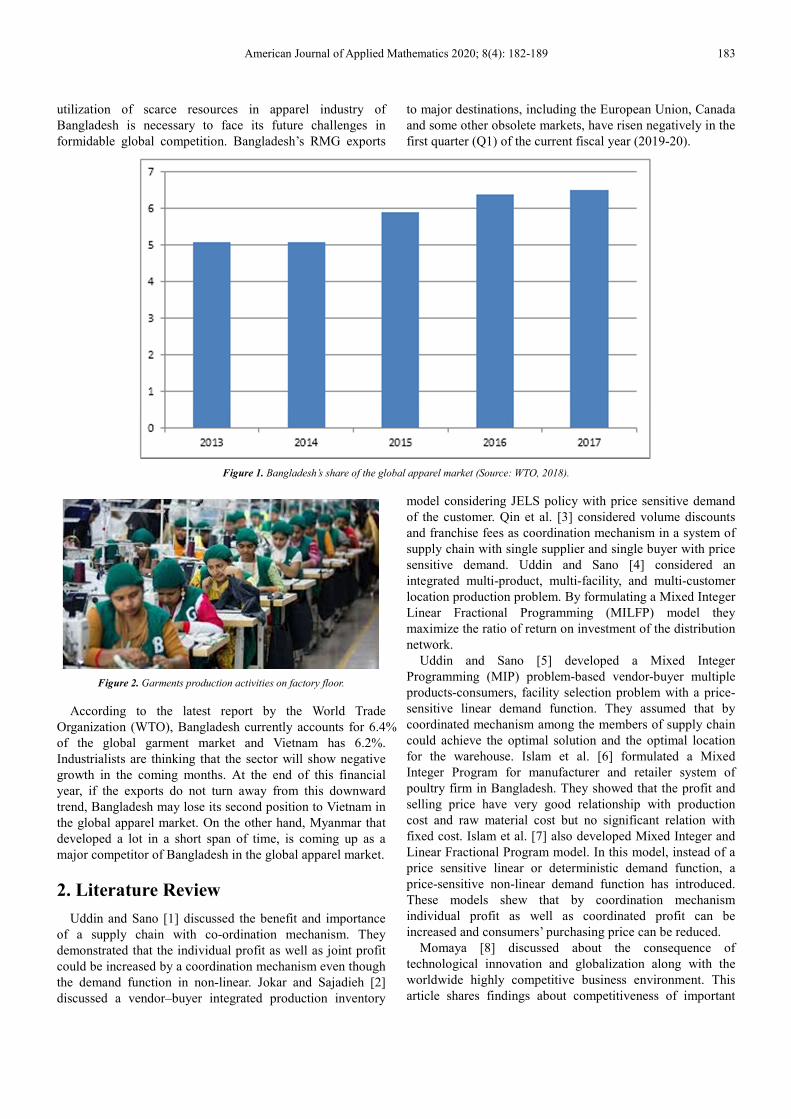
utilization of scarce resources in apparel industry of
Bangladesh is necessary to face its future challenges in
formidable global competition. Bangladesh’s RMG exports
to major destinations, including the European Union, Canada
and some other obsolete markets, have risen negatively in the
first quarter (Q1) of the current fiscal year (2019-20).
Figure 1. Bangladesh’s share of the global apparel market (Source: WTO, 2018).
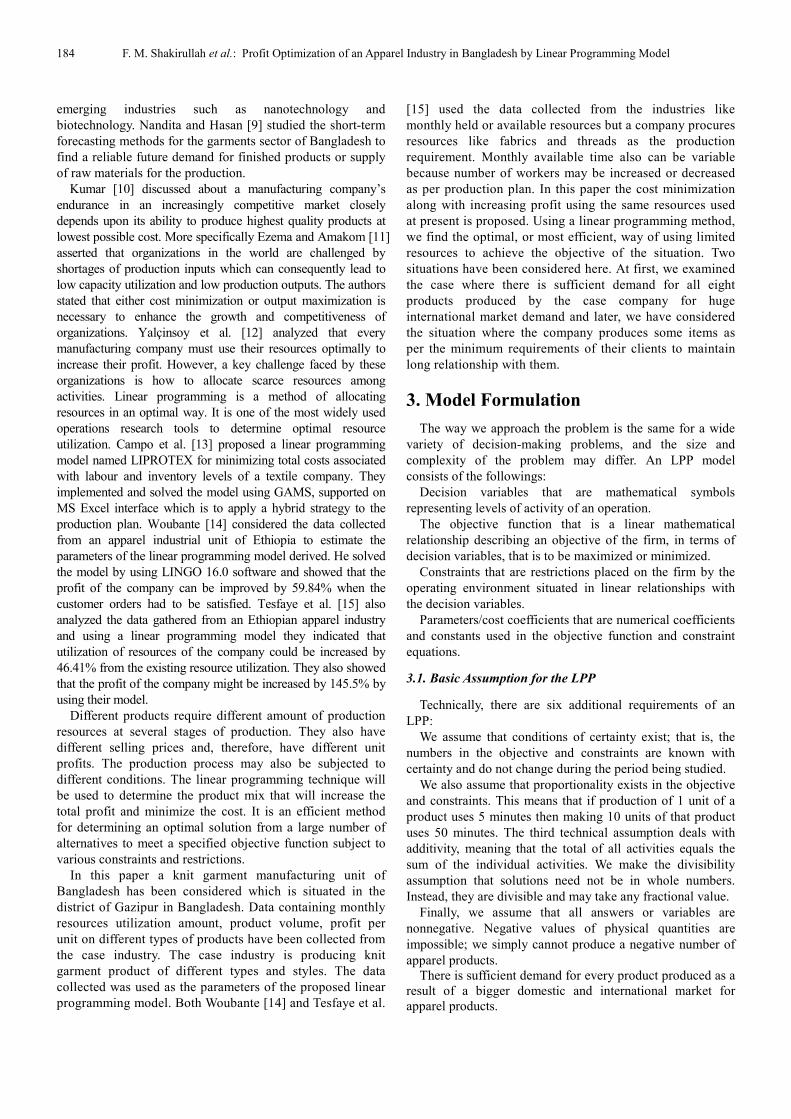
Figure 2. Garments production activities on factory floor.
According to the latest report by the World Trade
Organization (WTO), Bangladesh currently accounts for 6.4%
of the global garment market and Vietnam has 6.2%.
Industrialists are thinking that the sector will show negative
growth in the coming months. At the end of this financial
year, if the exports do not turn away from this downward
trend, Bangladesh may lose its second position to Vietnam in
the global apparel market. On the other hand, Myanmar that
developed a lot in a short span of time, is coming up as a
major competitor of Bangladesh in the global apparel market.
2. Literature Review
Uddin and Sano [1] discussed the benefit and importance
of a supply chain with co-ordination mechanism. They
demonstrated that the individual profit as well as joint profit
could be increased by a coordination mechanism even though
the demand function in non-linear. Jokar and Sajadieh [2]
discussed a vendor–buyer integrated production inventory
model considering JELS policy with price sensitive demand
of the customer. Qin et al. [3] considered volume discounts
and franchise fees as coordination mechanism in a system of
supply chain with single supplier and single buyer with price
sensitive demand. Uddin and Sano [4] considered an
integrated multi-product, multi-facility, and multi-customer
location production problem. By formulating a Mixed Integer
Linear Fractional Programming (MILFP) model they
maximize the ratio of return on investment of the distribution
network.
Uddin and Sano [5] developed a Mixed Integer
Programming (MIP) problem-based vendor-buyer multiple
products-consumers, facility selection problem with a price-
sensitive linear demand function. They assumed that by
coordinated mechanism among the members of supply chain
could achieve the optimal solution and the optimal location
for the warehouse. Islam et al. [6] formulated a Mixed
Integer Program for manufacturer and retailer system of
poultry firm in Bangladesh. They showed that the profit and
selling price have very good relationship with production
cost and raw material cost but no significant relation with
fixed cost. Islam et al. [7] also developed Mixed Integer and
Linear Fractional Program model. In this model, instead of a
price sensitive linear or deterministic demand function, a
price-sensitive non-linear demand function has introduced.
These models shew that by coordination mechanism
individual profit as well as coordinated profit can be
increased and consumers’ purchasing price can be reduced.
Momaya [8] discussed about the consequence of
technological innovation and globalization along with the
worldwide highly competitive business environment. This
article shares findings about competitiveness of important
184 F. M. Shakirullah et al.: Profit Optimization of an Apparel Industry in Bangladesh by Linear Programming Model
emerging industries such as nanotechnology and
biotechnology. Nandita and Hasan [9] studied the short-term
forecasting methods for the garments sector of Bangladesh to
find a reliable future demand for finished products or supply
of raw materials for the production.
Kumar [10] discussed about a manufacturing company’s
endurance in an increasingly competitive market closely
depends upon its ability to produce highest quality products at
lowest possible cost. More specifically Ezema and Amakom [11]
asserted that organizations in the world are challenged by
shortages of production inputs which can consequently lead to
low capacity utilization and low production outputs. The authors
stated that either cost minimization or output maximization is
necessary to enhance the growth and competitiveness of
organizations. Yalçinsoy et al. [12] analyzed that every
manufacturing company must use their resources optimally to
increase their profit. However, a key challenge faced by these
organizations is how to allocate scarce resources among
activities. Linear programming is a method of allocating
resources in an optimal way. It is one of the most widely used
operations research tools to determine optimal resource
utilization. Campo et al. [13] proposed a linear programming
model named LIPROTEX for minimizing total costs associated
with labour and inventory levels of a textile company. They
implemented and solved the model using GAMS, supported on
MS Excel interface which is to apply a hybrid strategy to the
production plan. Woubante [14] considered the data collected
from an apparel industrial unit of Ethiopia to estimate the
parameters of the linear programming model derived. He solved
the model by using LINGO 16.0 software and showed that the
profit of the company can be improved by 59.84% when the
customer orders had to be satisfied. Tesfaye et al. [15] also
analyzed the data gathered from an Ethiopian apparel industry
and using a linear programming model they indicated that
utilization of resources of the company could be increased by
46.41% from the existing resource utilization. They also showed
that the profit of the company might be increased by 145.5% by
using their model.
Different products require different amount of production
resources at several stages of production. They also have
different selling prices and, therefore, have different unit
profits. The production process may also be subjected to
different conditions. The linear programming technique will
be used to determine the product mix that will increase the
total profit and minimize the cost. It is an efficient method
for determining an optimal solution from a large number of
alternatives to meet a specified objective function subject to
various constraints and restrictions.
In this paper a knit garment manufacturing unit of
Bangladesh has been considered which is situated in the
district of Gazipur in Bangladesh. Data containing monthly
resources utilization amount, product volume, profit per
unit on different types of products have been collected from
the case industry. The case industry is producing knit
garment product of different types and styles. The data
collected was used as the parameters of the proposed linear
programming model. Both Woubante [14] and Tesfaye et al.
[15] used the data collected from the industries like
monthly held or available resources but a company procures
resources like fabrics and threads as the production
requirement. Monthly available time also can be variable
because number of workers may be increased or decreased
as per production plan. In this paper the cost minimization
along with increasing profit using the same resources used
at present is proposed. Using a linear programming method,
we find the optimal, or most efficient, way of using limited
resources to achieve the objective of the situation. Two
situations have been considered here. At first, we examined
the case where there is sufficient demand for all eight
products produced by the case company for huge
international market demand and later, we have considered
the situation where the company produces some items as
per the minimum requirements of their clients to maintain
long relationship with them.
3. Model Formulation
The way we approach the problem is the same for a wide
variety of decision-making problems, and the size and
complexity of the problem may differ. An LPP model
consists of the followings:
Decision variables that are mathematical symbols
representing levels of activity of an operation.
The objective function that is a linear mathematical
relationship describing an objective of the firm, in terms of
decision variables, that is to be maximized or minimized.
Constraints that are restrictions placed on the firm by the
operating environment situated in linear relationships with
the decision variables.
Parameters/cost coefficients that are numerical coefficients
and constants used in the objective function and constraint
equations.
3.1. Basic Assumption for the LPP
Technically, there are six additional requirements of an
LPP:
We assume that conditions of certainty exist; that is, the
numbers in the objective and constraints are known with
certainty and do not change during the period being studied.
We also assume that proportionality exists in the objective
and constraints. This means that if production of 1 unit of a
product uses 5 minutes then making 10 units of that product
uses 50 minutes. The third technical assumption deals with
additivity, meaning that the total of all activities equals the
sum of the individual activities. We make the divisibility
assumption that solutions need not be in whole numbers.
Instead, they are divisible and may take any fractional value.
Finally, we assume that all answers or variables are
nonnegative. Negative values of physical quantities are
impossible; we simply cannot produce a negative number of
apparel products. There is sufficient demand for every product produced as a
result of a bigger domestic and international market for apparel products.
American Journal of Applied Mathematics 2020; 8(4): 182-189 185
3.2. General Form of the LP Model
In general, if P = (p1, p2, p3, …, pn) is a tuple of real numbers, then the function f of real variables X = (x1, x2, x3,…, xn) defined by f (X) = p1 x1 + p2 x2 + p3x3+ … + pnxn is known as a linear function. If g is a linear function and b = (b1, b2, b3, …, bn) is a tuple of real numbers, then g(x) = b is called a linear equation, whereas g(x) (≤, ≥) b is called a linear inequality. A linear constraint is one that is either a linear equation or a linear inequality. A linear programming problem (LPP) is one which optimizes (maximizes or minimizes) a linear function subject to a finite collection of
linear constraints. Formally, any LPP having � decision variables can be written in the following form:
Maximize Z= ∑ �������
Subject to ∑ ������� ≤ ��, � = 1,2,3, … , �
�� ≥ 0, � = 1, 2, 3, … , �
When �� , �� , �� �� ��������.
The problem is to find the values of the decision variables
�j that optimize the objective function ! subject to the m
constraints and the non-negativity restrictions on the �j
variables. The resulting set of decision variables that
optimize the objective function is called the optimal solution.
This study attempts to identify the existing resource utilization
level and profit per month and compare them with the optimal
solutions obtained from solving the LPP models developed by the
MS Excel Solver and the mathematical programming language,
AMPL. Two models have been developed:
i. When there is sufficient demand;
ii. When some items are produced according to the request
of client for upholding long lasting relationship.
3.3. Model with Sufficient Demand
The model decision variables on the number of products to
be produced are set as:
x1= Girls’ T-shirt;
x2= Keiki Boy’s Long-johns;
x3= Boy’s College Hoodie;
x4= Boy’s Under ware;
x5= Girl’s Cardigan;
x6= Girl’s Leggings
x7= Girl’s College Shirt;
x8= Girl’s T-shirt L/S
The linear programming model, maximizing the total
profit in BD Taka is:
Maximize Z= a1x1+ a2x2+ a3x3+ a4x4+ a5x5+ a6x6+ a7x7+
a8x8
Subject to
Fabric:
a11x1+ a12x2+ a13x3+ a14x4+ a15x5+ a16x6+ a17x7+ a18x8 ≤ b1
Thread:
a21x1+ a22x2+ a23x3+ a24x4+ a25x5+ a26x6+ a27x7+ a28x8 ≤ b2
Labor:
a31x1+ a32x2+ a33x3+ a34x4+ a35x5+ a36x6+ a37x7+ a38x8 ≤ b3
Material:
a41x1+ a42x2+ a43x3+ a44x4+ a45x5+ a46x6+ a47x7+ a48x8 ≤ b4
Cutting:
a51x1+ a52x2+ a53x3+ a54x4+ a55x5+ a56x6+ a57x7+ a58x8 ≤ b5
Sewing:
a61x1+ a62x2+ a63x3+ a64x4+ a65x5+ a66x6+ a67x7+ a68x8 ≤ b6
Trimming:
a71x1+ a72x2+ a73x3+ a74x4+ a75x5+ a76x6+ a77x7+ a78x8 ≤ b7
Finishing:
a81x1+ a82x2+ a83x3+ a84x4+ a85x5+ a86x6+ a87x7+ a88x8 ≤ b8
Packing:
a81x1+ a82x2+ a83x3+ a84x4+ a85x5+ a86x6+ a87x7+ a88x8 ≤ b8
Non negative restrictions: x1, x2, x3, x4, x5, x6, x7, x8 ≥0
3.4. Model with Requested Demand
The model decision variables on the number of products to
be produced and the objective function are same as the
previous model with sufficient demand. All constrains are
also same but instead of non-negative restrictions following
conditions on decision variables are imposed:
x1≥r1, x2 ≥ r2
x3 ≥ r3, x4 ≥ r4
x5 ≥ r5, x6 ≥ r5
x7 ≥ r7, x8 ≥ r8
Where r1, r2, r3, r4, r5, r6, r7 and r8 are the minimum
production volumes requested by the buyers keeping in touch
with the industry for long time.
4. Material and Methods
We worked with primary data where data collection
procedure was quantitative in nature and relied on face-to-
face interview with the members of the management,
merchandisers, line supervisors and accountant of the
company according to the existing record kept. The company
we are considering is currently producing eight types of
garments products. The study attempts to identify the
existing resource utilization level and profit per month and
compare them with the optimal solution obtained from
solving the LPP model we developed. We have solved the
model using MS Excel Solver as well as by AMPL and got
the same solutions by using both the solver tools.
Relevant information collected from the case company, the
time consumption to produce different products, monthly
production, profit, cost and material utilization per unit. is
summarized in table 2, table 3 and table 4.
Table 2. Operation wise needed time in minute per unit.
Style Cutting Sewing Trimming Finishing Packing
1 0.4 6.4 0.4 0.4 0.4
2 0.3 5.3 0.3 0.3 0.3
3 0.5 5.5 0.5 0.5 0.5
4 0.2 5.2 0.2 0.2 0.2
5 0.6 7.6 0.3 0.6 0.6
6 0.5 6.5 0.3 0.5 0.5
7 0.4 5.4 0.4 0.4 0.4
8 0.5 7.5 0.4 0.5 0.5
Source: The case company
186 F. M. Shakirullah et al.: Profit Optimization of an Apparel Industry in Bangladesh by Linear Programming Model
Table 3. Material utilization and cost per unit.
Style Fabric needed
(grams)
Thread needed
(meter)
Labor cost
(Taka)
Material
cost (Taka)
1 128 120 28 131
2 121 110 25 144
3 246 220 65 220
4 100 70 22 120
5 180 220 60 240
6 131 120 25 125
7 165 120 30 155
8 120 115 25 140
Source: The case company
Table 4. Monthly production and profit per unit.
Style Monthly production (pieces) Profit per unit (Taka)
1 8000 42
2 14000 36
Style Monthly production (pieces) Profit per unit (Taka)
3 8000 40
4 7000 30
5 12000 35
6 10000 40
7 12000 30
8 11000 25
Source: The case company
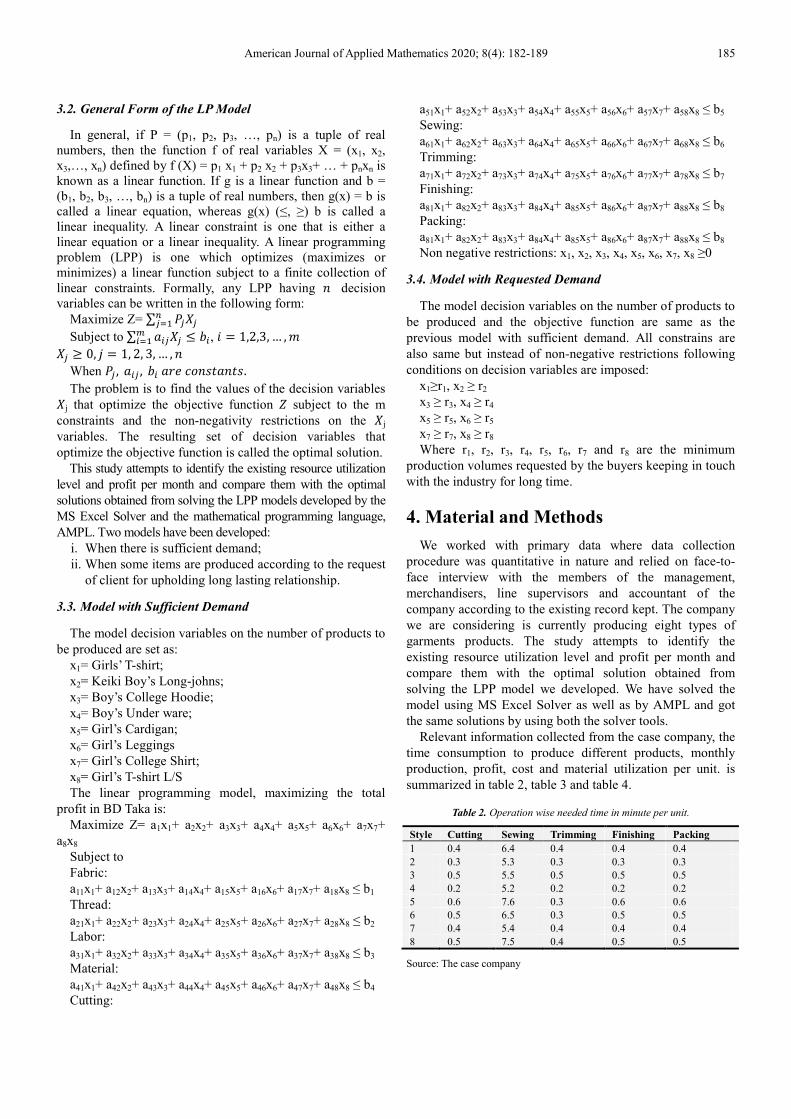
5. Results and Discussion
At first, we examined the case where demand is sufficient
for all eight products and later, we have considered the
situation where the company produces some items as per the
requests of their clients to maintain long relationship with
them. Table 5, table 6 and figure 3, show the profit increases
in both situations.
Table 5. Profit maximization in case of sufficient demand.
Profit achieved from LPP model (Taka) Profit achieved by Industry (Taka) Increase in Profit (Taka) Percentage of profit increase
34,20,623.45 28,25,000 5,95,623.45 21.08%
Table 6. Profit maximization in case of requested production.
Profit achieved from LPP model (Taka) Profit achieved by Industry (Taka) Increase in Profit (Taka) Percentage of profit increase
31,73,200 28,25,000 3,48,200 12.33%
Figure 3. Profit maximization in both the cases (amount in lac Taka).
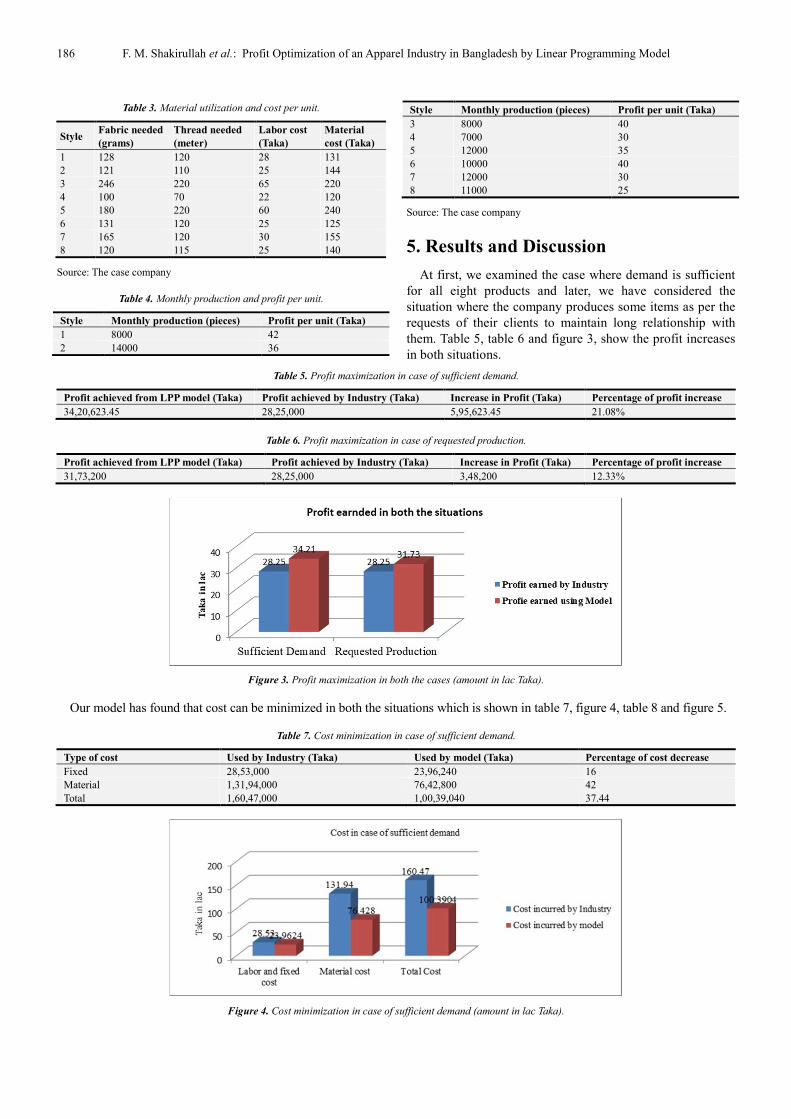
Our model has found that cost can be minimized in both the situations which is shown in table 7, figure 4, table 8 and figure 5.
Table 7. Cost minimization in case of sufficient demand.
Type of cost Used by Industry (Taka) Used by model (Taka) Percentage of cost decrease
Fixed 28,53,000 23,96,240 16
Material 1,31,94,000 76,42,800 42
Total 1,60,47,000 1,00,39,040 37.44
Figure 4. Cost minimization in case of sufficient demand (amount in lac Taka).
American Journal of Applied Mathematics 2020; 8(4): 182-189 187
Table 8. Cost minimization in case of request consideration.
Type of cost Industry (Taka) Model (Taka) Percentage of decrease
Fixed 28,53,000 26,19,100 8
Material 1,31,94,000 7,469,800 43
Total 1,60,47,000 1,00,88,900 37.13
Figure 5. Cost minimization in case of requested production (amount in lac Taka).
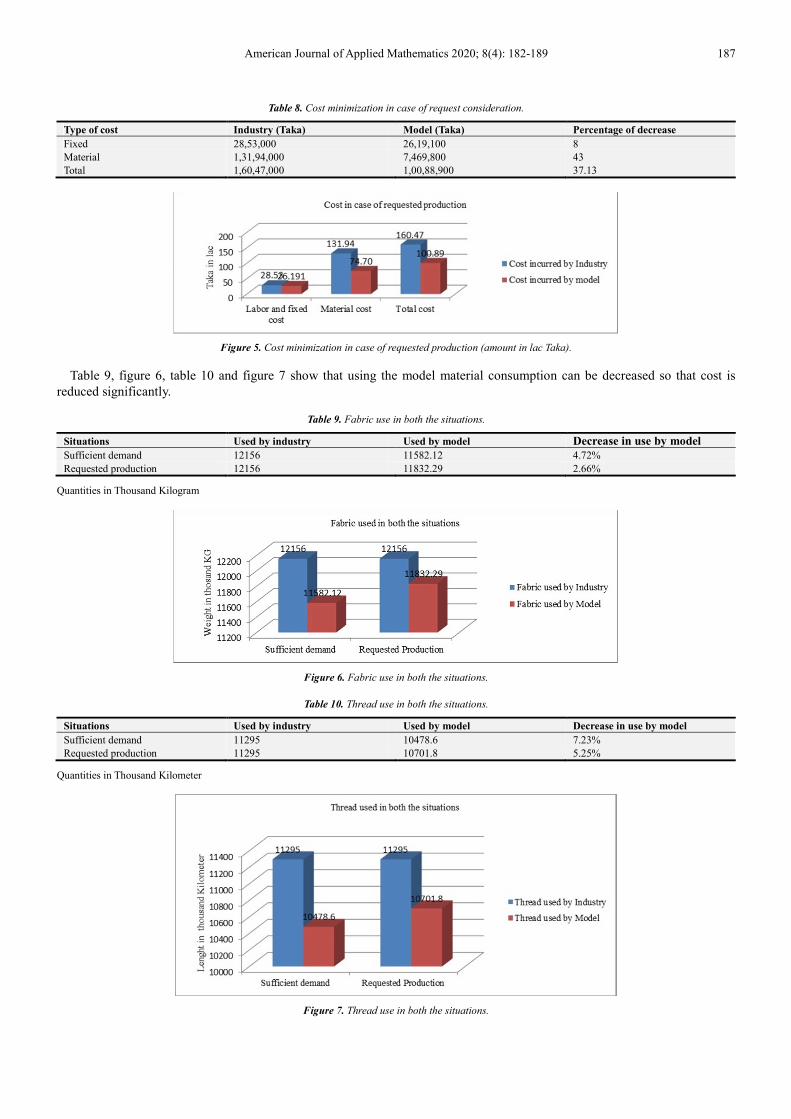
Table 9, figure 6, table 10 and figure 7 show that using the model material consumption can be decreased so that cost is
reduced significantly.
Table 9. Fabric use in both the situations.
Situations Used by industry Used by model Decrease in use by model
Sufficient demand 12156 11582.12 4.72%
Requested production 12156 11832.29 2.66%
Quantities in Thousand Kilogram
Figure 6. Fabric use in both the situations.
Table 10. Thread use in both the situations.
Situations Used by industry Used by model Decrease in use by model
Sufficient demand 11295 10478.6 7.23%
Requested production 11295 10701.8 5.25%
Quantities in Thousand Kilometer
Figure 7. Thread use in both the situations.
188 F. M. Shakirullah et al.: Profit Optimization of an Apparel Industry in Bangladesh by Linear Programming Model
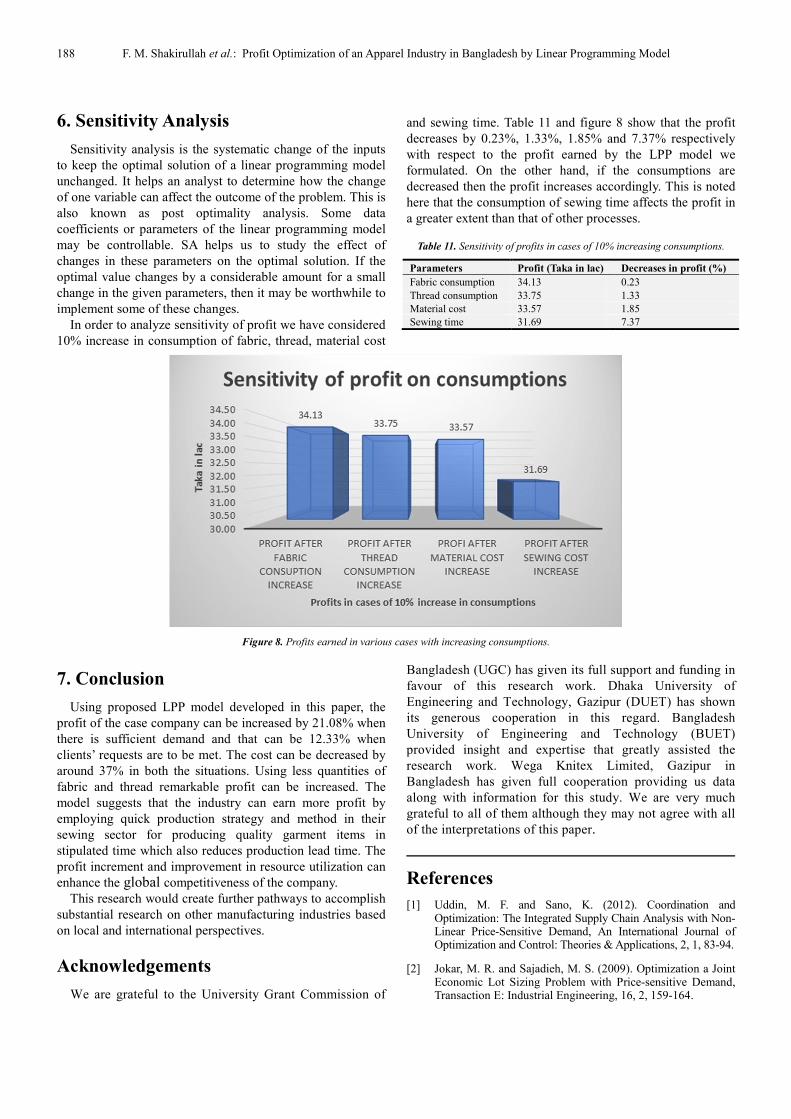
6. Sensitivity Analysis
Sensitivity analysis is the systematic change of the inputs
to keep the optimal solution of a linear programming model
unchanged. It helps an analyst to determine how the change
of one variable can affect the outcome of the problem. This is
also known as post optimality analysis. Some data
coefficients or parameters of the linear programming model
may be controllable. SA helps us to study the effect of
changes in these parameters on the optimal solution. If the
optimal value changes by a considerable amount for a small
change in the given parameters, then it may be worthwhile to
implement some of these changes.
In order to analyze sensitivity of profit we have considered
10% increase in consumption of fabric, thread, material cost
and sewing time. Table 11 and figure 8 show that the profit
decreases by 0.23%, 1.33%, 1.85% and 7.37% respectively
with respect to the profit earned by the LPP model we
formulated. On the other hand, if the consumptions are
decreased then the profit increases accordingly. This is noted
here that the consumption of sewing time affects the profit in
a greater extent than that of other processes.
Table 11. Sensitivity of profits in cases of 10% increasing consumptions.
Parameters Profit (Taka in lac) Decreases in profit (%)
Fabric consumption 34.13 0.23
Thread consumption 33.75 1.33
Material cost 33.57 1.85
Sewing time 31.69 7.37
Figure 8. Profits earned in various cases with increasing consumptions.
7. Conclusion
Using proposed LPP model developed in this paper, the
profit of the case company can be increased by 21.08% when
there is sufficient demand and that can be 12.33% when
clients’ requests are to be met. The cost can be decreased by
around 37% in both the situations. Using less quantities of
fabric and thread remarkable profit can be increased. The
model suggests that the industry can earn more profit by
employing quick production strategy and method in their
sewing sector for producing quality garment items in
stipulated time which also reduces production lead time. The
profit increment and improvement in resource utilization can
enhance the global competitiveness of the company.
This research would create further pathways to accomplish
substantial research on other manufacturing industries based
on local and international perspectives.
Acknowledgements
We are grateful to the University Grant Commission of
Bangladesh (UGC) has given its full support and funding in
favour of this research work. Dhaka University of
Engineering and Technology, Gazipur (DUET) has shown
its generous cooperation in this regard. Bangladesh
University of Engineering and Technology (BUET)
provided insight and expertise that greatly assisted the
research work. Wega Knitex Limited, Gazipur in
Bangladesh has given full cooperation providing us data
along with information for this study. We are very much
grateful to all of them although they may not agree with all
of the interpretations of this paper.
References
[1] Uddin, M. F. and Sano, K. (2012). Coordination and Optimization: The Integrated Supply Chain Analysis with Non-Linear Price-Sensitive Demand, An International Journal of Optimization and Control: Theories & Applications, 2, 1, 83-94.
[2] Jokar, M. R. and Sajadieh, M. S. (2009). Optimization a Joint Economic Lot Sizing Problem with Price-sensitive Demand, Transaction E: Industrial Engineering, 16, 2, 159-164.
American Journal of Applied Mathematics 2020; 8(4): 182-189 189
[3] Qin, Y., Tang, H. and Guo, C. (2007). Channel Coordination and Volume Discounts with Price-sensitive Demand. Int. J. Production Economics, 105, 43-53.
[4] Uddin, M. F. and Sano, K. (2010). Mixed Integer Linear Fractional Programming for Integrated Supply Chain Network Design and Optimization, International Journal of Business and Economics, 2, 1, 57-70.
[5] Uddin, M. F. and Sano, K. (2011). Coordination, Supply Chain Optimization and Facility Location Selection Problem, Journal of Society for Transportation and Traffic Studies, 2, 3, 18-32.
[6] Islam, M. K., Uddin, M. F. and Alam, M. M. (2014). Supply Chain Optimization by Mixed Integer Program for Manufacturer and Retailer System of Poultry Firm in Bangladesh, Journal of Bangladesh Mathematical Society, 34, 75-87.
[7] Islam, M. K., Uddin, M. F. and Alam, M. M. (2015). Comparison and Supply Chain Optimization of Poultry Firm Using Mixed Integer and Linear Fractional Program. IOSR Journal of Mathematics, 11, 1, 40-54.
[8] Momaya, K. (2008). Evaluating Country Competitiveness in Emerging Industries: Learning from a Case of Nanotechnology, Journal of International Business and Economy, 9, 1, 37-58.
[9] Nandita, B. and Hasan, M. B. (2017). A Sophisticated Forecasting Method for a Garments Company in Bangladesh, International Journal of Pure and Applied Mathematics, 117, 14, 145-156.
[10] Kumar, V. (2010). JIT Based Quality Management: Concept and Implications in Indian Context. International Journal of Engineering Science and Technology, 2, 1, 40-50.
[11] Ezema, B. I. and Amakom, U. (2012). Optimizing Profit with the Linear Programming Model: A Focus on Golden Plastic Industry Limited, Enugu, Nigeria. Interdisciplinary Journal of Research in Busness, 2, 2, 37-49.
[12] Yalçinsoy, A., Zincirkiran, M. and Tiftik, H. (2014). Approach of Capacity Planning Through Linear Programming Technique: A Practice in Textile Enterprise. International Journal of Innovative Research in Management, 3, 3, 16-29.
[13] Campo, E. A., Cano, J. A., Andres, R. and Montoya, G (2018). Linear Programming for Aggregate Production Planning in a Textile Company. Fabric and Textiles in Eastern Europe, 26, 5 (131), 13-19.
[14] Woubante, G. W. (2017). The Optimization Problem of Product Mix and Linear Programming Application: Case Study in the Apparel Industry. Open Science Journal, 2, 2, 1-11.
[15] Tesfaye, G., Berhane, T., Zenebe, B. and Asmelash, S. (2016). A Linear Programming Method to Enhance Resource Utilization Case of Ethiopian Apparel Sector. International Journal for Quality Research, 10, 2, 421-432.