Embed Size (px)
Citation preview
Profiling PL/SQL for
PerformanceArup Nanda
Longtime Oracle DBA
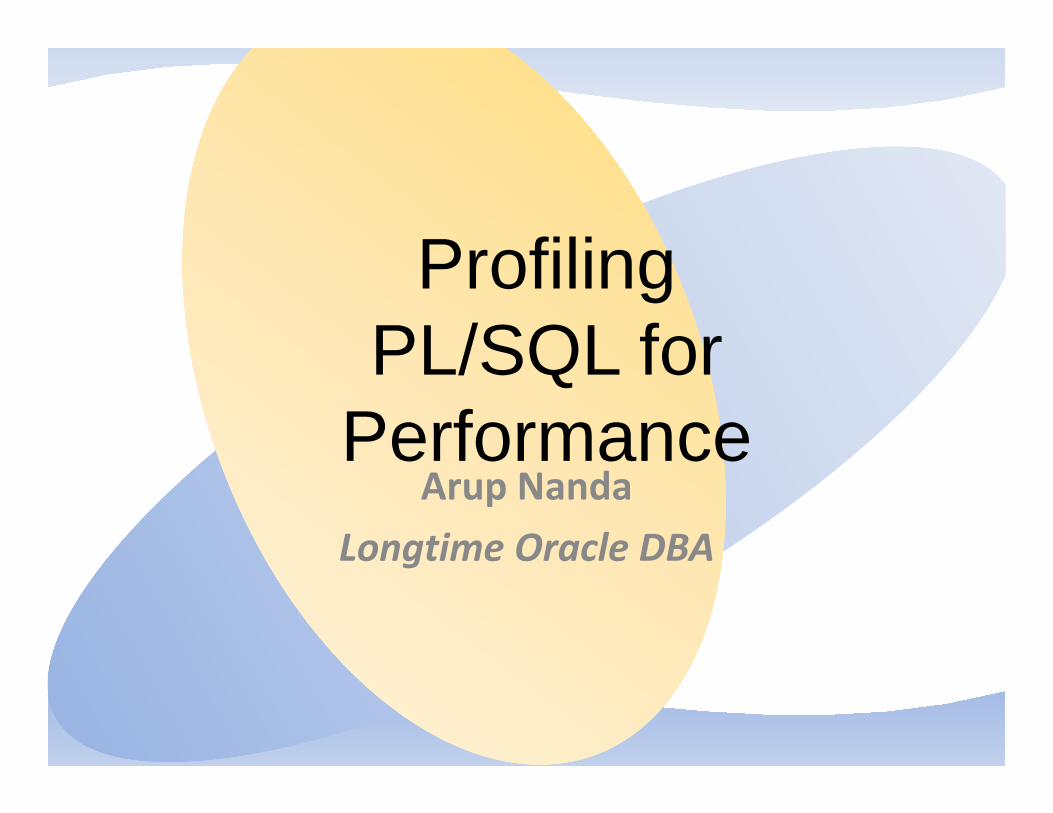
Why This Session?
• Why Performance Assessment in PL/SQL is Different?– Module-oriented– Depths of modules– Need to know the collective timings
• Traditional assessment methods – not relevant for modules
• Three tools– PL/SQL Profiler– PL/SQL Trace– PL/SQL Hierarchical Profiler
2Profiling PL/SQL

Profiling PL/SQL3
Traditional Profiler
Setup
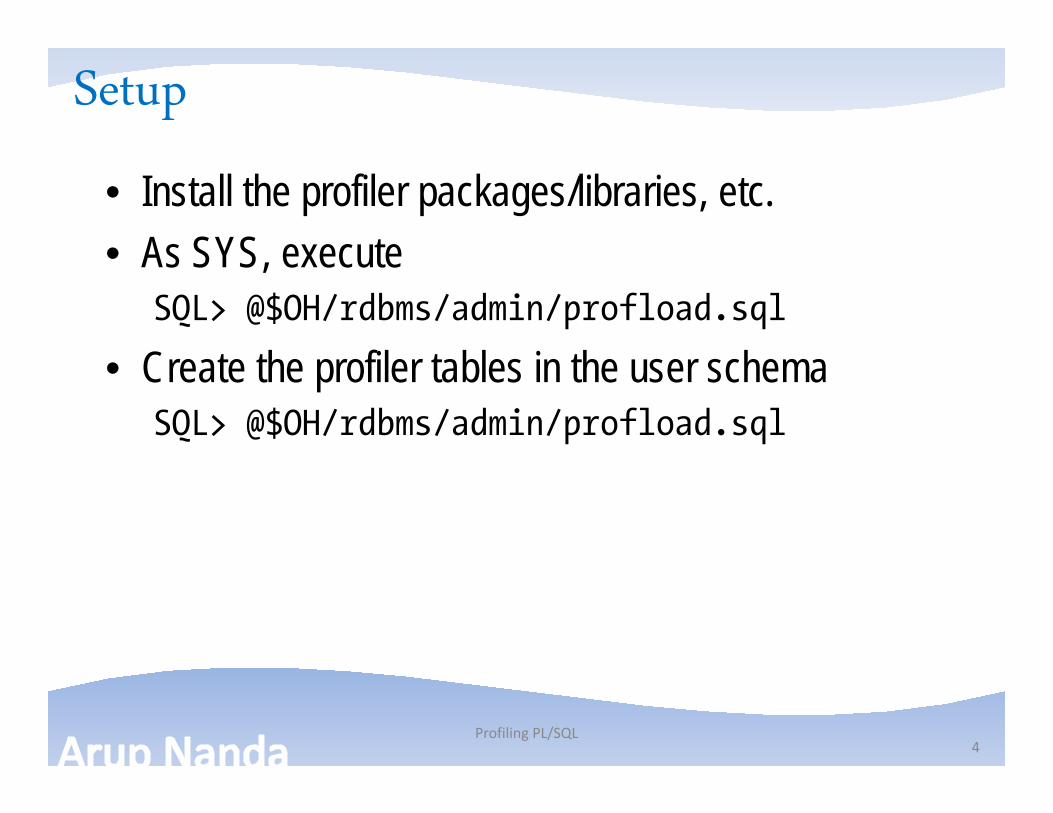
• Install the profiler packages/libraries, etc.• As SYS, execute
SQL> @$OH/rdbms/admin/profload.sql
• Create the profiler tables in the user schemaSQL> @$OH/rdbms/admin/profload.sql
Profiling PL/SQL4
General Structure
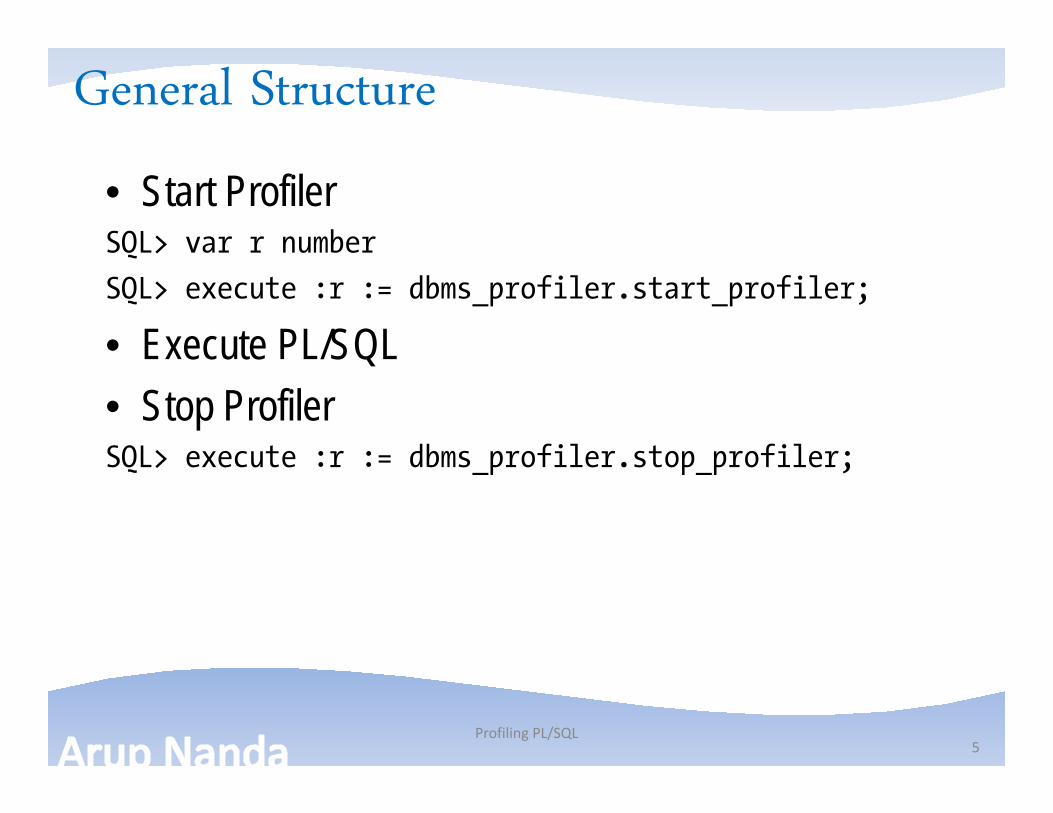
• Start ProfilerSQL> var r number
SQL> execute :r := dbms_profiler.start_profiler;
• Execute PL/SQL • Stop ProfilerSQL> execute :r := dbms_profiler.stop_profiler;
Profiling PL/SQL5
Check Results
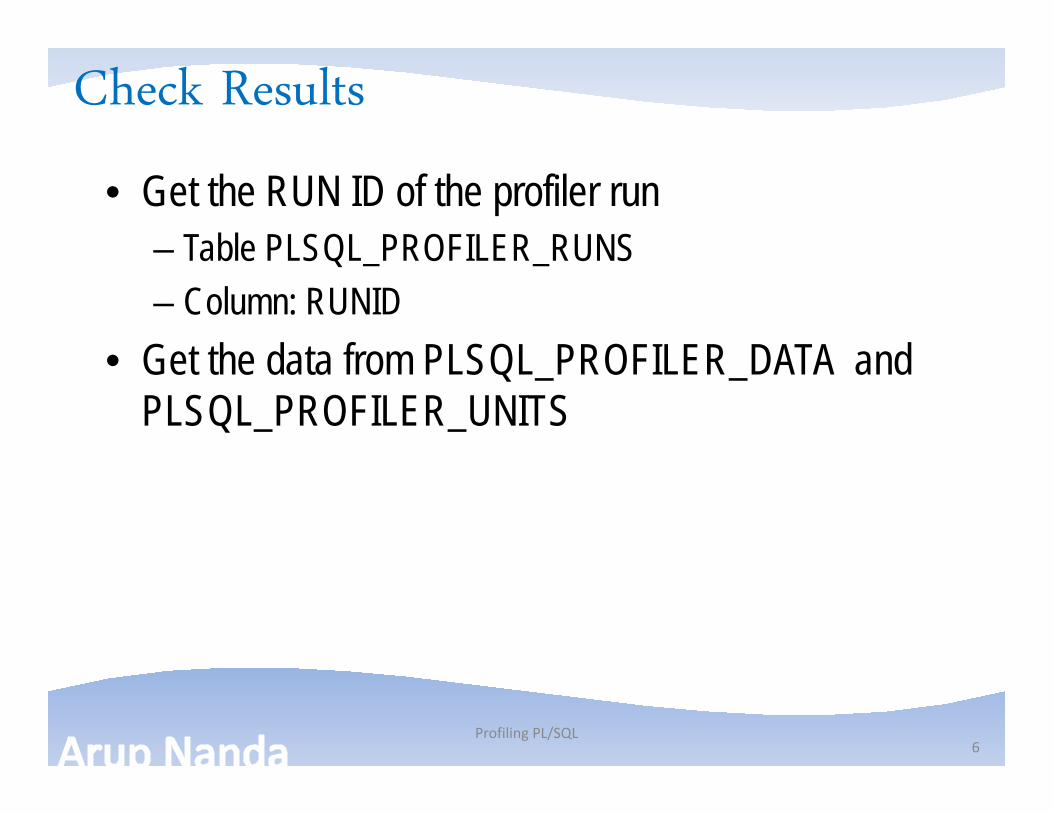
• Get the RUN ID of the profiler run– Table PLSQL_PROFILER_RUNS– Column: RUNID
• Get the data from PLSQL_PROFILER_DATA and PLSQL_PROFILER_UNITS
Profiling PL/SQL6
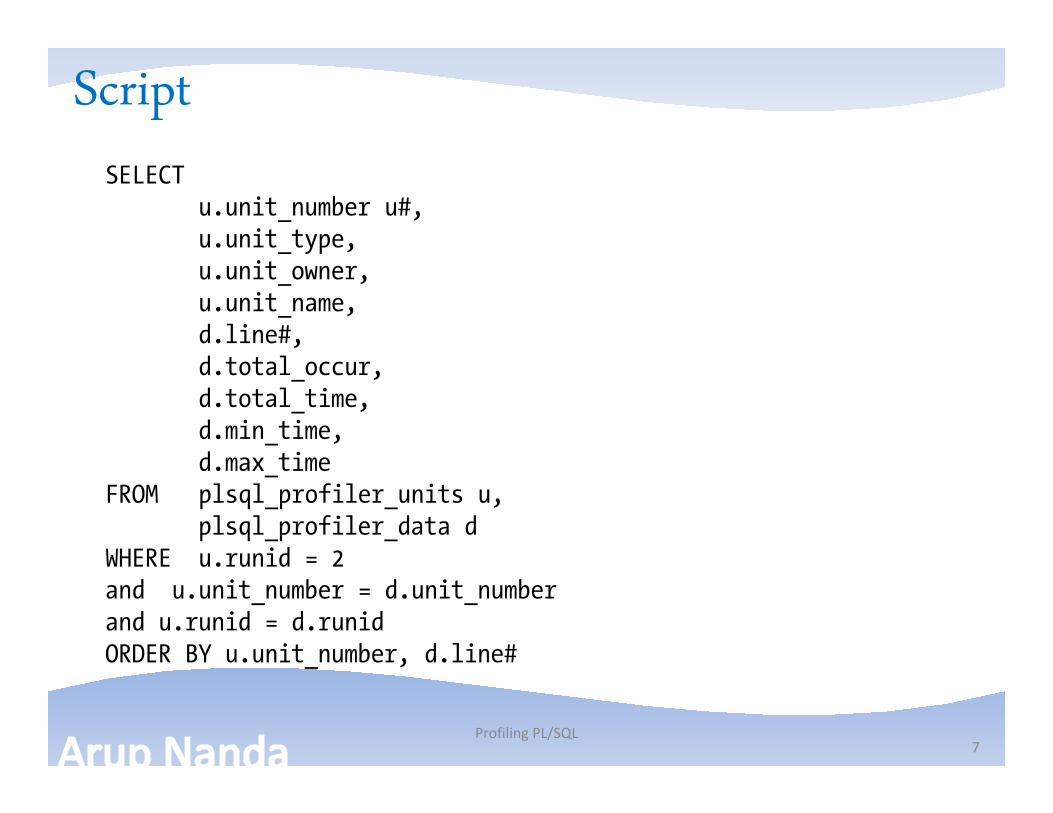
ScriptSELECT
u.unit_number u#,u.unit_type,u.unit_owner,u.unit_name,d.line#,d.total_occur,d.total_time,d.min_time,d.max_time
FROM plsql_profiler_units u,plsql_profiler_data d
WHERE u.runid = 2and u.unit_number = d.unit_numberand u.runid = d.runidORDER BY u.unit_number, d.line#
Profiling PL/SQL7
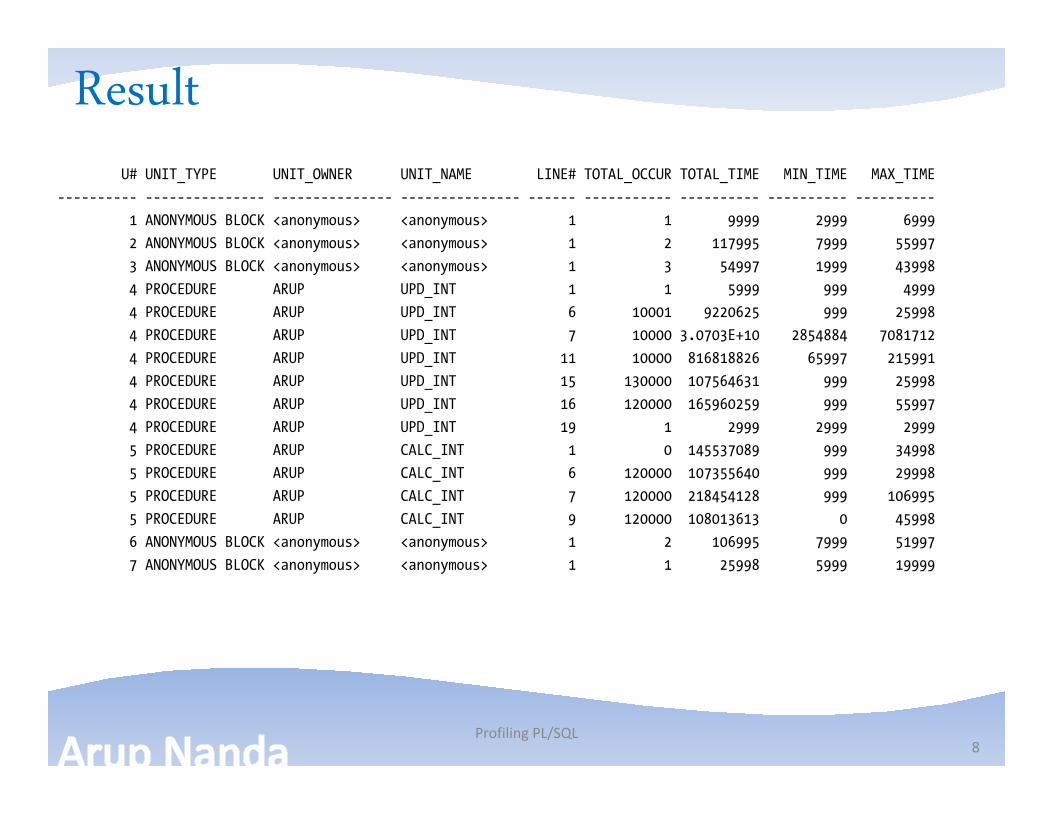
ResultU# UNIT_TYPE UNIT_OWNER UNIT_NAME LINE# TOTAL_OCCUR TOTAL_TIME MIN_TIME MAX_TIME
---------- --------------- --------------- --------------- ------ ----------- ---------- ---------- ----------
1 ANONYMOUS BLOCK <anonymous> <anonymous> 1 1 9999 2999 6999
2 ANONYMOUS BLOCK <anonymous> <anonymous> 1 2 117995 7999 55997
3 ANONYMOUS BLOCK <anonymous> <anonymous> 1 3 54997 1999 43998
4 PROCEDURE ARUP UPD_INT 1 1 5999 999 4999
4 PROCEDURE ARUP UPD_INT 6 10001 9220625 999 25998
4 PROCEDURE ARUP UPD_INT 7 10000 3.0703E+10 2854884 7081712
4 PROCEDURE ARUP UPD_INT 11 10000 816818826 65997 215991
4 PROCEDURE ARUP UPD_INT 15 130000 107564631 999 25998
4 PROCEDURE ARUP UPD_INT 16 120000 165960259 999 55997
4 PROCEDURE ARUP UPD_INT 19 1 2999 2999 2999
5 PROCEDURE ARUP CALC_INT 1 0 145537089 999 34998
5 PROCEDURE ARUP CALC_INT 6 120000 107355640 999 29998
5 PROCEDURE ARUP CALC_INT 7 120000 218454128 999 106995
5 PROCEDURE ARUP CALC_INT 9 120000 108013613 0 45998
6 ANONYMOUS BLOCK <anonymous> <anonymous> 1 2 106995 7999 51997
7 ANONYMOUS BLOCK <anonymous> <anonymous> 1 1 25998 5999 19999
Profiling PL/SQL8
Detailed Analysis
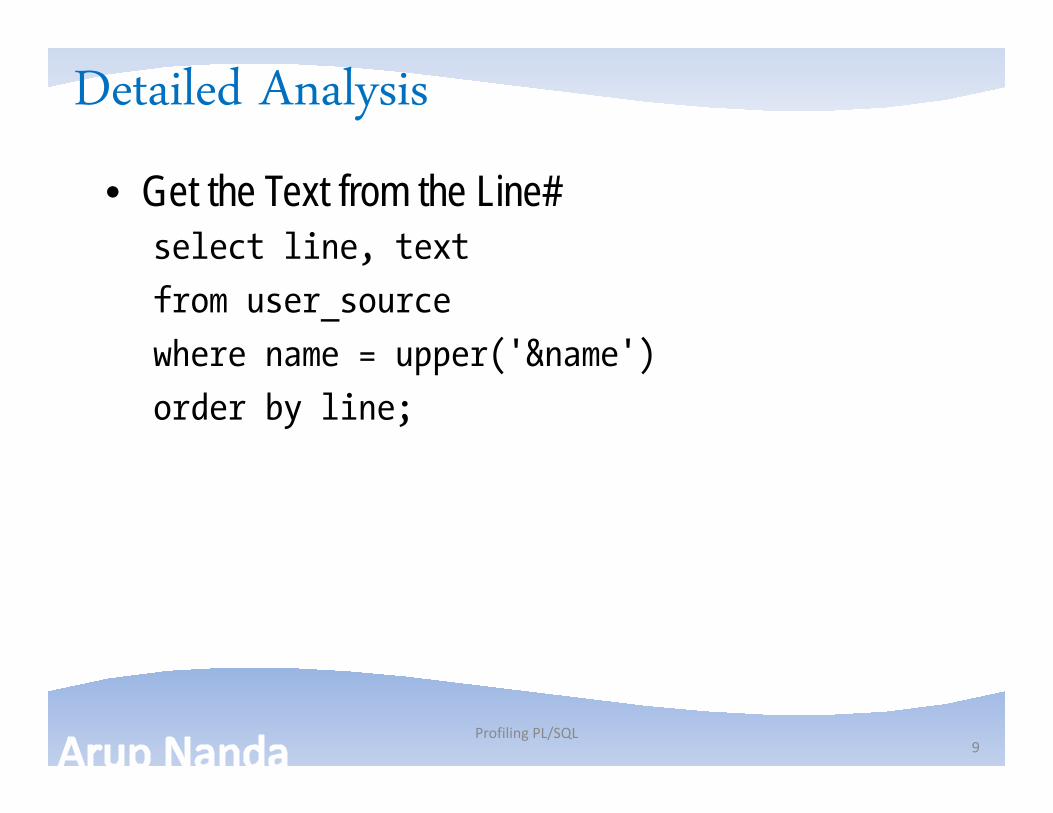
• Get the Text from the Line#select line, text
from user_source
where name = upper('&name')
order by line;
Profiling PL/SQL9
Profiling PL/SQL10
PL/SQL Trace
Steps
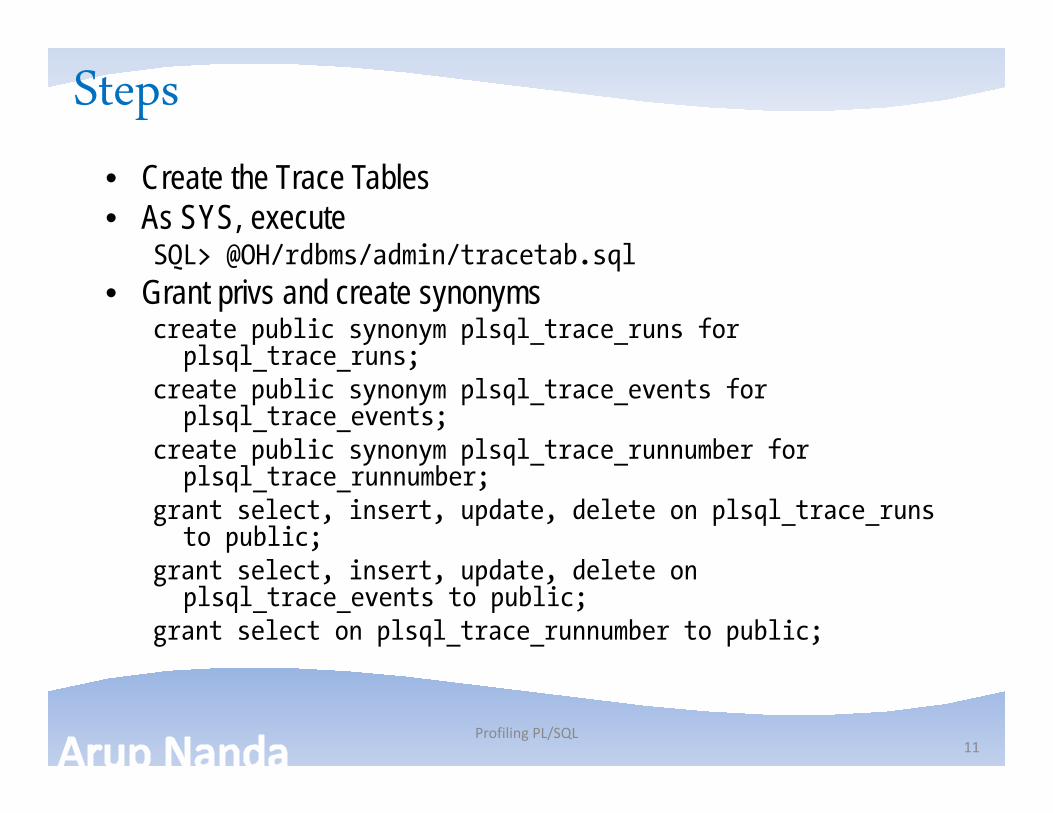
• Create the Trace Tables• As SYS, execute
SQL> @OH/rdbms/admin/tracetab.sql• Grant privs and create synonyms
create public synonym plsql_trace_runs for plsql_trace_runs;
create public synonym plsql_trace_events for plsql_trace_events;
create public synonym plsql_trace_runnumber for plsql_trace_runnumber;
grant select, insert, update, delete on plsql_trace_runsto public;
grant select, insert, update, delete on plsql_trace_events to public;
grant select on plsql_trace_runnumber to public;
Profiling PL/SQL11
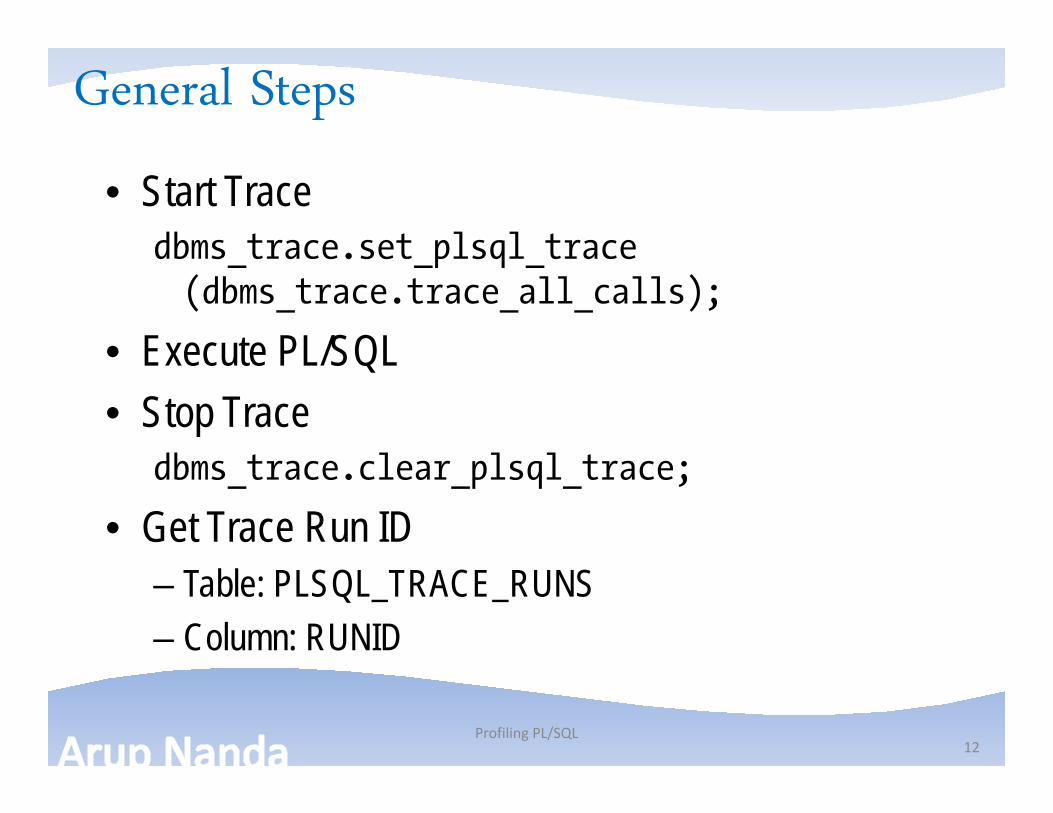
General Steps
• Start Tracedbms_trace.set_plsql_trace(dbms_trace.trace_all_calls);
• Execute PL/SQL• Stop Trace
dbms_trace.clear_plsql_trace;
• Get Trace Run ID– Table: PLSQL_TRACE_RUNS– Column: RUNID
Profiling PL/SQL12
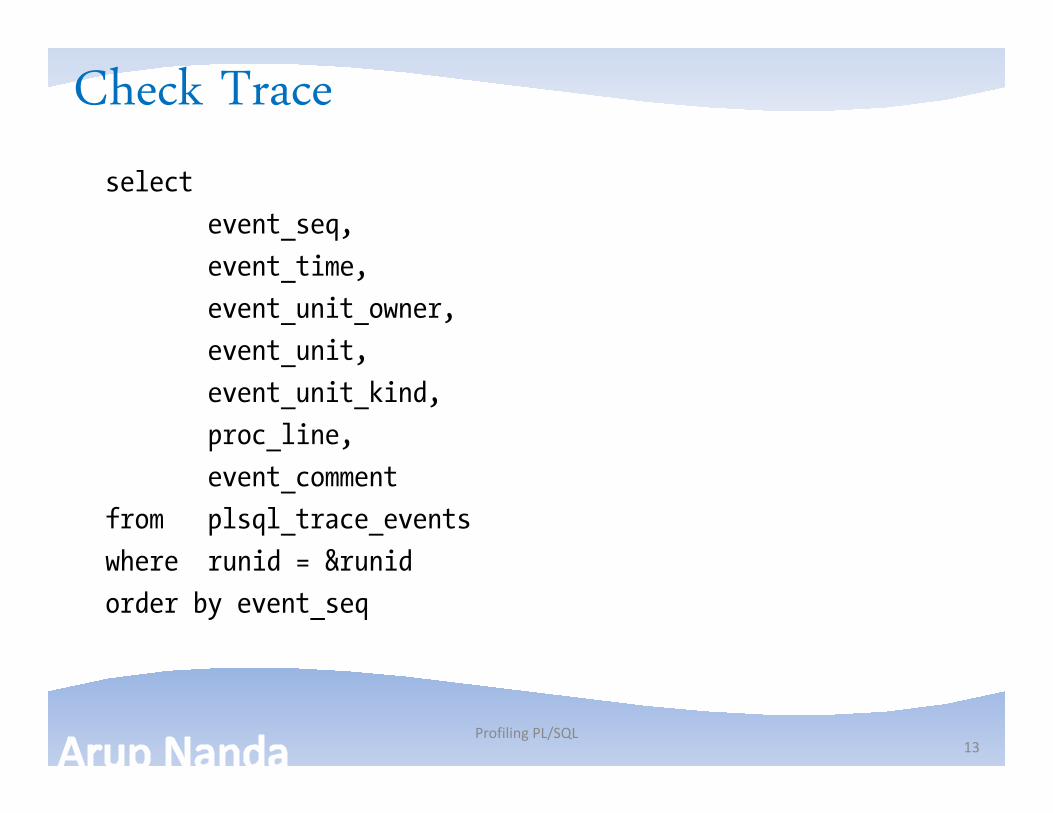
Check Trace
select
event_seq,
event_time,
event_unit_owner,
event_unit,
event_unit_kind,
proc_line,
event_comment
from plsql_trace_events
where runid = &runid
order by event_seq
Profiling PL/SQL13
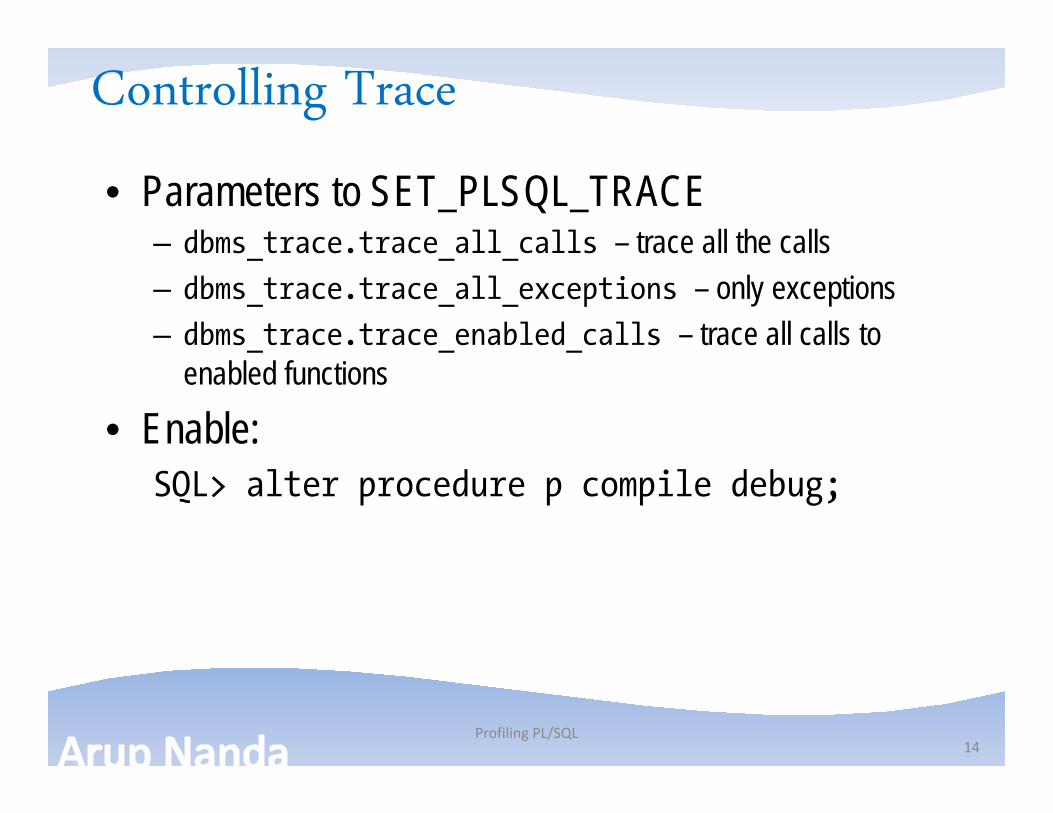
Controlling Trace
• Parameters to SET_PLSQL_TRACE– dbms_trace.trace_all_calls – trace all the calls– dbms_trace.trace_all_exceptions – only exceptions– dbms_trace.trace_enabled_calls – trace all calls to
enabled functions
• Enable:SQL> alter procedure p compile debug;
Profiling PL/SQL14

Profiling PL/SQL15
Hierarchical Profiler
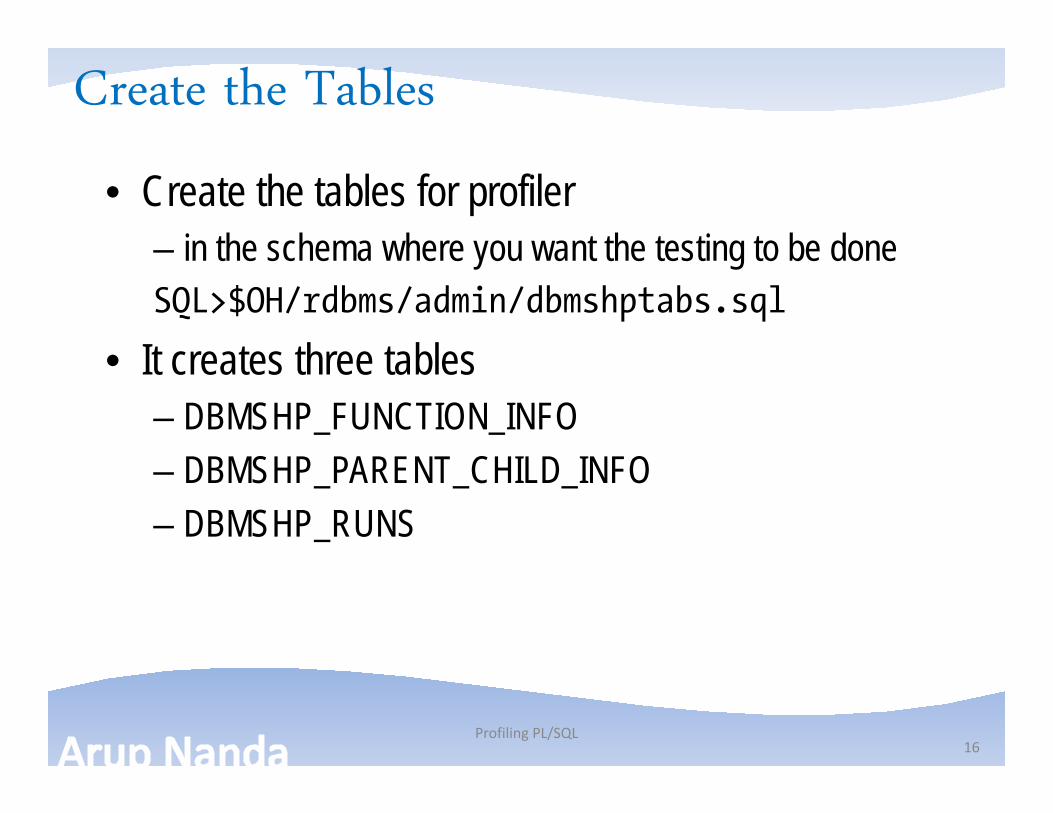
Create the Tables
• Create the tables for profiler – in the schema where you want the testing to be doneSQL>$OH/rdbms/admin/dbmshptabs.sql
• It creates three tables– DBMSHP_FUNCTION_INFO– DBMSHP_PARENT_CHILD_INFO– DBMSHP_RUNS
Profiling PL/SQL16
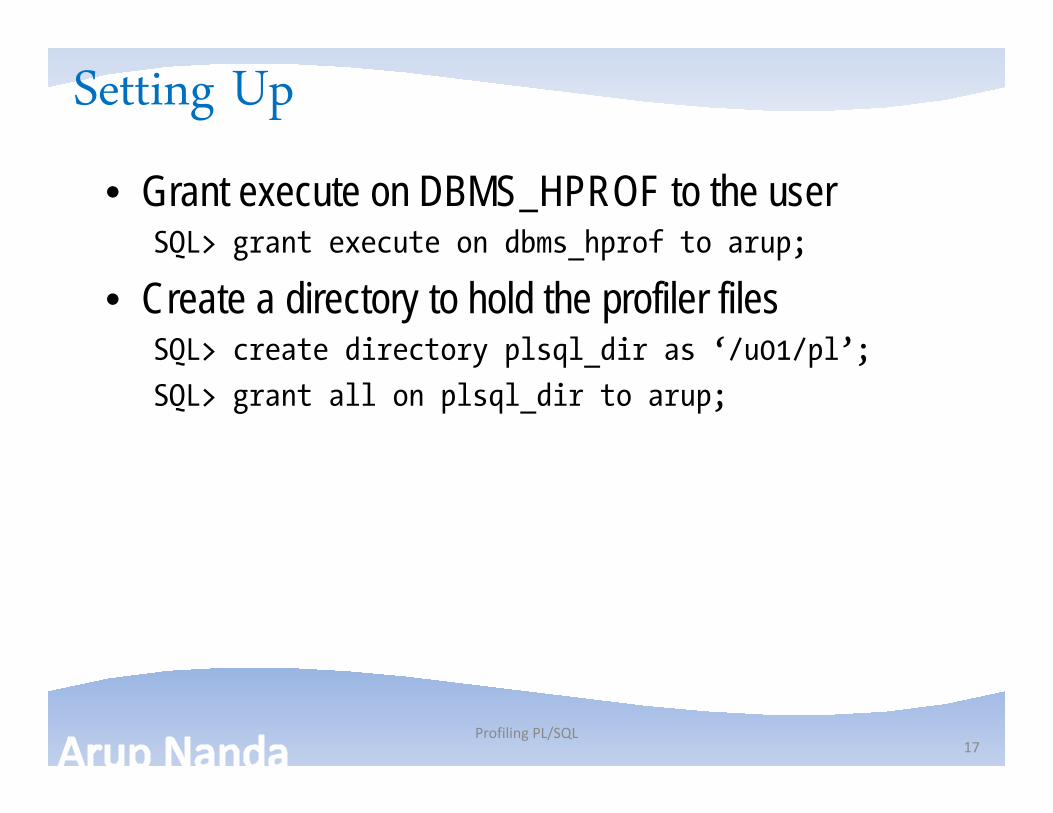
Setting Up
• Grant execute on DBMS_HPROF to the userSQL> grant execute on dbms_hprof to arup;
• Create a directory to hold the profiler filesSQL> create directory plsql_dir as ‘/u01/pl’;
SQL> grant all on plsql_dir to arup;
Profiling PL/SQL17
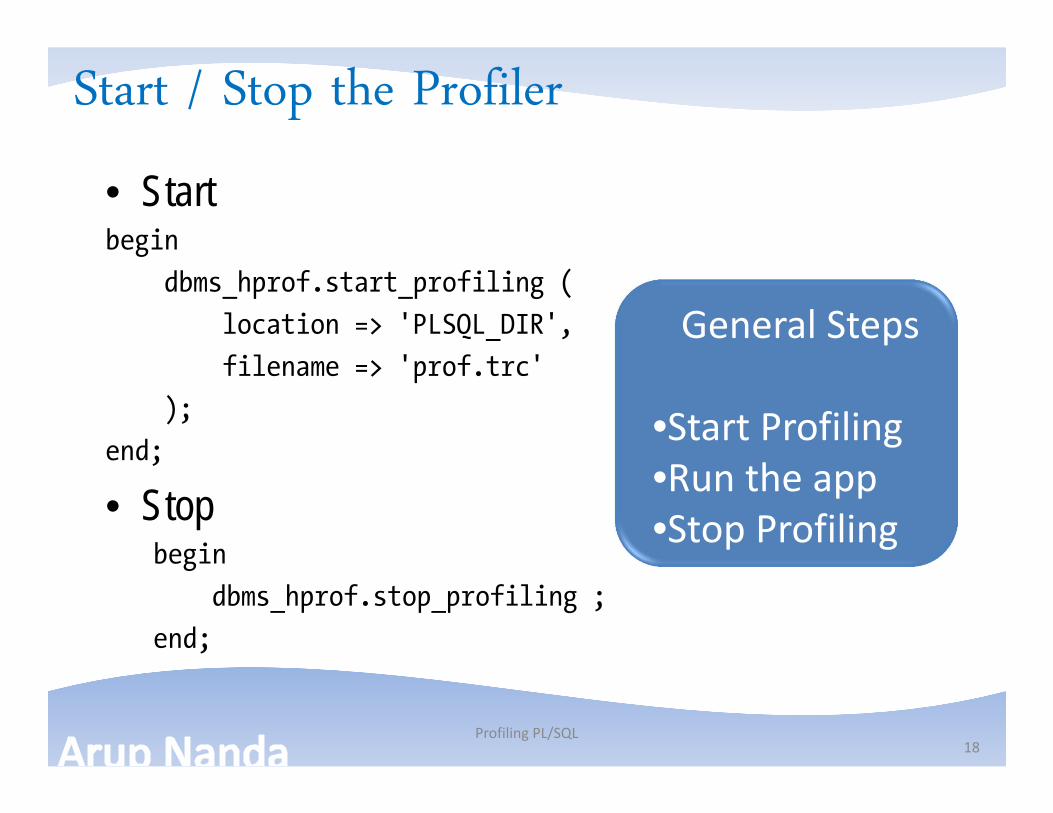
Start / Stop the Profiler
• Startbegin
dbms_hprof.start_profiling (
location => 'PLSQL_DIR',
filename => 'prof.trc'
);
end;
• Stopbegin
dbms_hprof.stop_profiling ;
end;
Profiling PL/SQL18
General Steps
•Start Profiling•Run the app•Stop Profiling
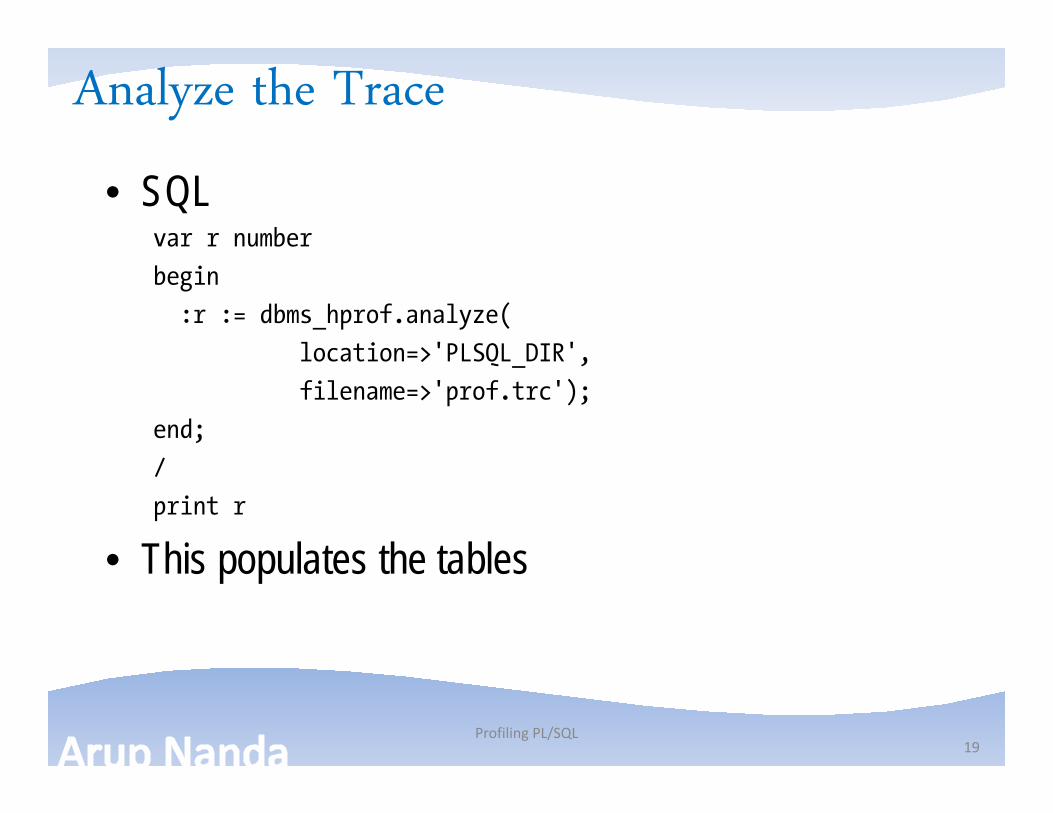
Analyze the Trace
• SQLvar r number
begin
:r := dbms_hprof.analyze(
location=>'PLSQL_DIR',
filename=>'prof.trc');
end;
/
print r
• This populates the tables
Profiling PL/SQL19
Create the Output Files
• Create the reports as HTML files$ plshprof -output upd_int prof.trc
• This creates several html files with prefix upd_int
Profiling PL/SQL20
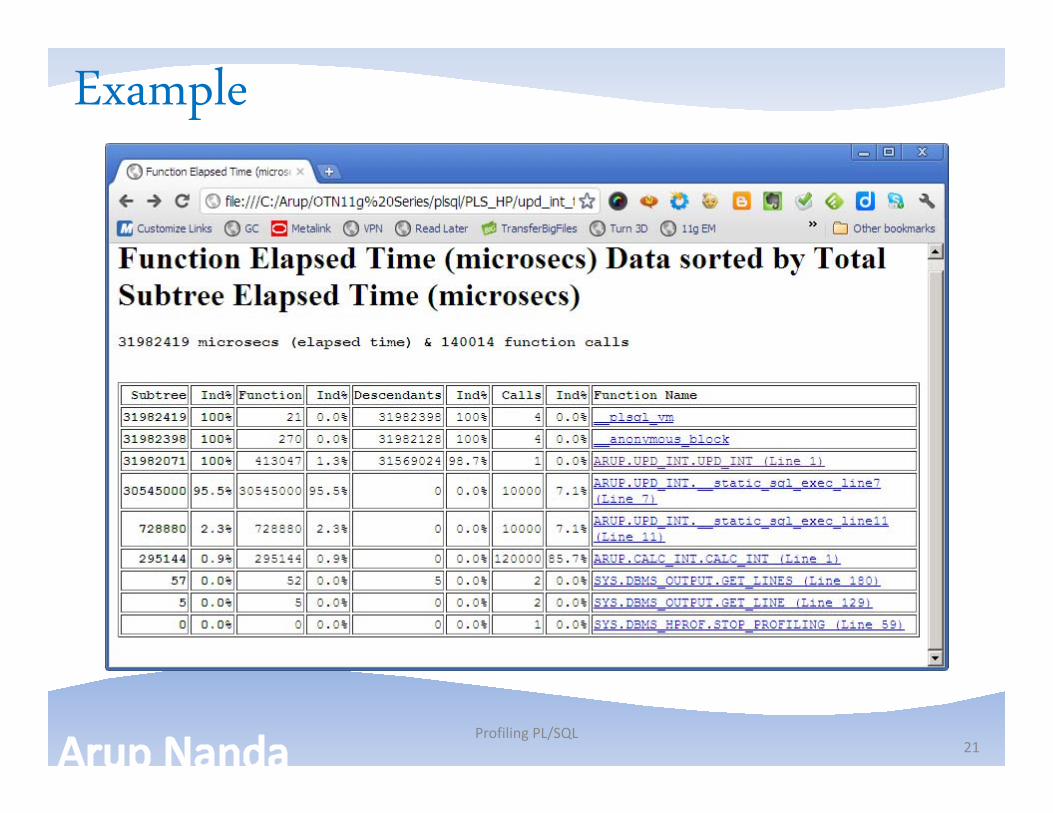
Example
Profiling PL/SQL21
Difference
• Pass two prof files for analyzing the differences$ plshprof –output diff <Trace1> <Trace2>
Profiling PL/SQL22
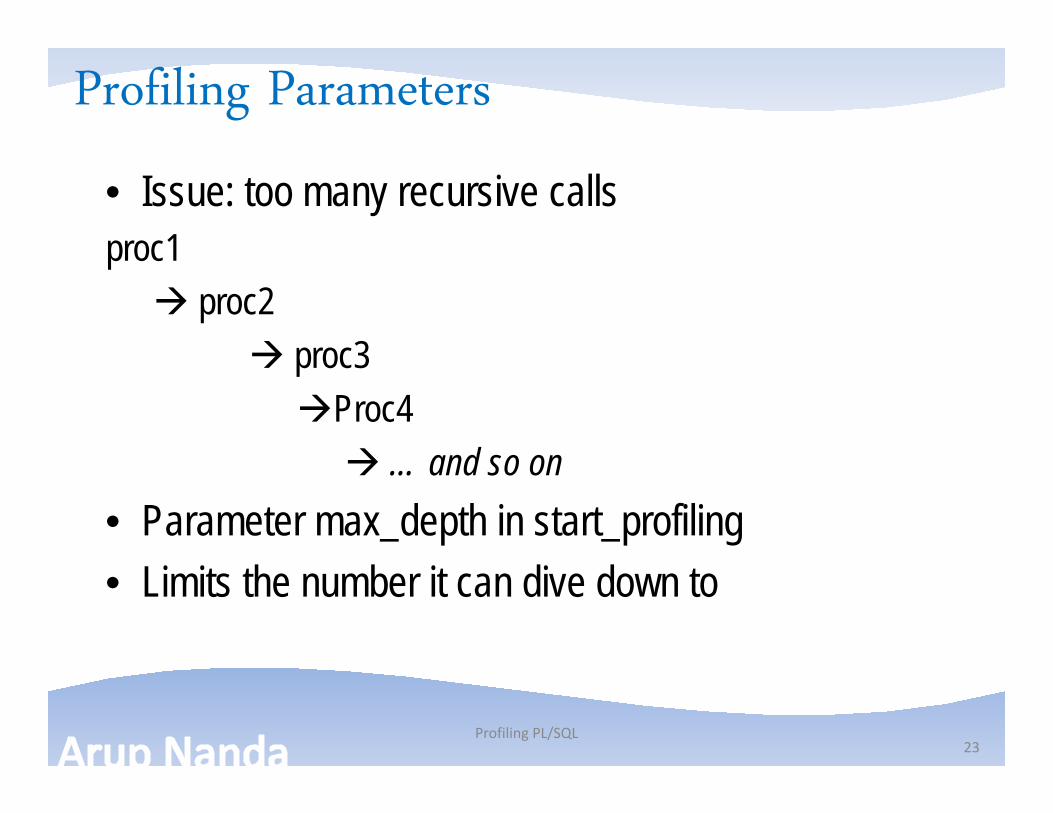
Profiling Parameters
• Issue: too many recursive callsproc1 proc2
proc3Proc4… and so on
• Parameter max_depth in start_profiling• Limits the number it can dive down to
Profiling PL/SQL23
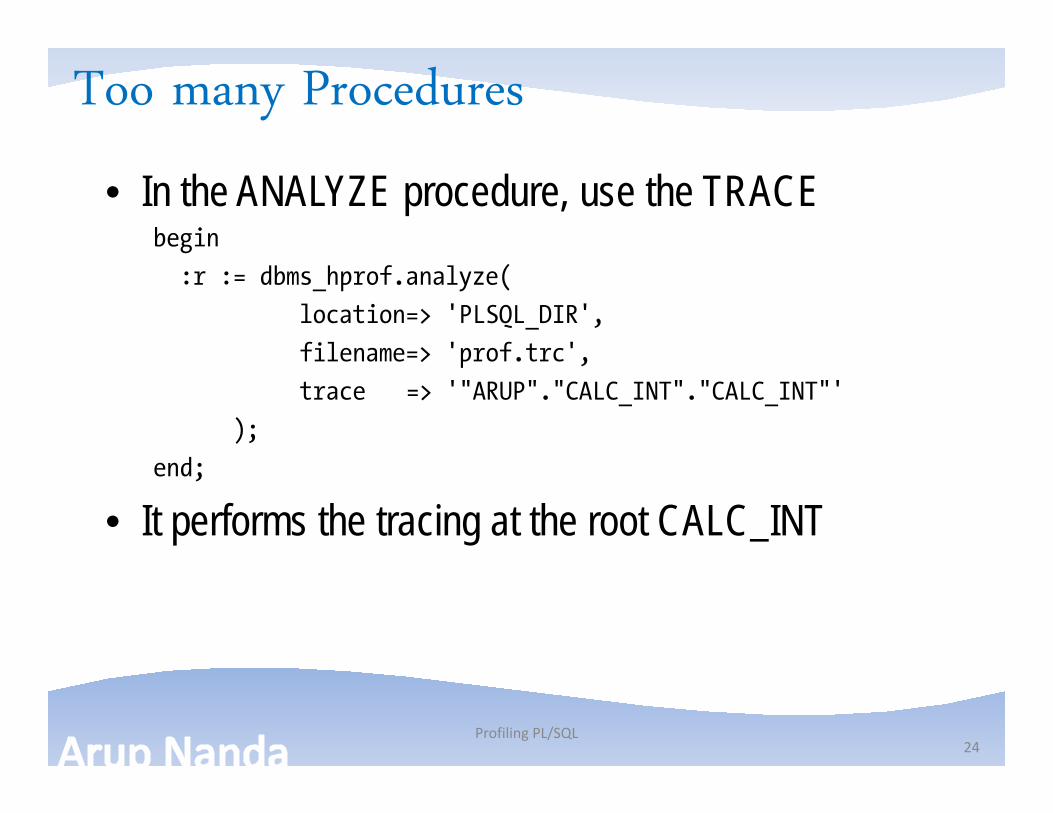
Too many Procedures
• In the ANALYZE procedure, use the TRACEbegin
:r := dbms_hprof.analyze(
location=> 'PLSQL_DIR',
filename=> 'prof.trc',
trace => '"ARUP"."CALC_INT"."CALC_INT"'
);
end;
• It performs the tracing at the root CALC_INT
Profiling PL/SQL24
Conclusion
• Find out which specific component in a PL/SQL routine is taking the maximum time
• If you have 11g, use Hierarchical Profiler• Oherwise, Traditional Profiler• Focus your tuning efforts on that • Use PL/SQL Tracing to trace the lines of code in the
module• Use Tracing to identify exceptions
Profiling PL/SQL25

Thank You!
Download Scripts: proligence.com/pres/soug14My Blog: arup.blogspot.comMy Tweeter: @arupnanda
Exadata Demystified 26