Embed Size (px)
Citation preview
Journal of
Clinical Medicine
Article
Profiles of Frailty among Older People Users of a Home-BasedPrimary Care Service in an Urban Area of Barcelona (Spain):An Observational Study and Cluster Analysis
Juan-José Zamora-Sánchez 1,2,* , Edurne Zabaleta-del-Olmo 1,3,4,5 , Sergio Fernández-Bertolín 3,4 ,Vicente Gea-Caballero 6,7 , Iván Julián-Rochina 8 , Gemma Pérez-Tortajada 9 and Jordi Amblàs-Novellas 10
�����������������
Citation: Zamora-Sánchez, J.-J.;
Zabaleta-del-Olmo, E.;
Fernández-Bertolín, S.; Gea-Caballero,
V.; Julián-Rochina, I.; Pérez-Tortajada,
G.; Amblàs-Novellas, J. Profiles of
Frailty among Older People Users of
a Home-Based Primary Care Service
in an Urban Area of Barcelona (Spain):
An Observational Study and Cluster
Analysis. J. Clin. Med. 2021, 10, 2106.
https://doi.org/10.3390/jcm10102106
Academic Editor: Hiroyuki Shimada
Received: 29 March 2021
Accepted: 7 May 2021
Published: 13 May 2021
Publisher’s Note: MDPI stays neutral
with regard to jurisdictional claims in
published maps and institutional affil-
iations.
Copyright: © 2021 by the authors.
Licensee MDPI, Basel, Switzerland.
This article is an open access article
distributed under the terms and
conditions of the Creative Commons
Attribution (CC BY) license (https://
creativecommons.org/licenses/by/
4.0/).
1 Atenció Primària Barcelona Ciutat, Gerència Territorial de Barcelona, Institut Català de la Salut,08007 Barcelona, Spain; [email protected]
2 School of Nursing, Universitat de Barcelona, 08036 Barcelona, Spain3 Fundació Institut Universitari per a la Recerca a l’Atenció Primària de Salut Jordi Gol i Gurina (IDIAPJGol),
08007 Barcelona, Spain; [email protected] Universitat Autònoma de Barcelona, 08193 Bellaterra (Cerdanyola del Vallès), Spain5 Nursing Department, Faculty of Nursing, Universitat de Girona, 17004 Girona, Spain6 Escuela de Enfermería La Fe, 46026 Valencia, Spain; [email protected] Grupo de investigación GREIACC, Instituto de Investigación Sanitaria La Fe, 46026 Valencia, Spain8 Department of Nursing, Faculty of Nursing and Podiatry, Universitat de València, 46010 Valencia, Spain;
[email protected] Atenció Primària de l’Àrea Metropolitana Nord, Gerència Territorial Metropolitana Nord, Institut Català de la
Salut, 08916 Barcelona, Spain; [email protected] Central Catalonia Chronicity Research Group (C3RG), Centre for Health and Social Care Research (CESS),
Universitat de Vic-University of Vic-Central University of Catalonia (UVIC-UCC), 08500 Vic, Spain;[email protected]
* Correspondence: [email protected]
Abstract: Background: The multidimensional assessment of frailty allows stratifying it into degrees;however, there is still heterogeneity in the characteristics of people in each stratum. The aim of thisstudy was to identify frailty profiles of older people users of a home-based primary care service.Methods: We carried out an observational study from January 2018 to January 2021. Participants wereall people cared for a home-based primary care service. We performed a cluster analysis by applying ak-means clustering technique. Cluster labeling was determined with the 22 variables of the Frail-VIGindex, age, and sex. We computed multiple indexes to assess the optimal number of clusters, and thiswas selected based on a clinical assessment of the best options. Results: Four hundred and twelveparticipants were clustered into six profiles. Three of these profiles corresponded to a moderate frailtydegree, two to a severe frailty degree and one to a mild frailty degree. In addition, almost 75% of theparticipants were clustered into three profiles which corresponded to mild and moderate degree offrailty. Conclusions: Different profiles were found within the same degree of frailty. Knowledge ofthese profiles can be useful in developing strategies tailored to these differentiated care needs.
Keywords: care dependence; cluster analysis; frailty; home care; multimorbidity; primary health care
1. Introduction
The aging of the world’s population is contributing to an increase in the number ofpeople with multimorbidity and complex care needs; as a result, the condition of frailtyis receiving greater international interest [1]. Frailty is characterized by a decline in thefunctioning of multiple physiological systems accompanied by an increased vulnerabilityto stressors [2]. Moreover, frailty determines a reduction in functional reserve and a higherrisk of adverse outcomes such as increased mortality, disability and use of healthcareresources [3–5]. It is also age-related, progressive, dynamic and potentially modifiable–and,therefore, preventable [6,7]. Furthermore, the introduction of the concept of frailty in
J. Clin. Med. 2021, 10, 2106. https://doi.org/10.3390/jcm10102106 https://www.mdpi.com/journal/jcm
J. Clin. Med. 2021, 10, 2106 2 of 12
clinical practice allows the identification of complex care needs by differentiating betweenchronological and biological age.
Today, the definition of frailty remains questioned, but according to the World HealthOrganisation, it is defined as “a progressive age-related decline in physiological systemsthat results in decreased reserves of intrinsic capacity, which confers extreme vulnerabilityto stressors and increases the risk of a range of adverse health outcomes” [8]. The mainmeasurement approaches are the Fried’s frailty phenotype [9] and Rockwood and Mitnit-ski’s accumulation of deficits model [10]. The frailty phenotype is based on the presenceof three or more of the following criteria: involuntary weight loss, exhaustion, slow gaitspeed, poor handgrip strength, and sedentary behaviour. Its use may be more suitablefor the identification of non-disabled older people at risk of adverse health outcomes [11].Regarding the accumulation of deficits model, allows an understanding of the conceptthrough the complex interaction of physical, psychological and social factors that lead tofrailty, expressed as a frailty index (FI). This FI is a ratio of potential age-related deficitsthat include disease, disability and geriatric syndromes [10]. The FI may be a more usefultool than the frailty phenotype to establish the effectiveness of any intervention and todescribe the health status trajectories over time [11,12]. A large number of FIs have beendeveloped based on this model, among which we highlight the Frail-VIG index. It has amultidimensional approach and is based on a comprehensive geriatric assessment (VIG isthe Spanish/Catalan abbreviation for ‘comprehensive geriatric assessment). The Frail-VIGindex fits well with the biopsychosocial model of primary care and allows stratificationof people into degrees of frailty, making it easier to set tailored therapeutic goals andtherapeutic intensity [13].
However, we still found heterogeneity among the characteristics of the people classi-fied under each degree of frailty. Therefore, identifying different profiles of people wouldcontribute to gaining additional knowledge about specific characteristics, and consequently,further facilitate personalization of the care plan. A number of previous studies have ex-plored this approach with a comprehensive assessment approach among older peopleliving in the community. Lafortune et al. identify four profiles, incorporating the physicaland cognitive dimensions [14]. Armstrong et al. identify seven relatively homogeneousprofiles among people receiving rehabilitation at home, which differ in terms of character-istics such as age, sex, cognition and functional impairment [15]. In a more recent study,Looman et al. identify six clusters around physical, cognitive and social functioning [16].Other authors explore patterns based on multimorbidity [17,18], which is defined as thepresence of two of more chronic diseases or conditions [19].
However, profiles based solely on morbidity do not capture other aspects of people’scomplex needs when considering at-home care. In this regard, multidimensional FIsinclude interrelated concepts of interest such as morbidity, frailty and dependence. On theother hand, morbidity can be considered as an antecedent of frailty and dependence as aconsequence of it [20,21]. Dependence is defined as a person’s lack of ability to performbasic activities needed for daily living as a result of a decrease in functional capacity [8]. Itis important to identify these concepts correctly [22], because whilst they are related, theirmanagement is different and can confuse interventions designed to prevent and mitigatefrailty. In addition, no research has been found that analyzed people’s profiles from abroad perspective, incorporating different domains of frailty (biological, psychological, andsocial), together with multimorbidity and dependence. Finally, people living with frailtyrisk experiencing a decline in their quality of life. Previous research shows the negativeassociation between frailty, multimorbidity and dependence with respect to quality oflife [23–25] Therefore, interventions aimed at decreasing frailty could have the addedbenefit of improving quality of life.
For all these reasons we decided to carry out this study, the aim of which was toidentify frailty profiles of older people users of a home-based primary care service, froma comprehensive perspective, using the Frail-VIG index which integrates the concepts offrailty (physical, cognitive and social), multimorbidity and dependence.
J. Clin. Med. 2021, 10, 2106 3 of 12
2. Materials and Methods2.1. Study Design, Scope, Period and Subjects
We carried out an observational study and cluster analysis in two health care areasof the Institut Català de la Salut (Catalan Health Institute) in Barcelona, Spain, that servea population of 51,121 users. This is a population with a medium-high socioeconomiclevel and a lower percentage of immigration than the mean for Catalonia (9.8% and 8.8%respectively, compared to 14.6% for Catalonia) and a high level of over-aging (26.8% and28.8% of people over 65 respectively, compared to the Catalan mean of 19.4%) [26]. Thestudy period was from January 2018 to January 2021.
Participants were all people included to under the home-care program during 2018.This program included all those who could not go to the health center for reasons of
health, physical condition, or their social situation or environment. Two general practi-tioners and four community nurses manage this program, which was also supported by asocial worker and a nurse case manager. All variables were assessed at baseline, exceptmortality, which was evaluated at 12 and 24 months after baseline.
2.2. Measurement Variables and Instruments
Frailty was measured using the Frail-VIG index. Published in 2017 by Amblàs- Novel-las et al. [27], this FI based on the comprehensive geriatric assessment, consists of 22 triggerquestions that are used to assess 25 deficits from eight assessment domains (functional,nutritional, cognitive, emotional, social, geriatric syndromes, severe symptoms and chronicdiseases). The final score, which is obtained by dividing the accumulated deficits bythe total potential accumulable deficits, range from 0 to 1 (with the submaximal limitin the clinical practice being close to 0.7). There is an Excel calculator available at:https://en.c3rg.com/index-fragil-vig (accessed on 11 May 2021). It enables people tobe grouped according to degrees of frailty: non-frailty (<0.20), mild frailty (0.20–0.35),moderate frailty (0.36–0.50) and severe frailty (>0.50). The Frail-VIG index has shown ahigh prognostic value for 12-month mortality (value under the ROC curve of 0.9, 95% CI0.88–0.92) [13,27].
For the cluster analysis, the variables were grouped as: sociodemographic (age, sex),diseases (cardiac, respiratory, renal, neurological, hepatic/digestive, cancer), symptoms(pain, dyspnoea), physical frailty (nutrition, falls, ulcers, dysphagia), psychological frailty(delirium, cognitive impairment, depression, anxiety), social vulnerability (the personlives alone or the family has limitations or difficulty in offering support, conflictive familyrelationship, inadequate hygiene conditions, inadequate housing, and lack of economicresources), and functional dependence for activities of daily living (ADLs) and instrumentalactivities of daily living (IADLs)
As a covariable, the perception of quality of life was measured by means of the EQ-5D-3L index, using the reference values for the Spanish population [28]. We also determinedwhether or not all participants had died at 12 and 24 months after the baseline assessmentdate, by reviewing primary care electronic health records, which systematically include thedate of death.
2.3. Data Collection and Sources of Information
Community nurses from the home-care service performed a comprehensive geriatricassessment as part of their usual practice. They also administered by interview the twomeasurement instruments: the Frail-VIG index and the EQ-5D-3L index. The research teamheld a preliminary consensus meeting with these nurses to unify criteria for collectingthe data from the aforementioned instruments, and a pilot test was carried out with20 participants to identify potential problems and introduce strategies for improvement.After the pilot, no changes in the procedure were necessary, and an instruction manual waswritten to ensure homogeneous data collection.
J. Clin. Med. 2021, 10, 2106 4 of 12
For the assessment of mortality at 12 and 24 months after the baseline assessment, wereviewed electronic health records, which include up-to-date information on date of death,regardless of the place where the death occurred.
2.4. Study Size
No sampling strategy was used in this study. All the older people users of thehome-based primary care service were included. In Spain, access to primary care isguaranteed by law and home care is part of the primary care service portfolio [29]. Thereis a comprehensive, multidisciplinary home care program; the study population wasidentified from the patient lists for this population-based care program.
2.5. Data Analysis
Categorical variables were expressed as frequencies and percentages and continuousvariables as mean and standard deviation. Differences between clusters for descriptivevariables were evaluated using the chi-square test, ANOVA and Kruskal–Wallis based onapplication conditions.
The cluster analysis was performed by applying the k-means hard clustering techniqueto the dataset. Prior to the clustering, a manual selection of variables was done to avoidoverestimation of some data, and only the 22 variables of the frailty index, age and sex wereused to determine the cluster labeling. The criterion for selecting these variables was toavoid duplicity of variables with similar clinical meaning. After grouping the individualsinto different clusters with these features, all variables were used to characterize the clusters.
PCAmix compression technique was used to reduce dimensionality of the data, noiseand deal efficiently with both dichotomous and continuous variables. Using this technique,principal component analysis (PCA) was applied to the continuous age variable andmultiple correspondence analysis (MCA) to the dichotomous variables. According toKaiser criterion, only the most significant 13 transformed dimensions were retained to feedthe k-means clustering.
To assess the optimal number of clusters (k), Calinski-Harabasz, Xie-Beni and Silhou-ette indexes were computed from the average of 100 different realizations for each possiblenumber from two to 20 [30]. To mitigate the negative effects of the random nature of theclustering, a clusterboot technique was used to select the most stable cluster from 100 dif-ferent realizations. The Calinski index did not reveal clear evidence for any clusters, whileXie-beni and Silhouette gave better results for groups of three, six and nine clusters. Finally,the determination of the optimal number of clusters was defined based on the principle ofparsimony and the potential clinical value of these three best options mentioned above. Acluster was considered clinically valuable when it facilitated more tailored care (targetedinterventions) for frail people.
R version 3.6.3 software (Vienna, Austria) was used to preprocess the data and toapply the clustering and IBM SPSS Statistic version 24 (Armonk, NY, USA) to characterizethe different obtained profiles.
2.6. Ethical Aspects
Informed consent was requested from the participants after they had been given oraland written information about the aims of the study. The study complies with Spanishregulations regarding the protection of personal data and was approved by the IDIAP’sClinical Research Ethics Committee–registration number P17/150.
3. Results
A total of 412 people participated in the study, mostly women (68.4%), with a mean ageof 88 (SD 8.1). Table 1 shows the characteristics of the participants in the total population.31.3% of cases had three or more target organ diseases–the most prevalent being heartdisease (60.2%) and chronic kidney failure (50.0%). More than 60% of participants reportedsignificant functional dependence for ADLs and IADLs. Approximately half had some
J. Clin. Med. 2021, 10, 2106 5 of 12
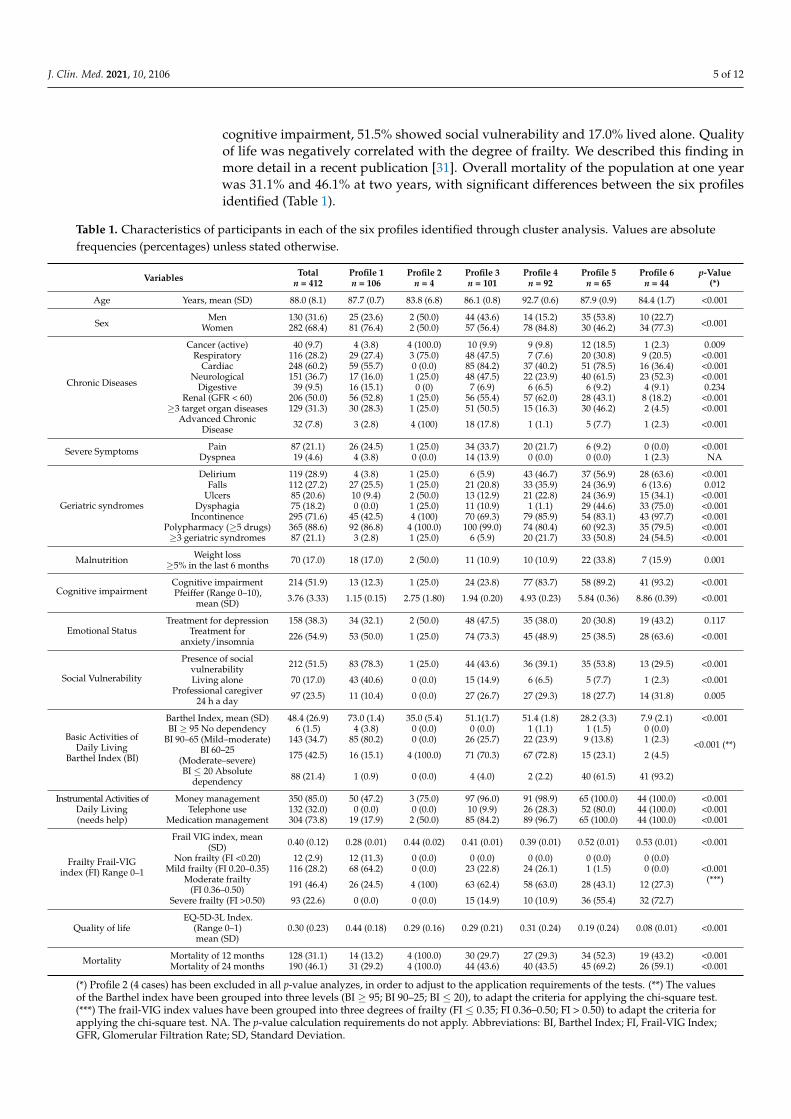
cognitive impairment, 51.5% showed social vulnerability and 17.0% lived alone. Qualityof life was negatively correlated with the degree of frailty. We described this finding inmore detail in a recent publication [31]. Overall mortality of the population at one yearwas 31.1% and 46.1% at two years, with significant differences between the six profilesidentified (Table 1).
Table 1. Characteristics of participants in each of the six profiles identified through cluster analysis. Values are absolutefrequencies (percentages) unless stated otherwise.
Variables Totaln = 412
Profile 1n = 106
Profile 2n = 4
Profile 3n = 101
Profile 4n = 92
Profile 5n = 65
Profile 6n = 44
p-Value(*)
Age Years, mean (SD) 88.0 (8.1) 87.7 (0.7) 83.8 (6.8) 86.1 (0.8) 92.7 (0.6) 87.9 (0.9) 84.4 (1.7) <0.001
SexMen 130 (31.6) 25 (23.6) 2 (50.0) 44 (43.6) 14 (15.2) 35 (53.8) 10 (22.7)
<0.001Women 282 (68.4) 81 (76.4) 2 (50.0) 57 (56.4) 78 (84.8) 30 (46.2) 34 (77.3)
Chronic Diseases
Cancer (active) 40 (9.7) 4 (3.8) 4 (100.0) 10 (9.9) 9 (9.8) 12 (18.5) 1 (2.3) 0.009Respiratory 116 (28.2) 29 (27.4) 3 (75.0) 48 (47.5) 7 (7.6) 20 (30.8) 9 (20.5) <0.001
Cardiac 248 (60.2) 59 (55.7) 0 (0.0) 85 (84.2) 37 (40.2) 51 (78.5) 16 (36.4) <0.001Neurological 151 (36.7) 17 (16.0) 1 (25.0) 48 (47.5) 22 (23.9) 40 (61.5) 23 (52.3) <0.001
Digestive 39 (9.5) 16 (15.1) 0 (0) 7 (6.9) 6 (6.5) 6 (9.2) 4 (9.1) 0.234Renal (GFR < 60) 206 (50.0) 56 (52.8) 1 (25.0) 56 (55.4) 57 (62.0) 28 (43.1) 8 (18.2) <0.001
≥3 target organ diseases 129 (31.3) 30 (28.3) 1 (25.0) 51 (50.5) 15 (16.3) 30 (46.2) 2 (4.5) <0.001Advanced Chronic
Disease 32 (7.8) 3 (2.8) 4 (100) 18 (17.8) 1 (1.1) 5 (7.7) 1 (2.3) <0.001
Severe Symptoms Pain 87 (21.1) 26 (24.5) 1 (25.0) 34 (33.7) 20 (21.7) 6 (9.2) 0 (0.0) <0.001Dyspnea 19 (4.6) 4 (3.8) 0 (0.0) 14 (13.9) 0 (0.0) 0 (0.0) 1 (2.3) NA
Geriatric syndromes
Delirium 119 (28.9) 4 (3.8) 1 (25.0) 6 (5.9) 43 (46.7) 37 (56.9) 28 (63.6) <0.001Falls 112 (27.2) 27 (25.5) 1 (25.0) 21 (20.8) 33 (35.9) 24 (36.9) 6 (13.6) 0.012
Ulcers 85 (20.6) 10 (9.4) 2 (50.0) 13 (12.9) 21 (22.8) 24 (36.9) 15 (34.1) <0.001Dysphagia 75 (18.2) 0 (0.0) 1 (25.0) 11 (10.9) 1 (1.1) 29 (44.6) 33 (75.0) <0.001
Incontinence 295 (71.6) 45 (42.5) 4 (100) 70 (69.3) 79 (85.9) 54 (83.1) 43 (97.7) <0.001Polypharmacy (≥5 drugs) 365 (88.6) 92 (86.8) 4 (100.0) 100 (99.0) 74 (80.4) 60 (92.3) 35 (79.5) <0.001≥3 geriatric syndromes 87 (21.1) 3 (2.8) 1 (25.0) 6 (5.9) 20 (21.7) 33 (50.8) 24 (54.5) <0.001
Malnutrition Weight loss≥5% in the last 6 months 70 (17.0) 18 (17.0) 2 (50.0) 11 (10.9) 10 (10.9) 22 (33.8) 7 (15.9) 0.001
Cognitive impairmentCognitive impairment 214 (51.9) 13 (12.3) 1 (25.0) 24 (23.8) 77 (83.7) 58 (89.2) 41 (93.2) <0.001Pfeiffer (Range 0–10),
mean (SD) 3.76 (3.33) 1.15 (0.15) 2.75 (1.80) 1.94 (0.20) 4.93 (0.23) 5.84 (0.36) 8.86 (0.39) <0.001
Emotional StatusTreatment for depression 158 (38.3) 34 (32.1) 2 (50.0) 48 (47.5) 35 (38.0) 20 (30.8) 19 (43.2) 0.117
Treatment foranxiety/insomnia 226 (54.9) 53 (50.0) 1 (25.0) 74 (73.3) 45 (48.9) 25 (38.5) 28 (63.6) <0.001
Social Vulnerability
Presence of socialvulnerability 212 (51.5) 83 (78.3) 1 (25.0) 44 (43.6) 36 (39.1) 35 (53.8) 13 (29.5) <0.001
Living alone 70 (17.0) 43 (40.6) 0 (0.0) 15 (14.9) 6 (6.5) 5 (7.7) 1 (2.3) <0.001Professional caregiver
24 h a day 97 (23.5) 11 (10.4) 0 (0.0) 27 (26.7) 27 (29.3) 18 (27.7) 14 (31.8) 0.005
Basic Activities ofDaily Living
Barthel Index (BI)
Barthel Index, mean (SD) 48.4 (26.9) 73.0 (1.4) 35.0 (5.4) 51.1(1.7) 51.4 (1.8) 28.2 (3.3) 7.9 (2.1) <0.001BI ≥ 95 No dependency 6 (1.5) 4 (3.8) 0 (0.0) 0 (0.0) 1 (1.1) 1 (1.5) 0 (0.0)
<0.001 (**)BI 90–65 (Mild–moderate) 143 (34.7) 85 (80.2) 0 (0.0) 26 (25.7) 22 (23.9) 9 (13.8) 1 (2.3)BI 60–25
(Moderate–severe) 175 (42.5) 16 (15.1) 4 (100.0) 71 (70.3) 67 (72.8) 15 (23.1) 2 (4.5)
BI ≤ 20 Absolutedependency 88 (21.4) 1 (0.9) 0 (0.0) 4 (4.0) 2 (2.2) 40 (61.5) 41 (93.2)
Instrumental Activities ofDaily Living(needs help)
Money management 350 (85.0) 50 (47.2) 3 (75.0) 97 (96.0) 91 (98.9) 65 (100.0) 44 (100.0) <0.001Telephone use 132 (32.0) 0 (0.0) 0 (0.0) 10 (9.9) 26 (28.3) 52 (80.0) 44 (100.0) <0.001
Medication management 304 (73.8) 19 (17.9) 2 (50.0) 85 (84.2) 89 (96.7) 65 (100.0) 44 (100.0) <0.001
Frailty Frail-VIGindex (FI) Range 0–1
Frail VIG index, mean(SD) 0.40 (0.12) 0.28 (0.01) 0.44 (0.02) 0.41 (0.01) 0.39 (0.01) 0.52 (0.01) 0.53 (0.01) <0.001
Non frailty (FI <0.20) 12 (2.9) 12 (11.3) 0 (0.0) 0 (0.0) 0 (0.0) 0 (0.0) 0 (0.0)<0.001
(***)Mild frailty (FI 0.20–0.35) 116 (28.2) 68 (64.2) 0 (0.0) 23 (22.8) 24 (26.1) 1 (1.5) 0 (0.0)
Moderate frailty(FI 0.36–0.50) 191 (46.4) 26 (24.5) 4 (100) 63 (62.4) 58 (63.0) 28 (43.1) 12 (27.3)
Severe frailty (FI >0.50) 93 (22.6) 0 (0.0) 0 (0.0) 15 (14.9) 10 (10.9) 36 (55.4) 32 (72.7)
Quality of lifeEQ-5D-3L Index.
(Range 0–1)mean (SD)
0.30 (0.23) 0.44 (0.18) 0.29 (0.16) 0.29 (0.21) 0.31 (0.24) 0.19 (0.24) 0.08 (0.01) <0.001
Mortality Mortality of 12 months 128 (31.1) 14 (13.2) 4 (100.0) 30 (29.7) 27 (29.3) 34 (52.3) 19 (43.2) <0.001Mortality of 24 months 190 (46.1) 31 (29.2) 4 (100.0) 44 (43.6) 40 (43.5) 45 (69.2) 26 (59.1) <0.001
(*) Profile 2 (4 cases) has been excluded in all p-value analyzes, in order to adjust to the application requirements of the tests. (**) The valuesof the Barthel index have been grouped into three levels (BI ≥ 95; BI 90–25; BI ≤ 20), to adapt the criteria for applying the chi-square test.(***) The frail-VIG index values have been grouped into three degrees of frailty (FI ≤ 0.35; FI 0.36–0.50; FI > 0.50) to adapt the criteria forapplying the chi-square test. NA. The p-value calculation requirements do not apply. Abbreviations: BI, Barthel Index; FI, Frail-VIG Index;GFR, Glomerular Filtration Rate; SD, Standard Deviation.
J. Clin. Med. 2021, 10, 2106 6 of 12
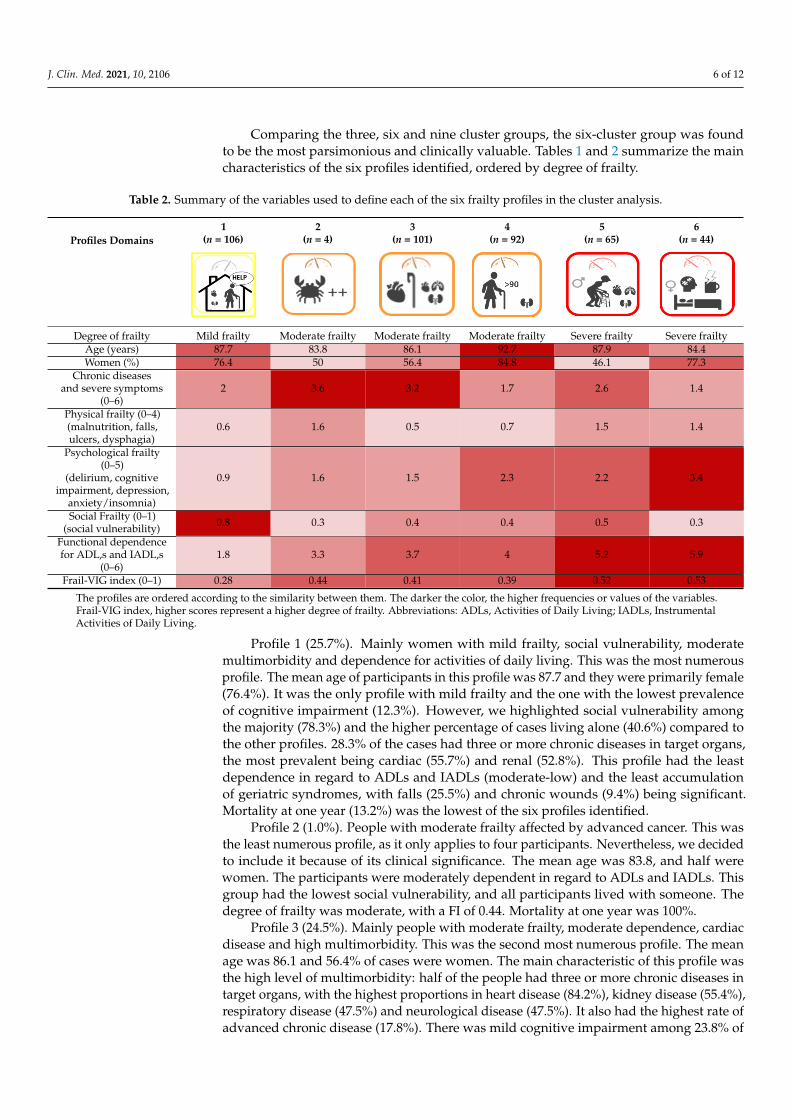
Comparing the three, six and nine cluster groups, the six-cluster group was foundto be the most parsimonious and clinically valuable. Tables 1 and 2 summarize the maincharacteristics of the six profiles identified, ordered by degree of frailty.
Table 2. Summary of the variables used to define each of the six frailty profiles in the cluster analysis.
Profiles Domains1
(n = 106)2
(n = 4)3
(n = 101)4
(n = 92)5
(n = 65)6
(n = 44)
J. Clin. Med. 2021, 10, x FOR PEER REVIEW 6 of 12
Variables Total n = 412
Profile 1 n = 106
Profile 2 n = 4
Profile 3 n = 101
Profile 4 n = 92
Profile 5 n = 65
Profile 6 n = 44
p-Value (*)
Daily Living (needs help)
Medication management 304 (73.8) 19 (17.9) 2 (50.0) 85 (84.2) 89 (96.7) 65 (100.0) 44 (100.0) <0.001
Frailty Frail-VIG index (FI) Range 0–1
Frail VIG index, mean (SD) 0.40 (0.12) 0.28 (0.01) 0.44 (0.02) 0.41 (0.01) 0.39 (0.01) 0.52 (0.01) 0.53 (0.01) <0.001 Non frailty (FI <0.20) 12 (2.9) 12 (11.3) 0 (0.0) 0 (0.0) 0 (0.0) 0 (0.0) 0 (0.0)
<0.001 (***)
Mild frailty (FI 0.20–0.35) 116 (28.2) 68 (64.2) 0 (0.0) 23 (22.8) 24 (26.1) 1 (1.5) 0 (0.0) Moderate frailty (FI 0.36–0.50) 191 (46.4) 26 (24.5) 4 (100) 63 (62.4) 58 (63.0) 28 (43.1) 12 (27.3)
Severe frailty (FI >0.50) 93 (22.6) 0 (0.0) 0 (0.0) 15 (14.9) 10 (10.9) 36 (55.4) 32 (72.7)
Quality of life EQ-5D-3L Index. (Range 0–1)
mean (SD) 0.30 (0.23) 0.44 (0.18) 0.29 (0.16) 0.29 (0.21) 0.31 (0.24) 0.19 (0.24) 0.08 (0.01) <0.001
Mortality Mortality of 12 months 128 (31.1) 14 (13.2) 4 (100.0) 30 (29.7) 27 (29.3) 34 (52.3) 19 (43.2) <0.001 Mortality of 24 months 190 (46.1) 31 (29.2) 4 (100.0) 44 (43.6) 40 (43.5) 45 (69.2) 26 (59.1) <0.001
(*) Profile 2 (4 cases) has been excluded in all p-value analyzes, in order to adjust to the application requirements of the tests. (**) The values of the Barthel index have been grouped into three levels (BI ≥ 95; BI 90–25; BI ≤ 20), to adapt the criteria for applying the chi-square test. (***) The frail-VIG index values have been grouped into three degrees of frailty (FI ≤ 0.35; FI 0.36–0.50; FI > 0.50) to adapt the criteria for applying the chi-square test. NA. The p-value calculation requirements do not apply. Abbreviations: BI, Barthel Index; FI, Frail-VIG Index; GFR, Glomerular Filtration Rate; SD, Standard Deviation.
Comparing the three, six and nine cluster groups, the six-cluster group was found to be the most parsimonious and clinically valuable. Tables 1 and 2 summarize the main characteristics of the six profiles identified, ordered by degree of frailty.
Table 2. Summary of the variables used to define each of the six frailty profiles in the cluster analysis.
Profiles Domains
1 (n = 106)
2 (n = 4)
3 (n = 101)
4 (n = 92)
5 (n = 65)
6 (n = 44)
Degree of frailty Mild frailty Moderate
frailty Moderate
frailty Moderate
frailty Severe frailty Severe frailty
Age (years) 87.7 83.8 86.1 92.7 87.9 84.4 Women (%) 76.4 50 56.4 84.8 46.1 77.3
Chronic diseases and severe symptoms (0–6)
2 3.6 3.2 1.7 2.6 1.4
Physical frailty (0–4) (malnutrition, falls, ulcers, dysphagia)
0.6 1.6 0.5 0.7 1.5 1.4
Psychological frailty (0–5) (delirium, cognitive impairment,
depression, anxiety/insomnia) 0.9 1.6 1.5 2.3 2.2 3.4
Social Frailty (0–1) (social vulnerability)
0.8 0.3 0.4 0.4 0.5 0.3
Functional dependence for ADL,s and IADL,s (0–6)
1.8 3.3 3.7 4 5.2 5.9
Frail-VIG index (0–1) 0.28 0.44 0.41 0.39 0.52 0.53 The profiles are ordered according to the similarity between them. The darker the color, the higher frequencies or values of the variables. Frail-VIG index, higher scores represent a higher degree of frailty. Abbreviations: ADLs, Activities of Daily Living; IADLs, Instrumental Activities of Daily Living.
Profile 1 (25.7%). Mainly women with mild frailty, social vulnerability, moderate multimorbidity and dependence for activities of daily living. This was the most numerous profile. The mean age of participants in this profile was 87.7 and they were primarily fe-
Degree of frailty Mild frailty Moderate frailty Moderate frailty Moderate frailty Severe frailty Severe frailtyAge (years) 87.7 83.8 86.1 92.7 87.9 84.4Women (%) 76.4 50 56.4 84.8 46.1 77.3
Chronic diseasesand severe symptoms
(0–6)2 3.6 3.2 1.7 2.6 1.4
Physical frailty (0–4)(malnutrition, falls,ulcers, dysphagia)
0.6 1.6 0.5 0.7 1.5 1.4
Psychological frailty(0–5)
(delirium, cognitiveimpairment, depression,
anxiety/insomnia)
0.9 1.6 1.5 2.3 2.2 3.4
Social Frailty (0–1)(social vulnerability) 0.8 0.3 0.4 0.4 0.5 0.3
Functional dependencefor ADL,s and IADL,s
(0–6)1.8 3.3 3.7 4 5.2 5.9
Frail-VIG index (0–1) 0.28 0.44 0.41 0.39 0.52 0.53
The profiles are ordered according to the similarity between them. The darker the color, the higher frequencies or values of the variables.Frail-VIG index, higher scores represent a higher degree of frailty. Abbreviations: ADLs, Activities of Daily Living; IADLs, InstrumentalActivities of Daily Living.
Profile 1 (25.7%). Mainly women with mild frailty, social vulnerability, moderatemultimorbidity and dependence for activities of daily living. This was the most numerousprofile. The mean age of participants in this profile was 87.7 and they were primarily female(76.4%). It was the only profile with mild frailty and the one with the lowest prevalenceof cognitive impairment (12.3%). However, we highlighted social vulnerability amongthe majority (78.3%) and the higher percentage of cases living alone (40.6%) compared tothe other profiles. 28.3% of the cases had three or more chronic diseases in target organs,the most prevalent being cardiac (55.7%) and renal (52.8%). This profile had the leastdependence in regard to ADLs and IADLs (moderate-low) and the least accumulationof geriatric syndromes, with falls (25.5%) and chronic wounds (9.4%) being significant.Mortality at one year (13.2%) was the lowest of the six profiles identified.
Profile 2 (1.0%). People with moderate frailty affected by advanced cancer. This wasthe least numerous profile, as it only applies to four participants. Nevertheless, we decidedto include it because of its clinical significance. The mean age was 83.8, and half werewomen. The participants were moderately dependent in regard to ADLs and IADLs. Thisgroup had the lowest social vulnerability, and all participants lived with someone. Thedegree of frailty was moderate, with a FI of 0.44. Mortality at one year was 100%.
Profile 3 (24.5%). Mainly people with moderate frailty, moderate dependence, cardiacdisease and high multimorbidity. This was the second most numerous profile. The meanage was 86.1 and 56.4% of cases were women. The main characteristic of this profile wasthe high level of multimorbidity: half of the people had three or more chronic diseases intarget organs, with the highest proportions in heart disease (84.2%), kidney disease (55.4%),respiratory disease (47.5%) and neurological disease (47.5%). It also had the highest rate ofadvanced chronic disease (17.8%). There was mild cognitive impairment among 23.8% of
J. Clin. Med. 2021, 10, 2106 7 of 12
cases, and moderate-high dependence for ADLs and IADLs. 43.6% of cases were sociallyvulnerable, and 14.9% lived alone. A quarter of the participants had experienced falls and12.9% had chronic wounds. The degree of frailty for this profile was moderate (FI 0.41).Mortality at one year was 29.7%.
Profile 4 (22.3%). Primarily nonagenarian women with moderate frailty, mild cognitiveimpairment and moderate-high dependence. This was one of the most numerous profiles,the oldest (a mean age of 92.7) and mainly women (84.8%). It was characterized by the highpresence of mild cognitive impairment (83.7%) and moderate-high dependence for ADLsand IADLs. Social vulnerability was present in 39.1% of cases, with 6.5% living alone and29.3% with a 24-h informal caregiver. 16.3% of the cases had three or more chronic diseasesin target organs, the most prevalent being kidney (62.0%) and renal (40.2%) diseases. 21.7%of cases had three or more geriatric syndromes, with rates of delirium at 46.7%, falls 35.9%and ulcers 22.8%. All this implied a moderate degree of frailty (FI 0.39). Mortality at oneyear was 29.3%.
Profile 5 (15.8%). Mainly men with severe frailty, moderate-high multimorbidity andhigh dependence. The mean age under this profile was 87.9, and a minority were women(46.1%). They had a high proportion of moderate cognitive impairment (89.2%), and severedependence for ADLs and IADLs. This was the second most socially vulnerable profile,at 53.8%. 7.7% of the people in this profile lived alone and 27.7% lived with an informalcaregiver. 46.2% of cases had three or more chronic diseases in target organs, the mostprevalent being cardiac (78.5%), neurological (61.5%) and renal (46.2%) diseases. Half ofthe people had three or more geriatric syndromes, with 56.9% having delirium. This profilehad the highest proportion of falls (36.9%) and chronic wounds (36.9%). All of the abovereflected a degree of severe frailty (FI 0.52). Mortality at one year was 52.3%.
Profile 6 (10.7%). Mainly women with severe frailty, cognitive impairment, dyspha-gia and total dependence. The cases in this profile were mainly women (77.3%), with amean age of 84.4 years. We found the highest rate-93.2%-of cognitive impairment (moder-ate/severe) and total dependence for ADLs and IADLs. Social vulnerability was indicatedin 29.5% of cases, and it was the profile with the highest percentage of permanent informalcaregivers at 31.8%. This profile had the lowest burden of overall multimorbidity, with apredominance of neurological disease (52.3%) as well as over half the cases having three ormore geriatric syndromes, with higher rates than under the other profiles for dysphagia(75%) and delirium (63.6%). Chronic wounds were also present in a third of cases. All ofthe above implied severe frailty (FI 0.53). Mortality at one year was 43.2%.
4. Discussion
The aim of the study was to identify frailty profiles among older people users of ahome-based primary care service from a multidimensional perspective (physical, psycho-logical and social). We identified six frailty profiles. Three of these profiles corresponded toa moderate frailty degree, two to a severe frailty degree and one to a mild frailty degree. Inaddition, almost three quarters of the study population were clustered into three profiles(profiles 1, 3 and 4) that corresponded to mild and moderate degree of frailty. It is they,therefore, who could benefit from planning frailty-prevention activities.
The profiles identified reveal underlying problems among the different domains offrailty and interrelated concepts (morbidity and dependence). These confirm the complexityof frailty, which is not sufficiently captured from measuring the degree of frailty and thedistinction between the different domains affected (physical, psychological and social).
These results are in line with three previous studies that looked at profiles of peo-ple living in the community using a multidimensional assessment approach. Lafortuneet al. [14] identify four profiles based on the assessment of physical and cognitive dimen-sions: relatively healthy, physical-cognitive impairment, significant physical impairmentand significant cognitive impairment. Armstrong et al. [15] identify seven profiles amonghome-based rehabilitation clients, based on an assessment of physical, cognitive and socialdimensions: people living alone and requiring assistance with housework and bathing;
J. Clin. Med. 2021, 10, 2106 8 of 12
cognitively intact people who are independent in regard to ADLs; people requiring assis-tance with IADLs and bathing; women requiring assistance with IADLs; women requiringassistance with IADLs and some ADLs; people who are dependent but mobile and havecognitive problems; people who are dependent and immobile with cognitive problems.Looman et al. [16] identify six profiles based on physical, cognitive, and social functioning:relatively healthy; mild physical frailty; psychological frailty; severe physical frailty; med-ically frail; and multi-frail. All three studies identify a profile of relatively healthy olderpeople, which did not appear in the present study. This could be related to the fact thatthe study population was composed of people included under a home-care program, whopresent greater vulnerability. In another recent study [32], three functional groups of olderpeople at risk of disability are identified: physical, social and mixed. The psychosocialgroup, however, includes variables from the psychological and social dimensions, whichcan make it difficult to plan differentiated preventive or management activities.
The vast majority of frailty research that focuses on people’s outcomes is based onadverse outcomes, such as mortality, dependence, hospitalization and institutionalization.Outcomes related to positive aspects such as well-being and quality of life are less stud-ied [24,33]. In our study, we have analyzed both negative outcomes (mortality, dependence,polypharmacy) as well as a positive outcome (quality of life). Frail older people can alsopresent improvement in their quality of life. Therefore, the information will also serve topersonalize the care plans based on a positive approach.
The main strength of this study is the statistical technique applied to determine theprofiles, as well as the standardized data collection, using simple measurement instrumentsthat are commonly used in healthcare practice. This pragmatic perspective would befeasible and capable of being extrapolated to larger populations. Another strong point isthe differentiation between the concepts of frailty, morbidity and dependence, as it helpswith planning care that is better aligned with needs. Where there is morbidity, activitieswill be planned to prevent or reduce frailty; where there is frailty, activities will be plannedto prevent adverse outcomes, such as dependence [21].
4.1. Limitations and Future Research Recommendations
The main limitation of the study is that although the sample studied was large andall possible participants have been included, it corresponds to an aging population in anurban area with a medium-high socio-economic level, which makes it difficult to generalizethe results to other settings or populations. Moreover, the Frail-VIG index is a simple andfeasible instrument for use in the care setting, albeit with some limitations: the variables thatcorrespond to physical frailty are focused on geriatric syndromes (weight loss, dysphagia,falls, ulcers) and do not include other variables that are recognized for identifying physicalfrailty. Here, the reference model would be Fried’s phenotype [9].
Future studies should contrast the results obtained in relation to other populationsincluded under home-care programs with different socio-cultural levels and analyze otherenvironments (for example, residential). It would also be useful to assess aspects of socialfrailty in greater depth. We suggest that this should include the three main componentsidentified in a recent review: threat or absence of social resources to meet basic socialneeds; threat or absence of social behaviors and social activities; and threat or absence ofself-management skills [34].
4.2. Care Implications and Outlook for the Future
The multidimensional nature of frailty has resulted in the identification of heteroge-neous profiles, under which it would be useful to adapt care plans in health care practice.The multidimensional impact of frailty justifies multicomponent interventions [35–37].Indications for multimorbidity management should also take account of health priorities,assess the potential benefits of interventions against potential harms, identify the person’shealth trajectory, and encourage shared decision making, aligning people’s wishes andprofessionals’ opinions [1,38]. An effective overall management approach would include
J. Clin. Med. 2021, 10, 2106 9 of 12
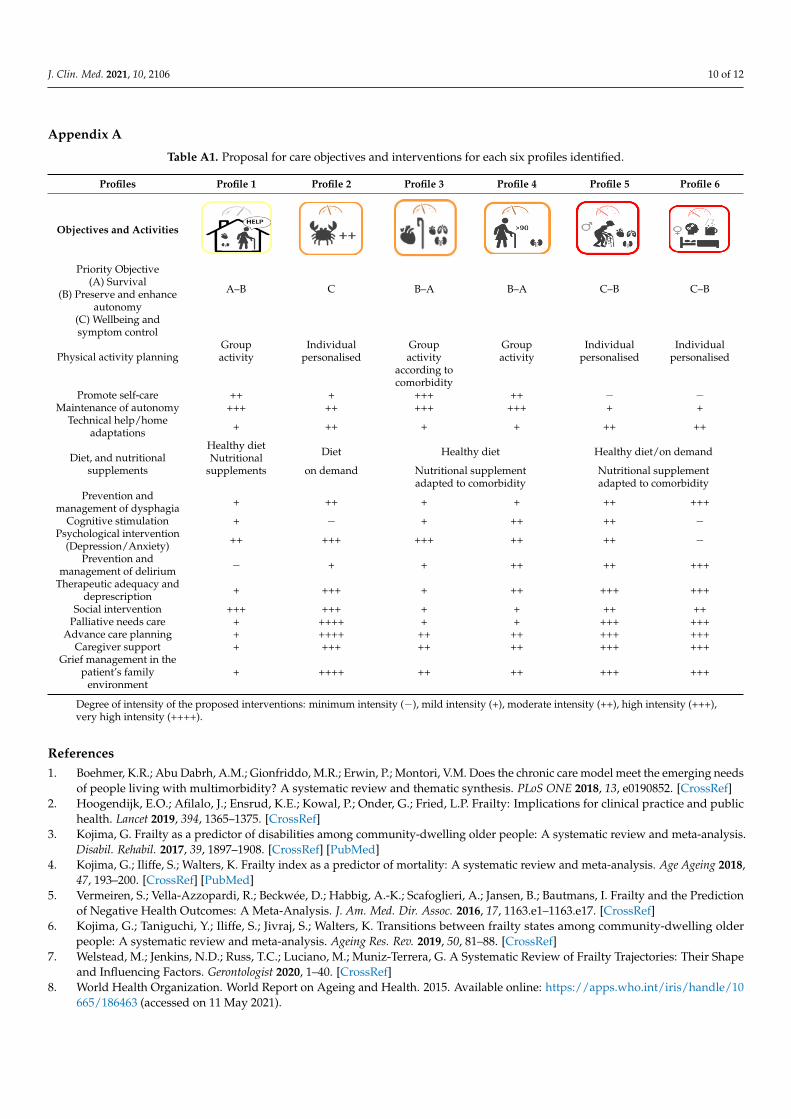
physical activity, nutritional supplementation, cognitive training, structured medicationreview, and social reinforcement. This approach shares similarities with other programsstudied in our healthcare setting with the resources available in community care and otherdevices in the territory [39–41]. Table A1 in appendix shows, as an example a pragmaticproposal of care objectives and interventions for the different profiles identified, accordingto the current evidence for the management of frailty [35–37] and the multimorbidity [1,38].Finally, it would also be helpful to include the opinions of the people cared for at home,their family members and caregivers on the profiles identified, as well as the care plansproposed for each of them.
5. Conclusions
This study identified six profiles of frailty, with clinical interest in older people users ofa home-based primary care service. It shows that the population included under the home-care program is heterogeneous and has different care needs. Identifying these profilescomplements information on degrees of frailty as it enables different care needs to beascertained for people who are identified as having the same degree of frailty and is usefulwhen designing interventions that are aligned with the needs of each population profile.
Author Contributions: Conceptualization, J.-J.Z.-S., E.Z.-d.-O. and S.F.-B.; data curation, J.-J.Z.-S.;formal analysis, J.-J.Z.-S., E.Z.-d.-O. and S.F.-B.; funding acquisition, J.-J.Z.-S.; investigation, J.-J.Z.-S.;methodology, J.-J.Z.-S. and J.A.-N.; project administration, J.-J.Z.-S.; resources, J.-J.Z.-S.; supervision,E.Z.-d.-O., V.G.-C. and I.J.-R.; visualization, J.-J.Z.-S., E.Z.-d.-O. and S.F.-B.; writing—original draft,J.-J.Z.-S.; writing—review and editing, J.-J.Z.-S., E.Z.-d.-O., S.F.-B., V.G.-C., I.J.-R. and G.P.-T. andJ.A.-N. All authors have read and agreed to the published version of the manuscript.
Funding: J.-J.Z.-S. was supported by a PERIS grant from the Departament de Salut de la Generalitatde Catalunya (the Catalan Regional Government’s Health Department), Spain for the period 2019-20registration number SLT008/18/00011.
Institutional Review Board Statement: The study was conducted according to the guidelines of theDeclaration of Helsinki, and approved by the Jordi Gol i Gorina Ethics Committee (code: P17/150;date 6 November 2017).
Informed Consent Statement: Informed consent was obtained from all subjects involved in theStudy or by family members in the case of advanced dementia.
Data Availability Statement: The data presented in this study are available on request from thecorresponding author. The data are not publicly available due to ethical reasons.
Acknowledgments: The authors of this study would like to thank all the professionals who helpedwith collecting the data, in particular the nurses of the home-care unit of the Montnegre PrimaryCare team.
Conflicts of Interest: The authors declare no conflict of interest. The funders had no role in the designof the study; in the collection, analyses, or interpretation of data; in the writing of the manuscript, orin the decision to publish the results.
J. Clin. Med. 2021, 10, 2106 10 of 12
Appendix A
Table A1. Proposal for care objectives and interventions for each six profiles identified.
Profiles Profile 1 Profile 2 Profile 3 Profile 4 Profile 5 Profile 6
Objectives and Activities
J. Clin. Med. 2021, 10, x FOR PEER REVIEW 10 of 12
Institutional Review Board Statement: The study was conducted according to the guidelines of the Declaration of Helsinki, and approved by the Jordi Gol i Gorina Ethics Committee (code: P17/150; date 6 November 2017)
Informed Consent Statement: Informed consent was obtained from all subjects involved in the Study or by family members in the case of advanced dementia.
Data Availability Statement: The data presented in this study are available on request from the corresponding author. The data are not publicly available due to ethical reasons.
Acknowledgments: The authors of this study would like to thank all the professionals who helped with collecting the data, in particular the nurses of the home-care unit of the Montnegre Primary Care team.
Conflicts of Interest: The authors declare no conflict of interest. The funders had no role in the design of the study; in the collection, analyses, or interpretation of data; in the writing of the manu-script, or in the decision to publish the results.
Appendix A
Table A1. Proposal for care objectives and interventions for each six profiles identified.
Profiles Profile 1 Profile 2 Profile 3 Profile 4 Profile 5 Profile 6
Objectives and Activities
Priority Objective
A–B C B–A B–A C–B C–B (A) Survival
(B) Preserve and enhance autonomy (C) Wellbeing and symptom control
Physical activity planning
Group Individual Group Group Individual Individual activity personalised activity activity personalised personalised
according to comorbidity
Promote self-care ++ + +++ ++ − − Maintenance of autonomy +++ ++ +++ +++ + +
Technical help/home adaptations + ++ + + ++ ++
Diet, and nutritional supplements
Healthy diet Nutritional
Diet Healthy diet Healthy diet/on demand
supplements on demand Nutritional supplement Nutritional supplement adapted to comorbidity adapted to comorbidity
Prevention and management of dysphagia + ++ + + ++ +++ Cognitive stimulation + − + ++ ++ −
Psychological intervention (Depres-sion/Anxiety)
++ +++ +++ ++ ++ −
Prevention and management of delirium − + + ++ ++ +++ Therapeutic adequacy and deprescription + +++ + ++ +++ +++
Social intervention +++ +++ + + ++ ++ Palliative needs care + ++++ + + +++ +++
Advance care planning + ++++ ++ ++ +++ +++ Caregiver support + +++ ++ ++ +++ +++
Grief management in the patient’s family environment
+ ++++ ++ ++ +++ +++
Degree of intensity of the proposed interventions: minimum intensity (−), mild intensity (+), moderate intensity (++), high intensity (+++), very high intensity (++++).
Priority Objective
A–B C B–A B–A C–B C–B(A) Survival
(B) Preserve and enhanceautonomy
(C) Wellbeing andsymptom control
Physical activity planningGroup Individual Group Group Individual Individualactivity personalised activity activity personalised personalised
according tocomorbidity
Promote self-care ++ + +++ ++ − −Maintenance of autonomy +++ ++ +++ +++ + +
Technical help/homeadaptations + ++ + + ++ ++
Diet, and nutritionalsupplements
Healthy dietNutritional Diet Healthy diet Healthy diet/on demand
supplements on demand Nutritional supplement Nutritional supplementadapted to comorbidity adapted to comorbidity
Prevention andmanagement of dysphagia + ++ + + ++ +++
Cognitive stimulation + − + ++ ++ −Psychological intervention
(Depression/Anxiety) ++ +++ +++ ++ ++ −
Prevention andmanagement of delirium − + + ++ ++ +++
Therapeutic adequacy anddeprescription + +++ + ++ +++ +++
Social intervention +++ +++ + + ++ ++Palliative needs care + ++++ + + +++ +++
Advance care planning + ++++ ++ ++ +++ +++Caregiver support + +++ ++ ++ +++ +++
Grief management in thepatient’s family
environment+ ++++ ++ ++ +++ +++
Degree of intensity of the proposed interventions: minimum intensity (−), mild intensity (+), moderate intensity (++), high intensity (+++),very high intensity (++++).
References1. Boehmer, K.R.; Abu Dabrh, A.M.; Gionfriddo, M.R.; Erwin, P.; Montori, V.M. Does the chronic care model meet the emerging needs
of people living with multimorbidity? A systematic review and thematic synthesis. PLoS ONE 2018, 13, e0190852. [CrossRef]2. Hoogendijk, E.O.; Afilalo, J.; Ensrud, K.E.; Kowal, P.; Onder, G.; Fried, L.P. Frailty: Implications for clinical practice and public
health. Lancet 2019, 394, 1365–1375. [CrossRef]3. Kojima, G. Frailty as a predictor of disabilities among community-dwelling older people: A systematic review and meta-analysis.
Disabil. Rehabil. 2017, 39, 1897–1908. [CrossRef] [PubMed]4. Kojima, G.; Iliffe, S.; Walters, K. Frailty index as a predictor of mortality: A systematic review and meta-analysis. Age Ageing 2018,
47, 193–200. [CrossRef] [PubMed]5. Vermeiren, S.; Vella-Azzopardi, R.; Beckwée, D.; Habbig, A.-K.; Scafoglieri, A.; Jansen, B.; Bautmans, I. Frailty and the Prediction
of Negative Health Outcomes: A Meta-Analysis. J. Am. Med. Dir. Assoc. 2016, 17, 1163.e1–1163.e17. [CrossRef]6. Kojima, G.; Taniguchi, Y.; Iliffe, S.; Jivraj, S.; Walters, K. Transitions between frailty states among community-dwelling older
people: A systematic review and meta-analysis. Ageing Res. Rev. 2019, 50, 81–88. [CrossRef]7. Welstead, M.; Jenkins, N.D.; Russ, T.C.; Luciano, M.; Muniz-Terrera, G. A Systematic Review of Frailty Trajectories: Their Shape
and Influencing Factors. Gerontologist 2020, 1–40. [CrossRef]8. World Health Organization. World Report on Ageing and Health. 2015. Available online: https://apps.who.int/iris/handle/10
665/186463 (accessed on 11 May 2021).
J. Clin. Med. 2021, 10, 2106 11 of 12
9. Fried, L.P.; Tangen, C.M.; Walston, J.; Newman, A.B.; Hirsch, C.; Gottdiener, J.; Seeman, T.; Tracy, R.; Kop, W.J.; Burke, G.; et al.Frailty in Older Adults: Evidence for a Phenotype. J. Gerontol. Ser. A Biol. Sci. Med. Sci. 2001, 56, M146–M157. [CrossRef][PubMed]
10. Mitnitski, A.B.; Mogilner, A.J.; Rockwood, K. Accumulation of Deficits as a Proxy Measure of Aging. Sci. World J. 2001, 1, 323–336.[CrossRef]
11. Cesari, M.; Gambassi, G.; van Kan, G.A.; Vellas, B. The frailty phenotype and the frailty index: Different instruments for differentpurposes. Age Ageing 2014, 43, 10–12. [CrossRef]
12. Puts, M.T.E.; Toubasi, S.; Andrew, M.K.; Ashe, M.C.; Ploeg, J.; Atkinson, E.; Ayala, A.P.; Roy, A.; Monforte, M.R.; Bergman, H.;et al. Interventions to prevent or reduce the level of frailty in community-dwelling older adults: A scoping review of the literatureand international policies. Age Ageing 2017, 46, 383–392. [CrossRef] [PubMed]
13. Amblàs-Novellas, J.; Martori, J.C.; Espaulella, J.; Oller, R.; Molist-Brunet, N.; Inzitari, M.; Romero-Ortuno, R. Frail-VIG index: Aconcise frailty evaluation tool for rapid geriatric assessment. BMC Geriatr. 2018, 18, 29. [CrossRef]
14. LaFortune, L.; Béland, F.; Bergman, H.; Ankri, J. Health status transitions in community-living elderly with complex care needs:A latent class approach. BMC Geriatr. 2009, 9, 6. [CrossRef] [PubMed]
15. Armstrong, J.J.; Zhu, M.; Hirdes, J.P.; Stolee, P. K-Means Cluster Analysis of Rehabilitation Service Users in the Home HealthCare System of Ontario: Examining the Heterogeneity of a Complex Geriatric Population. Arch. Phys. Med. Rehabil. 2012, 93,2198–2205. [CrossRef]
16. Looman, W.M.; Fabbricotti, I.N.; Blom, J.W.; Jansen, A.P.D.; Lutomski, J.E.; Metzelthin, S.F.; Huijsman, R. The frail older persondoes not exist: Development of frailty profiles with latent class analysis. BMC Geriatr. 2018, 18, 84. [CrossRef]
17. Violán, C.; Roso-Llorach, A.; Foguet-Boreu, Q.; Guisado-Clavero, M.; Pons-Vigués, M.; Pujol-Ribera, E.; Valderas, J.M. Multimor-bidity patterns with K-means nonhierarchical cluster analysis. BMC Fam. Pr. 2018, 19, 108. [CrossRef]
18. Marengoni, A.; Roso-Llorach, A.; Vetrano, D.L.; Fernández, S.; Guisado-Clavero, M.; Violán, C.; Calderón-Larrañaga, A.;Fernández-Bertolín, S. Patterns of Multimorbidity in a Population-Based Cohort of Older People: Sociodemographic, Lifestyle,and Functional Differences. J. Gerontol. Ser. A Boil. Sci. Med. Sci. 2019, 75, 798–805. [CrossRef]
19. Johnston, M.C.; Crilly, M.; Black, C.; Prescott, G.J.; Mercer, S.W. Defining and measuring multimorbidity: A systematic review ofsystematic reviews. Eur. J. Public Health 2019, 29, 182–189. [CrossRef] [PubMed]
20. Thillainadesan, J.; A Scott, I.; Le Couteur, D.G. Frailty, a multisystem ageing syndrome. Age Ageing 2020, 49, 758–763. [CrossRef]21. Gobbens, R.J.J.; Luijkx, K.G.; Wijnen-Sponselee, M.T.; Schols, J.M.G.A. Towards an integral conceptual model of frailty. J. Nutr.
Health Aging 2010, 14, 175–181. [CrossRef]22. Vetrano, D.L.; Palmer, K.; Marengoni, A.; Marzetti, E.; Lattanzio, F.; Roller-Wirnsberger, R.; Samaniego, L.L.; Rodríguez-Mañas, L.;
Bernabei, R.; Onder, G. Frailty and Multimorbidity: A Systematic Review and Meta-analysis. J. Gerontol. Ser. A Boil. Sci. Med. Sci.2019, 74, 659–666. [CrossRef]
23. Kojima, G.; Iliffe, S.; Jivraj, S.; Walters, K. Association between frailty and quality of life among community-dwelling older people:A systematic review and meta-analysis. J. Epidemiol. Community Health 2016, 70, 716–721. [CrossRef]
24. Crocker, T.F.; Brown, L.; Clegg, A.; Farley, K.; Franklin, M.; Simpkins, S.; Young, J. Quality of life is substantially worse forcommunity-dwelling older people living with frailty: Systematic review and meta-analysis. Qual. Life Res. 2019, 28, 2041–2056.[CrossRef] [PubMed]
25. Renne, I.; Gobbens, R.J. Effects of frailty and chronic diseases on quality of life in Dutch community-dwelling older adults: Across-sectional study. Clin. Interv. Aging 2018, 13, 325–334. [CrossRef]
26. CatSalut. Mòduls per al Seguiment d’indicadors de Qualitat. Available online: https://msiq.catsalut.cat/IMP.html (accessed on28 December 2020).
27. Amblàs-Novellas, J.; Martori, J.C.; Brunet, N.M.; Oller, R.; Gómez-Batiste, X.; Panicot, J.E. Índice frágil-VIG: Diseño y evaluaciónde un índice de fragilidad basado en la Valoración Integral Geriátrica. Rev. Española Geriatría y Gerontol. 2017, 52, 119–127.[CrossRef]
28. Herdman, M.; Badia, X.; Berra, S. El EuroQol-5D: Una alternativa sencilla para la medición de la calidad de vida relacionada conla salud en atención primaria. Atención Primaria 2001, 28, 425–429. [CrossRef]
29. Kringos, D.S.; Boerma, W.G.W.; Hutchinson, A.; Saltman, R.B. Building Primary Care in a Changing Europe. Case Studies. UnitedKingdom: Observatory on Health Systems and Policies. Available online: https://www.ncbi.nlm.nih.gov/books/NBK459010/pdf/Bookshelf_NBK459010.pdf (accessed on 27 April 2021).
30. Liu, Y.; Li, Z.; Xiong, H.; Gao, X.; Wu, J. Understanding of Internal Clustering Validation Measures. Int. Conf. Data Min. 2010, 21,911–916. [CrossRef]
31. Zamora-Sánchez, J.-J.; Zabaleta-Del-Olmo, E.; Gea-Caballero, V.; Julián-Rochina, I.; Pérez-Tortajada, G.; Amblàs-Novellas, J.Convergent and discriminative validity of the Frail-VIG index with the EQ-5D-3L in people cared for in primary health care.BMC Geriatr. 2021, 21, 243. [CrossRef] [PubMed]
32. Costanzo, L.; Pedone, C.; Cesari, M.; Ferrucci, L.; Bandinelli, S.; Incalzi, R.A. Clusters of functional domains to identify olderpersons at risk of disability. Geriatr. Gerontol. Int. 2017, 18, 685–691. [CrossRef]
33. Duppen, D.; Rossi, G.; Dierckx, E.; Hoeyberghs, L.; De Donder, L. D-SCOPE Consortium Focusing on positive outcomes in frailtyresearch: Development of a short well-being instrument for older adults (SWIO). Int. Psychogeriatrics 2019, 31, 767–777. [CrossRef]
J. Clin. Med. 2021, 10, 2106 12 of 12
34. Bunt, S.; Steverink, N.; Olthof, J.; Van Der Schans, C.P.; Hobbelen, J.S.M. Social frailty in older adults: A scoping review. Eur. J.Ageing 2017, 14, 323–334. [CrossRef]
35. Abbasi, M.; Rolfson, D.; Khera, A.S.; Dabravolskaj, J.; Dent, E.; Xia, L. Identification and management of frailty in the primarycare setting. Can. Med. Assoc. J. 2018, 190, E1134–E1140. [CrossRef]
36. Apóstolo, J.; Cooke, R.; Bobrowicz-Campos, E.; Santana, S.; Marcucci, M.; Cano, A.; Vollenbroek-Hutten, M.; Germini, F.;D’Avanzo, B.; Gwyther, H.; et al. Effectiveness of interventions to prevent pre-frailty and frailty progression in older adults: Asystematic review. JBI Database Syst. Rev. Implement. Rep. 2018, 16, 140–232. [CrossRef]
37. Dent, E.; Martin, F.C.; Bergman, H.; Woo, J.; Romero-Ortuno, R.; Walston, J.D. Management of frailty: Opportunities, challenges,and future directions. Lancet 2019, 394, 1376–1386. [CrossRef]
38. Boyd, C.; Smith, C.D.; Masoudi, F.A.; Blaum, C.S.; Dodson, J.A.; Green, A.R.; Kelley, A.; Matlock, D.; Ouellet, J.; Rich, M.W.; et al.Decision Making for Older Adults with Multiple Chronic Conditions: Executive Summary for the American Geriatrics SocietyGuiding Principles on the Care of Older Adults With Multimorbidity. J. Am. Geriatr. Soc. 2019, 67, 665–673. [CrossRef] [PubMed]
39. Inzitari, M.; Pérez, L.M.; Enfedaque, M.B.; Soto, L.; Díaz, F.; Gual, N.; Martín, E.; Orfila, F.; Mulero, P.; Ruiz, R.; et al. Integratedprimary and geriatric care for frail older adults in the community: Implementation of a complex intervention into real life. Eur. J.Intern. Med. 2018, 56, 57–63. [CrossRef] [PubMed]
40. Romera-Liebana, L.; Orfila, F.; Segura, J.M.; Real, J.; Fabra, M.L.; Möller, M.; Lancho, S.; Ramirez, A.; Marti, N.; Cullell, M.; et al.Effects of a Primary Care-Based Multifactorial Intervention on Physical and Cognitive Function in Frail, Elderly Individuals: ARandomized Controlled Trial. J. Gerontol. Ser. A Boil. Sci. Med. Sci. 2018, 73, 1668–1674. [CrossRef] [PubMed]
41. Huguet, L.G.; González, M.N.; Kostov, B.; Carmona, M.O.; Francia, C.C.; Nieto, M.C.; Docón, A.H.; Sauquet, R.V.; Prado, R.G.;Sisó-Almirall, A. Pre Frail 80: Multifactorial Intervention to Prevent Progression of Pre-Frailty to Frailty in the Elderly. J. Nutr.Health Aging 2018, 22, 1266–1274. [CrossRef]