Embed Size (px)
Citation preview

Tennessee Higher Education Commission
404 James Robertson Parkway, Suite 1900 | Nashville, TN 34243
Higher Education
Profiles & Trends
2013
Tennessee Higher Education Commission P a g e | 1
Tennessee Higher Education Profiles and Trends – January 2013
TENNESSEE HIGHER EDUCATION COMMISSION
2012 – 2013 COMMISSION MEMBERS
Mr. Charles W. Bone, Hendersonville, 6th Congressional District
Mr. Evan Cope, Vice Chair, Murfreesboro, 4th Congressional District
Mr. Gregory Frye, University of Tennessee, Martin
Mr. Tre Hargett, Secretary of State
Ms. Sharon Hayes, Brownsville, 8th Congressional District
Mr. Greg Isaacs, Knoxville, 2nd Congressional District
Mr. Adam Jarvis, East Tennessee State University
Mr. Cato Johnson, Bartlett, 7th Congressional District
Mr. Jon Kinsey, Chattanooga, 3rd Congressional District
Mr. David Lillard, Jr., State Treasurer
Dr. Gary Nixon, Executive Director, State Board of Education
Mayor A C Wharton, Secretary, Memphis, 9th Congressional District
Mr. Robert White, Chair, Johnson City, 1st Congressional District
Mr. Justin Wilson, State Comptroller
VACANT, 5th Congressional District
Tennessee Higher Education Commission P a g e | 2
Tennessee Higher Education Profiles and Trends – January 2013
PURPOSE OF THIS REPORT
The statute [T.C.A. §49-7-202(c)(7)] requires the Tennessee Higher Education Commission to prepare a biennial report for the governor and the general assembly, “commenting upon major developments, trends, new policies, budgets and financial considerations which in the judgment of the commission will be useful to the governor and to the general assembly in planning for the sound and adequate development of the state's program of public higher education.”
The purpose of this report is to provide state policymakers with a brief overview of Tennessee higher education within a regional and national context. This report presents data and analyses on five broad policy issues important to the state: 1) State context of higher education, 2) Student preparation, 3) Student participation, 4) Student progression, and 5) State higher education finance.
EXECUTIVE SUMMARY
• Tennessee trails the U.S. and Southern Regional Education Board (SREB) averages in both college educational attainment and economic vitality (Figures: 1.1, 1.2, 1.4). Distinct economic differences also exist across the state’s three Grand Divisions (Figures: 1.5, 1.6, 1.7).
• Although Tennessee is a net importer of labor at all levels of educational attainment, about one-third of the state’s in-migrants arrive without previously enrolling in college (Figure 1.3).
• Tennessee’s population is increasing rapidly and growing perceptibly older (Figure 1.8). For the population age 18 and younger, the most salient demographic change is the growth in the number of people of Hispanic origin (Figure 1.9).
• Tennessee trails the U.S. and SREB averages in 8th-graders’ test results in the National Assessment of Educational Progress (mathematics and science); NAEP scores of African-American students are, on average, lower than that of other ethnic groups (Figure 2.1). Minority students in the state demonstrate lower college retention and graduation rates than Caucasian students (Figures: 4.1, 4.3, 4.4).
• The public high school graduation rate in Tennessee continues to rise and has exceeded the national average, outpacing the SREB average by a large margin (Figure 2.2). Minority students in Tennessee public high schools demonstrate a higher freshman graduation rate than the U.S. and SREB averages (Figure 2.3).
• Since the Tennessee Education Lottery Scholarship (TELS) program began in 2004, a greater percentage of Tennessee high school graduates are enrolling in in-state institutions (Figure 3.2).
• Adult student participation in postsecondary education in the state is low; however, it is increasing across all institutional sectors, with the greatest growth observed in the private sector—especially in for-profit institutions (Figures: 3.4, 3.5).
• The six-year graduation rate in Tennessee is increasing both at two-and four-year public institutions.
• Although Tennessee ranks third nationally in the amount of state grant aid per full-time equivalent student, less than a quarter of this grant aid is need-based (Figure 5.4).
• Despite the growth in tuition and fees over the last two decades (Figures: 5.2, 5.3), higher education in Tennessee remains comparatively affordable in terms of the net cost of college relative to median family income (Figure 5.5). Availability of TELS awards brings higher education within reach of more Tennesseans (Figure 5.4).
Tennessee Higher Education Commission P a g e | 3
Tennessee Higher Education Profiles and Trends – January 2013
1. STATE CONTEXT OF HIGHER EDUCATION
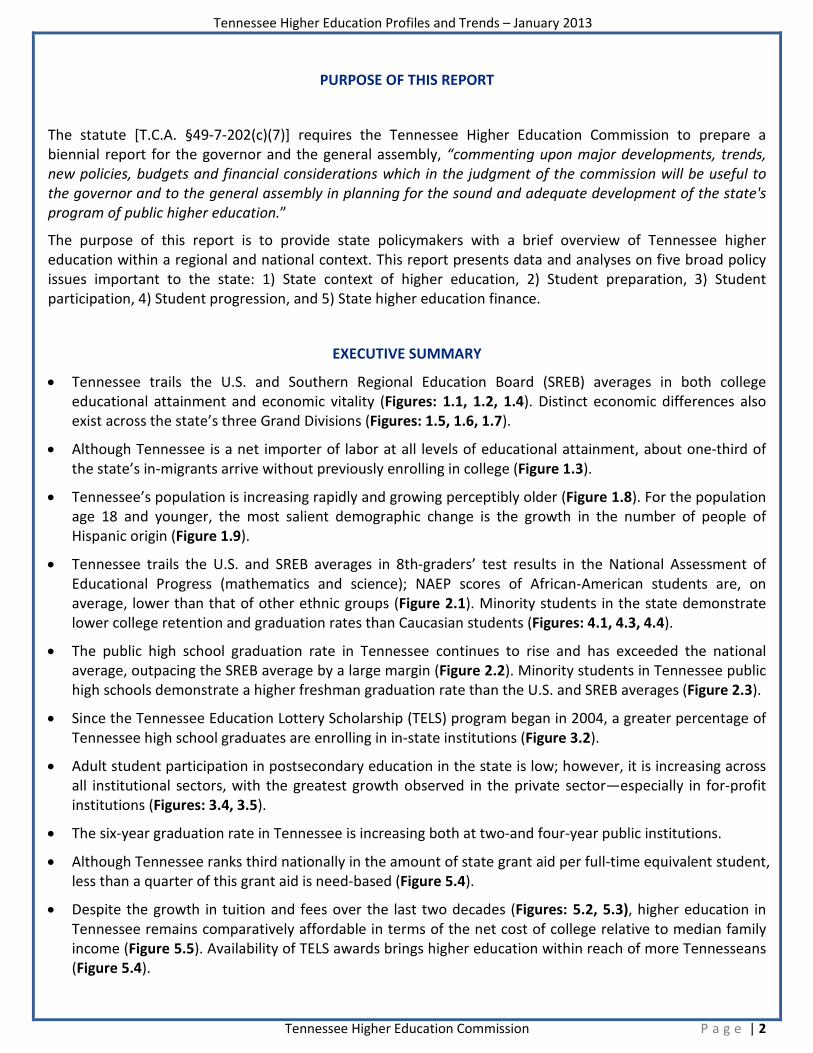
Personal income and educational attainment are linked to a
state’s economic competitiveness. In 2011, Tennessee’s per
capita income was $36,567, ranking 35th in the nation.
Meanwhile, 29.6 percent of adult state residents had at least
an associate’s degree, which ranked 43rd (Figure 1.1). The
orange-lettered states in the upper right quadrant of the
figure scored in the top ten on the New Economy Index,
which measures the extent to which state economies are
knowledge-based, innovative, and globalized. In 2010,
Tennessee ranked 41st in the New Economy Index. 1
1.1. Educational Attainment and Personal Income per Capita (2011)
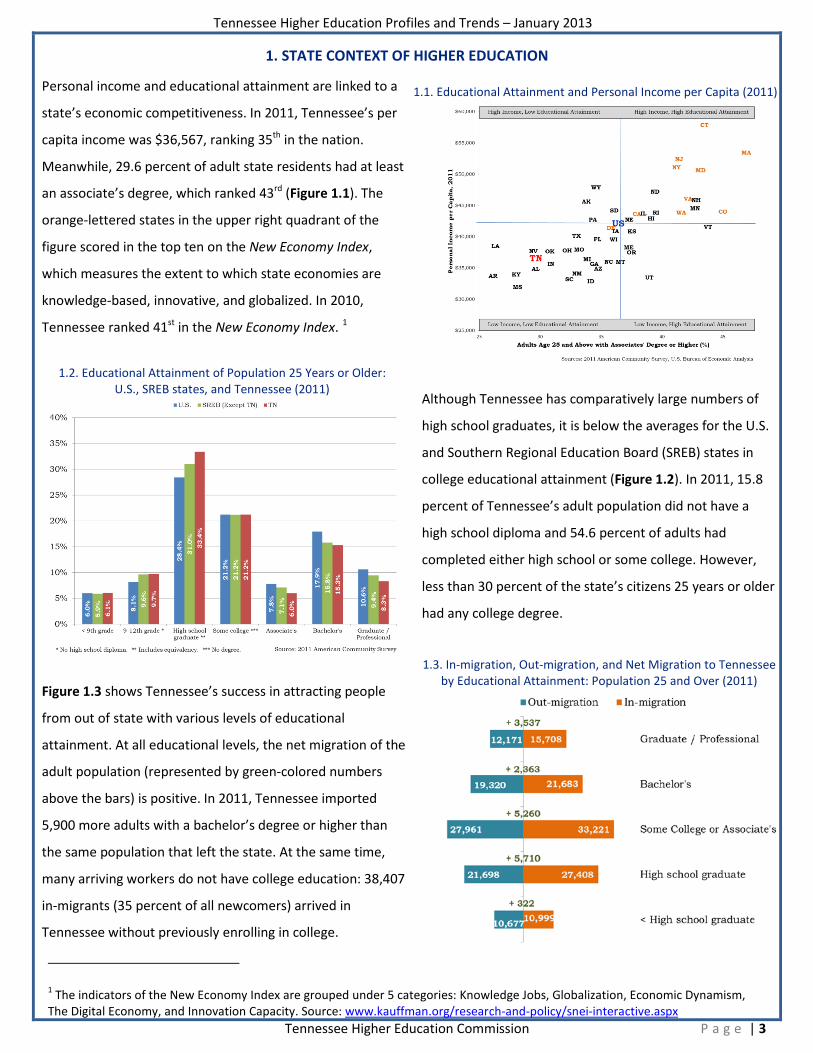
1.2. Educational Attainment of Population 25 Years or Older:
U.S., SREB states, and Tennessee (2011) Although Tennessee has comparatively large numbers of
high school graduates, it is below the averages for the U.S.
and Southern Regional Education Board (SREB) states in
college educational attainment (Figure 1.2). In 2011, 15.8
percent of Tennessee’s adult population did not have a
high school diploma and 54.6 percent of adults had
completed either high school or some college. However,
less than 30 percent of the state’s citizens 25 years or older
had any college degree.
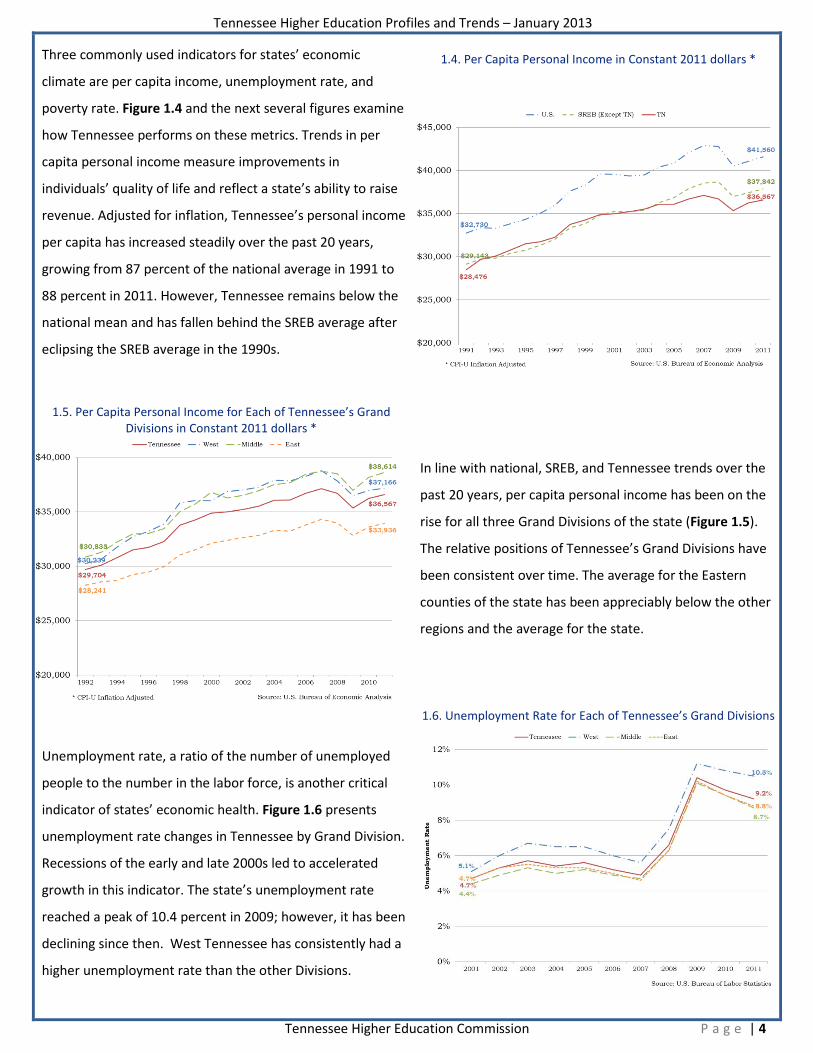
Figure 1.3 shows Tennessee’s success in attracting people
from out of state with various levels of educational
attainment. At all educational levels, the net migration of the
adult population (represented by green-colored numbers
above the bars) is positive. In 2011, Tennessee imported
5,900 more adults with a bachelor’s degree or higher than
the same population that left the state. At the same time,
many arriving workers do not have college education: 38,407
in-migrants (35 percent of all newcomers) arrived in
Tennessee without previously enrolling in college.
1.3. In-migration, Out-migration, and Net Migration to Tennessee by Educational Attainment: Population 25 and Over (2011)
1 The indicators of the New Economy Index are grouped under 5 categories: Knowledge Jobs, Globalization, Economic Dynamism, The Digital Economy, and Innovation Capacity. Source: www.kauffman.org/research-and-policy/snei-interactive.aspx
Tennessee Higher Education Commission P a g e | 4
Tennessee Higher Education Profiles and Trends – January 2013
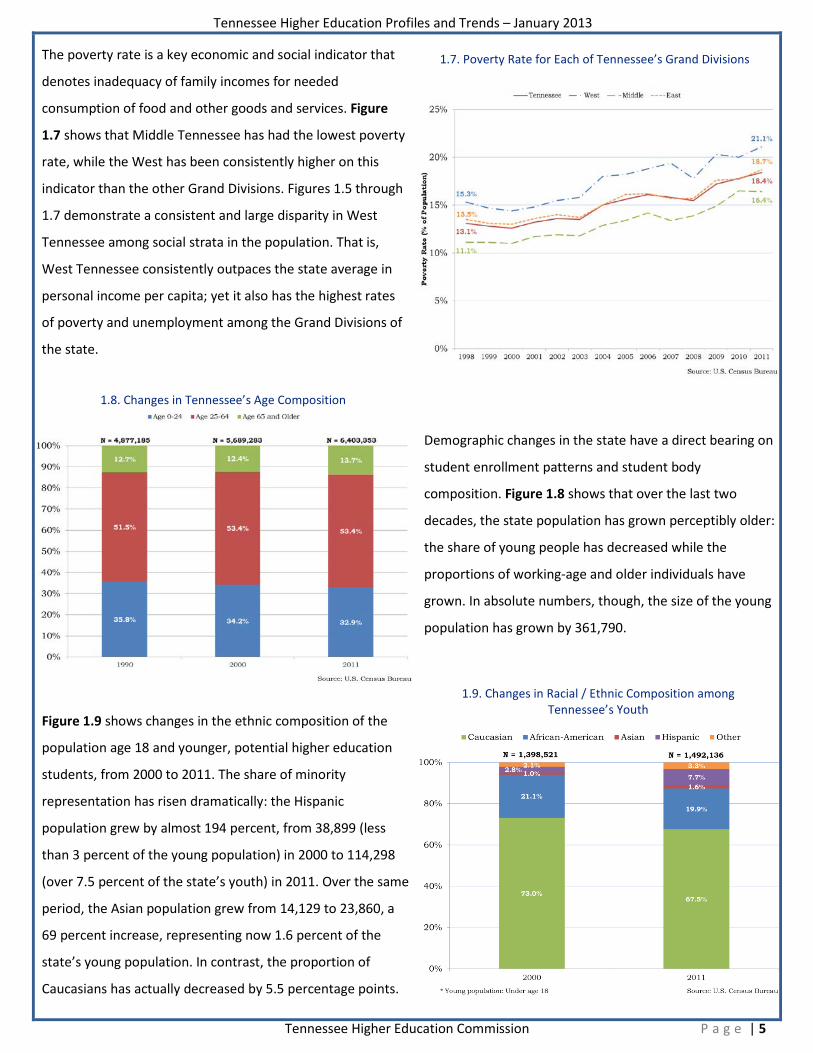
Three commonly used indicators for states’ economic
climate are per capita income, unemployment rate, and
poverty rate. Figure 1.4 and the next several figures examine
how Tennessee performs on these metrics. Trends in per
capita personal income measure improvements in
individuals’ quality of life and reflect a state’s ability to raise
revenue. Adjusted for inflation, Tennessee’s personal income
per capita has increased steadily over the past 20 years,
growing from 87 percent of the national average in 1991 to
88 percent in 2011. However, Tennessee remains below the
national mean and has fallen behind the SREB average after
eclipsing the SREB average in the 1990s.
1.4. Per Capita Personal Income in Constant 2011 dollars *
1.5. Per Capita Personal Income for Each of Tennessee’s Grand Divisions in Constant 2011 dollars *
In line with national, SREB, and Tennessee trends over the
past 20 years, per capita personal income has been on the
rise for all three Grand Divisions of the state (Figure 1.5).
The relative positions of Tennessee’s Grand Divisions have
been consistent over time. The average for the Eastern
counties of the state has been appreciably below the other
regions and the average for the state.
Unemployment rate, a ratio of the number of unemployed
people to the number in the labor force, is another critical
indicator of states’ economic health. Figure 1.6 presents
unemployment rate changes in Tennessee by Grand Division.
Recessions of the early and late 2000s led to accelerated
growth in this indicator. The state’s unemployment rate
reached a peak of 10.4 percent in 2009; however, it has been
declining since then. West Tennessee has consistently had a
higher unemployment rate than the other Divisions.
1.6. Unemployment Rate for Each of Tennessee’s Grand Divisions
Tennessee Higher Education Commission P a g e | 5
Tennessee Higher Education Profiles and Trends – January 2013
The poverty rate is a key economic and social indicator that
denotes inadequacy of family incomes for needed
consumption of food and other goods and services. Figure
1.7 shows that Middle Tennessee has had the lowest poverty
rate, while the West has been consistently higher on this
indicator than the other Grand Divisions. Figures 1.5 through
1.7 demonstrate a consistent and large disparity in West
Tennessee among social strata in the population. That is,
West Tennessee consistently outpaces the state average in
personal income per capita; yet it also has the highest rates
of poverty and unemployment among the Grand Divisions of
the state.
1.7. Poverty Rate for Each of Tennessee’s Grand Divisions
1.8. Changes in Tennessee’s Age Composition
Demographic changes in the state have a direct bearing on
student enrollment patterns and student body
composition. Figure 1.8 shows that over the last two
decades, the state population has grown perceptibly older:
the share of young people has decreased while the
proportions of working-age and older individuals have
grown. In absolute numbers, though, the size of the young
population has grown by 361,790.
Figure 1.9 shows changes in the ethnic composition of the
population age 18 and younger, potential higher education
students, from 2000 to 2011. The share of minority
representation has risen dramatically: the Hispanic
population grew by almost 194 percent, from 38,899 (less
than 3 percent of the young population) in 2000 to 114,298
(over 7.5 percent of the state’s youth) in 2011. Over the same
period, the Asian population grew from 14,129 to 23,860, a
69 percent increase, representing now 1.6 percent of the
state’s young population. In contrast, the proportion of
Caucasians has actually decreased by 5.5 percentage points.
1.9. Changes in Racial / Ethnic Composition among Tennessee’s Youth
Tennessee Higher Education Commission P a g e | 6
Tennessee Higher Education Profiles and Trends – January 2013
2. STUDENT PREPARATION
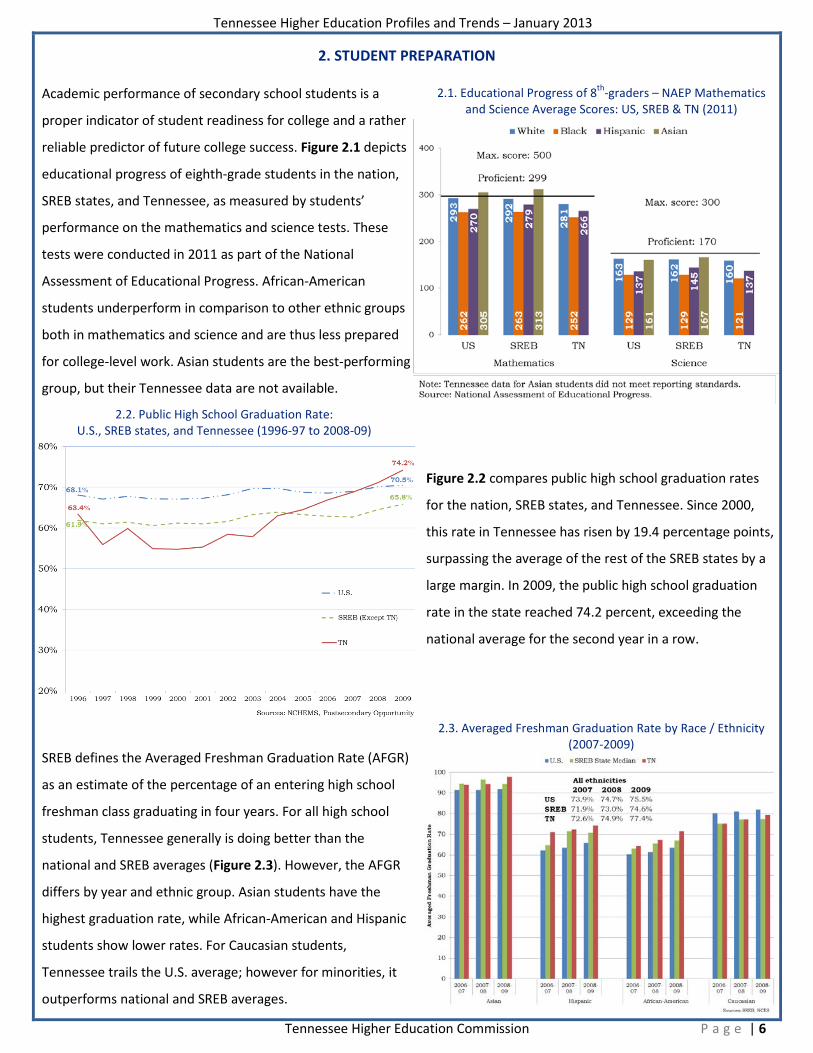
Academic performance of secondary school students is a
proper indicator of student readiness for college and a rather
reliable predictor of future college success. Figure 2.1 depicts
educational progress of eighth-grade students in the nation,
SREB states, and Tennessee, as measured by students’
performance on the mathematics and science tests. These
tests were conducted in 2011 as part of the National
Assessment of Educational Progress. African-American
students underperform in comparison to other ethnic groups
both in mathematics and science and are thus less prepared
for college-level work. Asian students are the best-performing
group, but their Tennessee data are not available.
2.1. Educational Progress of 8th-graders – NAEP Mathematics and Science Average Scores: US, SREB & TN (2011)
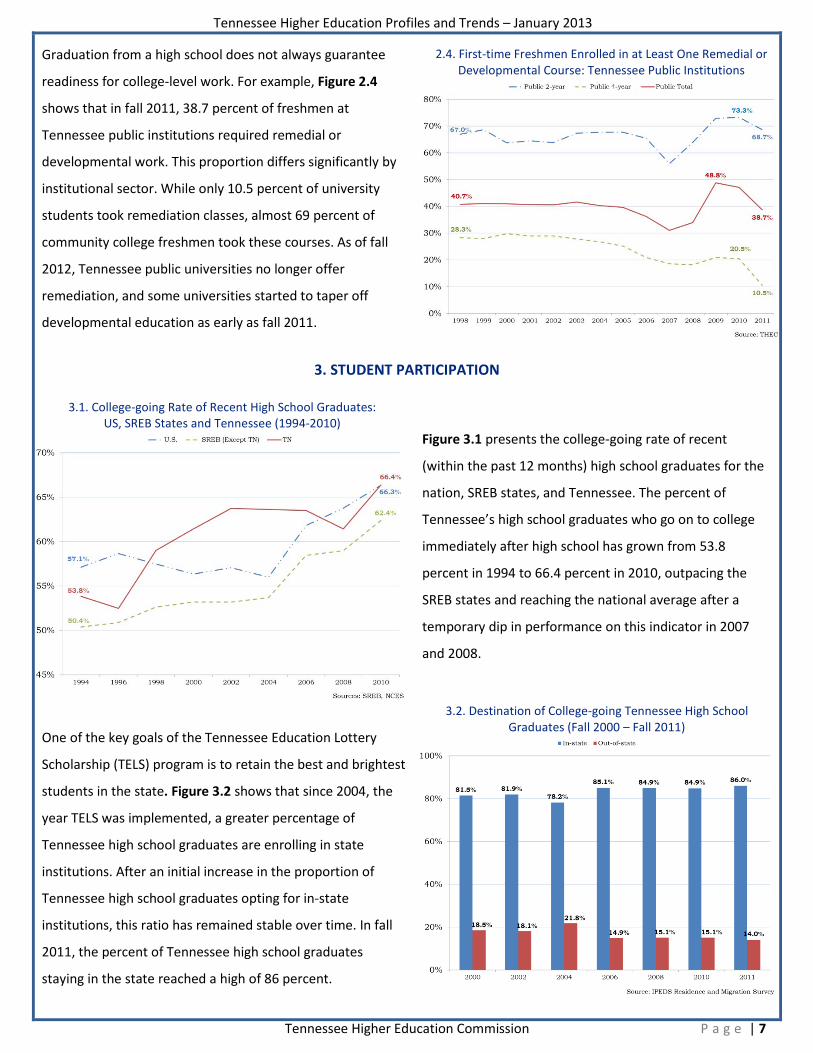
2.2. Public High School Graduation Rate:
U.S., SREB states, and Tennessee (1996-97 to 2008-09)
Figure 2.2 compares public high school graduation rates
for the nation, SREB states, and Tennessee. Since 2000,
this rate in Tennessee has risen by 19.4 percentage points,
surpassing the average of the rest of the SREB states by a
large margin. In 2009, the public high school graduation
rate in the state reached 74.2 percent, exceeding the
national average for the second year in a row.
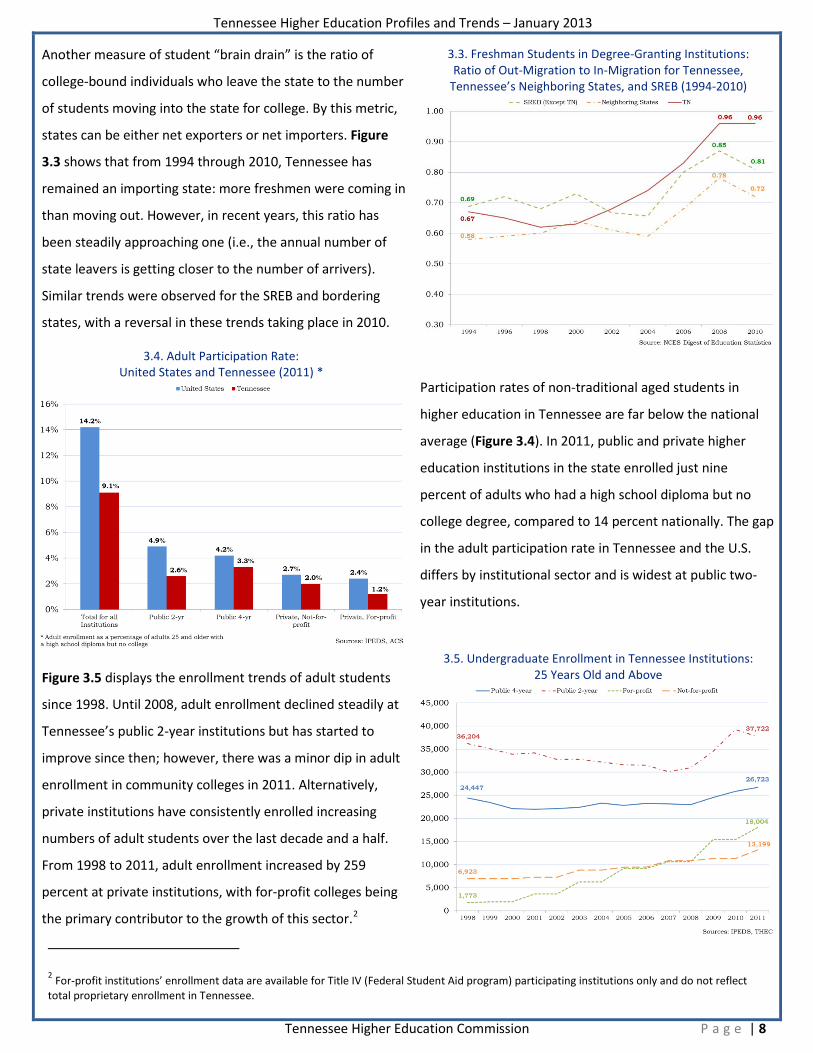
SREB defines the Averaged Freshman Graduation Rate (AFGR)
as an estimate of the percentage of an entering high school
freshman class graduating in four years. For all high school
students, Tennessee generally is doing better than the
national and SREB averages (Figure 2.3). However, the AFGR
differs by year and ethnic group. Asian students have the
highest graduation rate, while African-American and Hispanic
students show lower rates. For Caucasian students,
Tennessee trails the U.S. average; however for minorities, it
outperforms national and SREB averages.
2.3. Averaged Freshman Graduation Rate by Race / Ethnicity (2007-2009)
Tennessee Higher Education Commission P a g e | 7
Tennessee Higher Education Profiles and Trends – January 2013
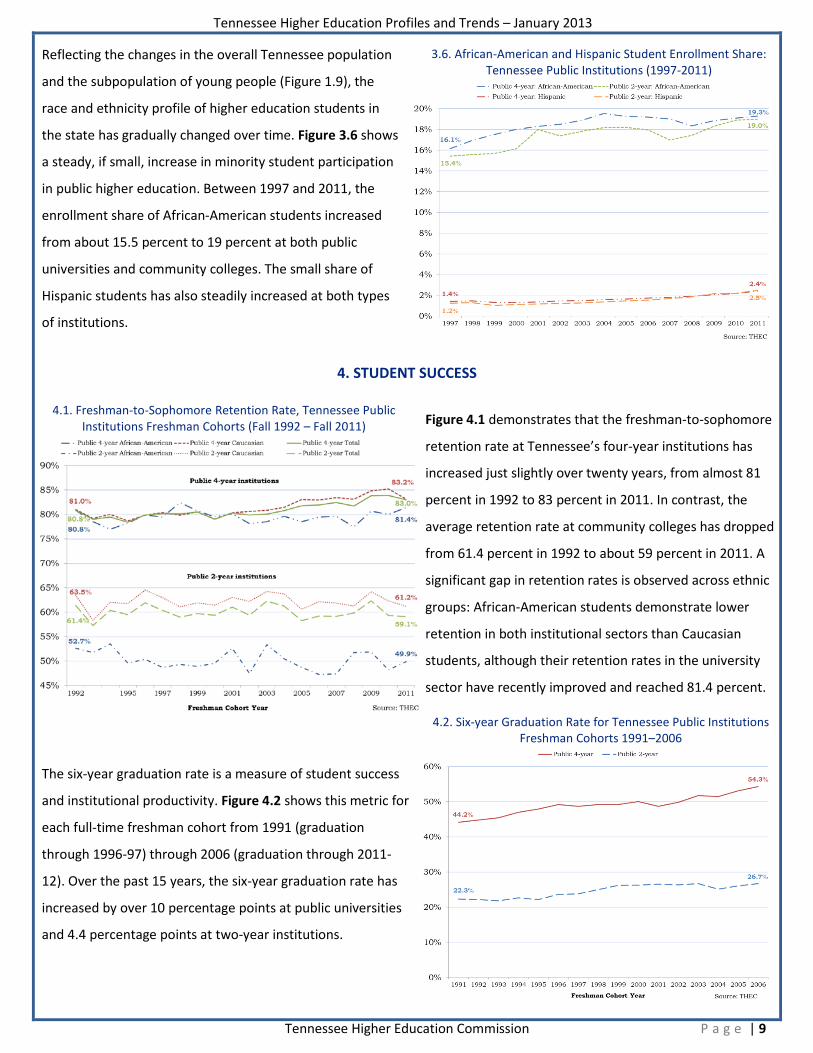
Graduation from a high school does not always guarantee
readiness for college-level work. For example, Figure 2.4
shows that in fall 2011, 38.7 percent of freshmen at
Tennessee public institutions required remedial or
developmental work. This proportion differs significantly by
institutional sector. While only 10.5 percent of university
students took remediation classes, almost 69 percent of
community college freshmen took these courses. As of fall
2012, Tennessee public universities no longer offer
remediation, and some universities started to taper off
developmental education as early as fall 2011.
2.4. First-time Freshmen Enrolled in at Least One Remedial or Developmental Course: Tennessee Public Institutions
3. STUDENT PARTICIPATION
3.1. College-going Rate of Recent High School Graduates: US, SREB States and Tennessee (1994-2010)
Figure 3.1 presents the college-going rate of recent
(within the past 12 months) high school graduates for the
nation, SREB states, and Tennessee. The percent of
Tennessee’s high school graduates who go on to college
immediately after high school has grown from 53.8
percent in 1994 to 66.4 percent in 2010, outpacing the
SREB states and reaching the national average after a
temporary dip in performance on this indicator in 2007
and 2008.
One of the key goals of the Tennessee Education Lottery
Scholarship (TELS) program is to retain the best and brightest
students in the state. Figure 3.2 shows that since 2004, the
year TELS was implemented, a greater percentage of
Tennessee high school graduates are enrolling in state
institutions. After an initial increase in the proportion of
Tennessee high school graduates opting for in-state
institutions, this ratio has remained stable over time. In fall
2011, the percent of Tennessee high school graduates
staying in the state reached a high of 86 percent.
3.2. Destination of College-going Tennessee High School Graduates (Fall 2000 – Fall 2011)
Tennessee Higher Education Commission P a g e | 8
Tennessee Higher Education Profiles and Trends – January 2013
Another measure of student “brain drain” is the ratio of
college-bound individuals who leave the state to the number
of students moving into the state for college. By this metric,
states can be either net exporters or net importers. Figure
3.3 shows that from 1994 through 2010, Tennessee has
remained an importing state: more freshmen were coming in
than moving out. However, in recent years, this ratio has
been steadily approaching one (i.e., the annual number of
state leavers is getting closer to the number of arrivers).
Similar trends were observed for the SREB and bordering
states, with a reversal in these trends taking place in 2010.
3.3. Freshman Students in Degree-Granting Institutions: Ratio of Out-Migration to In-Migration for Tennessee,
Tennessee’s Neighboring States, and SREB (1994-2010)
3.4. Adult Participation Rate:
United States and Tennessee (2011) * Participation rates of non-traditional aged students in
higher education in Tennessee are far below the national
average (Figure 3.4). In 2011, public and private higher
education institutions in the state enrolled just nine
percent of adults who had a high school diploma but no
college degree, compared to 14 percent nationally. The gap
in the adult participation rate in Tennessee and the U.S.
differs by institutional sector and is widest at public two-
year institutions.
Figure 3.5 displays the enrollment trends of adult students
since 1998. Until 2008, adult enrollment declined steadily at
Tennessee’s public 2-year institutions but has started to
improve since then; however, there was a minor dip in adult
enrollment in community colleges in 2011. Alternatively,
private institutions have consistently enrolled increasing
numbers of adult students over the last decade and a half.
From 1998 to 2011, adult enrollment increased by 259
percent at private institutions, with for-profit colleges being
the primary contributor to the growth of this sector.2
3.5. Undergraduate Enrollment in Tennessee Institutions: 25 Years Old and Above
2 For-profit institutions’ enrollment data are available for Title IV (Federal Student Aid program) participating institutions only and do not reflect total proprietary enrollment in Tennessee.
Tennessee Higher Education Commission P a g e | 9
Tennessee Higher Education Profiles and Trends – January 2013
Reflecting the changes in the overall Tennessee population
and the subpopulation of young people (Figure 1.9), the
race and ethnicity profile of higher education students in
the state has gradually changed over time. Figure 3.6 shows
a steady, if small, increase in minority student participation
in public higher education. Between 1997 and 2011, the
enrollment share of African-American students increased
from about 15.5 percent to 19 percent at both public
universities and community colleges. The small share of
Hispanic students has also steadily increased at both types
of institutions.
3.6. African-American and Hispanic Student Enrollment Share: Tennessee Public Institutions (1997-2011)
4. STUDENT SUCCESS 4.1. Freshman-to-Sophomore Retention Rate, Tennessee Public
Institutions Freshman Cohorts (Fall 1992 – Fall 2011) Figure 4.1 demonstrates that the freshman-to-sophomore
retention rate at Tennessee’s four-year institutions has
increased just slightly over twenty years, from almost 81
percent in 1992 to 83 percent in 2011. In contrast, the
average retention rate at community colleges has dropped
from 61.4 percent in 1992 to about 59 percent in 2011. A
significant gap in retention rates is observed across ethnic
groups: African-American students demonstrate lower
retention in both institutional sectors than Caucasian
students, although their retention rates in the university
sector have recently improved and reached 81.4 percent.
The six-year graduation rate is a measure of student success
and institutional productivity. Figure 4.2 shows this metric for
each full-time freshman cohort from 1991 (graduation
through 1996-97) through 2006 (graduation through 2011-
12). Over the past 15 years, the six-year graduation rate has
increased by over 10 percentage points at public universities
and 4.4 percentage points at two-year institutions.
4.2. Six-year Graduation Rate for Tennessee Public Institutions Freshman Cohorts 1991–2006
Tennessee Higher Education Commission P a g e | 10
Tennessee Higher Education Profiles and Trends – January 2013
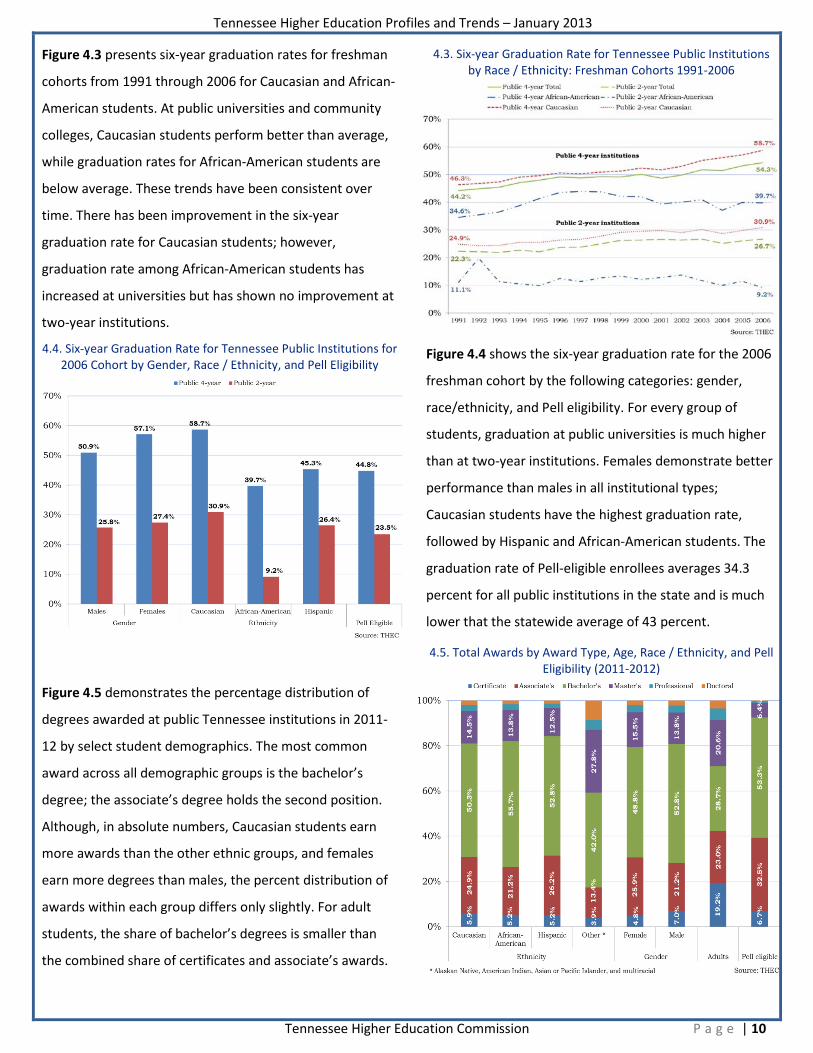
Figure 4.3 presents six-year graduation rates for freshman
cohorts from 1991 through 2006 for Caucasian and African-
American students. At public universities and community
colleges, Caucasian students perform better than average,
while graduation rates for African-American students are
below average. These trends have been consistent over
time. There has been improvement in the six-year
graduation rate for Caucasian students; however,
graduation rate among African-American students has
increased at universities but has shown no improvement at
two-year institutions.
4.3. Six-year Graduation Rate for Tennessee Public Institutions by Race / Ethnicity: Freshman Cohorts 1991-2006
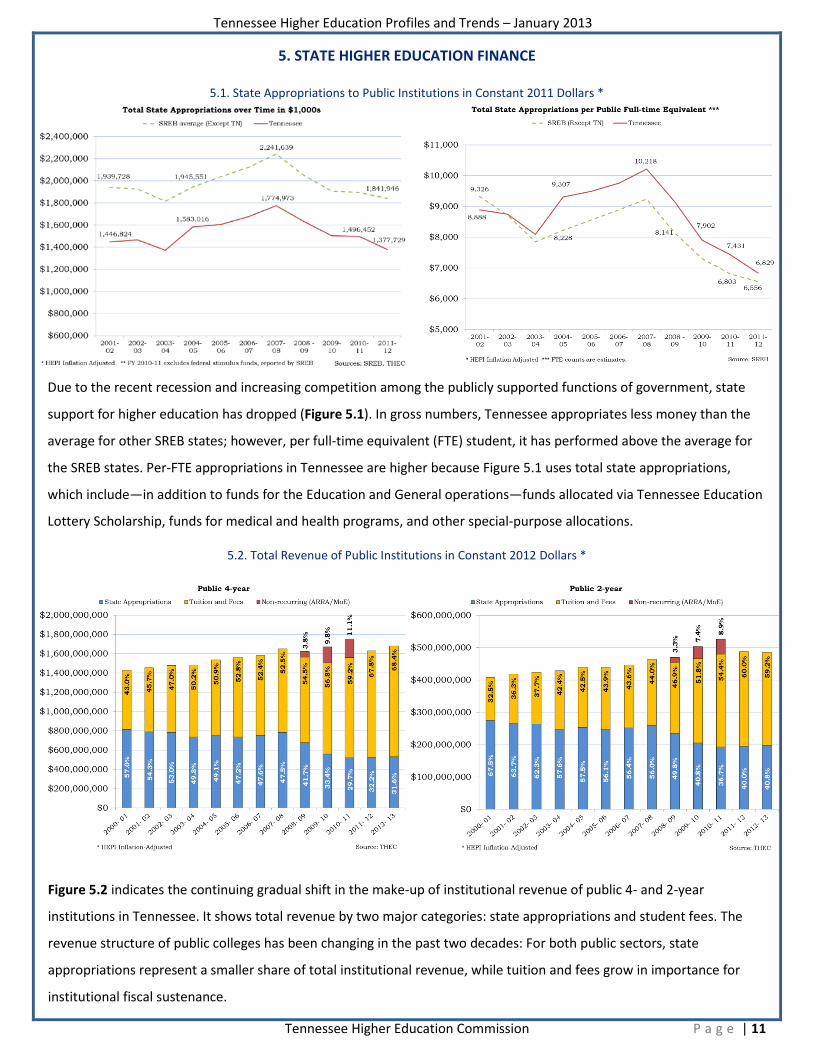
4.4. Six-year Graduation Rate for Tennessee Public Institutions for
2006 Cohort by Gender, Race / Ethnicity, and Pell Eligibility Figure 4.4 shows the six-year graduation rate for the 2006
freshman cohort by the following categories: gender,
race/ethnicity, and Pell eligibility. For every group of
students, graduation at public universities is much higher
than at two-year institutions. Females demonstrate better
performance than males in all institutional types;
Caucasian students have the highest graduation rate,
followed by Hispanic and African-American students. The
graduation rate of Pell-eligible enrollees averages 34.3
percent for all public institutions in the state and is much
lower that the statewide average of 43 percent.
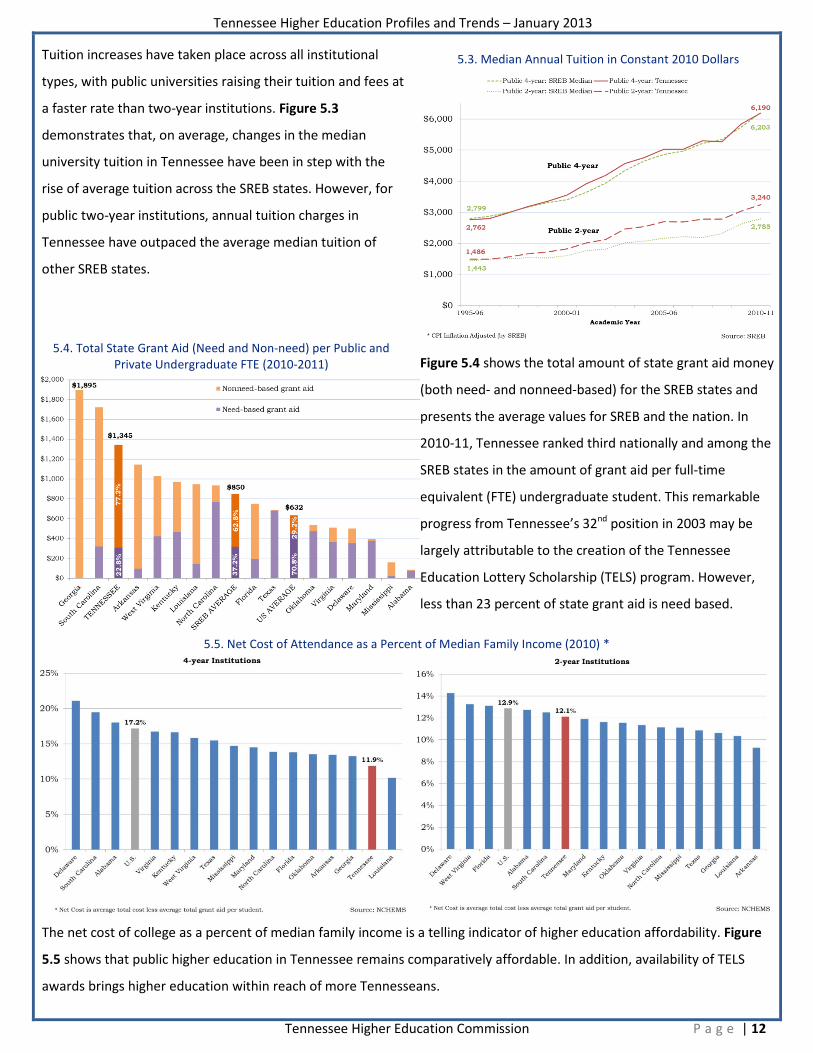
Figure 4.5 demonstrates the percentage distribution of
degrees awarded at public Tennessee institutions in 2011-
12 by select student demographics. The most common
award across all demographic groups is the bachelor’s
degree; the associate’s degree holds the second position.
Although, in absolute numbers, Caucasian students earn
more awards than the other ethnic groups, and females
earn more degrees than males, the percent distribution of
awards within each group differs only slightly. For adult
students, the share of bachelor’s degrees is smaller than
the combined share of certificates and associate’s awards.
4.5. Total Awards by Award Type, Age, Race / Ethnicity, and Pell Eligibility (2011-2012)
Tennessee Higher Education Commission P a g e | 11
Tennessee Higher Education Profiles and Trends – January 2013
5. STATE HIGHER EDUCATION FINANCE
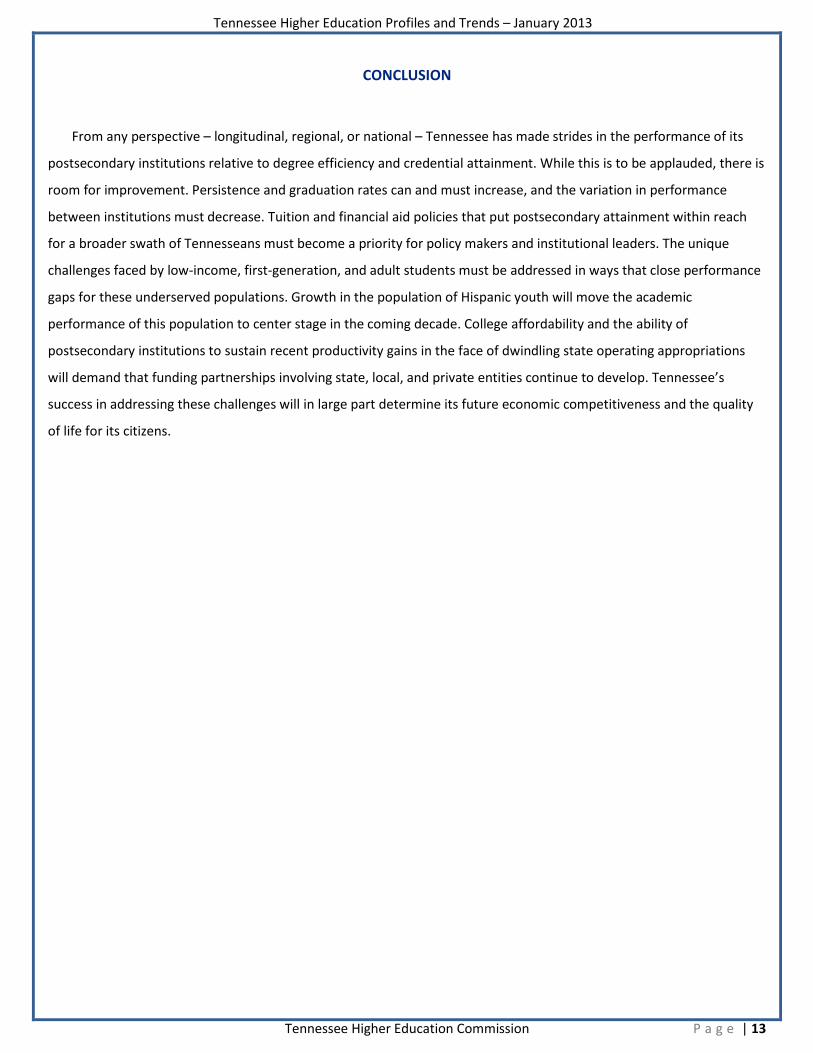
5.1. State Appropriations to Public Institutions in Constant 2011 Dollars *
Due to the recent recession and increasing competition among the publicly supported functions of government, state
support for higher education has dropped (Figure 5.1). In gross numbers, Tennessee appropriates less money than the
average for other SREB states; however, per full-time equivalent (FTE) student, it has performed above the average for
the SREB states. Per-FTE appropriations in Tennessee are higher because Figure 5.1 uses total state appropriations,
which include—in addition to funds for the Education and General operations—funds allocated via Tennessee Education
Lottery Scholarship, funds for medical and health programs, and other special-purpose allocations.
5.2. Total Revenue of Public Institutions in Constant 2012 Dollars *
Figure 5.2 indicates the continuing gradual shift in the make-up of institutional revenue of public 4- and 2-year
institutions in Tennessee. It shows total revenue by two major categories: state appropriations and student fees. The
revenue structure of public colleges has been changing in the past two decades: For both public sectors, state
appropriations represent a smaller share of total institutional revenue, while tuition and fees grow in importance for
institutional fiscal sustenance.
Tennessee Higher Education Commission P a g e | 12
Tennessee Higher Education Profiles and Trends – January 2013
Tuition increases have taken place across all institutional
types, with public universities raising their tuition and fees at
a faster rate than two-year institutions. Figure 5.3
demonstrates that, on average, changes in the median
university tuition in Tennessee have been in step with the
rise of average tuition across the SREB states. However, for
public two-year institutions, annual tuition charges in
Tennessee have outpaced the average median tuition of
other SREB states.
5.3. Median Annual Tuition in Constant 2010 Dollars
5.4. Total State Grant Aid (Need and Non-need) per Public and
Private Undergraduate FTE (2010-2011) Figure 5.4 shows the total amount of state grant aid money
(both need- and nonneed-based) for the SREB states and
presents the average values for SREB and the nation. In
2010-11, Tennessee ranked third nationally and among the
SREB states in the amount of grant aid per full-time
equivalent (FTE) undergraduate student. This remarkable
progress from Tennessee’s 32nd position in 2003 may be
largely attributable to the creation of the Tennessee
Education Lottery Scholarship (TELS) program. However,
less than 23 percent of state grant aid is need based.
5.5. Net Cost of Attendance as a Percent of Median Family Income (2010) *
The net cost of college as a percent of median family income is a telling indicator of higher education affordability. Figure
5.5 shows that public higher education in Tennessee remains comparatively affordable. In addition, availability of TELS
awards brings higher education within reach of more Tennesseans.
Tennessee Higher Education Commission P a g e | 13
Tennessee Higher Education Profiles and Trends – January 2013
CONCLUSION
From any perspective – longitudinal, regional, or national – Tennessee has made strides in the performance of its
postsecondary institutions relative to degree efficiency and credential attainment. While this is to be applauded, there is
room for improvement. Persistence and graduation rates can and must increase, and the variation in performance
between institutions must decrease. Tuition and financial aid policies that put postsecondary attainment within reach
for a broader swath of Tennesseans must become a priority for policy makers and institutional leaders. The unique
challenges faced by low-income, first-generation, and adult students must be addressed in ways that close performance
gaps for these underserved populations. Growth in the population of Hispanic youth will move the academic
performance of this population to center stage in the coming decade. College affordability and the ability of
postsecondary institutions to sustain recent productivity gains in the face of dwindling state operating appropriations
will demand that funding partnerships involving state, local, and private entities continue to develop. Tennessee’s
success in addressing these challenges will in large part determine its future economic competitiveness and the quality
of life for its citizens.