Embed Size (px)
Citation preview
Profiles and cognitive predictors of motor functionsamong early school-age children with mild intellectualdisabilities
Y.-P. Wuang,1 C.-C. Wang,2 M.-H. Huang2 & C.-Y. Su1
1 Department of Occupational Therapy, Kaohsiung Medical University, Kaohsiung,Taiwan2 Department of Physical and Rehabilitation Medicine, Kaohsiung Medical University Chung-Ho Memorial Hospital, Kaohsiung,Taiwan
Abstract
Background The purpose of the study was todescribe sensorimotor profile in children with mildintellectual disability (ID), and to examine the asso-ciation between cognitive and motor function.Methods A total of 233 children with mild ID aged7 to 8 years were evaluated with measures of cogni-tive, motor and sensory integrative functioning.Results Children with mild ID performed signifi-cantly less well on all test measures. 44.2% of chil-dren scored in the impaired range on seven out of22 sensorimotor measures. They had weaker finemotor skills than gross motor skills. Sensory inte-grative functions were only mildly impaired. TotalIQ substantially predicted overall performance oneach motor test. Specifically, verbal comprehensionand processing speed indexes were significant pre-dictors of gross and fine motor function.Conclusions Sensorimotor dysfunctions were foundto be very frequent in children with mild ID. Earlyidentification of sensorimtor impairments is essen-tial to prompt early intervention and facilitate betterintegration into regular school settings.
Keywords cognition, mild intellectual disabilities,school-age children, sensorimotor function
Introduction
In addition to significant limitations in intellectualfunctioning and adaptive behaviour, children withintellectual disabilities (ID) are also characterisedby delay of motor milestones and impairment ofsensorimotor function that affects sensory, neuro-musculoskeletal and motor systems (Hogan et al.2000). For instance, children with Down’s syn-drome often present with hypotonia, sensory inte-grative dysfunction as a result of limited sensoryexperience from poor motor control, motorsequencing deficits, and specific verbal-motor diffi-culties (Charlton et al. 2000; Maraj et al. 2003;Uyanik et al. 2003), whereas Williams syndromeis associated with atypical postures, weakness invisuospatial cognition which has implications fora variety of tasks requiring gross or fine motorcontrol, and visual-motor dysfunctions (Morris &Mervis 1999; Elliott & Bunn 2004). These sensory-motor deficits greatly impede the quality and quan-tity of the child’s participation or performance inactivities in school, at home and in the community(Dolva et al. 2004).
Correspondence: Professor Chwen-Yng Su, Department of Occu-pational Therapy, Kaohsiung Medical University, 100 Shih-Chuan1st Road, Kaohsiung, 807, Taiwan (e-mail: [email protected]).
Journal of Intellectual Disability Research doi: 10.1111/j.1365-2788.2008.01096.x
volume 52 part 12 pp 1048–1060 december 20081048
© 2008 The Authors. Journal Compilation © 2008 Blackwell Publishing Ltd
Previous studies of sensorimotor dysfunction inchildren with ID have mainly focused on specificdiagnoses with moderate, severe or profound ID.Sensorimotor performance in relation to mild ID,unfortunately, has not been properly investigatedand is largely unknown. Children with mild ID isinfrequently recognised before school age and maybegin to demonstrate the need for rehabilitation andspecial education services during early school yearsbecause of minor difficulties with gross and finemotor tasks that interfere with their participation inschool activities, academic performance, indepen-dence in daily living, as well as social acceptance bypeers (Hamilton 2002).These unsuccessful schoolexperiences may further retard social and emotionaldevelopment in these children (Sherrill 1998).There-fore, an in-depth assessment of sensory-motor func-tion is of paramount importance to provide a profileof a child’s strengths and weaknesses in sensorimo-tor development, based upon which an individual-ised therapy programme can be developed tofacilitate his/her integration into school life, andreduce the immediate burden and future expense onthe society (Wuang & Niew 2005).
The second issue that has not been explored indetail is the connection between motor performanceand cognitive functions in children with ID. Discrep-ancies exist regarding whether or not general cogni-tive ability affects motor development. According toPiaget (1966), cognitive development closely relieson the movement capabilities the child has acquired;similarly, motor development depends on intellectualcapabilities. Along this line, von Hofsten (2004,2007) postulated an action approach to motor devel-opment. In his theoretical premises, humans per-ceive and plan movements in terms of actions.Mastery of actions depends on the extent to which achild is able to anticipate what is going to happennext and use that information to guide his/herbehaviour.This so-called ‘prospective control ofactions’ is governed by cognitive and perceptualfunctions. Furthermore, action development paral-lels the development of theory-of-mind, whichallows the child to interpret other people’s actionsand intentions that in turn forms a basis for learningmore sophisticated social behaviour. Several brainregions are involved in action control, including themedial temporal/medial superior temporal cortex,posterior parietal cortex, prefrontal cortex and cer-
ebellum. A considerable number of empirical studieshave lent support to the contribution of general cog-nitive function to movement skills in children with orat risk for developmental disorders, including pre-terms (Seitz et al. 2006), developmental coordina-tion disorder (DCD) (Hamilton 2002), attentiondeficit hyperactivity disorder (ADHD) (Klimkeitet al. 2004), and developmental apraxia of speech(DAS) (Nijland 2002). At the other extreme, arecent study argued against a relation between cog-nitive and motor performance in a mixed group of5- to 6-year-old normal children and those at riskof behaviour problems (Wassenberg et al. 2005).
Apart from incongruity in the relationshipbetween global cognitive ability and overall motorfunction, the link between specific aspects of cogni-tive functioning and motor performance remainselusive in children with ID as well. People with IDshowed specific cognitive deficits on tasks of atten-tion (Simonoff et al. 2007), information processing(Detterman et al. 1992), language (Vicari et al.2000), verbal short-term memory (Brock & Jarrold2005; Van der Molen et al. 2007), visual perception(Di Blasi et al. 2007), and executive function (Roweet al. 2006). Among these cognitive impairments,however, only the relation between visual perceptualdysfunction and motor outcomes has received someattention. In this regard, Van der Molen et al. (2007)found that visual spatial skills significantly correlatedwith visuomotor integration in children and adoles-cents with ID. By contrast, studies on children withdisabilities other than ID have demonstrated signifi-cant association of specific cognitive deficits to dif-ferent aspects of motor ability. Children with DCD,for example, showed deficits of attention disengage-ment that contribute to problems of visuomotorintegration (Wilmut et al. 2007), whereas visualtiming deficit led to difficulty with ball catching (VanWaelvelde et al. 2004). Identification of the areas ofcognitive deficits in reference to compromised motorfunction makes specific recommendations for inter-vention strategies possible.
Towards these ends, the first objective of theresearch was to test the hypothesis that childrenwith mild ID aged 7 and 8 years would score sig-nificantly lower than the normative population onevery sensorimotor measure. To accomplish the firstobjective, standardised instruments that assess dif-ferent subcomponents of sensorimotor function,
1049Journal of Intellectual Disability Research volume 52 part 12 december 2008
Y.-P. Wuang et al. • Relation between cognitive and motor functions
© 2008 The Authors. Journal Compilation © 2008 Blackwell Publishing Ltd
including quantitative and qualitative aspects ofmotor behaviour, graphomotor skills, and sensoryintegration function were selected. The age of 7–8
years was chosen partly because it is not untilaround school age that children with mild IDreceived a formal diagnosis (Rogers 2005), andpartly because adequate motor performance duringthe primary school years (kindergarten throughGrade 3) is a prerequisite for learning (Loose et al.1991). The second objective was to test the hypoth-esis that cognitive function, whether global ordomain-specific, would have a significant impact onchildren’s motor performance, after adjusting forpossible demographic confounders. Positive find-ings, obtained from a mild form of developmentaldisorder as in the case of mild ID without overtgenotype or phenotype, would provide clearer evi-dence that cognitive and motor function are inter-twined with each other in children with disabilities.
Methods
Participants
Inclusion criteria for all participants were: agebetween 7 and 8 years, a diagnosis of mild IDdetermined by the board-certified physicians atlocal designated hospitals, absence of serious emo-tional or behavioural disturbances, and ability tofollow test instructions. Excluded were childrenwho carried coexisting autism, learning disabilities,cerebral palsy, blindness and deafness in an attemptto minimise confounding of data. Also excludedwere children with previous history of neurologicaldisorders such as traumatic brain injury, musculardystrophies and epilepsy.
A total of 266 children meet the study inclusionand exclusion criteria. An attempt was made tocontact parents or primary caregivers of these chil-dren to explain the project and request consent. Ofthese, 233 (142 boys, 91 girls) agreed to participate.Average age of these children was 90.66 months(SD = 4.47), and average IQ was 57.91 (SD = 3.73).
Measures
Bruninks-Oseretsky test of motor proficiency (BOTMP)(Bruininks 1978)
The BOTMP is designed to assess qualitativeaspects of motor function that focus on acquisition
of pattern of movement in children ranging in agefrom 4.5 to 14.5 years of age (Kroes et al. 2004).The test consists of a total score as well as separatemeasures of gross and fine motor skills. Grossmotor (GM) composite is derived from perfor-mance on four subtests covering running speed andagility, balance, bilateral coordination and strength,while fine motor (FM) composite summarises per-formance on three subtests involving responsespeed, visual-motor control, and upper-limb speedand dexterity. A total composite can be obtained bysumming the scores for the two composites and theupper limb coordination subtest. The higher theBOTMP composite scores, the better the motoroutcome. The average age-adjusted standard scoresfor subtests and three composites are 15 (SD = 5)and 50 (SD = 10) respectively. Internal consistencyreliability for the BOTMP subtests ranged from0.38 to 0.92 (Bruininks 1978). The estimates ofinter-rater reliability ranged between 0.63 and 0.97,with a test–retest reliability of 0.80 to 0.94. TheBOTMP showed moderate correlations withother motor performance tests (Croce et al.2001).
Developmental test of visual motor integration (VMI)(Beery 1997)
The VMI is a paper-and pencil task used to assessa child’s graphomotor or handwriting skills thatrequire both visual perception and motor planningabilities. The test involves copying a developmentalsequence of 27 geometric forms. The VMI has twosupplemental subtests: visual perception and motorcoordination. The visual perception task requiresthe child to choose a geometric form identical tothe stimulus form among others that look nearlybut not exactly the same. In the motor coordinationtask, the child has to trace the same 27 geometricforms with a pencil without going outside thedouble-lined paths. Higher scores indicate betterperformance. Published standard scores of the VMIas well as supplemental tests have a mean of 100
and a standard deviation of 15. The VMI demon-strated overall good reliability (Beery 1997). Interms of validity, the VMI correlated highly withchronological age (0.80~0.90), and with other teststhat purport to measure visual-motor integration(Erford & Snyder 2004).
1050Journal of Intellectual Disability Research volume 52 part 12 december 2008
Y.-P. Wuang et al. • Relation between cognitive and motor functions
© 2008 The Authors. Journal Compilation © 2008 Blackwell Publishing Ltd
Peabody developmental motor scales, second edition(PDMS-2) (Folio & Fewell 2000)
The PDMS-2 measures quantitative aspects ofmovement (i.e. developmental level of both GMand FM skills) in children from birth through 6
years 11 months of age. The GM composite of thePDMS-2 is organised into four subtests: reflexes,stationary, locomotion and object manipulation.The FM composite is divided into grasping andvisual-motor integration subtests. The total compos-ite is formed by a combination of the GM and FMsubtests. Each subtest score is expressed as anage-corrected standard score that is scaled to amean of 10 and a standard deviation of 3. Thedevelopmental quotients for the GM, FM, and totalcomposites are derived by summing the subteststandard scores and converting them to a quotientwith a mean of 100 and a standard deviation of 15.Coefficients for inter-rater reliability were high(r > 0.95). In terms of test–retest reliability,Spearman’s rank order correlation coefficients forthe items were r = 0.83 to 0.95 (Folio & Fewell2000).
Test of sensory integration function (TSIF) (Lin 2004)
The TSIF is designed to identify sensory integrativedysfunction in children aged from 3 through 12
years. Sensory integration refers to the neurologicalprocess that organises sensation from one’s ownbody and from the environment and makes it pos-sible to use the body effectively within the environ-ment (Ayres 1972). When the sensory inputs fromvisual, auditory, vestibular, proprioceptive, andtactile systems are not integrated or organisedappropriately in the brain, varying degrees ofproblems in development, information processing,and behaviour may occur. The test consists of 98
items divided into six subtests: postural movement,bilateral integration sequencing, sensory discrimina-tion, sensory searching, attention and activity, andemotional–behavioural reactivity. These subtests aremade up of interactive activities that engagemultiple sensory systems, including vestibular,proprioceptive and tactile systems. Each of theitems is rated on a 5-point Likert scale from1 = never to 5 = always, based on the frequency oftargeted behaviour during the entire observation
period. Higher scores suggest poorer performanceon sensory integration tasks. Subtest standardscores of the TSIF are based on a distributionhaving a mean of 50 and standard deviation of 10.Internal consistency for the overall test demon-strated a Cronbach’s alpha of 0.89, whiletest–retest reliabilities for the TSIF subtest scoresranged between 0.82 and 0.94. The TSIF subtestscores significantly varied as a function of age,sex, and residential location (urban vs. rural)(Lin 2004).
Wechsler intelligence scale for children-third edition(WISC-III) (Wechsler 1991)
The WISC-III is designed for ages 6 years 0 monthsto 16 years 11 months.The test consists of 13 sub-tests split into two scales: verbal and performance.Full scale IQ is a scaled score representing overallability in both verbal and performance subtest mea-sures.The WISC-III also yields four index scores,including verbal comprehension (VCI), perceptualorganisation (POI), freedom from distractibility(FDI) and processing speed (PSI).These indexeswere based on extensive factor analyses and arethought to tap relatively distinct cognitive domains.In short, the VCI is a measure of general verbalskills, such as verbal fluency, ability to understandand use verbal reasoning, and verbal knowledge.ThePOI assesses ability to examine a problem, drawupon visual-motor and visual-spatial skills, organisethoughts, create solutions, and then test them.TheFDI reflects attention, concentration, memory andnumeracy, while the PSI assesses visual memory,planning, psychomotor speed and speed of mentaloperations (Kaufman 1994).The WISC-III generatesthree IQ and four index scores which have a mean of100 and a standard deviation of 15. Psychometricproperties of the WISC-III have been well estab-lished.The Chinese version (Chen 1997) was used inthe study.
Procedure
The study was conducted during 2002–2006 in thepaediatric occupational therapy unit at a university-affiliated medical centre, after approval by its ethicscommittee. Children with mild ID were identifiedfrom relevant educational and clinical sources.
1051Journal of Intellectual Disability Research volume 52 part 12 december 2008
Y.-P. Wuang et al. • Relation between cognitive and motor functions
© 2008 The Authors. Journal Compilation © 2008 Blackwell Publishing Ltd
Thirty-six urban and rural elementary schoolslocated in southern Taiwan participated as educa-tional sources. Clinical sources included the healthdepartment of a metropolitan city, coupled with itssubordinate district health stations, and the depart-ments of rehabilitation medicine and paediatrics aswell as diagnostic and evaluation centres for devel-opmental disabilities at two hospitals in the metro-politan area. Using diagnosis and date of birth, weidentified the children by reviewing medical recordinformation contained within the databases com-piled by the city’s health department and two hos-pitals respectively.
Information on IQ based on the recently admin-istered Chinese version of the WISC-III (Chen1997) and diagnosis was collected from each child’smedical or school file. The TSIF was rated by chil-dren’s homeroom teachers. Six occupational thera-pists with 7 to 12 years of clinical experience inpaediatric rehabilitation administered the BOTMP,PDMS-2, TSIF, and VMI to the children accordingto standardised procedures provided by the appro-priate test manuals. The examiners undertook anintensive 1-day training session led by the principalinvestigator. During training, particular attentionwas drawn to the tests’ explicit nature, administra-tion and scoring. To meet the competency require-ment in test administration, each examinercompleted a case under the supervision of the prin-cipal investigator to ensure correctness and appro-priateness in administering and scoring prior toformal testing. After completing training, a videorecording of the assessment of one child was made.Each of the six therapists viewed the recordingand scored it individually. High levels of inter-raterreliability with all four instruments were reached,with 0.97, 0.94, 0.98 and 0.97 for the BOTMP,PDMS-2, TSIF and VMI respectively. Testing wasconducted on an individual basis in quiet locationsidentified at the child’s respective school or OTunit. Test sessions lasted approximately 2 h, with asuitable number of breaks to minimise the effects offatigue. Children were not paid for their participa-tion in the study.
Data analysis
To facilitate analyses, all raw scores were convertedto standard scores using the publisher-provided
norms. A one-sample z-test was then computed toevaluate whether children with mild ID performeddifferently from age-based normative samplesfor the BOTMP, PDMS-2, TSIF, VMI, andWISC-III. In order to determine the significancelevel of the difference in GM, FM, and totalcomposites between the BOTMP and PDMS-2, apaired-t test was applied. As group mean may hidethe distribution of test scores within a group, theproportion of children whose score on an individualsubtest fell more than 1.5 standard deviationsbelow the normative mean was calculated toestablish the frequency of sensorimotor impairment.In accordance with the widely accepted criteriafor cognitive impairment, the percentage ofchildren whose score on an individual index ofthe WISC-III fell more than 2 standarddeviations below the normative mean wascomputed to assess the frequency of cognitiveimpairment.
The relation between WISC-III total IQ andoverall motor performance (i.e. total scores of theBOTMP, PDMS-2, and VMI) was investigated bylinear regression analyses. This statistical procedurewas again repeated to examine the potentialcontribution of four index scores of the WISC-III toaspects of motor performance (i.e. GM and FMcomposites as well as VMI). To control for possibleconfounding effects of age and gender, allindependent and dependent variables were firstregressed on age and gender, and unstandardisedresiduals were saved. The saved unstandardisedresidual of each variable was then used in thesubsequent regression analyses. The unstandardisedresiduals represent the difference between testscores and what the model predicted based on theadjustments from the covariates. Regression modelscan accommodate dichotomous independentvariables by coding them 0 to indicate absence ofthe attribute and 1 to indicate presence (Gerstman2007). In this context, gender was dummy coded as0 for men and 1 for women. The variance inflationfactor (VIF) was employed to asses whethermulticollinearity was a serious problem for thepredictor variables used in the reported regressionequations. The VIF � 4 would be indicativeof a multicollinearity problem (Garson 2001),but it did not exceed 3 in any of the presentanalyses.
1052Journal of Intellectual Disability Research volume 52 part 12 december 2008
Y.-P. Wuang et al. • Relation between cognitive and motor functions
© 2008 The Authors. Journal Compilation © 2008 Blackwell Publishing Ltd
Results
Profile of cognitive and sensorimotor functions
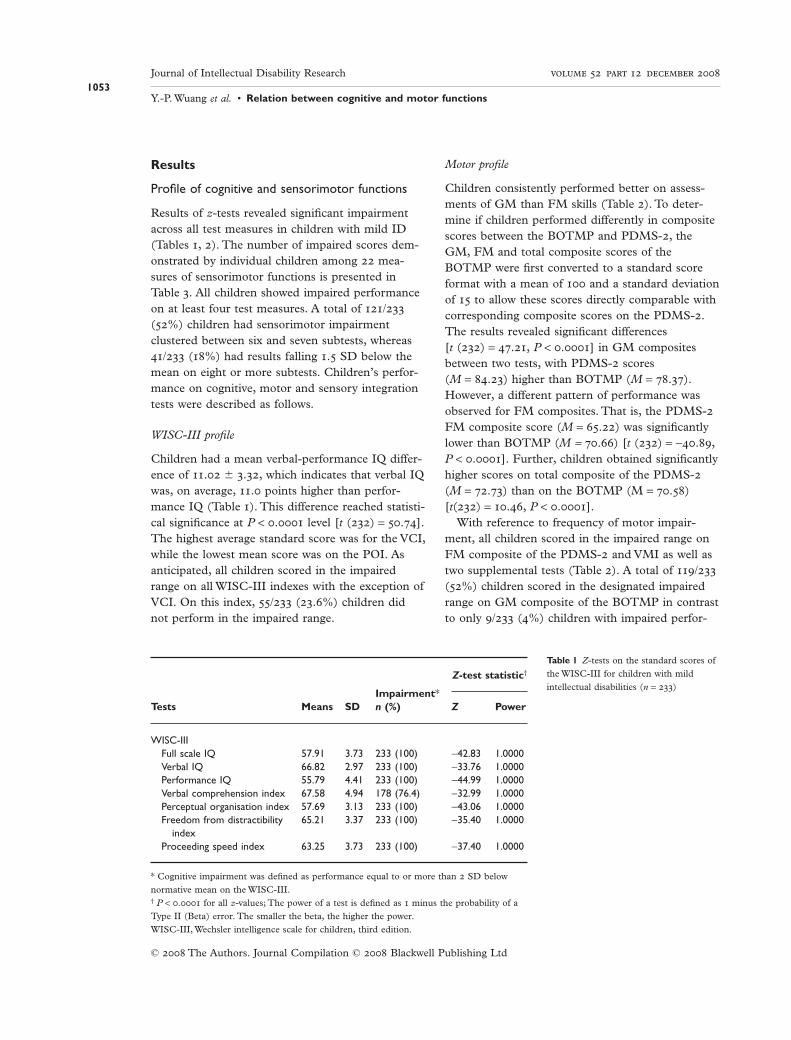
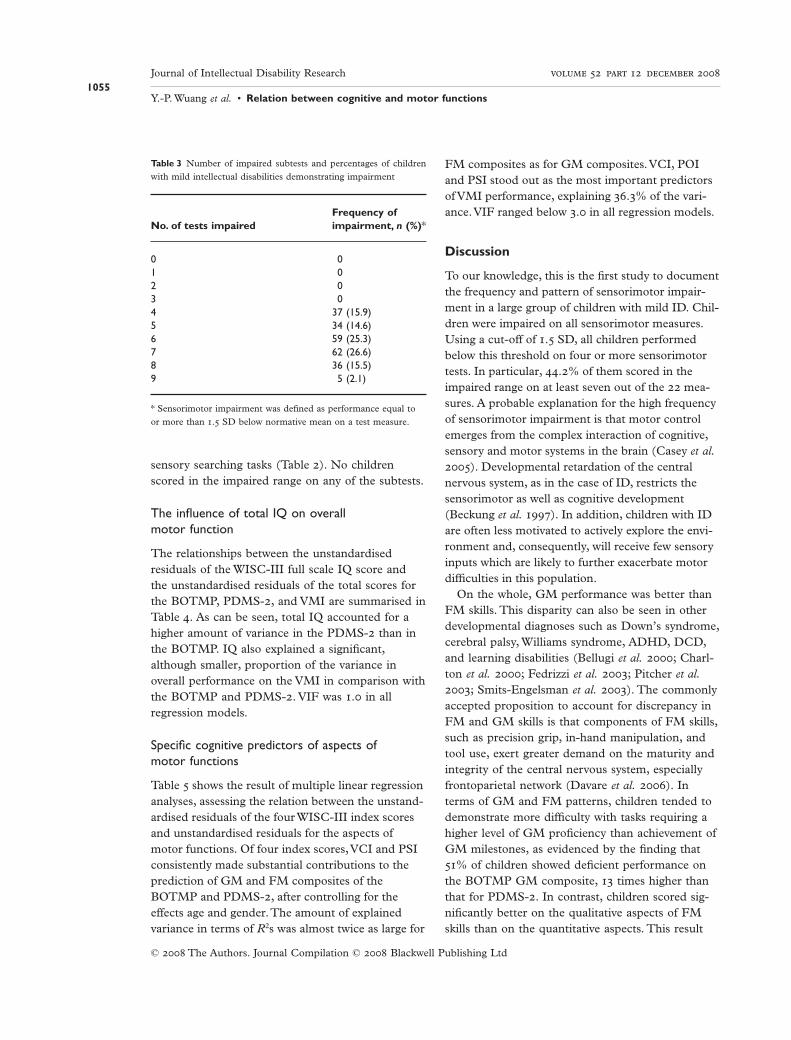
Results of z-tests revealed significant impairmentacross all test measures in children with mild ID(Tables 1, 2). The number of impaired scores dem-onstrated by individual children among 22 mea-sures of sensorimotor functions is presented inTable 3. All children showed impaired performanceon at least four test measures. A total of 121/233
(52%) children had sensorimotor impairmentclustered between six and seven subtests, whereas41/233 (18%) had results falling 1.5 SD below themean on eight or more subtests. Children’s perfor-mance on cognitive, motor and sensory integrationtests were described as follows.
WISC-III profile
Children had a mean verbal-performance IQ differ-ence of 11.02 � 3.32, which indicates that verbal IQwas, on average, 11.0 points higher than perfor-mance IQ (Table 1). This difference reached statisti-cal significance at P < 0.0001 level [t (232) = 50.74].The highest average standard score was for the VCI,while the lowest mean score was on the POI. Asanticipated, all children scored in the impairedrange on all WISC-III indexes with the exception ofVCI. On this index, 55/233 (23.6%) children didnot perform in the impaired range.
Motor profile
Children consistently performed better on assess-ments of GM than FM skills (Table 2). To deter-mine if children performed differently in compositescores between the BOTMP and PDMS-2, theGM, FM and total composite scores of theBOTMP were first converted to a standard scoreformat with a mean of 100 and a standard deviationof 15 to allow these scores directly comparable withcorresponding composite scores on the PDMS-2.The results revealed significant differences[t (232) = 47.21, P < 0.0001] in GM compositesbetween two tests, with PDMS-2 scores(M = 84.23) higher than BOTMP (M = 78.37).However, a different pattern of performance wasobserved for FM composites. That is, the PDMS-2FM composite score (M = 65.22) was significantlylower than BOTMP (M = 70.66) [t (232) = -40.89,P < 0.0001]. Further, children obtained significantlyhigher scores on total composite of the PDMS-2(M = 72.73) than on the BOTMP (M = 70.58)[t(232) = 10.46, P < 0.0001].
With reference to frequency of motor impair-ment, all children scored in the impaired range onFM composite of the PDMS-2 and VMI as well astwo supplemental tests (Table 2). A total of 119/233
(52%) children scored in the designated impairedrange on GM composite of the BOTMP in contrastto only 9/233 (4%) children with impaired perfor-
Table 1 Z-tests on the standard scores ofthe WISC-III for children with mildintellectual disabilities (n = 233)
Tests Means SDImpairment*n (%)
Z-test statistic†
Z Power
WISC-IIIFull scale IQ 57.91 3.73 233 (100) -42.83 1.0000Verbal IQ 66.82 2.97 233 (100) -33.76 1.0000Performance IQ 55.79 4.41 233 (100) -44.99 1.0000Verbal comprehension index 67.58 4.94 178 (76.4) -32.99 1.0000Perceptual organisation index 57.69 3.13 233 (100) -43.06 1.0000Freedom from distractibility
index65.21 3.37 233 (100) -35.40 1.0000
Proceeding speed index 63.25 3.73 233 (100) -37.40 1.0000
* Cognitive impairment was defined as performance equal to or more than 2 SD belownormative mean on the WISC-III.† P < 0.0001 for all z-values; The power of a test is defined as 1 minus the probability of aType II (Beta) error. The smaller the beta, the higher the power.WISC-III, Wechsler intelligence scale for children, third edition.
1053Journal of Intellectual Disability Research volume 52 part 12 december 2008
Y.-P. Wuang et al. • Relation between cognitive and motor functions
© 2008 The Authors. Journal Compilation © 2008 Blackwell Publishing Ltd
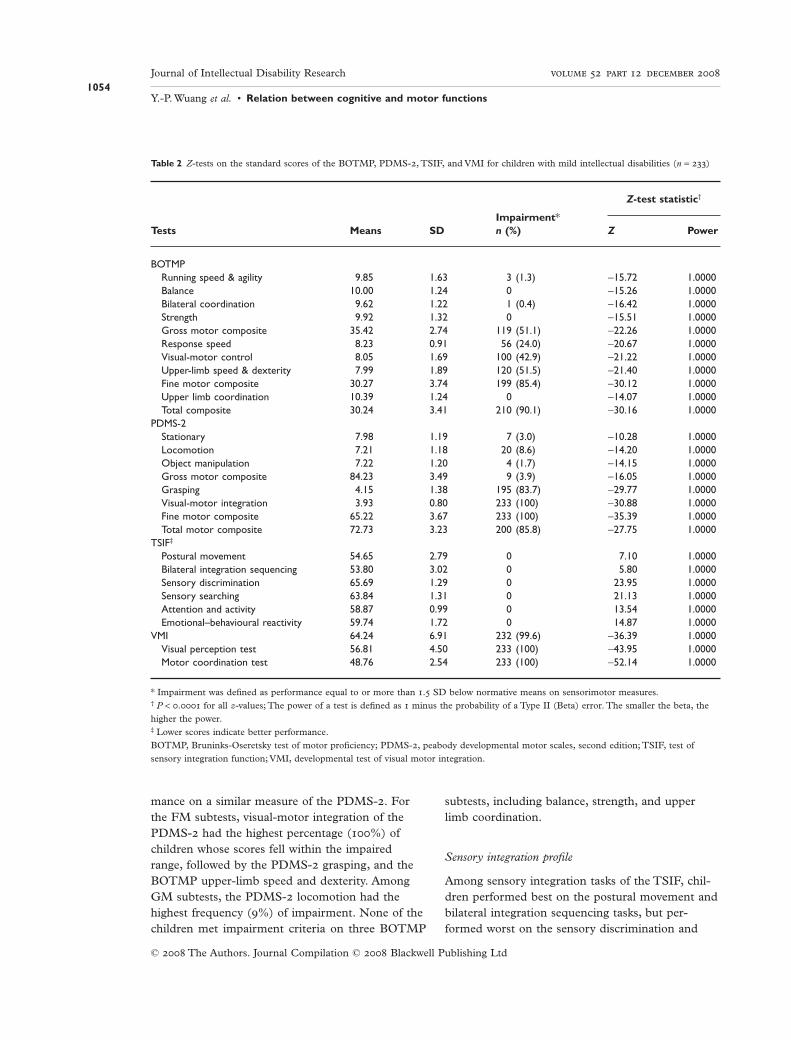
mance on a similar measure of the PDMS-2. Forthe FM subtests, visual-motor integration of thePDMS-2 had the highest percentage (100%) ofchildren whose scores fell within the impairedrange, followed by the PDMS-2 grasping, and theBOTMP upper-limb speed and dexterity. AmongGM subtests, the PDMS-2 locomotion had thehighest frequency (9%) of impairment. None of thechildren met impairment criteria on three BOTMP
subtests, including balance, strength, and upperlimb coordination.
Sensory integration profile
Among sensory integration tasks of the TSIF, chil-dren performed best on the postural movement andbilateral integration sequencing tasks, but per-formed worst on the sensory discrimination and
Table 2 Z-tests on the standard scores of the BOTMP, PDMS-2, TSIF, and VMI for children with mild intellectual disabilities (n = 233)
Tests Means SDImpairment*n (%)
Z-test statistic†
Z Power
BOTMPRunning speed & agility 9.85 1.63 3 (1.3) -15.72 1.0000Balance 10.00 1.24 0 -15.26 1.0000Bilateral coordination 9.62 1.22 1 (0.4) -16.42 1.0000Strength 9.92 1.32 0 -15.51 1.0000Gross motor composite 35.42 2.74 119 (51.1) -22.26 1.0000Response speed 8.23 0.91 56 (24.0) -20.67 1.0000Visual-motor control 8.05 1.69 100 (42.9) -21.22 1.0000Upper-limb speed & dexterity 7.99 1.89 120 (51.5) -21.40 1.0000Fine motor composite 30.27 3.74 199 (85.4) -30.12 1.0000Upper limb coordination 10.39 1.24 0 -14.07 1.0000Total composite 30.24 3.41 210 (90.1) -30.16 1.0000
PDMS-2Stationary 7.98 1.19 7 (3.0) -10.28 1.0000Locomotion 7.21 1.18 20 (8.6) -14.20 1.0000Object manipulation 7.22 1.20 4 (1.7) -14.15 1.0000Gross motor composite 84.23 3.49 9 (3.9) -16.05 1.0000Grasping 4.15 1.38 195 (83.7) -29.77 1.0000Visual-motor integration 3.93 0.80 233 (100) -30.88 1.0000Fine motor composite 65.22 3.67 233 (100) -35.39 1.0000Total motor composite 72.73 3.23 200 (85.8) -27.75 1.0000
TSIF‡
Postural movement 54.65 2.79 0 7.10 1.0000Bilateral integration sequencing 53.80 3.02 0 5.80 1.0000Sensory discrimination 65.69 1.29 0 23.95 1.0000Sensory searching 63.84 1.31 0 21.13 1.0000Attention and activity 58.87 0.99 0 13.54 1.0000Emotional–behavioural reactivity 59.74 1.72 0 14.87 1.0000
VMI 64.24 6.91 232 (99.6) -36.39 1.0000Visual perception test 56.81 4.50 233 (100) -43.95 1.0000Motor coordination test 48.76 2.54 233 (100) -52.14 1.0000
* Impairment was defined as performance equal to or more than 1.5 SD below normative means on sensorimotor measures.† P < 0.0001 for all z-values; The power of a test is defined as 1 minus the probability of a Type II (Beta) error. The smaller the beta, thehigher the power.‡ Lower scores indicate better performance.BOTMP, Bruninks-Oseretsky test of motor proficiency; PDMS-2, peabody developmental motor scales, second edition; TSIF, test ofsensory integration function; VMI, developmental test of visual motor integration.
1054Journal of Intellectual Disability Research volume 52 part 12 december 2008
Y.-P. Wuang et al. • Relation between cognitive and motor functions
© 2008 The Authors. Journal Compilation © 2008 Blackwell Publishing Ltd
sensory searching tasks (Table 2). No childrenscored in the impaired range on any of the subtests.
The influence of total IQ on overallmotor function
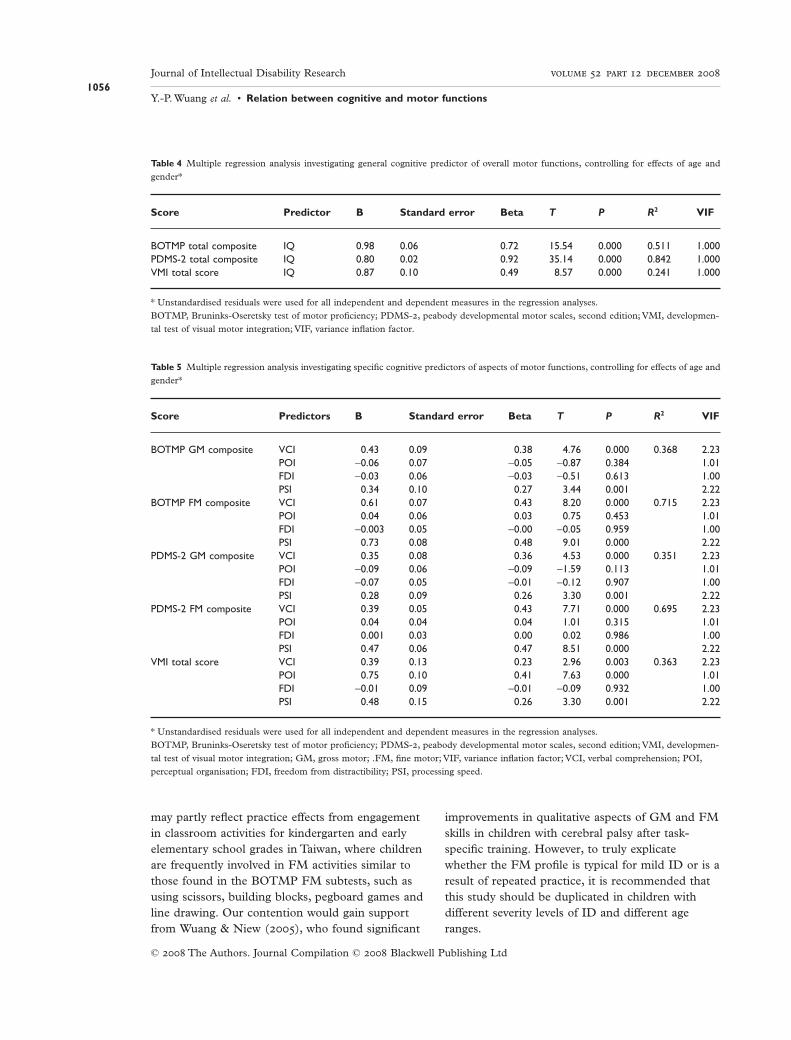
The relationships between the unstandardisedresiduals of the WISC-III full scale IQ score andthe unstandardised residuals of the total scores forthe BOTMP, PDMS-2, and VMI are summarised inTable 4. As can be seen, total IQ accounted for ahigher amount of variance in the PDMS-2 than inthe BOTMP. IQ also explained a significant,although smaller, proportion of the variance inoverall performance on the VMI in comparison withthe BOTMP and PDMS-2. VIF was 1.0 in allregression models.
Specific cognitive predictors of aspects ofmotor functions
Table 5 shows the result of multiple linear regressionanalyses, assessing the relation between the unstand-ardised residuals of the four WISC-III index scoresand unstandardised residuals for the aspects ofmotor functions. Of four index scores,VCI and PSIconsistently made substantial contributions to theprediction of GM and FM composites of theBOTMP and PDMS-2, after controlling for theeffects age and gender.The amount of explainedvariance in terms of R2s was almost twice as large for
FM composites as for GM composites.VCI, POIand PSI stood out as the most important predictorsof VMI performance, explaining 36.3% of the vari-ance.VIF ranged below 3.0 in all regression models.
Discussion
To our knowledge, this is the first study to documentthe frequency and pattern of sensorimotor impair-ment in a large group of children with mild ID. Chil-dren were impaired on all sensorimotor measures.Using a cut-off of 1.5 SD, all children performedbelow this threshold on four or more sensorimotortests. In particular, 44.2% of them scored in theimpaired range on at least seven out of the 22 mea-sures. A probable explanation for the high frequencyof sensorimotor impairment is that motor controlemerges from the complex interaction of cognitive,sensory and motor systems in the brain (Casey et al.2005). Developmental retardation of the centralnervous system, as in the case of ID, restricts thesensorimotor as well as cognitive development(Beckung et al. 1997). In addition, children with IDare often less motivated to actively explore the envi-ronment and, consequently, will receive few sensoryinputs which are likely to further exacerbate motordifficulties in this population.
On the whole, GM performance was better thanFM skills. This disparity can also be seen in otherdevelopmental diagnoses such as Down’s syndrome,cerebral palsy, Williams syndrome, ADHD, DCD,and learning disabilities (Bellugi et al. 2000; Charl-ton et al. 2000; Fedrizzi et al. 2003; Pitcher et al.2003; Smits-Engelsman et al. 2003). The commonlyaccepted proposition to account for discrepancy inFM and GM skills is that components of FM skills,such as precision grip, in-hand manipulation, andtool use, exert greater demand on the maturity andintegrity of the central nervous system, especiallyfrontoparietal network (Davare et al. 2006). Interms of GM and FM patterns, children tended todemonstrate more difficulty with tasks requiring ahigher level of GM proficiency than achievement ofGM milestones, as evidenced by the finding that51% of children showed deficient performance onthe BOTMP GM composite, 13 times higher thanthat for PDMS-2. In contrast, children scored sig-nificantly better on the qualitative aspects of FMskills than on the quantitative aspects. This result
Table 3 Number of impaired subtests and percentages of childrenwith mild intellectual disabilities demonstrating impairment
No. of tests impairedFrequency ofimpairment, n (%)*
0 01 02 03 04 37 (15.9)5 34 (14.6)6 59 (25.3)7 62 (26.6)8 36 (15.5)9 5 (2.1)
* Sensorimotor impairment was defined as performance equal toor more than 1.5 SD below normative mean on a test measure.
1055Journal of Intellectual Disability Research volume 52 part 12 december 2008
Y.-P. Wuang et al. • Relation between cognitive and motor functions
© 2008 The Authors. Journal Compilation © 2008 Blackwell Publishing Ltd
may partly reflect practice effects from engagementin classroom activities for kindergarten and earlyelementary school grades in Taiwan, where childrenare frequently involved in FM activities similar tothose found in the BOTMP FM subtests, such asusing scissors, building blocks, pegboard games andline drawing. Our contention would gain supportfrom Wuang & Niew (2005), who found significant
improvements in qualitative aspects of GM and FMskills in children with cerebral palsy after task-specific training. However, to truly explicatewhether the FM profile is typical for mild ID or is aresult of repeated practice, it is recommended thatthis study should be duplicated in children withdifferent severity levels of ID and different ageranges.
Table 4 Multiple regression analysis investigating general cognitive predictor of overall motor functions, controlling for effects of age andgender*
Score Predictor B Standard error Beta T P R2 VIF
BOTMP total composite IQ 0.98 0.06 0.72 15.54 0.000 0.511 1.000PDMS-2 total composite IQ 0.80 0.02 0.92 35.14 0.000 0.842 1.000VMI total score IQ 0.87 0.10 0.49 8.57 0.000 0.241 1.000
* Unstandardised residuals were used for all independent and dependent measures in the regression analyses.BOTMP, Bruninks-Oseretsky test of motor proficiency; PDMS-2, peabody developmental motor scales, second edition; VMI, developmen-tal test of visual motor integration; VIF, variance inflation factor.
Table 5 Multiple regression analysis investigating specific cognitive predictors of aspects of motor functions, controlling for effects of age andgender*
Score Predictors B Standard error Beta T P R2 VIF
BOTMP GM composite VCI 0.43 0.09 0.38 4.76 0.000 0.368 2.23POI -0.06 0.07 -0.05 -0.87 0.384 1.01FDI -0.03 0.06 -0.03 -0.51 0.613 1.00PSI 0.34 0.10 0.27 3.44 0.001 2.22
BOTMP FM composite VCI 0.61 0.07 0.43 8.20 0.000 0.715 2.23POI 0.04 0.06 0.03 0.75 0.453 1.01FDI -0.003 0.05 -0.00 -0.05 0.959 1.00PSI 0.73 0.08 0.48 9.01 0.000 2.22
PDMS-2 GM composite VCI 0.35 0.08 0.36 4.53 0.000 0.351 2.23POI -0.09 0.06 -0.09 -1.59 0.113 1.01FDI -0.07 0.05 -0.01 -0.12 0.907 1.00PSI 0.28 0.09 0.26 3.30 0.001 2.22
PDMS-2 FM composite VCI 0.39 0.05 0.43 7.71 0.000 0.695 2.23POI 0.04 0.04 0.04 1.01 0.315 1.01FDI 0.001 0.03 0.00 0.02 0.986 1.00PSI 0.47 0.06 0.47 8.51 0.000 2.22
VMI total score VCI 0.39 0.13 0.23 2.96 0.003 0.363 2.23POI 0.75 0.10 0.41 7.63 0.000 1.01FDI -0.01 0.09 -0.01 -0.09 0.932 1.00PSI 0.48 0.15 0.26 3.30 0.001 2.22
* Unstandardised residuals were used for all independent and dependent measures in the regression analyses.BOTMP, Bruninks-Oseretsky test of motor proficiency; PDMS-2, peabody developmental motor scales, second edition; VMI, developmen-tal test of visual motor integration; GM, gross motor; .FM, fine motor; VIF, variance inflation factor; VCI, verbal comprehension; POI,perceptual organisation; FDI, freedom from distractibility; PSI, processing speed.
1056Journal of Intellectual Disability Research volume 52 part 12 december 2008
Y.-P. Wuang et al. • Relation between cognitive and motor functions
© 2008 The Authors. Journal Compilation © 2008 Blackwell Publishing Ltd
In accordance with the literature (Gorman 1997),children with mild ID displayed sensory integrativedysfunction, particularly in the areas of sensory dis-crimination and sensory searching. Impairment insensory discrimination and sensory searching maymanifest themselves as apathetic, less motivated anddisoriented. The sensory processing deficienciesmay contribute to the adaptive behaviour deficits ofthese children and impact on their ability to engagein home, educational and social activities. Forexample, poor sensory discrimination can result ina lack of safety awareness, while sensory searchingproblem may affect their reading and writing abili-ties. Besides, academic failure at school may occurpartly in consequence of poor handwriting skill, asreflected by the impaired performance on the VMI.
Our second hypothesis on the effects of global anddomain-specific cognitive function on motor perfor-mance gained empirical support from the results.Total IQ was a robust predictor of quantitative andqualitative aspects of motor behaviour as well as gra-phomotor skills.This finding is in agreement withthe perspectives of Piaget (1966) and von Hofsten(2004, 2007), but partially contrasts with the find-ings of Wassenberg et al. (2005) who maintained thatgeneral cognitive performance would be more rel-evant in predicting qualitative than quantitativeaspects of movement. Such conflicting data could bereconciled on the ground that the two studies bearon different populations: normal children vs. chil-dren with mild ID. It is possible that the effect of IQon quantitative aspects of motor performance mightnot be apparent in healthy school aged children, butthat the children with mild ID who scored higher onIQ tests might be better able to achieve developmen-tal milestones more easily. Collectively, our resultssuggest that motor performance varied as a functionof child IQ even in the same diagnostic category (i.e.mild ID). Continued research is warranted to repli-cate this study in children with Down’s syndrome todetermine the relationship between varying levels ofID severity and qualitative vs. quantitative aspects ofmotor performance.
Regarding the relation between domain-specificcognitive abilities and aspects of motor functions,regression analysis demonstrated a strong corre-spondence between VCI, PSI, and motor perfor-mance. This is in part congruent with the findingsof Coleman et al. (2001) who found a significant
relationship between poor motor ability and perfor-mance IQ in young children at risk of DCD.However, unlike findings in the present study,several researchers found no significant associationbetween verbal IQ and motor coordination (Pieket al. 2004). It is reasonable to expect significantassociations since VCI, concerning the child’s abilityfor verbal learning, verbal expression, grasp ofverbal concepts and abstract reasoning, reflectsunderlying global neurocognitive function (Chenet al. 2000). In a similar vein, PSI, drawing on twoelementary visual motor processing tasks, refers tothe speed at which cognitive processes can becarried out and is an important element of execu-tive function. Certain aspects of executive function-ing were found to be significant correlates of motorperformance (Piek et al. 2004; Wassenberg et al.2005). The finding that POI and PSI made greatercontributions to the VMI performance than VCI isin conformity with the theoretical and empiricalliterature in that visual motor integration tended tocorrelate moderately with performance IQ and lesswell with verbal IQ (Beery 1997; Bonifacci 2004).
The WISC-III index scores explained a largeramount of variance in FM than GM tasks. Further,VCI contributed more to GM function than PSI,and vice versa for the FM skills. This finding prob-ably relates partly to the administration proceduresfor the motor tests employed in the study. Com-pared with the FM subtests of both BOTMP andPDMS-2, more GM subtests of these two testswere administered with complicated verbal instruc-tions given only to the child and that the task wasconsidered failed when the child was unable tocomprehend the instructions. As a result, VCIability seemed to somewhat bias the GM scores. Toeliminate the confounding effects of poor compre-hension of verbal instructions on interpretation oftest results, the second edition of the BOTMP(Bruninks & Bruninks 2005) provides large, clearpictures of the tasks being completed to helpprovide a better understanding of the test items.The FM tasks, on the other hand, were adminis-tered with verbal instructions as well as demonstra-tion. Consequently, the influence of VCI ability onthese tasks with high demand for motor coordina-tion was overridden by the PSI.
There are four limitations that need to beacknowledged regarding this study.The first con-
1057Journal of Intellectual Disability Research volume 52 part 12 december 2008
Y.-P. Wuang et al. • Relation between cognitive and motor functions
© 2008 The Authors. Journal Compilation © 2008 Blackwell Publishing Ltd
cerns a restricted age range of the sample. Replica-tion with other age groups and other countrieswould increase the clinical utility and confidence inconclusions regarding the typical level of sensorimo-tor performance in this elementary school age popu-lation with mild ID.The second pertains to thelimited scope of content covered by the TSIF. Otherimportant sensory integrative processes such aspraxis and space visualisation are in need of in-depthinvestigation.The third refers to the below-averagecomprehension ability associated with mild ID,which might affect their motor performance in thecontext that test administration procedures allowedverbal instructions only. Clinicians need to exercisecaution when selecting or administering motor testsfor children who have language, cognition or atten-tion problems. Finally, examination of the relation-ship between sensorimotor function, academicperformance, school function, and activities of dailyliving in this population would be beneficial to makeclear in the effect of sensorimotor dysfunction onfunctional outcome and guide efforts to improveperformance in these areas.
Conclusions
Children with mild ID displayed deficits in GM, FMand sensory integration functions. Motor profile wascharacterised by better GM than FM skills. GM per-formance was in favour of quantitative but not quali-tative aspects, while the reverse was true for FMperformance. Among sensory integrative functions,children had major difficulties with sensory discrimi-nation and sensory searching. Strong relations werefound between total IQ and overall motor perfor-mance, and between specific cognitive abilities (VCIand PSI) and GM and FM skills.
In light of the association between cognitive andmotor function, curriculum modification such aschanges in the method of instruction and teachingmaterials, as well as classroom arrangement, shouldbe implemented according to a child’s cognitivestrengths and weaknesses in order to be successfulin the school-wide activities.
ReferencesAyres A. J. (1972) Sensory Integration and Learning Disor-
der. Western Psychological Services, Los Angeles, CA.
Beckung E., Steffenburg U. & Uvebrant P. (1997) Motorand sensory dysfunctions in children with mental retar-dation and epilepsy. Seizure 6, 43–50.
Beery K. E. (1997) Developmental Test ofVisual-MotorIntegration, 4th edn. Western Psychological Services,Los Angeles, CA.
Bellugi U., Lichtenberger L., Jones W., Lai Z. & St.George, M. (2000) The neurocognitive profile of WS: acomplex pattern of strengths and weaknesses. Journal ofCognitive Neuroscience 12, 7–29.
Bonifacci P. (2004) Children with low motor ability havelower visual-motor integration ability but unaffectedperceptual skills. Human Movement Science 23, 157–68.
Brock J. & Jarrold C. (2005) Serial order reconstruction inDown syndrome: evidence for a selective deficit inverbal short-term memory. Journal of Child Psychologyand Psychiatry 46, 304–16.
Bruininks R. H. (1978) Bruininks-Oseretsky Test of MotorProficiency: Examiner’s Manual. American GuidanceService, Circle Pines, MN.
Bruninks R. H. & Bruninks B. D. (2005) Bruninks-Oseretsky Test pf Motor Proficiency, 2nd edn. Pearson,Minneapolis, MN.
Casey B. J., Tottenham N., Liston C. & Durston S. (2005)Imaging the developing brain: what have we learnedabout cognitive development? Trends in Cognitive Science9, 104–10.
Charlton J. L., Ihsen E. & Lavelle B. M. (2000) Controlof manual skills in children with Down syndrome. In:Perceptual Motor Behavior in Down Syndrome (eds D. J.Weeks, R. Chua & D. Elliott), pp. 25–48. Human Kinet-ics, Champaign, IL.
Chen R. H. (1997) Wechsler Intelligence Scale for Children-ChineseVersion, 3rd edn. Chinese Behavioral ScienceCorporation, Taipei.
Chen Y. L., Chen Y. H. & Lieh-Mak F. (2000) Semanticverbal fluency deficit as a familial trait marker in schizo-phrenia. Psychiatric Research 95, 133–48.
Coleman R., Piek J. P. & Livesey D. J. (2001) A longitudi-nal study of motor ability and kinaesthetic acuity inyoung children at risk of developmental coordinationdisorder. Human Movement Science 20, 95–110.
Croce R. V., Horvat M. & McCarthy E. (2001) Reliabilityand concurrent validity of the movement assessmentbattery for children. Perceptual and Motor Skills 93, 275–80.
Davare M., andres M., Cosnard G., Thonnard J. L. &Olivier E. (2006) Dissociating the role of ventral anddorsal premotor cortex in precision grasping. Journal ofNeuroscience 26, 2260–8.
Detterman D. K., Mayer J. D., Caruso D. R., Legree P. J.,Conners F. A. & Taylor R. (1992) Assessment of basiccognitive abilities in relation to cognitive deficits. Ameri-can Journal of Mental Deficiency 97, 251–86.
1058Journal of Intellectual Disability Research volume 52 part 12 december 2008
Y.-P. Wuang et al. • Relation between cognitive and motor functions
© 2008 The Authors. Journal Compilation © 2008 Blackwell Publishing Ltd
Di Blasi F. D., Elia F., Buono S., Ramakers G. J. & DiNuovo S. F. (2007) Relationships between visual-motorand cognitive abilities in intellectual disabilities. Percep-tual and Motor Skills 104, 763–72.
Dolva A. S., Coster W. & Lilja M. (2004) Functional per-formance in children with Down syndrome. AmericanJournal of Occupational Therapy 58, 612–29.
Elliott D. & Bunn L. (2004) Motor disorders in childrenwith intellectual disabilities. In: Developmental Motor Dis-orders: A Neuropsychological Perspective (eds. D. Dewey &D. E. Tupper), p. 145. Guildford, New York, NY.
Erford B. T. & Snyder H. (2004) Reliability and validity ofscores on the Slosson Visual Perceptual Skill Screener.Perceptual and Motor Skills 99, 621–7.
Fedrizzi E., Pagliano E., Andreucci E. & Oleari G. (2003)Hand function in children with hemiplegic cerebralpalsy: prospective follow-up and functional outcome inadolescence. Developmental Medicine and Child Neurology45, 85–91.
Folio M. R. & Fewell R. R. (2000) Peabody DevelopmentalMotor Scales: Examiner’s Manual, 2nd edn. PRO-ED,Austin, TX.
Garson G. D. (2001) Multiple regression, from Statnotes:topics in multivariate analysis. Available at: http://www2.chass.ncsu.edu/garson/pa765/statnote.htm(retrieved 25 October 2007).
Gerstman B. (2007) Continuous outcome, multiple predictors.Available at: http://www.sjsu.edu /faculty/gerstman/EpiInfo/cont-mult.htm (retrieved 25 October 2007).
Gorman P. A. (1997) Sensory dysfunction in dual diagno-sis: mental retardation/mental illness and autism. Occu-pational Therapy in Mental Health 13, 3–22.
Hamilton S. S. (2002) Evaluation of clumsiness in chil-dren. American Family Physician 66, 1435–40.
Hogan D. P., Rogers M. L. & Msall M. E. (2000) Func-tional limitations and key indicators of well-being inchildren with disabilities. Archives of Pediatrics andAdolescent Medicine 154, 1042–8.
Kaufman A. S. (1994) Intelligent Testing with theWISC-III.Wiley, New York.
Klimkeit E. I., Sheppard D. M., Lee P. & Bradshaw J. L.(2004) Bimanual coordination deficits in attentiondeficit/hyperactivity disorder (ADHD). Journal of Clini-cal Experimental Neuropsychology 26, 999–1010.
Kroes M., Vissers Y. L., Sleijpen F. A., Feron F. J., KesselsA. G., Bakker E. et al. (2004) Reliability and validity ofa qualitative and quantitative motor test for 5- to 6-year-old children. European Journal of Pediatric Neurology 8,135–43.
Lin J. K. (2004) Sensory Integration Function Test for Chil-dren: User’s Manual. Psychological Corporation, Taipei.
Loose A., Henderson S. E., Elliman D., Hall D., KnightE. & Jongmas M. (1991) Clumsiness in children: Do
they grow out of it? A 10-year follow-up study. Develop-mental Medicine and Child Neurology 33, 55–68.
Maraj B. K. V., Li L., Hillman R., Johnson J. & Ringen-bach S. D. (2003) Verbal and visual instruction inmotor skill acquisition for persons with and withoutDown syndrome. Adapted Physical Activity Quarterly 20,57–69.
Morris C. A. & Mervis C. B. (1999) Williams syndrome.In: Handbook of Neurodevelopmental and Genetic Disordersin Children (eds S. Goldstein & C. R. Reynolds), pp.555–90. Guilford Press, New York.
Nijland L. (2002) Developmental Apraxia of Speech: Deficitsin Phonetic Planning and Motor Programming. Thesis.Wageningen: Ponsen & Looijen BV.
Piaget J. (1966) The Psychology of Intelligence. Littlefield,Adams, and Company, Totowa, NJ.
Piek J. P., Dyck M. J., Nieman A., Anderson M., Hay D.,Smith L. M. et al. (2004) The relationship betweenmotor coordination, executive functioning and attentionin school aged children. Archives of Clinical Neuropsy-chology 19, 1063–76.
Pitcher T. M., Piek J. P. & Hay D. A. (2003) Fine andgross motor ability in males with ADHD. DevelopmentalMedicine and Child Neurology 45, 525–35.
Rogers S. L. (2005) Common conditions that influencechildren’s participation. In: Occupational Therapy forChildren, 5th edn (ed. J. Case-Smith), pp. 190–1. Mosby,St. Louis, MO.
Rowe J., Lavender A. & Turk V. (2006) Cognitive execu-tive function in Down’s syndrome. British Journal ofClinical Psychology 45, 5–17.
Seitz J., Jenni O. G., Molinari L., Caflisch J., Largo R. H.& Latal Hajnal L. (2006) Correlations between motorperformance and cognitive functions in children born<1250 g at school age. Neuropediatrics 37, 6–12.
Sherrill C. (1998) Activity, healthy lifestyles for all. In:Adapted Physical Activity, Recreation and Sport: Crossdisci-plinary and Lifespan, 5th edn (ed. C. Sherrill), pp. 1–3.WCB/McGraw-Hill, New York, NY.
Simonoff E., Pickles A., Wood N., Gringras P. & Chad-wick O. (2007) ADHD symptoms in children with mildintellectual disability. Journal of the American Academy ofChild and Adolescent Psychiatry 64, 591–600.
Smits-Engelsman B. C., Wilson P. H., Westenberg Y. &Duysens J. (2003) Fine motor deficiencies in childrenwith developmental coordination disorder and learningdisabilities: an underlying open-loop control deficit.Human Movement Science 22, 495–513.
Uyanik M., Bumin G. & Kayihan H. (2003) Comparisonof different therapy approaches in children with Downsyndrome. Pediatrics International 45, 68–73.
Van der Molen M. J., Van Luit J. E., Jongmans M. J. &Van der Molen M. W. (2007) Verbal working memory inchildren with mild intellectual disabilities. Journal ofIntellectual Disability Research 51, 162–9.
1059Journal of Intellectual Disability Research volume 52 part 12 december 2008
Y.-P. Wuang et al. • Relation between cognitive and motor functions
© 2008 The Authors. Journal Compilation © 2008 Blackwell Publishing Ltd
Van Waelvelde H., De Weerdt W., De Cock P. & Smits-Engelsman B. C. (2004) Association between visualperceptual deficits and motor deficits in children withdevelopmental coordination disorder. DevelopmentalMedicine and Child Neurology 46, 661–6.
Vicari S., Caselli M. C. & Tonucci F. (2000) Early lan-guage development in Italian children with Down syn-drome: asynchrony of lexical and morphosyntacticabilities. Neuropsychology 38, 634–44.
Von Hofsten C. (2004) An action perspective on motordevelopment. Trends in Cognitive Science 8, 266–72.
Von Hofsten C. (2007) Action in development. Develop-mental Science 10, 54–60.
Wassenberg R., Feron F. J. & Kessels A. G. (2005) Rela-tion between cognitive and motor performance in 5- to
6-year-old children: results from a large-scale cross-sectional study. Child Development 76, 1092–103.
Wechsler D. (1991) Manual for theWechsler Intelligence Scalefor Children-Third Edition. Psychological Corporation,San Antonio, TX.
Wilmut K., Brown J. H. & Wann J. P. (2007) Attentiondisengagement in children with developmental coordi-nation disorder. Disability and Rehabilitation 29, 47–55.
Wuang Y. P. & Niew W. I. (2005) The effect of adaptedphysical education program on the outcome of school-aged children with cerebral palsy. Bulletin of SpecialEducation and Rehabilitation 14, 217–40.
Accepted 20 May 2008
1060Journal of Intellectual Disability Research volume 52 part 12 december 2008
Y.-P. Wuang et al. • Relation between cognitive and motor functions
© 2008 The Authors. Journal Compilation © 2008 Blackwell Publishing Ltd