Embed Size (px)
Citation preview

Profile Portfolio Solutions
Annual Reportsfor the year ended 30 June 2016
Profile Accumulation Portfolio ARSN 149 248 662Profile Preservation Portfolio ARSN 149 249 052
OneVue RE Services Limited is the Responsible Entity of the Profile Portfolio Solutions,which are registered managed investment schemes, domiciled in Australia. Their registeredoffice and principal place of business is Level 5, 10 Spring Street Sydney, NSW 2000.

Page No.
Directors' Report 1
Auditor's Independence Declaration 4
Statements of Comprehensive Income 5
Statements of Financial Position 6
Statements of Changes in Net Assets Attributable to Unitholders 7
Statements of Cash Flows 8
Notes to the Financial Statements 9
Directors' Declaration 24
Independent Audit Report 25
CONTENTS

Directors’ Report
The Schemes are:
Profile Accumulation PortfolioProfile Preservation Portfolio
Directors
this report are:
Nigel Cameron Stokes Appointed 8 October 2014Brett Marsh Appointed 13 February 2015Lisa Jane McCallum Appointed 16 March 2015 Resigned 23 March 2016Alexander Wise Appointed 23 May 2013 Resigned 23 March 2016Karen Nita Gibson Appointed 23 March 2016Robert Joseph Brown Appointed 23 March 2016
Scheme Information
The registered office of the Responsible Entity is located at Level 5, 10 Spring Street, Sydney, NSW 2000.
decisions and therefore the performance of the Schemes in terms of returns to investors.
Principal Activity
The Schemes are unlisted registered managed investment schemes domiciled in Australia.
Constitutions of the Schemes. There have been no significant changes in the nature of this activity during the year.
Review of Operations
results are affected by the performance of the markets in which the individual Schemes invest.
Results
The performance of each Scheme, as represented by the results of its operations, was as follows:
Year ended30 June 2015
$ $Profile Accumulation Portfolio 2,355,566 10,505,902Profile Preservation Portfolio 632,465 4,547,024
The Directors of OneVue RE Services Limited (ABN 94 101 103 011, AFSL 223271), the Responsible Entity of Profile PortfolioSolutions ("the Schemes") present their report, together with the financial reports of the Schemes, for the year ended 30 June 2016.
The Directors of the Responsible Entity who, unless otherwise stated, have been in office from the beginning of the year and until the date of
Profile Portfolio Solutions are Australian Registered Schemes. OneVue RE Services Limited, the Responsible Entity of the Schemes, is
Profile Financial Services Pty Limited is the Investment Manager for the Schemes and is responsible for the Schemes' investment and divestment
The principal activity of the Schemes during the year was the investment of unitholders' funds in accordance with the provisions of the
The results of the operations of the Schemes are disclosed in the Statements of Comprehensive Income of the financial reports. These
Net profit attributable to unitholders after tax expense and before finance
costs
Year ended30 June 2016
incorporated and domiciled in Australia. Select Asset Management Limited was acquired by OneVue Holdings Limited, an AustralianSecurities Exchange listed company, on 28 August 2014 and changed its name to OneVue RE Services Limited on 18 February 2015.
-1-
Directors’ Report (Continued)
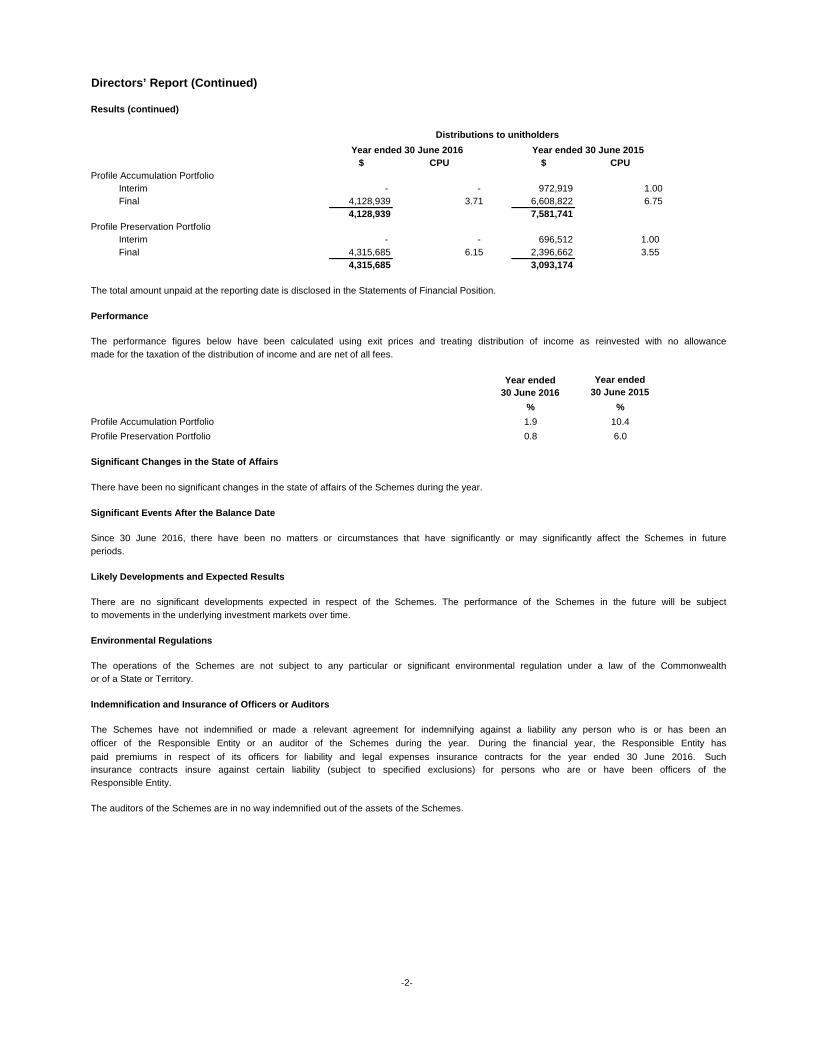
Results (continued)
$ CPU $ CPUProfile Accumulation Portfolio
Interim - - 972,919 1.00Final 4,128,939 3.71 6,608,822 6.75
4,128,939 7,581,741Profile Preservation Portfolio
Interim - - 696,512 1.00 Final 4,315,685 6.15 2,396,662 3.55
4,315,685 3,093,174
The total amount unpaid at the reporting date is disclosed in the Statements of Financial Position.
Performance
made for the taxation of the distribution of income and are net of all fees.
Year ended30 June 2015
%
Profile Accumulation Portfolio 10.4
Profile Preservation Portfolio 6.0
Significant Changes in the State of Affairs
There have been no significant changes in the state of affairs of the Schemes during the year.
Significant Events After the Balance Date
periods.
Likely Developments and Expected Results
to movements in the underlying investment markets over time.
Environmental Regulations
or of a State or Territory.
Indemnification and Insurance of Officers or Audito rs
Responsible Entity.
The auditors of the Schemes are in no way indemnified out of the assets of the Schemes.
The operations of the Schemes are not subject to any particular or significant environmental regulation under a law of the Commonwealth
The Schemes have not indemnified or made a relevant agreement for indemnifying against a liability any person who is or has been an
%
1.9
0.8
Distributions to unitholders
Year ended 30 June 2016
officer of the Responsible Entity or an auditor of the Schemes during the year. During the financial year, the Responsible Entity has
There are no significant developments expected in respect of the Schemes. The performance of the Schemes in the future will be subject
Year ended 30 June 2015
Since 30 June 2016, there have been no matters or circumstances that have significantly or may significantly affect the Schemes in future
paid premiums in respect of its officers for liability and legal expenses insurance contracts for the year ended 30 June 2016. Suchinsurance contracts insure against certain liability (subject to specified exclusions) for persons who are or have been officers of the
Year ended30 June 2016
The performance figures below have been calculated using exit prices and treating distribution of income as reinvested with no allowance
-2-

Directors’ Report (continued)
Relevant Information
Following is a list of relevant information required under the Corporations Act 2001: - Fees paid to the Responsible Entity - Refer to Note 9 to the Financial Statements - Units held by the Responsible Entity - Refer to Note 9 to the Financial Statements - Interest in the Schemes issued during the year - Refer to Note 7 to the Financial Statements - Withdrawals from the Schemes during the year - Refer to Note 7 to the Financial Statements - The number of interests in the Schemes as at 30 June 2016 - Refer to Note 7 to the Financial Statements - The value of the Schemes' assets and basis of valuation - Refer to Statements of Financial Position and Note 1
Auditor's Independence Declaration
A copy of the auditor's independence declaration as required under section 307C of the Corporations Act 2001 is set out on page 4.
Act 2001.
On behalf of the Directors
Brett MarshDirector
Dated this 27th day of September 2016, Sydney
Signed in accordance with a resolution of the Directors of OneVue RE Services Limited made pursuant to section 298(2) of the Corporations
-3-


Statements of Comprehensive IncomeFor the year ended 30 June 2016
2016 2015 2016 2015Note $ $ $ $
Investment IncomeTrust distributions 4,385,202 4,631,349 2,313,168 3,527,113 Interest 653,925 590,280 290,663 482,536 Net foreign exchange gain/(loss) (4,528) (19) 7,263 1,950 Net changes in the fair value of investments (1,739,209) 7,545,996 (1,334,234) 1,747,104 Other income 86,276 91,538 50,322 58,226 Total Investment Income 3,381,666 12,859,144 1,327,182 5,816,929
Expenses Investment management fees 9(b) 890,833 832,702 571,274 603,779 Performance fees 9(b) - 1,322,605 - 523,518 Fixed expense recovery fees 9(b) 123,713 189,531 123,105 137,427 Other expenses 5,893 6,401 338 4,787 Total Expenses 1,020,439 2,351,239 694,717 1,269,511
Net Profit Attributable to Unitholders Before Tax Expense and Finance Costs 2,361,227 10,507,905 632,465 4,547,418
Withholding tax expense 5,661 2,003 - 394
Net Profit Attributable to Unitholders After Tax Expense and Before Finance Costs 2,355,566 10,505,902 632,465 4,547,024
Finance Costs Attributable to UnitholdersDistributions to unitholders 4,128,939 7,581,741 4,315,685 3,093,174
Net Profit/(loss) Attributable to Unitholders Afte r Tax Expense and Finance Costs (1,773,373) 2,924,161 (3,683,220) 1,453,850
Other Comprehensive Income/(Loss) - - - -
(1,773,373) 2,924,161 (3,683,220) 1,453,850 Total Comprehensive Income/(loss) Attributable to Unitholders
Profile Accumulation Portfolio Profile Preservation Portfolio
The above Statements of Comprehensive Income should be read in conjunction with the accompanying notes.
-5-
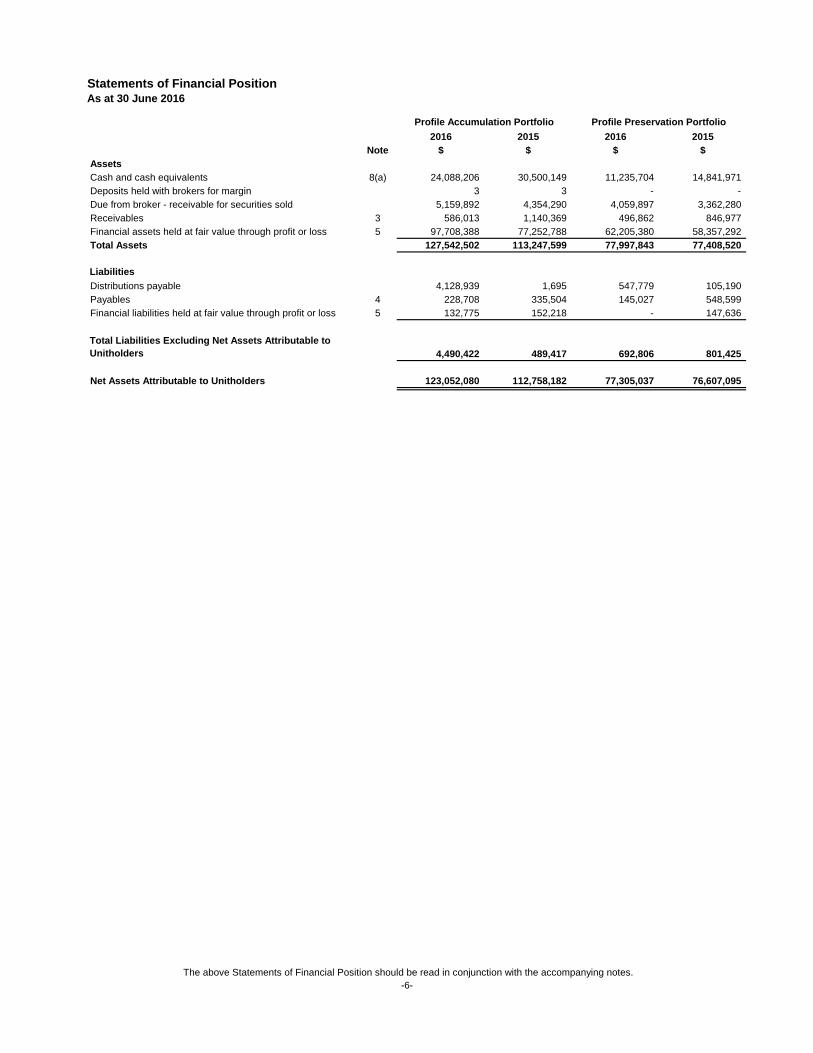
Statements of Financial PositionAs at 30 June 2016
2016 2015 2016 2015Note $ $ $ $
AssetsCash and cash equivalents 8(a) 24,088,206 30,500,149 11,235,704 14,841,971 Deposits held with brokers for margin 3 3 - - Due from broker - receivable for securities sold 5,159,892 4,354,290 4,059,897 3,362,280 Receivables 3 586,013 1,140,369 496,862 846,977 Financial assets held at fair value through profit or loss 5 97,708,388 77,252,788 62,205,380 58,357,292 Total Assets 127,542,502 113,247,599 77,997,843 77,408,520
Liabilities Distributions payable 4,128,939 1,695 547,779 105,190 Payables 4 228,708 335,504 145,027 548,599 Financial liabilities held at fair value through profit or loss 5 132,775 152,218 - 147,636
Total Liabilities Excluding Net Assets Attributabl e to Unitholders 4,490,422 489,417 692,806 801,425
Net Assets Attributable to Unitholders 123,052,080 112,758,182 77,305,037 76,607,095
Profile Accumulation Portfolio Profile Preservation Portfolio
The above Statements of Financial Position should be read in conjunction with the accompanying notes.-6-

Statements of Changes in Net Assets Attributable to UnitholdersFor the year ended 30 June 2016
2016 2015 2016 2015$ $ $ $
Net Assets Attributable to UnitholdersOpening balance 112,758,182 97,750,539 76,607,095 75,740,384 Applications 13,670,147 11,279,893 5,678,033 4,933,738 Reinvested distributions 4,086,239 7,579,795 3,767,906 2,959,544 Redemptions (5,689,115) (6,776,206) (5,064,777) (8,480,421)
124,825,453 109,834,021 80,988,257 75,153,245 (1,773,373) 2,924,161 (3,683,220) 1,453,850
Net Assets Attributable to Unitholders 123,052,080 112,758,182 77,305,037 76,607,095
Total Comprehensive Income/(loss) Attributable to Unitholders
Profile Accumulation Portfolio Profile Preservation Portfolio
The above Statements of Changes in Net Assets Attributable to Unitholders should be read in conjunction with the accompanying notes.
-7-

Statements of Cash FlowsFor the year ended 30 June 2016
2016 2015 2016 2015Note $ $ $ $
Cash Flows from Operating Activities Proceeds from sale of financial instruments held at fair value through profit or loss 5,078,834 19,268,098 16,967,674 21,701,137 Payment for purchases of financial instruments held at fair value through profit or loss (23,282,164) (10,757,443) (20,385,805) (21,592,431)
- (3) - - Trust distributions received 85,643 148,021 4,679 11,916 Interest received 677,649 574,473 303,651 497,625 GST received/(paid) 82,492 (84,780) 36,172 (31,690) Other income received 86,986 89,228 50,322 58,226 Investment management fees paid (885,423) (821,487) (572,194) (601,770) Performance fees paid - (1,348,598) - (542,092) Withholding tax paid (5,661) (2,003) - (394) Fixed expense recovery fees paid (133,591) (186,999) (127,592) (136,974) Other expenses paid (5,893) (6,401) (338) (4,787) Net Cash Inflow/(Outflow) from Operating Activitie s
8(b) (18,301,128) 6,872,106 (3,723,431) (641,234)
Cash Flows from Financing Activities Applications received 13,600,612 11,274,257 5,678,033 4,933,738 Redemptions paid (5,791,443) (6,575,573) (5,462,942) (8,137,421) Distributions paid 4,084,544 (1,893) (105,190) (166,871) Net Cash Inflow/(outflow) from Financing Activitie s
11,893,713 4,696,791 109,901 (3,370,554)
Net increase/(decrease) in cash and cash equivalents held (6,407,415) 11,568,897 (3,613,530) (4,011,788)Cash and cash equivalents at beginning of the financial year 30,500,149 18,931,271 14,841,971 18,851,809 Effect of foreign currency exchange rate changes (4,528) (19) 7,263 1,950
Cash and Cash Equivalents at End of the Financial Year 8(a) 24,088,206 30,500,149 11,235,704 14,841,971
Non-cash financing and operating activities 8(c) 8,902,763 12,200,413 6,377,350 6,399,450
Amounts paid to brokers for margin
Profile Accumulation Portfolio Profile Preservation Portfolio
The above Statements of Cash Flows should be read in conjunction with the accompanying notes.
-8-

Notes to the Financial Statements For the year ended 30 June 2016
1. Summary of significant accounting policies
consistently applied to all years presented, unless otherwise stated in the following text.
(a) Basis of Preparation
liabilities held at fair value through profit or loss, that have been measured at fair value.
amount expected to be recovered or settled within twelve months in relation to these balances cannot be reliably determined.
All amounts are presented in Australian dollars unless otherwise stated.
The Schemes are for-profit entities for the purposes of preparing Financial Statements.
(b) Statement of Compliance
Board.
New standards and interpretations not yet adopted
extent relevant to the Schemes) and interpretations are set out below:
● AASB 9 Financial Instruments (and applicable amendments), (effective from 1 January 2018)
accounting. The Schemes have not yet decided when to adopt AASB 9.
AASB 15 Revenue from Contracts with Customers (and applicable amendments) , (effective from 1 January 2018)
with the new requirements.
or future reporting periods and on foreseeable future transactions.
with customers. The core principle of this standard is that an entity shall recognise revenue to depict the transfer ofpromised goods or services to customers in an amount that reflects the consideration to which the entity expects tobe entitled in exchange for those goods and services. The standard also includes a set of disclosure requirementsthat would result in an entity providing users of financial statements with comprehensive information about the
recognition and measurement of the Schemes’ financial instruments as they are carried at fair value through profit or loss.The derecognition rules have not been changed from the previous requirements, and the Schemes do not apply hedge
There are no other standards that are not yet effective and that are expected to have a material impact on the Schemes in the current
on the Schemes' accounting policies or the amounts recognised in the financial statements as a result of complying
nature, amount, timing and uncertainty of revenue and cash flows arising from the entity's contracts with customers.The Schemes are currently assessing the impact of adopting this standard but do not expect any significant impact
The new standard provides a single, comprehensive principles-based five-step model to be applied to all contracts
AASB 9 Financial Instruments addresses the classification, measurement and derecognition of financial assets andfinancial liabilities. It has now also introduced revised rules around hedge accounting. The standard is not applicable until
months, except for financial assets and liabilities held at fair value through profit or loss and net assets attributable to unitholders. The
The financial statements have been prepared in accordance with the Australian Accounting Standards as issued by the Australian
1 January 2018 but is available for early adoption. The Directors do not expect this to have a significant impact on the
Accounting Standards Board and International Financial Reporting Standards as issued by the International Accounting Standards
Certain new accounting standards and interpretations have been published that are not mandatory for 30 June 2016 reportingperiods and have not been early adopted by the Schemes. The Directors’ assessment of the impact of these new standards (to the
The principal accounting policies applied in the preparation of these financial statements are set out below. These policies have been
The financial reports are general purpose financial reports, which have been prepared in accordance with the requirements of theCorporations Act 2001, Australian Accounting Standards and other authoritative pronouncements of the Australian AccountingStandards Board. The financial reports have also been prepared on a historical cost basis, except for financial assets and financial
The Statements of Financial Position are presented on a liquidity basis. Assets and liabilities are presented in decreasing order ofliquidity and are not distinguished between current and non-current. All balances are expected to be recovered or settled within twelve
-9-
Notes to the Financial Statements For the year ended 30 June 2016
1. Summary of significant accounting policies (Cont inued)
(c) Financial Instruments
(i) Classification
The Schemes classify financial assets and liabilities into the categories below in accordance with AASB 139.
Financial assets and liabilities at fair value thro ugh profit or loss
The category of financial assets and financial liabilities at fair value through profit or loss comprises:
Financial instruments held-for-trading
hedging relationship.
(ii) Recognition/derecognition
discharged.
(iii) Measurement
Financial assets and liabilities at fair value thro ugh profit or loss
value through profit or loss are expensed in the Statements of Comprehensive Income.
presented in the Statements of Comprehensive Income in the period in which they arise.
most representative of fair value.
market participants making the maximum use of market inputs and relying as little as possible on entity-specific inputs.
be made where deemed appropriate to reflect values based on recent actual market transactions.
For further details on how the fair value of financial instruments is determined, please see Note 10 (e).
(iv) Offsetting financial instruments
the liability simultaneously.
The fair value of unlisted managed investment funds and unlisted unit trusts is determined on the basis of the published redemptionprices of those unlisted managed investment funds and unlisted unit trusts at the reporting date. Adjustments to these values may
Financial assets and liabilities are offset and the net amount reported in the Statements of Financial Position when there is a legallyenforceable right to offset the recognised amounts and there is an intention to settle on a net basis, or realise the asset and settle
Schemes use a variety of methods and makes assumptions that are based on market conditions existing at each reporting date.Valuation techniques used include the use of comparable recent arm’s length transactions, reference to other instruments that aresubstantially the same, discounted cash flow analysis, option pricing models and other valuation techniques commonly used by
both financial assets and financial liabilities where the last traded price falls within the bid-ask spread. In circumstances wherethe last traded price is not within the bid-ask spread, management will determine the point within the bid-ask spread that is
The fair value of financial assets and liabilities that are not traded in an active market are determined using valuation techniques. The
In accordance to AASB 13 Fair Value Measurement , the Schemes utilised the last traded market price as fair valuation input for
derecognised when the right to receive cash flows from the financial assets has expired or the Schemes have transferred
At initial recognition, the Schemes measure a financial asset at its fair value. Transaction costs of financial assets carried at fair
substantially all risks and rewards of ownership. Financial liabilities are derecognised when the obligation under the liabilities are
Subsequent to initial recognition, all financial assets and liabilities at fair value through profit or loss are measured at fair value. Gainsand losses arising from changes in the fair value of the ‘financial assets or liabilities at fair value through profit or loss’ category are
The Schemes recognise financial assets and financial liabilities on the date it becomes party to the contractual agreement (tradedate) and recognise changes in fair value of the financial assets or financial liabilities from this date. Financial assets are
These include equity securities, managed investment funds, unit trusts, interest-bearing securities, options and forward foreign exchangecontracts. These financial instruments are acquired or incurred principally for the purpose of generating a profit from short-termfluctuation in price. All derivatives are classified as held for trading. The Schemes do not designate any derivatives as hedges in a
-10-
Notes to the Financial Statements For the year ended 30 June 2016
1. Summary of significant accounting policies (Cont inued)
(d) Foreign Currency Translation
(i) Functional and presentation currency
Schemes compete for funds and is regulated. The Australian dollar is also the Schemes’ presentation currency.
(ii) Transactions and balances
Comprehensive Income.
changes in the market price of securities. Such fluctuations are included with the net changes in the fair value of investments.
of Comprehensive Income on a net basis within net foreign exchange gain/(loss).
(e) Investment Income
measured. The following specific recognition criteria must also be met before income is recognised:
Dividend Income
withholding tax in the Statements of Comprehensive Income.
Trust Distributions Income
Trust distributions are recognised as income on an entitlements basis.
Interest Income
Interest earned on cash and cash equivalents is recognised in the Statements of Comprehensive Income.
amount of the financial instrument.
Net Changes in the Fair Value of Investments
during the year).
(f) Cash and Cash Equivalents
to day management of the Schemes' cash requirements.
For the purpose and presentation in the Statements of Cash Flows, cash and cash equivalents include deposits held at call with abank or financial institution. Cash and cash equivalents also include highly liquid investments with original maturities of three months orless which are readily convertible to cash on hand at the Responsible Entity's option and which the Responsible Entity uses in its day
Income is recognised to the extent that it is probable that the economic benefits will flow to the Schemes and the income can be readily
Interest is recognised for all debt instruments using the effective interest rate method. This is the rate that discounts estimated futurecash receipts through the expected life of the financial instrument, or a shorter period where appropriate, to the net carrying value of the
Changes in the fair value of investments are recognised as income and are determined as the difference between the fair value at year
Items included in the Schemes’ financial statements are measured using the currency of the primary economic environment in whichit operates (the functional currency). This is the Australian dollar, which reflects the currency of the economy in which the
end or consideration received (if sold during the year) and the fair value as at the prior year end or cost (if the investment was acquired
Dividends are recognised as income on the date the share is quoted ex-dividend with any related foreign withholding tax recorded as anexpense. The Schemes currently incur withholding tax imposed by certain countries on investment income. Such income is recorded gross of
Foreign currency transactions are translated into the functional currency using the exchange rates prevailing at the dates of thetransactions. Foreign exchange gains and losses resulting from the settlement of such transactions and from the translations at yearend exchange rates of monetary assets and liabilities denominated in foreign currencies are recognised in the Statements of
The Schemes do not isolate that portion of unrealised gains or losses on securities and derivative financial instruments that aremeasured at fair value through profit or loss and which is due to changes in foreign exchange rates from that which is due to
Non-monetary items that are measured at fair value in a foreign currency are translated using the exchange rates at the date whenfair value was determined. Translation differences on assets and liabilities carried at fair value are reported in the Statements
-11-

Notes to the Financial Statements For the year ended 30 June 2016
1. Summary of significant accounting policies (Cont inued)
(g) Due from and to Broker
(h) Receivables
Responsible Entity consider that the carrying amounts of receivables approximate their fair values.
(i) Payables
carrying period is dictated by market conditions and is generally less than 30 days.
(j) Goods and Services Tax
of Financial Position.
activities which is recoverable from, or payable to, the taxation authority is classified as operating cash flows.
(k) Taxation
Schemes, and the Schemes fully distribute the taxable income.
(l) Distributable Income
at the end of half year. Such distributions are determined by reference to the taxable income of the Schemes.
Distributable income includes capital gains arising from the disposal of assets.
capital gains.
Distributions to unitholders are recognised in the Statements of Comprehensive Income as finance costs.
(m) Use of Estimates
believed to be reasonable under the circumstances.
of the Investment Manager, independent of the area that created them.(for example, pricing models) are used to determine fair values, they are validated and periodically reviewed by experienced personnel
Distributable income does not include unrealised gains and losses on the net value of investments, accrued income not yet assessableexpenses provided for or accrued but not yet deductible and realised capital losses which are retained to offset future realised
The Schemes make estimates and assumptions that affect the reported amounts of assets and liabilities within the next financial year.Estimates are continually evaluated and based on historical experience and other factors, including expectations of future events that are
For the majority of the Schemes’ financial instruments, quoted market prices are readily available. However, certain financial instruments,for example over-the-counter derivatives or unquoted securities, are fair valued using valuation techniques. Where valuation techniques
recoverable from the Australian Tax Office (ATO) as a reduced input tax credit (RITC). Payables and accruals are stated with the amountof GST included. The net amount of GST recoverable/payable from/to the ATO is included as a receivable or payable in the Statements
Cash flows are included in the Statements of Cash Flows on a gross basis. The GST component of cash flows arising from financing
Under current legislation, the Schemes are not subject to income tax provided the unitholders are presently entitled to the income of the
In accordance with the Constitutions, the Schemes fully distribute their distributable income to unitholders. Distributions are payable
to collect all amounts due from the relevant broker. Indicators that the amount due from broker is impaired include significant financialdifficulties of the broker, and the probability that the broker will enter bankruptcy or financial reorganisation and default in payments.
Receivables include amounts where settlement has not yet occurred and are generally received within 30 days of being recorded asreceivables. Receivables are initially recognised at fair value and subsequently at amortised cost less impairment. The Directors of the
Payables are recognised for amounts to be paid in the future for goods and services received, whether or not billed to the Schemes. The
Responsible Entity fees and other expenses incurred by the Schemes are recognised net of the amount of goods and services tax (GST)
Amounts due from and to broker represent receivables for securities sold and payables for securities purchased that have beencontracted for but not yet delivered by year end. Trades are recorded on trade date, and normally settled within three business days.A provision for impairment of amounts due from broker is established when there is objective evidence that the Schemes will not be able
-12-
Notes to the Financial Statements For the year ended 30 June 2016
1. Summary of significant accounting policies (Cont inued)
(m) Use of Estimates (continued)
financial instruments.
For more information on how fair value is calculated, please refer to Note 10 (e) of the financial statements.
Assessment of fund investments as structured entities
funds, or whether the contractual agreement with the fund manager is the dominant factor in controlling these funds.
The Schemes have concluded that the funds in which it invests in are not structured entities.
(n) Unit Exit Prices
Schemes less estimated transaction costs divided by the number of units on issue.
(o) Terms and Conditions of Units on Issue
of units redeemed.
Unitholders have various rights under the Constitutions and the Corporations Act 2001, including the right to: - have their units redeemed; - receive income distributions; - attend and vote at meetings of unitholders; and - participate in the termination and winding up of the Schemes.
The rights, obligations and restrictions attached to each unitholder class are identical in all respects.
(p) Capital Management
discretion of unitholders.
The Responsible Entity monitors the level of weekly and monthly applications and redemptions relative to the liquid assets in the Schemes.
to any externally imposed capital requirements.
due to changes in the value of assets held and because the Schemes are subject to weekly applications and redemptions at the
Models use observable data, to the extent practicable. However, areas such as credit risk (both own and counterparty), volatilities andcorrelations require management to make estimates. Changes in assumptions about these factors could affect the reported fair value of
Unit exit prices are determined in accordance with the Constitutions and are calculated on a forward pricing basis as the net assets of the
In order to maintain or adjust the capital structure, the Responsible Entity may return capital to unitholders. The Schemes are not subject
Each unit confers upon the unitholder an equal interest in the Schemes, and is of equal value. A unit does not confer an interest in anyparticular asset or investment of the Schemes. Applications received for units in the Schemes are recorded net of any entry feespayable prior to the issue of units. Redemptions from the Schemes are recorded gross of any exit fees payable after the cancellation
The Responsible Entity manages its net assets attributable to unitholders as capital, notwithstanding that net assets attributable to
The Schemes have assessed whether the funds in which it invests should be classified as structured entities. The Schemes haveconsidered the voting rights and other similar rights afforded to investors in these funds, including the rights to remove the fundmanager or redeem holdings. The Schemes have concluded on whether these rights are the dominant factor in controlling the
unitholders are classified as a liability. The amount of net assets attributable to unitholders can change significantly on a weekly basis
-13-

Notes to the Financial Statements For the year ended 30 June 2016
2016 2015 2016 2015$ $ $ $
2. Auditor's Remuneration
Amounts paid or payable to Ernst & Young, the auditor of theSchemes for:
Audit of the Financial Statements of the Schemes 13,951 13,545 17,951 13,545 Tax service 8,100 7,300 8,100 7,300
22,051 20,845 26,051 20,845
Auditor's remuneration of the Schemes have been paid by the Investment Manager.
As at30 June 2016
As at30 June 2015
As at30 June 2016
As at30 June 2015
$ $ $ $3. Receivables
Distributions receivable 525,305 972,735 463,063 764,018 Interest receivable 34,423 58,147 17,297 30,285 GST receivable 24,685 107,177 16,502 52,674 Other receivable 1,600 2,310 - -
586,013 1,140,369 496,862 846,977
4. Payables
Investment management fees payable 82,808 77,398 52,597 53,517 Redemptions payable 138,305 240,633 84,835 483,000 Fixed expense recovery fees payable 7,595 17,473 7,595 12,082
228,708 335,504 145,027 548,599
5. Financial Assets and Liabilities Held at Fair Va lue Through Profit or Loss
Financial assets at fair value through profit or l oss Financial instruments held for tradingManaged investment funds Listed managed investment funds 10,809,918 11,658,490 1,679,522 2,285,928 Unlisted managed investment funds 69,175,458 54,794,859 49,227,867 47,062,610
Unit trusts Unlisted unit trusts 11,096,404 10,779,049 4,795,612 8,999,567
Interest-bearing securities Discounted securities 6,028,853 - 6,028,853 -
Derivative financial instruments Forward foreign exchange contracts 597,755 20,390 473,526 9,187 Total financial instruments held for trading 97,708,388 77,252,788 62,205,380 58,357,292
Total financial assets at fair value through profit or loss 97,708,388 77,252,788 62,205,380 58,357,292
Financial liabilities at fair value through profit or loss Financial instruments held for tradingDerivative financial instruments Forward foreign exchange contracts 132,775 152,218 - 147,636 Total financial instruments held for trading 132,775 152,218 - 147,636
Total financial liabilities at fair value through p rofit or loss 132,775 152,218 - 147,636
Profile Accumulation Portfolio
Profile Preservation Portfolio
-14-
Notes to the Financial Statements For the year ended 30 June 2016
6. Offsetting Financial Assets and Financial Liabil ities
the liability simultaneously.
Statements of Financial Position as the Schemes have a currently legally enforceable right to offset recognised amounts.
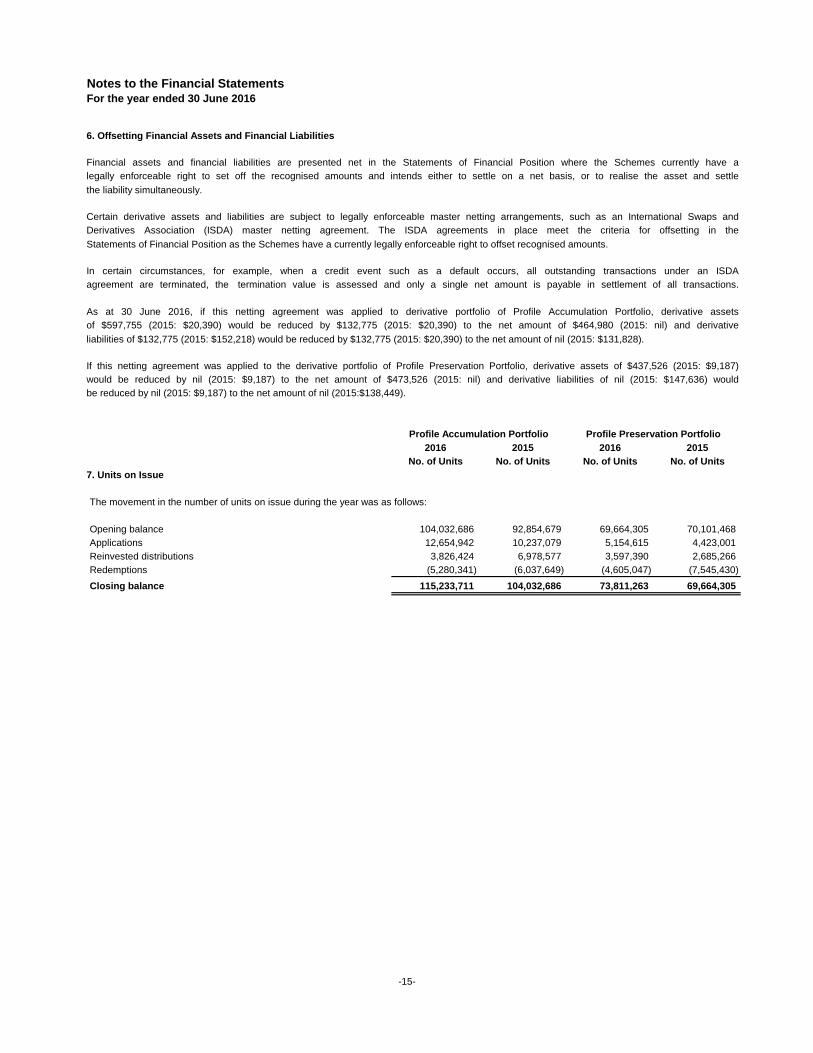
liabilities of $132,775 (2015: $152,218) would be reduced by $132,775 (2015: $20,390) to the net amount of nil (2015: $131,828).
2016 2015 2016 2015No. of Units No. of Units No. of Units No. of Units
7. Units on Issue
The movement in the number of units on issue during the year was as follows:
Opening balance 104,032,686 92,854,679 69,664,305 70,101,468 Applications 12,654,942 10,237,079 5,154,615 4,423,001 Reinvested distributions 3,826,424 6,978,577 3,597,390 2,685,266 Redemptions (5,280,341) (6,037,649) (4,605,047) (7,545,430)
Closing balance 115,233,711 104,032,686 73,811,263 69,664,305
be reduced by nil (2015: $9,187) to the net amount of nil (2015:$138,449).
of $597,755 (2015: $20,390) would be reduced by $132,775 (2015: $20,390) to the net amount of $464,980 (2015: nil) and derivative
If this netting agreement was applied to the derivative portfolio of Profile Preservation Portfolio, derivative assets of $437,526 (2015: $9,187)
Profile Accumulation Portfolio Profile Preservation Portfolio
Financial assets and financial liabilities are presented net in the Statements of Financial Position where the Schemes currently have alegally enforceable right to set off the recognised amounts and intends either to settle on a net basis, or to realise the asset and settle
Certain derivative assets and liabilities are subject to legally enforceable master netting arrangements, such as an International Swaps andDerivatives Association (ISDA) master netting agreement. The ISDA agreements in place meet the criteria for offsetting in the
In certain circumstances, for example, when a credit event such as a default occurs, all outstanding transactions under an ISDA
would be reduced by nil (2015: $9,187) to the net amount of $473,526 (2015: nil) and derivative liabilities of nil (2015: $147,636) would
agreement are terminated, the termination value is assessed and only a single net amount is payable in settlement of all transactions.
As at 30 June 2016, if this netting agreement was applied to derivative portfolio of Profile Accumulation Portfolio, derivative assets
-15-

Notes to the Financial Statements For the year ended 30 June 2016
2016 2015 2016 2015$ $ $ $
8. Cash Flow Information
(a) Reconciliation of Cash and Cash EquivalentsCash and cash equivalents at the end of the year as shownin the Statements of Cash Flows is reconciled to the relateditems in the Statements of Financial Position as follows:
Cash on deposit 24,088,206 30,500,149 11,235,704 14,841,971
24,088,206 30,500,149 11,235,704 14,841,971
(b) Reconciliation of Change in Net Assets Attribut able to Unitholders to Net Cash Inflow/(Outflow) from Operating ActivitiesNet profit attributable to unitholders 2,355,566 10,505,902 632,465 4,547,024 Proceeds from sale of financial instruments held for trading 5,078,834 19,268,098 16,967,674 21,701,137 Payment for purchases of financial instruments held for trading (23,282,164) (10,757,443) (20,385,805) (21,592,431)Net changes in the fair value of investments 1,739,209 (7,545,996) 1,334,234 (1,747,104)Investment income reinvested (4,746,989) (4,614,982) (2,609,444) (3,439,906)Net foreign exchange gain/(loss) 4,528 19 (7,263) (1,950)Net changes in deposits held with brokers - (3) - -
Changes in assets and liabilities: (Increase)/decrease in receivables 554,356 28,757 350,115 (91,892) Increase/(decrease) in payables (4,468) (12,246) (5,407) (16,112)
Net cash inflow/(outflow) from operating activities (18,301,128) 6,872,106 (3,723,431) (641,234)
(c) Non-cash Financing and Operating ActivitiesNon-cash financing and operating activities carried out duringthe year on normal commercial terms and conditions included:
Reinvestment of unitholder distributions 4,086,239 7,579,795 3,767,906 2,959,544 Participation in reinvestment plans 4,746,989 4,614,982 2,609,444 3,439,906 UUT rebate reinvestments 69,535 5,636 - -
8,902,763 12,200,413 6,377,350 6,399,450
Profile Accumulation Portfolio Profile Preservation Portfolio
-16-

Notes to the Financial Statements For the year ended 30 June 2016
9. Related Party Transactions
(a) General Information
The Responsible Entity of the Profile Portfolio Solutions is OneVue RE Services Limited.
(b) Transactions with the Responsible Entity
Details of rebates received and fees expensed during the year are set out below:
2016 2015 2016 2015 2016 2015$ $ $ $ $ $
Profile Accumulation Portfolio 890,833 832,702 - 1,322,605 123,713 189,531 Profile Preservation Portfolio 571,274 603,779 - 523,518 123,105 137,427
2016 2015 2016 2015 2016 2015$ $ $ $ $ $
Profile Accumulation Portfolio 82,808 77,398 - - 7,595 17,473 Profile Preservation Portfolio 52,597 53,517 - - 7,595 12,082
Profile Financial Services Pty Limited.
Bank Bill if invested at the beginning of the month.
intention not to seek reimbursement of these expenses from the Schemes.
(c) Directors and Executive Disclosures
deemed to be the Directors of the Schemes. These individuals and the Responsible Entity comprise the KMP of the Schemes.
this report:
NameNigel Cameron Stokes Appointed 8 October 2014Brett Marsh Appointed 13 February 2015Lisa Jane McCallum Appointed 16 March 2015 Resigned 23 March 2016Alexander Wise Appointed 23 May 2013 Resigned 23 March 2016Karen Nita Gibson Appointed 23 March 2016Robert Joseph Brown Appointed 23 March 2016
related to services they render to the individual Schemes.
higher of a High Water Mark and a Cash Hurdle. The Cash Hurdle is the rate of interest that could have been earned on 30 day Australian
Fixed expense recovery fees expensed
Performance feesexpensed
Investment management fees expensed
directors and any other persons having authority and responsibility for planning, directing and controlling the activities of the entity.
During the year, the Responsible Entity has incurred certain expenses on behalf of the Schemes. It is the Responsible Entity's
AASB 124 "Related Party Disclosures" defines key management personnel (KMP) as including all non-executive directors, executive
for the Profile Portfolios. The Responsible Entity receives a portion of the investment management fee and the performance fee from
The Schemes have no employees, however the non-executive directors and executive directors of the Responsible Entity have been
The following non-executive directors and executive directors of the Responsible Entity held office during the year and until the date of
Remuneration paid to the Responsible Entity is detailed above. No Director of the Responsible Entity was paid any remuneration by theSchemes during the year and their compensation paid by the Responsible Entity or related entities of the Responsible Entity is not
The performance fee on these Schemes is payable monthly at 10.25% including irrecoverable GST on any outperformance above the
In accordance with the Constitutions, the Responsible Entity is entitled to receive fees for the provision of services to the Schemesand to be reimbursed for certain expenditure incurred in the administration of the Schemes.
The investment management fee and the performance fee are charged by Profile Financial Services Pty Limited, the investment manager
Investment management fees payable
Performance feespayable
Fixed expense recovery fees payable
-17-
Notes to the Financial Statements For the year ended 30 June 2016
9. Related Party Transactions (Continued)
(c) Directors and Executive Disclosures (continued)
in 2016 and 2015.
(d) Investments
(i) Related party investments of the Schemes
Responsible Entity for, are set out below:
2016 2015 2016 2015 2016 2015$ $ % % $ $
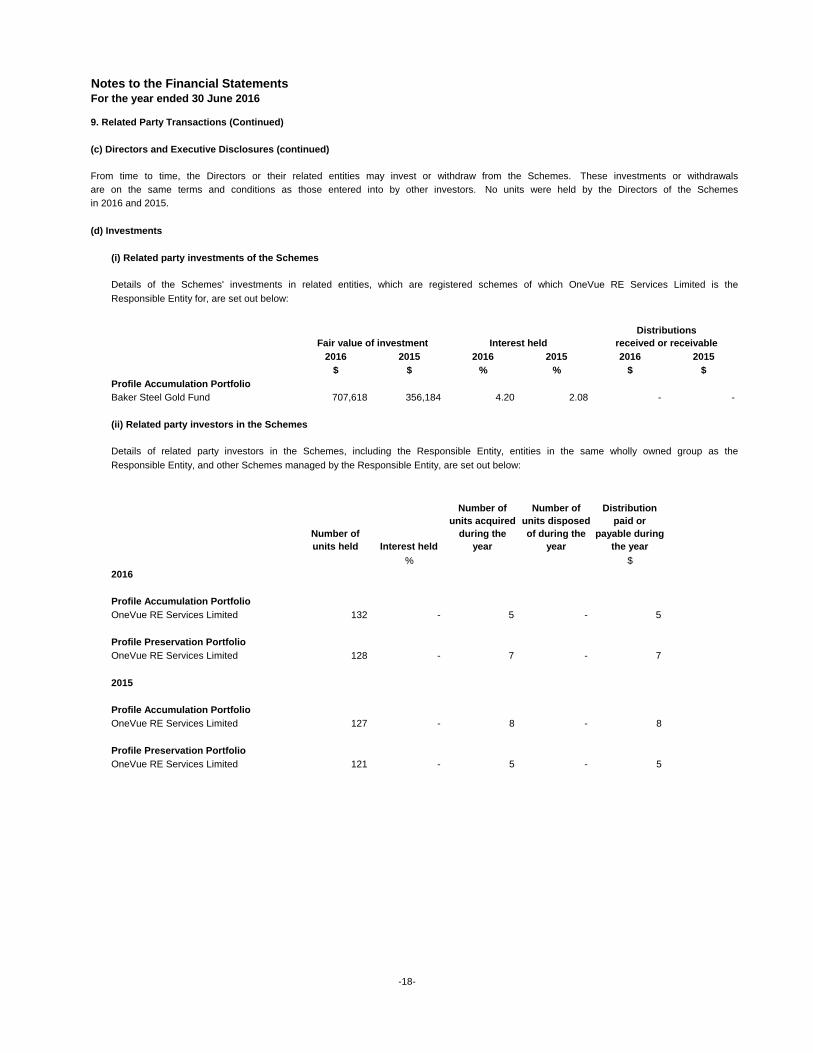
Profile Accumulation PortfolioBaker Steel Gold Fund 707,618 356,184 4.20 2.08 - -
(ii) Related party investors in the Schemes
Responsible Entity, and other Schemes managed by the Responsible Entity, are set out below:
Number of units held Interest held
Number of units acquired
during the year
Number of units disposed of during the
year
Distribution paid or
payable during the year
% $2016
Profile Accumulation PortfolioOneVue RE Services Limited 132 - 5 - 5
Profile Preservation PortfolioOneVue RE Services Limited 128 - 7 - 7
2015
Profile Accumulation PortfolioOneVue RE Services Limited 127 - 8 - 8
Profile Preservation PortfolioOneVue RE Services Limited 121 - 5 - 5
Fair value of investment
Details of related party investors in the Schemes, including the Responsible Entity, entities in the same wholly owned group as the
From time to time, the Directors or their related entities may invest or withdraw from the Schemes. These investments or withdrawals
Details of the Schemes' investments in related entities, which are registered schemes of which OneVue RE Services Limited is the
are on the same terms and conditions as those entered into by other investors. No units were held by the Directors of the Schemes
Distributionsreceived or receivableInterest held
-18-

Notes to the Financial Statements For the year ended 30 June 2016
10. Financial Risk Management Objectives and Polici es
(a) Financial Risk Management Objectives, Policies and Processes
regulatory change.
instruments such as trade debtors and creditors, which arise directly from their operations.
The Responsible Entity is responsible for identifying and controlling the risks that arise from these financial instruments.
level and at underlying investment levels.
The Responsible Entity aims to minimise risks through a number of means as outlined below: - having in place appropriate asset allocation policies which are compatible with each Scheme's objectives; -
potential concentrations of risk and sensitivity to key risk factors; -
managing the risks in relation to their strategy; -
tested annually; and -
buckets.
(b) Credit Risk
obligation.
indirectly through managed investment funds.
Wholesale Funding commencing in 2008.
2016 2015$ $
Profile Accumulation Portfolio 10,014,096 28,789,133 Profile Preservation Portfolio 5,507,753 14,545,924
for National Australia bank was Aa2).
detailed below, of which up to $1,000,000 is guaranteed through the Australian Government Guarantee Scheme for Large Deposits and
In relation to derivative financial instruments, credit risk arises from the potential failure of counterparties to meet their obligations underthe contract or arrangement. The risk associated with these contracts is minimised by undertaking transactions with counterparties onrecognised exchanges, and ensuring where possible that transactions are undertaken with a large number of counterparties. EachScheme's largest counterparty for cash exposure at 30 June 2016 is the AMP Bank Limited (June 2015: National Australia Bank) as
At 30 June 2016, Moody's long-term senior debt rating for AMP Bank Limited is A2 (At 30 June 2015, Moody's long term senior debt rating
brokers. The risk of default is considered minimal, as delivery of securities sold is only made once the broker has received payment.Payment is made on a purchase once the securities have been received by the broker. The trade will fail if either party fails to meet its
The credit risk disclosures have been prepared on the basis of the Schemes' direct investment and not on a look-through basis for investments held
arises from cash and cash equivalents, deposits with banks and other financial institutions and amounts due from broker. None of these
Risks arising from holding financial instruments are inherent in the Schemes and are managed through a process of ongoingidentification, measurement and monitoring. The Schemes are exposed to credit risk, liquidity and cash flow risk, market risk and risk of
Financial instruments of the Schemes comprise investments in financial assets for the purpose of generating a return on the investmentmade by unitholders, in addition to derivatives, cash and cash equivalents, net assets attributable to unitholders, and other financial
The Responsible Entity maintains a comprehensive risk management program at the company operational level, at each individual Scheme
of Financial Position. Credit risk primarily arises from investments in debt securities and from trading derivative products. Other credit risk
diversification and by having limits on the allocations to individual investments, areas/sectors, investment managers and liquidity
applying a rigorous portfolio construction process which includes scenario analysis and stress testing to identify/manage any
completing extensive and ongoing due diligence on the underlying investment and fund managers to ensure they are effectively
implementing systems to produce regular reports with consistency and accuracy, and maintaining a business continuity plan which is
managing specific risks such as individual investment risk, investment style risk, manager risk, liquidity risk and market risk through
credit risk exposure at balance date is the carrying amount of each class of recognised financial asset as indicated in the StatementsCredit risk represents the risk that a counterparty will fail to perform contractual obligations under a contract. The Schemes' maximum
assets are impaired nor past due but not impaired. All transactions in listed securities are settled/paid for upon delivery using approved
-19-
Notes to the Financial Statements For the year ended 30 June 2016
10. Financial Risk Management Objectives and Polici es (Continued)
(c) Liquidity and Cash Flow Risk
liquidity position on a regular basis.
to each Scheme as set out in its respective Product Disclosure Statement.
funds (30 June 2015: nil).
against a fluctuation in market values or to reduce volatility.
(d) Market Risk
investment strategies.
(i) Interest Rate Risk
market interest rates including term deposits.
the reporting date.
% % $ $
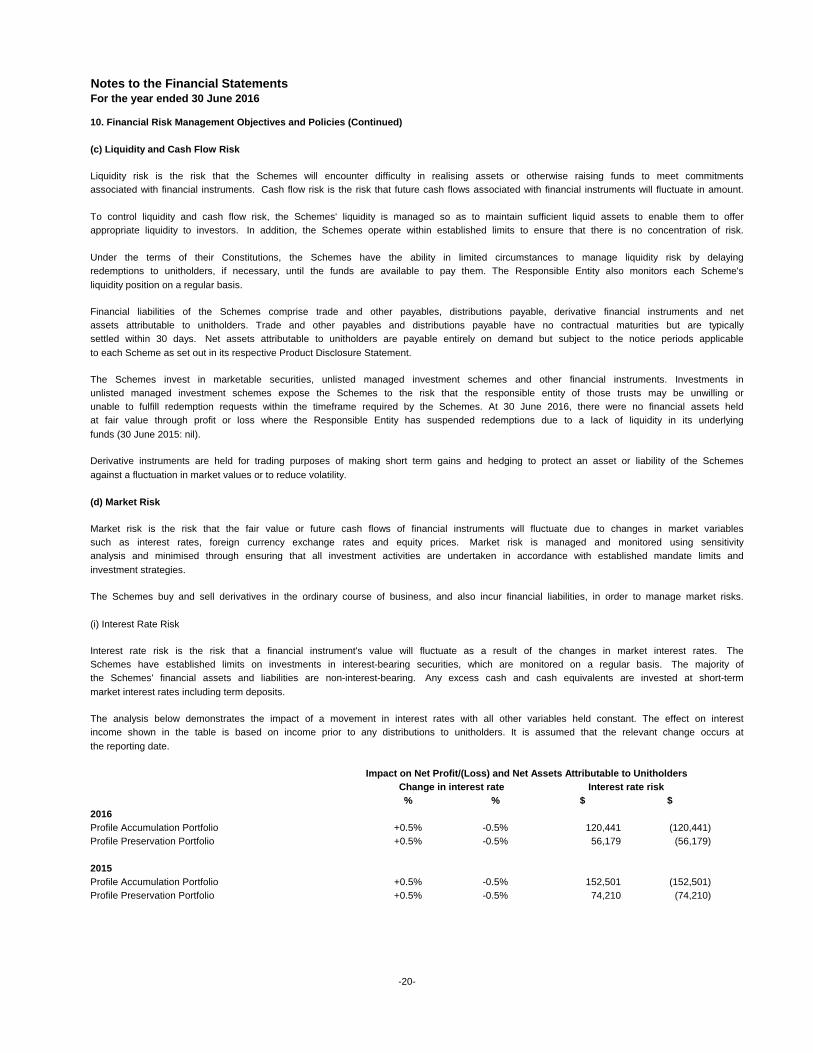
Profile Accumulation Portfolio +0.5% -0.5% 120,441 (120,441)Profile Preservation Portfolio +0.5% -0.5% 56,179 (56,179)
Profile Accumulation Portfolio +0.5% -0.5% 152,501 (152,501)Profile Preservation Portfolio +0.5% -0.5% 74,210 (74,210)
The Schemes invest in marketable securities, unlisted managed investment schemes and other financial instruments. Investments inunlisted managed investment schemes expose the Schemes to the risk that the responsible entity of those trusts may be unwilling orunable to fulfill redemption requests within the timeframe required by the Schemes. At 30 June 2016, there were no financial assets heldat fair value through profit or loss where the Responsible Entity has suspended redemptions due to a lack of liquidity in its underlying
Impact on Net Profit/(Loss) and Net Assets Attribut able to UnitholdersInterest rate risk
Derivative instruments are held for trading purposes of making short term gains and hedging to protect an asset or liability of the Schemes
Market risk is the risk that the fair value or future cash flows of financial instruments will fluctuate due to changes in market variablessuch as interest rates, foreign currency exchange rates and equity prices. Market risk is managed and monitored using sensitivityanalysis and minimised through ensuring that all investment activities are undertaken in accordance with established mandate limits and
The Schemes buy and sell derivatives in the ordinary course of business, and also incur financial liabilities, in order to manage market risks.
income shown in the table is based on income prior to any distributions to unitholders. It is assumed that the relevant change occurs at
the Schemes' financial assets and liabilities are non-interest-bearing. Any excess cash and cash equivalents are invested at short-term
The analysis below demonstrates the impact of a movement in interest rates with all other variables held constant. The effect on interest
Schemes have established limits on investments in interest-bearing securities, which are monitored on a regular basis. The majority of
Change in interest rate
2016
2015
Liquidity risk is the risk that the Schemes will encounter difficulty in realising assets or otherwise raising funds to meet commitmentsassociated with financial instruments. Cash flow risk is the risk that future cash flows associated with financial instruments will fluctuate in amount.
Financial liabilities of the Schemes comprise trade and other payables, distributions payable, derivative financial instruments and netassets attributable to unitholders. Trade and other payables and distributions payable have no contractual maturities but are typicallysettled within 30 days. Net assets attributable to unitholders are payable entirely on demand but subject to the notice periods applicable
Interest rate risk is the risk that a financial instrument's value will fluctuate as a result of the changes in market interest rates. The
To control liquidity and cash flow risk, the Schemes' liquidity is managed so as to maintain sufficient liquid assets to enable them to offerappropriate liquidity to investors. In addition, the Schemes operate within established limits to ensure that there is no concentration of risk.
Under the terms of their Constitutions, the Schemes have the ability in limited circumstances to manage liquidity risk by delayingredemptions to unitholders, if necessary, until the funds are available to pay them. The Responsible Entity also monitors each Scheme's
-20-

Notes to the Financial Statements For the year ended 30 June 2016
10. Financial Risk Management Objectives and Polici es (Continued)
(d) Market Risk (continued)
(ii) Currency Risk
in exchange rates. The risk is measured using sensitivity analysis.
exchange risk sensitivity has not been prepared.
(iii) Equity Price Risk
the Schemes' investment portfolios.
Schemes invests. As a result, historic variations in risk variables are not a definitive indicator of future variations in the risk variables.
-10% 10%$ $
Profile Accumulation Portfolio30 June 2016 (9,108,178) 9,108,17830 June 2015 (7,723,240) 7,723,240
Profile Preservation Portfolio30 June 2016 (5,570,300) 5,570,30030 June 2015 (5,834,811) 5,834,811
(e) Fair Value Measurement
within the hierarchy is based on the lowest level input that is significant to the fair value measurement. The three levels are:
Level 1: Valued by reference to quoted prices in active markets for identical assets or liabilities. These quoted prices represent actual andregularly occurring market transactions on an arms length basis.
Level 2: Valued using inputs other than quoted prices included within level 1 that are observable for the asset or liability, either directly (asprices) or indirectly (derived from prices), including: quoted prices in active markets for similar assets or liabilities, quoted prices in marketsin which there are few transactions for identical or similar assets or liabilities, and other inputs that are not quoted prices but areobservable for the asset or liability.
number of factors, including historical correlation of the Schemes' investments with the relevant benchmark and market volatility.However, actual movements in the risk variables may be greater or less than anticipated due to a number of factors, includingunusually large market shocks resulting from changes in the performance of the economies, markets and securities in which the
Financial instruments carried at fair value are categorised under a three-level hierarchy, reflecting the availability of observable marketinputs when estimating the fair value. If different levels of inputs are used to measure a financial instrument's fair value, the classification
Equity price risk is the risk that the fair value of equities decreases as a result of changes in market prices, whether those changes arecaused by factors specific to the individual stock or factors affecting all instruments in the market. Equity price risk exposure arises from
The following table summarises the sensitivity of the Schemes' operating profit and net assets attributable to unitholders to the variousmarket risks. The analysis is based on the assumption that the markets in which the Schemes investments move by +/-10%. Thereasonably possible movements in the risk variables have been determined based on management's best estimate, having regard to a
Price riskImpact on Net Profit/(Loss) and Net Assets Attribut able to Unitholders
Foreign currency exchange risk arises as the value of monetary securities denominated in other currencies will fluctuate due to changes
As the Schemes have minimal direct exposure to monetary securities denominated in currencies other than the Australian dollar, foreign
-21-
Notes to the Financial Statements For the year ended 30 June 2016
10. Financial Risk Management Objectives and Polici es (Continued)
(e) Fair Value Measurement
the extent that observable inputs are not available.
Hierarchy:
Level 1 Level 2 Level 3 Total$ $ $ $
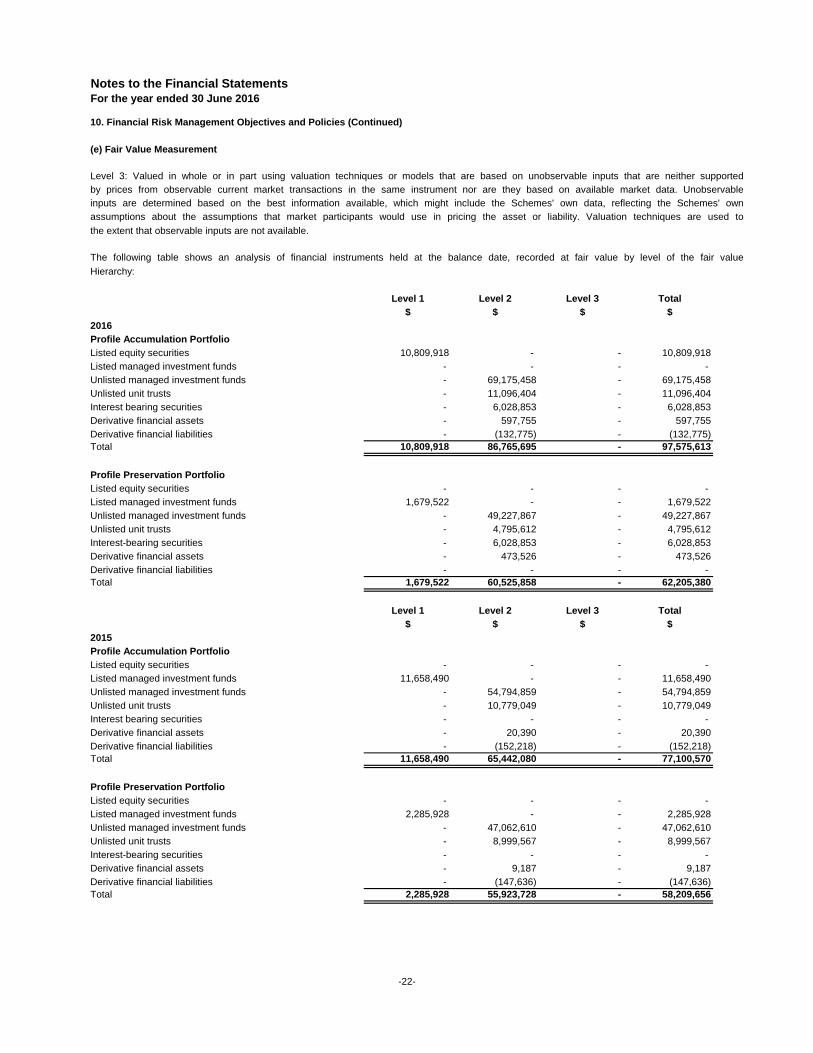
2016Profile Accumulation PortfolioListed equity securities 10,809,918 - - 10,809,918Listed managed investment funds - - - - Unlisted managed investment funds - 69,175,458 - 69,175,458Unlisted unit trusts - 11,096,404 - 11,096,404Interest bearing securities - 6,028,853 - 6,028,853Derivative financial assets - 597,755 - 597,755Derivative financial liabilities - (132,775) - (132,775)Total 10,809,918 86,765,695 - 97,575,613
Profile Preservation PortfolioListed equity securities - - - - Listed managed investment funds 1,679,522 - - 1,679,522Unlisted managed investment funds - 49,227,867 - 49,227,867Unlisted unit trusts - 4,795,612 - 4,795,612Interest-bearing securities - 6,028,853 - 6,028,853Derivative financial assets - 473,526 - 473,526Derivative financial liabilities - - - - Total 1,679,522 60,525,858 - 62,205,380
Level 1 Level 2 Level 3 Total$ $ $ $
2015Profile Accumulation PortfolioListed equity securities - - - - Listed managed investment funds 11,658,490 - - 11,658,490Unlisted managed investment funds - 54,794,859 - 54,794,859Unlisted unit trusts - 10,779,049 - 10,779,049Interest bearing securities - - - - Derivative financial assets - 20,390 - 20,390Derivative financial liabilities - (152,218) - (152,218)Total 11,658,490 65,442,080 - 77,100,570
Profile Preservation PortfolioListed equity securities - - - - Listed managed investment funds 2,285,928 - - 2,285,928Unlisted managed investment funds - 47,062,610 - 47,062,610Unlisted unit trusts - 8,999,567 - 8,999,567Interest-bearing securities - - - - Derivative financial assets - 9,187 - 9,187Derivative financial liabilities - (147,636) - (147,636)Total 2,285,928 55,923,728 - 58,209,656
Level 3: Valued in whole or in part using valuation techniques or models that are based on unobservable inputs that are neither supportedby prices from observable current market transactions in the same instrument nor are they based on available market data. Unobservableinputs are determined based on the best information available, which might include the Schemes' own data, reflecting the Schemes' ownassumptions about the assumptions that market participants would use in pricing the asset or liability. Valuation techniques are used to
The following table shows an analysis of financial instruments held at the balance date, recorded at fair value by level of the fair value
-22-

Notes to the Financial Statements For the year ended 30 June 2016
11. Derivative Financial Instruments
manage financial risks associated with the Schemes' investment transactions, and as a means of effecting a change in the asset mix.
exposure to the market exceeds the underlying value of the Scheme.
amount is an aggregate exposure value of all contracts.
Notional NotionalAssets Liabilities Amount Assets Liabilities Amount
$ $ $ $ $ $ Profile Accumulation Portfolio Forward foreign exchange contracts 597,755 (132,775) 512,055 20,390 (152,218) (82,213)
597,755 (132,775) 512,055 20,390 (152,218) (82,213)
Profile Preservation Portfolio Forward foreign exchange contracts 473,526 - 501,952 9,187 (147,636) (99,142)
473,526 - 501,952 9,187 (147,636) (99,142)
12. Commitments and Contingencies
The Schemes did not have any commitments or contingent liabilities as at 30 June 2016 (30 June 2015: nil).
13. Events Subsequent to Balance Date
affected or may significantly affect the Schemes.
14. Scheme Information
Directors of OneVue RE Services Limited on the 27th day of September 2016.
at Level 5, 10 Spring Street, Sydney, NSW 2000.The Responsible Entity, is incorporated and domiciled in Australia. The registered office of the Responsible Entity is located
2015Fair Value
Since 30 June 2016, there have been no matters or circumstances not otherwise dealt with in the Financial Report that have significantly
Fair Value
A derivative financial instrument is a contract, the price or value of which is derived from the price or value of an underlying asset, liabilityor index. Investments in derivative financial instruments such as futures and options are authorised investments, which may be used to
Investments in derivatives are not used to gear the Schemes' investment portfolios. Gearing a Scheme would occur if the level of
The fair value of derivative financial instruments shown represents the amount of unrealised gains and losses, whereas the notional
2016
The financial report of the Schemes for the year ended 30 June 2016 was authorised for issue in accordance with a resolution of the
-23-

DIRECTORS' DECLARATION
The Directors of OneVue RE Services Limited (the Responsible Entity) declare that for the following Schemes:
Profile Accumulation PortfolioProfile Preservation Portfolio
(a)they become due and payable;
(b)
performance of the Schemes; and
(c) the financial statements and notes also comply with International Financial Reporting Standards as disclosed in Note 1(b).
Corporations Act 2001.
On behalf of the Directors
Brett MarshDirector
Dated this 27th day of September 2016, Sydney
in the Directors' opinion, there are reasonable grounds to believe that the Schemes will be able to pay their debts as and when
in the Directors' opinion, the attached financial statements and notes thereto are in accordance with the Corporations Act 2001,including compliance with the Australian Accounting Standards and giving a true and fair view of the financial position and
Signed in accordance with a resolution of the Directors of OneVue RE Services Limited made pursuant to section 295(5) of the
-24-