Embed Size (px)
Citation preview

ASSOCIATION OF BRAZILIAN BEEF EXPORTERS
Profile of CattleProduction in Brazil

BRASIL ON THE WORLD MARKET, 2008
CATTLE HERD HEAD
ANNUAL SLAUGHTERING
BEEF PRODUCTION YEAR
BEEF EXPORTS
CONSUMPTION PER CAPITA
INDUSTRIAL UNITS
180 Millions
40 Millions
9 Million Tons CWE
2,2 Million Tons CWE
37,2 KG
1500
% MUNDIAL
18%
16%
15%
29%
Safe beef from the farm to the consumer’s table
1 out of every 3 Kg of beef traded worldwide is Brazilian
Source: MDIC, CNPC, USDA

CURRENT LAND USELAND DISTRIBUTION (Millions of hectares)
853Total
Source: CONAB *Crop 2008/09 - Forecast
7,6%Land area used for agriculture
Amazon Rainforest 350 41%
Native and cultivated pastures 220 26%
National reserves 55 6,4%
Annual crops area 48* 5,6%
Permanent cultures 14 1,6%
Cities, lakes, roads, swamps 20 2,4%
Cultivated forests 5 0,6%
Amazon Rainforest 350 41%
Other uses (indian reservations, etc) 51 6%
Available land for agriculture 90 11%

AMAZON
Legal Amazon (5 millions Km2) X Amazon
Forest (3,5 milions Km2)
Cerrado(savana): Agriculture and Cattle
Preservation is National Policy
Cattle created in the Amazon region is for local consumption
Population: 19.676.745 hab.
Area: 5 milions Km2
3,9 hab./Km2
Amazon Forest
“Cerrado”(savanas)
VEGETATION
Fonte: SUDAM

LEGAL AMAZON - CONCEPTS
• The Legal Amazon in its totality to the States of the AC, AP, AM, TM, Pará, RO, RR and TO the e, partially, the Stateof MA, the west of the meridian of 44°WGr (Federal Constitution, Oct – 05; 1988).
• Objectives: Political concept introducedas form of economic management to states and areas with similar characteristics, aiming at the local development (Law n º 1,806, Jan 06th; 1953)
Fonte: SUDAM
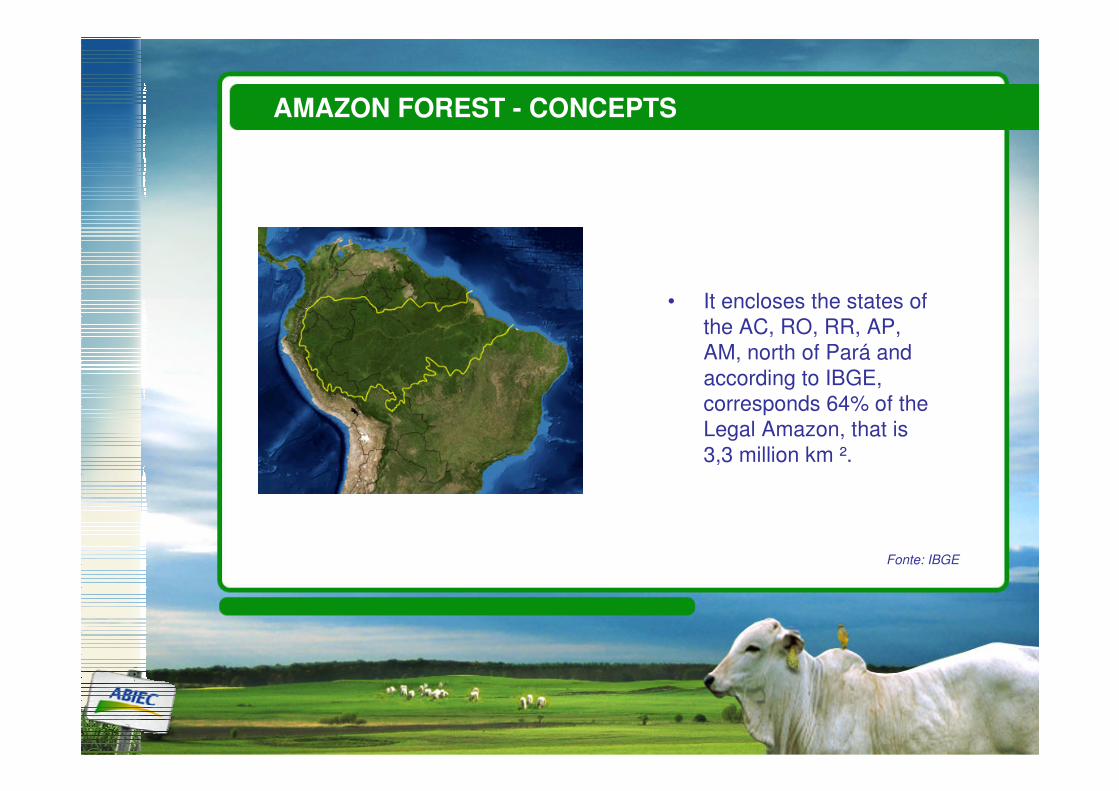
AMAZON FOREST - CONCEPTS
Fonte: IBGE
• It encloses the states of
the AC, RO, RR, AP,
AM, north of Pará and
according to IBGE,
corresponds 64% of the
Legal Amazon, that is
3,3 million km ².


CATTLE DISTRIBUTION (%)
Fonte: IBGE (2007)
States Heads %Mato Grosso 25.683.031 12,9Minas Gerais 22.575.194 11,3Mato Grosso do Sul 21.832.001 10,9Goiás 20.471.490 10,2Pará 15.353.989 7,7
Rio Grande do Sul13.516.426 6,8
São Paulo 11.790.564 5,9Bahia 11.385.723 5,7Rondônia 11.007.613 5,5Paraná 9.494.843 4,8Tocantins 7.395.450 4,9Others 29.245.690 14,6
TOTAL 199.752.014 100,05.5
12.9
10.9
10.2
4.95.7
11.3
5.9
4.8
6.8
7.71.0
1.0
0.2
1.0

STATES WITH CLEARENCES FOR EXPORT:
SOURCE: OIE
FREE ZONE OF FOOT AND MOUTH DISEASE WITHOUT VACCINATION
FREE ZONE OF FOOT AND MOUTH DISEASE WITH VACCINATION
TAMPON ZONE AND HIGH MONITORING ZONE
NOT ELIGIBLE ZONE

CATTLE DISTRIBUTION – LEGAL AMAZON
PA8%
OUTROS64%
RO6%
MT13%
TO4%
MA3%
AP0,05%
AM1%
RR0,24%
AC1%
* States with clereancesfor Export (OIE)
IBGE (2007)

CATTLE SLAGHTER – LEGAL AMAZON versus OIE
* States with clearences for Export
(According OIE)
MAPA/ MDIC (2008)
OUTROS62% RO
7%
MT17%
TO4%
MA2%
PA7%
RR0,24%
AC1%
AM0,25%
In 2008, 15% of Brazilian Fresh Beef Exports volume and Processed Brazilian Beef had been destined for Countries of General List. The States located in the Legal Amazon and clearenced for Exports, accordingOIE are: PA , TO, MT and RO.

BRAZILIAN BEEF EXPORTS – PARÁData 2008
Source:ADEPARÁ, ABIEC, SAGRE e MAPA
1 Member
• Total Exports Slaughterhouses (SIF): 14
• Total of members units (SIF): 4 (28%)
• Total of slaughter in the State (SIF): 1,6 millions of heads
• Total of informal slaughterhouses: 11 with SIM
*According to the ADEPARÁ, the informality of the sector in the State do not allow measure the amount of registered estabelishments in the SIE (Service of StateInspection).
*SIF – Service Of Federal Inspection
*SIM – Service Of Municipal Inspection

BRAZILIAN BEEF EXPORTS - MATO GROSSO Data 2008
Source:INDEA;ABIEC e MAPA
12 members
• Total of Qualified for Exports plant (SIF): 34
• Total of members units: 19 (55%)
• Total of slaughter (SIF): 3,6 milhões de bovinos
• Total of informal slaugtherhouses: 31, between15 with SIE and 16 with SIM.
*According to the INDEA, estimate that about 40% of the state brazilian beef commerce it is proceeding from informal establishments.

BRAZILIAN BEEF PRODUCTION
Source: CNPC
(000) TON Eq. C.
Technological advances + good practical of animal handling
Earnings in productivity and increase in the production
* Estimate
-
1.000
2.000
3.000
4.000
5.000
6.000
7.000
8.000
9.000
10.000
Série1 5.200 5.400 6.045 5.820 6.040 6.270 6.650 6.900 7.300 7.700 8.350 8.776 9.053 9.297 9.011
1994 1995 1996 1997 1998 1999 2000 2001 2002 2003 2004 2005 2006 2007 2008*

BEEF EXPORTS, TON NET
BEEF EXPORTS REPRESENTS 24 % OF PRODUCTION
Source: SECEX/MDIC
2008(Eqc)
Exports: 2,2 millions T
Production: 9,0 millions T
0
200.000
400.000
600.000
800.000
1.000.000
1.200.000
1.400.000
1.600.000
1.800.000
1998 1999 2000 2001 2002 2003 2004 2005 2006 2007 2008
TO
N.L
ÍQ.

EARNINGS IN THE PRODUCTIVITY OF BRAZILIAN CATTLE
Source: IBGE
Cattle X Pasture Evolution
0
20.000.000
40.000.000
60.000.000
80.000.000
100.000.000
120.000.000
140.000.000
160.000.000
180.000.000
1940 1950 1960 1970 1975 1980 1985 1996 2006
(HE
AD
S)
0
20.000.000
40.000.000
60.000.000
80.000.000
100.000.000
120.000.000
140.000.000
160.000.000
180.000.000
200.000.000
(ha)
CATTLE PASTURE (ha)

Brazilian Beef Exports per State
2008
Source: SECEX/MDIC
PA1%
MT13%
Outros Am. Legal
8%
Outros Estados do Brasil
78%
SP, MT, MS, GO e MG – States that are distinguished by aggregate 51,2 % of Cattle and 63% of the Slaugtherhouses of ABIEC’s members – detained
83% of Brazilian Beef Exports.

POSITIVE ACTIONS OF ABIEC’S MEMBERS - SUSTAINABILITY
•Cattle purchase: supplier’s selection from List of the IBAMA –
Brazilian Institute of the Environment and the Renewable Natural
Resources and a List from the Ministry of the Labor and
Employment (MTE);
• Partnership with local city halls;
• Active participation in the social – environmental projects, leaded
by ONG (The Nature Conservancy; WWF; Imazon; Alliance of the
Land) and by Governmental Institutions (Land Institute and State’s
Environment Secretariats);

ABIEC
THANK YOU!
www.abiec.com.br
Otávio H. Cançado