Embed Size (px)
Citation preview
MAKING ONLINE SECURITY RISKS
TANGIBLEProfessor Sadie Creese
Professor Koen Lamberts
Nick PapanikolaouResearch Fellow
International Digital LaboratoryUniversity of Warwick
http://digital.warwick.ac.uk/E-Security/
INTRODUCTION This work is the product of a collaboration between
The International Digital Laboratory, University of Warwick
The Department of Psychology, University of Warwick Computer scientists are keen to take advantage of
what is known about human perception of risks ...so as to reduce online fraud and damage to computer
users’ data; ...so as to enforce security policies in a user-friendly
way. Cognitive science has much to offer in this regard,
since much is known about how information can be communicated effectively to users, taking into account the structure of the brain
The central issue is how risk can be communicated effectively to users of computer systems
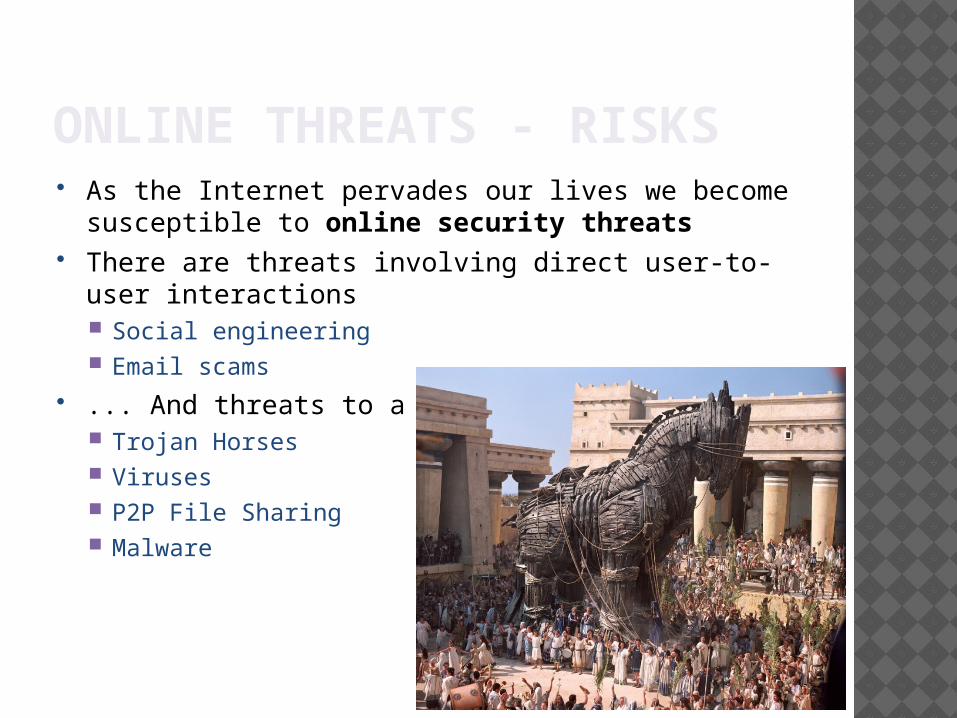
ONLINE THREATS - RISKS As the Internet pervades our lives we become
susceptible to online security threats There are threats involving direct user-to-user
interactions Social engineering Email scams
... And threats to a user’s data Trojan Horses Viruses P2P File Sharing Malware
ONLINE THREATS - RISKS Online security is of concern to everyone In its infancy the Internet was the province of a
handful of specialists, who were usually well versed in IT security ... so potential risks were understood reasonably well
The vast majority of Internet users today does not have even a basic understanding of online threats
Dangers / Potential Costs Loss of data Theft of data Unauthorised access
[ Statistics? ]
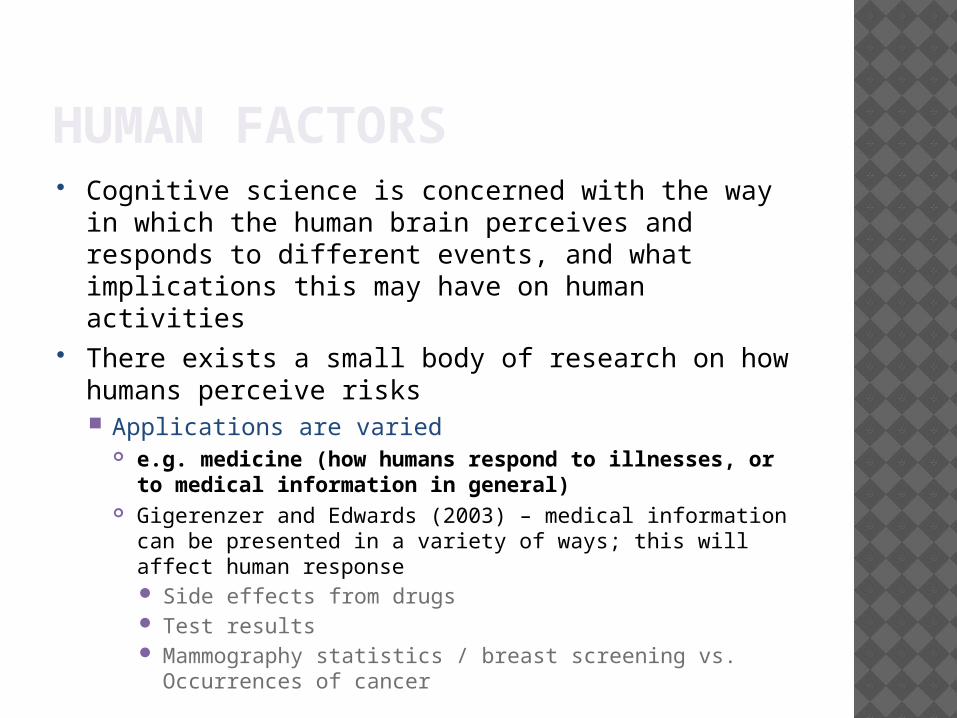
HUMAN FACTORS Cognitive science is concerned with the way in
which the human brain perceives and responds to different events, and what implications this may have on human activities
There exists a small body of research on how humans perceive risks Applications are varied
e.g. medicine (how humans respond to illnesses, or to medical information in general)
Gigerenzer and Edwards (2003) – medical information can be presented in a variety of ways; this will affect human response Side effects from drugs Test results Mammography statistics / breast screening vs.
Occurrences of cancer
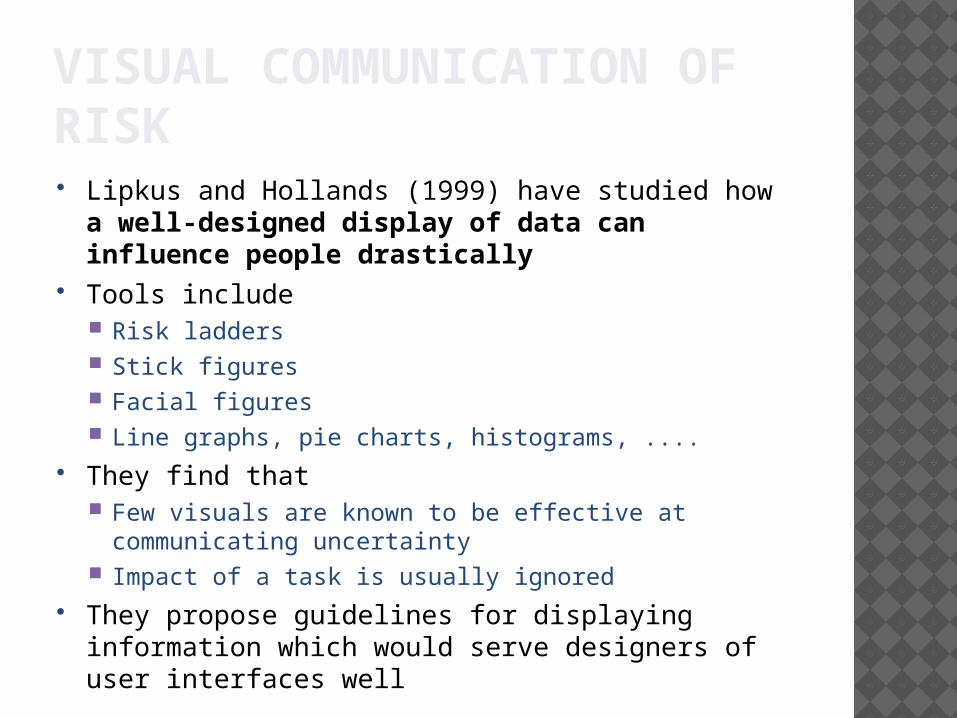
VISUAL COMMUNICATION OF RISK Lipkus and Hollands (1999) have studied how a
well-designed display of data can influence people drastically
Tools include Risk ladders Stick figures Facial figures Line graphs, pie charts, histograms, ....
They find that Few visuals are known to be effective at communicating
uncertainty Impact of a task is usually ignored
They propose guidelines for displaying information which would serve designers of user interfaces well
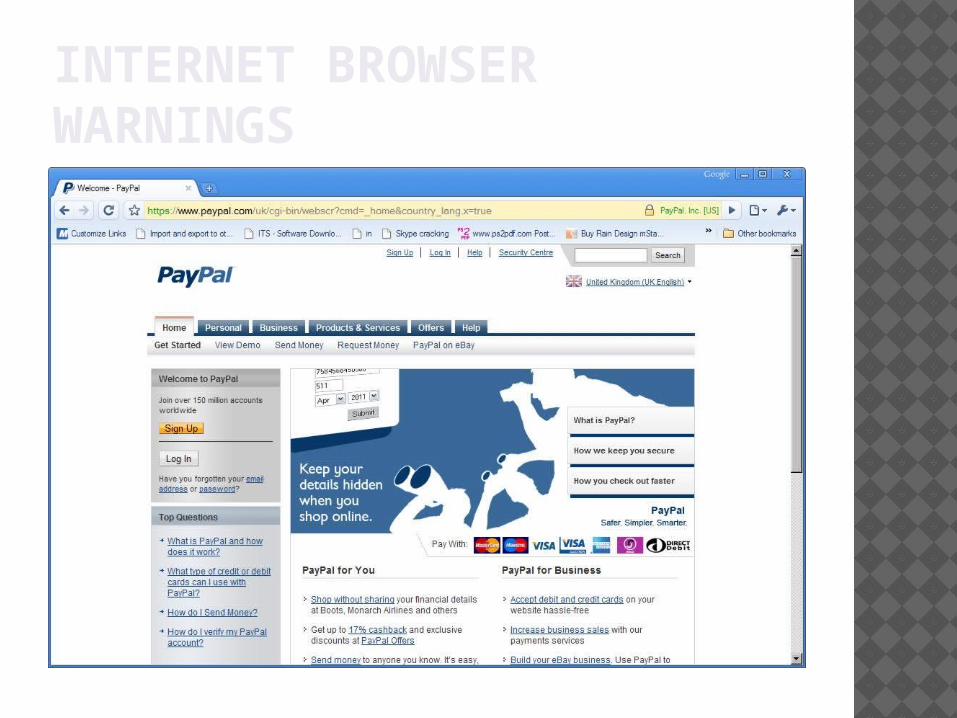
INTERNET BROWSER WARNINGS
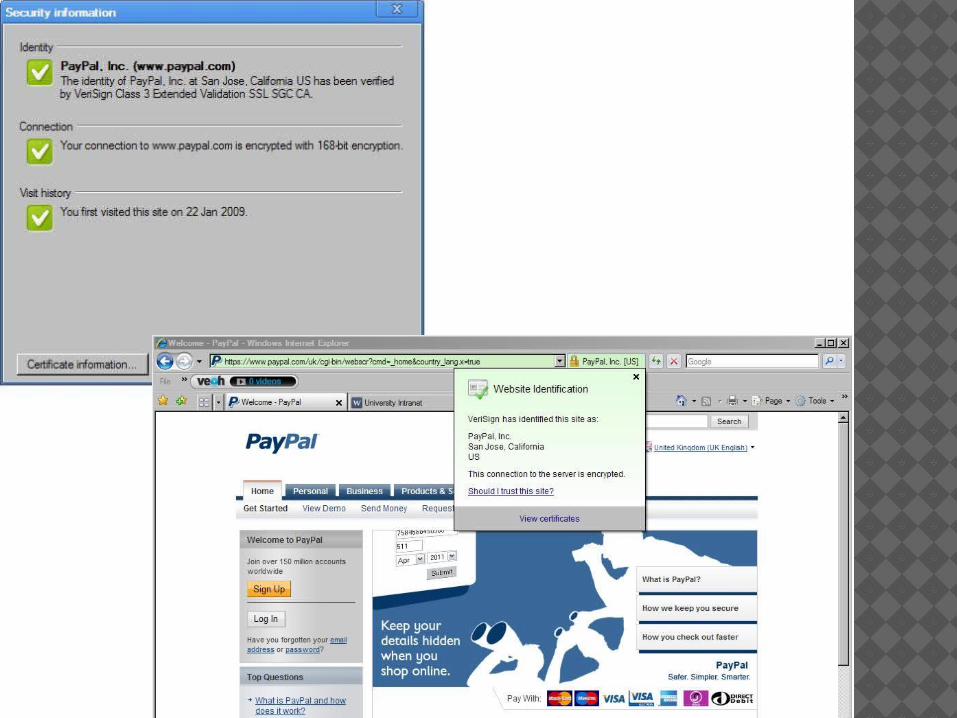
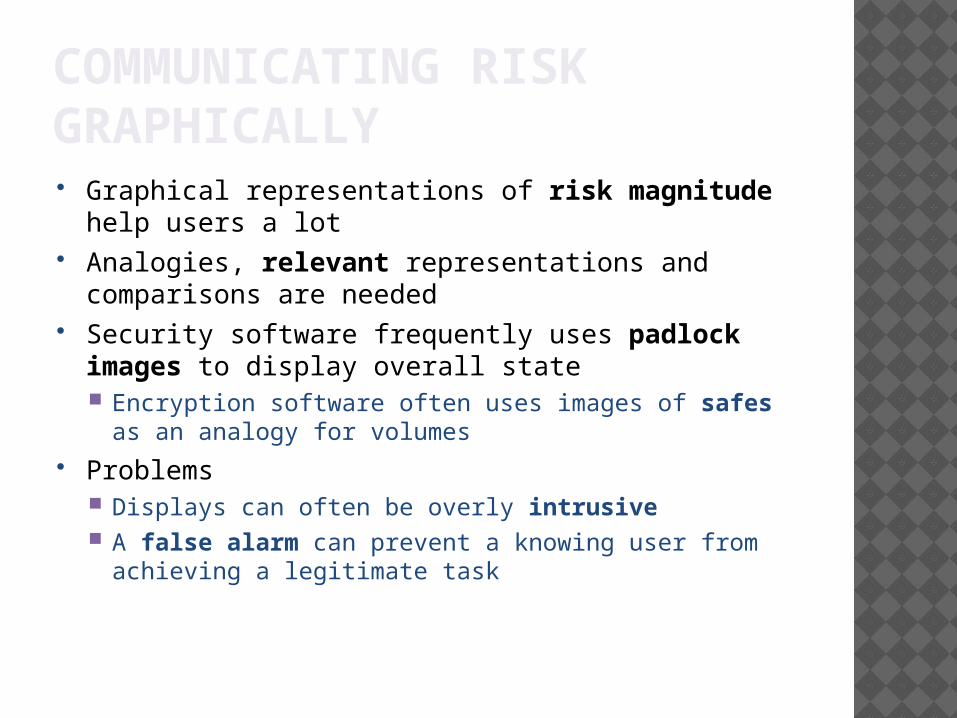
COMMUNICATING RISK GRAPHICALLY Graphical representations of risk magnitude help
users a lot Analogies, relevant representations and
comparisons are needed Security software frequently uses padlock images
to display overall state Encryption software often uses images of safes as an
analogy for volumes Problems
Displays can often be overly intrusive A false alarm can prevent a knowing user from
achieving a legitimate task
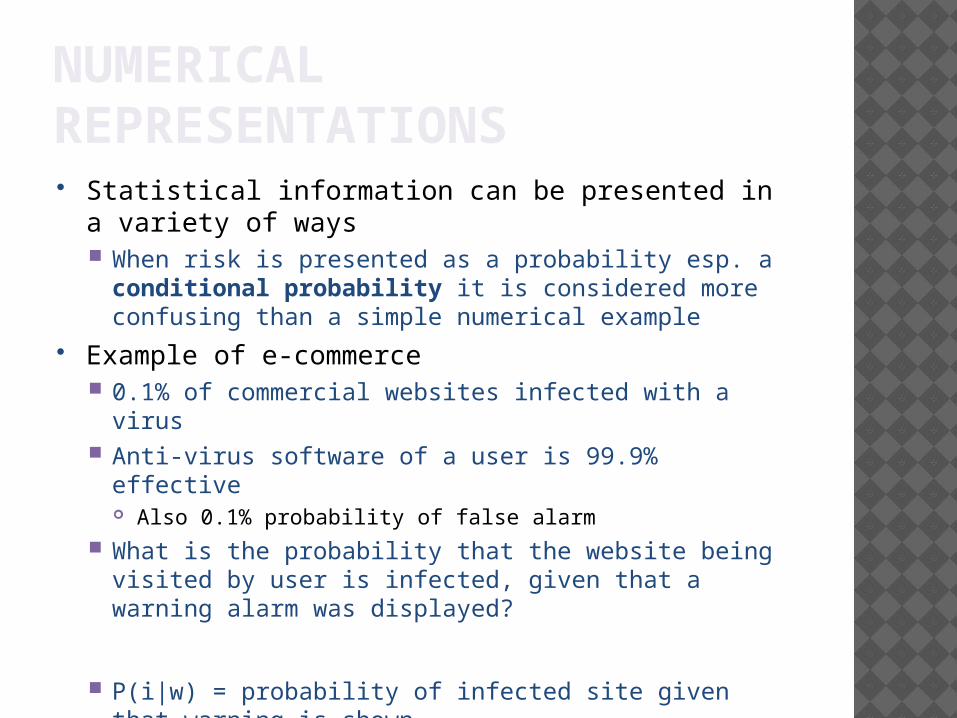
NUMERICAL REPRESENTATIONS Statistical information can be presented in a variety
of ways When risk is presented as a probability esp. a
conditional probability it is considered more confusing than a simple numerical example
Example of e-commerce 0.1% of commercial websites infected with a virus Anti-virus software of a user is 99.9% effective
Also 0.1% probability of false alarm What is the probability that the website being visited by
user is infected, given that a warning alarm was displayed?
P(i|w) = probability of infected site given that warning is shown
P(w|i) = probability of warning being shown given that site is infected
P(i) = probability of site being infected P(w) = probability of warning being shown
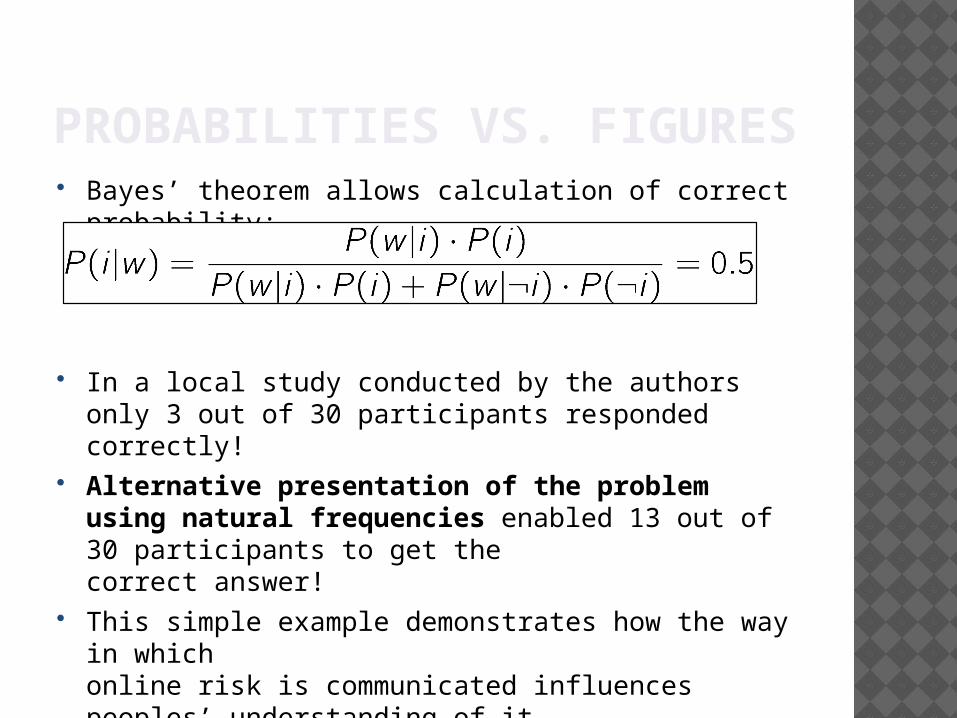
PROBABILITIES VS. FIGURES Bayes’ theorem allows calculation of correct
probability:
In a local study conducted by the authors only 3 out of 30 participants responded correctly!
Alternative presentation of the problem using natural frequencies enabled 13 out of 30 participants to get the correct answer!
This simple example demonstrates how the way in which online risk is communicated influences peoples’ understanding of it
WORK IN PROGRESS We have only briefly considered
Visual representations of risk Numerical representations
Current work has involved Bridging the gap between purely social research and
computer science Surveying the literature in cognitive science for techniques
and tools that might influence human perceptions of online risk
Conducting a small-scale experiment with numerical representations in order to validate the research of Gigerenzer and Edwards in the context of online risks
Future work To develop a proper, extensive model of online risk To investigate different types of security policies and how
they can be communicated most effectively
THE BIGGER PICTURE We expect that this work will lead to a large-scale
interdisciplinary project, which will enable Security experts to better understand the user’s
perspective Psychologists and cognitive scientists to better
understand how users perceive threats and danger in the digital age
This work is likely to impact other security research E.g. Project EnCoRe (“Ensuring Consent and
Revocation”) is a large-scale UK project focused on developing privacy controls for systems and software
REFERENCES Gigerenzer, G., & Edwards, A. (2003). Simple tools
for understanding risks: from innumeracy to insight. British Medical Journal, 327, 741-744.
Lipkus, I. M., & Hollands, J. G. (1999). The visual communication of risk. Journal of the National Cancer Institute Monographs, 25, 149-163.
Slovic, P. (1987). Perception of risk. Science, 236, 280-285.
Sparrow, J. A. (1989). Graphical displays in information systems: Some data properties influencing the effectiveness of alternative forms. Behaviour & Information Technology, 8(1), 43-56.


![Elastic Analysis & Application Tables of Rectangular Plates [Artigo-papanikolaou]](https://img.pdfslide.us/doc/110x75/55cf9cb5550346d033aac39c/elastic-analysis-application-tables-of-rectangular-plates-artigo-papanikolaou.jpg)


![[Paper] Aristotle Papanikolaou - Byzantium Orthodoxy and Democracy](https://img.pdfslide.us/doc/110x75/55cf98ea550346d0339a6d4f/paper-aristotle-papanikolaou-byzantium-orthodoxy-and-democracy.jpg)