Embed Size (px)
Citation preview
School of Public Health and Community Medicine
Mary-Louise McLaws
Professor of Epidemiology
Healthcare Associated Infection and Infectious Diseases Control
Epidemiology Advisor to Clinical Excellence Commission
Central Line Associated Bloodstream Infections: Is achieving zero possible?
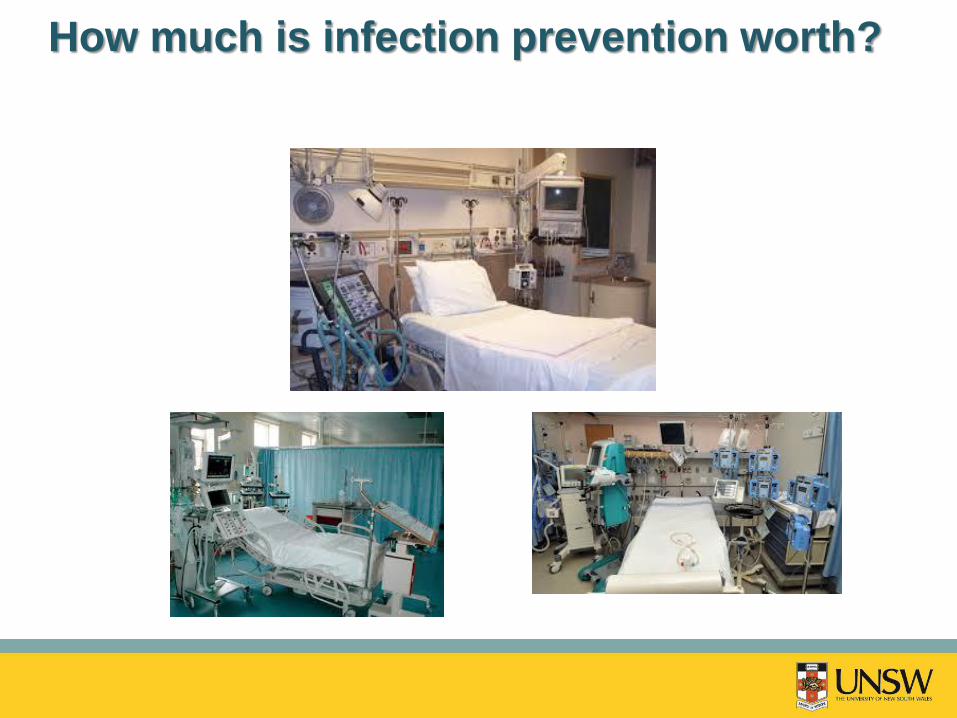
How much is infection prevention worth?
1. Insertion bundle for zero risk for CLABSI
How large is the CLABSI problem ?
How did we introduce bundle intervention ?
2. Dwell time associated with increased risk of CLABSI
Is every patient with a CVC at risk of CLABSI?
3. Surveillance analysis to assist CLABSI prevention
Is there a better surveillance method to identify dwell time
for targeting infection control efforts?
4. Other CLABSI prevention methods
Some are expensive so which patients should have
additional prevention resources?
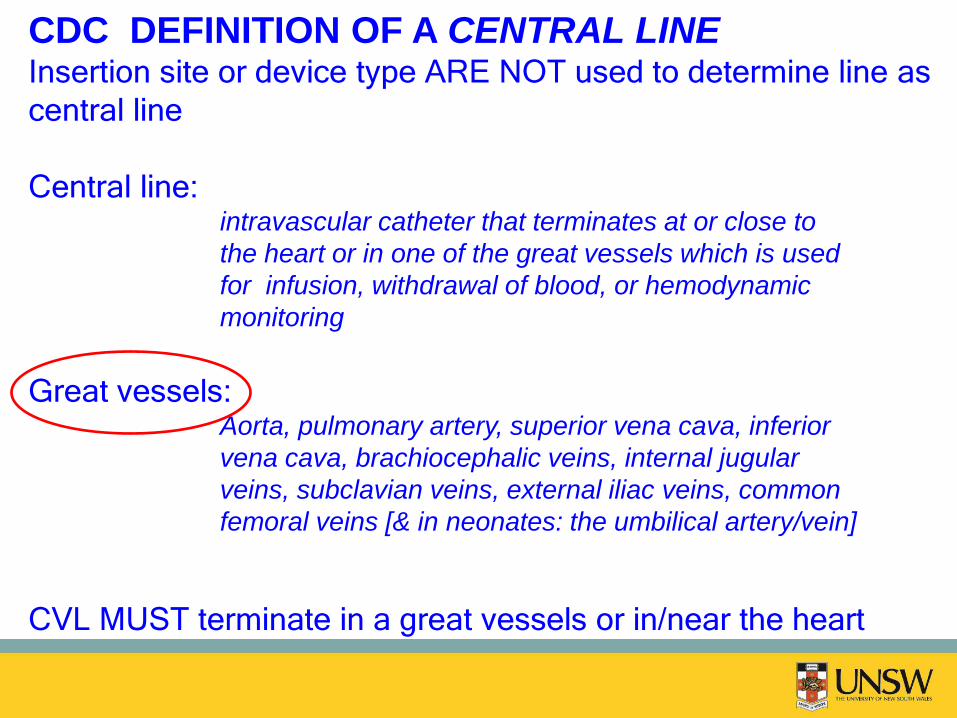
CDC DEFINITION OF A CENTRAL LINE Insertion site or device type ARE NOT used to determine line as
central line
Central line: intravascular catheter that terminates at or close to
the heart or in one of the great vessels which is used
for infusion, withdrawal of blood, or hemodynamic
monitoring
Great vessels: Aorta, pulmonary artery, superior vena cava, inferior
vena cava, brachiocephalic veins, internal jugular
veins, subclavian veins, external iliac veins, common
femoral veins [& in neonates: the umbilical artery/vein]
CVL MUST terminate in a great vessels or in/near the heart
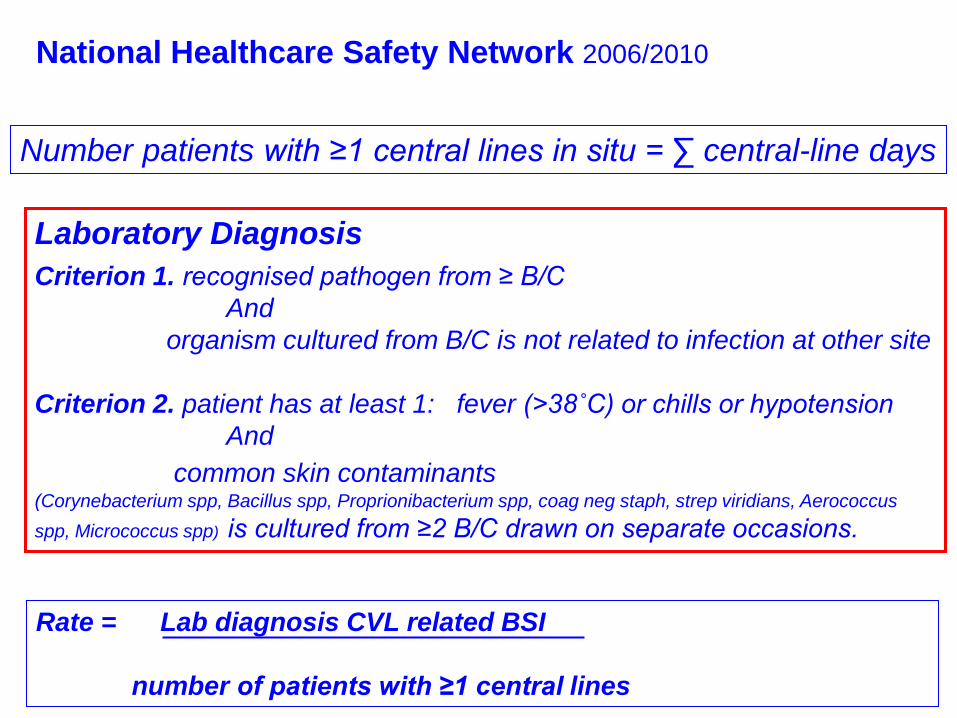
Laboratory Diagnosis
Criterion 1. recognised pathogen from ≥ B/C
And
organism cultured from B/C is not related to infection at other site
Criterion 2. patient has at least 1: fever (>38˚C) or chills or hypotension
And
common skin contaminants (Corynebacterium spp, Bacillus spp, Proprionibacterium spp, coag neg staph, strep viridians, Aerococcus
spp, Micrococcus spp) is cultured from ≥2 B/C drawn on separate occasions.
Rate = Lab diagnosis CVL related BSI
number of patients with ≥1 central lines
Number patients with ≥1 central lines in situ = ∑ central-line days
National Healthcare Safety Network 2006/2010
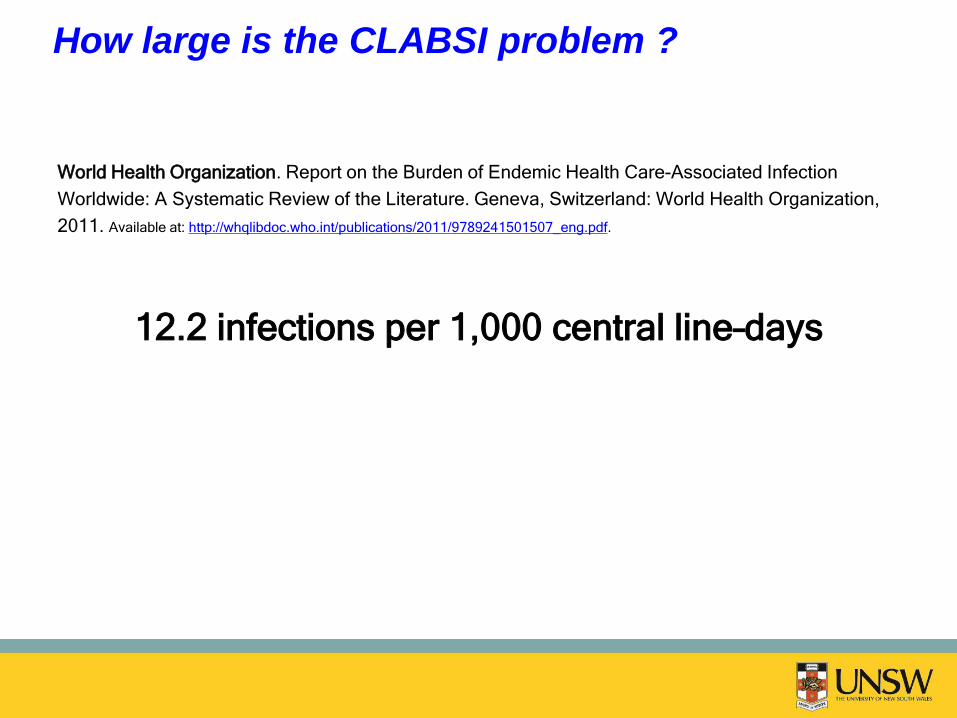
World Health Organization. Report on the Burden of Endemic Health Care-Associated Infection
Worldwide: A Systematic Review of the Literature. Geneva, Switzerland: World Health Organization,
2011. Available at: http://whqlibdoc.who.int/publications/2011/9789241501507_eng.pdf.
12.2 infections per 1,000 central line–days
How large is the CLABSI problem ?
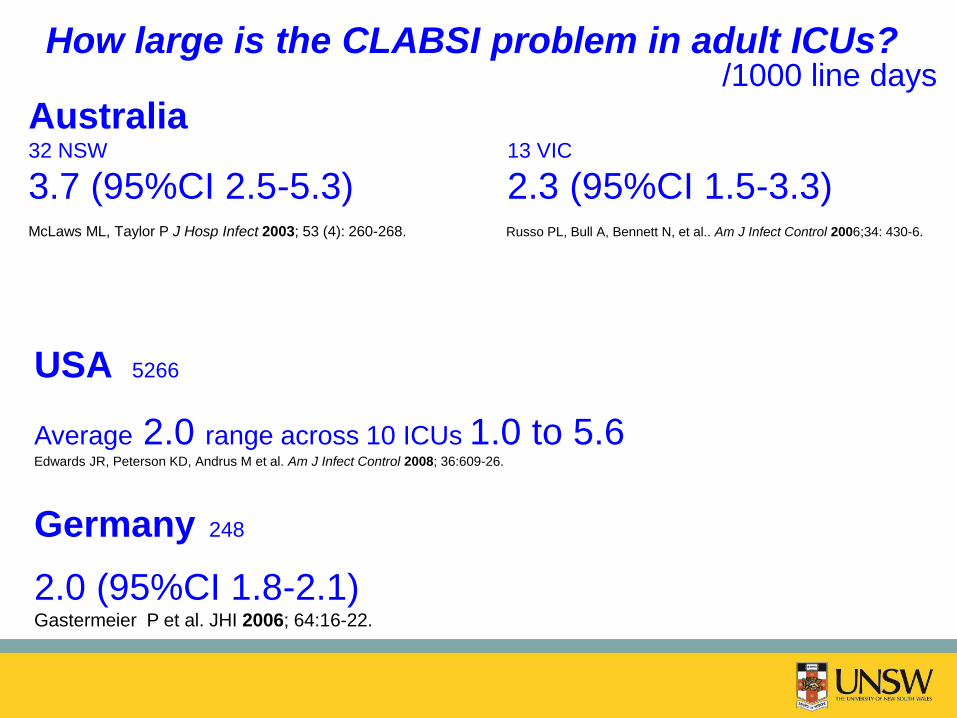
Australia 32 NSW 13 VIC
3.7 (95%CI 2.5-5.3) 2.3 (95%CI 1.5-3.3)
McLaws ML, Taylor P J Hosp Infect 2003; 53 (4): 260-268. Russo PL, Bull A, Bennett N, et al.. Am J Infect Control 2006;34: 430-6.
USA 5266
Average 2.0 range across 10 ICUs 1.0 to 5.6 Edwards JR, Peterson KD, Andrus M et al. Am J Infect Control 2008; 36:609-26.
Germany 248
2.0 (95%CI 1.8-2.1) Gastermeier P et al. JHI 2006; 64:16-22.
How large is the CLABSI problem in adult ICUs? /1000 line days
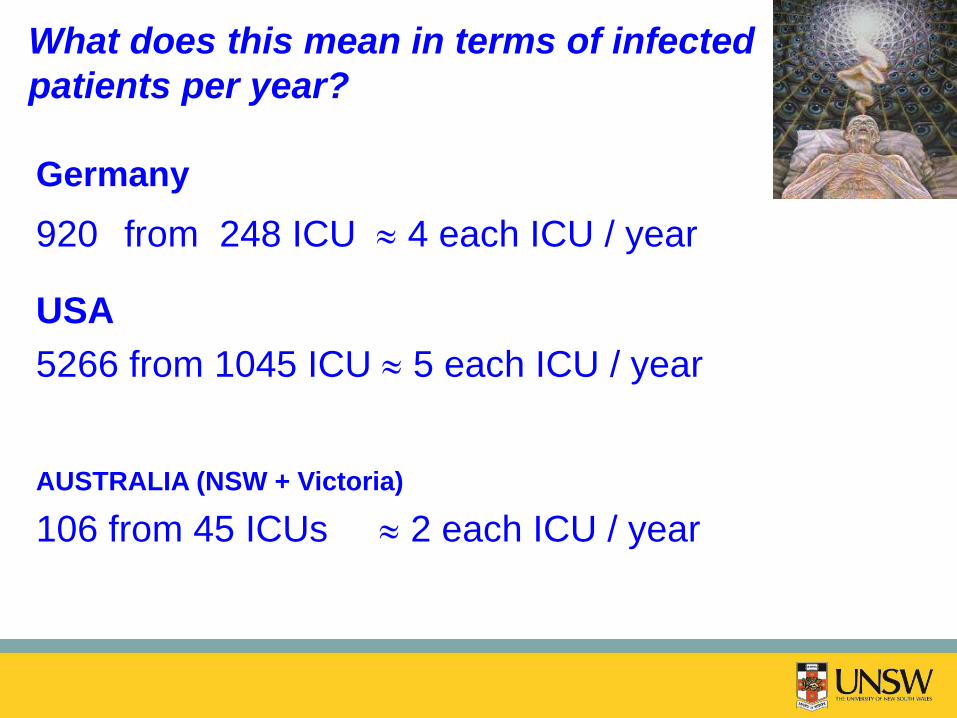
Germany
920 from 248 ICU 4 each ICU / year
USA
5266 from 1045 ICU 5 each ICU / year
AUSTRALIA (NSW + Victoria)
106 from 45 ICUs 2 each ICU / year
What does this mean in terms of infected
patients per year?
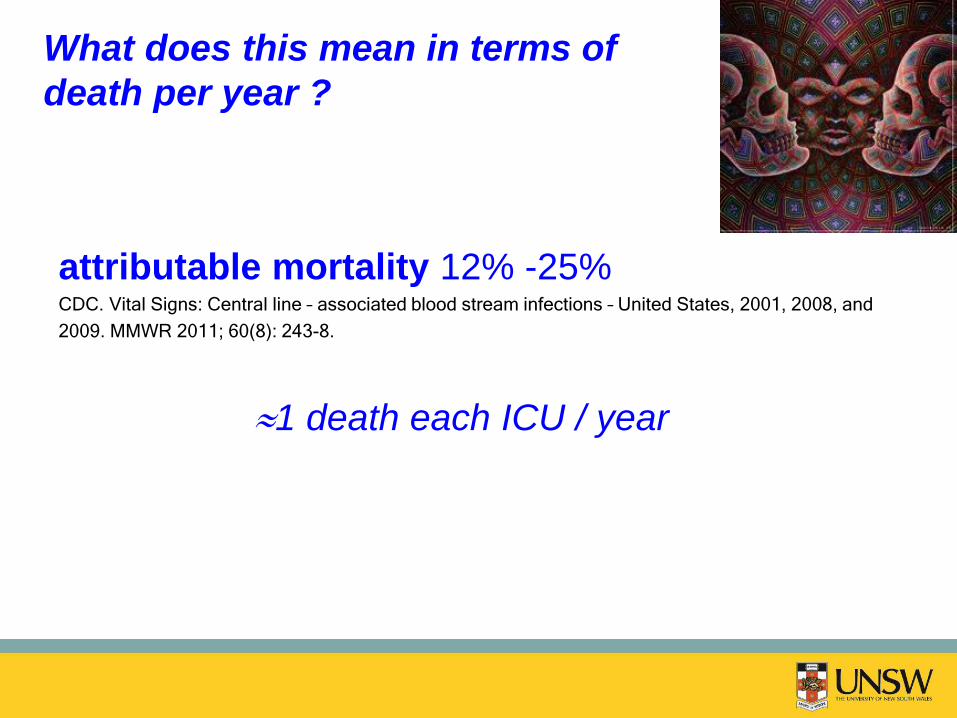
What does this mean in terms of
death per year ?
attributable mortality 12% -25% CDC. Vital Signs: Central line – associated blood stream infections – United States, 2001, 2008, and
2009. MMWR 2011; 60(8): 243-8.
1 death each ICU / year
15 years of Evidence
CLABSI is preventable

Early highlights on prevention
• Prevention of central venous catheter-related infections by using maximal sterile barrier precautions during insertion. Raad II et al. Infect Control Hosp Epidemiol 1994; 15:231-8.
• Eliminating catheter-related bloodstream infections in the intensive care unit. Berenholtz et al. Crit Care Med 2004; 32 (10): 2014-2020.
• Prevention of intravascular catheter infection. Eggimann P. Curr Opin
Infect Dis 2007; 20:360-369
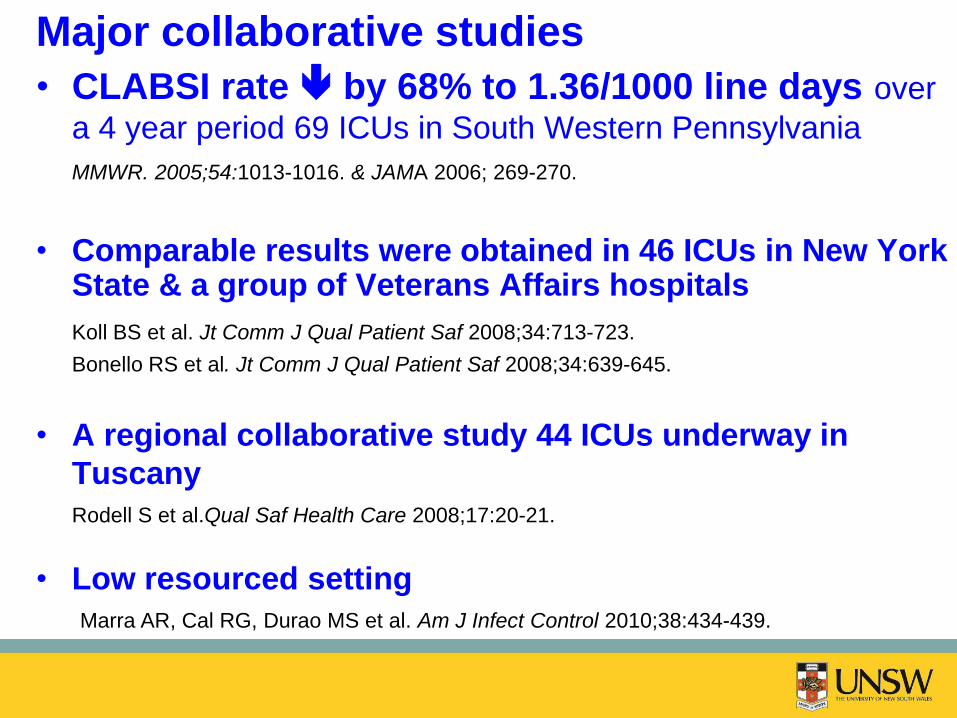
Major collaborative studies
• CLABSI rate by 68% to 1.36/1000 line days over
a 4 year period 69 ICUs in South Western Pennsylvania MMWR. 2005;54:1013-1016. & JAMA 2006; 269-270.
• Comparable results were obtained in 46 ICUs in New York State & a group of Veterans Affairs hospitals
Koll BS et al. Jt Comm J Qual Patient Saf 2008;34:713-723.
Bonello RS et al. Jt Comm J Qual Patient Saf 2008;34:639-645.
• A regional collaborative study 44 ICUs underway in
Tuscany
Rodell S et al.Qual Saf Health Care 2008;17:20-21.
• Low resourced setting
Marra AR, Cal RG, Durao MS et al. Am J Infect Control 2010;38:434-439.
Keystone ICU Project
Pronovost P, Needham D, Berenholtz S, et al. An intervention to decrease catheter-
related bloodstream infections in the ICU. N Engl J Med 2006;355:2725–2732
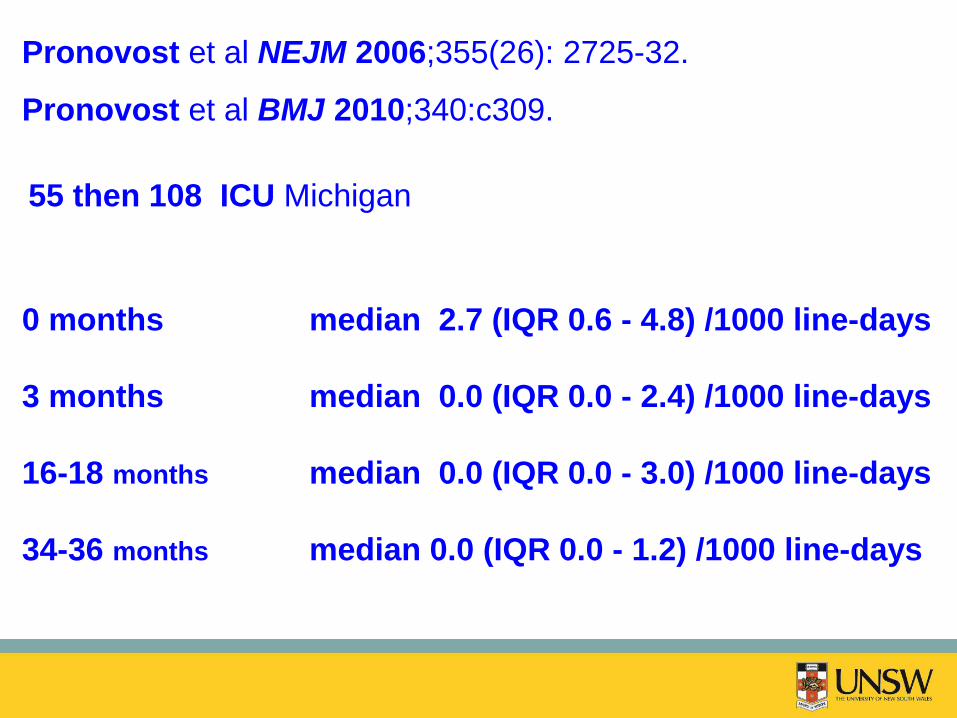
Pronovost et al NEJM 2006;355(26): 2725-32.
Pronovost et al BMJ 2010;340:c309.
0 months median 2.7 (IQR 0.6 - 4.8) /1000 line-days
3 months median 0.0 (IQR 0.0 - 2.4) /1000 line-days
16-18 months median 0.0 (IQR 0.0 - 3.0) /1000 line-days
34-36 months median 0.0 (IQR 0.0 - 1.2) /1000 line-days
55 then 108 ICU Michigan
Aim: all 37 public ICUs in NSW
How did NSW introduce bundle intervention ?

How did NSW introduce bundle intervention ?
Multidisciplinary support
Clinical Excellence Commission
Intensive Care Centre Monitoring Unit
NSW Ministry of Health
Physician and Nurse from every ICU
Burrell A, McLaws ML, Herkes R, Mungo M, Pantle A. Aseptic insertion of central lines reduces bacteraemia: The NSW
Central Line Associated Bacteraemia Collaborative (CLAB-ICU). Med J Aust 2011; 194: 583-587.
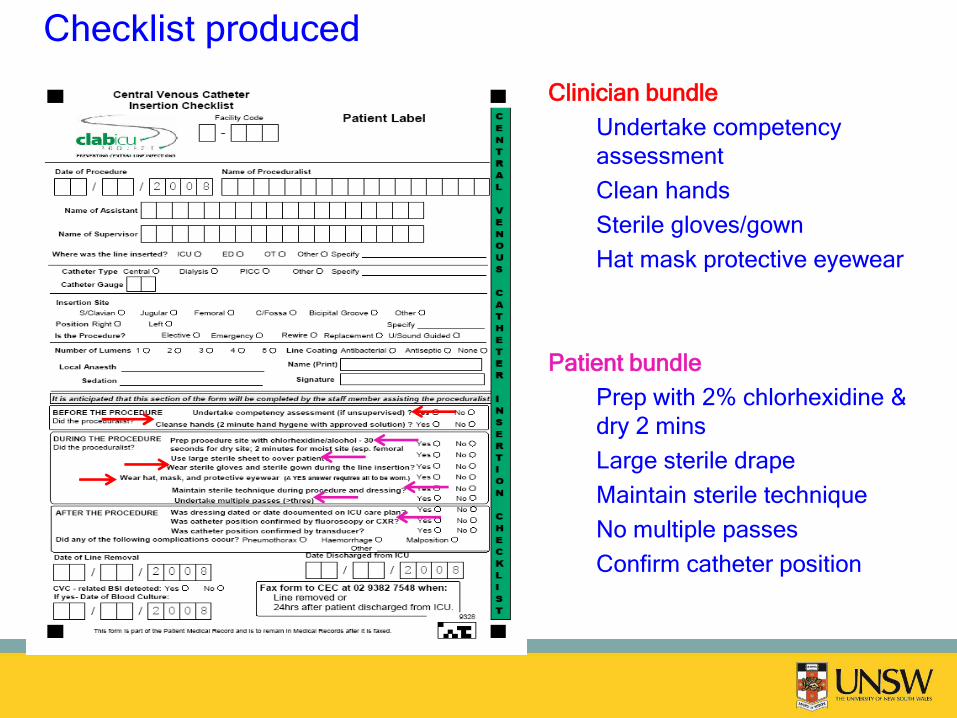
Checklist produced
Clinician bundle
Undertake competency
assessment
Clean hands
Sterile gloves/gown
Hat mask protective eyewear
Patient bundle
Prep with 2% chlorhexidine &
dry 2 mins
Large sterile drape
Maintain sterile technique
No multiple passes
Confirm catheter position
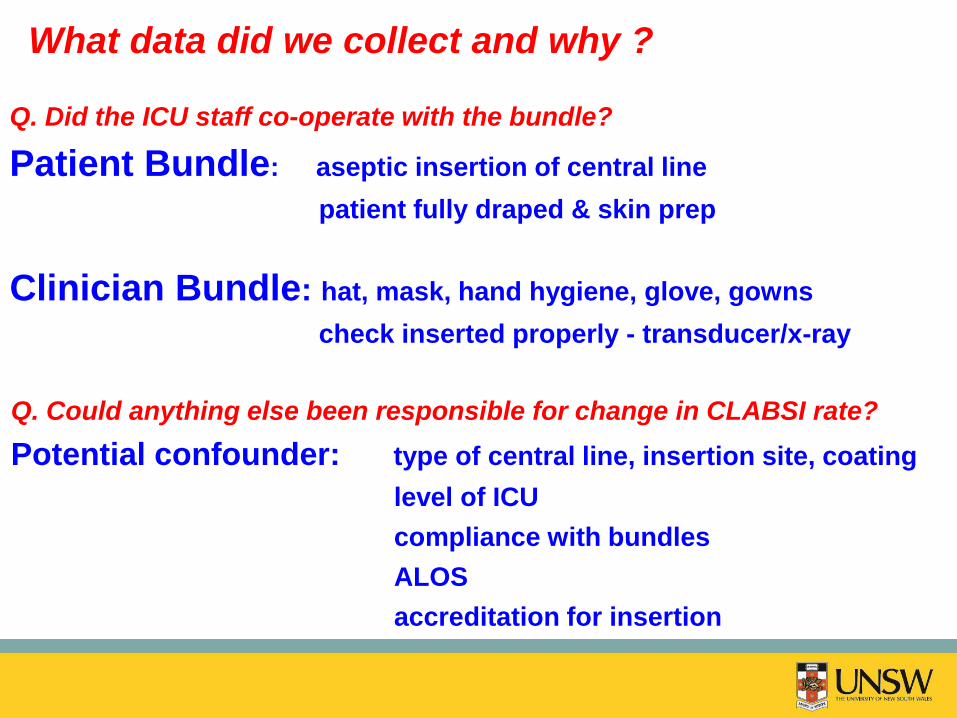
Q. Did the ICU staff co-operate with the bundle?
Patient Bundle: aseptic insertion of central line
patient fully draped & skin prep
Clinician Bundle: hat, mask, hand hygiene, glove, gowns
check inserted properly - transducer/x-ray
Q. Could anything else been responsible for change in CLABSI rate?
Potential confounder: type of central line, insertion site, coating
level of ICU
compliance with bundles
ALOS
accreditation for insertion
What data did we collect and why ?
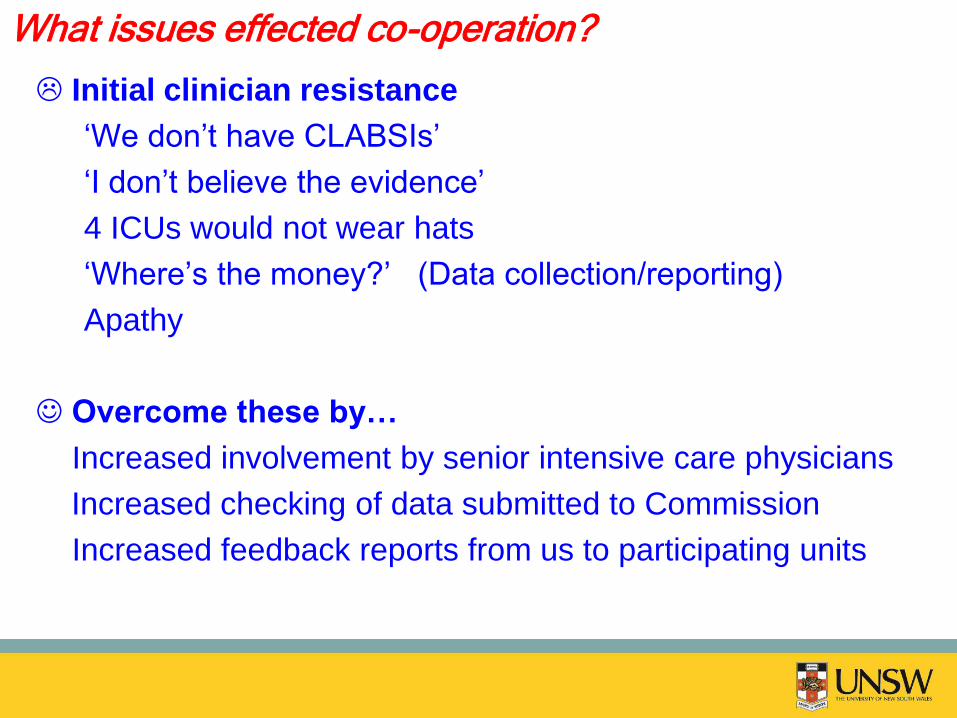
Initial clinician resistance
‘We don’t have CLABSIs’
‘I don’t believe the evidence’
4 ICUs would not wear hats
‘Where’s the money?’ (Data collection/reporting)
Apathy
Overcome these by…
Increased involvement by senior intensive care physicians
Increased checking of data submitted to Commission
Increased feedback reports from us to participating units
What issues effected co-operation?
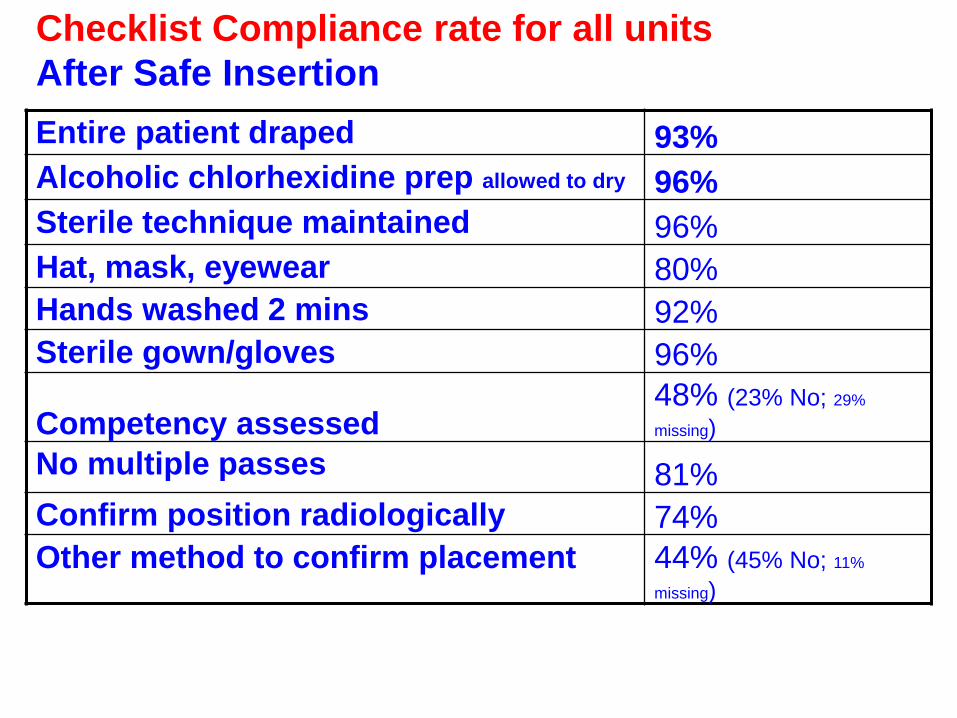
Checklist Compliance rate for all units
After Safe Insertion
Entire patient draped 93%
Alcoholic chlorhexidine prep allowed to dry 96%
Sterile technique maintained 96%
Hat, mask, eyewear 80%
Hands washed 2 mins 92%
Sterile gown/gloves 96%
Competency assessed 48% (23% No; 29%
missing)
No multiple passes 81%
Confirm position radiologically 74%
Other method to confirm placement 44% (45% No; 11%
missing)
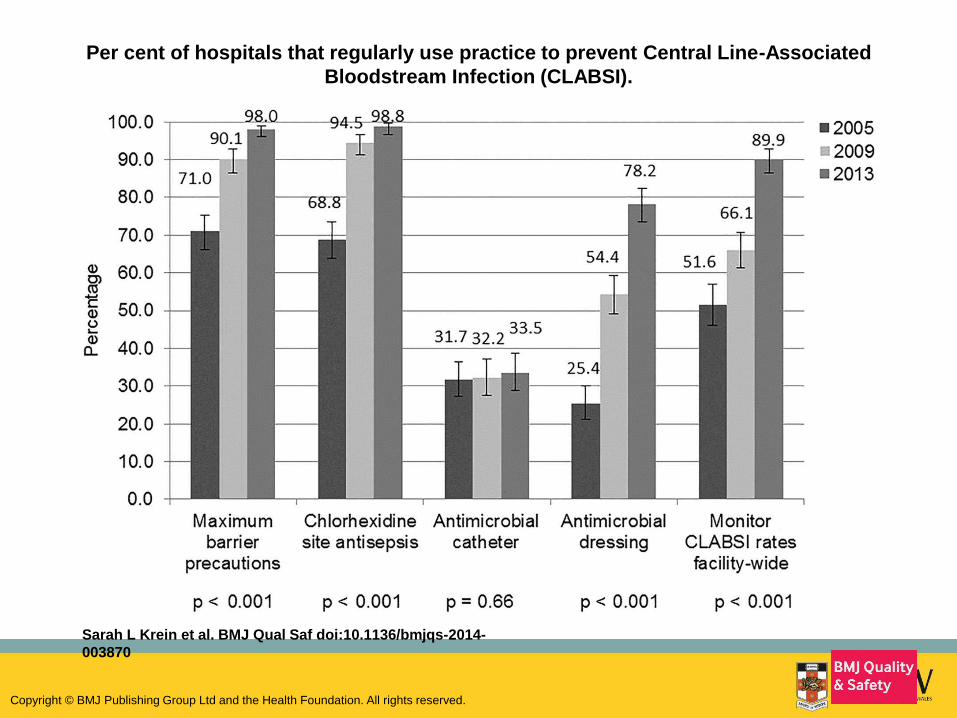
Per cent of hospitals that regularly use practice to prevent Central Line-Associated
Bloodstream Infection (CLABSI).
Sarah L Krein et al. BMJ Qual Saf doi:10.1136/bmjqs-2014-
003870
Copyright © BMJ Publishing Group Ltd and the Health Foundation. All rights reserved.
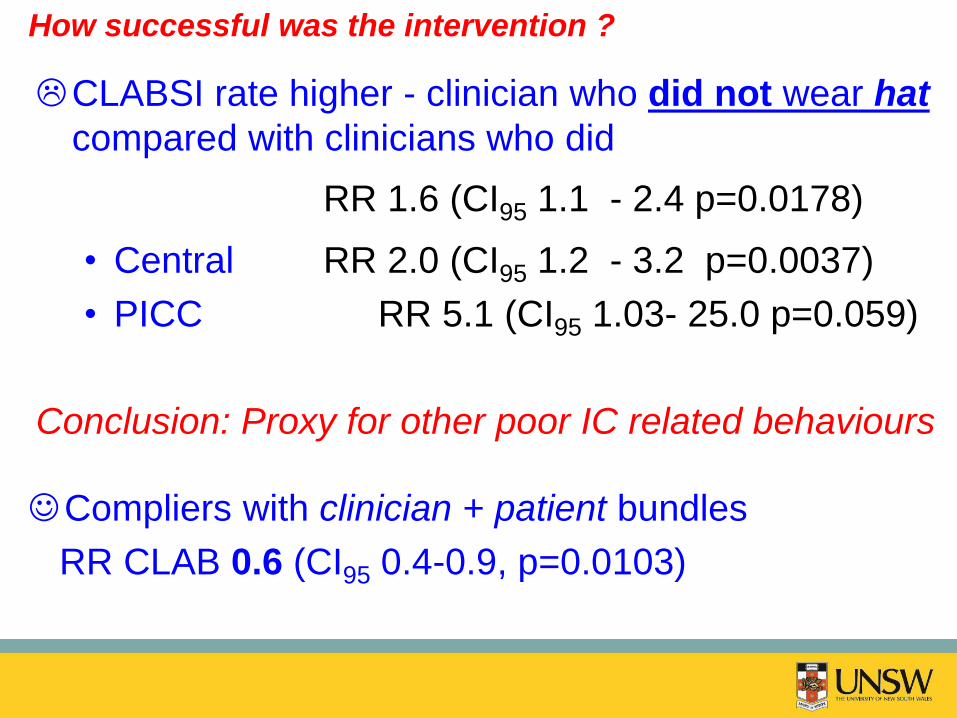
CLABSI rate higher - clinician who did not wear hat
compared with clinicians who did
RR 1.6 (CI95 1.1 - 2.4 p=0.0178)
• Central RR 2.0 (CI95 1.2 - 3.2 p=0.0037)
• PICC RR 5.1 (CI95 1.03- 25.0 p=0.059)
Conclusion: Proxy for other poor IC related behaviours
How successful was the intervention ?
Compliers with clinician + patient bundles
RR CLAB 0.6 (CI95 0.4-0.9, p=0.0103)
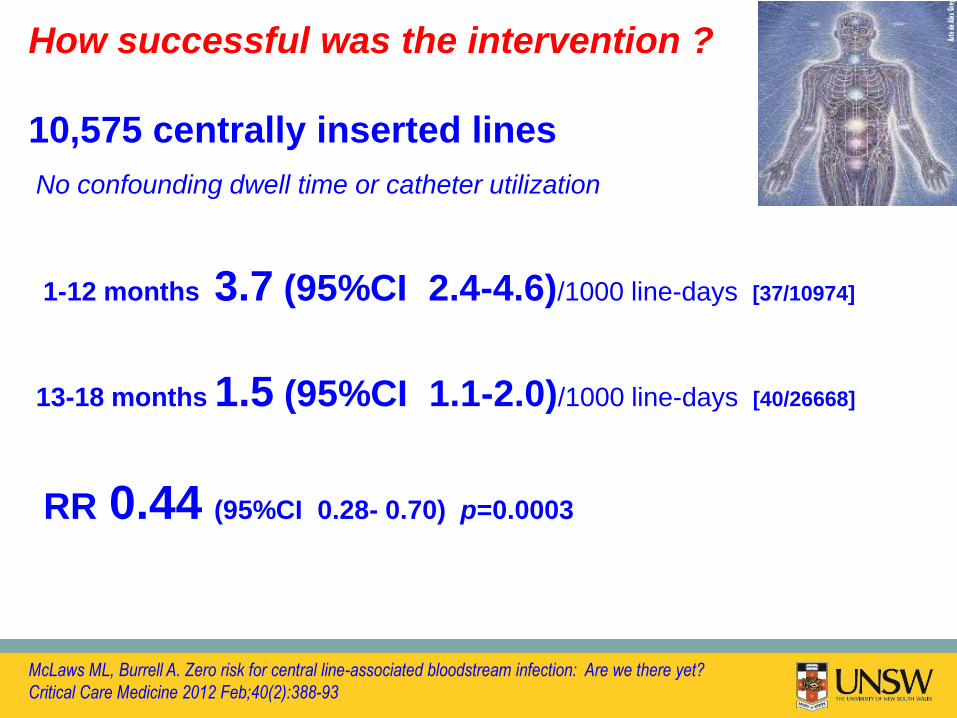
How successful was the intervention ?
10,575 centrally inserted lines
1-12 months 3.7 (95%CI 2.4-4.6)/1000 line-days [37/10974]
13-18 months 1.5 (95%CI 1.1-2.0)/1000 line-days [40/26668]
RR 0.44 (95%CI 0.28- 0.70) p=0.0003
No confounding dwell time or catheter utilization
McLaws ML, Burrell A. Zero risk for central line-associated bloodstream infection: Are we there yet?
Critical Care Medicine 2012 Feb;40(2):388-93
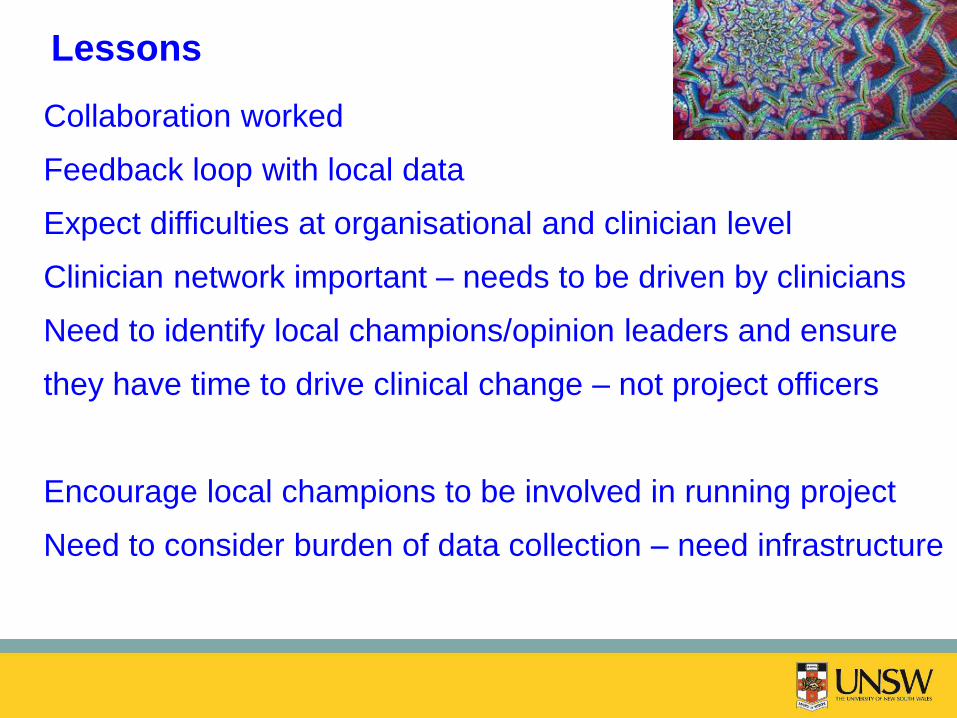
Lessons
Collaboration worked
Feedback loop with local data
Expect difficulties at organisational and clinician level
Clinician network important – needs to be driven by clinicians
Need to identify local champions/opinion leaders and ensure
they have time to drive clinical change – not project officers
Encourage local champions to be involved in running project
Need to consider burden of data collection – need infrastructure
Improvements were due to
• Increased awareness of need for scrupulous aseptic insertion
• Increasing compliance with clinician bundle (if non hat
wearers their clinician bundle data were coded non complier)
• Not due to ↓femoral lines or ↓dwell time
• Significantly better communication between ICU & infection
control
• Greater understanding of surveillance definition
• Increased ownership by ICU care clinicians following
reporting of individual ICU CLABSI data
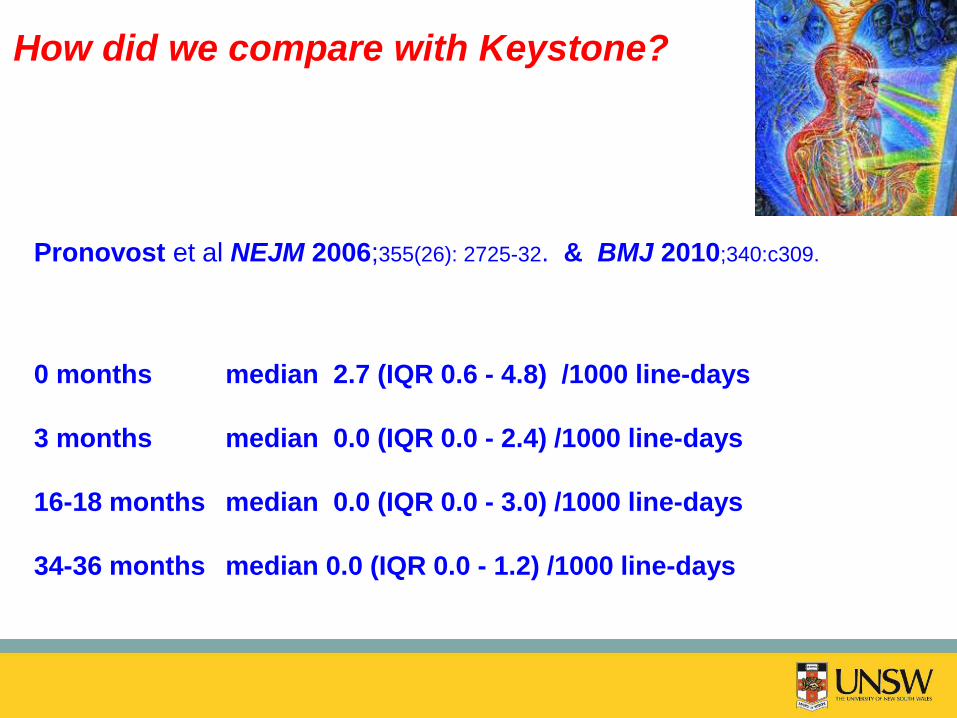
Pronovost et al NEJM 2006;355(26): 2725-32. & BMJ 2010;340:c309.
0 months median 2.7 (IQR 0.6 - 4.8) /1000 line-days
3 months median 0.0 (IQR 0.0 - 2.4) /1000 line-days
16-18 months median 0.0 (IQR 0.0 - 3.0) /1000 line-days
34-36 months median 0.0 (IQR 0.0 - 1.2) /1000 line-days
How did we compare with Keystone?
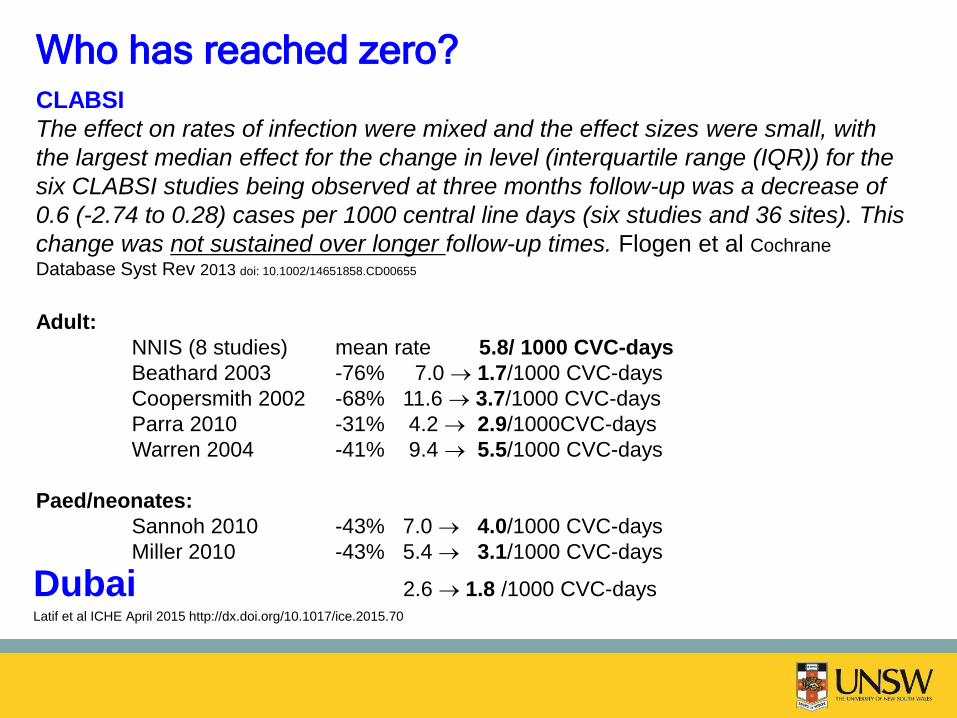
Who has reached zero?
Dubai 2.6 1.8 /1000 CVC-days Latif et al ICHE April 2015 http://dx.doi.org/10.1017/ice.2015.70
CLABSI
The effect on rates of infection were mixed and the effect sizes were small, with
the largest median effect for the change in level (interquartile range (IQR)) for the
six CLABSI studies being observed at three months follow-up was a decrease of
0.6 (-2.74 to 0.28) cases per 1000 central line days (six studies and 36 sites). This
change was not sustained over longer follow-up times. Flogen et al Cochrane
Database Syst Rev 2013 doi: 10.1002/14651858.CD00655
Adult:
NNIS (8 studies) mean rate 5.8/ 1000 CVC-days
Beathard 2003 -76% 7.0 1.7/1000 CVC-days
Coopersmith 2002 -68% 11.6 3.7/1000 CVC-days
Parra 2010 -31% 4.2 2.9/1000CVC-days
Warren 2004 -41% 9.4 5.5/1000 CVC-days
Paed/neonates:
Sannoh 2010 -43% 7.0 4.0/1000 CVC-days
Miller 2010 -43% 5.4 3.1/1000 CVC-days

Why aren’t we
achieving zero
infection ?
http://fedoraproject.org/wiki/File:Artwork_F10Themes_Binary_grid_animated.gif
How long after aseptic insertion can you expect
The patient to remain free from infection ?
Is every patient with a CVC at risk of CLABSI?

First let’s look at the calculation for CLABSI
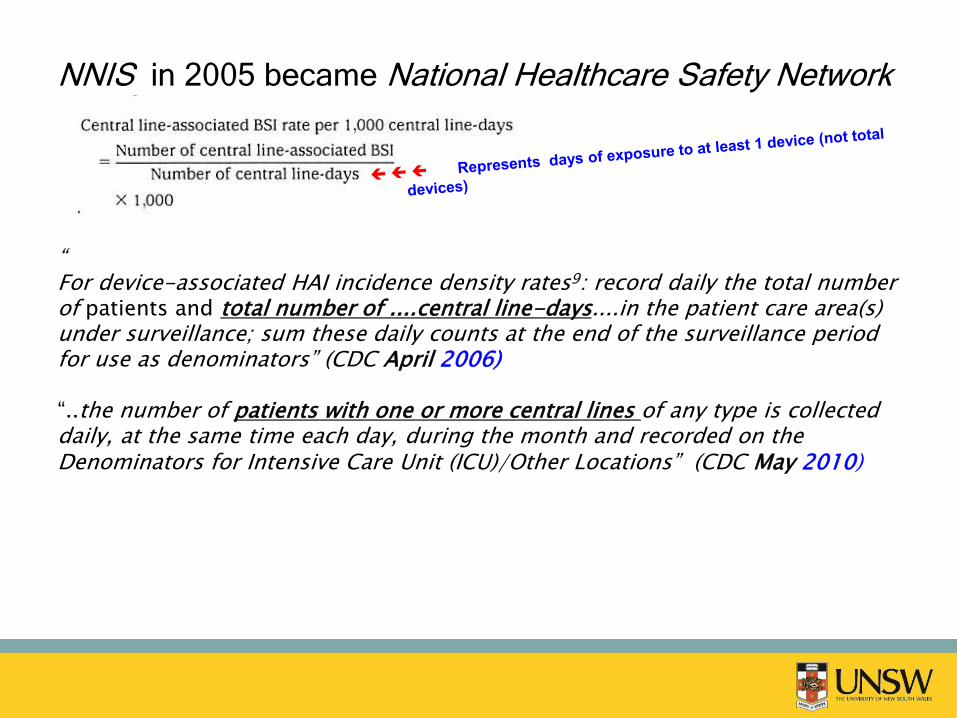
NNIS in 2005 became National Healthcare Safety Network (NHSN)
“ For device-associated HAI incidence density rates9: record daily the total number of patients and total number of ....central line-days....in the patient care area(s) under surveillance; sum these daily counts at the end of the surveillance period for use as denominators” (CDC April 2006) “..the number of patients with one or more central lines of any type is collected daily, at the same time each day, during the month and recorded on the Denominators for Intensive Care Unit (ICU)/Other Locations” (CDC May 2010)
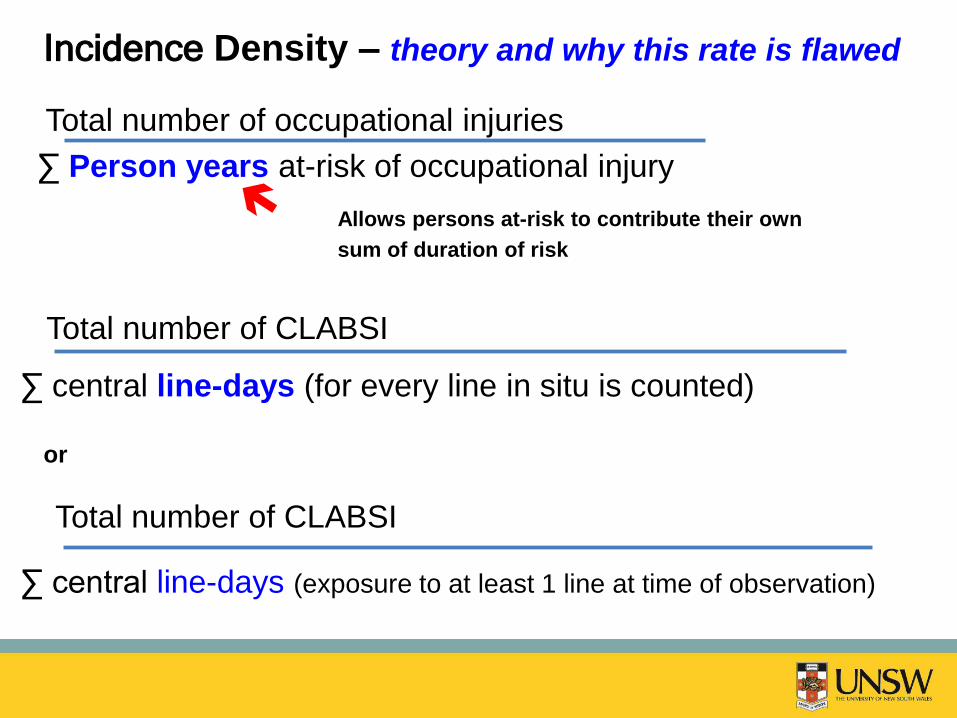
Total number of occupational injuries
∑ Person years at-risk of occupational injury
Incidence Density – theory and why this rate is flawed
Allows persons at-risk to contribute their own
sum of duration of risk
Total number of CLABSI
∑ central line-days (exposure to at least 1 line at time of observation)
Total number of CLABSI
∑ central line-days (for every line in situ is counted)
or

History sophistication of disease frequency and distribution
1620-74 John Graunt quantified disease patterns
in The Nature of Political Observations Made Upon the Bills of
Mortality (1664)
1807- 83 William Farr vital statistics system
(1837) for surveillance person-time

Statistics for a Fixed population
fixed Mt (or Mb) in a fixed population is evaluated within successive ‘same time’
intervals so that time dependence of Mt can be elucidated.
Graunt’s Life table
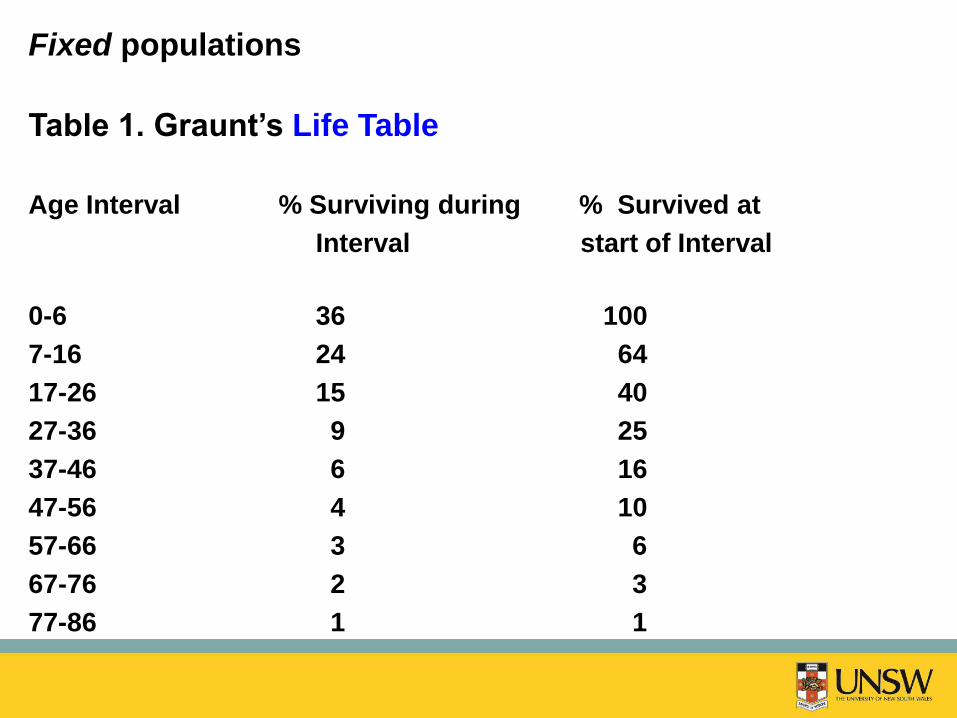
Fixed populations
Table 1. Graunt’s Life Table
Age Interval % Surviving during % Survived at
Interval start of Interval
0-6 36 100
7-16 24 64
17-26 15 40
27-36 9 25
37-46 6 16
47-56 4 10
57-66 3 6
67-76 2 3
77-86 1 1
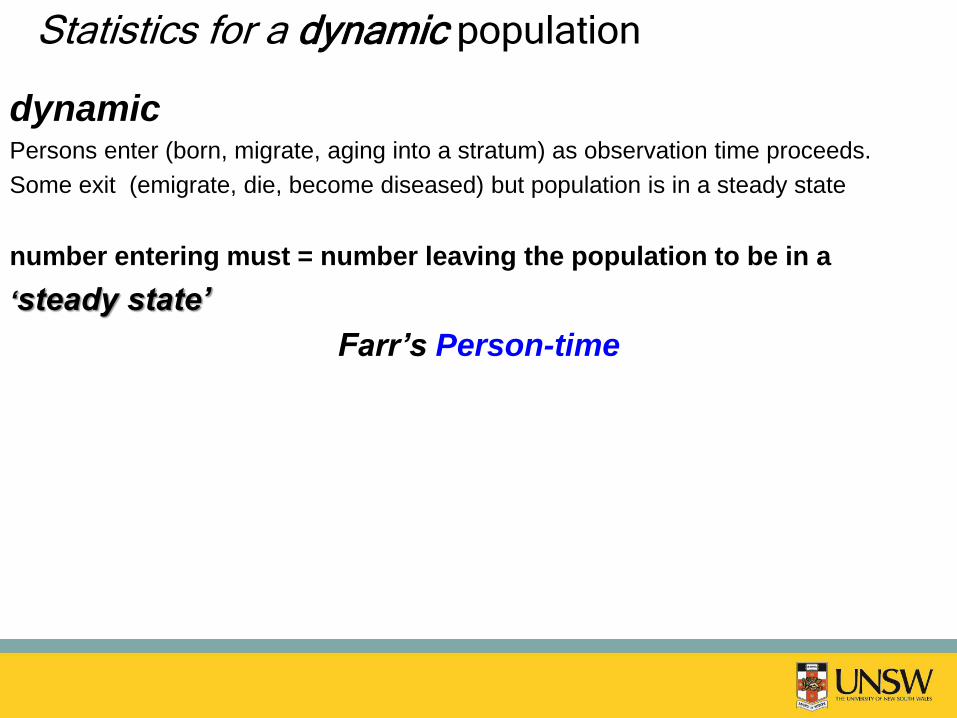
Statistics for a dynamic population
dynamic Persons enter (born, migrate, aging into a stratum) as observation time proceeds.
Some exit (emigrate, die, become diseased) but population is in a steady state
number entering must = number leaving the population to be in a
‘steady state’
Farr’s Person-time
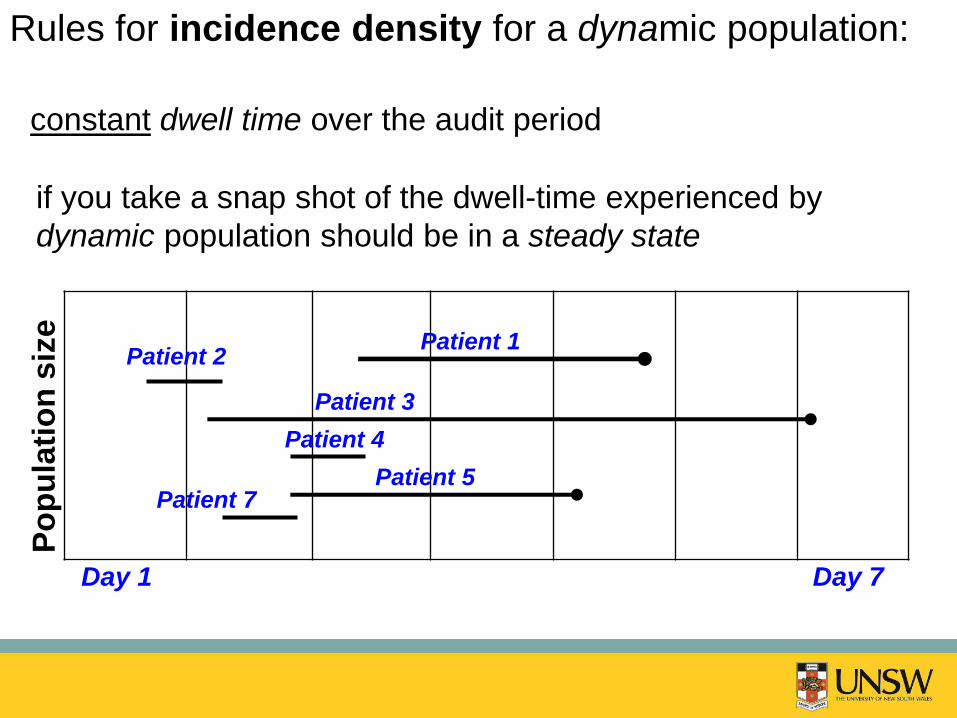
Rules for incidence density for a dynamic population:
constant dwell time over the audit period
if you take a snap shot of the dwell-time experienced by
dynamic population should be in a steady state
Po
pu
lati
on
siz
e
Day 1 Day 7
Patient 2 Patient 1
Patient 3
Patient 4
Patient 5 Patient 7
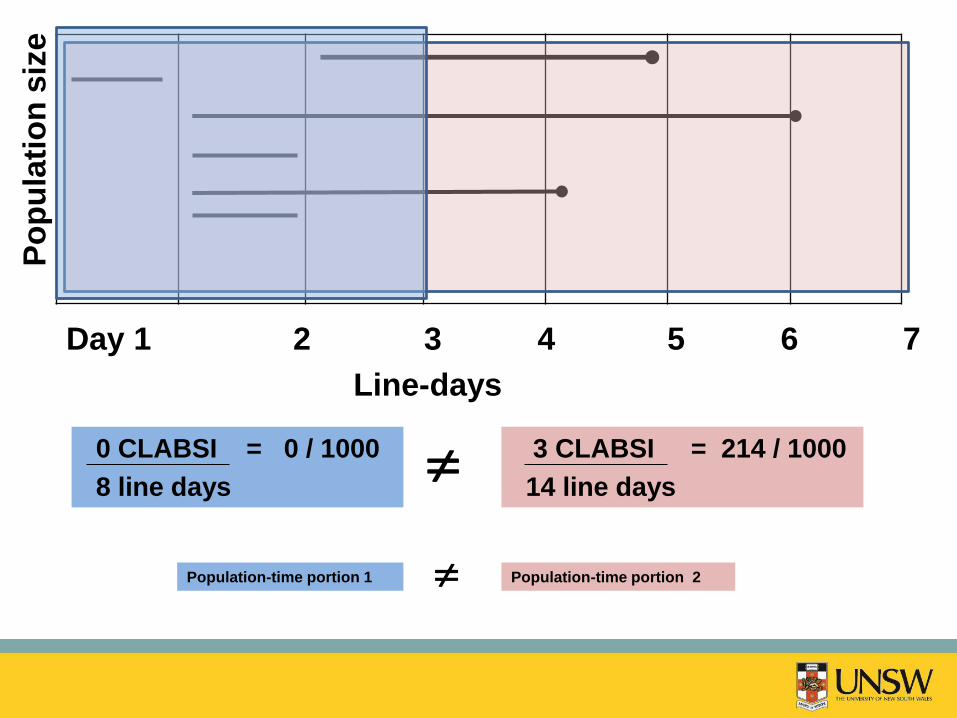
3 CLABSI = 214 / 1000
14 line days
Po
pu
lati
on
siz
e
Day 1 2 3 4 5 6 7
Line-days
0 CLABSI = 0 / 1000
8 line days
Population-time portion 1 Population-time portion 2

McLaws ML, Berry G. Infect Control Hosp Epidemiol 2005
Current calculation assumes (Pr) CLABSI rate (Pr)dwell time day1= (Pr)dwell time 2= (Pr)dwell time 3= etc
CDC calculation expects linear relationship and
denominator in a steady state

What has this got to do with Zero risk?
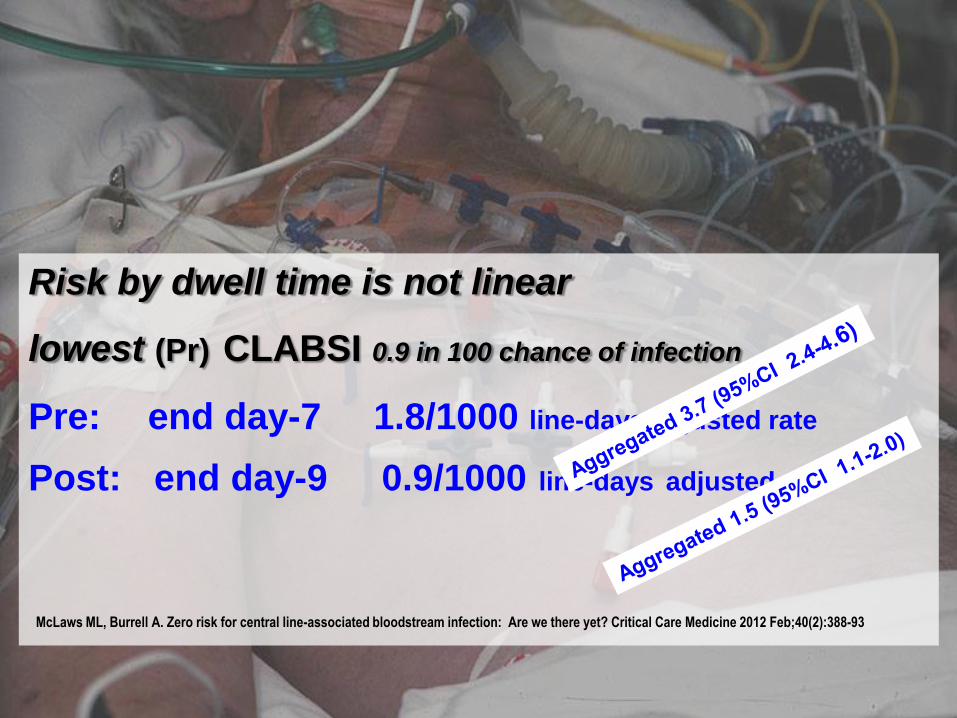
Risk by dwell time is not linear
lowest (Pr) CLABSI 0.9 in 100 chance of infection
Pre: end day-7 1.8/1000 line-days adjusted rate
Post: end day-9 0.9/1000 line-days adjusted rate
McLaws ML, Burrell A. Zero risk for central line-associated bloodstream infection: Are we there yet? Critical Care Medicine 2012 Feb;40(2):388-93
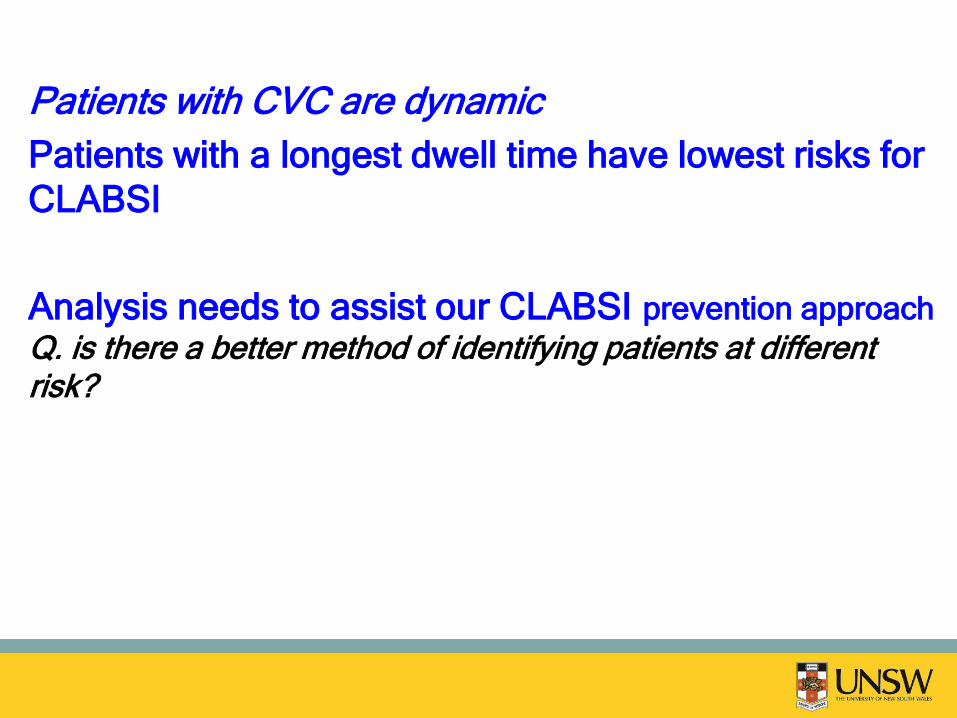
Patients with CVC are dynamic
Patients with a longest dwell time have lowest risks for
CLABSI
Analysis needs to assist our CLABSI prevention approach
Q. is there a better method of identifying patients at different risk?
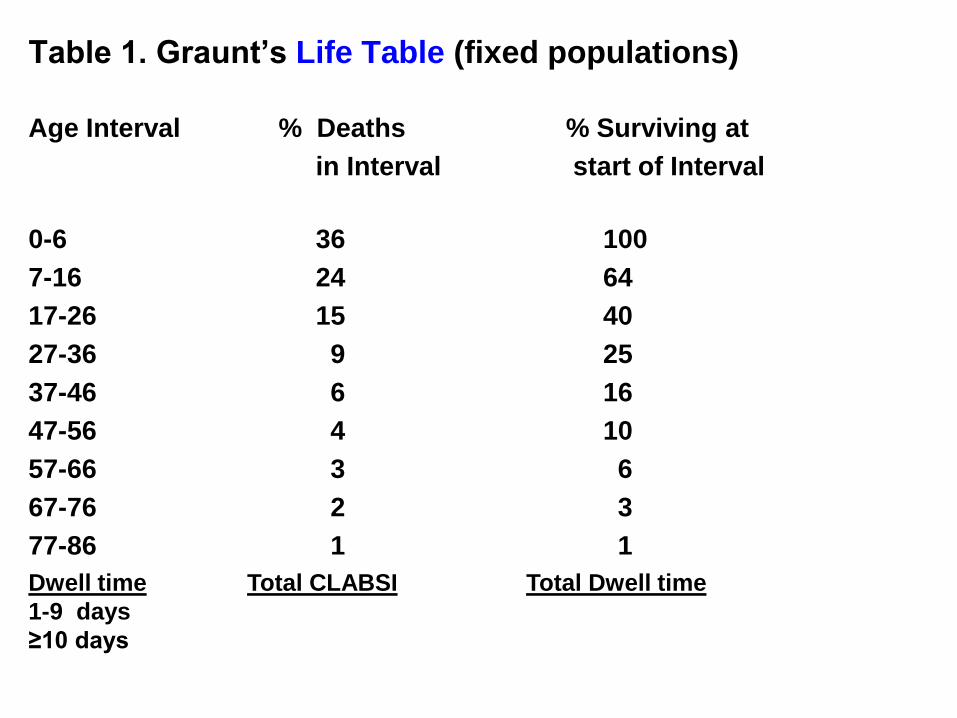
Table 1. Graunt’s Life Table (fixed populations)
Age Interval % Deaths % Surviving at
in Interval start of Interval
0-6 36 100
7-16 24 64
17-26 15 40
27-36 9 25
37-46 6 16
47-56 4 10
57-66 3 6
67-76 2 3
77-86 1 1
Dwell time
1-9 days
≥10 days
Total Dwell time
Total CLABSI
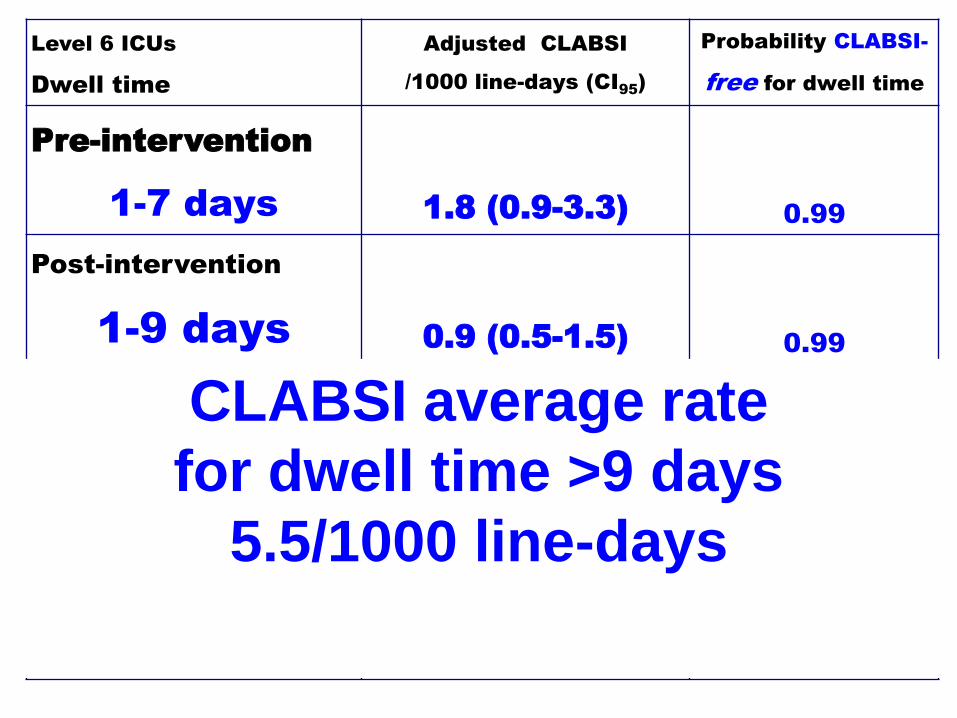
Level 6 ICUs
Dwell time
Adjusted CLABSI
/1000 line-days (CI95
)
Probability CLABSI-
free for dwell time
Pre-intervention
1-7 days 1.8 (0.9-3.3) 0.99
Post-intervention
1-9 days 0.9 (0.5-1.5) 0.99
10-11 5.9 (1.9-13.7) 0.98
12-13 4.1 (0.5-14.6) 0.97
14 22.3 (6.1-56.2) 0.95
15-16 3.9 (0.0-21.5) 0.94
17-20 3.3 (0.0-18.2) 0.92
>20 3.2 (0.0-17.7) 0.87
CLABSI average rate
for dwell time >9 days
5.5/1000 line-days
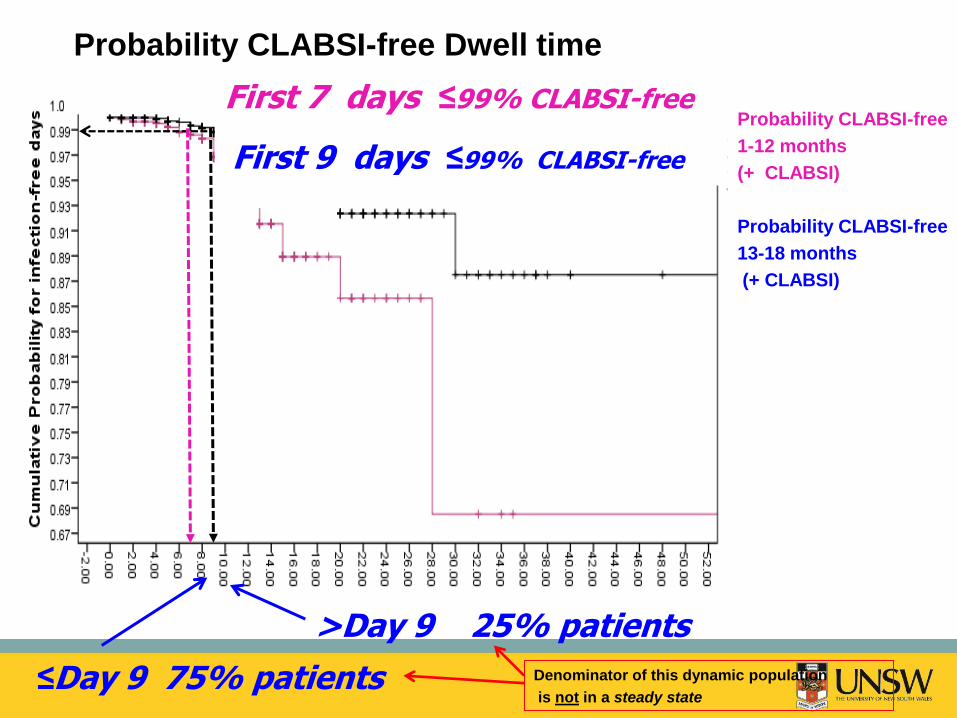
Probability CLABSI-free Dwell time
Probability CLABSI-free
1-12 months
(+ CLABSI)
Probability CLABSI-free
13-18 months
(+ CLABSI)
First 7 days ≤99% CLABSI-free First 9 days ≤99% CLABSI-free
≤Day 9 75% patients
>Day 9 25% patients
Denominator of this dynamic population
is not in a steady state
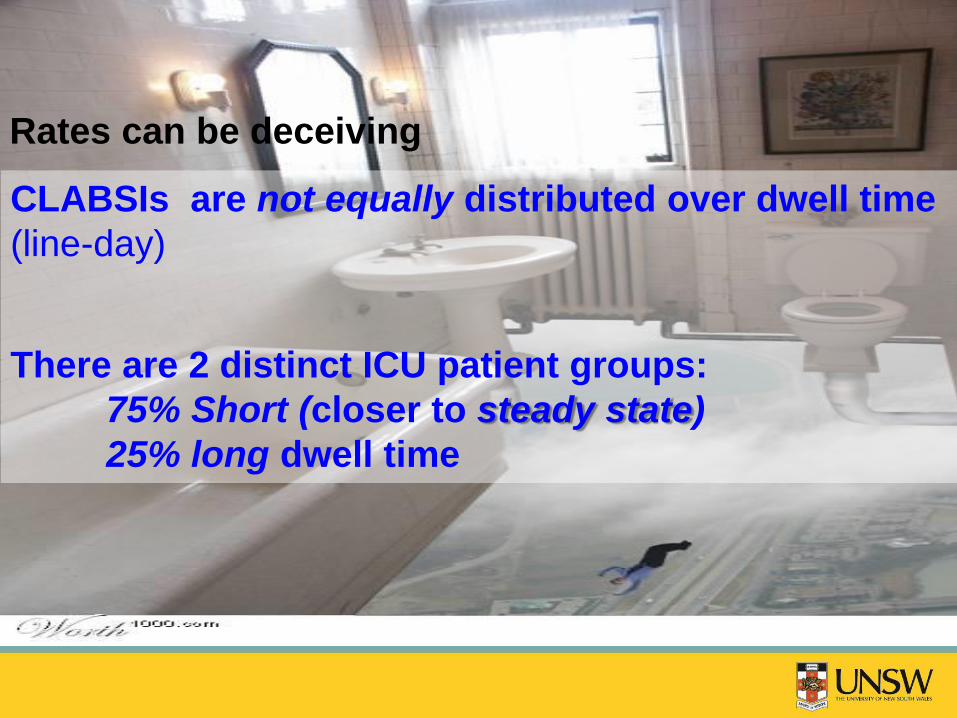
What national aggregation doesn’t show
CLABSIs are not equally distributed over dwell time
(line-day)
There are 2 distinct ICU patient groups:
75% Short (closer to steady state)
25% long dwell time
Rates can be deceiving
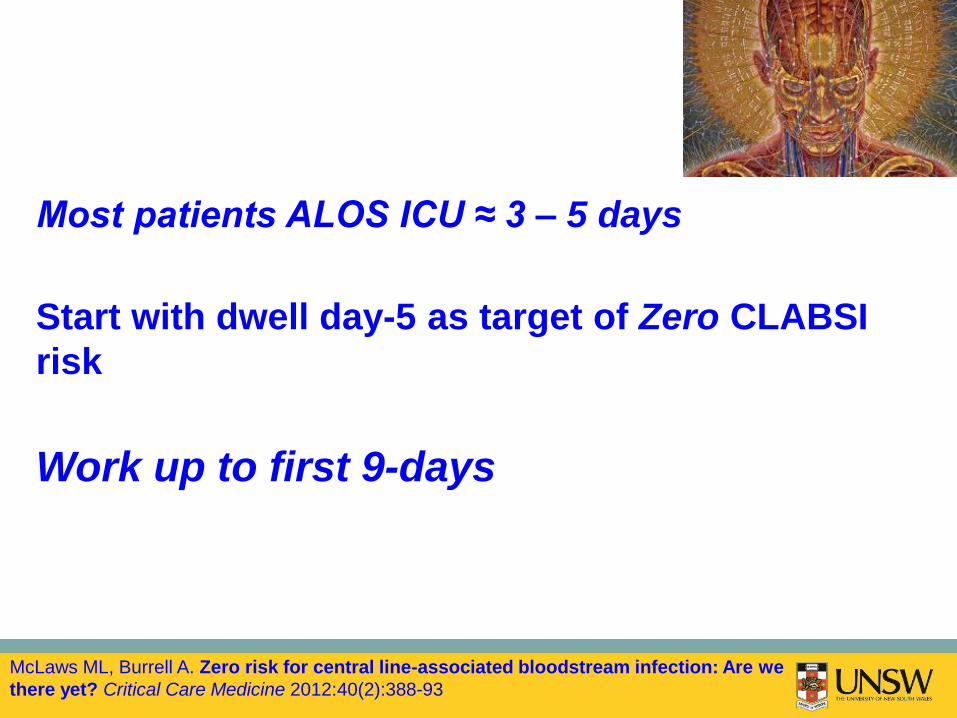
Most patients ALOS ICU ≈ 3 – 5 days
Start with dwell day-5 as target of Zero CLABSI
risk
Work up to first 9-days
McLaws ML, Burrell A. Zero risk for central line-associated bloodstream infection: Are we
there yet? Critical Care Medicine 2012:40(2):388-93
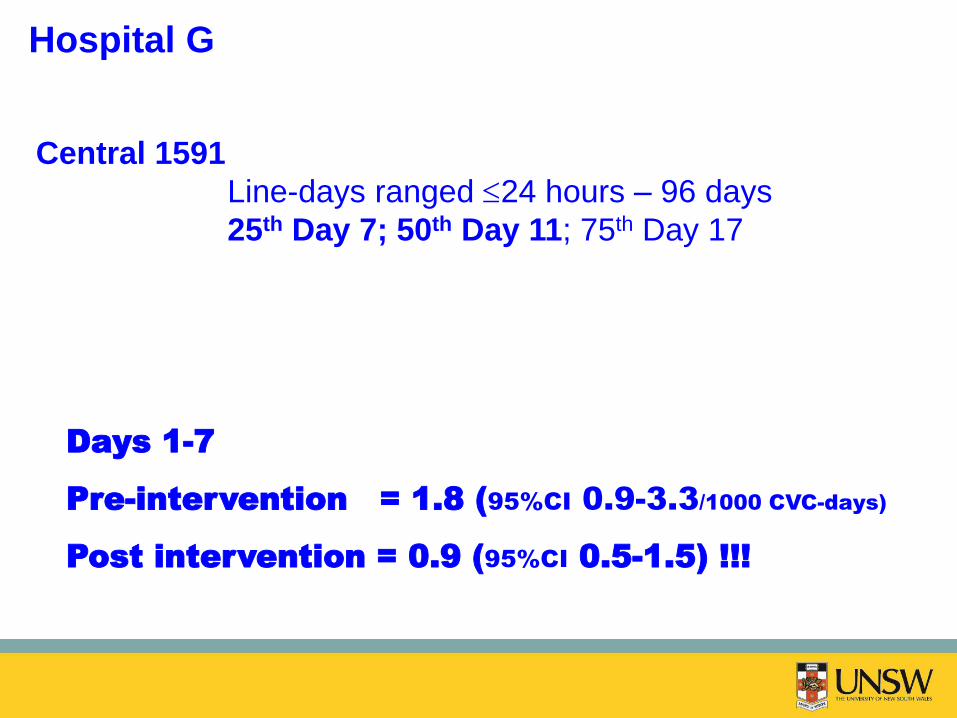
Central 1591
Line-days ranged 24 hours – 96 days
25th Day 7; 50th Day 11; 75th Day 17
Days 1-7
Pre-intervention = 1.8 (95%CI 0.9-3.3/1000 CVC-days)
Post intervention = 0.9 (95%CI 0.5-1.5) !!!
Hospital G

% [lines inserted]
Central 73 [3389]
PICC 15 [700]
Dialysis 11 [533]
Other & not specified 1 [33]
TOTAL lines inserted 100 [4655]
lines
Singular
74%
Concurrent 21%
Sequential 5%
Hospital G
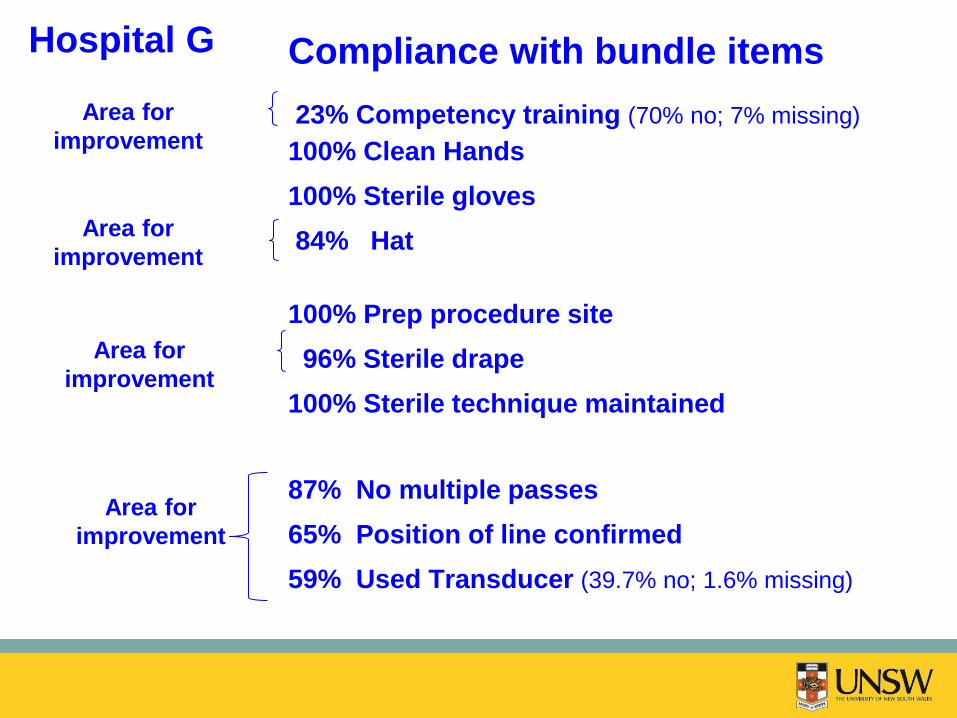
Hospital G Compliance with bundle items 23% Competency training (70% no; 7% missing)
100% Clean Hands
100% Sterile gloves
84% Hat
100% Prep procedure site
96% Sterile drape
100% Sterile technique maintained
87% No multiple passes
65% Position of line confirmed
59% Used Transducer (39.7% no; 1.6% missing)
Area for
improvement
Area for
improvement
Area for
improvement
Area for
improvement
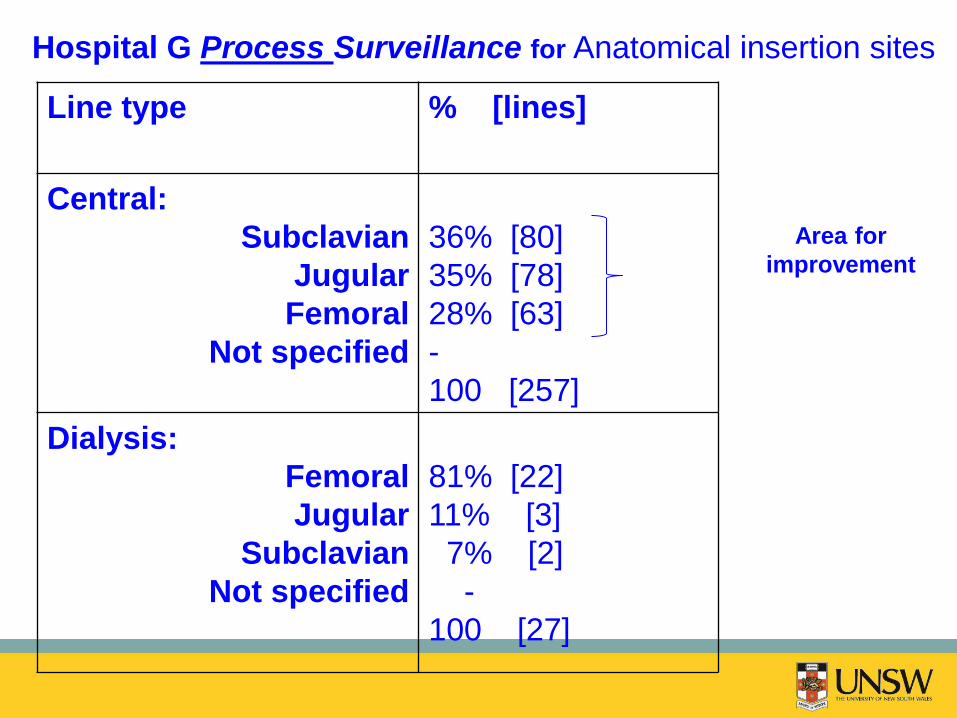
Hospital G Process Surveillance for Anatomical insertion sites
Line type % [lines]
Central:
Subclavian
Jugular
Femoral
Not specified
36% [80]
35% [78]
28% [63]
-
100 [257]
Dialysis:
Femoral
Jugular
Subclavian
Not specified
81% [22]
11% [3]
7% [2]
-
100 [27]
Area for
improvement
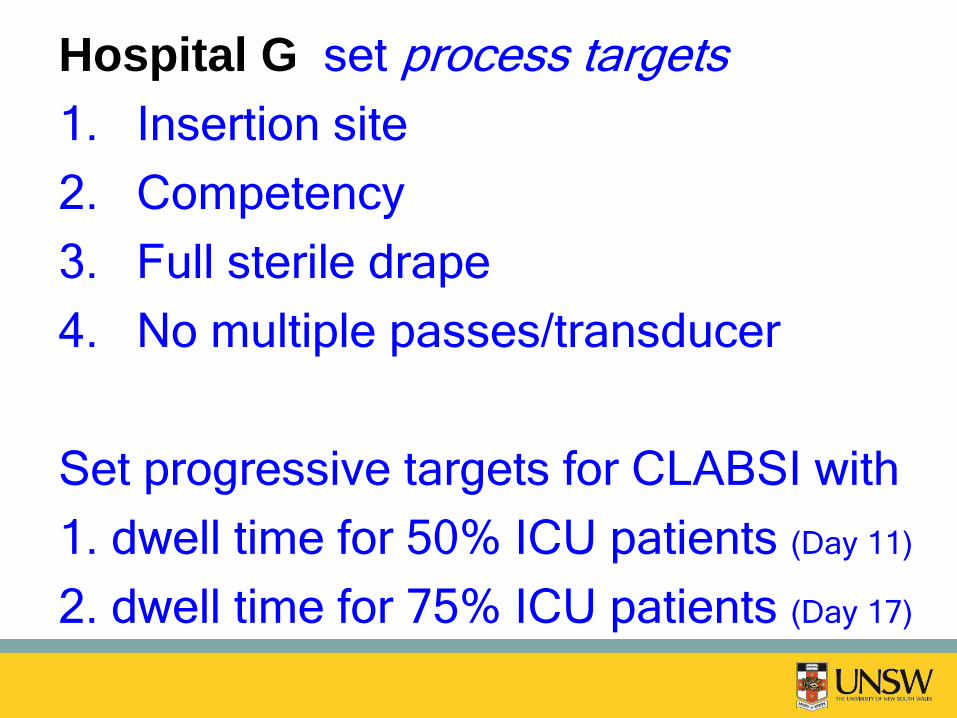
Hospital G set process targets
1. Insertion site
2. Competency
3. Full sterile drape
4. No multiple passes/transducer
Set progressive targets for CLABSI with
1. dwell time for 50% ICU patients (Day 11)
2. dwell time for 75% ICU patients (Day 17)
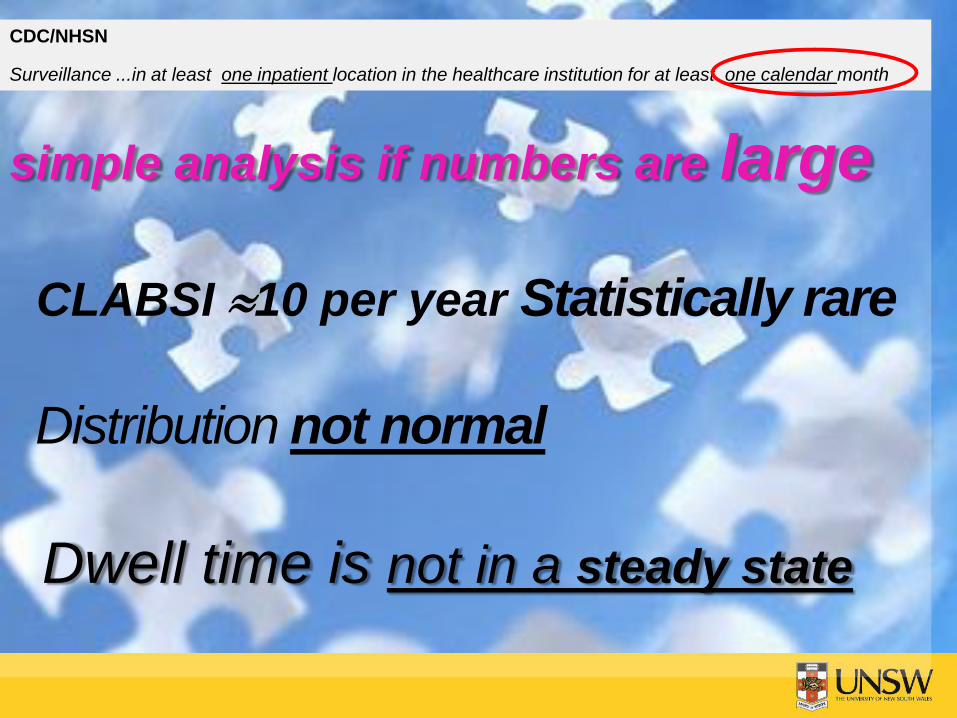
simple analysis if numbers are large CLABSI 10 per year Statistically rare
Distribution not normal
Dwell time is not in a steady state
CDC/NHSN
Surveillance ...in at least one inpatient location in the healthcare institution for at least one calendar month
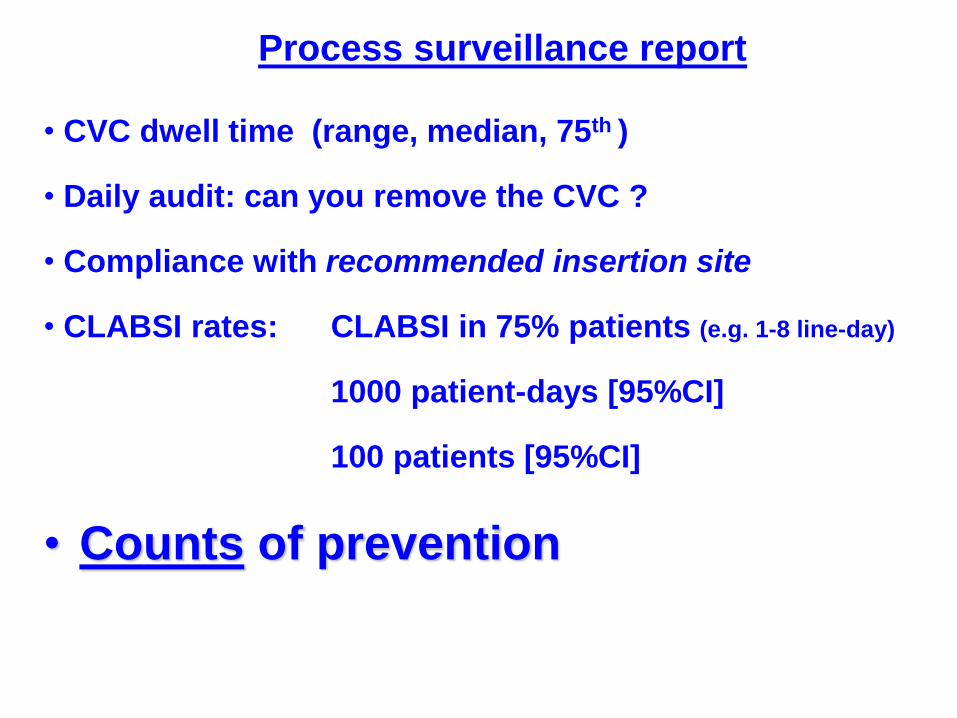
Process surveillance report
• CVC dwell time (range, median, 75th )
• Daily audit: can you remove the CVC ?
• Compliance with recommended insertion site
• CLABSI rates: CLABSI in 75% patients (e.g. 1-8 line-day)
1000 patient-days [95%CI]
100 patients [95%CI]
• Counts of prevention
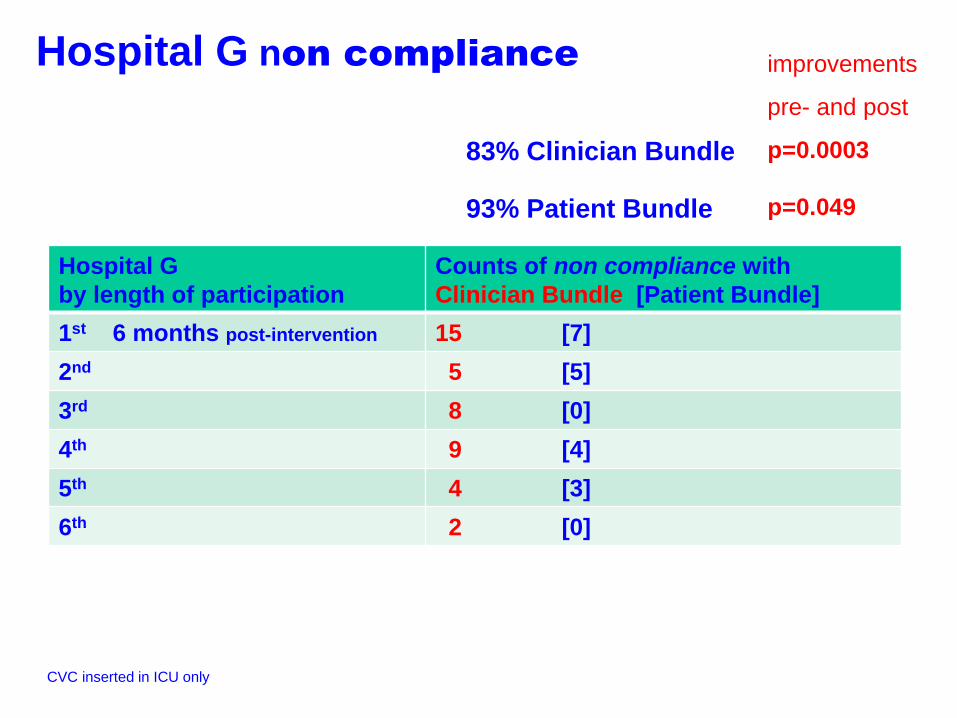
Hospital G non compliance
83% Clinician Bundle 93% Patient Bundle
improvements
pre- and post
p=0.0003
p=0.049
CVC inserted in ICU only
Hospital G
by length of participation
Counts of non compliance with
Clinician Bundle [Patient Bundle]
1st 6 months post-intervention 15 [7]
2nd 5 [5]
3rd 8 [0]
4th 9 [4]
5th 4 [3]
6th 2 [0]
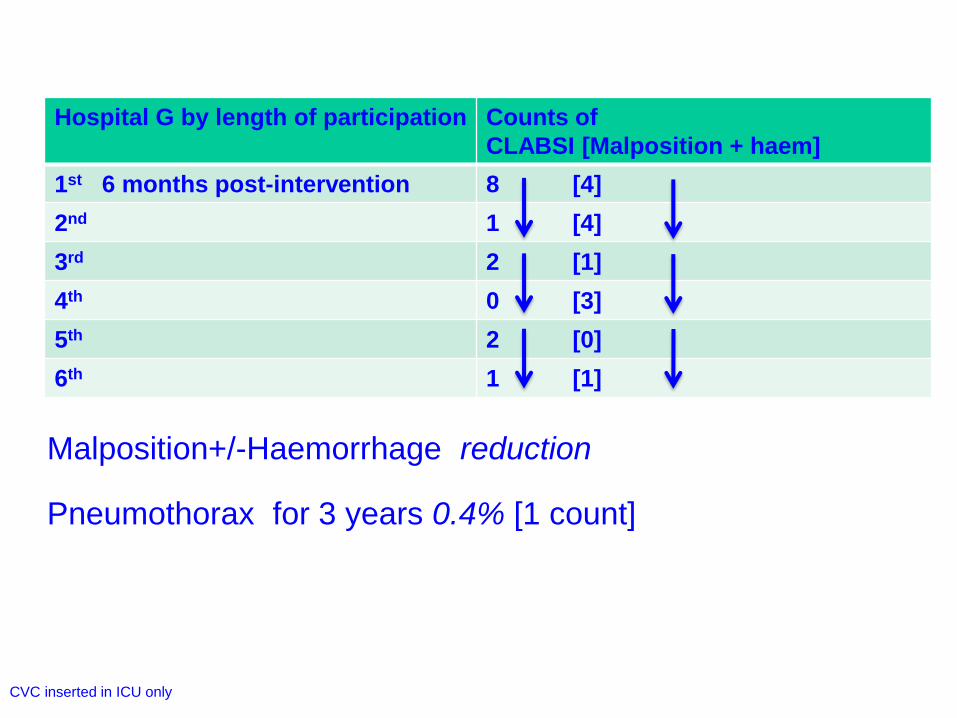
Hospital G by length of participation Counts of
CLABSI [Malposition + haem]
1st 6 months post-intervention 8 [4]
2nd 1 [4]
3rd 2 [1]
4th 0 [3]
5th 2 [0]
6th 1 [1]
CVC inserted in ICU only
Malposition+/-Haemorrhage reduction
Pneumothorax for 3 years 0.4% [1 count]
CVC inserted in ICU only
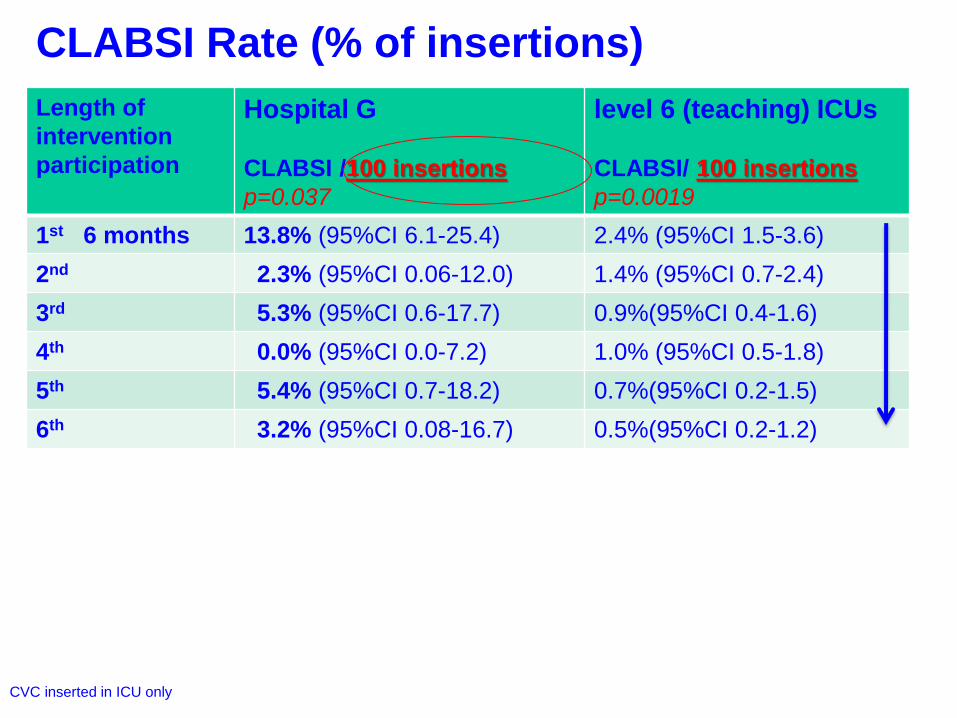
Length of
intervention
participation
Hospital G
CLABSI /100 insertions
p=0.037
level 6 (teaching) ICUs
CLABSI/ 100 insertions
p=0.0019
1st 6 months 13.8% (95%CI 6.1-25.4) 2.4% (95%CI 1.5-3.6)
2nd 2.3% (95%CI 0.06-12.0) 1.4% (95%CI 0.7-2.4)
3rd 5.3% (95%CI 0.6-17.7) 0.9%(95%CI 0.4-1.6)
4th 0.0% (95%CI 0.0-7.2) 1.0% (95%CI 0.5-1.8)
5th 5.4% (95%CI 0.7-18.2) 0.7%(95%CI 0.2-1.5)
6th 3.2% (95%CI 0.08-16.7) 0.5%(95%CI 0.2-1.2)
CLABSI Rate (% of insertions)
Other CLABSI prevention methods
Some are expensive so which patients should
have additional prevention resources?
>9 days average rate 5.5/1000 line-days
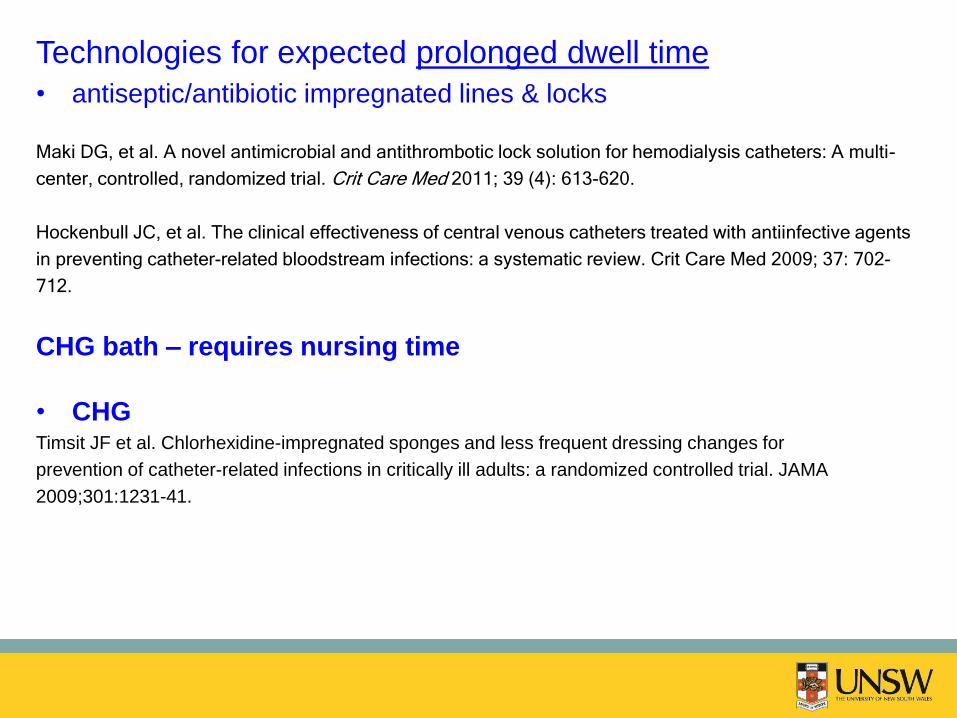
Technologies for expected prolonged dwell time
• antiseptic/antibiotic impregnated lines & locks
Maki DG, et al. A novel antimicrobial and antithrombotic lock solution for hemodialysis catheters: A multi-
center, controlled, randomized trial. Crit Care Med 2011; 39 (4): 613-620.
Hockenbull JC, et al. The clinical effectiveness of central venous catheters treated with antiinfective agents
in preventing catheter-related bloodstream infections: a systematic review. Crit Care Med 2009; 37: 702-
712.
CHG bath – requires nursing time
• CHG Timsit JF et al. Chlorhexidine-impregnated sponges and less frequent dressing changes for
prevention of catheter-related infections in critically ill adults: a randomized controlled trial. JAMA
2009;301:1231-41.
Post-insertion care
Inexpensive intervention for all dwell time
• early removal of catheters Mermel LA, et al. Clinical practice guidelines for the
diagnosis and management of intravascular catheter-related infection: 2009 Update by the Infectious
Diseases Society of America. Clin Infect Dis 2009; 49: 1-45.
• where possible removal of CVL on discharge from ICU
So where to from here Counts of fewer CLABSI
(between last report and the current one)
75% patients should be at zero risk
– report for first x days (this cut point will differ by hospital)
Technology
• But for whom?.............................
So who gets technology
• Everyone with CVC ?
• Just 25% of patients expected to have
prolonged dwell time ?
Ask CEO
Q. What is your maximum willingness to free up an ICU bed at
$4000 per day?

The psychedelic artist http://en.wikipedia.org/wiki/Alex_Grey