Embed Size (px)
Citation preview

© Copyright 2015, Association for Institutional Research
PROFESSIONAL FILES | SPRING 2015 VOLUMESupporting quality data and decisions for higher education.

Letter from the Editor This volume of Professional Files brings us two articles on very different topics, but with a
common theme—relationships.
Wang introduces Social Network Analysis, a data visualization technique that focuses on the
relationships among cases, instead of just their attributes. Her three examples applying this
technique to common IR study questions will make you want to start building your own SNA
models right away!
Carpenter-Hubin, Sullivan, and Herbers share their experience building relationships with faculty through a collaborative
study of faculty workload and resources. Their insights into how to work as peers respectful of each other’s expertise can
serve as a model for our own research partnerships.
Consider this a reminder to nurture your own relationships with IR colleagues by sharing your work in AIR Professional
Files!
Sincerely,
Sharron Ronco
IN THIS ISSUE...Article 136 Page 1Author: Ning WangApplications of Social Network Analysis in Institutional Research
Article 137 Page 11Authors: Julie Carpenter-Hubin, Jason Sullivan and Joan M. HerbersTwo Heads Are Better Than One: A Collaboration between Institu-tional Research and Faculty for a More Meaningful Analysis of the STEM Faculty Experience
EDITORSSharron RoncoCoordinating EditorMarquette University
Leah Ewing RossManaging EditorAssociation for Institutional Research
Lisa GwaltneyEditorial AssistantAssociation for Institutional Research
ISSN 2155-7535
PROFESSIONAL FILE
© Copyright 2015, Association for Institutional Research
SPRING 2015 VOLUME | PAGE 1
APPLICATIONS OF SOCIAL NETWORK ANALYSIS IN INSTITUTIONAL RESEARCH
ARTICLE 136
Ning Wang
About the AuthorNing Wang is the Director of Institutional Research at University of California, San Francisco.
AbstractSocial network analysis (SNA), with its distinct perspective on studying relations and its exceptional capability to visualize data, should be embraced by institutional researchers as a promising new research methodology complementary to inferential and exploratory statistics. This article introduces SNA through discussion of three analytical studies on topics highly relevant to institutional research (IR): (1) double-majors, (2) gatekeeping courses, and (3) STEM pipeline leaking. The unique approach of SNA in exploring, analyzing, and presenting data has great potential for advancing IR’s analytical capacity.
INTRODUCTIONInstitutional research (IR) professionals frequently adopt new analytical tools and research methodologies. This has allowed more sophisticated studies to be carried out that better inform institutions’ policy making, which leads in the long term to students being
better served. Traditional descriptive and inferential statistics, from simple frequencies and cross-tabulations, to the whole family of regressions, to more-advanced techniques such as survival analysis and structural equation modeling, have sufficiently fulfilled a large part of IR’s analytical functionality. At the same time, the large amount of data found in IR and the nature of IR research that emphasizes identification of patterns, predictions, and possible interventions, coupled with high-capacity software such as SAS, have made exploratory statistics a new frontier in IR. The recent interest in data mining and predictive modeling exemplifies this shift.
However, a missing piece of IR analytics is the study of relations. Traditional statistical methods assume the observation independence—that is, they assume that observations of a study are not related to one another, but rather can be independently examined by various internal and external attributes (Chen & Zhu, 2001). The observations in higher education settings, however, often are not independent. The activities of higher education and the people involved are relational and interactive in nature. Examples of these activities include co-authorship of scholarly
publications, faculty collaboration on research projects, peer influence among students with specific ethnic or social backgrounds, mentorship between faculty members and students, formation of learning communities among students with shared academic interests, and so forth. Relations also extend beyond people: for example, majors within a discipline are interrelated by overlapping course offerings, colleges and universities are interrelated by students transferring in and out, and states form a network through out-of-state student enrollment.
Such networks of relations are extensive in higher education, but few studies have addressed their dynamics and implications, partly because of the methodological limitations of inferential and exploratory statistics. As Wasserman and Faust (1994) in their classic book of social network analysis (SNA) stated, “The focus on relations, and the patterns of relations, requires a set of methods and analytic concepts that are distinct from the methods of traditional statistics and data analysis” (p. 3). The inadequate understanding of relations and interactions among the various entities in higher education calls for the addition of network analysis into IR’s analytical paradigm.

PAGE 2 | SPRING 2015 VOLUME
At the intersection of inferential statistics, exploratory statistics, and network analysis is data visualization—or the representation of data through graphical means. However, “data visualization . . . involves more than just representing data in a graphical form (instead of using a table). The information behind the data should also be revealed in a good display; the graphic should aid the readers or viewers in seeing the structure in the data” (Chen, Härdle, & Unwin, 2008, p. 6). As the well-known statistician and pioneer in data visualization Edward Tufte stated, “At their best, graphics are instruments for reasoning about quantitative information. . . . Of all methods for analyzing and communicating statistical information, well-designed data graphics are usually the simplest and at the same time the most powerful” (Tufte, 2001, p. 13).
Founded on graph theory, network analysis is exceptionally well developed in generating meaningful and intriguing visual representations of data. While charts and graphs are integral components of inferential and exploratory statistics, graphics is at the heart of network analysis. It is the way that an underlying network structure can be uncovered, while at the same time providing the vocabulary through which network properties can be described. At a time when effective communication of findings to institutions’ administrators and other constituents is more important than ever to further data-driven and research-based policy making, network analysis, with its expertise in data visualization, can be especially beneficial to IR.
This article introduces SNA to the IR community. As a well-established method that has been widely used in social sciences, SNA can contribute a great deal to IR with its unique perspective on relations and its power in visual presentation. The following will (1) introduce basic concepts in SNA, (2) present three studies that used SNA, and (3) discuss issues key to successfully applying SNA in IR.
SOCIAL NETWORK ANALYSIS AND ITS BASIC CONCEPTSSNA is inherently an interdisciplinary endeavor that uses social psychology, sociology, statistics, and graph theory. Beginning in the 1970s, the empirical study of various networks has played an increasingly important role in the social sciences. Among many of its applications, SNA has been used to understand the diffusion of innovations, the communication of news, the spread of diseases, the culture and structure of social organizations and business corporations, the formation of political views and affiliations, and so forth (Carrington, Scott, & Wasserman, 2005). More recently SNA has gained significant use in studying online communities and social media such as Facebook and Twitter.
The complicated mathematical background of SNA is beyond the scope of this article. However, it would be helpful to explain in simple terms several basic yet essential concepts used in the examples of analytical works described in this paper: vertice or node, edge, degree, directed and
undirected graph, weight, modularity, and centrality.
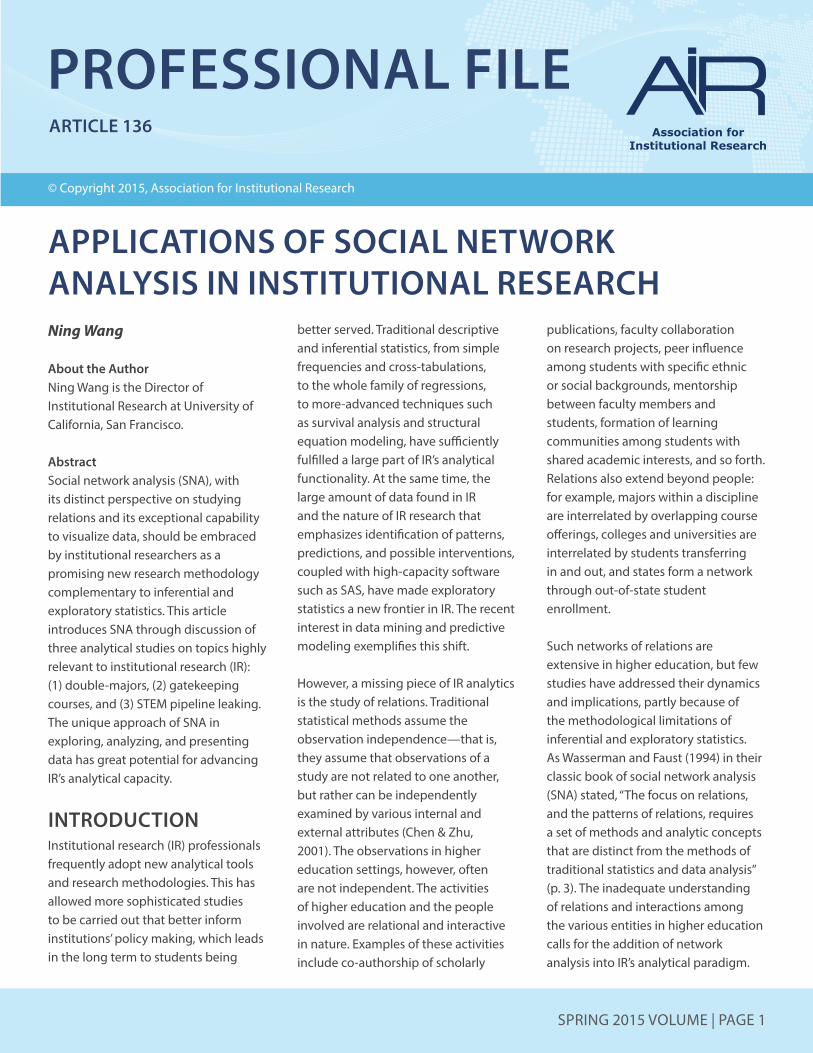
Borrowed from graph theory, the interconnected objects in SNA are represented by mathematical abstractions called vertices (more commonly called nodes), while the links that connect some pairs of nodes are called edges. The number of edges incident upon a node is defined as degree. Typically, a graph is depicted in diagrammatic form as a set of dots for the nodes, joined by lines or curves for the edges. When applied to a study, nodes represent the observations of a study, and edges represent the relations between the observations of a study. If the relations are initiated from certain observations to others, the edges would be represented with arrows from the initiators to the receivers, and the graph would be directed. Conversely, if the relations between two observations are mutual, the edge would be represented with a line segment connecting the two, and the graph would be undirected. A graph is weighted if a value or a weight is assigned to each edge. Depending on the problem at hand, such weights might represent a diverse set of attributes of the relationship (Hanneman & Riddle, 2005).
For demonstration, Figure 1 is a weighted undirected graph representing a hypothetical network of faculty collaboration. Nodes 1–10 are faculty members. Edges exist between those who collaborated on grant proposals, and weights on the edges denote the number of grant proposals that the two faculty members submitted together. As seen
SPRING 2015 VOLUME | PAGE 3
in the graph, Faculty 2 worked with Faculty 1 once, with Faculty 5 once, and with Faculty 3 three times on grant proposals; the node representing Faculty 2, therefore, has a degree of three and a weighted degree of five.
Modularity is one important measure of the network structure. It divides a network into modules, also called groups, clusters, or communities. Networks possessing community structures function differently from average networks, so identification of such community structures can have substantial importance in understanding the dynamics and properties of the network. The mathematical idea of the modularity
Figure 1. Demonstration of Basic Concepts in Social Network Analysis
measure is to compute the difference between the number of edges falling within groups and the expected number of edges in an equivalent network where edges are placed at random (Newman & Girvan, 2004). Large differences would indicate nodes being densely interconnected while being only sparsely connected with the rest of the network—in other words, forming modules. Network analysis software can generate this measure and partition the network by its underlying community structures.
Centrality is another important measure, examining the relative importance of a node within a graph. There are three main types of centrality:
degree, closeness, and betweenness. Degree centrality is defined as the number of edges that a node has. The nodes having higher degrees are related to other nodes, and therefore are at positions in the network that are more central. Closeness centrality emphasizes the distance of a node to all other nodes in the network. Betweenness centrality focuses on the position of a node between pairs of nodes. The higher betweenness of a node means more nodes depend on it to make connections with other nodes. Centrality can be evaluated with a set of statistics, such as Freeman Degree Centrality, Geodesic Path Distances, Eigenvector Centrality, Hierarchical Reduction, and so forth (Hanneman & Riddle, 2005). This article does not attempt to elaborate on details of these statistics; the readers are encouraged to obtain more information (e.g., Carrington et al., 2005; Chen et al., 2008; Tufte, 1990, 2001; Wasserman & Faust, 1994). The output of the above-mentioned statistics for the hypothetical network in Figure 1 is provided in Table 1 (next page).
For SNA, however, the statistics are often not the end product. Unlike inferential and exploratory statistics, the graphs in SNA are at the core of explaining and understanding findings, as the relational statistics are incorporated into graphs through the visualization process. Figure 1 shows two modules; Module A, consisting of faculty members 1 through5 and faculty member 10, and Module B, consisting of faculty members 6 through9. Members of each module worked more frequently within rather than across the modules.

PAGE 4 | SPRING 2015 VOLUME
Faculty 5 worked mainly with faculty 1 through4, but also worked once with faculty6 and once with faculty 7, thus bridging the two modules. A closer look at the departmental affiliation shows that faculty in Module A are from the biology department, and faculty in Module B are from the psychology department. Faculty5, a professor in biology, has research interests in neuroscience and has actively collaborated with professors in psychology. Faculty 10 is a statistician from the mathematics department who built a collegial relationship with Faculty 4 and who was once asked to work with him on a grant.
It can also be observed that Faculty 5 is at the center of the network in all three centrality measurements. Faculty 5 is identified as an active researcher in the two fields of biology and psychology by the high degree centrality (shown in Table 1 as Degree of 6 and Weighted
Degree of 7), as a good collaborator with all other researchers by the high closeness centrality (shown in Table 1 as 0.75), and as the key person for promoting interdisciplinarity between the two fields by the high betweenness centrality (shown in Table 1 as 0.65).
APPLICATION OF SOCIAL NETWORK ANALYSIS IN THREE STUDIESThis section will describe the application of SNA through three examples of small-scale analytical work: (1) a study of double-majors that used the modularity measure of SNA to reveal the connectivity among majors that can inform student advising; (2) a study of gatekeeping courses that used the measure of centrality to identify major-specific and general-education courses that students
failed before dropping out of the institution; and (3) a study of STEM (science, technology, engineering, and mathematics) pipeline leaking that examined students who started in STEM majors but subsequently graduated in non-STEM majors.
The three studies were conducted using the open source software Gephi (http://gephi.org). As a tool specifically developed for network analysis, Gephi has at its core a set of algorithms, called layouts, that detect and generate graphical representations of network structures. The layout ForceAtlas, for example, probably the most used force-directed layout, simulates a physical system in which nodes repulse each other like magnets, while edges attract their nodes like springs. These forces create a movement that eventually converges to a balanced state of spatialization of the nodes and edges, revealing the structure and
Id Label Modularity Class
Degree Weighted Degree
Closeness Centrality
Betweenness Centrality
Eigenvector Centrality
1 Faculty 1 0 2 3 0.47 0.00 0.44
2 Faculty 2 0 3 5 0.50 0.01 0.57
3 Faculty 3 0 3 6 0.53 0.03 0.59
4 Faculty 4 0 3 4 0.53 0.22 0.49
5 Faculty 5 0 6 7 0.75 0.65 1.00
6 Faculty 6 1 4 6 0.60 0.18 0.71
7 Faculty 7 1 4 7 0.60 0.18 0.71
8 Faculty 8 1 2 3 0.41 0.00 0.40
9 Faculty 9 1 2 4 0.41 0.00 0.40
10 Faculty 10 0 1 1 0.36 0.00 0.14
Table 1. Demonstration of Basic Relational Statistics Output in Social Network Analysis

SPRING 2015 VOLUME | PAGE 5
features of the network. Layouts have their specialties that suit networks of different sizes and emphasize different features. Layouts such as ForceAtlas2 and OpenOrd work with big networks, Circular and Radial Axis emphasize ranking, and GeoLayout uses latitude/longitude coordinates to visualize geographical networks.
The software also provides calculations of relational statistics unique to network analysis. Measures for modularity and centrality, among other statistics, can be generated with relative ease. The statistics can then be used in visualization; for example, the computed modularity allows partitioning of nodes into groups and reveals the community structure of the network. The statistics can also be saved into the data set and used in other statistical analysis; for example, the eigenvalue for centrality of each observation can be a new predictive variable in a regression model.
Graphs generated through Gephi are the main tool used to present findings of the three studies. Main features are shown, while detailed institution-specific figures that could have been shown as labels accompanying the nodes and edges are removed from the graphs.
Study 1: Double-MajorsMany college students concurrently pursue studies in two or more majors. Faculty and student advisors may anecdotally know some of the popular combinations of majors in their discipline; IR analysts, however, would want to approach the phenomenon of double-major with empirical evidence.
Five years (2009–13) of undergraduate degree data were compiled to ensure adequate sample size and to minimize fluctuations over the years. The data file contained majors, combinations of double-majors, and the number of students awarded degrees in each double-major. After applying the layout algorithm of ForceAtlas, the partitioning based on the statistics of modularity, and the filtering that eliminated majors with fewer than five students graduating with double-majors every year over the study period, a network structure emerged with more than 1,500 baccalaureate graduates in two of the approximately 40 or (Figure 2).
Majors clustered into groups based on their connections with one another after the modularity measure was
employed. Three areas of study appeared prominently in the graph where double-majors concentrated—economics/business, arts/humanities, and biological sciences/psychology. Four free-standing yet strongly tied pairs of majors were also identified—international affairs/political science, housing/consumer economics, exercise and sport science/athletic training, and consumer foods/dietetics. Clustering of majors into groups provides an empirical verification that double-majors occur most often within disciplines where connectivity between course offerings, degree requirements, and administrative procedures facilitates the pursuit of double-majors.The font size of the major titles is proportionate to the weighted degree of the major—that is, the number of students in this major who also
Figure 2. Double-Major Combinations of Bachelor’s Degree Recipients

PAGE 6 | SPRING 2015 VOLUME
Figure 3. Failing Courses and Last Major of Undergraduate Dropouts
graduated with a degree in another major. It can be seen that finance, psychology, biology, international business, and economics had the most students graduating with double-majors. The thickness of the edges is proportionate to the number of students taking on the corresponding pair of majors. It is then observed that over the five-year period psychology/biology, housing/consumer economics, international affairs/political science, finance/international business, and finance/economics were the top five most popular double-major combinations.
As Edward Tufte (2001) stated, “Modern data graphics can do much more than simply substitute for small statistical tables” (p. 9). The visual presentation in Figure 2 of the double-major data not only conveys information in a more coherent and succinct fashion than a tabular presentation, but also reveals the data at multiple levels not conveniently available in table form. It provides a broad overview of the areas of study within which double-majors tend to form, as well as the details of specific majors and major combinations. As groupings of majors surface through the modularity measure of SNA, more insights emerge. . These patterns of double-majors that graduates have successfully followed can serve as evidence for student advisors in their discussions with students contemplating taking on another major of study. University administrators might want to strengthen existing partnerships or explore new linkages between majors to enrich students’ educational experiences and promote their future employability.
Study 2: Gatekeeping CoursesEntry-level gatekeeping courses have been known to pose challenges to students and to potentially lead to attrition, particularly in STEM majors. It is very important for institutions focused on retaining and engaging students to help those students succeed in courses that most frequently serve as gatekeepers. Identification of these courses is inevitably the first step.
This study tracked students from four first-time, full-time freshmen cohorts (Fall 2004–Fall 2007) to identify dropouts—those who had neither graduated nor remained enrolled six years after their initial matriculation. For those dropouts who had failing grades on record, the failed courses and the majors that they last enrolled in before leaving the institution were compiled. Over 1,500 students from 17

SPRING 2015 VOLUME | PAGE 7
majors with 42 potential gatekeeping courses were included in the study.
Figure 3 is the visual representation of relations between failed courses, indicated by green nodes, and last majors, indicated by red nodes. Plotting was based on the degree centrality of the majors in this course-major network. The star network at the center of the graph made it clear that most of the dropouts left the institution with an unspecified major—in other words, they left early in their college life before declaring a major—and the many courses surrounding the unspecified major were the failed courses that could be potential hurdles to student retention. Among them, five introductory courses—Precalculus (MATH1113), American Government (POLS1101), Elementary Psychology (PSYC1101), Freshman Chemistry I (CHEM1211), and Basic Concepts in Biology (BIOL1103)—have prominent edges in the graph. The thickness of the edges between these courses and the unspecified major is proportionate to the number of students with an unspecified major who failed these courses. Furthermore, these five courses were actually the most challenging for students from all majors, as indicated by the size of their title in the figure. The size is proportionate to the total number of students who failed these courses regardless of their major.
The university also lost students in the other red-node majors—computer science, prebusiness, psychology, biology, and so forth. These majors are located on the periphery of the graph because of their relatively low
centrality in this course-major network. Failing of certain major-specific courses was potentially related to dropping out of these majors. For example, two foundation courses in computer science, Systems Programming [CSCI1730] and Discrete Mathematics for Computer Science [CSCI2610], were probably weeding out students. An introductory accounting course, Principles of Accounting I [ACCT2101] and an introductory economics course, Principles of Macroeconomics [ECON2105], were stumbling blocks for some students in prebusiness. The introductory statistics course [STAT2000] might have been a source of struggle for some students with sociology, speech communication, international affairs, and psychology majors.
One of the principles that Tufte (1990) suggested for the good practice of statistical graphics is “enhancing the dimensionality and density of portrayals of information” (p. 9). Figure 3 combined three dimensions of information—the gatekeeping courses, the majors that lost students, and the relationship between majors and courses—in one graph, while the same information in tabular form would have been cumbersome and lacked clarity. Instead of providing an isolated view of students and courses confined to a specific major, Figure 3 allows examination of more comprehensive course-taking patterns across majors. More importantly, the graph vividly points to possible directions for further investigation and action. University administrators might want to evaluate teaching and learning in the five introductory courses revealed as gatekeepers in the
graph. Perhaps factors like a large-lecture form of pedagogy, one-way passive learning, or an emphasis on memorization over critical thinking, might have contributed to the students’ failings. Strategies could then be developed to engage both the faculty and the students to change these gatekeepers into gateways of student success. The department head of biology might learn from the graph that for students intending to major in biology, Freshman Chemistry I (CHEM1211) and II (CHEM1212) together with Principles of Biology I (BIOL1107) were the most challenging courses, and that for students who succeeded in these courses and officially enrolled in biology as a major, the next set of courses in the sequence—Modern Organic Chemistry I (CHEM2211) and II (CHEM2212), and Principles of Biology II (BIOL1108)—were road blocks. A long-term plan focusing on building a solid foundation for further study in this major may be needed. Curriculum and pedagogy designed with intentional sequencing may help ensure adequate preparation and smooth transition of students for each section of the course sequence.
Study 3: STEM Pipeline LeakingGovernment, educators, and industry leaders have long been concerned about STEM pipeline leaking, where students depart from academic and career paths in science, technology, engineering, and mathmatics. According to the BusinessHigher Education Forum (2010), only 4 percent of the 4 million ninth-graders in the United States in 2001 would be STEM college graduates by 2011. This study

PAGE 8 | SPRING 2015 VOLUME
attempted to revealan aspect of the leakage along the STEM pipelineby identifying undergraduate students in STEM majors who changed their academic pursuit to non-STEM majors.
Students from five first-time full-time freshmen cohorts (Fall 2003–Fall 2007) were tracked through fiscal year 2013 for bachelor’s degree attainment. Those who first declared a major in STEM (based on the National Science Foundation definition) and later graduated in non-STEM majors, and whose major GPA was 3.0 or above when leaving STEM, constituted the group for this study.
A directed graph using the Circular Layout was built to show the migration between majors. For focus and clarity, only STEM majors with ten or more students in the five freshmen cohorts who later graduated in non-STEM majors were retained. The results in Figure 4 represent about 800 students in eight starting STEM majors who graduated in ten non-STEM fields. The blue nodes on the left side represent starting STEM majors, sorted and sized by the number of students leaving for any non-STEM major. The yellow nodes on the right side represent ending non-STEM majors classified into disciplines by the first two digits of the major CIP code, sorted and sized by the number of students transferring in from all STEM majors. The thickness of the edge between two nodes is proportionate to the number of students changing majors.
Figure 4 is mainly descriptive. By mapping the migration of students, the status of retention and persistence
in STEM majors at the institution is illuminated. The graph does not intend to address the many facets of the issue, but rather to show the non-STEM destinations for STEM majors who were in solid academic standing in their STEM major. These students might intend to pursue postgraduate professional programs, or plan for careers other than basic research, or simply want to explore studies beyond STEM. Instead of a divisive view of STEM versus non-STEM, the linkages in the graph present an opportunity for cooperation between the two fields.
A major-minor partnership can be one way to bridge the two fields. Possibilities exist for interdisciplinary collaboration between computer science and management information systems in business; mathematics and econometrics or finance in business; biology and dietetics study or nutrition
science in family and consumer sciences; and so on.. Certificate programs can be another option—for example, a certificate program in science journalism could be an option for students in biology or chemistry who are also interested in journalism; a program in math education could be an option for mathematics students who have an interest in education; or a program in health promotion could be a good fit for biology students aspiring to a career in health professions. If the demanding workload of a STEM major prohibits formal pursuit of another area of study, an area of emphasis that blends in courses from a relevant non-STEM major may meet students’ needs. Other possibilities may include joint projects or the incorporation of governmental, societal, or cultural implications of science and technology into the teaching of STEM.
Figure 4. STEM Major Students Graduating in Non-STEM Majors

SPRING 2015 VOLUME | PAGE 9
Figure 4 illustrates many opportunities to bridge the gap between STEM and non-STEM, and suggests the need for an orchestrated effort from departments on both sides to foster a campus-wide culture change geared to encourage students to stay in STEM without missing opportunities present in non-STEM fields.
DISCUSSIONSIn addition to the Gephi software that was used to conduct the above three studies, other open source software for network analysis include UCINET, Pajek, and R. All offer functions such as importing and filtering data, visualizing and spatializing network structures, generating relational statistics, and manipulating and exporting graphic presentations (Bastian, Heymann, & Jacomy, 2009). Their flexible interfaces and interactive ways of analyzing data make them accessible to IR analysts of different levels.
There are two issues critical to the successful application of SNA in IR. First is an open mind that sees relations and tries the network approach in conducting research on topics old and new. Network analysis, especially, allows new leverage for answering traditional research questions in IR. Relational statistics generated in SNA can provide alternative explanations to traditional theories, or can explain additional variance when they are being entered into established models. Studies that provide good examples of SNA include work investigating social network and college students’ sense of community (Dawson, 2008); student networking
in an online learning environment (Dawson, 2010); peer influence on student persistence and retention (Eckles & Stradley, 2012; Thomas, 2000); the extent to which size and density of a student’s social network predict academic achievement (Fletcher & Tienda, 2009; Skahill, 2003); and the effect of roommate and friend network on racial attitude and cultural competency (Levin, van Laar, & Sidanius, 2003; van Laar, Levin, Sinclair, & Sidanius, 2005); faculty co-authorship and co-citation (Girvan & Newman, 2002; Mählck & Persson, 2000; Otte & Rousseau, 2002; Perianes-Rodríguez, Olmeda-Gómez, & Moya-Anegón, 2010). However, few studies have been done on the formation of network, or on the university social network as a whole in which the student network, the faculty network, and the staff network interact. More robust and varied studies on SNA are needed to enrich the literature in higher education in general and in IR in particular.
The second issue is how to visually present the data with proper functionality and aesthetic form. Excellence in data visualization lies in the delivery of patterns and their implications uncovered from a data set in an intuitive, informative, and productive way, to improve understanding and encourage audience engagement (Friedman, 2008). The various network analysis software products provide highly configurable layout algorithms for generating graphs, and tools for modifying the display parameters of the graphs. They are readily available to the analyst, but only the right use
of them can achieve balance between information accuracy and visual attractiveness, and can ultimately facilitate understanding of the data. The graph should lead the viewer to think about the substance and to see the differences, rather than be distracted by the graphic design. Most often, multiple aspects of the data set can be presented in one graph; a clear focus serving a clear explanatory purpose is thus important for the graph to be meaningful. Sometimes details are sacrificed to render the graph with clarity; tabular and verbal descriptions of the data set then must be closely integrated with the graph for full reporting of the findings. And above all, “an ill-specified model or a puny data set cannot be rescued by a visually appealing graph” (Tufte, 2001, p. 13).
SNA is not meant to replace inferential and exploratory statistics, but rather is a complement that greatly enriches traditional model- building by allowing the study of unique research questions concerning a network type of relationships. IR has been a relative latecomer to network analysis. However, as more relational data (e.g., institutional records, email corpora, online learning management systems, and social media Web sites) are collected and become more easily accessible, IR researchers will have more opportunities to apply SNA and thus to appreciate the unique insights this method offers. SNA should emerge as an important tool as IR increasingly assumes the role of a local and national key player in educational statistics, analytics, and policy making.

PAGE 10 | SPRING 2015 VOLUME
ReferencesBastian, M., Heymann, S., & Jacomy, M. (2009). Gephi: An open source software for exploring and manipulating networks. Pro-ceedings of the Third International ICWSM Conference, May, San Jose, CA. Retrieved from http://www.aaai.org/ocs/index.php/ICWSM/09/paper/viewFile/154Forum/1009
Business-Higher Education Forum (BHEF) (2010). Increasing the number of U.S. STEM graduates: Insights from the STEM education modeling project. Working Paper, Author, Washington, DC.
Carrington, P. J., Scott, J., & Wasserman, S. (Eds.) (2005). Models and methods in social network analysis. Cambridge, UK: Cam-bridge University Press.
Chen, A., & Zhu, W. (2001). Revisiting the as-sumptions for inferential statistical analyses: A conceptual guide. Quest, 53(4), 418–439.
Chen, C., Härdle, W., & Unwin, A. (Eds.) (2008). Handbook of data visualization. Berlin: Springer-Verlag.
Dawson, S. (2008). A study of the relation-ship between student social networks and sense of community. Educational Technol-ogy & Society, 11(3), 224–238.
Dawson, S. (2010). “Seeing” the learning community: An exploration of the develop-ment of a resource for monitoring online student networking. British Journal of Educa-tional Technology, 41(5), 736–752.
Eckles, J. E., & Stradley, E. G. (2012). A social network analysis of student retention using archival data. Social Psychology of Education, 15(2), 165–180.
Fletcher, J. M., & Tienda, M. (2009). High school classmates and college success. Sociology of Education, 82, 287–314.
Friedman, V. (2008). Data Visualization and Infographics. Smashing Magazine. http://www.smashingmagazine.com/2008/01/14/monday-inspiration-data-visualization-and-infographics/
Girvan, M., & Newman, M. E. J. (2002). Community structure in social and biologi-cal networks. Proceedings of the National Academy of Sciences of the United States of America, 99(12), 7821–7826.
Hanneman, R. A., & Riddle, M. (2005). Introduction to social network methods. Retrieved from http://www.faculty.ucr.edu/~hanneman/nettext/
Levin, S., van Laar, C., & Sidanius, J. (2003). The effects of ingroup and outgroup friend-ships on ethnic attitudes in college: A longi-tudinal study. Group Processes & Intergroup Relations, 6, 76–92.
Mählck, P., & Persson, O. (2000). Socio-bibliometric mapping of intra-departmental networks. Scientometrics, 49(1), 81–91.
Newman, M. E. J., & Girvan, M. (2004). Find-ing and evaluating community structure in networks. Physical Review E, 69, 026113.
Otte, E., & Rousseau, R. (2002). Social net-work analysis: A powerful strategy, also for the information sciences. Journal of Informa-tion Science, 28(6), 441–453.
Perianes-Rodríguez, A., Olmeda-Gómez, C., & Moya-Anegón, F. (2010). Detecting, identifying and visualizing research groups in coauthorship networks. Scientometrics, 82(2), 307–319.
Skahill, M. P. (2003). The role of social sup-port network in college persistence among freshman students. Journal of College Student Retention, 4(1), 39–52.
Thomas, S. L. (2000). Ties that bind: A social network approach to understanding student integration and persistence. The Journal of Higher Education, 71(5), 591–615.
Tufte, E. R. (1990). Envisioning information. Cheshire, CT: Graphics Press.
Tufte, E. R. (2001). The visual display of quan-titative information (2nd ed.). Cheshire, CT: Graphics Press.
van Laar, C., Levin, S., Sinclair, S., & Sidanius, J. (2005). The effect of university roommate contact on ethnic attitudes and behavior. Journal of Experimental Social Psychology, 41(4), 329–345.
Wasserman, S., & Faust, K. (1994). Social network analysis: Methods and applications (Vol. 8). Cambridge, UK: Cambridge Univer-sity Press.

Thank You!AIR expresses sincere appreciation for the members who serve as peer reviewers. Authors who submit materials to AIR Publications receive feedback from AIR members. The following individuals reviewed
manuscripts submitted to this volume of Professional Files.
About AIR Professional FileBiannual Professional File volumes are journal-length publications grounded in relevant literature that synthesize current issues, present new processes or models, or share practical applications related to
institutional research. All submissions are peer-reviewed. For more information about AIR Publications, including Professional File and instructions for authors, visit www.airweb.org/publications.
Association for Institutional ResearchRandy L. Swing, Executive Director1435 E. Piedmont Drive, Suite 211
Tallahassee, FL 32308www.airweb.org
ISSN 2155-7535
Laura Palucki Blake
Allison Cantwell
Katherine Cermak
Shoshannah Cohen
Tim Delicath
Karma El Hassan
Barbara Escobar
George Guajardo
Betsy Hansel
Angela Henderson
Charlie Mathies
Kristina Monteiro
Gail Tudor

The Benefits ofAIR MembershipThe mission of AIR is to build IR capacity by providing practical information, timely training, and opportunities for meaningful professional interaction. AIR members receive exclusive benefits*, including:
• Access to the AIR e-Library• Access to AIR Events and Forum Materials• Online Learning Opportunities• Discounts on Professional Journals• eAIR Monthly Newsletter• Online Interaction and Resources
Learn more at www.airweb.org.
*The above benefits are for the 2015-2016 membership year. Membership benefits are subject to change. Visit the AIR website at www.airweb.org for the most current information.